


Abstract
The solvent dependence of the optical properties of tris(thenoyltrifluoroacetonate)(1,10-phenanthroline)europium(III) (Eu(TTA)3Phen) solution was studied in chloroform, dichloromethane, toluene, acetonitrile, acetone, N,N-dimethylformamide, dimethyl sulfoxide, and methanol. The optical properties of solid Eu(TTA)3Phen were carefully studied for comparison. The absorption spectra are dominated by ligand-centered bands, with only minor solvent-induced changes in the absorption maxima. Upon excitation into the ligand band, the emission spectra containe the characteristic narrow transition bands of europium(III), indicating efficient ligand-to-metal energy transfer. The photochemical properties of Eu(TTA)3Phen significantly depend on the solvent. Nonpolar and weakly coordinating solvents preserve longer lifetimes and higher solution quantum yields, with maxima in chloroform (14.7%) and toluene (13.7%). In contrast, methanol produces the strongest perturbation, yielding the shortest lifetime (0.364 ms), highest nonradiative rate (1427 s−1), lowest Eu(III) internal quantum yield (48.0%), and lowest photoluminescence quantum yield (4.6%). Analysis of radiative/nonradiative rates and 5D0-level formation quantum yield shows that solvent-dependent luminescence arises from changes in both the Eu3+-radiative transition efficiency and ligand-to-metal sensitization, providing design guidelines for solution-processable Eu3+ emitters.
1. Introduction
Luminescent europium(III) complexes have attracted considerable attention as functional materials for light-emitting devices, sensors, bioimaging, and optical encoding applications [1,2,3,4]. Lanthanide-based coordination compounds are also gaining increasing attention as components of X-ray scintillators, where high-Z metal centers enhance X-ray absorption and organic ligands can act as antenna units that promote efficient energy harvesting and radiative emission [5]. Their interest arises from the characteristic photophysical features of Eu3+ ions, including narrow red emission bands, long excited-state lifetimes, ligand-sensitized emission after UV excitation, and high color purity [6,7]. However, direct excitation of Eu3+ is inefficient, because the 4f–4f transitions are Laporte-forbidden and therefore exhibit very low molar absorption coefficients [8,9]. This limitation is effectively addressed through the so-called antenna effect, where organic chromophores with strong UV absorption act as light-harvesting units [10]. Upon excitation, these ligands transfer energy to Eu3+, enabling population of its emitting excited states and significantly enhancing Eu3+ luminescence [7,11].
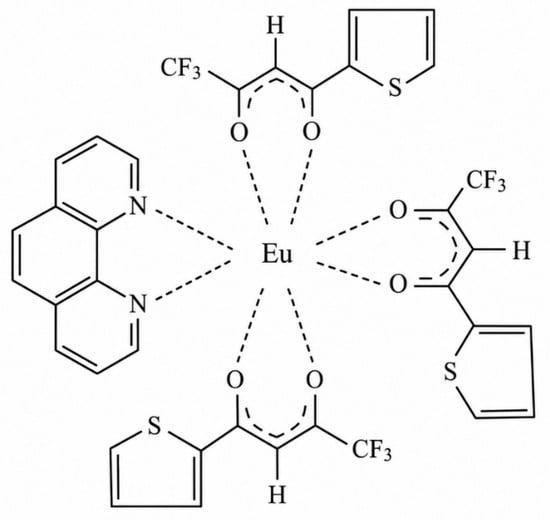
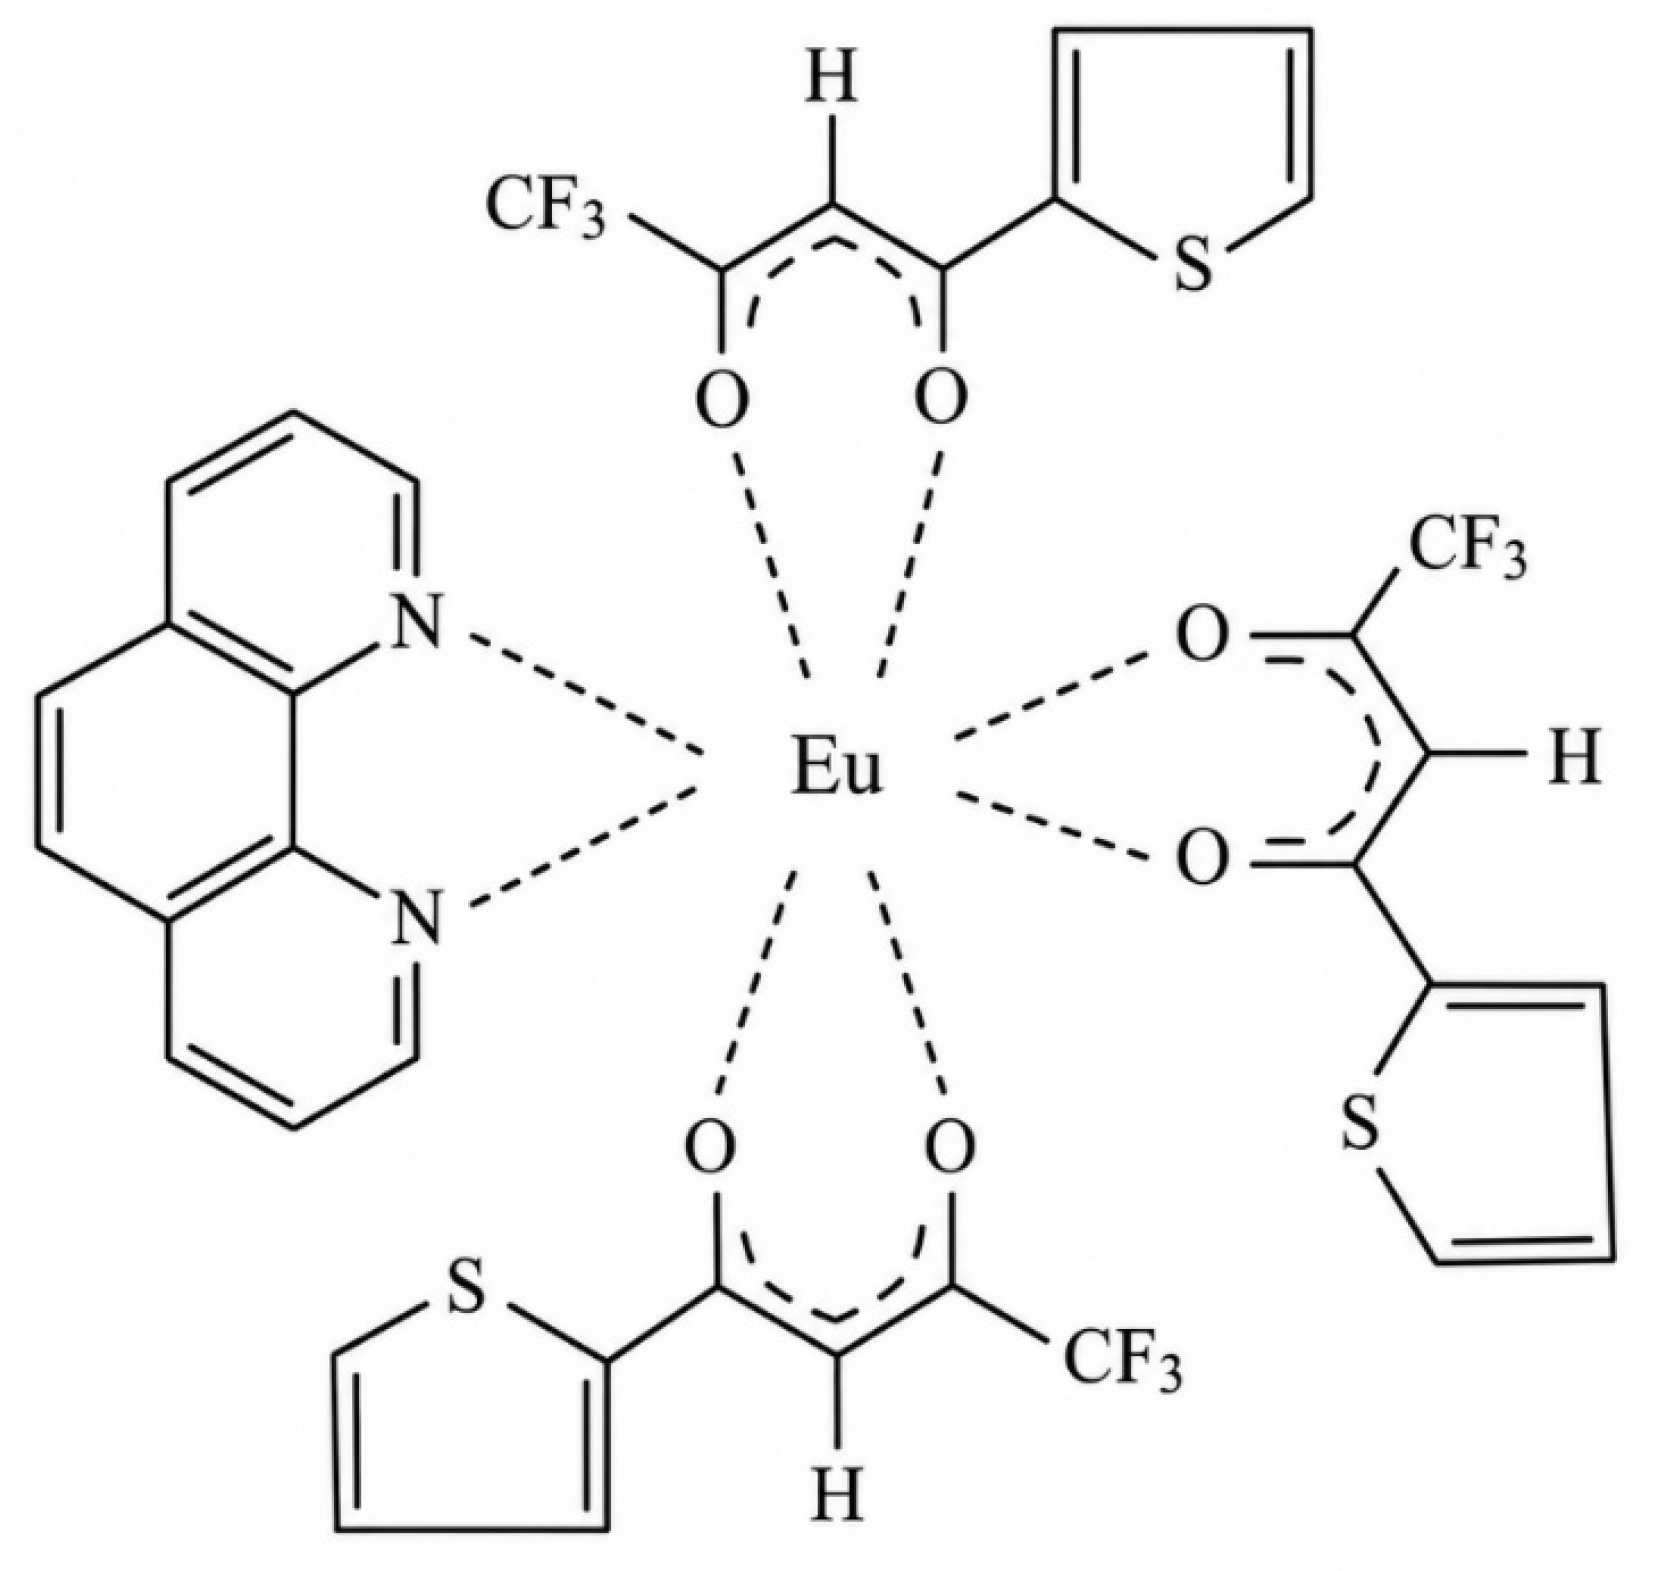
Among Eu3+ coordination compounds, β-diketonate complexes containing neutral ancillary ligands such as 1,10-phenanthroline (Phen) are well-established antenna systems that convert UV excitation into intense red emission [12,13]. Eu(TTA)3Phen (Scheme 1), Tris(thenoyltrifluoroacetonate)(1,10-phenanthroline)europium(III), is a representative example of this family and has been widely investigated in crystalline form, polymer matrices, mesoporous hosts, and optoelectronic devices [12,14,15]. In this complex, the TTA and Phen ligands act as light-harvesting chromophores. After ligand-centered excitation, intersystem crossing populates ligand triplet states, followed by energy transfer to Eu3+ and emission from the 5D0 level through the characteristic 5D0 → 7FJ transitions (J = 0–4). Recent time-resolved studies of Eu3+ β-diketonate complexes indicate that ligand-to-metal energy transfer can be highly efficient once the ligand triplet state is populated, making ligand excited-state dynamics, particularly intersystem crossing, a key factor governing the overall sensitization efficiency [6,10,16].
Scheme 1.
Chemical structure of Eu(TTA)3Phen.
Whereas the photophysical properties and device performance of Eu(TTA)3Phen in the crystalline state and in solid hosts such as mesoporous structures or polymeric films have been extensively characterized [15,17,18,19,20], the studies on the optical properties of Eu(TTA)3Phen solutions in organic solvents are rather limited and comparatively less systematic. Solvent polarity, coordinating ability, and proticity can influence several key processes that determine Eu3+ luminescence, including the local symmetry around the metal center, the energy and population of ligand excited states, and the efficiency of nonradiative deactivation pathways [21,22]. Moreover, even subtle changes in the Eu3+ coordination environment or in the accessibility of high-energy vibrational oscillators (O–H, N–H, and C–H) can strongly influence nonradiative decay pathways, leading to substantial variations in luminescence lifetimes and quantum yields. These effects are particularly relevant in Eu-based sensors and photonic materials, where emission efficiency directly determines detection sensitivity and device performance [23,24]. Beyond displays, sensing, bioimaging, and optical encoding, rare-earth coordination materials and MOF-based scintillators have shown that scintillation performance can be improved through heavy-atom effects, ligand-centered energy transfer, restriction of intramolecular motion, and control of self-absorption [25,26,27].
Understanding these solvent-dependent effects is therefore critical for optimizing Eu(TTA)3Phen and related complexes for solution-based sensing (e.g., detection of organophosphorus agents), bioimaging, and photonic applications, where the microenvironment around the luminophore can range from nonpolar polymer domains to highly polar or protic media [28,29]. In particular, correlating solvent-controlled changes in local symmetry (as probed by hypersensitive 5D0 → 7F2 intensity and the asymmetry ratio R21, Eu(III) internal quantum yield, and the quantum yield of 5D0-level formation with established energy-transfer models (Dexter vs. Förster, triplet-mediated vs. charge-transfer pathways [30,31]) provides a route to bridge detailed mechanistic insight from ultrafast spectroscopy with practical design rules for applied systems [29,32].
In this work, we report a comprehensive study of the solvent-dependent photophysical properties of Eu(TTA)3Phen in organic solvents spanning a wide range of polarity and hydrogen-bonding ability, such as chloroform, dichloromethane, toluene, acetonitrile, acetone, N,N-dimethylformamide (DMF), dimethyl sulfoxide (DMSO), and methanol. The absorption spectra, emission spectra, luminescence lifetimes, photoluminescence quantum yields (PLQYs), asymmetry ratios, radiative and nonradiative decay rates, Eu(III) internal quantum yields, and quantum yield of 5D0-level formation values are evaluated and correlated with solvent properties. By introducing the quantum yield of 5D0-level formation, Φform(5D0), as a semi-quantitative measure of antenna efficiency, we demonstrate that both the Eu(III) internal quantum yield and the ligand-to-metal energy transfer are strongly solvent-dependent. These findings provide mechanistic insights into the photophysics of Eu(TTA)3Phen in solution and establish design principles for tuning luminescence performance via solvent or microenvironment engineering.
2. Materials and Methods
2.1. Materials
2-Thenoyltrifluoroacetone (HTTA, >98%) and 1,10-phenanthroline (Phen) were purchased from Alfa Chemistry (Zhengzhou city, China). Europium(III) nitrate pentahydrate was purchased from Chemcraft (Kaliningrad, Russia). Sodium hydroxide (>99%), chloroform (HPLC grade), dichloromethane (HPLC grade), acetone (HPLC grade), dimethyl sulfoxide (DMSO, ACS reagent grade), N,N-dimethylformamide (DMF, ACS reagent grade), toluene (ACS reagent grade), acetonitrile (HPLC grade), methanol (HPLC grade), and ethanol (96%), sulfuric acid (98%), quinine sulfate (United States Pharmacopeia (USP) Reference Standard) were purchased from Sigma-Aldrich (Saint Louis, MO, USA). All reagents were used as received without further purification.
2.2. Synthesis of Crystalline Eu(TTA)3Phen
Eu(TTA)3Phen was synthesized using a modified literature method [33]. Briefly, HTTA (15 mmol) and Phen (5 mmol) were dissolved in 100 mL of a water/ethanol mixture (1:1, v/v). Solid NaOH (15 mmol) was then added under vigorous stirring. Separately, europium(III) nitrate pentahydrate (5 mmol) was dissolved in 50 mL of water and added to the alkaline ligand solution under vigorous stirring, resulting in the formation of a white precipitate. The suspension was heated at 60 °C and stirred for 1 h. The precipitate was collected by filtration, washed repeatedly with a water/ethanol mixture (1:1, v/v), and dried under vacuum at room temperature for one week. The final product was obtained as a white solid with a yield of 1.15 g (23%). The purity and crystalline nature of the complex were confirmed by powder X-ray diffraction (PXRD), Fourier-transform infrared spectroscopy (FTIR), and Raman spectroscopy (Figures S1 and S2, Supplementary Materials). The PXRD pattern was compared with a previously reported Eu(TTA)3Phen-containing complex [34] (Figure S3, Supplementary Materials).
2.3. Preparation of Solutions
Eu(TTA)3Phen solutions were prepared in chloroform, dichloromethane, toluene, acetonitrile, acetone, DMF, DMSO, and methanol. Two series of quinine sulphate solutions were prepared in 0.5 M H2SO4 to have an absorbance less than 0.2 at the excitation wavelength (365 or 405 nm). The concentration range was adjusted according to the solubility of the complex and the requirements of each optical measurement. For UV–Vis absorption measurements, Eu(TTA)3Phen solutions with a concentration in the range from 1 μM to 0.2–3.0 mM were prepared, depending on the solvent. For photoluminescence quantum yield measurements, Eu(TTA)3Phen solutions with concentrations of 1–5 μM were used for excitation at 365 nm, whereas concentrations of 0.20–3.0 mM were used for excitation at 405 nm. When required, the absorbance at the excitation wavelength was kept below approximately 0.2 to minimize inner-filter and reabsorption effects.
2.4. Instrumentation
UV–Vis absorption spectra of Eu(TTA)3Phen solutions were recorded using a Jenway Genova Nano micro-volume spectrophotometer (Cole-Parmer Ltd., Staffordshire, UK). Measurements were performed using quartz cuvettes with optical path lengths of 1 and 10 mm, depending on the absorbance of the solutions. Spectra were collected in the 200–500 nm wavelength range.
Solid-state UV–Vis–NIR diffuse reflectance spectra of crystalline Eu(TTA)3Phen were acquired using a Lambda 1050 UV/Vis/NIR spectrometer (PerkinElmer Inc., Waltham, MA, USA) equipped with a Praying Mantis diffuse reflectance accessory (DRP-SAP, Harrick Scientific Products, Inc., Mt Kisco, NY, USA). Reflectance spectra were recorded in the 200–700 nm wavelength range and subsequently transformed using the Kubelka–Munk function:
for comparison with solution absorption spectra.
Steady-state photoluminescence spectra were recorded using a laboratory-built spectrofluorometer based on a Little Garden spectrometer (Lao Kang, Beijing, China). A 100 mW, 405 nm laser (405-100-14.5 × 45-XL, Q-Line, Dongguan, Guangdong Province, China) and a 365 nm LED (UV-3W High Power LED, HViero Shenzhen, China) were used as excitation sources. The 365 nm excitation wavelength was selected because it overlaps more strongly with the lowest-energy ligand-centered absorption band of Eu(TTA)3Phen. The 405 nm excitation wavelength lies on the weak long-wavelength tail of the ligand-centered absorption band, where the absorption is much weaker than at the absorption maximum. Nevertheless, measurable Eu3+ emission was obtained under 405 nm excitation because of the relatively high excitation power of the laser and the sample concentrations used for these measurements. The spectral calibration of the spectrometer was verified by comparing the emission spectrum of Eu(TTA)3Phen in chloroform with a previously reported spectrum of the same complex [35] (Figure S4, Supplementary Materials). The linear response of the spectrometer was verified from the linear dependence of the recorded signal intensity on the excitation intensity, which was attenuated using a set of color filters (Figure S5, Supplementary Materials). The emission spectra were corrected for the spectral sensitivity of the detector and grating.
Photoluminescence decay curves were measured using a laboratory-built time-resolved spectrofluorometer. Excitation pulses at 405 nm, with a pulse duration of 100 μs, pulse energy of 25 μJ per pulse, and beam diameter of 1 mm, were generated using a 500 mW laser (Yilubao, Shanghai, China) modulated by TTL square pulses from an FNIRSI DSO-TC3 signal generator (FNIRSI, Shenzhen, China). The emission signal was detected using a high-speed TZT 76084 photodiode (Shenzhen Tianzhongtian Trading Co., Ltd., Shenzhen, China) and recorded with an FNIRSI 1014D digital oscilloscope (FNIRSI, Shenzhen,, China). Scattered excitation light was removed using an optical color filter.
Fourier-transform infrared (FTIR) spectra were obtained using an Agilent Cary 630 FTIR spectrometer (Agilent Technologies, Santa Clara, CA, USA) equipped with a diamond attenuated total reflectance (ATR) accessory. Spectra were collected in the 4000–650 cm−1 range with a spectral resolution of 1 cm−1.
Raman spectra of crystalline Eu(TTA)3Phen were collected using a LabRAM HR Evolution Raman spectrometer (Horiba Jobin Yvon, Kyoto, Japan). Measurements were performed using a 785 nm excitation laser, with a nominal laser power of 40 mW and an accumulation time of 5 s.
Powder X-ray diffraction (PXRD) patterns were recorded using a MiniFlex-600 diffractometer (Rigaku Corporation, Akishima, Tokyo, Japan) equipped with a sealed-tube Cu Kα1,2 non-monochromatized radiation source and a D/tex Ultra2 detector operating in one-dimensional scan mode. The X-ray generator was operated at 40 kV and 15 mA. Diffraction data were collected over the 5–60° 2θ range using a step size of 0.01° and a scanning speed of 10° min−1.
OriginPro 2018 (64 bit, SR1, b.9.5.1.195) software were used to analyze the experimental data.
2.5. Photophysical Data Analysis
Photoluminescence quantum yields (PLQYs) were determined by the relative method, following procedures commonly applied to luminescent materials [36], using quinine sulfate in 0.5 M H2SO4 as the reference standard (PLQYR = 0.546 at 25 °C) [37,38]. Eu(TTA)3Phen solutions and the reference were measured under identical instrumental conditions, including excitation wavelength, integration time, optical geometry, and detector settings. The integrated emission intensity was obtained by numerical integration of the Eu3+ emission bands over the 550–750 nm range. For each solvent, the integrated emission intensity was plotted as a function of the absorbed fraction (1 − 10−A), where A is the absorbance at the excitation wavelength;and the slopes of the linear plots were used to calculate the PLQY according to the equation:
where PLQY and PLQYR are the photoluminescence quantum yields of the sample and reference, respectively; GradS and GradR are the slopes obtained for the sample and reference; and nS and nR are the refractive indices of the solvent and reference medium, respectively. Solvent refractive indices were taken from literature values [39]. For crystalline Eu(TTA)3Phen, an approximate refractive index of n = 1.5 was used for the radiative-rate calculations [40]. PLQYs were measured at two wavelengths (365 and 405 nm), and the resulting values were averaged and given in Table 1.
Table 1.
Photophysical properties of crystalline Eu(TTA)3Phen and Eu(TTA)3Phen solution in different solvents: photoluminescence decay time constants (τ); radiative (Ar), nonradiative (Anr), and total (Atot) decay rates; Eu(III) internal quantum yields (ηEu); photoluminescence quantum yields (PLQY); formation quantum yields of the 5D0 level; and asymmetry ratios (R21).
Photoluminescence decay curves were fitted using a mono-exponential function:
where τ is the observed lifetime of the Eu3+ 5D0 emitting level. The total decay rate was calculated as Atot = 1/τ. Luminescence decay is affected by the combination of radiative and nonradiative processes. The radiative decay rate is determined by dipole transition strength and local-field correction. Nonradiative processes include multiphonon relaxation, quenching on impurities (e.g., O-H group of water molecules), and cooperative processes (cross-relaxation, energy migration). Radiative and nonradiative decay rates of Eu3+-doped phosphors can be calculated from the emission spectrum using the 4f–4f intensity theory [11]. Magnetic dipole 5D0 – 7F1 transition probability A0–1 = AMD,0∙n03 = 14.65∙n03. AMD,0 is the spontaneous emission probability of the magnetic dipole 5D0 − 7F1, 14.65 s−1, and n0 is the refractive index of the solid EuTTA3Phen or the solvent. Radiative decay rates A0–λ (λ = 2, 4) of the 5D0 − 7Fλ emission transition can be obtained from formula:
where I0–λ and ν0–λ are integral intensity and frequency of the 5D0 − 7Fλ emission transition. The total radiative decay rate, Ar, could be calculated by summing all the A0–λ radiative decay rates (λ = 1, 2, 4). The total decay rate is the reciprocal of the observed lifetime of the 5D0 level , while the nonradiative probability can be calculated as . The values of all parameters are given in Table S2, Supplementary Materials. The Eu(III) internal quantum yield was determined as ηEu = Ar/Atot. Here, Φform(5D0) = PLQY/ηEu denotes the apparent quantum yield of population of the Eu(III) 5D0 emitting state following photon absorption. This derived quantity describes the net efficiency of all processes preceding 5D0 emission, including ligand absorption, intersystem crossing, ligand excited-state deactivation, and ligand-to-Eu energy transfer. It should therefore not be interpreted as a direct measurement of an individual energy-transfer rate or mechanism.
3. Results and Discussion
3.1. Crystalline Eu(TTA)3Phen Characterization
The FTIR spectrum of crystalline Eu(TTA)3Phen confirms the presence of both TTA and Phen ligands in the synthesized complex (Figure S1 and Table S3, Supplementary Materials). The main experimental bands are in good agreement with previously reported FTIR data for Eu(TTA)3Phen [42]. In particular, the band at 1624 cm−1 is assigned mainly to the carbonyl-related C=O stretching vibration of coordinated TTA, whereas the band at 1598 cm−1 is attributed to C=N/C=C vibrations of the Phen ligand and the conjugated ligand framework. These assignments are supported by previous reports showing that the carbonyl stretching bands of free HTTA shift from the 1660–1640 cm−1 region to lower wavenumbers after coordination to Eu3+, and that Phen-related C=N/C–H vibrational bands also shift upon complex formation [15,42]. Additional bands at 1537 and 1505 cm−1 are assigned to coupled C=C/C=N stretching modes of the TTA/Phen framework. The bands at 1355 and 1305 cm−1 are associated with β-diketonate/CF3-related vibrations of the TTA ligand, while the bands at 1184 and 1132 cm−1 are attributed to coupled C–F/C–C/C=C vibrations within the TTA framework. The bands at 844, 723, and 715 cm−1 are assigned mainly to out-of-plane C–H vibrations and ring deformation modes of the Phen ligand. Overall, the FTIR spectrum agrees well with reported vibrational features of Eu(TTA)3Phen and supports the successful formation of the ternary Eu3+ β-diketonate–phenanthroline complex.
The Raman spectrum of crystalline Eu(TTA)3Phen provides complementary vibrational evidence for the coordinated TTA/Phen ligand framework (Figure S2, Supplementary Materials). The spectrum exhibits well-defined bands that agree closely with Raman features reported for Eu(TTA)3 complexes containing phenanthroline-derived ligands [43,44,45]. In particular, the bands observed at 1625, 1608, 1594, and 1523 cm−1 are assigned to coupled C=O/C=C/C=N stretching modes of the coordinated β-diketonate and phenanthroline framework. These bands fall in the coordination-sensitive 1530–1660 cm−1 region, where β-diketonate C=O/C=C vibrations have been reported to shift upon coordination to Eu3+ [43]. The intense Raman band at 1415 cm−1, together with bands at 1355 and 1307 cm−1, is attributed to β-diketonate chelate-ring and CF3/C–C-related vibrations of the TTA ligand. Additional bands at 1084, 1055, 936, 862, 770, 753, 725, and 685 cm−1 are assigned to coupled C–F/C–C vibrations, aromatic ring modes, and out-of-plane C–H/ring deformation modes of the TTA/Phen framework. The low-wavenumber bands below 650 cm−1 are assigned tentatively to ligand-framework, chelate-ring, and lattice-related modes. Overall, the Raman spectrum supports the FTIR results by confirming the characteristic vibrational fingerprint of the coordinated Eu3+ β-diketonate–phenanthroline complex.
The crystalline nature of the synthesized Eu(TTA)3Phen was further evaluated by PXRD (Figure S3, Supplementary Materials). The molecular structure of Eu(TTA)3Phen has previously been determined by single-crystal X-ray diffraction; the analysis showed that Eu(TTA)3Phen crystallizes in the triclinic system and contains an eight-coordinate Eu(III) center with a slightly distorted square-antiprismatic coordination polyhedron [46]. Accordingly, the PXRD experiment in the present work is used only to verify the crystallinity and phase consistency of the obtained bulk sample. The experimental diffraction pattern obtained in this work shows a series of sharp reflections, confirming that the obtained solid is crystalline. The main reflections of the synthesized complex are in good agreement with the reported PXRD pattern of Eu(TTA)3Phen-containing rare-earth complexes, supporting the successful formation of the expected crystalline phase [34]. The presence of intense low-angle and mid-angle diffraction peaks is characteristic of the ordered packing of molecular Eu3+ β-diketonate–phenanthroline complexes. Similar sharp diffraction features have also been reported for Eu(TTA)3Phen-containing polymer films, with reflections at 2θ values around 15.0°, 20.6°, 21.9°, 26.6°, and 30.6°, confirming the crystalline contribution of the Eu(TTA)3Phen phase [20]. Minor differences in relative peak intensities between the experimental and reference patterns can be attributed to preferred orientation, crystallite-size effects, sample preparation, or differences in measurement conditions. Overall, the PXRD results, together with the FTIR analysis, confirm the formation of crystalline Eu(TTA)3Phen.
3.2. Absorption Spectra and Solvent Dependence
The UV–Vis absorption spectra of Eu(TTA)3Phen in all studied solvents were measured over a concentration range between 1 μM and 0.2–3.0 mM, depending on the solubility of Eu(TTA)3Phen in each solvent. The linearity of the absorption response was verified within the investigated concentration range, confirming that the Beer–Lambert law was obeyed under the experimental conditions used. Due to self-absorption of the solvents, for several solvents, the UV-vis spectrum is not reported at short wavelengths.
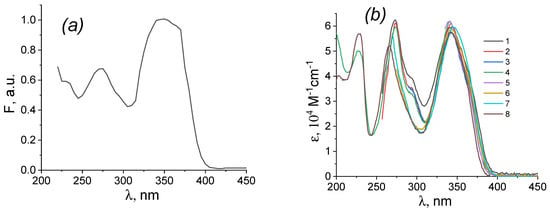
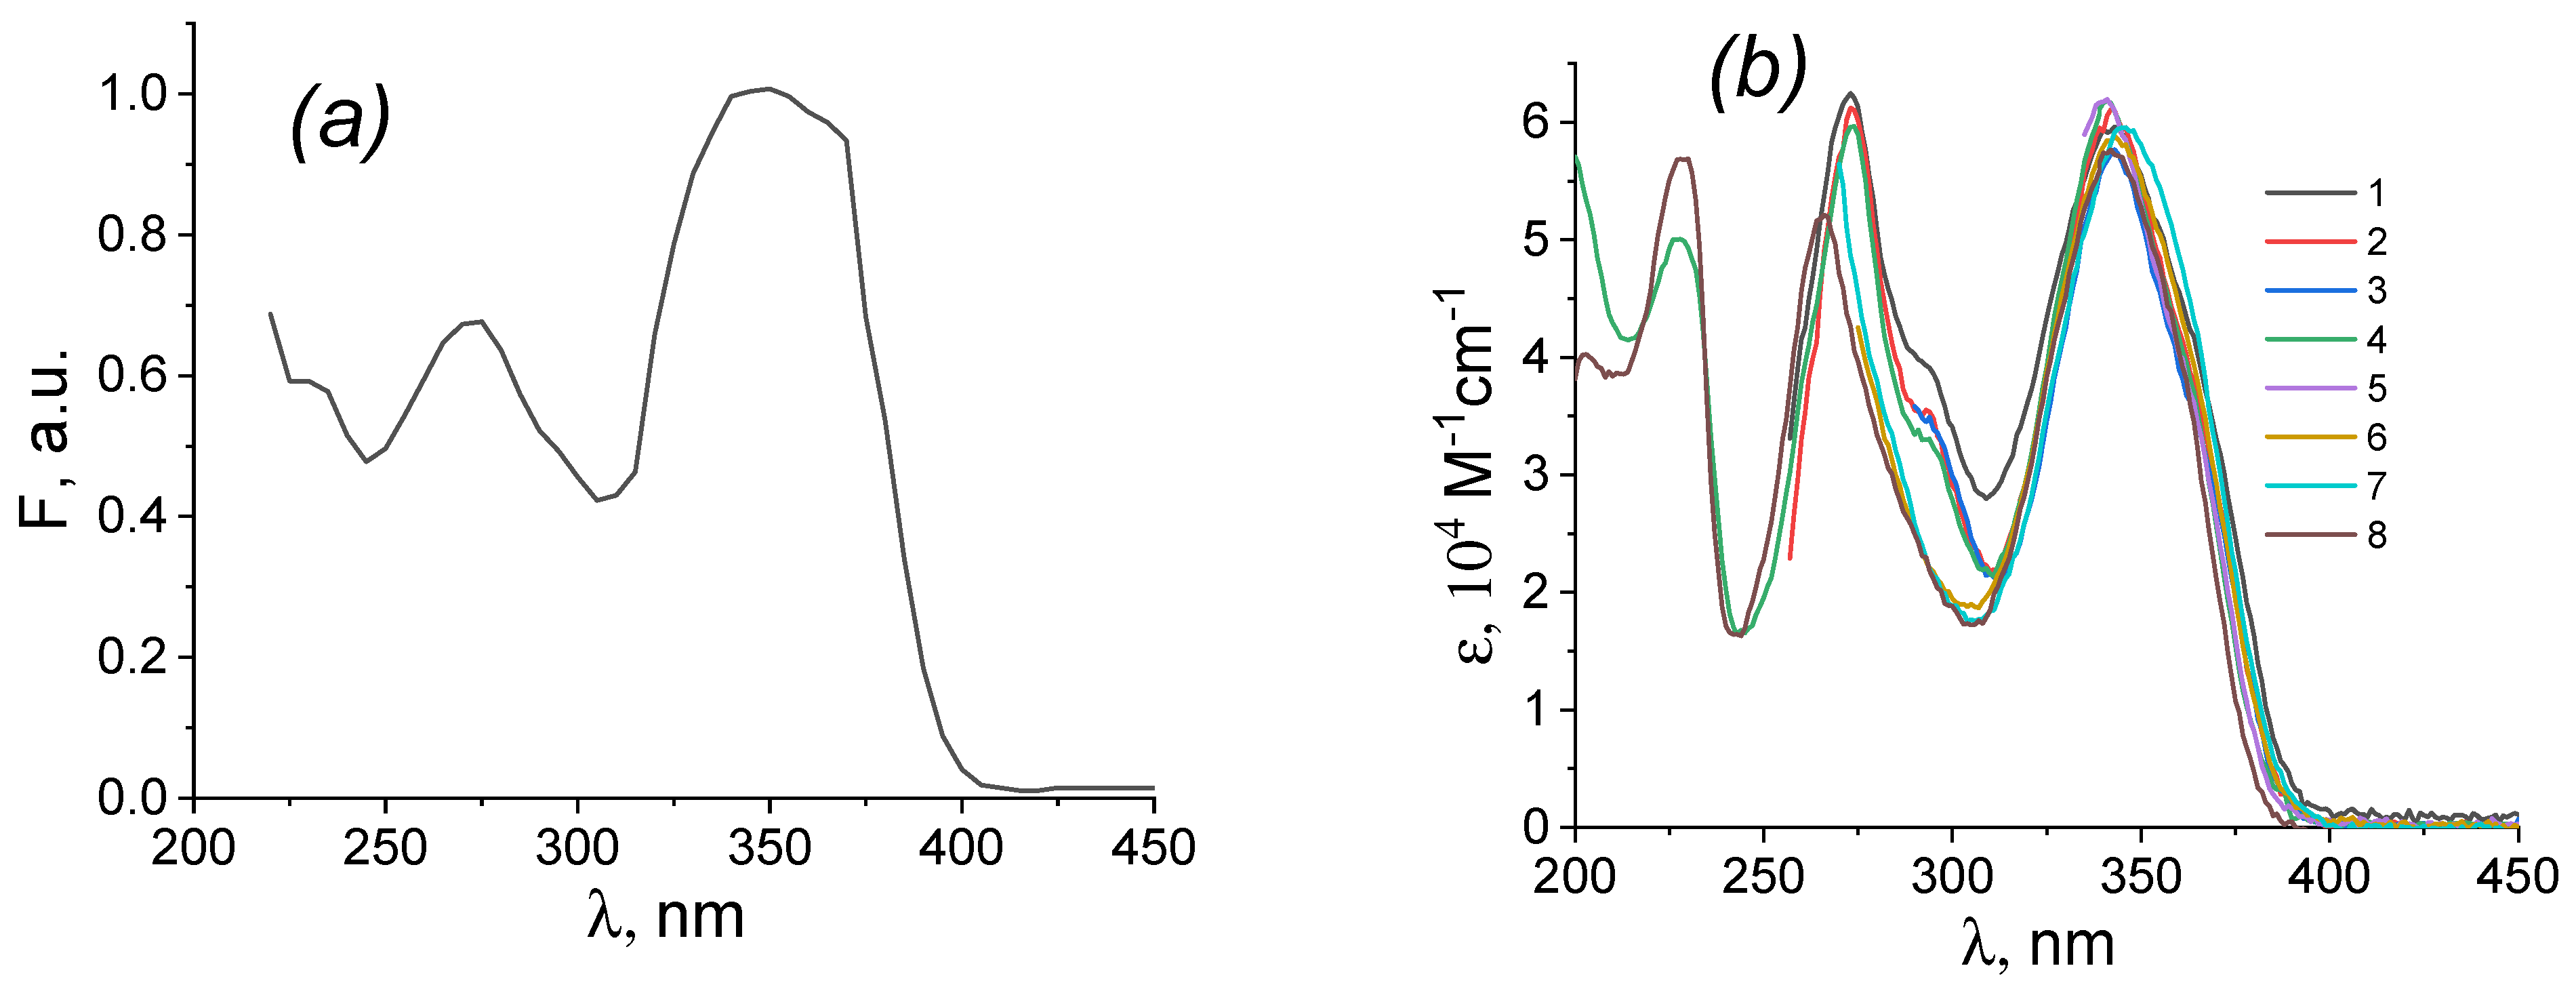
The absorption spectra are dominated by intense ligand-centered π–π* bands in the near-UV region (Figure 1 and Table S1, Supplementary Materials), with molar extinction coefficients in the range of 5.77 × 10⁴ to 6.24 × 10⁴ M−1 cm−1. The lowest-energy absorption band maximum, λ1, lies between 340 and 346 nm and shifts only slightly with solvent, from 340 nm in acetone to 346 nm in DMSO. This minor solvatochromic shift, Δλ = 6 nm, indicates that the lowest ligand-centered singlet excited state of the TTA/Phen chromophores is only weakly perturbed by changes in solvent polarity and coordinating ability. Higher-energy bands appear at λ3 = 266–274 nm in chloroform, dichloromethane, acetonitrile, and methanol. For the chloroform, dichloromethane, toluene, acetone, and acetonitrile solutions, the shoulder appears at λ2 = 292 nm, whereas this shoulder is absent in DMF, DMSO, and methanol. This shoulder may arise from specific solvent–complex interactions, such as weak coordination of donor solvents close to the Eu3+ center, because DMF, DMSO, and methanol solvents possess more pronounced donor properties relative to other solvents and, in principle, can weakly coordinate to the europium(III) ion, increasing its coordination number to 9, which has been observed for other Eu complexes [47]. However, this assumption should be further investigated. The absorption spectra of Eu(TTA)3Phen in chloroform, dichloromethane, acetonitrile, and methanol have an absorption band at λ4 = 228–230 nm in acetonitrile and methanol, corresponding to higher-lying π–π* transitions of the conjugated TTA and Phen chromophores.
Figure 1.
Absorption spectra of (a) crystalline Eu(TTA)3Phen (Kubelka-Munk function) and (b) Eu(TTA)3Phen solution in (1) chloroform, (2) dichloromethane, (3) toluene, (4) acetonitrile, (5) acetone, (6) N,N-dimethylformamide, (7) dimethyl sulfoxide, and (8) methanol.
The observed molar extinction coefficients are in good agreement with previously reported values for Eu(TTA)3Phen in solution, confirming the strong light-harvesting ability of the organic antenna ligands. The solid-state absorption spectrum of crystalline Eu(TTA)3Phen, represented using the Kubelka–Munk function, shows absorption bands centered at approximately 350, 270, and 230 nm (Figure 1a). The similarity between the spectral profile of the crystalline material and those of the solutions (Figure 1b) indicates that the main ligand-centered absorption features are preserved across the solvent series. No clear evidence of significant aggregation, decomposition, or ligand dissociation is observed from the absorption spectra under the experimental conditions used.
3.3. Photoluminescence Spectra and Local Symmetry
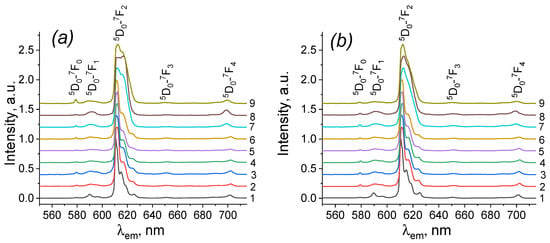
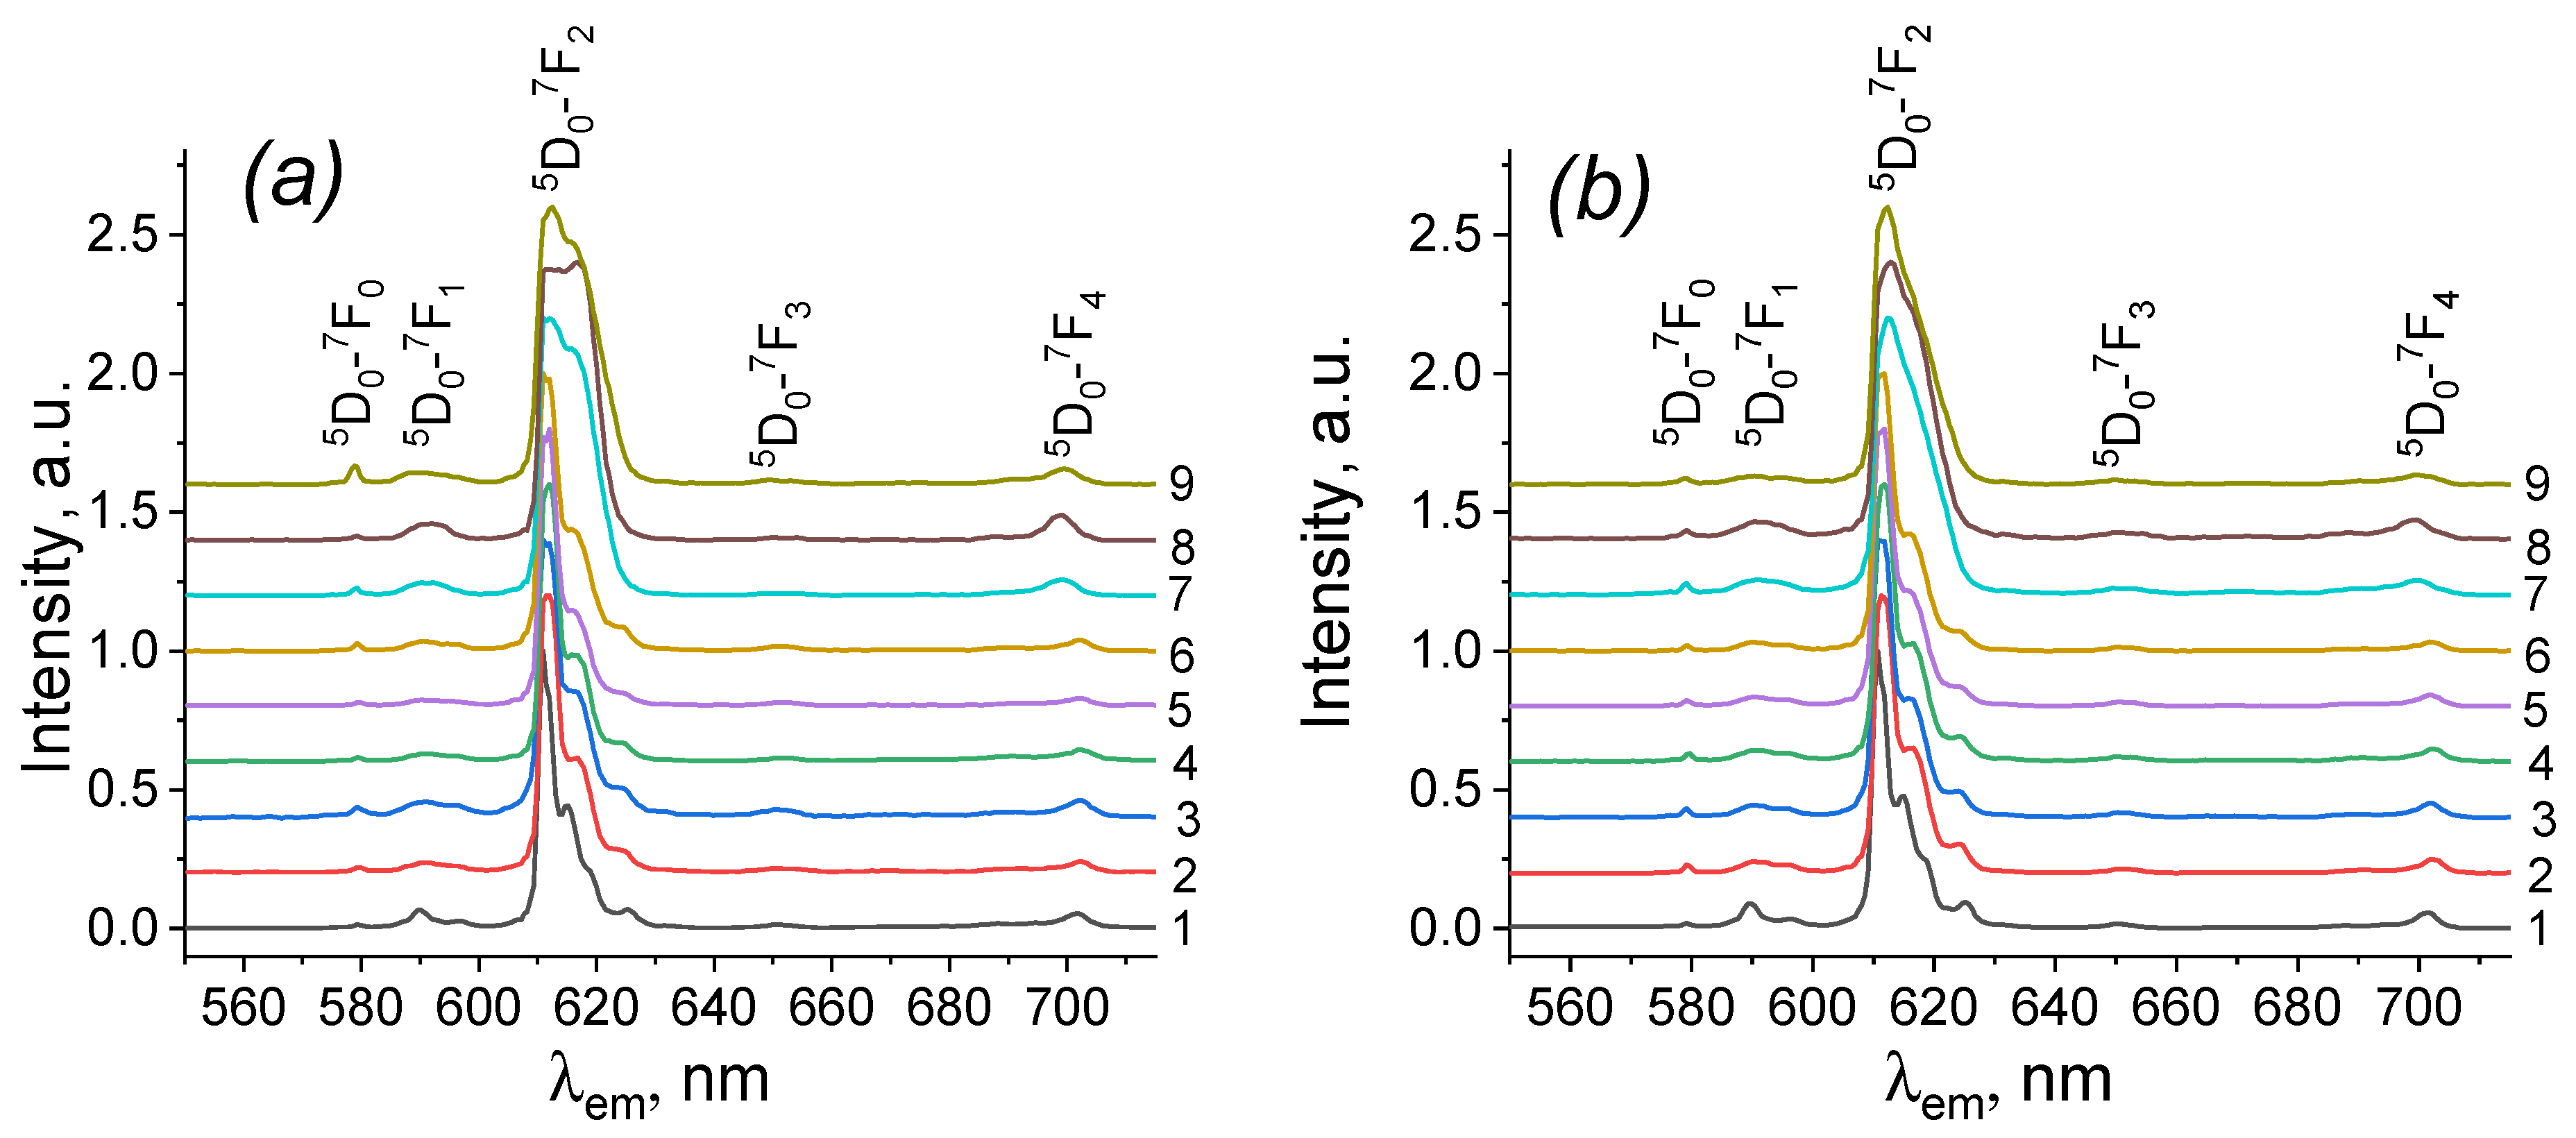
Upon excitation into the ligand-centered absorption bands at 365 or into its weak long-wavelength absorption tail at 405 nm, Eu(TTA)3Phen exhibits the characteristic emission of Eu3+ in all studied solvents and in the crystalline state (Figure 2). The emission spectra consist of narrow 5D0 → 7FJ transitions: 5D0 → 7F0 at 579–580 nm, 5D0 → 7F1 at 590–592 nm, 5D0 → 7F2 at 610–616 nm, 5D0 → 7F3 at approximately 650 nm, and 5D0 → 7F4 at 699–702 nm. The normalized spectra show that the positions of the 5D0 → 7F0, 5D0 → 7F1, 5D0 → 7F3, and 5D0 → 7F4 band maxima remain nearly unchanged across the solvent series, with variations not exceeding 2–3 nm. This behavior is consistent with the shielding of the Eu3+ 4f orbitals by the filled 5s2 and 5p6 shells, which limits the direct influence of the external solvent field on the 4f–4f transition energies [6,48].
Figure 2.
Normalized emission spectra of (1) crystalline Eu(TTA)3Phen and Eu(TTA)3Phen solution in (2) chloroform, (3) dichloromethane, (4) toluene, (5) acetonitrile, (6) acetone, (7) N,N-dimethylformamide, (8) dimethyl sulfoxide, and (9) methanol (a) upon 365 nm excitation (b) upon 405 nm excitation.
In contrast, the hypersensitive 5D0 → 7F2 electric-dipole transition is more strongly affected by the solvent environment. This transition is highly sensitive to the local symmetry and polarizability around Eu3+ and becomes more intense when the Eu3+ ion occupies a non-centrosymmetric site [6,35]. The dominance of the 5D0 → 7F2 band in all media confirms the absence of inversion symmetry around the Eu3+ center. However, changes in its position, width, and intensity indicate that the local coordination environment is modified upon dissolution and depends strongly on solvent identity.
The full width at half maximum of the hypersensitive 5D0 → 7F2 transition, FWHM0−2, shows a pronounced solvent dependence (Table S2, Supplementary Materials). FWHM0−2 increases from 86 cm−1 in the crystalline complex to approximately 100–108 cm−1 in nonpolar and weakly coordinating solvents such as chloroform, dichloromethane, and toluene. This modest broadening can be attributed to weak inhomogeneous broadening associated with solvation and increased conformational freedom of the TTA and Phen ligands in solution. A much stronger broadening is observed in DMF, DMSO, and methanol, where FWHM0−2 reaches 241–264 cm−1. These values indicate a broader distribution of Eu3+ local environments in strongly coordinating or protic media.
The asymmetry ratio R21, defined as the ratio between the integrated intensities of the 5D0 → 7F2 and 5D0 → 7F1 transitions, provides additional information about the local symmetry around Eu3+. The 5D0 → 7F2 transition is strongly affected by the coordination environment, whereas the 5D0 → 7F1 magnetic-dipole transition is much less sensitive to changes in the Eu3+ coordination sphere. Therefore, the asymmetry ratio is widely used as a spectroscopic parameter to track changes in local symmetry around Eu3+ ions [6,49,50,51,52,53].
In the crystalline state, Eu(TTA)3Phen exhibits R21 = 12.8 (Table 1), reflecting a moderately asymmetric Eu3+ environment. Upon dissolution in chloroform, dichloromethane, and toluene, the asymmetry ratio increases to 19.4–20.0, indicating a further lowering of local symmetry and increased electric-dipole character of the 5D0 → 7F2 transition. This enhancement can be attributed to the loss of long-range crystal-packing constraints and greater conformational flexibility of the ligands in solution.
Higher asymmetry ratio values are observed in polar aprotic solvents, reaching 24.5 in acetonitrile, 24.6 in acetone, 23.0 in DMF, and 21.6 in DMSO. These elevated values indicate stronger solvent-induced symmetry lowering. This effect may arise from specific solvent–complex interactions, such as weak coordination of donor solvents close to the Eu3+ center or hydrogen-bonding/electrostatic interactions with the β-diketonate carbonyl groups. Nevertheless, the preservation of the overall Eu3+ emission pattern suggests that the primary coordination structure of Eu(TTA)3Phen remains largely intact in these aprotic solvents.
Methanol produces the largest asymmetry ratio value, 34.9, indicating the strongest perturbation of the Eu3+ local environment. This value is nearly three times larger than that of the crystalline complex and substantially higher than those obtained in aprotic solvents. The exceptionally high asymmetry ratio in methanol suggests a qualitatively different solvation regime, likely involving strong hydrogen bonding and/or direct interaction of methanol molecules with the coordination sphere. As discussed below, this strong structural perturbation is accompanied by the most pronounced lifetime shortening, the highest nonradiative decay rate, and the lowest photoluminescence quantum yield.
3.4. Luminescence Lifetimes and Radiative/Nonradiative Decay Rates
Photoluminescence decay curves of Eu(TTA)3Phen were fitted using a mono-exponential function (Figures S6 and S7, Supplementary Materials), indicating that the 5D0 excited-state decay can be described by a single lifetime component under the experimental conditions used. Lifetime analysis is widely used to evaluate emitting-site uniformity and radiative/nonradiative processes in Eu3+-based luminescent materials [54,55]. The mono-exponential behavior suggests that the dominant emitting Eu3+ species is uniform in each medium and that no significant contribution from multiple emissive species is detected within the sensitivity of the measurement.
The crystalline complex exhibits the longest lifetime, τ = 0.805 ± 0.007 ms, corresponding to a total decay rate of Atot = 1242 s−1 (Table 1). This relatively long lifetime is consistent with efficient shielding of the Eu3+ ion by the bulky TTA and Phen ligands and with a comparatively low nonradiative decay rate, Anr = 494 s−1. In solution, the lifetime decreases in all solvents. Among aprotic solvents, the longest lifetimes are observed in dichloromethane, τ = 0.717 ± 0.007 ms, and acetone, τ = 0.695 ± 0.007 ms. Shorter lifetimes are found in DMF, τ = 0.560 ± 0.007 ms, and DMSO, τ = 0.578 ± 0.007 ms. Methanol produces the strongest lifetime shortening, τ = 0.364 ± 0.007 ms, with Atot = 2747 s−1.
Radiative and nonradiative decay rates were estimated from the corrected emission spectra using a Judd–Ofelt-based approach [56,57], taking the magnetic-dipole 5D0 → 7F1 transition as a reference. This method is commonly used for Eu3+ complexes because the 5D0 → 7F1 transition has a relatively well-defined magnetic-dipole character, whereas the electric-dipole transitions are sensitive to the local ligand field [6,16]. The calculated radiative decay rate, Ar, varies from 748 s−1 in the crystalline state to 1320 s−1 in methanol. The highest Ar values are observed in methanol, DMSO, and DMF, whereas the lowest values are obtained for the crystalline complex and dichloromethane. This increase in Ar upon dissolution, especially in more strongly perturbed media, is consistent with the increase in R21 and reflects enhanced electric-dipole character of the 5D0 → 7F2 transition in more asymmetric environments.
The main solvent effect, however, is observed in the nonradiative decay rate Anr, which varies over a much wider range, from 428 s−1 in dichloromethane to 1427 s−1 in methanol. In nonpolar and moderately polar aprotic solvents, the nonradiative decay rate remains relatively low, ranging from 428 to 657 s−1, leading to high Eu(III) internal quantum yields, ηEu, between 61.9% and 70.1%. The lowest nonradiative decay rate values are observed in dichloromethane and acetone, whereas the highest nonradiative decay rate values among aprotic solvents are obtained in DMF and acetonitrile. These differences suggest that solvent coordination ability, polarity, and vibrational coupling influence the nonradiative deactivation of the Eu3+ emitting state.
In methanol, the nonradiative decay rate increases sharply to 1427 s−1, reducing Eu(III) internal quantum yield (ηEu) to 48.0%, the lowest value among all studied media. This pronounced enhancement of nonradiative decay is consistent with multiphonon relaxation mediated by high-energy O–H vibrational oscillators [58], in this case from methanol molecules located near the Eu3+ center [59,60]. O–H, N–H, and C–H oscillators are well known to quench lanthanide excited states when they are close to the metal center, with O–H vibrations being particularly effective because of their high vibrational energy [23]. Thus, the short lifetime and high nonradiative decay rate observed in methanol provide direct evidence that solvent proticity plays a decisive role in controlling nonradiative decay in Eu(TTA)3Phen solutions.
3.5. Photoluminescence Quantum Yields and Efficiency of Antenna Sensitization
The photoluminescence quantum yield of Eu(TTA)3Phen shows a pronounced dependence on the solvent (Table 1). The crystalline complex exhibits a photoluminescence quantum yield (PLQY) of 38.15% [41]. In solution, the highest PLQY values are obtained in chloroform, 14.7 ± 0.5%, and toluene, 13.7 ± 0.5%, followed by dichloromethane, 10.8 ± 0.5%. Polar aprotic solvents give lower PLQY values: 10.0 ± 0.5% in acetonitrile, 10.9 ± 0.8% in acetone, 9.3 ± 0.5% in DMF, and 8.4 ± 0.5% in DMSO. The lowest PLQY is observed in methanol, with a value of 4.6 ± 0.5%.
The decrease in photoluminescence quantum yield upon dissolution cannot be explained solely by changes in the Eu(III) internal quantum yield. To distinguish between the Eu3+-radiative transition efficiency and the efficiency of ligand-to-metal sensitization, the 5D0-state formation quantum yield, Φform(5D0), was calculated as PLQY/ηEu. This parameter represents the fraction of absorbed photons that successfully populate the Eu3+ 5D0 level before radiative or nonradiative decay occurs. It therefore provides a quantitative measure of antenna sensitization efficiency, including ligand absorption, intersystem crossing, triplet-state population, ligand-to-metal energy transfer, and competing deactivation pathways [61,62].
The crystalline complex shows the highest 5D0-state formation quantum yield, 63.4%, indicating efficient formation of the Eu3+ emitting state in the solid. In solution, 5D0-state formation quantum yield decreases substantially, reaching 22.8% in chloroform, 19.8% in toluene, and 15.6% in dichloromethane. In polar aprotic solvents, 5D0-state formation quantum yield ranges from 12.3% to 16.2%, with the lowest value among these solvents observed in DMSO. Methanol shows the lowest 5D0-state formation quantum yield, Φform(5D0) = 9.5%.
These results demonstrate that antenna efficiency (described by 5D0-state formation quantum yield) and the Eu3+-radiative transition efficiency (described by Eu(III) internal quantum yield) are partially independent factors that both control the overall luminescence output. For example, dichloromethane exhibits one of the highest Eu(III) internal quantum yields, ηEu = 69.3%, but its PLQY is limited to 10.8% because Φform(5D0) is only 15.6%. In contrast, chloroform provides a better balance between ηEu = 64.6% and Φform(5D0) = 22.8%, resulting in the highest solution PLQY. Therefore, a high Eu(III) internal quantum yield alone is not sufficient to guarantee high total emission efficiency; efficient ligand-to-metal sensitization is also required.
The lower Φform(5D0) values observed in polar aprotic solvents suggest that solvent-induced perturbation affects the antenna pathway. In Eu3+ β-diketonate complexes, ligand-to-metal sensitization is generally associated with excitation of the organic antenna ligands, intersystem crossing to ligand triplet states, and subsequent energy transfer to Eu3+. The energy of the ligand triplet state and its energy gap relative to the Eu3+ accepting levels are key parameters controlling sensitization efficiency [63,64]. Recent ultrafast optical and X-ray spectroscopic studies of Eu3+ complexes have provided direct evidence that energy transfer from antenna ligands to Eu3+ can proceed efficiently from ligand triplet states through exchange-mediated mechanisms [61]. In the present system, specific solvent–complex interactions in DMF, DMSO, acetone, and acetonitrile may perturb the ligand triplet-state energy, modify intersystem crossing efficiency, or introduce additional ligand-centered deactivation pathways that compete with Eu3+ sensitization.
Methanol combines both detrimental effects: inefficient formation of the 5D0 level and enhanced nonradiative deactivation from that level. Its Φform(5D0) value is the lowest of the series, 9.5%, while its ηEu is also the lowest, 48.0%. The low PLQY of methanol, 4.6%, therefore probably results from both reduced antenna sensitization and strong O–H-mediated nonradiative quenching. The strong deviation of R21 in methanol further supports the conclusion that the protic solvent induces substantial perturbation of the Eu3+ coordination environment, which affects both energy transfer to Eu3+ and decay from the 5D0 level.
3.6. Solvent Dependence of the Optical Response and Its Structural Implications
The combined dataset of absorption spectra, emission spectra, lifetimes, radiative and nonradiative decay rates, photoluminescence quantum yield, 5D0-state formation quantum yield, and asymmetry ratio values reveals clear correlations between the photophysical response of Eu(TTA)3Phen and solvent properties such as polarity, coordinating ability, and proticity.
Nonpolar and weakly coordinating solvents, namely chloroform, dichloromethane, and toluene, preserve relatively narrow emission bands, long lifetimes, low nonradiative decay rates, high Eu(III) internal quantum yields, and the highest solution photoluminescence quantum yield values. In these solvents, FWHM0−2 remains close to 100–108 cm−1, τ ranges from 0.637 to 0.717 ms, Anr remains between 428 and 538 s−1, and Eu(III) internal quantum yield remains between 64.6% and 69.3%. The R21 values of 19.4–20.0 indicate a moderately asymmetric Eu3+ environment, but the overall photophysical performance suggests that the complex remains well protected from strong solvent-induced perturbation. Chloroform and toluene provide the most favorable balance between antenna efficiency and the Eu3+-radiative transition efficiency, leading to the highest solution photoluminescence quantum yields.
Polar aprotic solvents, including acetonitrile, acetone, DMF, and DMSO, induce greater changes in local symmetry and antenna efficiency. Their values of asymmetry ratio increase to 21.6–24.6, and DMF and DMSO produce substantial broadening of the 5D0 → 7F2 band. Although Eu(III) internal quantum yield remains relatively high in these solvents, the photoluminescence quantum yield values decrease because the 5D0-state formation quantum yield is reduced to 12.3–16.2%. This indicates that the overall luminescence output in polar aprotic solvents is limited primarily by less efficient population of the Eu3+ 5D0 level rather than by complete quenching of the emitting state. The trend is consistent with partial solvent-induced perturbation of the antenna pathway through donor interactions, electrostatic effects, or hydrogen bonding to ligand carbonyl groups.
Methanol represents the most unfavorable medium for Eu(TTA)3Phen luminescence. The exceptionally high asymmetry ratio, 34.9, the shortest lifetime, 0.364 ms, the highest Anr, 1427 s−1, the lowest Eu(III) internal quantum yield, 48.0%, the lowest 5D0-state formation quantum yield, 9.5%, and the lowest photoluminescence quantum yield, 4.6%, collectively demonstrate that methanol strongly perturbs the Eu3+ local environment, enhances O–H-mediated vibrational quenching, and reduces ligand-to-metal sensitization. These results show that protic solvents are particularly detrimental to Eu(TTA)3Phen emission.
Overall, the solvent-dependent luminescence of Eu(TTA)3Phen is governed by two coupled but distinguishable contributions: the Eu(III) internal quantum yield and the efficiency of ligand-to-metal sensitization. Nonpolar and weakly coordinating solvents preserve both factors more effectively, whereas strongly coordinating polar solvents mainly reduce antenna efficiency, and methanol reduces both antenna efficiency and Eu(III) internal quantum yield. This distinction is important for the rational design of Eu(TTA)3Phen-based luminophores for solution-processable photonic systems, sensing platforms, and emissive polymeric or hybrid materials [15,24,42]. In particular, the combined analysis of R21, FWHM0−2, τ, Ar, Anr, ηEu, PLQY, and Φform(5D0) provides a practical framework to determine whether a decrease in emission efficiency originates mainly from Eu3+-centered nonradiative quenching or from inefficient antenna sensitization.
The optical data demonstrate solvent-dependent perturbation of the Eu(III) emitting environment. However, they do not by themselves establish a unique coordination structure in solution. Accordingly, references to direct solvent coordination, ligand dissociation, or a specific structural rearrangement are treated as hypotheses rather than conclusions. Therefore, future work should correlate these photophysical parameters with quantitative solvent descriptors, including dielectric constant, donor number, acceptor number, and Kamlet–Taft parameters [65,66], to establish predictive models for solvent-dependent emission behavior. In addition, ligand design strategies such as increased steric shielding, fluorination, or reduced access of high-energy vibrational oscillators to the Eu3+ center may help improve the resistance of Eu(TTA)3Phen-related complexes to solvent-induced quenching.
4. Conclusions
In this work, the solvent-dependent photophysical properties of Eu(TTA)3Phen were systematically investigated in organic solvents with different polarity, coordinating ability, and proticity. The UV–Vis absorption spectra showed only minor solvent-induced shifts in the ligand-centered absorption bands, indicating that the primary light-harvesting properties of the TTA/Phen antenna system are largely preserved across the solvent series. In contrast, the Eu3+ emission spectra, asymmetry ratios, luminescence lifetimes, radiative and nonradiative decay rates, photoluminescence quantum yields, and 5D0-level formation efficiencies showed pronounced solvent dependence.
Nonpolar and weakly coordinating solvents, particularly chloroform and toluene, provided the most favorable conditions for Eu(TTA)3Phen luminescence in solution, yielding the highest photoluminescence quantum yield values and relatively efficient 5D0-level formation. Polar aprotic solvents maintained relatively high Eu(III) internal quantum yields but reduced the overall luminescence output mainly through decreased antenna sensitization efficiency. Methanol produced the strongest perturbation, leading to the highest asymmetry ratio, shortest lifetime, highest nonradiative decay rate, lowest Eu(III) internal quantum yield, lowest 5D0-state formation quantum yield, and lowest photoluminescence quantum yield.
These results demonstrate that the solvent-dependent emission of Eu(TTA)3Phen is governed by both Eu3+-centered deactivation and ligand-to-metal sensitization efficiency. The combined analysis of the optical properties provides a practical framework for identifying whether luminescence losses originate primarily from nonradiative quenching of the Eu3+ emitting state or from inefficient antenna-mediated population of the 5D0 level. This understanding is useful for the rational design of Eu(TTA)3Phen-based luminophores for solution-processable photonic materials, sensing platforms, and emissive hybrid systems.
Supplementary Materials
The following supporting information can be downloaded at https://www.mdpi.com/article/10.3390/chemistry8090126/s1. Table S1: UV–Vis absorption parameters of crystalline Eu(TTA)3Phen and Eu(TTA)3Phen solutions in different solvents; Table S2: Extended photophysical parameters of crystalline Eu(TTA)3Phen and Eu(TTA)3Phen solutions in different solvents; Table S3: FTIR band assignments of crystalline Eu(TTA)3Phen; Figure S1: FTIR spectra of crystalline Eu(TTA)3Phen; Figure S2: Raman spectra of crystalline Eu(TTA)3Phen; Figure S3: PXRD pattern of Eu(TTA)3Phen (1) reported in this work and (2) reported previously [34]. The XRD pattern of Eu(TTA)3Phen from [34] was digitized and then re-plotted. The coinciding diffraction maxima were marked by the dashed lines; Figure S4: The emission spectra of 10 μM chloroform solution of Eu(TTA)3Phen (1) reported in this work upon 365-nm excitation using our state-of-art spectrofluorometer and (2) reported previously [35] upon 355-nm excitation using Fluorolog-3 spectrofluorometer (Horiba Jobin Yvon, Japan). The emission spectrum of Eu(TTA)3Phen in CHCl3 from [35] was digitized and then re-plotted; Figure S5: The power dependence of 611-nm emission intensity at 7 mM DMSO solution of Eu(TTA)3Phen upon 405-nm excitation, recorded using Little Garden spectrometer (Lao Kang, China); Figure S6: Photoluminescence decay curves of Eu(TTA)3Phen in the crystalline state and in different solvents upon 405-nm excitation; Figure S7: Photoluminescence decay curves of Eu(TTA)3Phen in the crystalline state and in different solvents upon 405-nm excitation in logarithmic coordinates.
Author Contributions
Conceptualization, B.V. and A.M.; methodology, B.V. and A.M.; formal analysis, B.V. and M.N.R.; investigation, B.V.; data curation, B.V. and M.N.R.; visualization, B.V.; writing—original draft preparation, A.M. and B.V.; writing—review and editing, B.V., M.N.R., and A.M.; supervision, A.M.; project administration, A.M. All authors have read and agreed to the published version of the manuscript.
Funding
This research received no external funding.
Data Availability Statement
The data presented in this study are available in the article and the Supplementary Materials. Additional raw experimental data are available from the corresponding author upon reasonable request.
Acknowledgments
The authors acknowledge Yachay Tech University for institutional support. A.M. acknowledges Chemcraft Ltd. (Kaliningrad, Russia) and personally its director Vladislav Labunets, for the supply the lanthanide salts for the experiments. The authors acknowledge Mario Damian Andrango Torres and Ariel Sebastian Calderon Rodriguez, students of Yachay Tech University, for the help with experimental setup development. Preplexity AI (https://www.perplexity.ai/, accessed on 7 July 2026) was used in order to proof-read the text of the article.
Conflicts of Interest
The authors declare no conflicts of interest.
Abbreviations
The following abbreviations are used in this manuscript:
| Eu(TTA)3Phen | tris(thenoyltrifluoroacetonate)(1,10-phenanthroline)europium(III) |
| HTTA | 2-thenoyltrifluoroacetone |
| Phen | 1,10-phenanthroline |
| ACN | acetonitrile |
| DCM | dichloromethane |
| DMF | N,N-dimethylformamide |
| DMSO | dimethyl sulfoxide |
| ATR | attenuated total reflectance |
| DR | diffuse reflectance |
| FTIR | Fourier-transform infrared spectroscopy |
| FWHM | full width at half maximum |
| ISC | intersystem crossing |
| PL | photoluminescence |
| PLQY | photoluminescence quantum yield |
| PXRD | powder X-ray diffraction |
| UV-Vis | ultraviolet–visible spectroscopy |
| UV–Vis–NIR | ultraviolet–visible–near-infrared spectroscopy |
| Atot | total decay rate |
| Ar | radiative decay rate |
| Anr | nonradiative decay rate |
| R21 | asymmetry ratio |
| τ | photoluminescence decay time constant |
| ηEu | Eu(III) internal quantum yield |
| Φform(5D0) | formation quantum yield of the Eu3+ 5D0 level |
References
- Ahmed, Z.; Carvalho, R.d.S.; dos Santos, A.M.; Gambassi, F.; Bandini, E.; Marvelli, L.; Maini, L.; Barbieri, A.; Cremona, M. Highly Luminescent Europium(III) Complexes in Solution and PMMA-Doped Films for Bright Red Electroluminescent Devices. Molecules 2023, 28, 4371. [Google Scholar] [CrossRef] [Scilit] [PubMed]
- Pershagen, E.; Nordholm, J.; Borbas, K.E. Luminescent Lanthanide Complexes with Analyte-Triggered Antenna Formation. J. Am. Chem. Soc. 2012, 134, 9832–9835. [Google Scholar] [CrossRef] [Scilit] [PubMed]
- Delbianco, M.; Sadovnikova, V.; Bourrier, E.; Mathis, G.; Lamarque, L.; Zwier, J.M.; Parker, D. Bright, Highly Water-Soluble Triazacyclononane Europium Complexes to Detect Ligand Binding with Time-Resolved FRET Microscopy. Angew. Chem. Int. Ed. 2014, 53, 10718–10722. [Google Scholar] [CrossRef] [Scilit] [PubMed]
- Feng, P.; Yang, X.; Feng, X.; Zhao, G.; Li, X.; Cao, J.; Tang, Y.; Yan, C.H. Highly Stable Perovskite Quantum Dots Modified by Europium Complex for Dual-Responsive Optical Encoding. ACS Nano 2021, 15, 6266–6275. [Google Scholar] [CrossRef] [Scilit] [PubMed]
- Zhang, Y.; Du, T.; Duan, H.; Chen, B.; Zhang, J.; Xiao, Q.; Chen, G.; Guo, D.; Liao, H.; Zhou, S.; et al. Efficient and Robust Europium(III)-Based Hybrid Lanthanide Scintillators for Advanced X-ray Imaging. Angew. Chem. Int. Ed. 2025, 64, e202423155. [Google Scholar] [CrossRef] [Scilit] [PubMed]
- Binnemans, K. Interpretation of Europium(III) Spectra. Coord. Chem. Rev. 2015, 295, 1–45. [Google Scholar] [CrossRef] [Scilit]
- Cao, W.; Tang, Y.; Cui, Y.; Qian, G. Energy Transfer in Metal–Organic Frameworks and Its Applications. Small Struct. 2020, 1, 2000019. [Google Scholar] [CrossRef] [Scilit]
- Marin, R.; Jaque, D.; Benayas, A. Switching to the Brighter Lane: Pathways to Boost the Absorption of Lanthanide-Doped Nanoparticles. Nanoscale Horiz. 2021, 6, 209–230. [Google Scholar] [CrossRef] [Scilit] [PubMed]
- Fu, L.M.; Wen, X.F.; Ai, X.C.; Sun, Y.; Wu, Y.S.; Zhang, J.P.; Wang, Y. Efficient Two-Photon-Sensitized Luminescence of a Europium(III) Complex. Angew. Chem. Int. Ed. 2005, 44, 747–750. [Google Scholar] [CrossRef] [Scilit] [PubMed]
- Miyazaki, S.; Gotanda, M.; Kitagawa, Y.; Hasegawa, Y.; Miyata, K.; Onda, K. Full Picture of Energy Transfer in a Trivalent Europium Complex with Bidentate β-Diketonate Ligand. J. Phys. Chem. Lett. 2024, 15, 10718–10724. [Google Scholar] [CrossRef] [Scilit] [PubMed]
- Yin, H.Q.; Wang, X.Y.; Yin, X.B. Rotation Restricted Emission and Antenna Effect in Single Metal–Organic Frameworks. J. Am. Chem. Soc. 2019, 141, 15166–15173. [Google Scholar] [CrossRef] [Scilit] [PubMed]
- Nehra, K.; Dalal, A.; Hooda, A.; Singh, S.; Singh, D. Computational and Spectroscopic Evaluation of 1,10-Phenanthroline-Based Eu(III) Fluorinated β-Diketonate Complexes for Displays. J. Lumin. 2022, 251, 119111. [Google Scholar] [CrossRef] [Scilit]
- Ilmi, R.; Haque, A.; Khan, M.S. Synthesis and Photophysics of Red-Emitting Europium Complexes: An Estimation of the Role of Ancillary Ligand by Chemical Partition of Radiative Decay Rate. J. Photochem. Photobiol. A Chem. 2019, 370, 135–144. [Google Scholar] [CrossRef] [Scilit]
- Dalal, A.; Nehra, K.; Hooda, A.; Singh, D.; Kumar, S.; Malik, R.S. Red Emissive Ternary Europium Complexes: Synthesis, Optical, and Luminescence Characteristics. Luminescence 2022, 37, 1309–1320. [Google Scholar] [CrossRef] [Scilit] [PubMed]
- Shahi, P.K.; Singh, A.K.; Singh, S.K.; Rai, S.B.; Ullrich, B. Revelation of the Technological Versatility of the Eu(TTA)3Phen Complex by Demonstrating Energy Harvesting, Ultraviolet Light Detection, Temperature Sensing, and Laser Applications. ACS Appl. Mater. Interfaces 2015, 7, 18231–18239. [Google Scholar] [CrossRef] [Scilit] [PubMed]
- Werts, M.H.V.; Jukes, R.T.F.; Verhoeven, J.W. The Emission Spectrum and the Radiative Lifetime of Eu3+ in Luminescent Lanthanide Complexes. Phys. Chem. Chem. Phys. 2002, 4, 1542–1548. [Google Scholar] [CrossRef] [Scilit]
- Wang, Z.; Hu, X.; Yang, Y.; Wang, W.; Wang, Y.; Gong, X.; Geng, C.; Tang, J. Synthesis of Mesoporous and Hollow SiO2@Eu(TTA)3phen with Enhanced Fluorescence Properties. Materials 2023, 16, 4501. [Google Scholar] [CrossRef] [Scilit] [PubMed]
- Guo, X.; Guo, H.; Fu, L.; Deng, R.; Chen, W.; Feng, J.; Dang, S.; Zhang, H. Synthesis, Spectroscopic Properties, and Stabilities of Ternary Europium Complex in SBA-15 and Periodic Mesoporous Organosilica: A Comparative Study. J. Phys. Chem. C 2009, 113, 2603–2610. [Google Scholar] [CrossRef] [Scilit]
- Cheng, B.; Deng, Z.; Liang, C.; Zhang, Y.; Hao, J.; Xu, D.; Xiao, J.; Wang, R. Electroluminescence Based on Eu0.5La0.5(TTA)3phen Doped Poly(N-vinylcarbazole). J. Rare Earths 2006, 24, 529–532. [Google Scholar] [CrossRef] [Scilit]
- Garoub, M.; Hefny, A.H.; Omer, W.E.; Elsaady, M.M.; Abo-Aly, M.M.; Sayqal, A.A.; Alharbi, A.; Hameed, A.; Alessa, H.; Youssef, A.O.; et al. Highly Selective Optical Sensor Eu(TTA)3Phen Embedded in Poly(methyl methacrylate) for Assessment of Total Prostate-Specific Antigen Tumor Marker in Male Serum Suffering Prostate Diseases. Front. Chem. 2020, 8, 561052. [Google Scholar] [CrossRef] [Scilit] [PubMed]
- Li, M.; Zhou, Y.; Yao, Y.; Gao, T.; Yan, P.; Li, H. Designing Water-Quenching-Resistant Highly Luminescent Europium Complexes by Regulating the Orthogonal Arrangement of Bis-β-Diketone Ligands. Dalton Trans. 2021, 50, 9914–9922. [Google Scholar] [CrossRef] [Scilit] [PubMed]
- Marcus, Y. The Properties of Organic Liquids That Are Relevant to Their Use as Solvating Solvents. Chem. Soc. Rev. 1993, 22, 409–416. [Google Scholar] [CrossRef] [Scilit]
- Beeby, A.; Clarkson, I.M.; Dickins, R.S.; Faulkner, S.; Parker, D.; Royle, L.; De Sousa, A.S.; Williams, J.A.G.; Woods, M. Non-Radiative Deactivation of the Excited States of Europium, Terbium and Ytterbium Complexes by Proximate Energy-Matched OH, NH and CH Oscillators: An Improved Luminescence Method for Establishing Solution Hydration States. J. Chem. Soc. Perkin Trans. 2 1999, 28, 493–504. [Google Scholar] [CrossRef] [Scilit]
- Bünzli, J.C.G. On the Design of Highly Luminescent Lanthanide Complexes. Coord. Chem. Rev. 2015, 293–294, 19–47. [Google Scholar] [CrossRef] [Scilit]
- Song, F.J.; Su, P.; Li, X.; Yan, C.H.; Zhang, J.L.; Tang, Y. Harnessing Rare Earth Coordination Chemistry for Advanced Photofunctional Materials: From Fundamental Principles to Emerging Technologies. Chem. Soc. Rev. 2026, 55, 5117–5197. [Google Scholar] [CrossRef] [Scilit] [PubMed]
- Jiang, W.K.; Huang, T.T.; Li, R.Y.; Wang, H.L.; Li, Y.L.; Zou, H.H.; Liang, F.P.; Chen, D.X.; Zhu, Z.H. Ultra-High-Brightness Ln-MOFs X-ray Scintillators by Heavy Atoms, Aggregation Effects, and Hydrogen Bonds Restrict Movement. Adv. Mater. 2026, 38, e20018. [Google Scholar] [CrossRef] [Scilit] [PubMed]
- Dhamo, L.; Perego, J.; Villa, I.; Bezuidenhout, C.X.; Mattei, I.; Landella, A.; Bracco, S.; Comotti, A.; Monguzzi, A. Ultrafast Scintillating Metal–Organic Framework Films. Nat. Commun. 2026, 17, 1834. [Google Scholar] [CrossRef] [Scilit] [PubMed]
- Ruggieri, S.; Mizzoni, S.; Nardon, C.; Cavalli, E.; Sissa, C.; Anselmi, M.; Cozzi, P.G.; Gualandi, A.; Sanadar, M.; Melchior, A.; et al. Circularly Polarized Luminescence from New Heteroleptic Eu(III) and Tb(III) Complexes. Inorg. Chem. 2023, 62, 8812–8822. [Google Scholar] [CrossRef] [Scilit] [PubMed]
- Melo, L.L.L.S.; Castro, G.P.; Navarro, M.; Gonçalves, S.M.C.; Simas, A.M. Unmasking the UV Photobleaching of β-Diketonate [Eu(BTFA)4]− Complexes as an Energy-Driven Photoreduction Process. Inorg. Chem. 2025, 64, 3842–3856. [Google Scholar] [CrossRef] [Scilit] [PubMed]
- Dexter, D.L. A Theory of Sensitized Luminescence in Solids. J. Chem. Phys. 1953, 21, 836–850. [Google Scholar] [CrossRef] [Scilit]
- Förster, T. Zwischenmolekulare Energiewanderung und Fluoreszenz. Ann. Phys. 1948, 437, 55–75. [Google Scholar] [CrossRef] [Scilit]
- Shahi, P.K.; Kumar, B.; Prakash, R.; Rai, S.B. Investigation of Optical Properties and Energy Transfer in Eu(III)- and Tb(III)-Based Composite Compound Dispersed in Polar, Non-Polar Solvents and Polymer Matrix. Mater. Res. Express 2019, 6, 046204. [Google Scholar] [CrossRef] [Scilit]
- Meng, M.; Bai, M.; Da, Z.; Cui, Y.; Li, B.; Pan, J. Selective Recognition of Salicylic Acid Employing New Fluorescent Imprinted Membrane Functionalized with Poly(amidoamine) (PAMAM)-Encapsulated Eu(TTA)3phen. J. Lumin. 2019, 208, 24–32. [Google Scholar] [CrossRef] [Scilit]
- Lü, Y.; Zhang, J.; Cao, W.; Zhang, F.; Xu, Z. Syntheses and Characterization of Binuclear Complexes Tb1−xEux(TTA)3Phen. J. Rare Earths 2007, 25, 296–301. [Google Scholar] [CrossRef] [Scilit]
- Thor, W.; Kai, H.Y.; Yeung, Y.H.; Wu, Y.; Cheung, T.L.; Tam, L.K.B.; Zhang, Y.; Charbonnière, L.J.; Tanner, P.A.; Wong, K.L. Unearthing the Real-Time Excited State Dynamics from Antenna to Rare Earth Ions Using Ultrafast Transient Absorption. JACS Au 2024, 4, 3813–3822. [Google Scholar] [CrossRef] [Scilit] [PubMed]
- Villegas, E.; Diaz-Barrios, A.; González, G.; Chimborazo, J.; Reinoso, C.; Caetano, M.; de Lima, L.; Gardener, J.; Solorzano, G. Enhanced Luminescent Properties of Carbon Quantum Dots on Thermo-Responsive Vinylcaprolactam Hydrogel Matrix. Carbon Trends 2025, 19, 100484. [Google Scholar] [CrossRef] [Scilit]
- Eaton, D.F. Reference Materials for Fluorescence Measurement. Pure Appl. Chem. 1988, 60, 1107–1114. [Google Scholar] [CrossRef] [Scilit]
- Brouwer, A.M. Standards for Photoluminescence Quantum Yield Measurements in Solution (IUPAC Technical Report). Pure Appl. Chem. 2011, 83, 2213–2228. [Google Scholar] [CrossRef] [Scilit]
- Bruno, T.J.; Svoronos, P.D.N. CRC Handbook of Basic Tables for Chemical Analysis: Data-Driven Methods and Interpretation; CRC Press: Boca Raton, FL, USA, 2020; ISBN 9781315109466. [Google Scholar] [CrossRef] [Scilit]
- Peng, C.; Zhang, H.; Yu, J.; Meng, Q.; Fu, L.; Li, H.; Sun, L.; Guo, X. Synthesis, Characterization, and Luminescence Properties of the Ternary Europium Complex Covalently Bonded to Mesoporous SBA-15. J. Phys. Chem. B 2005, 109, 15278–15287. [Google Scholar] [CrossRef] [Scilit] [PubMed]
- Dai, T.T.; Liu, L.; Tao, D.L.; Li, S.G.; Zhang, H.; Cui, Y.M.; Wang, Y.Z.; Chen, J.T.; Zhang, K.; Sun, W.Z.; et al. Influence of Gd Doping on the Absolute Quantum Efficiency and Lifetime of EuxGd1−x(TTA)3phens. Chin. Chem. Lett. 2014, 25, 892–896. [Google Scholar] [CrossRef] [Scilit]
- Zhao, S.; Zhang, L.; Li, W.; Li, L. Preparation and Fluorescent Property of Eu(TTA)3phen Incorporated in Polycarbonate Resin. Polym. J. 2006, 38, 523–526. [Google Scholar] [CrossRef] [Scilit]
- Nolasco, M.M.; Vaz, P.M.; Freitas, V.T.; Lima, P.P.; André, P.S.; Ferreira, R.A.S.; Vaz, P.D.; Ribeiro-Claro, P.; Carlos, L.D. Engineering Highly Efficient Eu(III)-Based Tri-Ureasil Hybrids toward Luminescent Solar Concentrators. J. Mater. Chem. A 2013, 1, 7339–7350. [Google Scholar] [CrossRef] [Scilit]
- Reiher, M.; Brehm, G.; Schneider, S. Assignment of Vibrational Spectra of 1,10-Phenanthroline by Comparison with Frequencies and Raman Intensities from Density Functional Calculations. J. Phys. Chem. A 2004, 108, 734–742. [Google Scholar] [CrossRef] [Scilit]
- Nekoei, A.R.; Tayyari, S.F.; Vakili, M.; Holakoei, S.; Hamidian, A.H.; Sammelson, R.E. Conformation and Vibrational Spectra and Assignment of 2-Thenoyltrifluoroacetone. J. Mol. Struct. 2009, 932, 112–122. [Google Scholar] [CrossRef] [Scilit]
- Hu, M.L.; Huang, Z.Y.; Cheng, Y.Q.; Wang, S.; Lin, J.J.; Hu, Y.; Xu, D.J.; Xu, Y.Z. Crystal Structure and Fluorescence Spectrum of the Complex [Eu(III)(TTA)3(phen)]. Chin. J. Chem. 1999, 17, 637–643. [Google Scholar] [CrossRef] [Scilit]
- De Rosa, D.F.; Starck, M.; Parker, D.; Pal, R. Unlocking Same-Sign CPL: Solvent Effects on Spectral Form and Racemisation Kinetics in Nine-Coordinate Chiral Europium(III) Complexes. Chem. Eur. J. 2024, 30, e202303227. [Google Scholar] [CrossRef] [Scilit] [PubMed]
- Richardson, F.S. Terbium(III) and Europium(III) Ions as Luminescent Probes and Stains for Biomolecular Systems. Chem. Rev. 1982, 82, 541–552. [Google Scholar] [CrossRef] [Scilit]
- Kolesnikov, I.E.; Povolotskiy, A.V.; Mamonova, D.V.; Kolesnikov, E.Y.; Kurochkin, A.V.; Lähderanta, E.; Mikhailov, M.D. Asymmetry Ratio as a Parameter of Eu3+ Local Environment in Phosphors. J. Rare Earths 2018, 36, 474–481. [Google Scholar] [CrossRef] [Scilit]
- Sudarsan, V.; Van Veggel, F.C.J.M.; Herring, R.A.; Raudsepp, M. Surface Eu3+ Ions Are Different than “Bulk” Eu3+ Ions in Crystalline Doped LaF3 Nanoparticles. J. Mater. Chem. 2005, 15, 1332–1342. [Google Scholar] [CrossRef] [Scilit]
- Golyeva, E.V.; Kolesnikov, I.E.; Lähderanta, E.; Kurochkin, A.V.; Mikhailov, M.D. Effect of Synthesis Conditions on Structural, Morphological and Luminescence Properties of MgAl2O4:Eu3+ Nanopowders. J. Lumin. 2018, 194, 387–393. [Google Scholar] [CrossRef] [Scilit]
- Park, K.; Kim, H.; Hakeem, D.A. Effect of Host Composition and Eu3+ Concentration on the Photoluminescence of Aluminosilicate (Ca,Sr)2Al2SiO7:Eu3+ Phosphors. Dye. Pigment. 2017, 136, 70–77. [Google Scholar] [CrossRef] [Scilit]
- Thor, W.; Carneiro Neto, A.N.; Moura, R.T.; Wong, K.L.; Tanner, P.A. Europium(III) Coordination Chemistry: Structure, Spectra and Hypersensitivity. Coord. Chem. Rev. 2024, 517, 215927. [Google Scholar] [CrossRef] [Scilit]
- Kolesnikov, I.E.; Povolotskiy, A.V.; Mamonova, D.V.; Lähderanta, E.; Manshina, A.A.; Mikhailov, M.D. Photoluminescence Properties of Eu3+ Ions in Yttrium Oxide Nanoparticles: Defect vs. Normal Sites. RSC Adv. 2016, 6, 76533–76541. [Google Scholar] [CrossRef] [Scilit]
- Kolesnikov, I.E.; Kolokolov, D.S.; Kurochkin, M.A.; Voznesenskiy, M.A.; Osmolowsky, M.G.; Lähderanta, E.; Osmolovskaya, O.M. Morphology and Doping Concentration Effect on the Luminescence Properties of SnO2:Eu3+ Nanoparticles. J. Alloys Compd. 2020, 822, 153640. [Google Scholar] [CrossRef] [Scilit]
- Judd, B.R. Optical Absorption Intensities of Rare-Earth Ions. Phys. Rev. 1962, 127, 750–761. [Google Scholar] [CrossRef] [Scilit]
- Ofelt, G.S. Intensities of Crystal Spectra of Rare-Earth Ions. J. Chem. Phys. 1962, 37, 511–520. [Google Scholar] [CrossRef] [Scilit]
- Haas, Y.; Stein, G. Pathways of Radiative and Radiationless Transitions in Europium(III) Solutions. The Role of High Energy Vibrations. J. Phys. Chem. 1971, 75, 3677–3681. [Google Scholar] [CrossRef] [Scilit]
- Supkowski, R.M.; Horrocks, W.D.W. On the Determination of the Number of Water Molecules, q, Coordinated to Europium(III) Ions in Solution from Luminescence Decay Lifetimes. Inorg. Chim. Acta 2002, 340, 44–48. [Google Scholar] [CrossRef] [Scilit]
- Horrocks, W.D., Jr.; Sudnick, D.R. Lanthanide Ion Probes of Structure in Biology. Laser-Induced Luminescence Decay Constants Provide a Direct Measure of the Number of Metal-Coordinated Water Molecules. J. Am. Chem. Soc. 1979, 101, 334–340. [Google Scholar] [CrossRef] [Scilit]
- Mara, M.W.; Tatum, D.S.; March, A.M.; Doumy, G.; Moore, E.G.; Raymond, K.N. Energy Transfer from Antenna Ligand to Europium(III) Followed Using Ultrafast Optical and X-ray Spectroscopy. J. Am. Chem. Soc. 2019, 141, 11071–11081. [Google Scholar] [CrossRef] [Scilit] [PubMed]
- Latva, M.; Takalo, H.; Mukkala, V.M.; Matachescu, C.; Rodríguez-Ubis, J.C.; Kankare, J. Correlation between the Lowest Triplet State Energy Level of the Ligand and Lanthanide(III) Luminescence Quantum Yield. J. Lumin. 1997, 75, 149–169. [Google Scholar] [CrossRef] [Scilit]
- Sato, S.; Wada, M. Relations between Intramolecular Energy Transfer Efficiencies and Triplet State Energies in Rare Earth β-Diketone Chelates. Bull. Chem. Soc. Jpn. 1970, 43, 1955–1962. [Google Scholar] [CrossRef] [Scilit]
- Crosby, G.A.; Whan, R.E.; Alire, R.M. Intramolecular Energy Transfer in Rare Earth Chelates. Role of the Triplet State. J. Chem. Phys. 1961, 34, 743–748. [Google Scholar] [CrossRef] [Scilit]
- Gutmann, V. Empirical Parameters for Donor and Acceptor Properties of Solvents. Electrochim. Acta 1976, 21, 661–670. [Google Scholar] [CrossRef] [Scilit]
- Kamlet, M.J.; Abboud, J.L.M.; Abraham, M.H.; Taft, R.W. Linear Solvation Energy Relationships. 23. A Comprehensive Collection of the Solvatochromic Parameters, π*, α, and β, and Some Methods for Simplifying the Generalized Solvatochromic Equation. J. Org. Chem. 1983, 48, 2877–2887. [Google Scholar] [CrossRef] [Scilit]

Disclaimer/Publisher’s Note: The statements, opinions and data contained in all publications are solely those of the individual author(s) and contributor(s) and not of MDPI and/or the editor(s). MDPI and/or the editor(s) disclaim responsibility for any injury to people or property resulting from any ideas, methods, instructions or products referred to in the content. |
© 2026 by the authors. Licensee MDPI, Basel, Switzerland. This article is an open access article distributed under the terms and conditions of the Creative Commons Attribution (CC BY) license.