


Abstract
The combination of gemcitabine (GEM) and olaparib (OLA) shows promise for treating pancreatic cancer, particularly in patients with mutations in the BRCA genes. This work presents the validation of a straightforward, fast, and sensitive chromatographic method for the simultaneous analysis of GEM and OLA, supporting the development of advanced pharmaceutical formulations that combine the two drugs. The efficient chromatographic separation of GEM and OLA was achieved using a C18 column (250 × 4.6 mm, 5 μm) with a mobile phase composed of acetonitrile and water (50:50, v/v), which eluted isocratically at a flow rate of 0.8 mL/min. Determinations were performed using a PDA detector at 243 nm for both drugs. The retention times for GEM and OLA were approximately 3.3 and 4.3 min, respectively. The method was linear (R2 > 0.999), with a regression curve in the concentration range of 0.5 to 10.0 μg/mL, demonstrating sensitivity, precision, and accuracy. The recovery rates of the drugs from the pancreatic tissue were higher than 97.0%. The components of a coated liposomal formulation and the pancreatic tissue did not interfere with the analysis, and both drugs demonstrated a low degradation rate under stressful conditions. In conclusion, the validated method was suitable for quantifying GEM and OLA simultaneously, even in a biological matrix, making it feasible to support the development of advanced pharmaceutical formulations that incorporate both drugs, such as liposomes.
1. Introduction
Pancreatic cancer is among the malignancies with the lowest survival rates [1,2]. Gemcitabine hydrochloride (GEM), a deoxycytidine nucleoside analog that inhibits cell cycle progression [3,4], is currently the standard chemotherapeutic agent used in the treatment of this disease [5]. However, its clinical efficacy remains limited, with low response rates. In most cases, GEM serves primarily as a palliative role.
Considering the limited therapeutic efficacy of GEM as a monotherapy, its combination with other agents has emerged as a potentially effective strategy to enhance treatment outcomes [6,7]. Recent studies have identified that subgroups of patients with pancreatic cancer harbor mutations in tumor suppressor genes, such as BRCA1 and BRCA2, which are critical in repairing DNA single-strand breaks through the homologous recombination pathway [8]. The physiological characteristics of this patient subgroup suggest they may benefit from therapeutic agents that target DNA repair pathways [9,10]. Olaparib (OLA), a poly(ADP-ribose) polymerase (PARP) inhibitor, impairs the repair of DNA single-strand breaks by inhibiting PARP activity [11]. This leads to the accumulation of DNA damage and increased genomic instability, particularly in cells already deficient in homologous recombination. As such, OLA represents a promising therapeutic alternative for patients with pancreatic cancer harboring BRCA1 or BRCA2 mutations [8,12].
The combination therapy of GEM and OLA is founded on synthetic lethality, wherein the simultaneous inhibition of DNA synthesis and repair pathways leads to selective cell death in genetically vulnerable tumors [13,14,15,16]. Preclinical studies have demonstrated that this drug combination enhances tumor cytotoxicity, increases apoptosis induction, and reduces cellular proliferation. These findings support the growing interest in this therapeutic strategy as a basis for developing personalized treatment protocols [17,18].
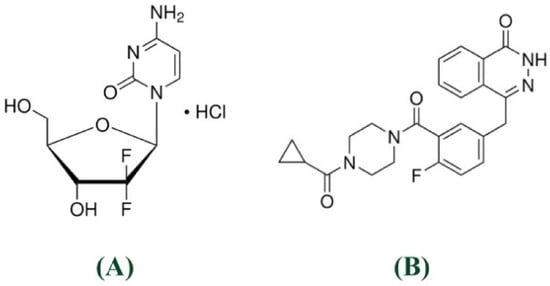
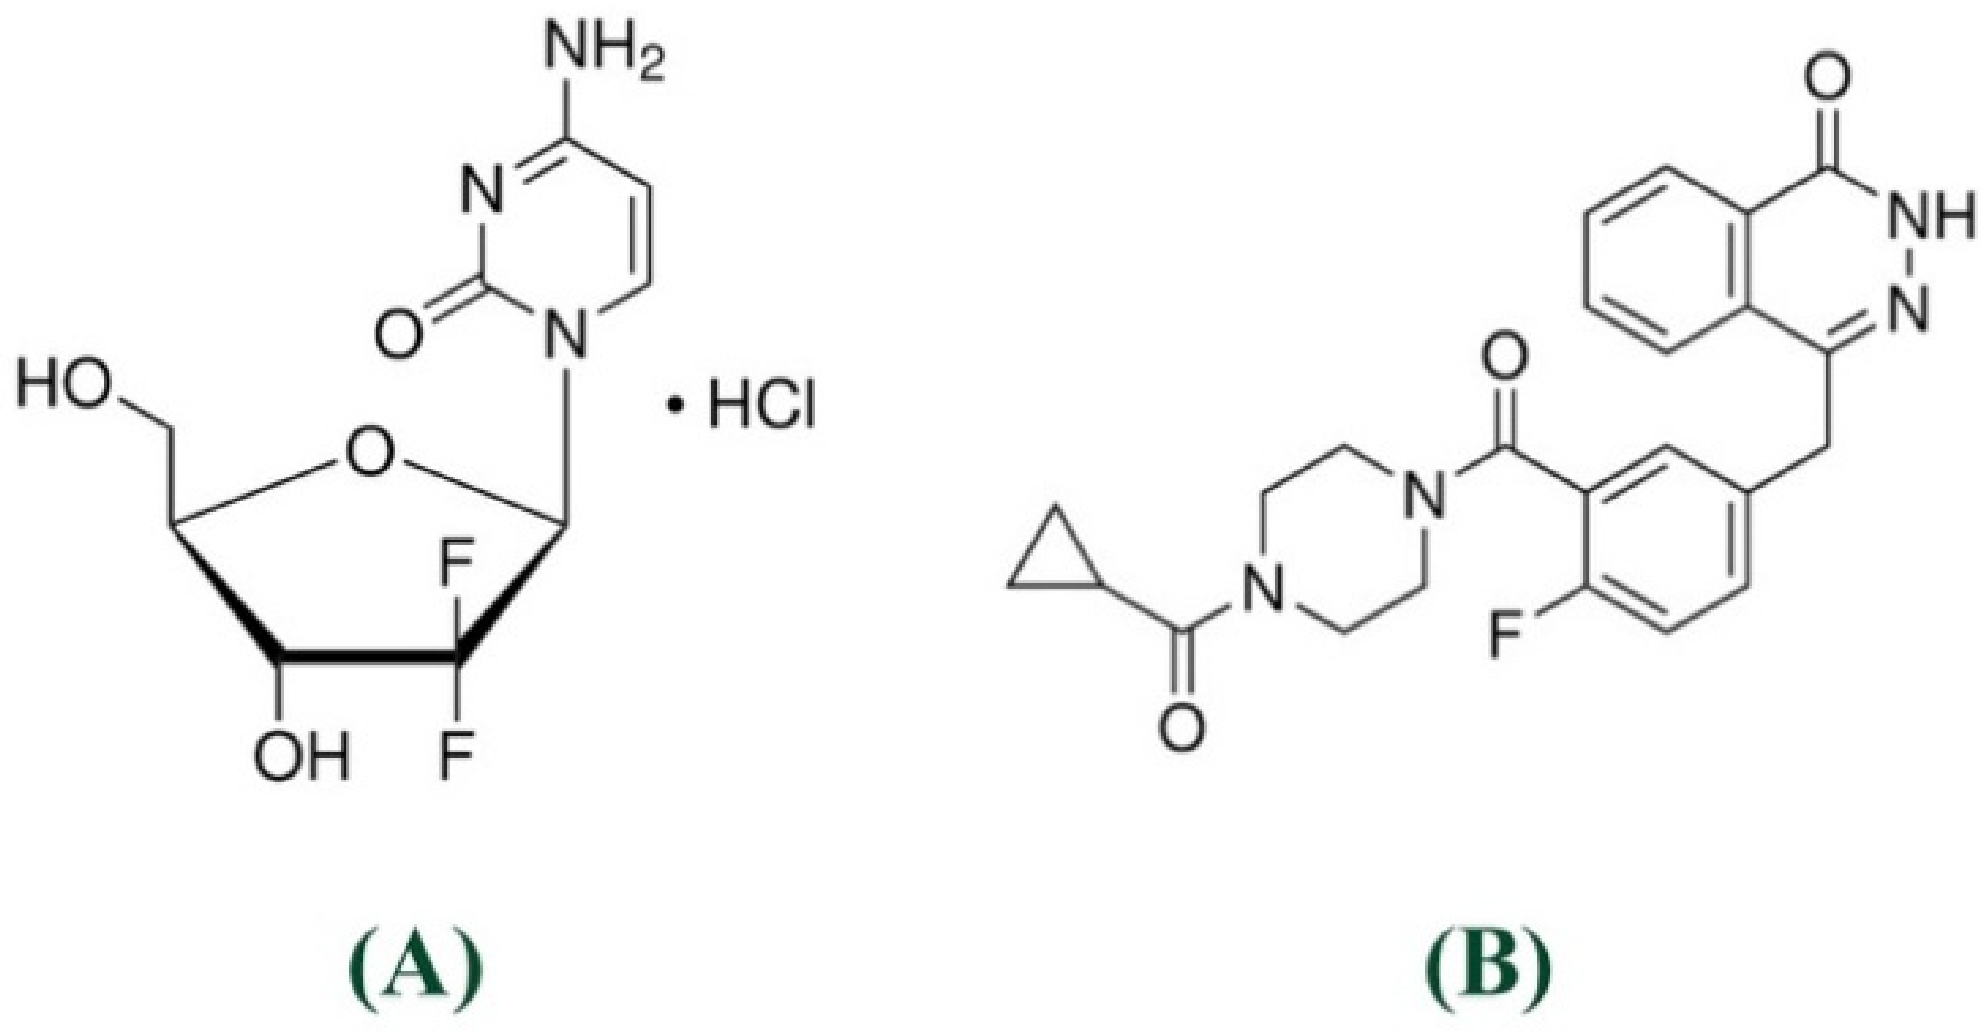
Peptide nanoparticles containing GEM and OLA have been proposed as a potential approach for treating pancreatic cancer [19]. However, the possibility of developing new systems to deliver these molecules remains open, as a targeted, effective, and safe treatment for pancreatic tumors is still far from being implemented. An analytical method capable of simultaneously quantifying both drugs is mandatory to support such a development. Nevertheless, this is not a trivial task due to the distinct molecular characteristics between these drugs, such as their polarity and solubility in water, being GEM a polar [20,21] (molecular weight: 299.7 g/mol, water solubility: 0.824 mg/mL, log P: 0.28, pKa in strongest acidic: 5.38, pKa in strongest basic: 2.34) and OLA a nonpolar (molecular weight: 434.5 g/mol, water solubility: 0.060 mg/mL, log P: 2.72, pKa in strongest acidic: 9.96, pKa in strongest basic: −0.9) molecule [22,23] (Figure 1).
Figure 1.
GEM (A) and OLA (B) molecular structures.
There are some analytical studies for GEM or OLA isolated [24,25,26,27], but none evaluate both simultaneously for cases where the association occurs. Such simultaneous quantification would provide greater speed and reliability to the process, especially in the quality control phase. Furthermore, chemical and biological interferents in the sample from which the drugs will be quantified must be considered, and no previous method has been described for the simultaneous determination of these drugs in the presence of complex interferences, such as pancreatic tissue components or the constituents of chitosan-coated liposomal formulations.
Indeed, the development of analytical methods capable of quantifying therapeutic agents directly in pancreatic tissue enriched with chemotherapy represents a critical advancement for evaluating drug delivery systems targeting pancreatic cancer. Unlike plasma or serum concentrations, which reflect systemic exposure, tissue-specific quantification provides direct evidence of drug accumulation at the target site, enabling accurate assessment of delivery efficiency and therapeutic potential. This approach is particularly valuable for evaluating novel drug delivery systems, such as nanoparticles or liposomes, where the primary objective is to enhance drug concentration specifically within pancreatic tissue while minimizing systemic toxicity. Furthermore, pancreatic tissue quantification enables the determination of drug penetration kinetics, distribution patterns, and retention times within the organ, providing essential pharmacokinetic data that cannot be obtained through conventional plasma analysis.
Therefore, this study aims to propose and validate a high-throughput chromatographic method for the simultaneous quantification of GEM and OLA in complex matrices, thereby supporting the development of advanced formulations for treating pancreatic cancer. By employing an isocratic and buffer-free approach, the study focuses on the simultaneous determination of both drugs in pancreatic extracts and key components of chitosan-coated liposomal nanoparticles. Unlike previously reported methods, which often require laborious extractions or the use of buffers that limit the life of the equipment, our approach seeks to offer an isocratic method that is ‘friendly’ to the laboratory routine (buffer-free and fast-running).
2. Materials and Methods
2.1. Material
GEM and OLA standards (≥98%) were purchased from Sigma-Aldrich (Steinheim, Germany). Acetonitrile and methanol of chromatographic grade were purchased from J. T. Baker (Phillipsburg, NJ, USA). Dibasic sodium phosphate and sodium phosphate monohydrate were supplied by Vetec (Rio de Janeiro, Brazil). Phosphatidylcholine from soybean was purchased from Lipoid (S100 PC ≥ 94.0%, Ludwigshafen, Germany). Chitosan oligosaccharide lactate (molecular weight 4000–6000, >90% deacetylated) was purchased from Sigma-Aldrich (Steinheim, Germany). All analyses were performed with ultrapure water (Millipore, Illkirch-Graffenstaden, Molsheim, France).
2.2. Preparation of Interferents
2.2.1. Pancreas Extract
Initially, the pancreas from a group of culling mice was excised after euthanasia and immediately frozen in phosphate-buffered saline (PBS) at −20 °C. This organ was donated from animals sacrificed for other experiments that do not affect the pancreatic function of the animals (University of Brasília Ethics Committee, protocol number 23106.125197/2021-49). A total of 200 mg of pancreatic tissue was used, with 40 mg portions each submerged in 1 mL of methanol, resulting in a final volume of 5 mL. The samples were stirred at 300 rpm for 24 h at room temperature. The mixture was then homogenized using a Turrax® RW20 (Lab Dancer, Staufen, Germany) at 10,000 rpm for 5 min and subsequently centrifuged at 4000 rpm for 10 min. The resulting supernatant was carefully collected and maintained on ice throughout the experimental procedures. Before the injection, 5 mL aliquots of the supernatant were mixed with 45 mL of acetonitrile: water solution (50:50, v/v) [28].
This procedure mimics the extraction of drugs from the pancreas tissue in future pharmacokinetic studies of formulations containing the drug combinations. Therefore, these extracts will be used to verify the selectivity of the method (Section 2.5.1). Furthermore, the same process will be used to analyze the recovery of the drug from the pancreas tissue, to validate the application of the validated analytical method (Section 2.6).
2.2.2. Coated Liposomes
The coated liposomes were obtained using the thin-film hydration method [29], where 1 mL of a 200 mmol/L phosphatidylcholine solution in chloroform/methanol (75:25) was dried by rotary evaporation (Lab Dancer, Staufen, Germany) at 500 rpm and 500 mmHg for 1 h. After that, the thin film was hydrated with 5 mL of PBS for 1 h at 55 °C. After hydration, the formulation was homogenized for 5 min at 14,500 rpm. Then, a 10-cycle extrusion process was performed through a 600 nm-pore filter, followed by an additional 5 cycles through 200 nm-pore filters and 5 cycles through a 100 nm-pore polycarbonate membrane using compressed nitrogen (Lipex, Northern Lipids Inc., Burnaby, BC, Canada) [30,31].
The liposomes were coated by preparing a 1% chitosan oligosaccharide solution in water and then diluted to 0.1% in PBS. Afterwards, 500 μL of the 0.1% chitosan oligosaccharide solution was slowly added to 2 mL of the liposomal formulation under mechanical agitation at 300 rpm, and the mixture was maintained for 1 h [32].
These liposomes will be used as contaminants in Section 2.5.1 to verify the selectivity of the method when used to quantify the drugs from these delivery systems.
2.3. Stock Solutions and Calibration Standards
Stock solutions of GEM and OLA were individually prepared at 200 μg/mL by dissolving each compound in a 50:50 (v/v) water/acetonitrile mixture. For the preparation of calibration curves, the appropriate volumes of each stock solution were transferred into a 10 mL amber volumetric flask, and the dilutions were obtained using the same solvent system.
2.4. Chromatographic Equipment and Establishment of Chromatographic Conditions
Standard solutions of GEM and OLA were evaluated using the scanning mode (190–400 nm) individually with a UV–Vis spectrophotometer (UV-1800, Shimadzu, Kyoto, Japan) and a quartz cell of 10 mm optical path length. The wavelength of maximum absorption of GEM and OLA was selected to determine which would be the most suitable, based on peaks with good resolution and close intensities, for the analysis of both drugs using a chromatographic method.
The HPLC method was developed and performed on a liquid chromatography system (LC-20AD, Shimadzu, Kyoto, Japan) equipped with a quaternary pump, an automatic sample injector (9SIL-20AD model, Shimadzu, Kyoto, Japan), a column oven (CTO-20AS model, Shimadzu, Kyoto, Japan), a degasser, and a photodiode array detector (PDA) (SPD-M20A model, Shimadzu, Kyoto, Japan). Different mobile phases, using water with methanol or acetonitrile, were tested in various proportions and flow rates to achieve the best peak resolution, considering GEM and OLA, as well as the interferent peaks described in Section 2.2. System suitability tests, such as tailing peak and theoretical plates, were also performed. The reversed-phase C18 column (250 × 4.6 mm, 5 μm) (Discovery®, Supelco, Darmstadt, Germany) was used, the temperature of the oven was maintained at 30 °C, and the injection sample volume was 10 µL. The Shimadzu LC software (Version 1.25 SP4) performed data acquisition, analysis, and reporting.
2.5. Analytical Method Validation
The analytical method was validated according to ICH guideline Q2(R2) [33], regarding selectivity, linearity, limit of detection (LOD), limit of quantitation (LOQ), precision, accuracy, and robustness.
2.5.1. Specificity and Selectivity
The specificity of the method was demonstrated by its ability to unequivocally assess GEM and OLA in the presence of potential interferences, such as formulation components and biological matrices. In accordance with ICH Q2(R2) guidelines, selectivity was comprehensively evaluated by analyzing the analytes in the presence of chitosan-coated liposome constituents (Section 2.2.2), PBS, and pancreatic tissue homogenate extracts (Section 2.2.1). Samples containing 5.0 µg/mL of each drug were analyzed (n = 6) in both the absence and presence of these matrices. Selectivity was confirmed by comparing peak areas and retention times, which showed no significant signal overlaps or co-elutions at the retention windows of the analytes. The results were statistically validated by analysis of variance (one-way ANOVA) at a significance level of 0.05, showing no significant matrix effects. Furthermore, peak purity was verified using a photodiode array (PDA) detector (SPD-M20A model, Shimadzu, Kyoto, Japan) and Shimadzu software; the Purity Index exceeded the predefined threshold of 0.999 for all analyzed peaks, ensuring they were spectrally pure and free from co-eluting impurities. These results confirm that the method is both selective and specific for the simultaneous quantification of GEM and OLA in complex matrices.
2.5.2. System Suitability
The parameters of system suitability, such as retention time, theoretical plates, symmetry factor, and resolution, were evaluated employing the repeatability of six replicates of GEM and OLA at a concentration of 5.0 μg/mL [33,34].
2.5.3. Linearity
The linearity of the analytical method was assessed using three analytical curves prepared from three independent stock solutions of each analyte. Aliquots from these solutions were diluted in a 50:50 (v/v) mixture of ultrapure water and HPLC-grade acetonitrile to generate calibration curves in the range of 0.5 to 10.0 µg/mL for both GEM and OLA. For each drug, concentration values were plotted against the corresponding instrumental response (peak area), linearity was evaluated using the least-squares linear regression method, and the analysis of the residues was carried out observing the homogeneous distribution of the analyzed values [24,25,26,27,33].
2.5.4. Limit of Detection and Limit of Quantitation
The Limit of detection (LOD) and Limit of quantification (LOQ) represent the lowest concentrations at which the analytes can be reliably detected and quantified, respectively. These values were determined based on the calibration curves of both drugs and were calculated using Equations (1) and (2) [24,25,26,27,33], as follows:
where σ is the standard deviation of the response and S is the slope of the calibration curve.
LOD = (3.3 × σ)/S,
LOQ = (10 × σ)/S,
2.5.5. Precision
Precision was assessed in terms of repeatability and intermediate precision. Repeatability was evaluated by analyzing three concentrations of GEM and OLA simultaneously, at three levels of concentration, a low, medium and high point used in the linearity curve (1.0, 5.0, and 10.0 µg/mL), each in triplicate (n = 3). Intermediate precision was determined by analyzing the same concentrations on two different days, with sample preparation performed by two different analysts. The results were expressed as the coefficient of variation (CV), calculated according to Equation (3):
CV (%) = (standard deviation)/mean × 100,
2.5.6. Accuracy
The accuracy of the method was evaluated based on the percentage of the measured concentration relative to the theoretical concentration of each drug. This was assessed using the same concentrations as those applied in the precision study (1.0, 5.0, and 10.0 µg/mL). Accuracy was calculated as the ratio between the experimentally determined concentration and experimental concentration, expressed as a percentage, according to Equation (4):
Accuracy (%) = (experimental concentration)/(theoretical concentration) × 100,
2.5.7. Robustness
Robustness was assessed by the One-Factor-at-a-Time (OFAT) method, deliberately varying three critical chromatographic parameters: mobile phase composition (±5.0%), oven temperature (±5.0 °C), and mobile phase flow rate (±0.1 mL/min). All experiments were performed in triplicate using samples containing 5.0 µg/mL of GEM and OLA. System suitability parameters, including symmetry factors, theoretical plates, and retention time, were evaluated for each drug. The robustness of the method was statistically validated by analysis of variance (ANOVA) at a significance level of 0.05.
2.5.8. Analytical Stability
The stability of the solution containing both drugs at 5.0 µg/mL was assessed to ensure the storage time and whether changes in the concentrations of GEM and OLA occur. The study was conducted over 30 days, with intervals of 0, 7, 15, 21, and 30 days, with the solutions stored in airtight amber jars under three temperature conditions: 4 °C, room temperature, and 40 °C.
To ensure the stability of the drugs in the analytical method, stress studies were conducted to induce forced degradation of GEM and OLA. The degradation was conducted with the drugs at the concentrations of the stock solution at 200 µg/mL, for acid and alkaline stresses, HCl or NaOH at the final concentration of 0.1 N, oxidative stress with 3% H2O2, enzymatic degradation with trypsin 3.0 μg/mL [24], photodegradation under ultraviolet light at 1.2 million lux/h performed in a photostability chamber (Marconi MA839/71, Piracicaba, São Paulo, Brazil) and thermal degradation at 80 °C. All experiments were conducted for 1 h using three replicates (n = 3) [24,25].
2.6. Application of the Method in Experiments Involving Extraction from the Pancreas
The recovery rate was calculated based on the amounts of GEM and OLA recovered after spiking known quantities of the drugs into mouse pancreatic tissue. The procedure involved adding 1.0 mL of a 250.0 µg/mL solution of GEM and OLA, prepared in ultrapure water and acetonitrile (50:50, v/v), to the tissue samples. After solvent evaporation, the pancreatic tissue was cut into small pieces and resuspended in 50.0 mL of the same ultrapure water/acetonitrile mixture (50:50, v/v) to reach the final concentration of 5.0 μg/mL of GEM and OLA. The samples were then subjected to rotation in a multi-rotator (Multi Bio RS-24, BioSan, Riga, Latvia) at 30 rpm overnight at room temperature, followed by filtration and analysis using the previously described HPLC-DAD method. Recovery was calculated using the same equation employed for accuracy determination, and the experiment was performed in six replicates (n = 6).
2.7. Analytical Target Profile (ATP) and Acceptance Criteria
To ensure the method’s fitness for its intended purpose, an Analytical Target Profile (ATP) was defined, focusing on the simultaneous quantification of GEM and OLA in liposomal formulations and pancreatic tissue within a linear range of 0.5–10 µg/mL. Based on this profile and following ICH guideline Q2(R2) [33] and USP <621> guidelines [34], predefined acceptance criteria were established. The target method aims to be isocratic, buffer-free, and feature a total run time of less than 8 min. For linearity, a coefficient of determination R2 ≥ 0.999 was required. Precision and accuracy were considered acceptable if the CV% and relative error were <5%, and recovery values remained between 95 and 105%. Regarding sensitivity, the LOD and LOQ were required to be lower than 0.5 µg/mL, defined by the lowest point of the validated range. System suitability requirements included a tailing factor between 0.8 and 1.5, a resolution above 1.5, a capacity factor (k′) above 2.0, and theoretical plates above 2000. Robustness was assessed by the One-Factor-at-a-Time (OFAT) method; the method was considered robust if deliberate variations (mobile phase ± 5%, temperature ± 5 °C, and flow rate ± 0.1 mL/min) did not compromise these suitability parameters or the simultaneous identification of the analytes. Finally, stability was predetermined as acceptable if the concentration of the analytes remained within 85% to 115% of the initial value under all tested storage conditions and Peak purity was required to show no evidence of co-elution, with a purity index exceeding the threshold limit (typically > 0.999) across the analyzed peaks.
3. Results and Discussion
3.1. Establishment of Chromatographic Conditions
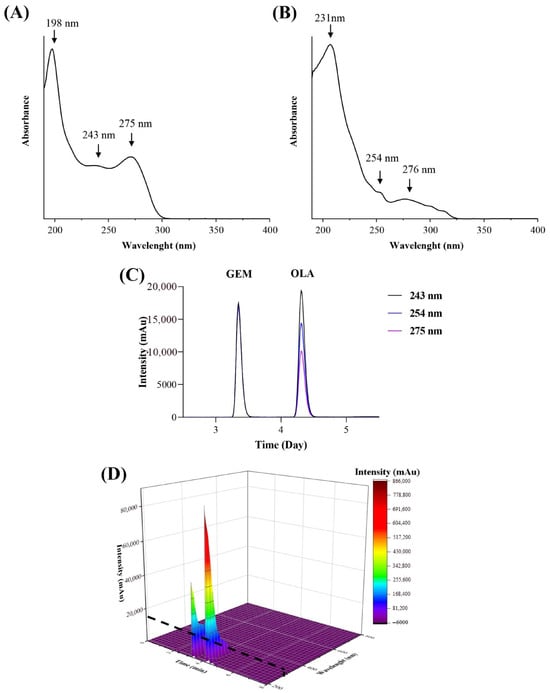
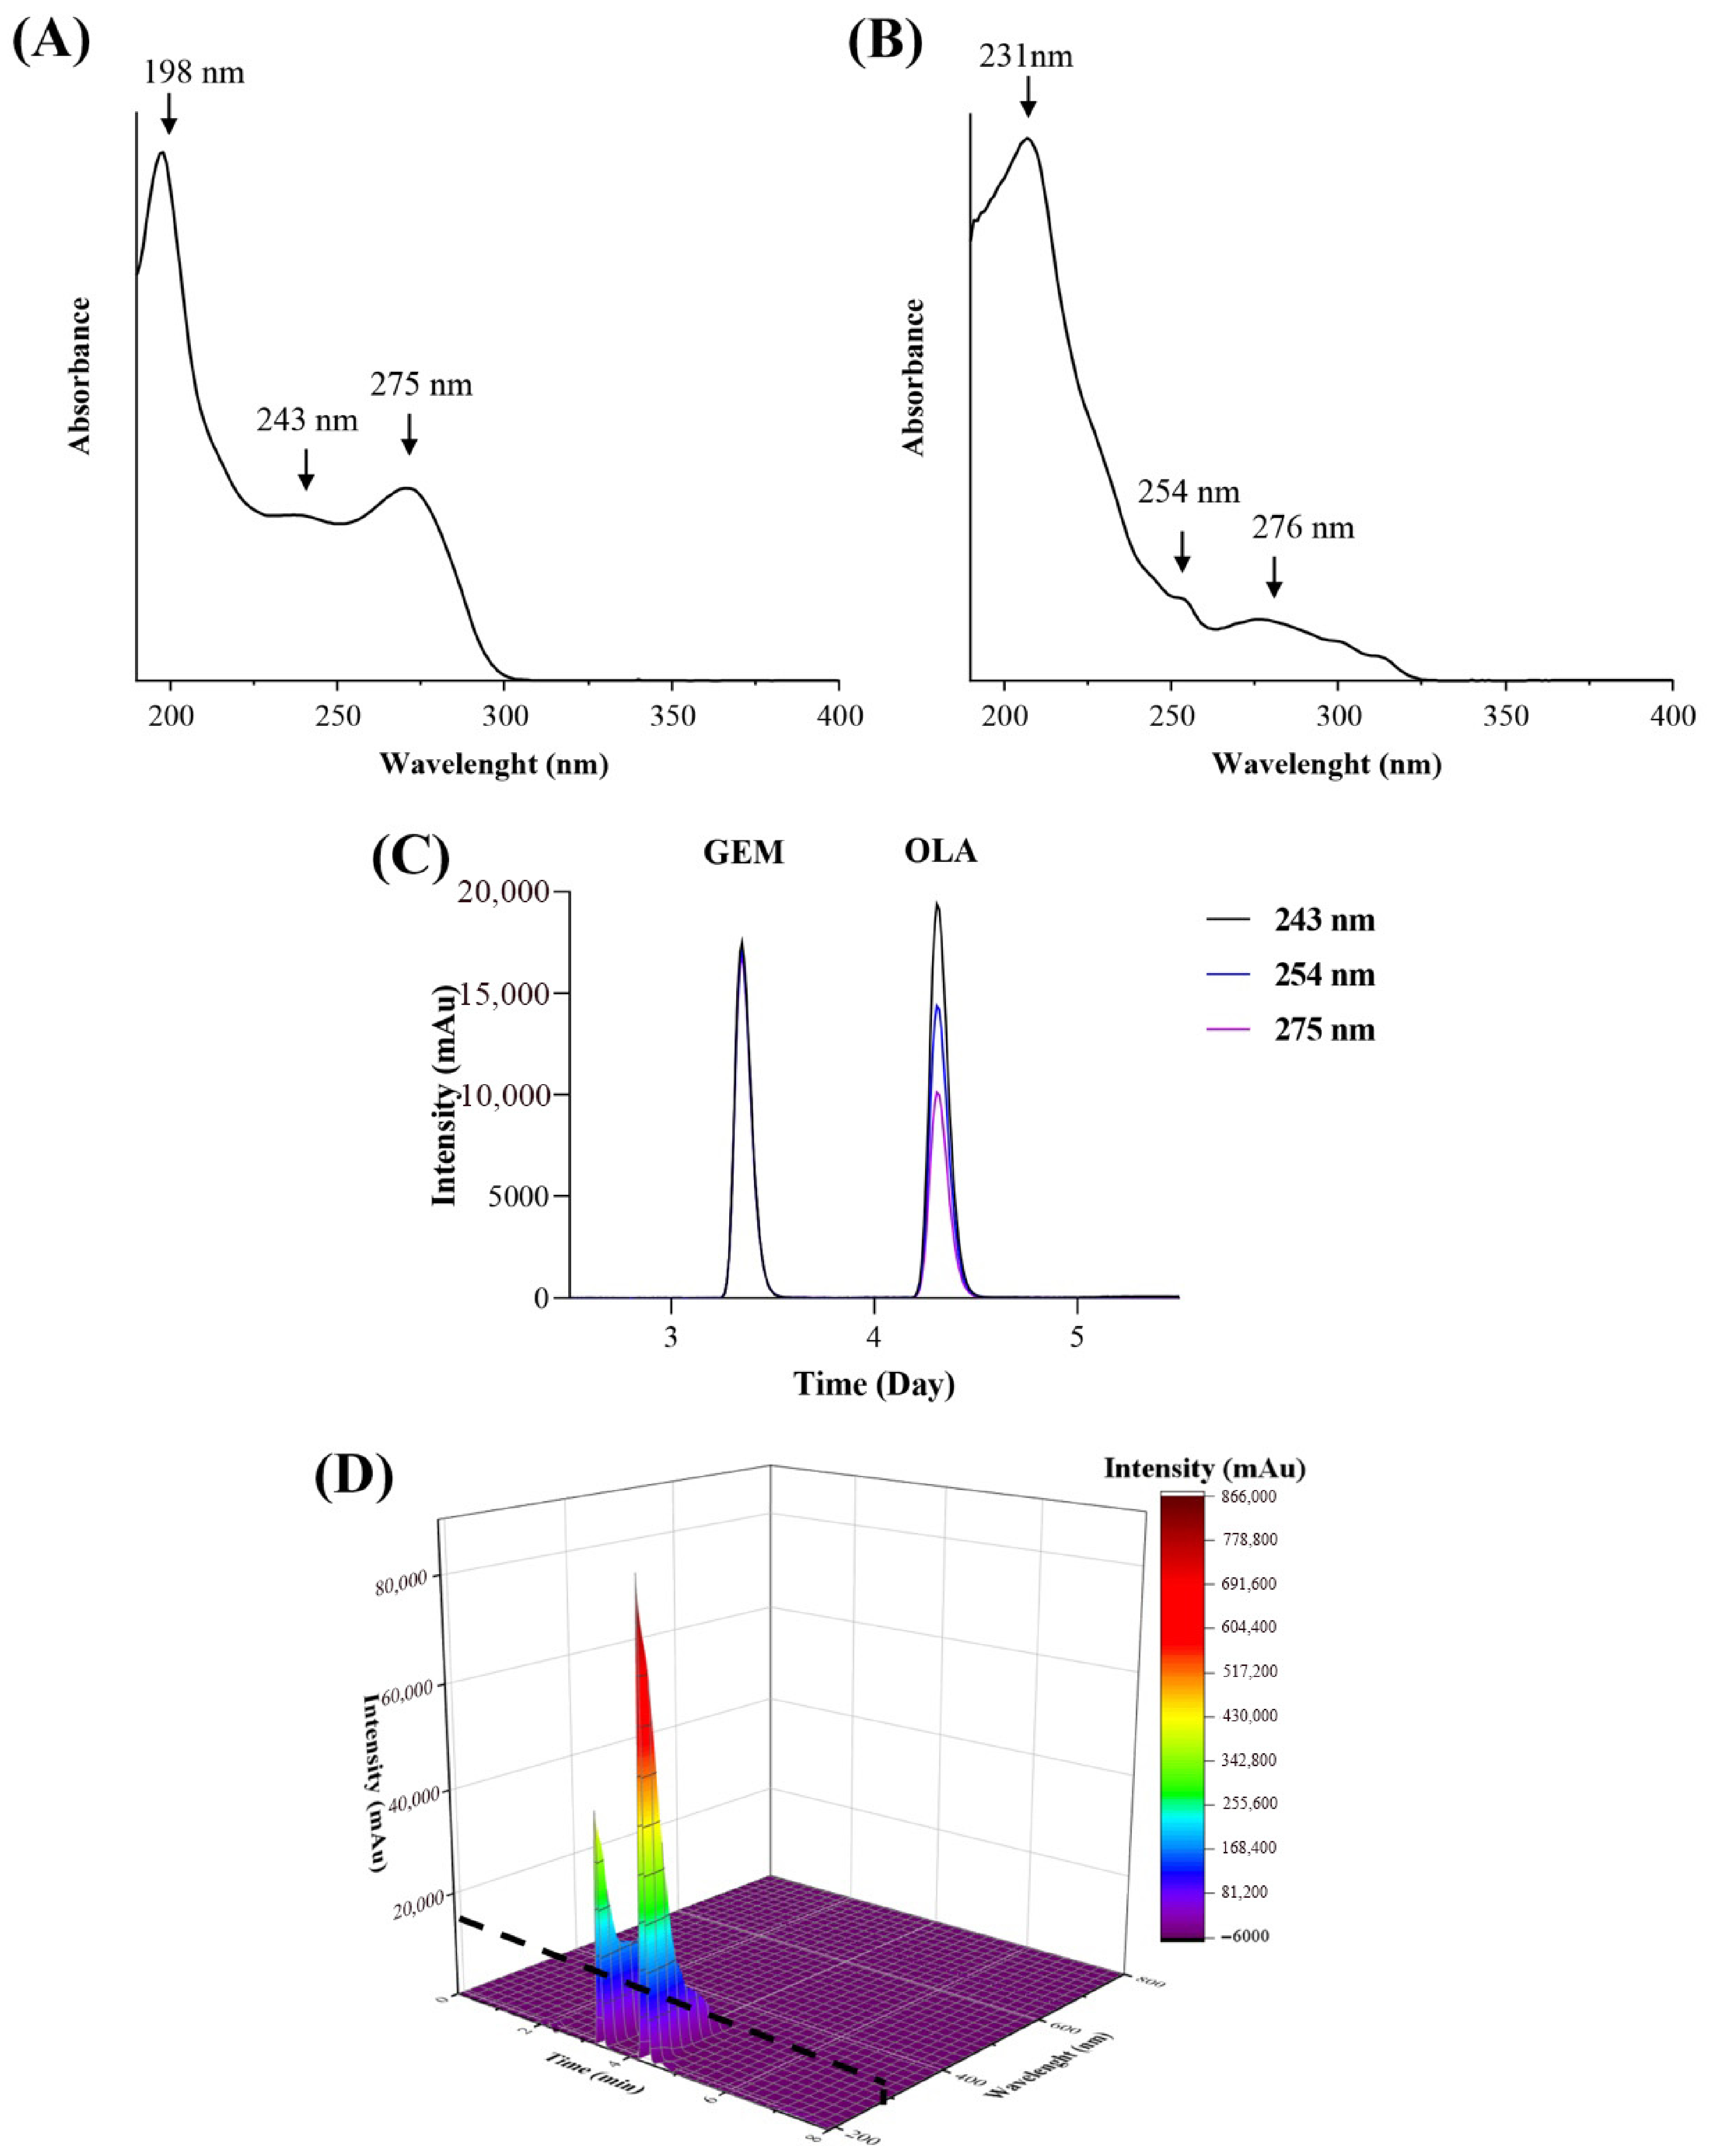
GEM showed maximum absorption at 198, 243, and 275 nm (Figure 2A), while OLA exhibited maximum absorption at 207, 254, and 276 nm (Figure 2B). To identify a single wavelength suitable for simultaneous quantification, several wavelengths within the drugs absorption maxima, 254, 275, 243, and 231 nm, were tested in HPLC-DAD analyses (Figure 2C). All tested wavelengths yielded well-resolved peaks with comparable intensity.
Figure 2.
UV spectrum for GEM (A) and OLA (B) obtained by scanning mode from 190 to 400 nm. Overlapping the HPLC peaks at the selected wavelengths (C). 3D graph correlating the intensity of the GEM and OLA peaks simultaneously with the maximum absorbance of each, with the retention time (D). The dashed lines represent the 243 nm wavelength cutoff.
Notably, GEM exhibited similar detector responses across the entire wavelength range tested. Therefore, the wavelength at which both drugs produced the higher peak intensities with minimal interference was prioritized (243 nm). It provided well-resolved peaks of similar intensity for both drugs (Figure 2D) while minimizing absorbance from interfering substances.
For the development of the analytical method, tests were carried out using a standard solution containing both drugs diluted in acetonitrile/water (50:50, v/v) at 5.0 μg/mL, as well as the different analytical interferences from pancreas tissue and coated liposomes, injected separately. The data presented in Table 1 summarize the analytical conditions tested and the achieved results in terms of peak shape and separation.
Table 1.
Screening of chromatographic conditions (Critical Method Parameters) and their impact on system suitability parameters to satisfy the predefined ATP.
Initially, methanol was the solvent of choice because both compounds exhibited adequate solubility under the tested conditions. However, the solvent presented a separate peak at the same GEM retention time, even with changes in the mobile phase proportions, making it impossible to achieve a total separation between them. Another alternative was to change the pH of the water in the mobile phase to 3; however, the peak GEM presented distortions, which would make its quantification unfeasible. The addition of acetonitrile and changes in the flow were tested to try to separate the peaks present in the solvent and avoid distortion of the GEM peak. The replacement of methanol with acetonitrile and the non-alteration of the water’s pH presented more viable perspectives in terms of peak form and quantification, including the separation of peaks present in the solvents, as shown in trial 13. After that, the increase in the amount of water in the mobile phase composition and the decrease in flow presented ideal conditions for the simultaneous identification and quantification of GEM and OLA.
Therefore, the ideal condition for determining the analytical method consisted of eluting both peaks with good resolution, where there would be no distortions or overlaps with other peaks that could impair the identification and quantification of GEM and OLA.
Both compounds showed good resolution of the peaks and no overlap with the peaks of the contamination, as shown in trial 15, which is the method selected.
3.2. Specificity and Selectivity
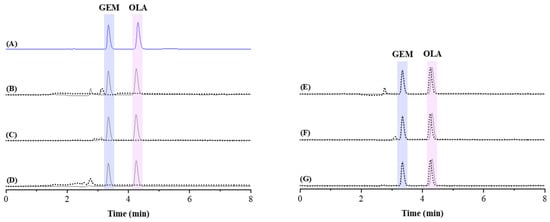
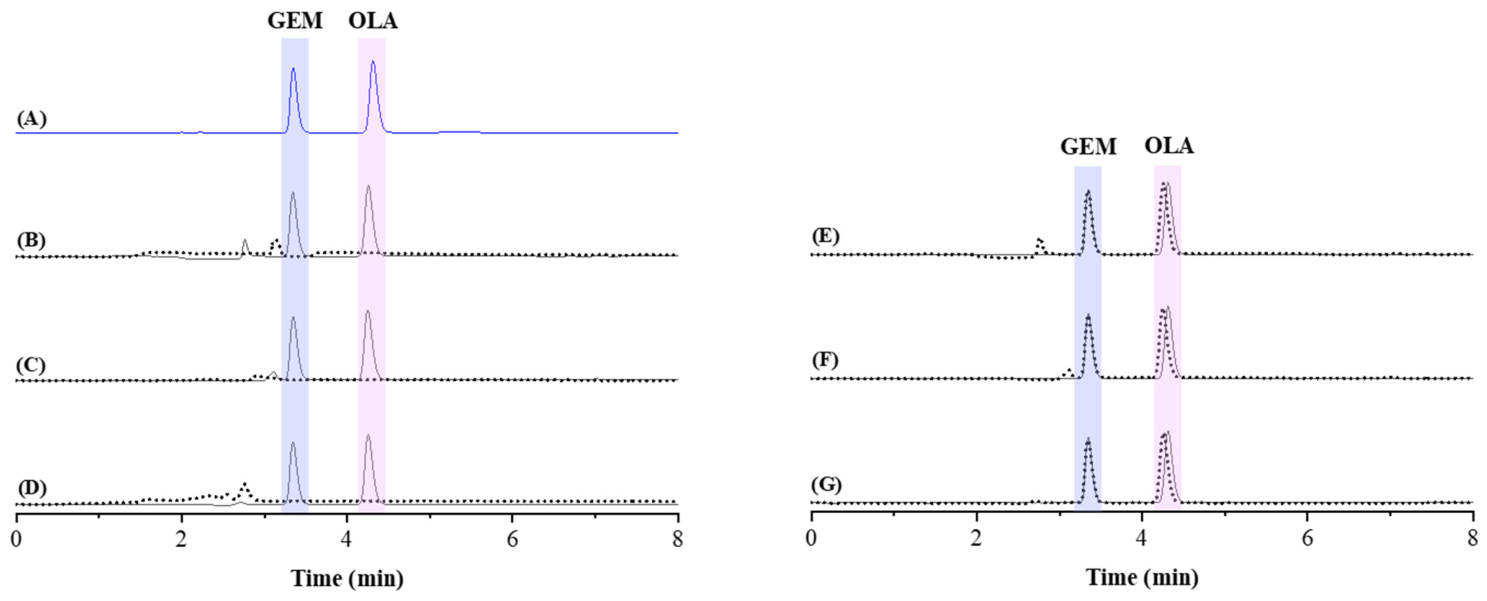
The specificity and selectivity of the method were demonstrated by its ability to unequivocally assess GEM and OLA in the presence of potential interferences, such as formulation components and biological matrices. Chromatograms presented in Figure 3 demonstrated the adequacy of the method, as no significant differences in chromatographic performance were observed. Specifically, no interfering peaks from the matrices or contaminants were detected at the retention times of the analytes, ensuring the absence of co-elution.
Figure 3.
Representative chromatograms of GEM and OLA without the presence of contaminants (control) (A), overlap of GEM and OLA peaks in the presence of contaminants (solid lines) compared to the respective blanks (dashed lines), PBS 0.1 mol/L pH 7.4 (B); components of the coated liposome (C) and biological matrix of the pancreatic homogenate (D). Representative chromatograms of GEM and OLA without the presence of contaminants (control in solid lines) overlap on the peaks of GEM and OLA in the presence of contaminants (dashed lines); PBS 0.1 mol/L pH 7.4 (E); components of the coated liposome (F) and biological matrix of the pancreatic homogenate (G).
Furthermore, in accordance with ICH Q2(R2) requirements for chromatographic methods, peak purity was evaluated to ensure that the identified signals were spectrally pure [33]. The analysis revealed no co-eluting peaks from the diluents at the exact retention times of each drug. The Purity Indices for GEM and OLA were 0.999 and 1.000, respectively, confirming that the analytical method is highly specific and selective for the simultaneous detection, identification, and quantification of both drugs at 243 nm.
Peak purity analysis confirmed the method’s specificity in the presence of various matrix components. For samples containing chitosan-coated liposome excipients, the peak purity indices were 1.000 for GEM and 0.999 for OLA. In the presence of pancreatic tissue matrix interferents, the indices were 0.999 for GEM and 1.000 for OLA. Additionally, in the presence of PBS, both GEM and OLA maintained a peak purity index of 0.999.
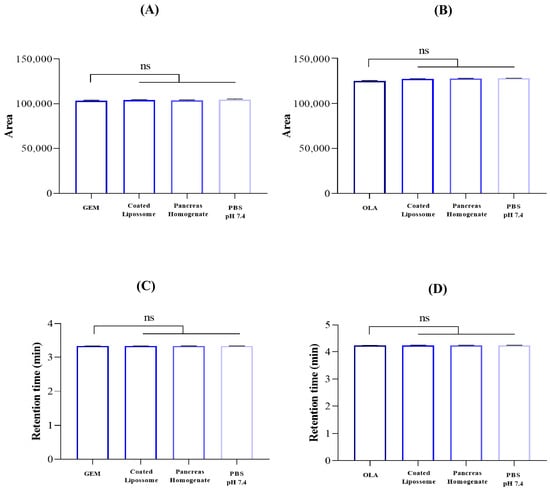
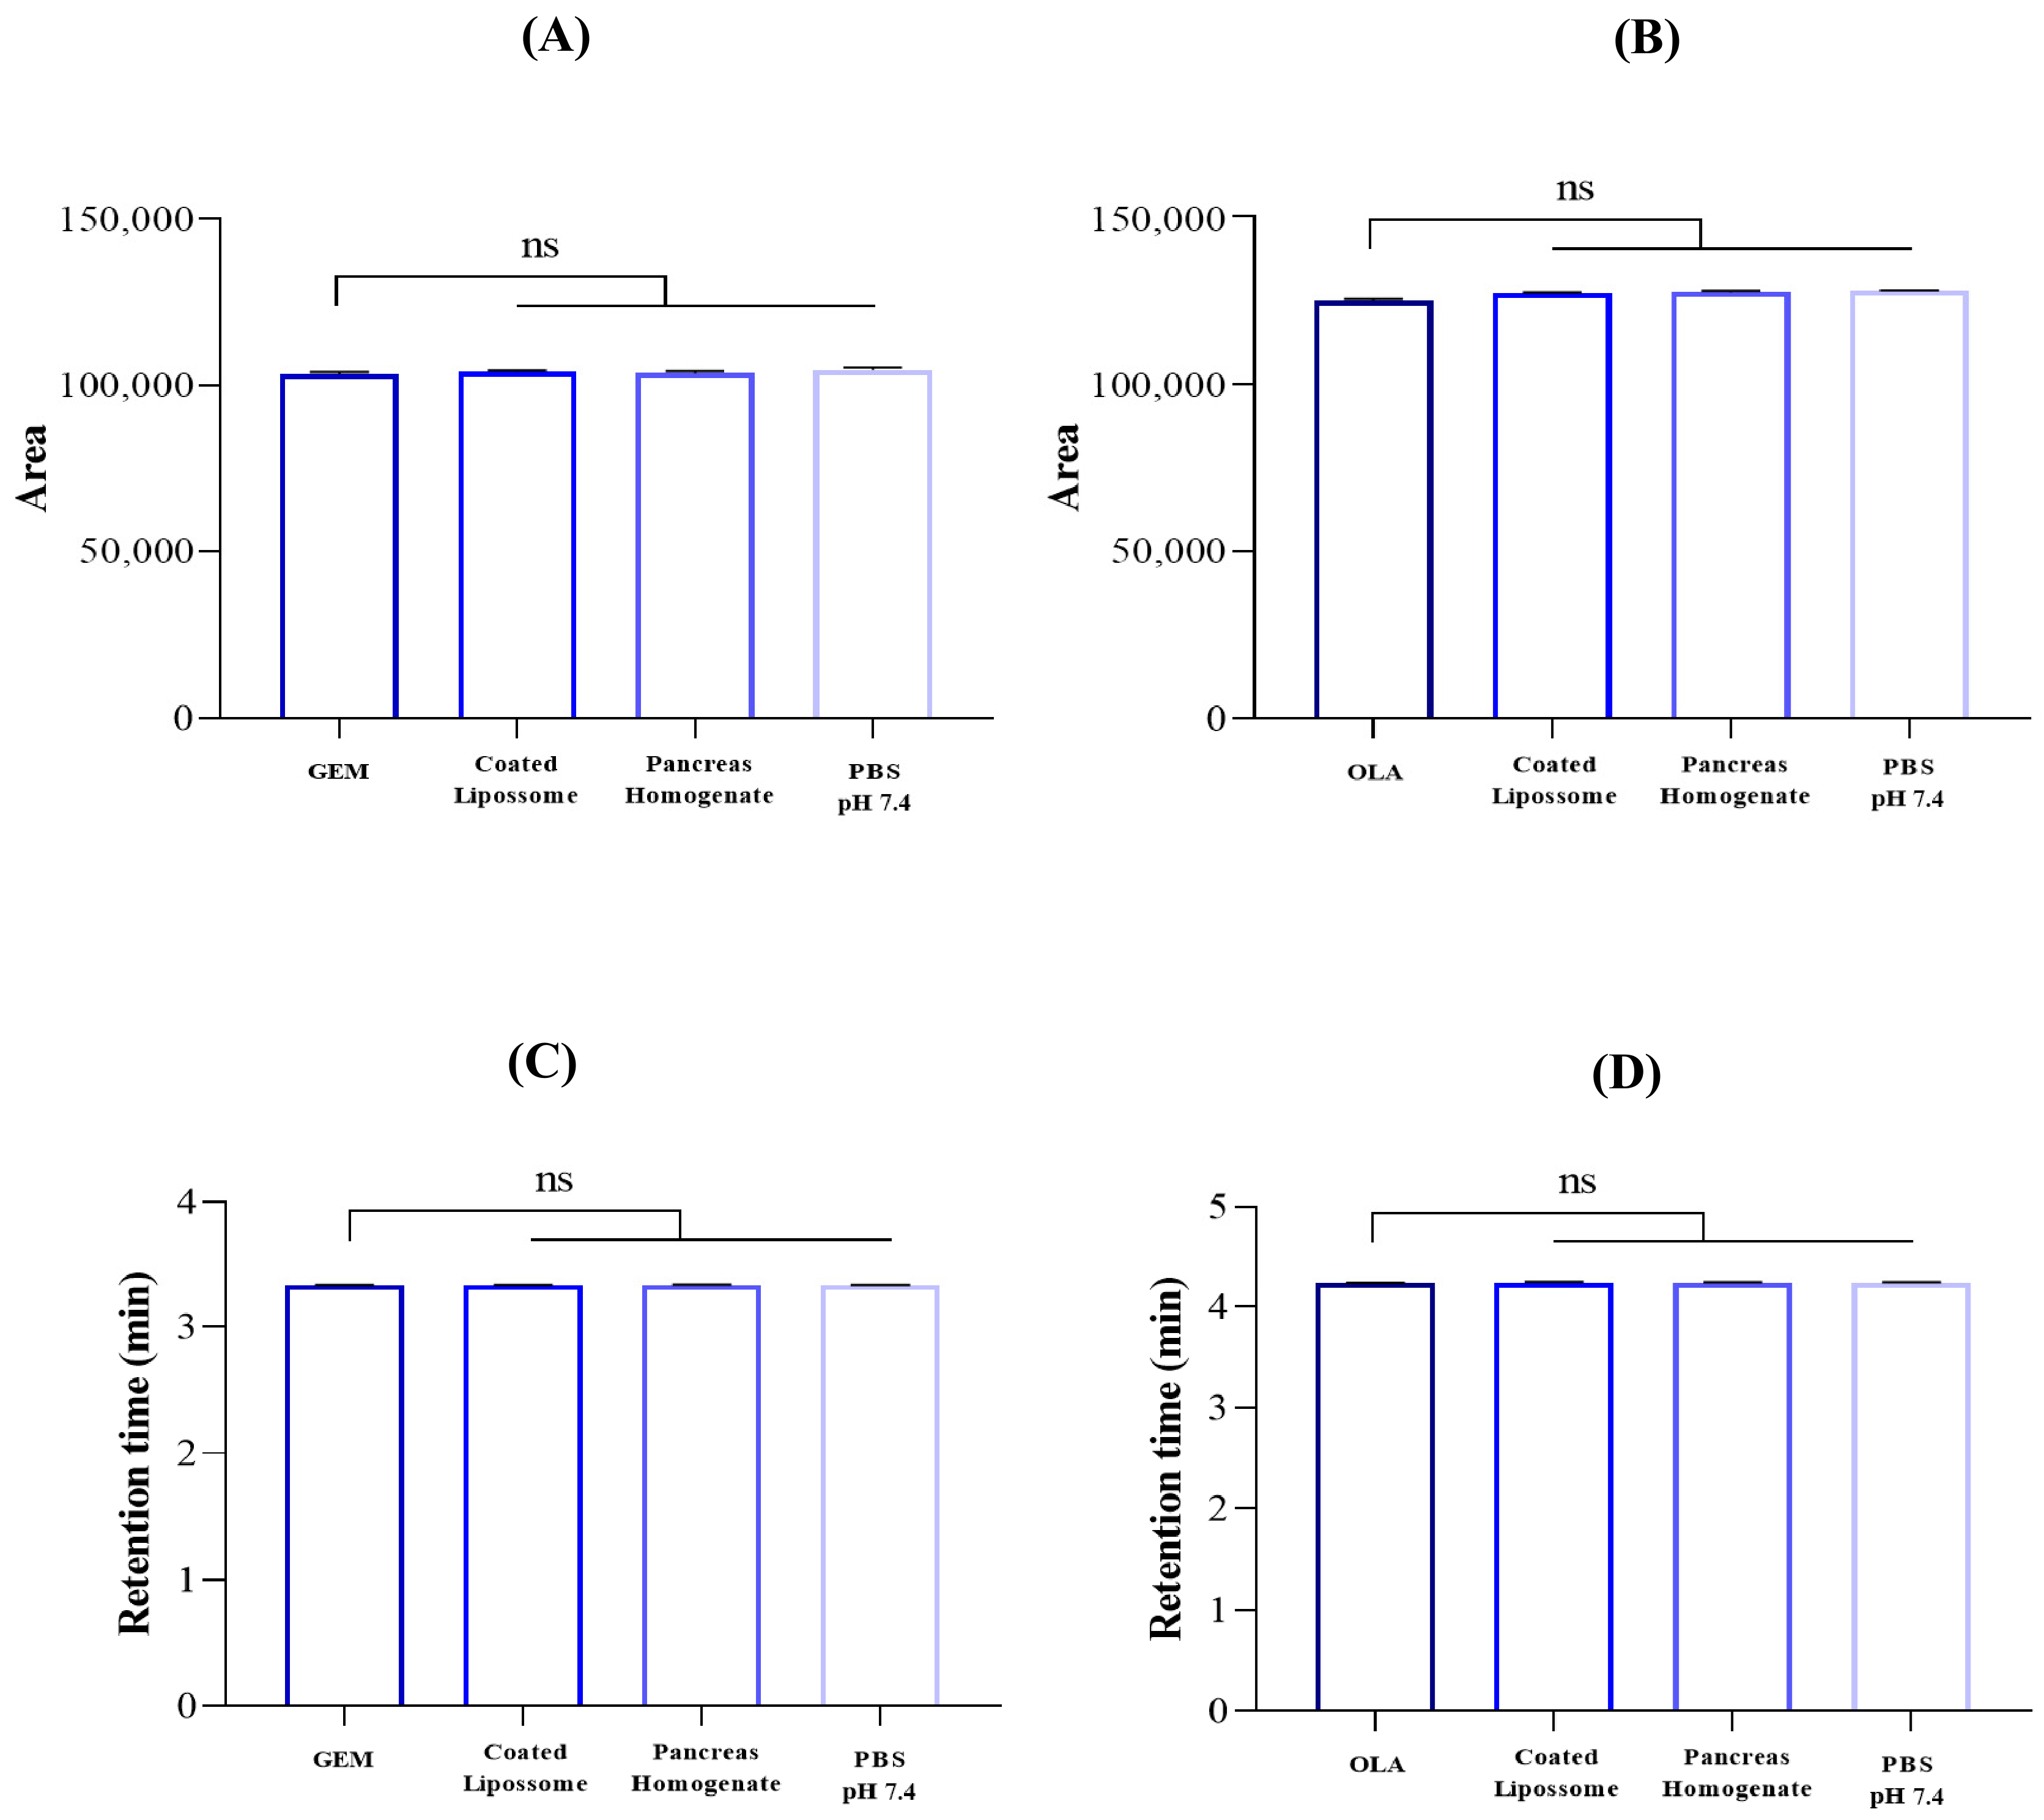
Quantitatively, there were no significant differences in the areas of the peaks and retention times of both drugs in the presence of contaminants in Figure 4. For GEM, the presence of the components of the coated liposomal formulation represents only 1% of the increase in the area, and, for OLA all areas had a slight increase of 2% in the areas in the presence of contaminants (p < 0.05, ANOVA), which ensures the selectivity of the method.
Figure 4.
Quantitative selectivity results. Selectivity was analyzed in terms of variation in GEM (A) and OLA (B) peak areas and retention times ((C,D) respectively, for each drug) in the presence or absence of each interferent; ns: not statistically significant according to one-way ANOVA.
3.3. System Suitability
System suitability was evaluated using six replicates of the GEM and OLA standard solutions, considering parameters related to the suitability criteria. All system suitability values are within acceptable limits, with the number of theoretical plates above of 2000 (5808 ± 76 for GEM and 7966 ± 56 for OLA), the symmetry of the peak is established by the tailing factor, presenting values between 0.8 and 1.5 (1.44 ± 0.01 for GEM and 1.36 ± 0.01 for OLA), capacity factor (k′) above 2.0 (for 2.0 ± 0.0 GEM and 2.6 ± 0.2 for OLA), and resolution between GEM and OLA peaks presenting values above 1.5 (5.22 ± 0.01 GEM:OLA). The CV values were lower than 2.0%, indicating that the system is suitable for further analysis according to the USP <621> [34].
3.4. Linearity
The linear regressions of the calibration curves for GEM and OLA were independently established by plotting the peak areas against the corresponding concentrations in the range of 0.5 to 10.0 µg/mL. A strong proportional relationship was observed between concentration and detector response for both analytes. The linear regression equations obtained were y = 20,703x − 897.76 for GEM (R2 = 0.9991) and y = 25,209x − 710.11 for OLA (R2 = 0.9993). The high slope values (20,703 for GEM and 25,209 for OLA) indicate the method’s good sensitivity. Furthermore, the correlation coefficients (R2) exceeding 0.999 for both drugs meet the linearity criteria established by regulatory agencies [33].
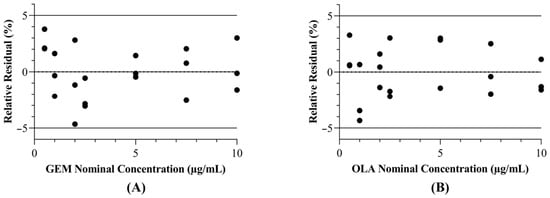
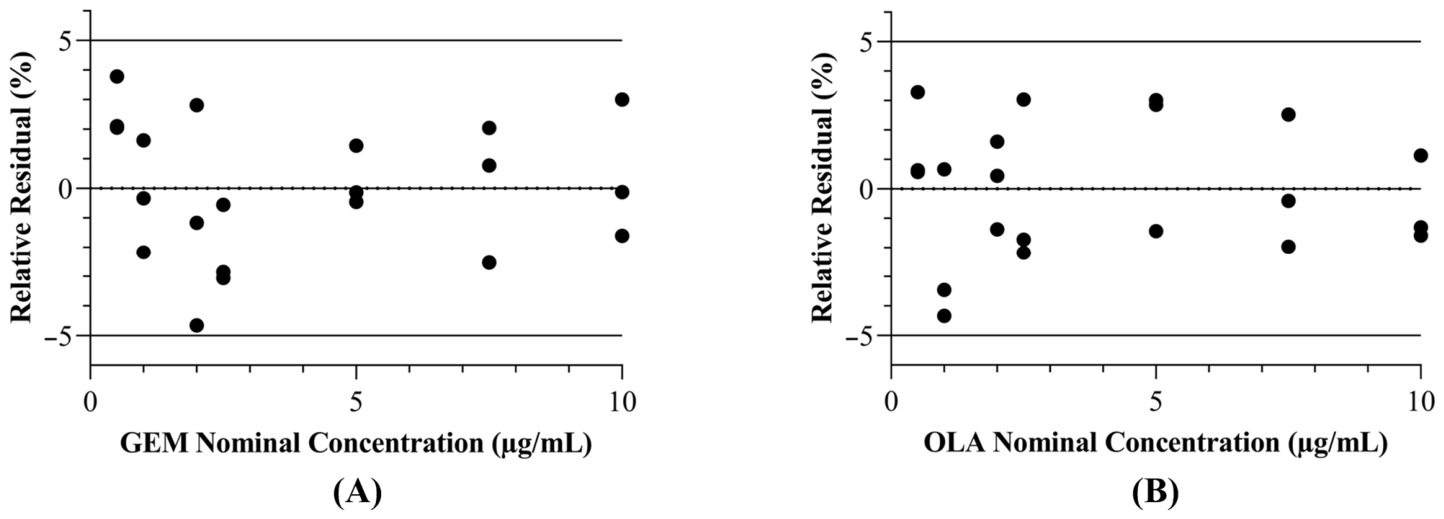
Furthermore, analysis of the residuals, represented by the relative residuals of GEM and OLA, showed a good random distribution with no trend, indicating the linearity of the method, as shown in Figure 5. Specifically, the residual analysis for both analytes demonstrated that the relative errors were distributed randomly around the zero line, with all values falling within the ±5% acceptance limit. This confirms that the analytical response is homoscedastic and that the linear model provides an accurate estimation of the analyte concentration throughout the evaluated range (0.5–10 µg/mL) [34,35,36].
Figure 5.
Residual plots of the relative errors (%) for GEM (A) and OLA (B) with dashed lines indicating the ±5% acceptance limits.
3.5. LOD and LOQ
The LODs for GEM and OLA were 0.05 and 0.01 µg/mL, respectively, and the LOQs for both drugs were 0.16 and 0.04 µg/mL. These limits were lower than the value of the lowest point on the analytical curve (0.5 µg/mL). Therefore, these values are considerable, as they demonstrate that the developed analytical method possesses the desired sensitivity to detect and quantify GEM [24] and OLA [27] simultaneously, thereby reflecting its ability to detect and quantify both drugs even at low concentrations. However, international guidelines, such as ICH guideline Q2(R2) [33], do not stipulate universal acceptance values for LOD and LOQ.
3.6. Precision
Precision was evaluated at two different levels: repeatability and intermediate precision. These results were presented together with the coefficients of variation in Table 2. All coefficients of variation examined at different concentrations were below 5%. This indicates that the analytical method can maintain a consistent response within the concentration range used for both drugs, which meets the criteria defined by international validation agencies for method precision [24,25,26,27,33].
Table 2.
Precision of the method for the simultaneous determination of GEM and OLA.
3.7. Accuracy
The accuracy of the analytical method was evaluated by measuring GEM and OLA from a precision test. The accuracy values for GEM and OLA ranged from 97.50% to 101.82% and 96.89% to 103.15%, respectively, considering all analyses with different days and analysts [24,25,26,27,34], as shown in Table 3. These values fall within the limits established by international legislation [33], recovery tests for GEM and OLA, with a predefined acceptance criterion of 95.0% to 105.0%, allowing the method to be considered accurate.
Table 3.
Results of accuracy tests for the simultaneous determination of GEM and OLA.
3.8. Robustness
The robustness of the analytical method was evaluated based on the responses obtained from the purposeful alteration of parameters used during analytical validation, which included oven temperature, the proportion of the mobile phase, and the flow rate of the mobile phase (Table 4). Variations in the composition of the mobile phase affected the retention time of OLA, as the increase in acetonitrile content decreased its retention time, consistent with its nonpolar nature [22]. However, the increase in water content did not cause a significant change in the retention time of GEM, despite its more polar nature [20]. Changes in flow rate also affected the retention time of both drugs, where a higher flow value decreases the retention time of both compounds. All changes caused by variations in the composition of the mobile phase and the flow rate were expected; however, none of the tested conditions resulted in significant changes to the adequacy parameters, such as the Tailing Factor, Theoretical Plates and Capacity Factor (k′), which remained within acceptable limits [34,37,38]. Thus, the analytical method proved to be robust, as the purposeful changes applied did not cause significant changes in the parameters of system adequacy or the simultaneous identification and quantification of GEM and OLA.
Table 4.
Effects of the analytical parameters on retention time, tailing factor, and theoretical plates of the developed method for the simultaneous quantification of GEM and OLA.
3.9. Analytical Stability
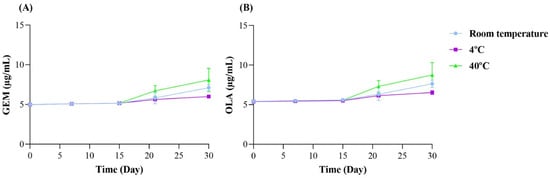
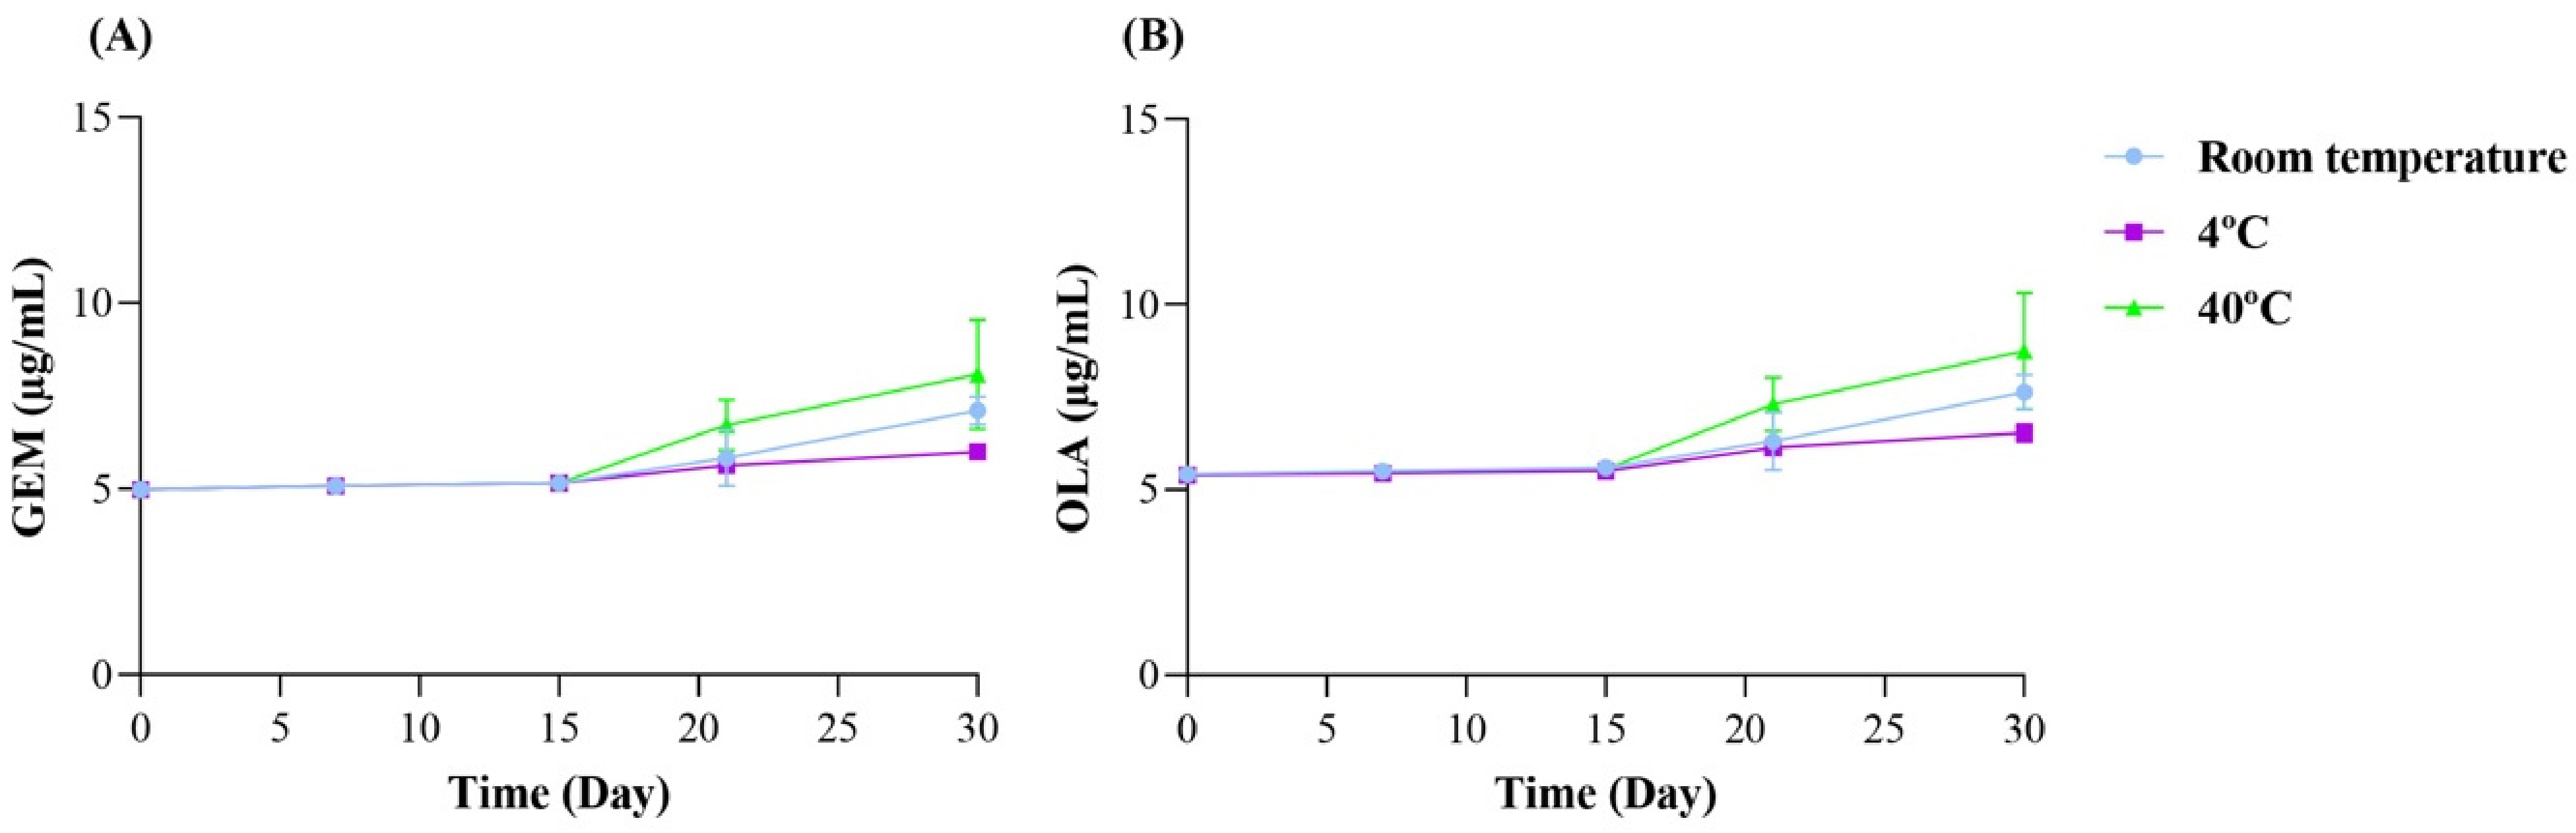
The solutions stored at 4 °C and at room temperature remained stable until day 21, exhibiting only a slight increase in concentration for both drugs, with no significant formation of degradation products, as the chromatographic profiles remained consistent without the appearance of new peaks. According to the predefined acceptance criteria, stability was confirmed as the measured concentrations remained within the 85% to 115% range of the initial value. The solutions stored at 40 °C remained stable until day 15, after which there was a significant increase in drug concentrations for GEM (A) and OLA (B); this observed increase in concentration is likely attributed to solvent micro-evaporation of the organic component in the diluent. The standard solutions containing GEM and OLA have a practically constant experimental concentration for 21 days, regardless of storage at room temperature or 4 °C, demonstrating that the compounds are stable in solution under these conditions. This stability allows for their use during this period, as shown in Figure 6.
Figure 6.
Stability of GEM (A) and OLA (B) in mobile phase for 30 days at different temperatures.
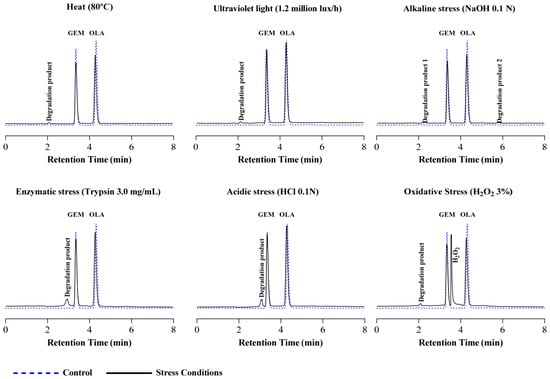
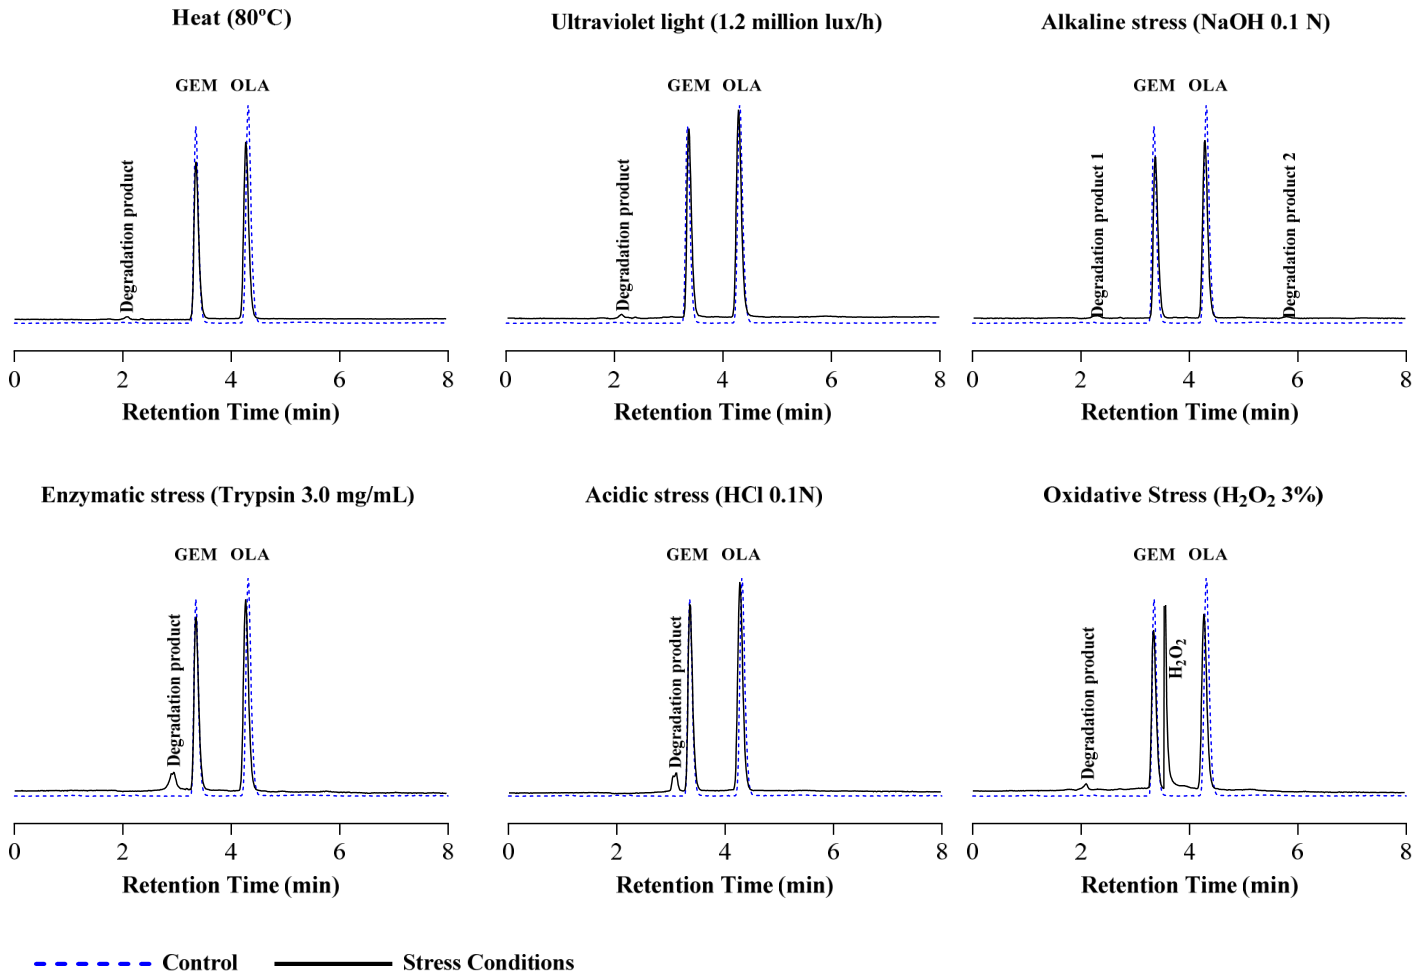
Both drugs, when subjected to various stress conditions for one hour, exhibited a low degradation rate, except for thermal degradation, which resulted in high recovery values for both compounds, as shown in Table 5. Under all tested stress conditions, degradation products were formed and detectable at 243 nm. These products eluted at distinct retention times, depending on the stress applied: acidic stress (0.1 N HCl) at 3.093 min, alkaline stress (0.1 N NaOH) at 2.290 and 5.788 min, oxidative stress (3.0% H2O2) at 2.094 min, enzymatic stress (trypsin, 3.0 mg/mL) at 2.952 min, photolytic stress (light exposure) at 2.108 min, and thermal stress (heat) at 2.086 min.
Table 5.
Percentage remained and Purity index of GEM and OLA under different stressed conditions.
The separation of these degradation products from the main peaks confirms the method’s specificity and selectivity as defined in the ICH guideline Q2(R2) [33]. To further support this, peak purity analysis was performed for GEM and OLA in all stressed samples, yielding Purity Index values > 0.999. These results demonstrate that the degradation products did not co-elute with the analytes, ensuring that the method remains stability-indicating and capable of providing accurate quantification even in the presence of stress-induced impurities, as represented in the chromatograms presented in Figure 7.
Figure 7.
Representative chromatograms of forced degradation conditions and their respective degradation products.
3.10. Application of the Method in Experiments of Recovery in Pancreatic Tissue
The recovery of the drugs was tested in a complex biological matrix, such as the pancreatic tissues, which is relevant for this drug association, since they must be quantified in this organ for the evaluation of delivery systems targeting pancreatic cancer.
The recovery rates of GEM and OLA ranged from 102.64% to 104.26% ± 0.56 and 97.80% to 99.51% ± 0.57, respectively, within the limits established by international legislation [33]. This demonstrates the applicability of the validated method in in vivo tests of new delivery systems containing the combination of drugs.
4. Conclusions
The analytical methodology, as demonstrated according to ICH guideline acceptance criteria, was shown to be selective, linear, and sensitive for the simultaneous quantification of GEM and OLA at a single detection wavelength. The method showed adequate precision and accuracy, even in the presence of potential interfering substances from both a chitosan-coated liposomal formulation and the biological matrix derived from mouse pancreatic tissues. Therefore, this method represents a robust and reliable tool to support the development of injectable liposomal formulations containing GEM and OLA.
Author Contributions
Conceptualization, G.M.G. and M.J.B.M.R.; methodology, M.T.S. and B.N.M.; validation, M.T.S. and B.N.M.; formal analysis, M.T.S. and G.M.G.; investigation, M.T.S. and B.N.M.; resources, T.G., M.C.-F., M.J.B.M.R. and G.M.G.; writing—original draft preparation, M.T.S. and B.N.M.; writing—review and editing, T.G., M.C.-F., M.J.B.M.R. and G.M.G.; supervision, M.J.B.M.R. and G.M.G.; project administration, G.M.G.; funding acquisition, M.J.B.M.R. and G.M.G. All authors have read and agreed to the published version of the manuscript.
Funding
This research was funded by CNPq (Conselho Nacional de Desenvolvimento Científico e Tecnológico, Grants 310291/2021-6 and 402518/2025-0) and the University of Brasília (Edital Interno nº 005/2025/PPGCS). CAPES (Coordenação de Aperfeiçoamento de Pessoal de Nível Superior) provided scholarships for the students.
Data Availability Statement
The raw data supporting the conclusions of this article will be made available by the authors on request.
Acknowledgments
The authors acknowledge Marcia Mortari for providing the pancreas samples.
Conflicts of Interest
The authors declare no conflicts of interest.
References
- McGuigan, A.; Kelly, P.; Turkington, R.C.; Jones, C.; Coleman, H.G.; McCain, R.S. Pancreatic cancer: A review of clinical diagnosis, epidemiology, treatment and outcomes. World J. Gastroenterol. 2018, 24, 4846–4861. [Google Scholar] [CrossRef] [Scilit]
- Daamen, L.A.; Groot, V.P.; Intven, M.P.W.; Besselink, M.G.; Busch, O.R.; Koerkamp, B.G.; Mohammad, N.H.; Hermans, J.J.; vanLaarhoven, H.W.M.; Nuyttens, J.J.; et al. Postoperative surveillance of pancreatic cancer patients. Eur. J. Surg. Oncol. 2019, 45, 1770–1777. [Google Scholar] [CrossRef] [Scilit]
- Cerqueira, N.M.F.S.A.; Fernandes, P.A.; Ramos, M.J. Understanding Ribonucleotide Reductase Inactivation by GEM citabine. Chem. Eur. J. 2007, 13, 8507–8515. [Google Scholar] [CrossRef] [Scilit]
- Fuertes, M.A.; Alonso, C.; Pérez José, M. Biochemical Modulation of Cisplatin Mechanisms of Action: Enhancement of Antitumor Activity and Circumvention of Drug Resistance. Chem. Rev. 2003, 103, 645–662. [Google Scholar] [CrossRef] [Scilit] [PubMed]
- Burstein, H.J.; Krilov, L.; Aragon-Ching, J.B.; Baxter, N.N.; Chiorean, E.G.; Chow, W.A.; De Groot, J.F.; Devine, S.G.; DuBois, S.G.; El-Deiry, W.S.; et al. Clinical Cancer Advances 2017: Annual Report on Progress Against Cancer from the American Society of Clinical Oncology. J. Clin. Oncol. 2017, 35, 1341–1367. [Google Scholar] [CrossRef] [Scilit] [PubMed]
- Rosen, M.N.; Goodwin, R.A.; Vickers, M.M. BRCA mutated pancreatic cancer: A change is coming. World J. Gastroenterol. 2021, 27, 1943–1958. [Google Scholar] [CrossRef] [Scilit] [PubMed]
- Conroy, T.; Hammel, P.; Hebbar, M.; Ben Abdelghani, M.; Wei, A.C.; Raoul, J.L.; Choné, L.; François, E.; Artru, P.; Biagi, J.J.; et al. FOLFIRINOX or GEM citabine as Adjuvant Therapy for Pancreatic Cancer. N. Engl. J. Med. 2018, 379, 2395–2406. [Google Scholar] [CrossRef] [Scilit]
- Holter, S.; Borgida, A.; Dodd, A.; Grant, R.; Semotiuk, K.; Hedley, D.; Dhani, N.; Narod, S.; Akbari, M.; Moore, M.; et al. Germline BRCA Mutations in a Large Clinic-Based Cohort of Patients with Pancreatic Adenocarcinoma. J. Clin. Oncol. 2015, 33, 3124–3129. [Google Scholar] [CrossRef] [Scilit]
- Golan, T.; Kanji, Z.S.; Epelbaum, R.; Devaud, N.; Dagan, E.; Holter, S.; Aderka, D.; Paluch-Shimon, S.; Kaufman, B.; Gershoni-Baruch, R.; et al. Overall survival and clinical characteristics of pancreatic cancer in BRCA mutation carriers. Br. J. Cancer 2014, 111, 1132–1138. [Google Scholar] [CrossRef] [Scilit]
- Lohse, I.; Borgida, A.; Cao, P.; Cheung, M.; Pintilie, M.; Bianco, T.; Holter, S.; Ibrahimov, E.; Kumareswaran, R.; Bristow, R.G.; et al. BRCA1 and BRCA2 mutations sensitize to chemotherapy in patient-derived pancreatic cancer xenografts. Br. J. Cancer 2015, 113, 425–432. [Google Scholar] [CrossRef] [Scilit]
- Ashworth, A. A Synthetic Lethal Therapeutic Approach: Poly(ADP) Ribose Polymerase Inhibitors for the Treatment of Cancers Deficient in DNA Double-Strand Break Repair. J. Clin. Oncol. 2008, 26, 3785–3790. [Google Scholar] [CrossRef] [Scilit]
- Fong, P.C.; Boss, D.S.; Yap, T.A.; Tutt, A.; Wu, P.; Mergui-Roelvink, M.; Mortimer, P.; Swaisland, H.; Lau, A.; O’Connor, M.J.; et al. Inhibition of Poly(ADP-Ribose) Polymerase in Tumors from BRCA Mutation Carriers. N. Engl. J. Med. 2009, 361, 123–134. [Google Scholar] [CrossRef] [Scilit] [PubMed]
- Golan, T.; Hammel, P.; Reni, M.; Van Cutsem, E.; Macarulla, T.; Hall, M.J.; Park, J.-O.; Hochhauser, D.; Arnold, D.; Oh, D.-Y.; et al. Maintenance Olaparib for Germline BRCA -Mutated Metastatic Pancreatic Cancer. N. Engl. J. Med. 2019, 381, 317–327. [Google Scholar] [CrossRef] [Scilit] [PubMed]
- Meng, X.; Bi, J.; Li, Y.; Yang, S.; Zhang, Y.; Li, M.; Liu, H.; Li, Y.; Mcdonald, M.E.; Thiel, K.W.; et al. AZD1775 Increases Sensitivity to Olaparib and GEM citabine in Cancer Cells with p53 Mutations. Cancers 2018, 10, 149. [Google Scholar] [CrossRef] [Scilit] [PubMed]
- Quiñonero, F.; Mesas, C.; Muñoz-Gámez, J.A.; Jiménez-Luna, C.; Perazzoli, G.; Prados, J.; Melguizo, C.; Ortiz, R. PARP1 inhibition by Olaparib reduces the lethality of pancreatic cancer cells and increases their sensitivity to GEM citabine. Biomed. Pharmacother. 2022, 155, 113669. [Google Scholar] [CrossRef] [Scilit]
- Gao, Y.; Chen, M.K.; Chu, Y.Y.; Yang, L.; Yu, D.; Liu, Y.; Hung, M.-C. Nuclear translocation of the receptor tyrosine kinase. Am. J. Cancer Res. 2021, 11, 236–250. [Google Scholar]
- Bendell, J.; O’Reilly, E.M.; Middleton, M.R.; Chau, I.; Hochster, H.; Fielding, A.; Burke, W.; Burris, H. Phase I study of olaparib plus GEM citabine in patients with advanced solid tumours and comparison with GEM citabine alone in patients with locally advanced/metastatic pancreatic cancer. Ann. Oncol. 2015, 26, 804–811. [Google Scholar] [CrossRef] [Scilit]
- Rajan, A.; Carter, C.A.; Kelly, R.J.; Gutierrez, M.; Kummar, S.; Szabo, E.; Yancey, M.A.; Ji, J.; Mannargudi, B.; Woo, S.; et al. A Phase I Combination Study of Olaparib with Cisplatin and GEM citabine in Adults with Solid Tumors. Clin. Cancer Res. 2012, 18, 2344–2351. [Google Scholar] [CrossRef] [Scilit]
- Du, C.; Qi, Y.; Zhang, Y.; Wang, Y.; Zhao, X.; Min, H.; Han, X.; Lang, J.; Qin, H.; Shi, Q.; et al. Epidermal Growth Factor Receptor-Targeting Peptide Nanoparticles Simultaneously Deliver GEM citabine and Olaparib to Treat Pancreatic Cancer with Breast Cancer 2 (BRCA2) Mutation. ACS Nano 2018, 12, 10785–10796. [Google Scholar] [CrossRef] [Scilit]
- Moysan, E.; Bastiat, G.; Benoit, J.P. GEM citabine Versus Modified GEM citabine: A Review of Several Promising Chemical Modifications. Mol. Pharm. 2013, 10, 430–444. [Google Scholar] [CrossRef] [Scilit]
- DrugBank. DB00441: Gemcitabine Hydrochloride (DBSALT000092). 2025. Available online: https://go.drugbank.com/salts/DBSALT000092 (accessed on 6 July 2025).
- Kim, Y.H.; Kim, S.B.; Choi, S.H.; Nguyen, T.T.L.; Ahn, S.H.; Moon, K.S.; Cho, K.-H.; Sim, T.-Y.; Heo, E.-J.; Kim, S.T.; et al. Development and Evaluation of Self-Microemulsifying Drug Delivery System for Improving Oral Absorption of Poorly Water-Soluble Olaparib. Pharmaceutics 2023, 15, 1669. [Google Scholar] [CrossRef] [Scilit] [PubMed]
- DrugBank. DB09074: Olaparib (DB09074). 2025. Available online: https://go.drugbank.com/drugs/DB09074 (accessed on 6 July 2025).
- Chen, G.; Svirskis, D.; Wen, J. Development and validation of a stability indicating isocratic HPLC method for GEM citabine with application to drug release from poly lactic-co-glycolic acid nanoparticles and enzymatic degradation studies. J. Pharm. Pharmacol. 2015, 67, 1528–1536. [Google Scholar] [CrossRef] [Scilit]
- Singh, R.; Shakya, A.K.; Naik, R.; Shalan, N. Stability-Indicating HPLC Determination of GEM citabine in Pharmaceutical Formulations. Int. J. Anal. Chem. 2015, 2015, 862592. [Google Scholar] [CrossRef] [Scilit]
- Daumar, P.; Dufour, R.; Dubois, C.; Penault-Llorca, F.; Bamdad, M.; Mounetou, E. Development and validation of a high-performance liquid chromatography method for the quantitation of intracellular PARP inhibitor Olaparib in cancer cells. J. Pharm. Biomed. Anal. 2018, 152, 74–80. [Google Scholar] [CrossRef] [Scilit]
- Chaudhary, A.; Tonk, R.; Dagur, P.; Dey, S.; Ghosh, M. Stability Indicating Assay Method for the Quantitative Determination of Olaparib in Bulk and Pharmaceutical Dosage Form. Turk. J. Pharm. Sci. 2022, 19, 488–497. [Google Scholar] [CrossRef] [Scilit]
- Mosztbacher, D.; Demcsák, A.; Sahin-Tóth, M. Measuring digestive protease activation in the mouse pancreas. Pancreatology 2020, 20, 288–292. [Google Scholar] [CrossRef] [Scilit]
- Santos, G.A.; Angelo, T.; Andrade, L.M.; Silva, S.M.M.; Magalhães, P.O.; Cunha-Filho, M.; Gelfuso, G.; Taveira, S.; Gratieri, T. The role of formulation and follicular pathway in voriconazole cutaneous delivery from liposomes and nanostructured lipid carriers. Colloids Surf. B Biointerfaces 2018, 170, 341–346. [Google Scholar] [CrossRef] [Scilit] [PubMed]
- Andrade, J.F.M.; Matos, B.N.; Rocho, R.V.; Barbalho, G.N.; Cunha-Filho, M.; Gelfuso, G.M.; Gratieri, T. Evaluation of Dutasteride-Loaded Liposomes and Transfersomes for Follicular-Targeting for Androgenic Alopecia Topical Treatment. Pharmaceutics 2024, 16, 1524. [Google Scholar] [CrossRef] [Scilit]
- Dos Santos, G.A.; Ferreira-Nunes, R.; Dalmolin, L.F.; Dos Santos Ré, A.C.; Anjos, J.L.V.; Mendanha, S.A.; Aires, C.P.; Lopez, R.F.V.; Cunha-Filho, M.; Gelfuso, G.M.; et al. Besifloxacin liposomes with positively charged additives for an improved topical ocular delivery. Sci. Rep. 2020, 10, 19285. [Google Scholar] [CrossRef] [Scilit] [PubMed]
- Barbalho, G.N.; Matos, B.N.; Da Silva Brito, G.F.; Da Cunha Miranda, T.; Alencar-Silva, T.; Sodré, F.F.; Gelfuso, G.M.; Cunha-Filho, M.; Carvalho, J.L.; da Silva, J.K.D.R.; et al. Skin Regenerative Potential of Cupuaçu Seed Extract (Theobroma grandiflorum), a Native Fruit from the Amazon: Development of a Topical Formulation Based on Chitosan-Coated Nanocapsules. Pharmaceutics 2022, 14, 207. [Google Scholar] [CrossRef] [Scilit]
- ICH. Harmonised Tripartite Guideline—Validation of Analytical Procedures Text and Methodology—Q2 (R2); ICH: Geneva, Switzerland, 2023. [Google Scholar]
- United States Pharmacopeia. <621> Chromatography. In USP-NF; United States Pharmacopeial Convention: Rockville, MD, USA, 2024. [Google Scholar]
- Angelo, T.; Pires, F.Q.; Gelfuso, G.M.; Da Silva, J.K.R.; Gratieri, T.; Cunha-Filho, M.S.S. Development and validation of a selective HPLC-UV method for thymol determination in skin permeation experiments. J. Chromatogr. B 2016, 1022, 81–86. [Google Scholar] [CrossRef] [Scilit]
- Raposo, F. Evaluation of analytical calibration based on least-squares linear regression for instrumental techniques: A tutorial review. Trends Anal. Chem. 2016, 77, 167–185. [Google Scholar] [CrossRef] [Scilit]
- Tolentino, S.; Gratieri, T.; Cunha-Filho, M.; Gelfuso, G.M. Curcumin quantification in skin and mucosa: Optimization of extraction and chromatographic method validation. J. Chromatogr. B 2023, 1217, 123623. [Google Scholar] [CrossRef] [Scilit]
- Albuquerque, L.F.F.; Souto, M.V.; Saldanha-Araujo, F.; Carvalho, J.L.; Gratieri, T.; Cunha-Filho, M.; Gelfuso, G.M. Development and Validation of a Chromatographic Method for Ibrutinib Determination in Human and Porcine Skin. Chemistry 2024, 6, 272–282. [Google Scholar] [CrossRef] [Scilit]

Disclaimer/Publisher’s Note: The statements, opinions and data contained in all publications are solely those of the individual author(s) and contributor(s) and not of MDPI and/or the editor(s). MDPI and/or the editor(s) disclaim responsibility for any injury to people or property resulting from any ideas, methods, instructions or products referred to in the content. |
© 2026 by the authors. Licensee MDPI, Basel, Switzerland. This article is an open access article distributed under the terms and conditions of the Creative Commons Attribution (CC BY) license.