


Abstract
Propolis and goldenberry (Physalis peruviana L.) provide bioactive compounds of interest for the development of food products enriched with natural bioactive ingredients. This study evaluated gummy candies fortified with propolis/honey microencapsulates produced by spray drying using maltodextrin and tara gum, together with goldenberry juice. Microencapsulates prepared with propolis from Colpa and Nueva Esperanza were characterized through bioactive and physicochemical analyses, SEM-EDS, FTIR, and TGA-DSC. Six gummy formulations were developed using a constrained mixture design, varying the microencapsulate (5, 6, and 7%), juice (25 and 30%), and water proportions, and their acceptance was evaluated by 120 consumers. The Colpa microencapsulate showed the most favorable bioactive profile and was selected for the formulations. The linear mixture models were significant (p < 0.001; R2 = 0.8240–0.9897). F6 showed the highest phenolic compound (1.22 mg GAE/g), flavonoid (0.90 mg QE/g), and total carotenoid contents (497.99 µg BCE/100 g), as well as the greatest antioxidant capacity (7.85 µmol TE/g). F5 achieved the highest sensory preference (33.33%) and contained 69.10 g/100 g of carbohydrates, 15.00 g/100 g of protein, 339.10 kcal/100 g, and a hardness of 2.46 N. The results showed that formulations with higher microencapsulate and juice contents exhibited greater bioactive responses, whereas F5 achieved the highest sensory preference and showed compositional and textural characteristics typical of a gummy matrix.
1. Introduction
Plant-derived bioactive compounds have attracted growing interest in food science because of their chemical diversity and functional properties. Fruits, vegetables, cereals, and other plant matrices are sources of polyphenols, flavonoids, carotenoids, terpenoids, and other biologically active metabolites, with antioxidant capacity being one of their most notable biological properties [1,2]. These characteristics have favored their use as ingredients in functional foods intended to provide properties beyond their conventional nutritional value [1,3]. However, incorporating these compounds into food matrices is limited by their solubility and stability during processing and storage [3,4]. In particular, various bioactive compounds may degrade under conditions such as high temperatures, light, and moisture, reducing their functionality and limiting their technological application [4]. Consequently, recovering, characterizing, and stabilizing these molecules are important steps toward expanding their use in designing new functional foods.
Among natural sources of bioactive compounds, goldenberry (Physalis peruviana L.), a fruit native to the Andean region, stands out for its carotenoids and phenolic compounds associated with antioxidant capacity, supporting its potential as an ingredient for developing functional foods [5]. Propolis, on the other hand, is a resinous matrix produced by bees from plant exudates and resins, whose chemical composition largely depends on its botanical and geographical origin [6,7]. Its main bioactive constituents include flavonoids and phenolic acids; however, its application in foods may be limited by the instability of these compounds when exposed to temperature, oxygen, and light, as well as by unfavorable sensory characteristics [7,8,9]. In this context, spray-drying microencapsulation offers an alternative for protecting these compounds and facilitating their incorporation into food matrices. In particular, the feasibility of using maltodextrin and tara gum as wall materials to obtain propolis/honey microencapsulates with appreciable phenolic and flavonoid contents and antioxidant capacity has been demonstrated [10].
The combined selection of goldenberry, propolis, and honey was intended to bring together ingredients with complementary bioactive profiles within a single food matrix. Peruvian goldenberry has been reported to contain vitamin C, phenolic compounds, carotenoids, and relevant antioxidant capacity [11,12], while propolis/honey systems have shown appreciable contents of phenolic compounds and flavonoids together with antioxidant activity [10]. Therefore, their incorporation into gummy candies was intended to provide a broader bioactive profile than that of conventional formulations based mainly on sugars and gelling agents, while maintaining a practical and sensorially acceptable food matrix.
Gummy candies are a versatile matrix for incorporating functional ingredients because they allow the integration of plant extracts, antioxidant compounds, and other bioactive components; however, their formulation may also modify the product’s functional, technological, and sensory properties [13]. For example, incorporating green propolis extract into fruit gummies significantly increased their antioxidant capacity, although high concentrations may adversely affect flavor [14]. Likewise, particulate systems containing phenolic compounds from propolis have been successfully incorporated into gelatin gummy candies while maintaining high phenolic content and antioxidant activity [15], and microencapsulated propolis has also been shown to improve antioxidant activity without compromising sensory acceptance [9]. Because component proportions influence the final characteristics of these products, mixture designs are an appropriate tool for studying and optimizing gummy formulations [16]. Although previous studies have evaluated the microencapsulation of propolis and honey and the incorporation of propolis-derived bioactive compounds into gummy matrices, the combined incorporation of propolis/honey microencapsulates and goldenberry juice has been scarcely studied. In particular, limited information is available on how the relative proportions of these ingredients affect phenolic, flavonoid, and carotenoid contents, antioxidant capacity, and sensory acceptance of gummy candies. In this context, the novelty of the present study lies in integrating propolis/honey microencapsulates obtained by spray drying with goldenberry juice within a constrained mixture design.
Based on this background, it was hypothesized that the proportions of propolis/honey microencapsulates, goldenberry juice, and water significantly influence the bioactive profile and sensory characteristics of gummy candies. Therefore, this study aimed to characterize propolis/honey microencapsulates obtained by spray drying and to evaluate their incorporation, together with goldenberry juice, into gummy candy formulations. To this end, we used a constrained mixture design to evaluate the effect of component proportions on total phenolic compounds, antioxidant capacity, flavonoids, and total carotenoids. We complemented the study with physicochemical analyses, SEM-EDS, FTIR, and sensory evaluation.
2. Materials and Methods
2.1. Materials and Reagents
Samples of raw propolis were obtained from the localities of Colpa and Nueva Esperanza, Andahuaylas Province, Apurímac, Peru. Samples from each geographical origin were kept separate throughout processing and characterization. Honey and goldenberry (Physalis peruviana L.) fruits were purchased from the central market of Andahuaylas, Apurímac, Peru, where the fruits are locally commercialized as goldenberry. Fruits intended for juice preparation were selected according to their external morphological characteristics, integrity, and ripeness and subsequently processed for incorporation into the formulations. No formal botanical authentication was performed, and no voucher specimen was deposited in a herbarium.
Maltodextrin (Regon, Lima, Peru) and tara gum (Molinos Asociados S.A.C., Lima, Peru) were used as wall materials for the preparation of the microencapsulates. For gummy candy production, neutral gelatin (200 Bloom), sucrose, glucose, isomalt, glycerin, and potassium benzoate (Passion Foods, Lima, Peru). These ingredients were commercially sourced products manufactured in China.
The reagents used for the analyses were Folin–Ciocalteu reagent (HiMedia, Mumbai, India), gallic acid (Sigma-Aldrich, Taufkirchen, Germany), quercetin (Sigma-Aldrich, Taufkirchen, Germany), aluminum chloride hexahydrate (Sigma-Aldrich, Taufkirchen, Germany), Trolox [6-hydroxy-2,5,7,8-tetramethylchroman-2-carboxylic acid] (Sigma-Aldrich, Taufkirchen, Germany), DPPH [2,2-diphenyl-1-picrylhydrazyl] (HiMedia, Mumbai, India), 96% ethanol (Coderal, Lima, Peru), methanol (Spectrum, New Brunswick, NJ, USA), and 99% isopropanol (Martell, Lima, Peru).
2.2. Preparation of the Ethanolic Propolis Extract and Microencapsulation of Propolis and Honey
To obtain the ethanolic propolis extract, 15 g of raw propolis was mixed with 100 mL of 80% ethanol. The mixture was stirred for 24 h and subsequently filtered. The filtrate was centrifuged at 4500 rpm for 10 min at 5 °C to separate insoluble particles. The clarified extract was subsequently concentrated under reduced pressure using a rotary evaporator (HS-2005V-N, HAHNVAPOR, Shanghai, China) at 40 °C until its volume was reduced to approximately 20% of the initial volume, thereby promoting ethanol evaporation. The resulting concentrated extract was stored at 4 °C until use in the microencapsulation process.
The microencapsulates were prepared from ethanolic propolis extract and honey. For this purpose, 10 mL of ethanolic propolis extract was mixed with 10 mL of honey. An encapsulating dispersion consisting of 30% (w/v) maltodextrin and 0.3% (w/v) tara gum was previously prepared and stirred for 24 h using a thermomagnetic stirrer to promote complete hydration of the wall materials. An amount of this encapsulating dispersion equivalent to 10% (w/w), calculated relative to the total mass of the ethanolic propolis extract–honey mixture, was then incorporated. Subsequently, the system was homogenized at 5000 rpm for 3 min using an Ultra-Turrax high-speed homogenizer.
The resulting dispersion was spray-dried in a Mini Spray Dryer B-290 (Büchi Labortechnik AG, Flawil, Switzerland) using an inlet temperature of 120 °C, an aspirator setting of 100%, a feed pump rate of 30%, an airflow rate of 650 L/h, and a 0.7 mm nozzle. The outlet temperature remained within the range of 66–68 °C during the drying process. The resulting microencapsulates were collected and stored in airtight polyethylene containers inside a desiccator until characterization and subsequent use [10].
2.3. Formulation and Preparation of Gummy Candies with Goldenberry Juice
For the preparation of the gummy candies, the propolis/honey microencapsulate obtained from propolis collected in Colpa was used. A constrained mixture design was applied to evaluate the effect of three variable components: propolis/honey microencapsulate, goldenberry juice, and water. Together, these components accounted for 54.5% of each formulation, whereas the proportions of gelatin, sucrose, glucose, isomalt, potassium benzoate, and glycerin were kept constant. Six formulations were evaluated, considering two levels of goldenberry juice (25 and 30%) and three levels of propolis/honey microencapsulate (5, 6, and 7%). The proportion of water was adjusted in each formulation so that the total composition reached 100% (Table 1).
Table 1.
Percentage composition of the gummy candy formulations (% w/w).
For gummy candy preparation, two mixtures were initially prepared. In the first mixture, neutral gelatin (11.9%) was dispersed in the amount of water corresponding to each formulation and heated to 50 °C until complete hydration and dissolution were achieved.
In a second mixture, glucose (17%), sucrose (11%), isomalt (5%), and the corresponding proportion of goldenberry juice (25 or 30%) were combined. The mixture was maintained under constant stirring and initially heated to approximately 50 °C; the temperature was then increased to 65 °C to promote matrix homogenization and finally reduced again to approximately 50 °C.
The previously hydrated gelatin was incorporated into the second mixture together with potassium benzoate, glycerin, and the corresponding proportion of propolis/honey microencapsulate. The microencapsulates were added at approximately 50 °C, and the mixture was homogenized until a uniform distribution of the components was obtained.
Finally, the mixture was immediately poured into molds and allowed to cool at room temperature until the desired consistency was achieved. The gummy candies were removed from the molds and subsequently dried in a forced-convection oven (FED 115, Binder, Tuttlingen, Germany) at 30 °C for 24 h to reduce their moisture content and promote stability during storage. The dried samples were stored in airtight plastic containers until analysis [9].
2.4. Physicochemical and Structural Characterization
Characterization was carried out by determining moisture content, hygroscopicity, and color, as well as by analyzing particle size, zeta potential, scanning electron microscopy coupled with energy-dispersive X-ray spectroscopy (SEM-EDS), Fourier-transform infrared spectroscopy (FTIR), and thermal properties. The determinations were performed on the corresponding samples according to the nature of each analysis.
2.4.1. Moisture Content
The moisture content of the microencapsulates was determined using the oven-drying method at 105 °C and expressed as a percentage of moisture. Drying was continued until the mass loss corresponding to the water content of the samples was obtained [10].
2.4.2. Hygroscopicity
The hygroscopicity of the microencapsulates was determined by placing 1 g of sample in an open Petri dish, which was then placed inside a sealed container containing a saturated NaCl solution. The samples were maintained at 25 °C for seven days. After this period, the final mass was recorded, and hygroscopicity was calculated from the increase in sample mass [10].
2.4.3. Color
The color of the samples was determined using a CR-5 colorimeter (Konica Minolta, Tokyo, Japan). Measurements were performed according to the CIELAB color space, recording the lightness parameter (L*), red-green coordinate (a*), and yellow–blue coordinate (b*) [10].
2.4.4. pH Determination
The pH of goldenberry juice was measured potentiometrically using a pH meter (Schott Instruments Lab 850, Mainz, Germany). Measurements were performed on the juice samples, and the results were expressed as pH values [17].
2.4.5. Titratable Acidity
Titratable acidity was determined by potentiometric titration using a previously standardized 0.1 N sodium hydroxide (NaOH) solution. The acidity was calculated from the volume of NaOH consumed during titration and expressed as a percentage of citric acid equivalents [17].
2.4.6. Particle Size and Zeta Potential (ζ)
The particle size of the microencapsulates was determined by laser diffraction using a Mastersizer 3000 (Malvern Instruments, Malvern, Worcestershire, UK). For the analysis, a sufficient amount of sample was dispersed in isopropanol and sonicated for 60 s until the obscuration level required by the instrument was reached. The ζ-potential was determined using a Zetasizer ZSU3100 (Malvern Instruments, Malvern, Worcestershire, UK) equipped with a 632.8 nm He-Ne laser. The microencapsulates were dispersed in ultrapure water and sonicated for 60 s. Measurements were subsequently performed at 25 °C using a disposable folded capillary cell (DTS1080) [10].
2.4.7. Scanning Electron Microscopy and EDS Analysis
The surface morphology and elemental composition of the microencapsulates were evaluated by scanning electron microscopy coupled with energy-dispersive X-ray spectroscopy (SEM-EDS) using a Prism E SEM microscope (Thermo Fisher Scientific, Waltham, MA, USA). The samples were mounted on conductive carbon tape and analyzed at an accelerating voltage of 30 kV. Micrographs were obtained at 2000× magnification to examine particle morphology and distribution, whereas EDS analysis was used to semi-quantitatively determine the surface elemental composition [10].
2.4.8. Fourier-Transform Infrared Spectroscopy (FTIR)
The functional groups present in the samples were characterized by Fourier-transform infrared spectroscopy using a Nicolet IS50 spectrometer (Thermo Fisher Scientific, Waltham, MA, USA). Spectra were recorded in transmission mode in the mid-infrared region from 400 to 4000 cm−1. For analysis of the microencapsulates, pellets containing 99% potassium bromide (KBr) and 1% sample were prepared [10]. Gummy candy formulations F1–F6 were also analyzed by FTIR over the range of 400–4000 cm−1 to compare their spectral profiles and identify the main bands associated with the functional groups present in the matrix.
2.4.9. Thermogravimetric Analysis and Differential Scanning Calorimetry (TGA-DSC)
For TGA analysis, approximately 10 mg of sample was analyzed using a TGA 550 instrument (TA Instruments, New Castle, DE, USA) by heating from 20 to 600 °C at a rate of 10 °C/min under a nitrogen atmosphere. The resulting curves were used to determine the main stages of mass loss and the thermal stability of the microencapsulates. For DSC analysis, approximately 2 mg of sample was analyzed using a DSC 2500 calorimeter (TA Instruments, New Castle, DE, USA), applying a heating program from 20 to 300 °C at a rate of 3 °C/min [10].
2.5. Determination of Bioactive Compounds and Antioxidant Capacity
For the determination of total phenolic compounds, antioxidant capacity and flavonoids in the gummy candies, methanolic extracts were prepared by mixing 0.2 g of sample with 10 mL of 80% methanol (v/v). The mixtures were vortexed at 3000 rpm for 60 s and kept in the dark at room temperature for 24 h. Subsequently, the samples were centrifuged at 3500 rpm for 3 min, and the clarified methanolic extracts were stored at 4 °C until analysis [9].
2.5.1. Total Phenolic Compounds
The total phenolic content was determined using the Folin–Ciocalteu method. Sample extracts were reacted with a 20% sodium carbonate solution, 0.25 N Folin–Ciocalteu reagent, and ultrapure water. Subsequently, absorbance was measured at 755 nm using a Genesys 150 spectrophotometer (Thermo Fisher Scientific, Waltham, MA, USA). Quantification was performed using a gallic acid calibration curve ranging from 5 to 35 mg/L, and the results were expressed as milligrams of gallic acid equivalents per gram of sample (mg GAE/g) [10].
2.5.2. Antioxidant Capacity by DPPH
Antioxidant capacity was evaluated using the 2,2-diphenyl-1-picrylhydrazyl (DPPH) radical method. A DPPH stock solution was prepared at a concentration of 1.25 mM and diluted with 80% methanol until an absorbance of 1.10 ± 0.02 at 515 nm was reached. The extract from each sample was mixed with the DPPH solution and kept at room temperature for 10 min. Subsequently, absorbance was measured at 515 nm using a Genesys 150 spectrophotometer (Thermo Fisher Scientific, Waltham, MA, USA). Antioxidant capacity was quantified using a Trolox calibration curve ranging from 10 to 699.19 µmol/L, and the results were expressed as µmol Trolox equivalents per gram of sample (µmol TE/g) [10].
2.5.3. Total Flavonoids
The total flavonoid content was determined using a colorimetric method based on complex formation with aluminum chloride. Sample extracts were mixed with methanol and aluminum chloride and protected from light for 10 min. Absorbance was then measured at 450 nm using a Genesys 150 spectrophotometer (Thermo Fisher Scientific, Waltham, MA, USA). Quantification was performed using a quercetin calibration curve ranging from 0.2 to 1.2 mg/mL, and the results were expressed as milligrams of quercetin equivalents per gram of sample (mg QE/g) [10].
2.5.4. Total Carotenoid Content
Total carotenoid content was determined using a spectrophotometric method. A 1.0 g sample was homogenized with 10 mL of an acetone:ethanol mixture (1:1, v/v) and maintained for 24 h at 4 ± 2 °C. Subsequently, the extract was vacuum-filtered using Whatman No. 41 filter paper, and the filtrate was brought to a final volume of 50 mL with the same solvent mixture. Next, 25 mL of hexane and 12.5 mL of distilled water were added, the mixture was vigorously shaken, and it was allowed to stand for 30 min to permit phase separation. The absorbance of the organic phase was measured at 470 nm using hexane as the blank in a Genesys 150 spectrophotometer (Thermo Fisher Scientific, Waltham, MA, USA). The results were expressed as µg β-carotene equivalents per 100 g of sample (µg BCE/100 g), using an absorptivity coefficient of 2500 [18].
2.5.5. Vitamin C Determination
Vitamin C content was determined using a spectrophotometric method based on the reduction of 2,6-dichlorophenolindophenol. A 0.4% oxalic acid solution and a 0.1% ascorbic acid standard solution were prepared. Calibration solutions containing different proportions of distilled water, oxalic acid, dye reagent, and ascorbic acid standard were used to construct the calibration curve. Samples were extracted with 0.4% oxalic acid, filtered, and then measured for absorbance at 520 nm. We calculated vitamin C concentrations from the calibration curve and expressed them as mg ascorbic acid per gram dry matter [19].
2.6. Sensory Evaluation
The sensory acceptance of the six gummy candy formulations was evaluated with the participation of 120 untrained consumers of both sexes, aged 18–44 years. The samples were presented individually and identified using random numerical codes. Participants evaluated color, odor, flavor, and texture using a structured five-point hedonic scale: dislike very much (1), dislike slightly (2), neither like nor dislike (3), like slightly (4), and like very much (5). Water was provided for palate cleansing between samples, and the evaluations were conducted under appropriate lighting conditions and in individual booths to minimize influence among participants and possible carryover effects between formulations.
Adult consumers who voluntarily agreed to participate in the study were considered eligible, whereas those who reported an allergy or hypersensitivity to any of the ingredients used, particularly bee products, were excluded. Additionally, after evaluating all six formulations, each participant was asked to select the formulation they preferred most [9]. The sensory evaluation was conducted within the framework of the research project approved by the Ethics Committee of the Faculty of Engineering of Universidad Nacional José María Arguedas through Dean’s Resolution No. 285-2023-D-FI-UNAJMA, dated 25 September 2023. Written informed consent was obtained from all participants prior to the sensory evaluation.
2.7. Proximate Composition of the Selected Formulation
The proximate composition of the formulation with the highest sensory acceptance was determined according to official AOAC methods (2012). Moisture content was determined using AOAC 925.10, protein using AOAC 960.52, fat using AOAC 2003.05, and ash using AOAC 923.03. Carbohydrate content was calculated by difference, and the energy value was estimated using the general Atwater factors of 4 kcal/g for protein and carbohydrates and 9 kcal/g for fat [20].
2.8. Texture Profile Analysis (TPA)
The texture profile of the selected formulation was determined using a Brookfield AMETEK texture analyzer (AMETEK Brookfield, Middleboro, MA, USA) equipped with a 5000 g load cell. Samples were subjected to texture profile analysis (TPA) using two consecutive compression cycles with a TA3/1000 cylindrical probe, a compression distance of 3.0 mm, and a speed of 0.5 mm/s. Hardness, cohesiveness, adhesiveness, springiness, and resilience were determined from the resulting curves. Data were processed using Texture Pro software, version 1.0.19 [9].
2.9. Statistical Analysis
The results were expressed as mean ± standard deviation. Differences among formulations were evaluated by analysis of variance (ANOVA), followed by Fisher’s LSD test, considering a significance level of p < 0.05. Sensory evaluation data were analyzed using the nonparametric Kruskal–Wallis test (p < 0.05).
To evaluate the effect of the proportions of propolis/honey microencapsulate, goldenberry juice, and water on the response variables, linear mixture models were fitted. Model significance was evaluated by analysis of variance (ANOVA), considering a significance level of p < 0.05. Goodness of fit was assessed using the coefficient of determination (R2) and adjusted coefficient of determination (adjusted R2). Response surfaces and Pareto charts were generated from the fitted models to analyze the behavior and relative contribution of the components within the experimental region studied. Statistical analyses and graphical representations were performed using OriginPro 2026 (OriginLab Corporation, Northampton, MA, USA) and STATISTICA 7 (StatSoft, Inc., Tulsa, OK, USA).
3. Results and Discussion
3.1. Characterization of Propolis, Propolis Extracts, and Honey
The results of the bioactive and physicochemical characterization (Table 2) revealed significant differences between the propolis samples from Colpa and Nueva Esperanza. Colpa propolis showed higher contents of total phenolic compounds and flavonoids, as well as greater antioxidant capacity, whereas Nueva Esperanza propolis exhibited a higher moisture content. Regarding color, no significant differences in lightness (L*) were observed between the two samples; however, a* and b* values were higher in Colpa propolis, indicating a greater contribution of reddish and yellowish tones.
Table 2.
Bioactive and physicochemical characterization of propolis, propolis extracts, and honey.
The differences observed between the two geographical origins may be related to the characteristic chemical variability of propolis according to its geographical and botanical origin. The composition of this matrix depends on the plant resins available in the surroundings of the bee colonies and may vary according to the local flora and environmental conditions of the collection site [6,7]. In multifloral propolis previously collected from different localities in Apurímac, differences in chemical composition and biofunctional properties were also observed and were associated with the particular characteristics of the sampling sites, including flora, altitude, and climatic conditions [7]. These variations may be attributed to differences in the available plant sources, which modify the profile of phenolic acids, flavonoids, and other metabolites incorporated into propolis [21].
The ethanolic extracts showed a similar trend in the bioactive variables, with significantly higher values of total phenolic compounds, flavonoids, and antioxidant capacity in the Colpa extract. Marked differences were also observed in the color parameters: the Colpa extract exhibited considerably lower lightness, whereas the Nueva Esperanza extract showed higher L*, a*, and b* values, indicating a comparatively lighter color with a greater reddish-yellow component.
The ethanolic propolis extracts showed appreciable contents of phenolic compounds and flavonoids, consistent with previous results obtained for propolis from the same region [10]. These compounds may have been selectively recovered by hydroethanolic mixtures. In this regard, hydroethanolic solutions containing approximately 70–80% ethanol have been reported to be effective for recovering phenolic compounds and flavonoids from propolis [22].
Honey showed the lowest numerical values of phenolic compounds, flavonoids, and antioxidant capacity. Its moisture content was higher than that observed in the raw propolis samples. The results demonstrate differences in bioactive and physicochemical characteristics associated with the geographical origin of the propolis, with the Colpa sample standing out for its more favorable bioactive profile. The moisture content of the honey was within the range of 16.53–20.67% previously reported for honey samples from Apurímac [10]. In that study, phenolic and flavonoid contents were also lower than those observed in ethanolic propolis extracts, showing a trend similar to that found in the present study [10].
3.2. Physicochemical and Bioactive Characterization of Goldenberry Juice
The physicochemical and bioactive characterization of goldenberry juice, presented in Table 3, revealed a high moisture content and a low proportion of dry matter, together with an acidic pH and appreciable titratable acidity. The CIELAB color parameters showed positive a* and b* values, with a predominance of the yellow component, characteristic of the fruit. Furthermore, phenolic compounds, flavonoids, and vitamin C were identified, together with antioxidant capacity determined using the DPPH assay. These findings characterize the physicochemical properties of goldenberry juice and demonstrate the presence of bioactive constituents associated with its antioxidant potential.
Table 3.
Physicochemical and bioactive characterization of goldenberry juice.
Previous studies have reported physicochemical and bioactive characteristics of goldenberry juice that provide a useful basis for comparison with the present findings. Fresh goldenberry juice has been reported to exhibit total soluble solids of 13.42 °Brix, a pH of 3.76, and titratable acidity of 1.41% (as citric acid), together with 71.06 mg/100 mL of ascorbic acid, 39.42 mg/100 mL of total phenolic compounds, and antioxidant activity of 85.44% [23]. Similarly, another study reported total soluble solids of 10.5 °Brix, a pH of 3.84, and titratable acidity of 0.93% (as citric acid), together with 47 mg/100 g of vitamin C and 6.5 mg/100 g of phenolic compounds [24]. These findings are consistent with the acidic nature and presence of bioactive constituents observed in the goldenberry juice evaluated in the present study. Nevertheless, differences in analytical methods and reporting units should be considered when comparing bioactive compound contents among studies.
3.3. Characterization of Propolis/Honey Microencapsulates
The microencapsulates obtained from propolis from Colpa and Nueva Esperanza showed significant differences in most of the variables evaluated (Table 4). The Colpa microencapsulate exhibited higher contents of total phenolic compounds and flavonoids, as well as greater antioxidant capacity. In contrast, no significant differences were observed between the two microencapsulates in moisture content or lightness (L*).
Table 4.
Bioactive and physicochemical characterization of propolis/honey microencapsulates.
The higher contents of phenolic compounds and flavonoids, together with the greater antioxidant capacity observed in the Colpa microencapsulate, followed the same trend previously observed in the propolis and its ethanolic extract. The presence of these bioactive compounds after microencapsulation is consistent with previous studies reporting phenolic compounds and antioxidant activity in spray-dried propolis powders [25,26,27]. Likewise, core composition, wall materials, and processing conditions may influence the preservation of bioactive compounds [26,27]. In propolis/honey microencapsulates previously obtained by spray drying, a direct relationship between phenolic and flavonoid contents and antioxidant capacity was also observed [10].
Furthermore, drying conditions and the incorporation of maltodextrin may influence the phenolic content and antioxidant properties of dried plant extracts, as reported in previous studies. However, in the present study, the retention of bioactive compounds relative to the initial feed dispersion was not quantified; therefore, potential losses during spray drying could not be determined. This represents a limitation of the study that should be addressed in future research through quantitative retention assessments [28].
Regarding color parameters, the Colpa microencapsulate showed a more negative a* value and a significantly higher b* value than the Nueva Esperanza microencapsulate. Hygroscopicity was also significantly higher in the Colpa microencapsulate. Zeta potential differed significantly between the samples, with a more negative value for Colpa, whereas particle size was larger in this microencapsulate than in that obtained from Nueva Esperanza propolis.
The moisture contents of both microencapsulates were below 5%, which is a favorable characteristic for dehydrated powders. Previous studies on encapsulated propolis have shown that moisture content, hygroscopicity, and other physicochemical properties depend on matrix composition and the conditions used during the drying process [25,26]. Moisture contents close to 6% and hygroscopicity values of approximately 8% have been reported for propolis/honey microencapsulates obtained by spray drying [10], whereas hygroscopicity in the present study ranged from 7.44 to 10.25%. Likewise, the high lightness values obtained are consistent with L* values above 90 previously reported for propolis/honey microencapsulates [10].
The hygroscopicity of the powders may be related to the availability of hydroxyl groups in the polysaccharides of the encapsulating matrix, which are capable of interacting with water molecules from the surrounding environment. In particular, tara gum exhibits hydrophilic behavior associated with its galactomannan structure; therefore, the organization of this polysaccharide within the matrix may contribute to the observed differences in moisture uptake [29].
The particle sizes of both microencapsulates fall within the range of 7.83–53.7 µm previously reported for propolis/honey systems obtained by spray drying [10]. The differences observed between the samples may be related to core composition and to interactions occurring during particle formation and drying, since the characteristics of the encapsulation system influence the size and physical properties of the microparticles [25,26,27]. The zeta potential values indicate a pronounced negative surface charge in both microencapsulates. Values of similar magnitude, close to −33.5 mV, have recently been reported for propolis microcapsules obtained by complex coacervation followed by spray drying [9], supporting the electrokinetic behavior observed in the samples evaluated.
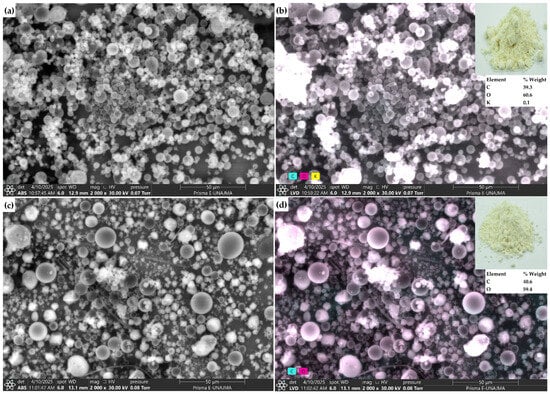
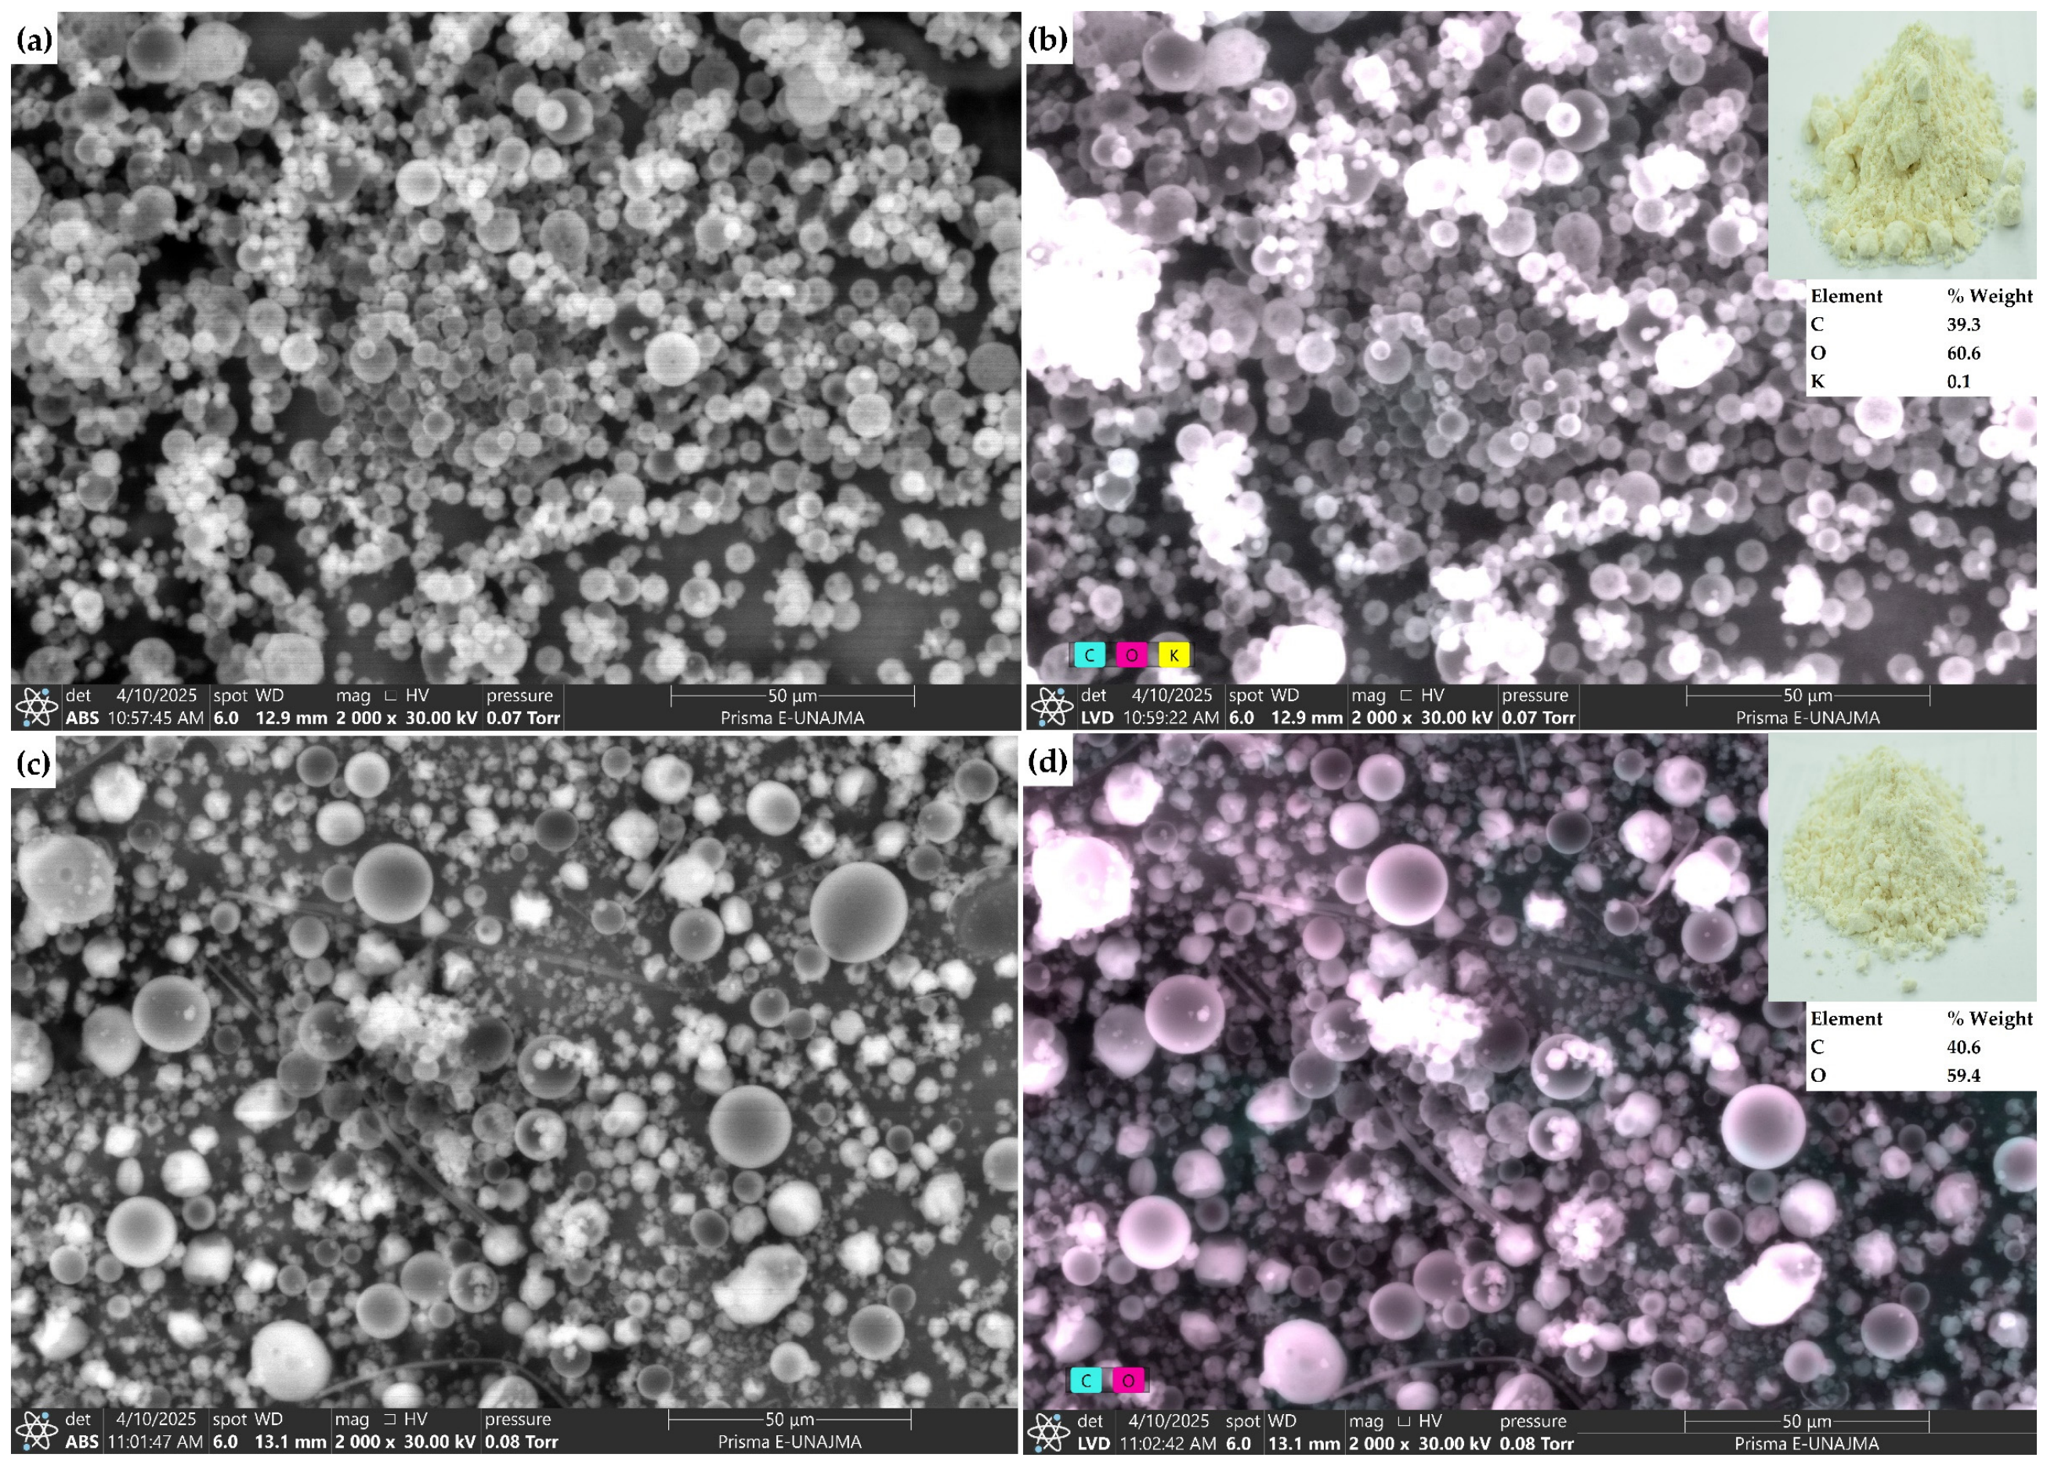
Figure 1 shows the surface morphology and elemental composition of the microencapsulates prepared with propolis from Colpa and Nueva Esperanza. The SEM micrographs (Figure 1a,c) revealed predominantly spherical particles in both samples, with a heterogeneous size distribution and the presence of aggregates. Relatively smooth surfaces were also observed, together with agglomerated structures and particles of different diameters.
Figure 1.
Morphology (a) and elemental composition (b) of the microencapsulate prepared with Colpa propolis; morphology (c) and elemental composition (d) of the microencapsulate prepared with Nueva Esperanza propolis.
The predominantly spherical morphology may be associated with the rapid removal of solvent during spray drying and the consequent formation of a surface film around the atomized droplets. In turn, the heterogeneity in particle size and the formation of aggregates may be related to feed characteristics and atomization and drying conditions [30]. This behavior is consistent with previous studies on spray-dried microencapsulated propolis, in which predominantly spherical particles, relatively smooth surfaces, and varying degrees of agglomeration have been described [26,27,30]. In propolis/honey systems, spherical particles of different sizes and predominantly smooth surfaces have also been observed when maltodextrin and gum were used as encapsulating materials [10].
EDS analysis (Figure 1b,d) showed that carbon and oxygen were the predominant elements in both microencapsulates. The Colpa sample contained 39.3% C and 60.6% O, together with a minor proportion of K (0.1%), whereas the Nueva Esperanza microencapsulate contained 40.6% C and 59.4% O. Both samples showed a similar surface elemental composition dominated by carbon and oxygen.
The predominance of carbon and oxygen is consistent with the organic nature of propolis, honey, and the biopolymers used as wall materials. Similar results have been reported for propolis/honey microencapsulates, in which both elements constituted the largest proportion of the surface composition determined by EDS [10]. Likewise, propolis microcapsules obtained using another encapsulation system showed a surface composition dominated by carbon and oxygen, which is consistent with matrices composed mainly of organic compounds [9].
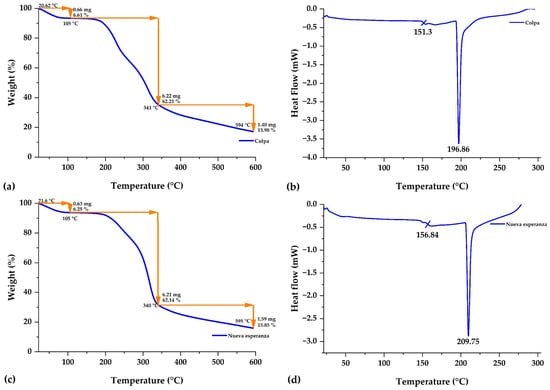
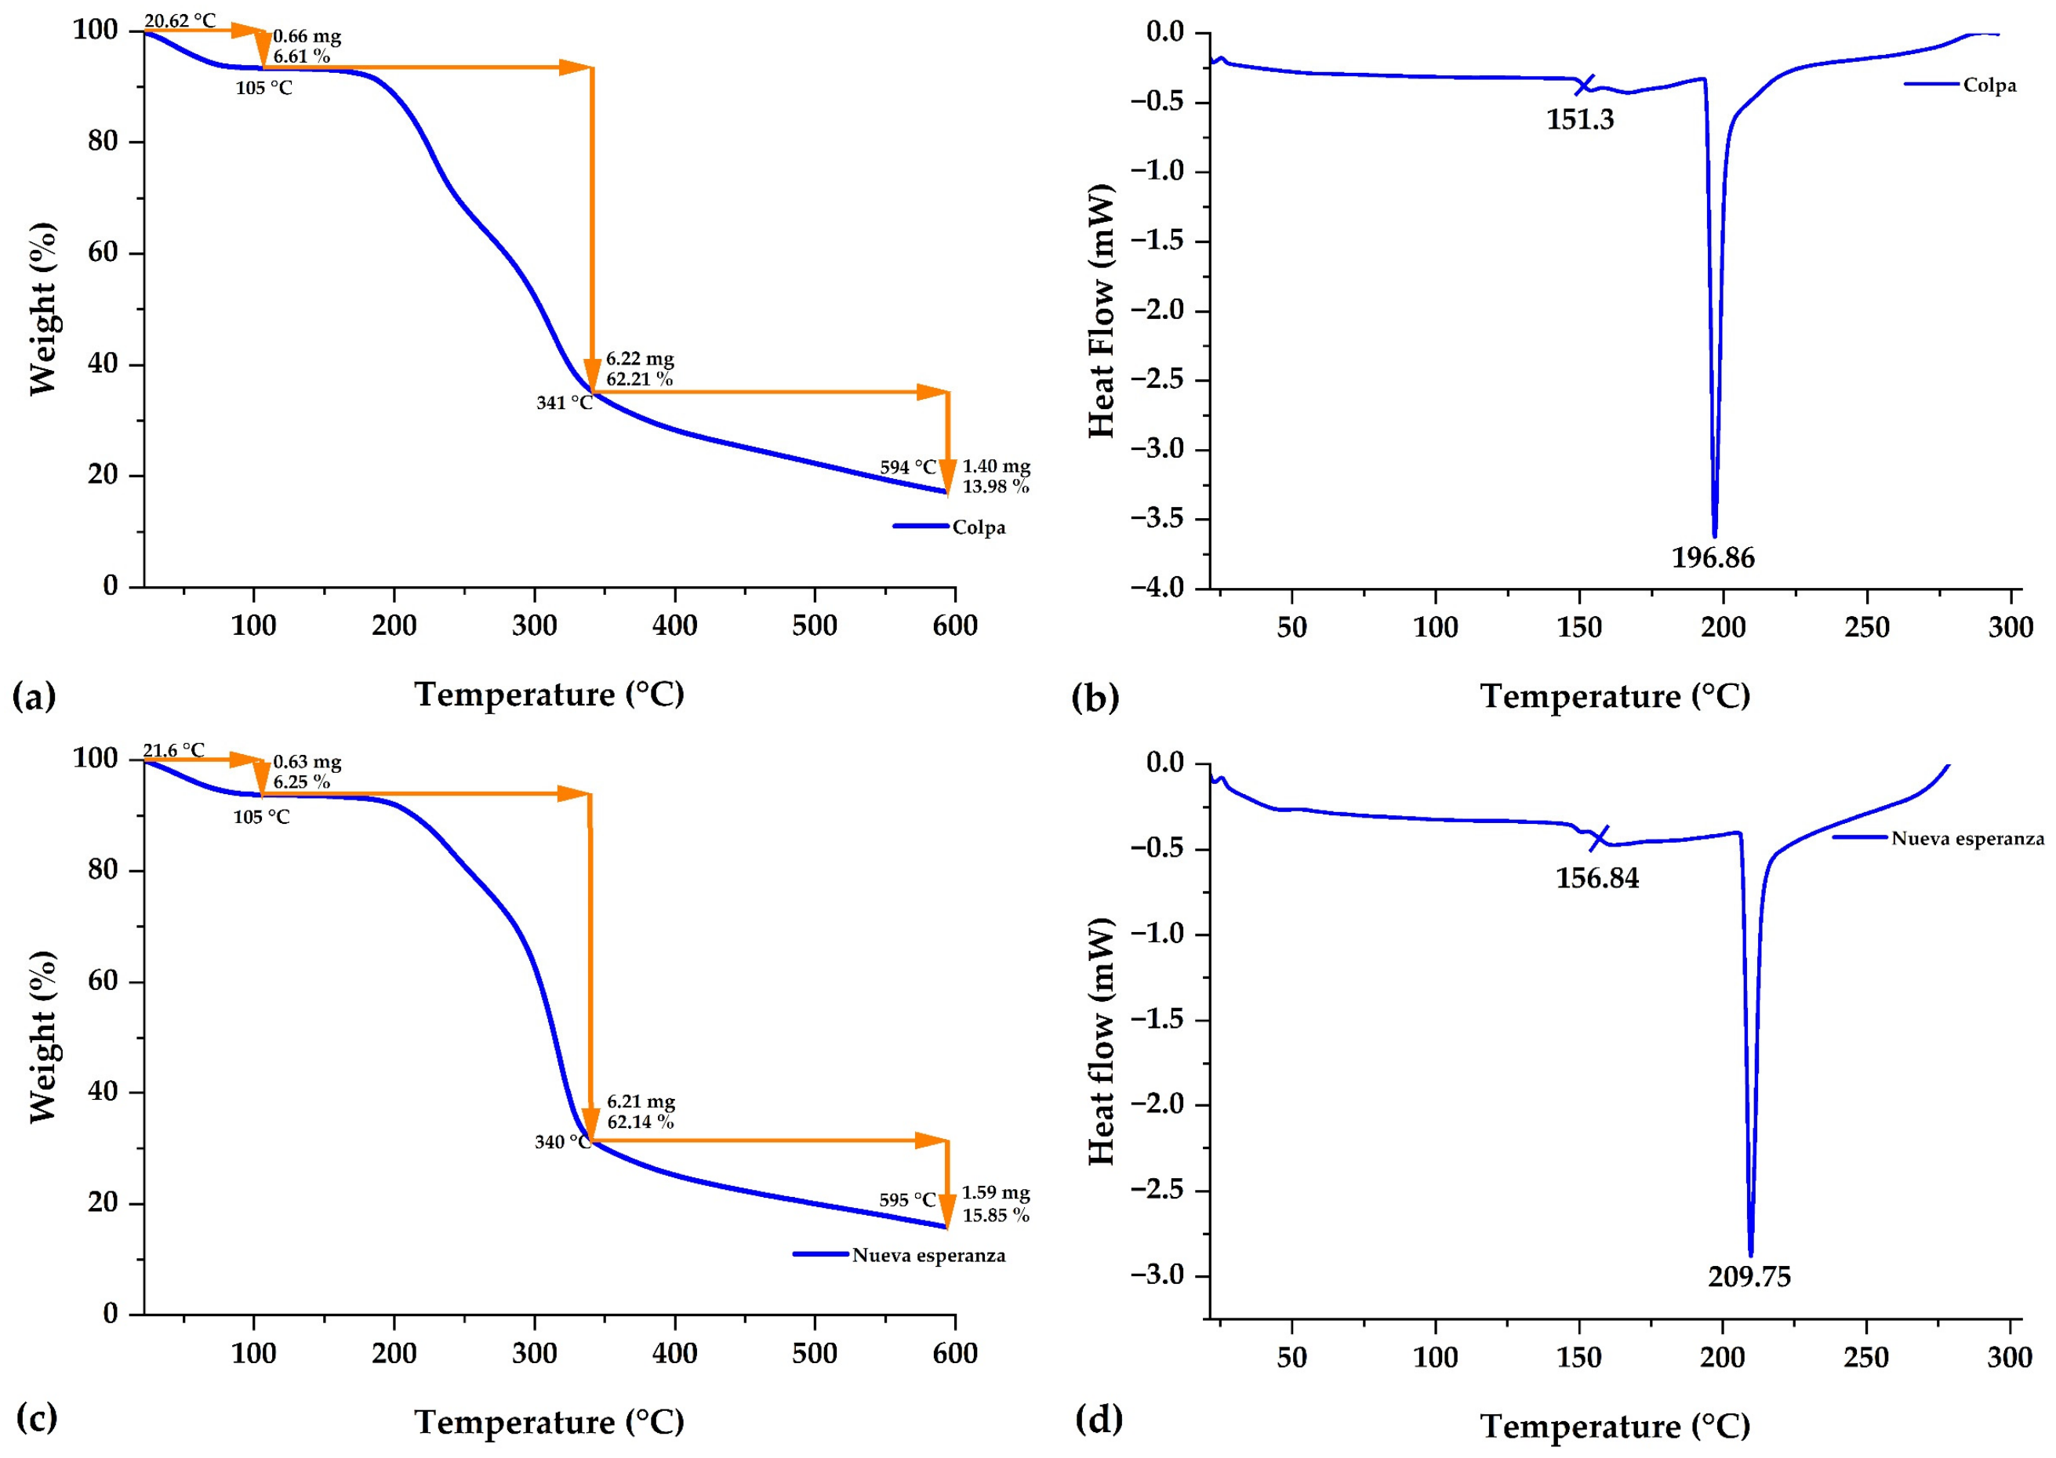
Figure 2 shows the thermal behavior of the microencapsulates prepared with propolis from Colpa and Nueva Esperanza. The thermogravimetric curves (Figure 2a,c) showed similar profiles and allowed three main stages of mass loss to be distinguished. The first stage, recorded up to approximately 105 °C, may be mainly associated with the removal of water and other volatile compounds. The second stage, extending approximately from 105 to 340–341 °C, accounted for the greatest mass loss and was related to the thermal degradation of the main organic constituents of the encapsulating matrix and the incorporated compounds. Finally, the third stage, recorded approximately between 340–341 and 594–595 °C, corresponded to an additional and progressive mass loss associated with the degradation of more thermally resistant organic components and the formation of the final residue.
Figure 2.
Thermogravimetric analysis (a) and differential scanning calorimetry (b) of the microencapsulate prepared with Colpa propolis; thermogravimetric analysis (c) and differential scanning calorimetry (d) of the microencapsulate prepared with Nueva Esperanza propolis.
In this system, a substantial part of the thermal response may be attributed to the polysaccharide matrix composed of maltodextrin and tara gum. The abundance of hydroxyl groups favors intermolecular interactions, mainly through hydrogen bonding, whose progressive disruption and subsequent degradation of the polysaccharide chains may contribute to the thermal events observed at intermediate and high temperatures [29].
This thermal behavior is consistent with that previously described for microencapsulated systems obtained by spray drying. Mass loss at low temperatures has been mainly associated with the removal of water and low-molecular-weight volatile compounds, whereas subsequent losses correspond to the progressive degradation of carbohydrates, proteins, lipids, and other organic constituents of the matrix [10,31]. Similar thermogravimetric profiles have also been reported for propolis/honey microencapsulates, with an initial mass loss of approximately 5% associated with water removal and a main degradation stage around 316–320 °C [10]. The similarity observed between the Colpa and Nueva Esperanza samples suggests that both exhibited comparable thermal behavior under the conditions evaluated.
The residual masses of the Colpa and Nueva Esperanza microencapsulates were 13.98% at 594 °C and 15.85% at 595 °C, respectively. These residues may be associated with carbonaceous material formed during thermal degradation and inorganic constituents of the microencapsulates. However, their specific composition was not determined, and the residual mass values alone do not provide sufficient evidence to establish a direct relationship with encapsulation efficiency or storage stability.
The differential scanning calorimetry curves (Figure 2b,d) showed two main thermal events in each microencapsulate. In the Colpa microencapsulate, these events were recorded at approximately 151.30 and 196.86 °C, respectively. In the Nueva Esperanza microencapsulate, a first event was observed at around 156.84 °C, followed by a pronounced endothermic peak at 209.75 °C. Both microencapsulates exhibited similar thermal profiles; however, the events observed for Nueva Esperanza were shifted toward slightly higher temperatures than those recorded for Colpa.
The observed endothermic events are close to those described for other propolis microencapsulation systems. In microcapsules obtained by complex coacervation followed by spray drying, an endothermic transition around 146.97 °C associated with system dehydration and another main transition near 204.85 °C related to the thermal behavior of the encapsulating matrix were reported [9]. These values are comparable to those recorded for the Colpa and Nueva Esperanza microencapsulates, indicating thermal behavior characteristic of encapsulated organic matrices subjected to heating. The shift in the Nueva Esperanza thermal events toward slightly higher temperatures may be related to differences in core composition and in its interactions with the wall materials.
However, higher DSC transition temperatures do not necessarily indicate greater thermal stability. Considering the similar thermogravimetric profiles of both microencapsulates and the absence of additional quantitative calorimetric parameters, the available results do not allow a definitive determination of which microencapsulate exhibits superior thermal stability.
Considering its higher contents of total phenolic compounds and flavonoids, as well as its greater antioxidant capacity, the microencapsulate prepared with propolis from Colpa was selected for incorporation into the gummy candy formulations. This selection allowed the formulation stage to use the microencapsulate that exhibited the most favorable bioactive profile among the two geographical origins evaluated.
3.4. Effect of Formulation on the Bioactive Compounds of Gummy Candies
The experimental results of the mixture design for the bioactive variables evaluated in the gummy candies are presented in Table 5. The formulations differed in total phenolic compound content, antioxidant capacity, flavonoid content, and total carotenoid content. Formulation F6 showed the highest numerical values for all four responses evaluated; however, the significant differences among formulations depended on the variable considered. These results indicate that variations in the proportions of propolis/honey microencapsulate, goldenberry juice, and water modified the bioactive profile of the gummy candies. The data were fitted using linear mixture models, which were significant for all four response variables (p < 0.001), with coefficients of determination (R2) ranging from 0.8240 to 0.9897 and adjusted R2 values ranging from 0.8005 to 0.9884.
Table 5.
Bioactive compounds and antioxidant capacity of the gummy candy formulations.
The lack-of-fit analysis showed non-significant results for antioxidant capacity (p = 0.9830) and flavonoid content (p = 0.0923). In contrast, significant lack of fit was observed for total phenolic compounds (p < 0.001) and total carotenoids (p < 0.001). Nevertheless, the models exhibited high coefficients of determination, allowing the identification of general response trends within the experimental region, although predictive limitations remain for the variables showing significant lack of fit.
The variation in bioactive profile among the formulations is consistent with previous reports on functional gummy candies, in which the incorporation and proportion of ingredients rich in bioactive compounds can substantially modify the phenolic content and antioxidant capacity of the final product [13,14]. Likewise, the incorporation of propolis microcapsules into gummy matrices has been shown to increase phenolic compounds, flavonoids, and antioxidant capacity as the proportion of the functional ingredient increases [9].
An important consideration when interpreting the results is the absence of an unfortified gummy control. Previous studies have reported that gummy formulations without added propolis may exhibit measurable phenolic content and antioxidant activity, depending on the composition of the base matrix and other ingredients [14,32]. However, differences in formulation composition and analytical procedures prevent the direct extrapolation of these findings to the present study. Therefore, the contribution of the base matrix could not be independently quantified, and the reported values should be interpreted as the overall responses of the complete formulations rather than as contributions exclusively attributable to the incorporated bioactive ingredients.
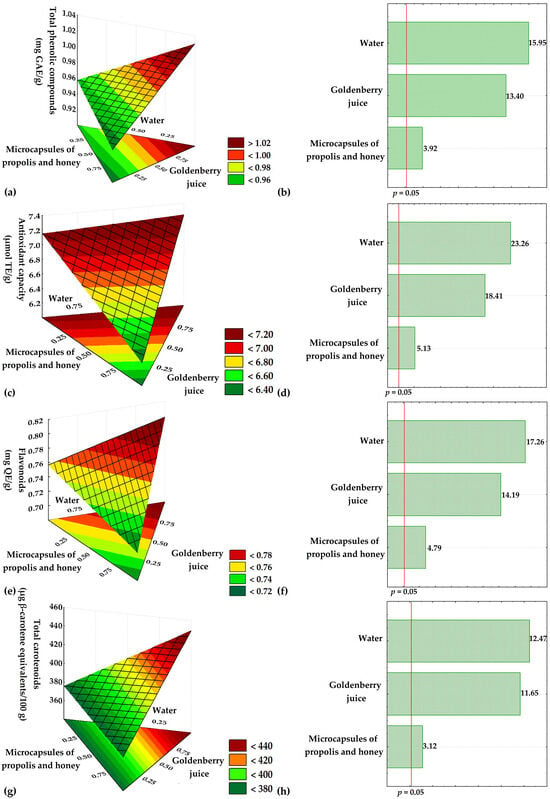
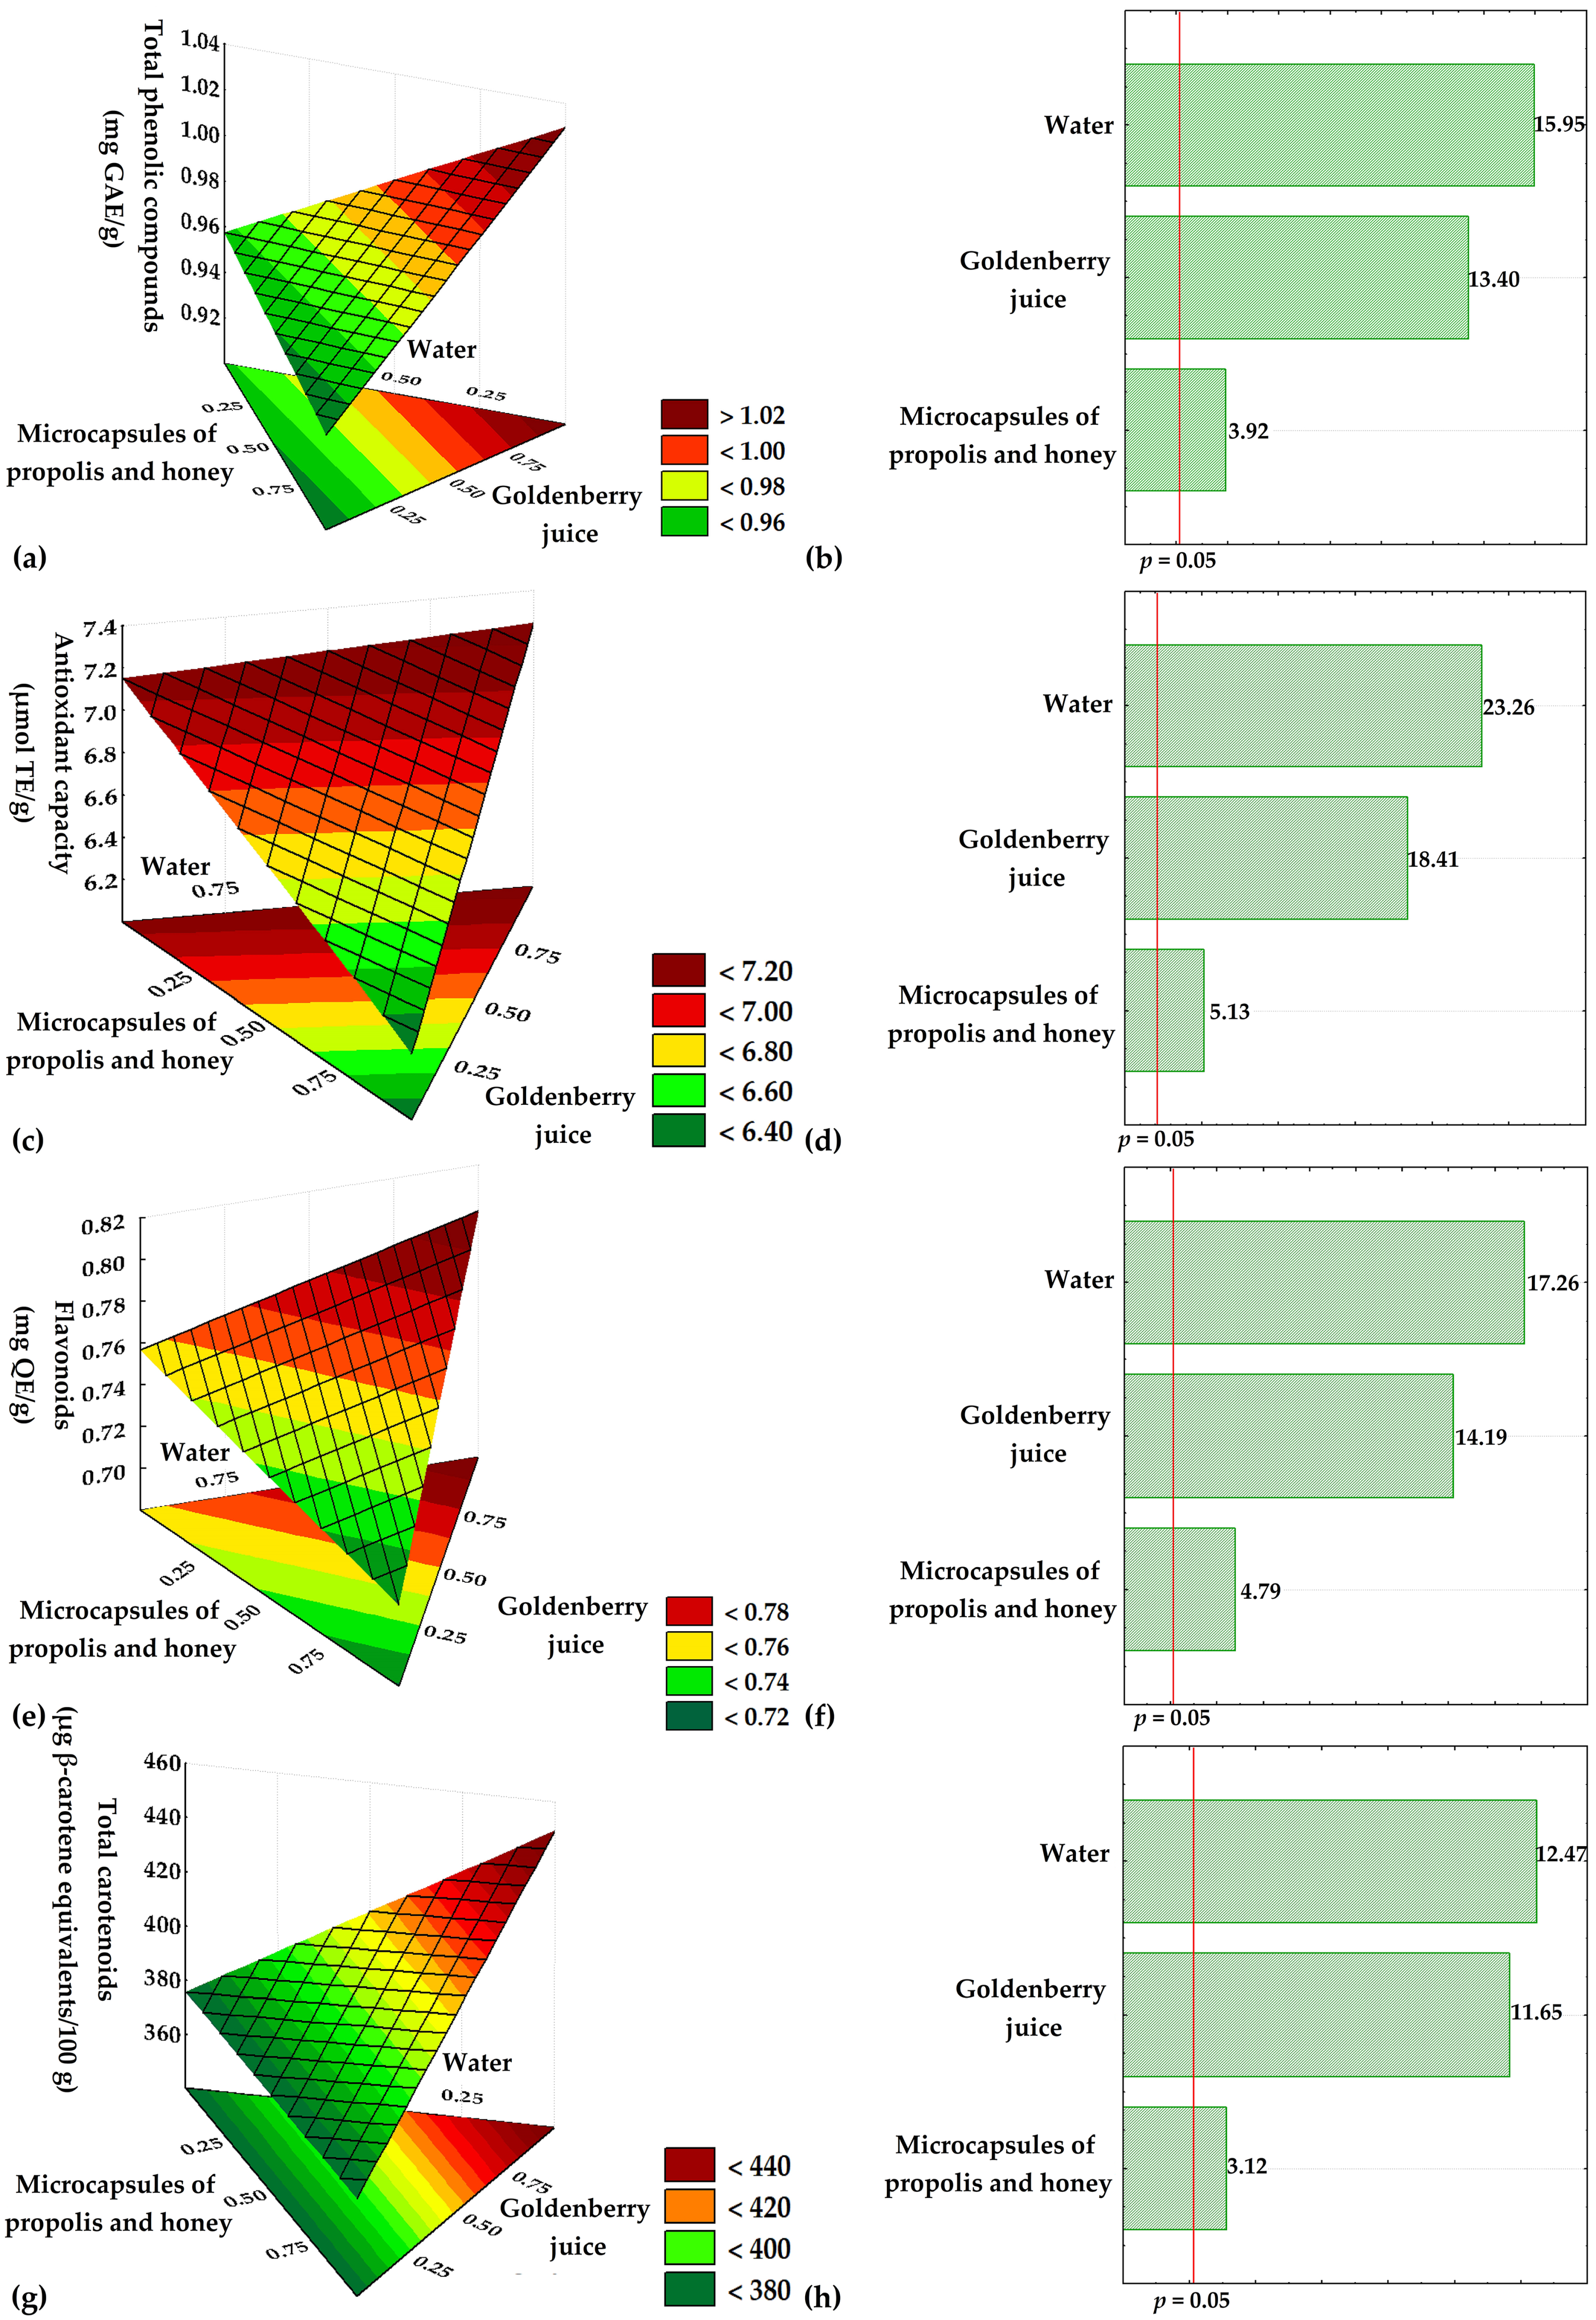
The response surfaces (Figure 3a,c,e,g) showed that the highest values of total phenolic compounds, antioxidant capacity, and flavonoids were located in regions characterized by higher proportions of propolis/honey microencapsulate and goldenberry juice. For total carotenoid content, the highest responses were mainly associated with a higher proportion of goldenberry juice, which is consistent with the carotenoid contribution of this fruit matrix.
Figure 3.
Response surfaces (a,c,e,g) and Pareto charts (b,d,f,h) for total phenolic compounds, antioxidant capacity, flavonoids, and total carotenoids of the gummy candies.
The observed behavior may be related to the complementary contribution of the bioactive components incorporated into the formulation. The microencapsulate primarily represents a source of phenolic compounds and flavonoids derived from propolis, whereas goldenberry provides a matrix rich in phenolic compounds and carotenoids with antioxidant activity [5,9,10]. This interpretation is consistent with the bioactive profile described for Physalis peruviana fruits grown in Andean regions of Peru, in which relevant contents of carotenoids and phenolic compounds associated with antioxidant capacity have been reported [33]. In particular, the observed association between a higher proportion of goldenberry juice and higher total carotenoid contents is consistent with the carotenoid profile previously described for this species [5].
The Pareto charts (Figure 3b,d,f,h) showed significant effects (p < 0.05) of the mixture components on the response variables. Water exhibited the greatest magnitude of standardized effect, followed by goldenberry juice, whereas the propolis/honey microencapsulate showed a smaller, although significant, contribution. Because of the nature of mixture designs, these effects should be interpreted considering that an increase in the proportion of one component necessarily implies a decrease in one or more of the remaining components.
The influence of water should be interpreted mainly as a dilution effect within the mixture system. Previous studies on gummy candies fortified with propolis microcapsules have shown that formulations with higher water content exhibit lower concentrations of phenolic compounds and flavonoids and lower antioxidant capacity, whereas a higher proportion of bioactive components favors these responses [9]. In addition to the dilution effect, water content may modify molecular mobility and interactions among gelatin, sugars, and other solutes present in the gummy matrix, thereby affecting its structural organization and system properties [34]. Therefore, the possibility that matrix characteristics may also influence the extraction and analytical recovery of bioactive compounds cannot be ruled out.
Formulation F6, containing 30% goldenberry juice, 7% propolis/honey microencapsulate, and 17.5% water, exhibited the highest bioactive responses among the formulations evaluated. The response obtained for F6 may be explained by the combination of the highest proportions of microencapsulate and goldenberry juice evaluated together with the lowest proportion of water. A similar trend has been observed in other gummy candy formulations containing propolis, in which combinations with greater incorporation of functional ingredients achieved higher levels of phenolic compounds and antioxidant capacity [9,14]. These results demonstrate that formulation can modulate the bioactive profile of the product through the balance between functional components and the aqueous phase.
3.5. FTIR Characterization
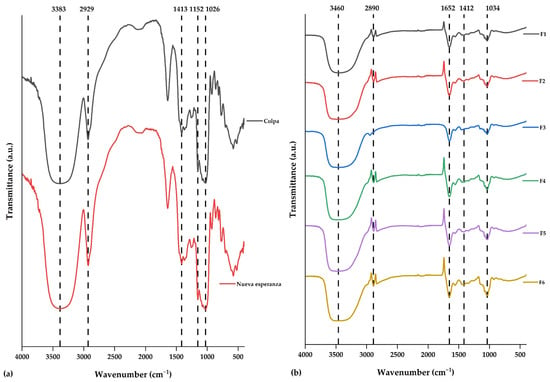
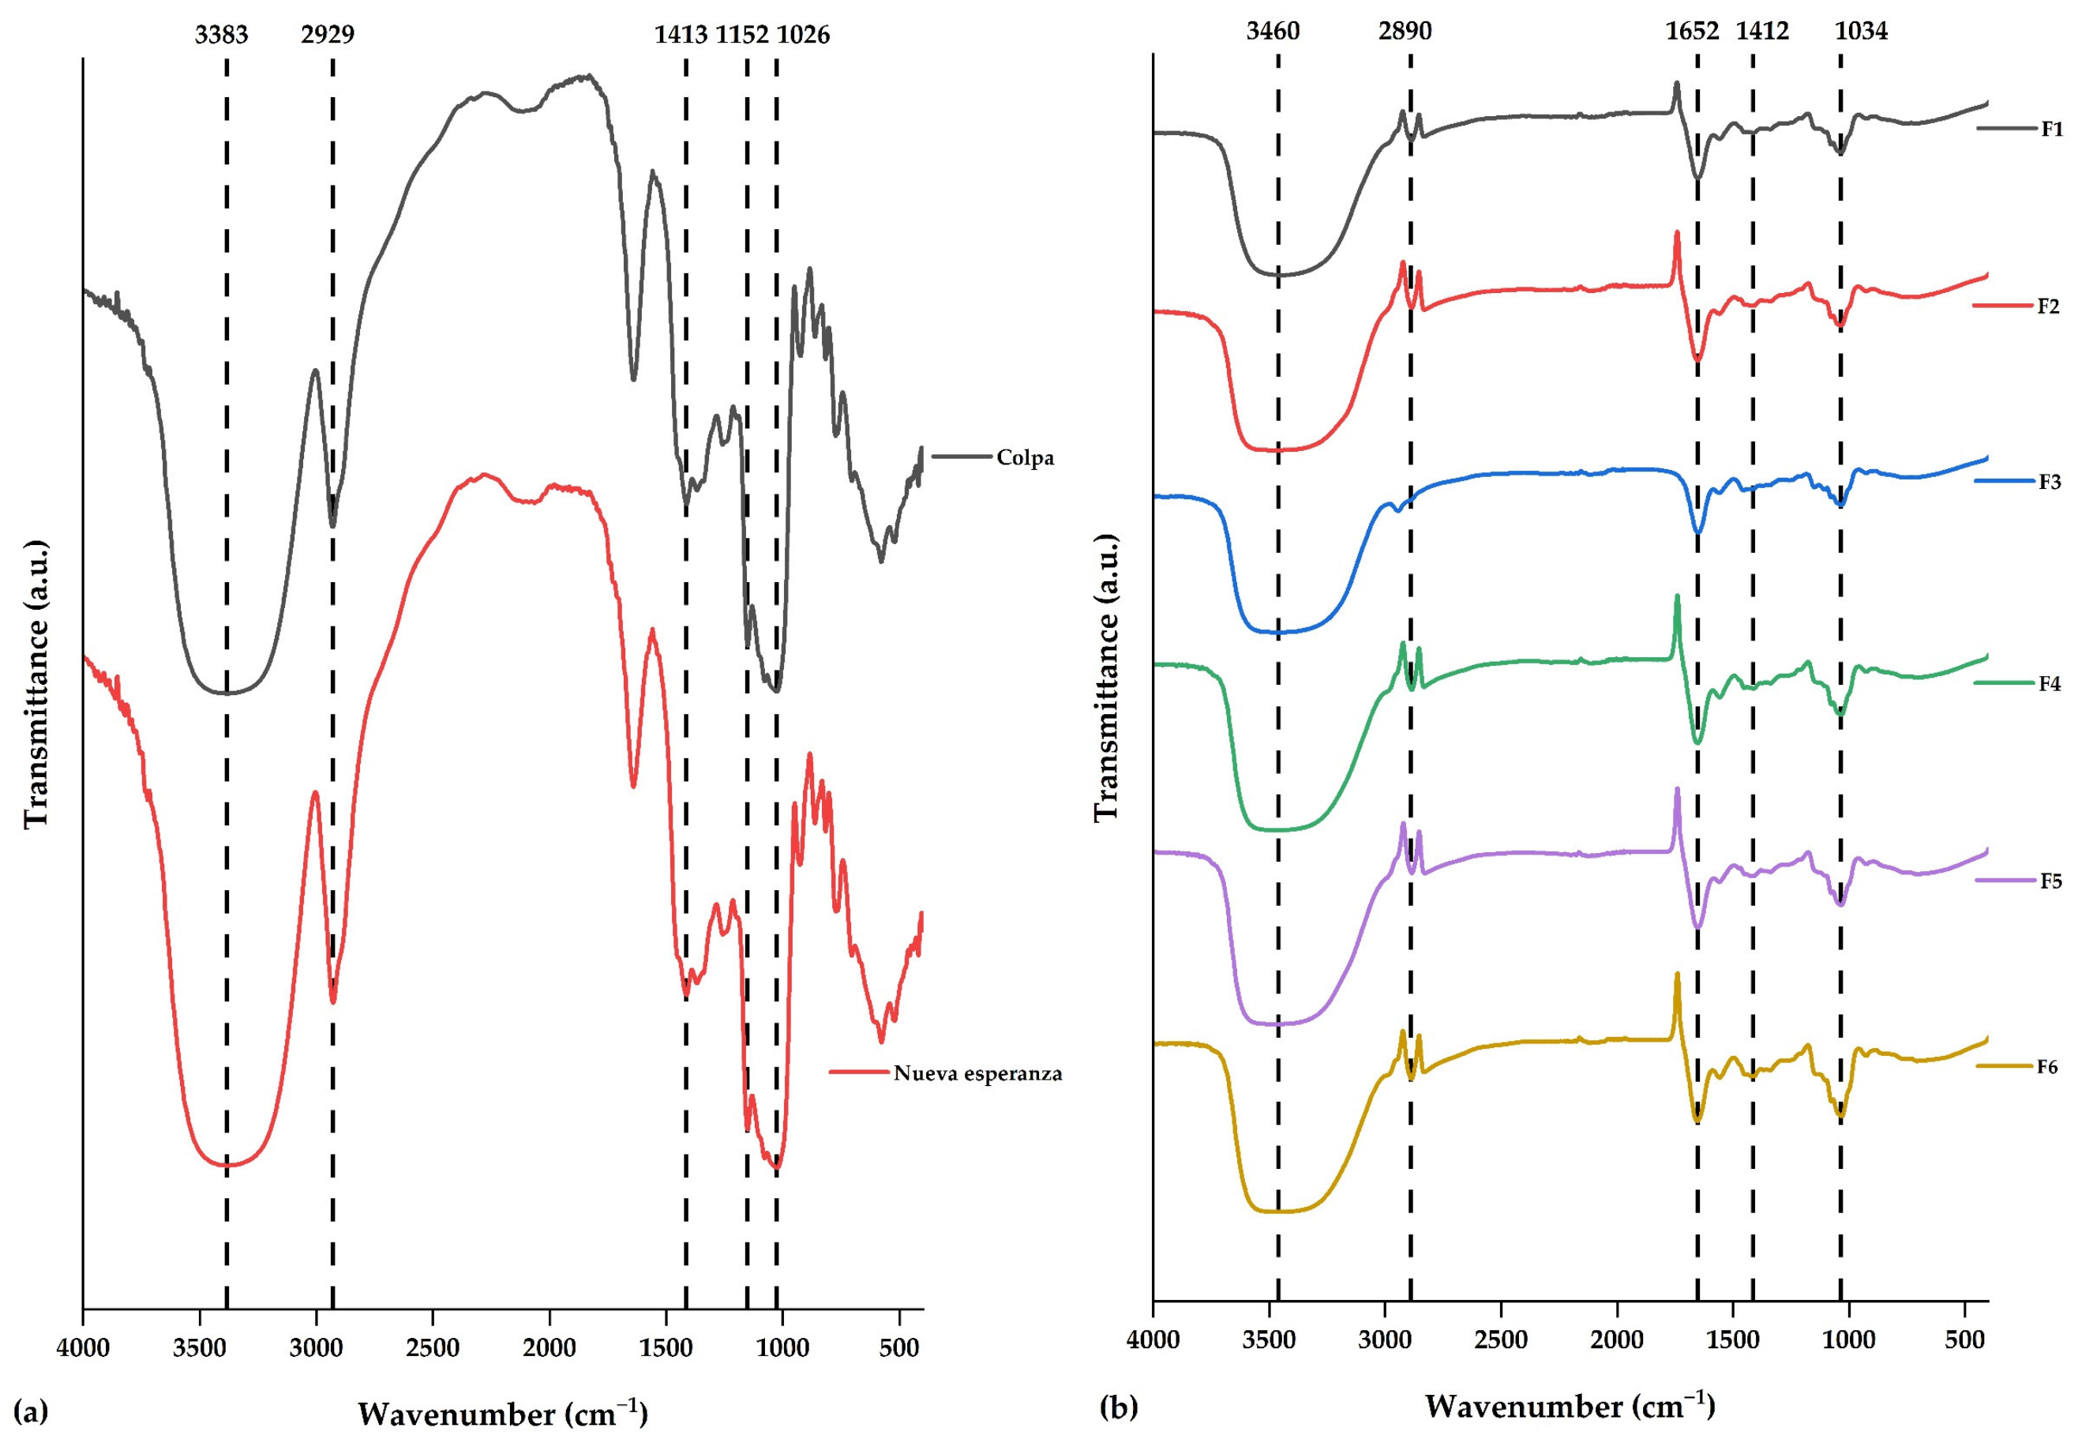
Figure 4 shows the FTIR spectra of the microencapsulates prepared with propolis from Colpa and Nueva Esperanza, as well as those of the gummy candy formulations F1–F6. Similar spectral profiles were observed for the microencapsulates (Figure 4a). The broad band near 3383 cm−1 may be associated with O–H stretching vibrations of hydroxyl groups present in phenolic compounds and carbohydrates of the encapsulating matrix, whereas the signal around 2929 cm−1 mainly corresponds to C–H stretching vibrations of aliphatic groups. The bands located around 1413, 1152, and 1026 cm−1 may be related to vibrations of C–H, C–O, and C–O–C groups, mainly present in the polysaccharides used as wall materials. Although differences in the intensity of some signals were observed, both microencapsulates retained a similar spectral pattern.
Figure 4.
FTIR spectra of (a) the microencapsulates prepared with Colpa and Nueva Esperanza propolis and (b) the gummy candy formulations F1–F6.
This spectral pattern is consistent with that previously described for microencapsulated propolis systems, in which hydroxyl groups, aliphatic structures, and C–O and C–O–C bonds associated with propolis compounds and encapsulating materials have been identified [7,9,10,35]. The broad band in the 3300–3500 cm−1 region is consistent with the presence of hydroxyl groups from maltodextrin, tara gum galactomannans, sugars, and phenolic compounds, which are capable of participating in hydrogen-bonding interactions [29,36]. The retention of the main bands and the absence of new signals or pronounced shifts suggest that encapsulation was mainly governed by non-covalent interactions between the core and the wall materials rather than by the formation of new chemical bonds [9,36,37].
Characteristic bands were identified in the gummy candy formulations (Figure 4b). The broad band around 3460 cm−1 is associated with O–H stretching vibrations, whereas the signal near 2890 cm−1 corresponds to C–H vibrations of aliphatic groups. The band around 1652 cm−1 may be related to carbonyl groups and characteristic vibrations of the gelatin protein matrix, whereas the signals near 1412 and 1034 cm−1 are mainly associated with C–H and C–O/C–O–C vibrations of the carbohydrates present in the formulation. These signals are consistent with a food matrix composed mainly of gelatin and carbohydrates, together with the functional groups contributed by the microencapsulate and goldenberry juice. The presence of bands in similar regions has previously been described in microencapsulated propolis systems [9,10].
The spectra of F1–F6 showed similar positions for the main bands, with variations mainly in their relative intensities. The absence of pronounced shifts or new bands indicates that the formulations retained a similar chemical profile, suggesting that differences in ingredient proportions did not produce major structural changes detectable by FTIR. This behavior is consistent with systems in which physical associations among the components predominate and the characteristic bands of the raw materials are retained [9,10,37].
3.6. Sensory Evaluation and Preference
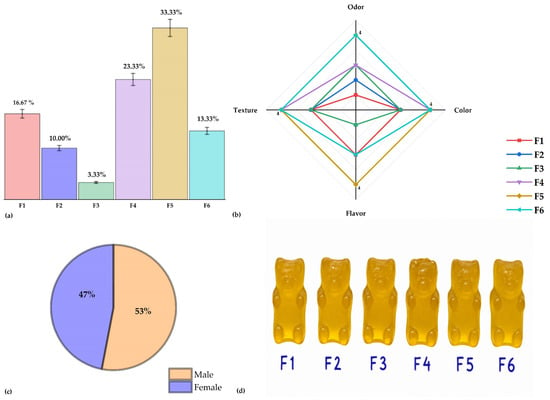
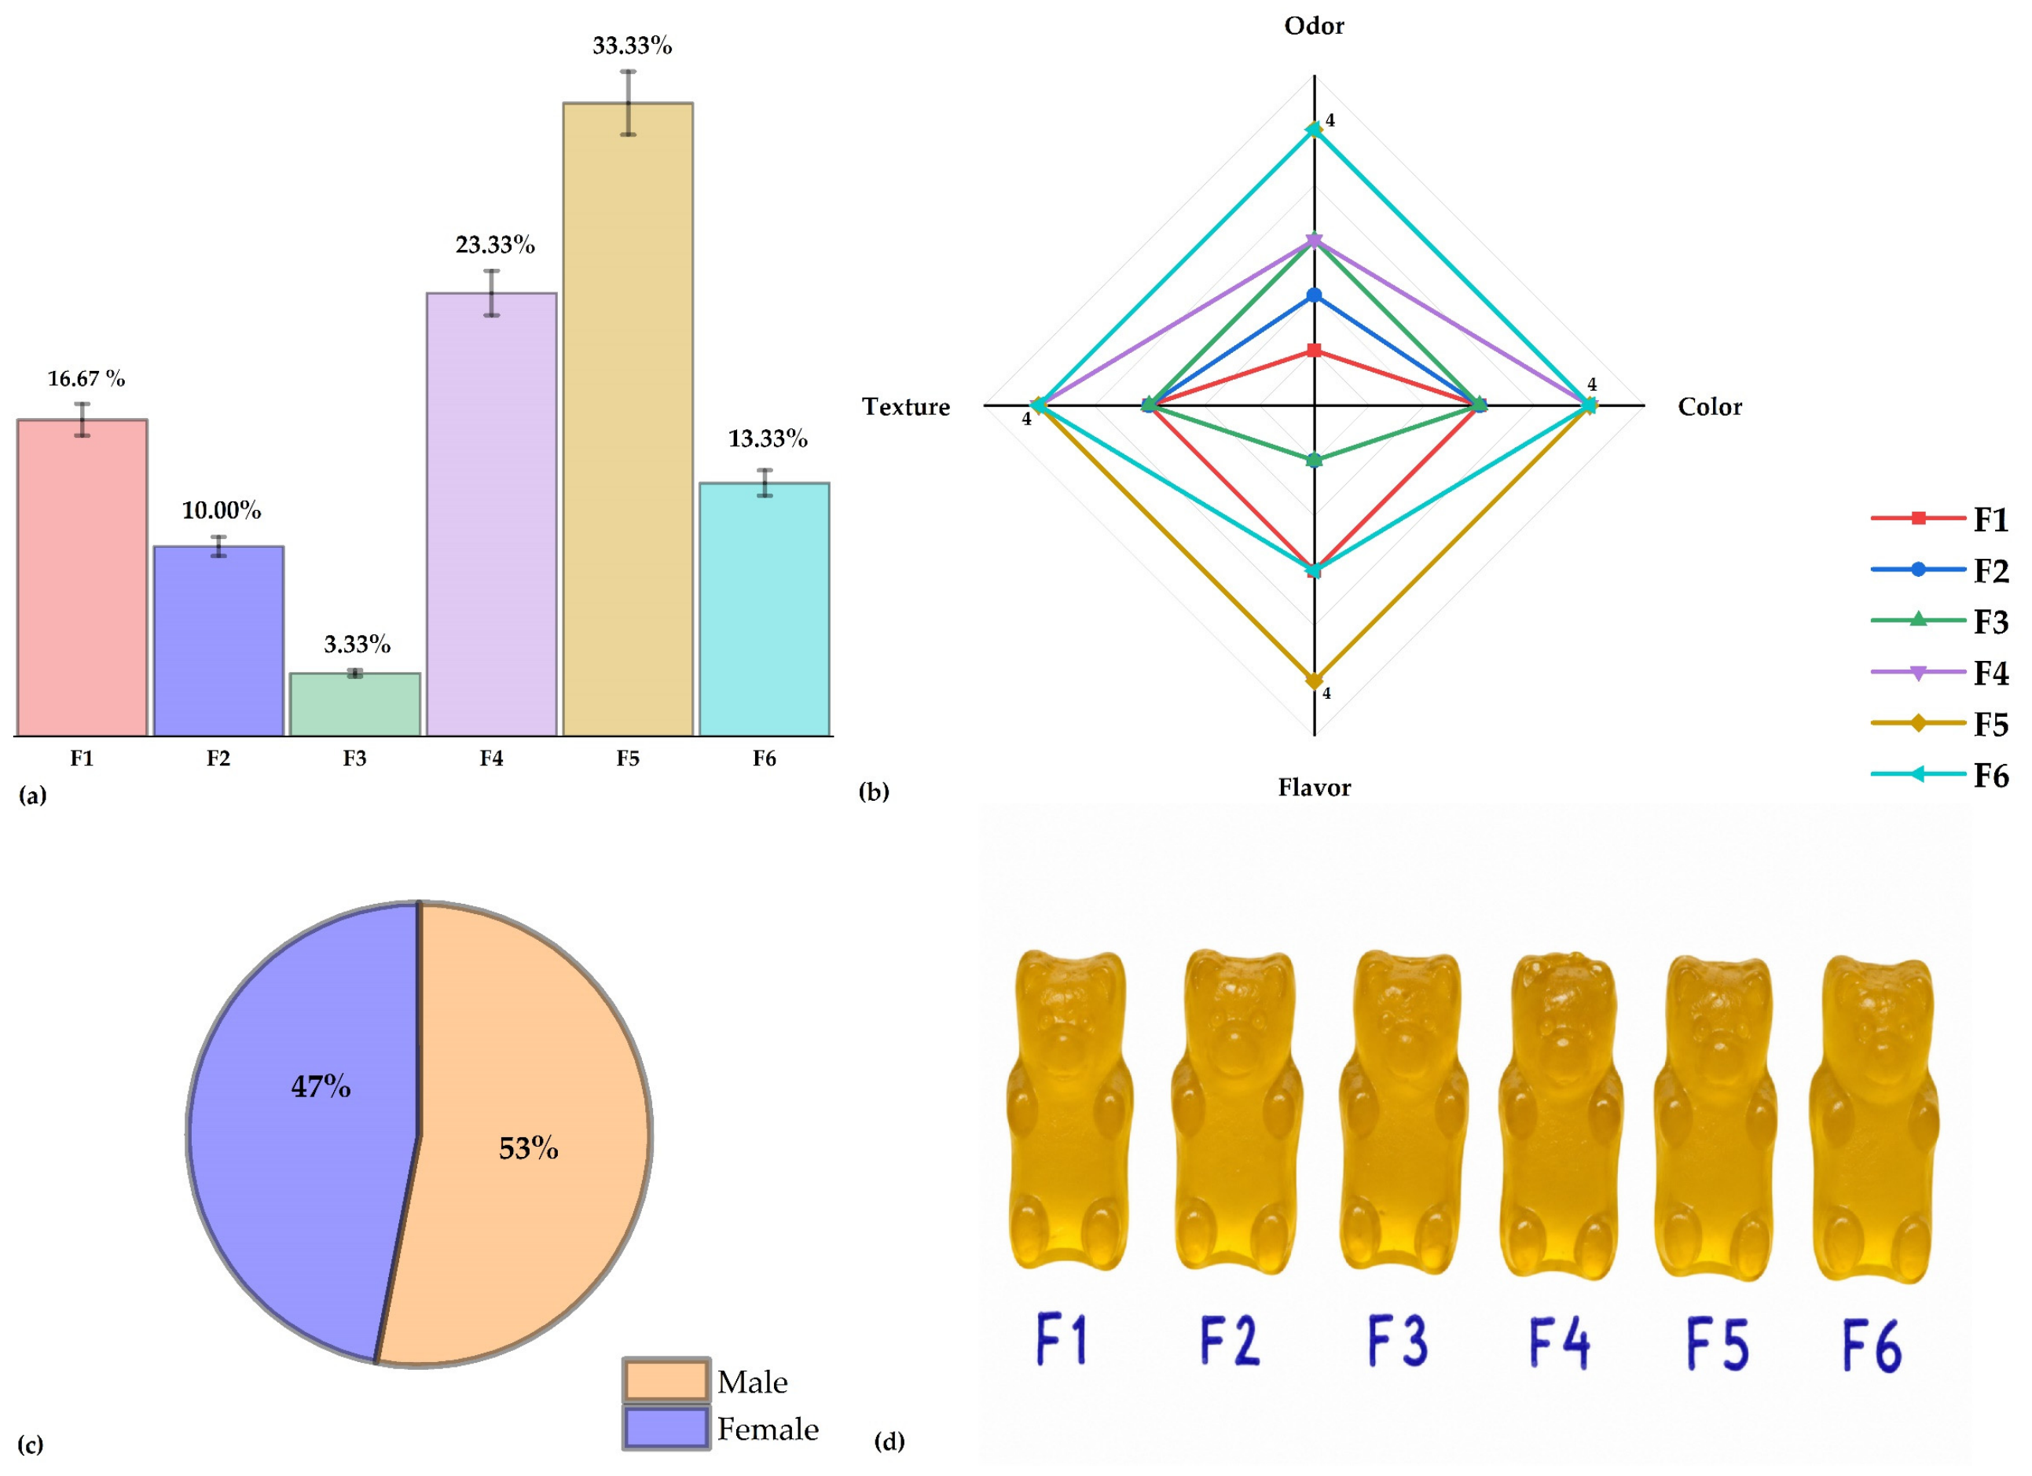
The results of the sensory acceptance test showed differences among the formulations for the attributes evaluated (Table 6). For odor, F5 and F6 received the highest ratings, whereas F1 obtained the lowest score. For color and texture, F4, F5, and F6 received higher ratings than F1, F2, and F3. For flavor, the highest scores were obtained by F4 and F5, followed by F1 and F6, whereas F2 and F3 received the lowest ratings. Thus, F5 stood out for receiving favorable ratings for all four sensory attributes evaluated.
Table 6.
Attribute scores obtained in the sensory acceptance test of gummy candies.
These results indicate that sensory acceptance depended on the balance among the formulation components rather than solely on increasing the proportion of microencapsulate or goldenberry juice. In functional gummy candies, the incorporation of bioactive ingredients may simultaneously modify attributes such as flavor, odor, color, and texture; therefore, their proportion is a determining factor in product acceptance [13,14,16].
The preference test (Figure 5a) showed that F5 was the most frequently selected formulation, accounting for 33.33% of the responses, followed by F4 with 23.33%. The remaining formulations showed lower preference percentages. The sensory profile (Figure 5b) allowed comparison of odor, color, flavor, and texture ratings among the six formulations, confirming the favorable performance of F5, which received positive ratings for all attributes evaluated. The distribution of participants by sex was 53% male and 47% female (Figure 5c). The visual appearance of the formulations is shown in Figure 5d.
Figure 5.
Formulation preference (a), sensory profile of color, odor, flavor, and texture (b), percentage distribution of panelists by sex (c), and visual appearance of formulations F1–F6 (d).
The higher preference for F5 is consistent with the results of the acceptance test and suggests that this formulation achieved an appropriate balance among the sensory characteristics of the propolis/honey microencapsulate, goldenberry juice, and the other components of the gummy matrix. Acceptance of this type of product depends on ensuring that the incorporation of bioactive ingredients does not produce unfavorable changes in attributes that are important to consumers, particularly flavor, odor, and texture [13,14]. Although F6 showed the highest bioactive responses, its lower preference compared with F5 may be related to the higher proportion of microencapsulate incorporated. It has been reported that microencapsulated propolis can be successfully incorporated into confectionery products, although its proportion may influence the sensory characteristics of the matrix [30]. Overall, these results indicate that a greater bioactive response does not necessarily translate into higher sensory acceptance; therefore, both aspects should be considered jointly when selecting the formulation.
3.7. Proximate Composition and Textural Properties of the Formulation with the Highest Sensory Acceptance
The proximate composition and textural properties of formulation F5, selected because it showed the highest sensory acceptance among the evaluated formulations, are presented in Table 7. This formulation was characterized by a predominance of carbohydrates, followed by protein and moisture, whereas fat and ash contents were comparatively low. The energy value was 339.10 kcal/100 g. Regarding the texture profile, F5 exhibited a hardness of 2.46 ± 0.70 N, together with cohesiveness, adhesiveness, springiness, and resilience values of 1.04 ± 0.04, 0.10 ± 0.07 mJ, 2.87 ± 0.05 mm, and 0.66 ± 0.06, respectively.
Table 7.
Proximate composition, energy value, and textural properties of formulation F5.
The compositional profile of F5 is consistent with the nature of gummy candies, in which sugars and other formulation solids constitute an important fraction of the product. The moisture content obtained falls within the range of 13.00–17.95% reported for functional gummy candies prepared with natural antioxidants [38]. The protein content, in turn, may be mainly related to the proportion of gelatin used as the gelling agent. The proximate composition of this type of product may vary considerably depending on the functional ingredients and hydrocolloids used in its preparation [38,39].
The textural properties of gummy candies depend on the structure of the gel network and on the interactions among water, gelatin, sugars, and the other formulation components. Water can act as a plasticizer and modify the mobility of gelatin chains, whereas sugars affect water availability and interactions within the network, thereby influencing properties such as firmness and gel recovery [34]. Studies on gummies prepared with honey, gelatin, and propolis have shown that variations in these ingredients significantly modify properties such as hardness, adhesiveness, and resilience [32]. Likewise, the incorporation of propolis into gelled matrices may alter their textural behavior depending on the concentration used and the composition of the system [14,32]. In gummy candies fortified with microencapsulated propolis, hardness values of 1.41–2.58 N, cohesiveness of 0.87–0.97, springiness of 3.02–3.12 mm, and resilience of 0.50–0.56 have been reported [9], which are close to those obtained for F5. In particular, the hardness of F5 (2.46 N) falls within this range, whereas its cohesiveness (1.04) and resilience (0.66) were slightly higher and its springiness (2.87 mm) was slightly lower. These characteristics are relevant because of their relationship with texture perception during consumption [16].
Furthermore, the gelatin–sugar matrix may influence the release and bioaccessibility of phenolic compounds and carotenoids during gastrointestinal digestion. Interactions between bioactive compounds and matrix components may affect their release under digestive conditions. Although bioaccessibility was not evaluated in the present study, future research should consider these matrix effects and employ standardized in vitro gastrointestinal digestion protocols to assess the bioaccessibility of the incorporated bioactive compounds [40].
4. Conclusions
The combination of propolis/honey microencapsulates with goldenberry juice made it possible to obtain gummy candies with differentiated bioactive and sensory profiles depending on the proportions of the components. The microencapsulate prepared with Colpa propolis exhibited the most favorable bioactive profile among the two geographical origins evaluated and showed physicochemical, morphological, and thermal characteristics compatible with its incorporation into the gummy matrix. In the formulations, higher proportions of microencapsulate and goldenberry juice, together with a lower proportion of water, were associated with higher contents of phenolic compounds, flavonoids, and total carotenoids, as well as greater antioxidant capacity, with the highest bioactive responses observed in F6. However, F5 showed the highest consumer preference and favorable ratings for the sensory attributes evaluated, indicating that a greater bioactive response does not necessarily result in higher sensory acceptance. Proximate and textural characterization of F5 showed a product composed predominantly of carbohydrates and proteins, with a textural profile characteristic of a gummy matrix. Overall, the results support the technological feasibility of incorporating propolis/honey microencapsulates together with goldenberry juice into gummy candies under the experimental conditions evaluated. A limitation of this study is the absence of formal botanical authentication and a voucher specimen for the goldenberry fruits. Although the propolis samples and gummy formulations were physicochemically and bioactively characterized, certain limitations related to the botanical origin of propolis, surrounding flora, the absence of an unfortified gummy control, and specific analytical and stability assessments should be acknowledged. Future studies should address these aspects and further evaluate storage stability and the bioaccessibility of bioactive compounds under simulated gastrointestinal conditions.
Author Contributions
Conceptualization, C.A.L.-S. and W.P.O.; methodology, D.C.-Q., D.J.C.-M., G.D.l.C. and J.A.-C.; software, J.C.M.-S. and U.R.Q.-Q.; validation, L.A.M.-P. and A.G.V.-S.; formal analysis, J.C.M.-S., U.R.Q.-Q., L.A.M.-P. and A.G.V.-S.; investigation, F.T.-P., D.J.C.-M., G.D.l.C., J.A.-C., J.C.M.-S., U.R.Q.-Q., L.A.M.-P. and A.G.V.-S.; data curation, C.A.L.-S. and W.P.O.; writing—original draft preparation, D.C.-Q. and D.J.C.-M.; writing—review and editing, F.T.-P., G.D.l.C. and J.A.-C.; supervision, G.D.l.C.; project administration, C.A.L.-S. All authors have read and agreed to the published version of the manuscript.
Funding
This research received no external funding.
Institutional Review Board Statement
The study was reviewed and approved by the corresponding institutional ethics committee.
Informed Consent Statement
Informed consent was obtained from all subjects involved in the study.
Data Availability Statement
Data are available within the article.
Acknowledgments
The authors acknowledge the Research Group on Nutraceuticals and Biomaterials of the UNAJMA. Grammarly was used solely for language support, and the authors take full responsibility for the final content.
Conflicts of Interest
The authors declare no conflicts of interest.
References
- Abedelmaksoud, T.G.; Younis, M.I.; Altemimi, A.B.; Tlay, R.H.; Ali Hassan, N. Bioactive Compounds of Plant-Based Food: Extraction, Isolation, Identification, Characteristics, and Emerging Applications. Food Sci. Nutr. 2025, 13, e70351. [Google Scholar] [CrossRef] [Scilit] [PubMed]
- Shen, N.; Wang, T.; Gan, Q.; Liu, S.; Wang, L.; Jin, B. Plant flavonoids: Classification, distribution, biosynthesis, and antioxidant activity. Food Chem. 2022, 383, 132531. [Google Scholar] [CrossRef] [Scilit] [PubMed]
- Rutkowska, J.; Pasqualone, A. Plant Extracts as Functional Food Ingredients. Foods 2025, 14, 374. [Google Scholar] [CrossRef] [Scilit] [PubMed]
- Luiza Koop, B.; Nascimento da Silva, M.; Diniz da Silva, F.; Thayres dos Santos Lima, K.; Santos Soares, L.; José de Andrade, C.; Ayala Valencia, G.; Rodrigues Monteiro, A. Flavonoids, anthocyanins, betalains, curcumin, and carotenoids: Sources, classification and enhanced stabilization by encapsulation and adsorption. Food Res. Int. 2022, 153, 110929. [Google Scholar] [CrossRef] [Scilit] [PubMed]
- Naranjo-Durán, A.M.; Quintero-Quiroz, J.; Ciro-Gómez, G.L.; Barona-Acevedo, M.-J.; Contreras-Calderón, J.d.C. Characterization of the antioxidant activity, carotenoid profile by HPLC-MS of exotic colombian fruits (goldenberry and purple passion fruit) and optimization of antioxidant activity of this fruit blend. Heliyon 2023, 9, e17819. [Google Scholar] [CrossRef] [Scilit] [PubMed]
- Tsuda, T.; Kumazawa, S. Propolis: Chemical Constituents, Plant Origin, and Possible Role in the Prevention and Treatment of Obesity and Diabetes. J. Agric. Food Chem. 2021, 69, 15484–15494. [Google Scholar] [CrossRef] [Scilit] [PubMed]
- Ligarda-Samanez, C.A.; Choque-Quispe, D.; Moscoso-Moscoso, E.; Huamán-Carrión, M.L.; Ramos-Pacheco, B.S.; Peralta-Guevara, D.E.; Cruz, G.D.; Martínez-Huamán, E.L.; Arévalo-Quijano, J.C.; Muñoz-Saenz, J.C.; et al. Obtaining and Characterizing Andean Multi-Floral Propolis Nanoencapsulates in Polymeric Matrices. Foods 2022, 11, 3153. [Google Scholar] [CrossRef] [Scilit] [PubMed]
- Tavares, L.; Smaoui, S.; Lima, P.S.; de Oliveira, M.M.; Santos, L. Propolis: Encapsulation and application in the food and pharmaceutical industries. Trends Food Sci. Technol. 2022, 127, 169–180. [Google Scholar] [CrossRef] [Scilit]
- Ligarda-Samanez, C.A.; Choque-Quispe, D.; Palomino-Rincón, H.; Moscoso-Moscoso, E.; Guzmán Gutiérrez, R.J.; Banda Mozo, I. Microencapsulation of Propolis by Complex Coacervation with Chia Mucilage and Gelatin: Antioxidant Stability and Functional Potential. Antioxidants 2025, 14, 845. [Google Scholar] [CrossRef] [Scilit] [PubMed]
- Ligarda-Samanez, C.A.; Choque-Quispe, D.; Moscoso-Moscoso, E.; Huamán-Carrión, M.L.; Ramos-Pacheco, B.S.; De la Cruz, G.; Arévalo-Quijano, J.C.; Muñoz-Saenz, J.C.; Muñoz-Melgarejo, M.; Quispe-Quezada, U.R.; et al. Microencapsulation of Propolis and Honey Using Mixtures of Maltodextrin/Tara Gum and Modified Native Potato Starch/Tara Gum. Foods 2023, 12, 1873. [Google Scholar] [CrossRef] [Scilit] [PubMed]
- Málaga Barreda, R.; Guevara Pérez, A.; Araujo Vargas, M. Efecto del procesamiento de puré de aguaymanto (Physalis peruviana L.), sobre los compuestos bioactivos y la capacidad antioxidante. Rev. Soc. Quím. Perú 2013, 79, 162–174. [Google Scholar]
- Teixeira, B.J.; Ataurima, I.M.A.; Inca, L.S.V.; Llica, E.R.; Manrique, P.E.H.; Alfaro, K.M.d.C.A.; Cotos, M.R.C. Evaluación del contenido de polifenoles totales y la capacidad antioxidante de los extractos etanólicos de los frutos de aguaymanto (Physalis peruviana L.) de diferentes lugares del Perú. Rev. Soc. Quím. Perú 2016, 82, 272–279. [Google Scholar] [CrossRef] [Scilit]
- Tarahi, M.; Tahmouzi, S.; Kianiani, M.R.; Ezzati, S.; Hedayati, S.; Niakousari, M. Current Innovations in the Development of Functional Gummy Candies. Foods 2024, 13, 76. [Google Scholar] [CrossRef] [Scilit] [PubMed]
- Cedeño-Pinos, C.; Marcucci, M.C.; Bañón, S. Contribution of Green Propolis to the Antioxidant, Physical, and Sensory Properties of Fruity Jelly Candies Made with Sugars or Fructans. Foods 2021, 10, 2586. [Google Scholar] [CrossRef] [Scilit] [PubMed]
- Alves, M.J.d.S.; Chacon, W.D.C.; Rodrigues Monteiro, A.; Ayala Valencia, G. Gelatin Candies Architected with Active Starch Nanoparticles Containing Phenolic Compounds from Propolis Extract. Starch-Stärke 2024, 76, 2300162. [Google Scholar] [CrossRef] [Scilit]
- Renaldi, G.; Junsara, K.; Jannu, T.; Sirinupong, N.; Samakradhamrongthai, R.S. Physicochemical, textural, and sensory qualities of pectin/gelatin gummy jelly incorporated with Garcinia atroviridis and its consumer acceptability. Int. J. Gastron. Food Sci. 2022, 28, 100505. [Google Scholar] [CrossRef] [Scilit]
- Ligarda-Samanez, C.A.; Choque-Quispe, D.; Ramos-Pacheco, B.S.; Yanahuillca-Vargas, A.; Huamán-Carrión, M.L.; Moscoso-Moscoso, E.; Palomino-Rincón, H. Comparación taxonómica, fisicoquímica, fenólica y antioxidante en especies de frutos silvestres altoandinos: Rubus y Hesperomeles. Acta Agronómica 2025, 72, 30–37. [Google Scholar] [CrossRef] [Scilit]
- Soria-Melgarejo, G.; Raya-Pérez, J.C.; Ramírez-Pimentel, J.G.; Covarrubias-Prieto, J.; Gutiérrez-Benicio, G.M.; Andrade-González, I.; Aguirre-Mancilla, C.L. Physicochemical, nutritional properties, and antioxidant potential of ‘limilla’ fruit (Rhus aromatica var. schmidelioides (Schltdl.) Engl.). Heliyon 2024, 10, e34990. [Google Scholar] [CrossRef] [Scilit] [PubMed]
- Ligarda-Samanez, C.A.; Choque-Quispe, D.; Moscoso-Moscoso, E.; Ramos-Pacheco, B.S.; Palomino-Rincón, H.; Peralta-Guevara, D.E. Microencapsulation of bioactive compounds from Hesperomeles escalloniifolia Schltdl (Capachu) in quinoa starch and Tara Gum. CyTA-J. Food 2025, 23, 2564354. [Google Scholar] [CrossRef] [Scilit]
- Ligarda-Samanez, C.A.; Palomino-Rincón, H.; Choque-Quispe, D.; Moscoso-Moscoso, E.; Arévalo-Quijano, J.C.; Huamán-Carrión, M.L.; Quispe-Quezada, U.R.; Muñoz-Saenz, J.C.; Gutiérrez-Gómez, E.; Cabel-Moscoso, D.J.; et al. Bioactive Compounds and Sensory Quality in Chips of Native Potato Clones (Solanum tuberosum spp. andigena) Grown in the High Andean Region of PERU. Foods 2023, 12, 2511. [Google Scholar] [CrossRef] [Scilit] [PubMed]
- Pant, K.; Sharma, A.; Chopra, H.K.; Nanda, V. Impact of biodiversification on propolis composition, functionality, and application in foods as natural preservative: A review. Food Control 2024, 155, 110097. [Google Scholar] [CrossRef] [Scilit]
- Zhang, Y.; Cao, C.; Yang, Z.; Jia, G.; Liu, X.; Li, X.; Cui, Z.; Li, A. Simultaneous determination of 20 phenolic compounds in propolis by HPLC-UV and HPLC-MS/MS. J. Food Compos. Anal. 2023, 115, 104877. [Google Scholar] [CrossRef] [Scilit]
- Embaby, H.E.-S.; Mokhtar, S.M. Impact of adding goldenberry (Physalis peruviana L.) on some quality characteristics and bio-functional properties of pasteurized carrot (Daucus carota L.) nectar. J. Food Sci. Technol. 2019, 56, 966–975. [Google Scholar] [CrossRef] [Scilit] [PubMed]
- Aladhadh, M.; Ebrahim, H.N.E.-D.A.E.-K.; Ahmed, R.M.; Al-Saman, M.A.; Ramadan, M.F.; Elsanhoty, R.M.; Abou-Elazm, F.I. Goldenberry (Physalis peruviana L.) juice inhibits foodborne pathogens while promoting probiotic bacterial growth. Sci. Rep. 2026, 16, 22389. [Google Scholar] [CrossRef] [Scilit] [PubMed]
- Pant, K.; Thakur, M.; Chopra, H.K.; Nanda, V. Encapsulated bee propolis powder: Drying process optimization and physicochemical characterization. LWT 2022, 155, 112956. [Google Scholar] [CrossRef] [Scilit]
- Busch, V.M.; Pereyra-Gonzalez, A.; Šegatin, N.; Santagapita, P.R.; Poklar Ulrih, N.; Buera, M.P. Propolis encapsulation by spray drying: Characterization and stability. LWT 2017, 75, 227–235. [Google Scholar] [CrossRef] [Scilit]
- Andrade, J.K.S.; Denadai, M.; Andrade, G.R.S.; da Cunha Nascimento, C.; Barbosa, P.F.; Jesus, M.S.; Narain, N. Development and characterization of microencapsules containing spray dried powder obtained from Brazilian brown, green and red propolis. Food Res. Int. 2018, 109, 278–287. [Google Scholar] [CrossRef] [Scilit] [PubMed]
- Vareltzis, P.; Stergiou, A.; Kalinderi, K.; Chamilaki, M. Antioxidant Potential of Spray- and Freeze-Dried Extract from Oregano Processing Wastes, Using an Optimized Ultrasound-Assisted Method. Foods 2023, 12, 2628. [Google Scholar] [CrossRef] [Scilit] [PubMed]
- Moscoso-Moscoso, E.; Ligarda-Samanez, C.A.; Choque-Quispe, D.; Huamán-Carrión, M.L.; Arévalo-Quijano, J.C.; De la Cruz, G.; Luciano-Alipio, R.; Calsina Ponce, W.C.; Sucari-León, R.; Quispe-Quezada, U.R.; et al. Preliminary Assessment of Tara Gum as a Wall Material: Physicochemical, Structural, Thermal, and Rheological Analyses of Different Drying Methods. Polymers 2024, 16, 838. [Google Scholar] [CrossRef] [Scilit] [PubMed]
- Gargouri, W.; Elleuche, M.; Fernández-Muiño, M.A.; Sancho, M.T.; Osés, S.M. Microencapsulated propolis powder: A promising ingredient of chewing gum. Powder Technol. 2024, 440, 119777. [Google Scholar] [CrossRef] [Scilit]
- Ballesteros, L.F.; Ramirez, M.J.; Orrego, C.E.; Teixeira, J.A.; Mussatto, S.I. Encapsulation of antioxidant phenolic compounds extracted from spent coffee grounds by freeze-drying and spray-drying using different coating materials. Food Chem. 2017, 237, 623–631. [Google Scholar] [CrossRef] [Scilit] [PubMed]
- Kaewpetch, K.; Yolsuriyan, S.; Disayathanoowat, T.; Phokasem, P.; Jannu, T.; Renaldi, G.; Samakradhamrongthai, R.S. Influence of Gelatin and Propolis Extract on Honey Gummy Jelly Properties: Optimization Using D-Optimal Mixture Design. Gels 2024, 10, 282. [Google Scholar] [CrossRef] [Scilit] [PubMed]
- Obregón-La Rosa, A.J.; Contreras-López, E.; Flores Juárez, E.; Gonzales Barrón, Ú.; Muñoz, A.M.; Ramos-Escudero, F. Nutritional and antioxidant profile of the Physalis fruit grown in three Andean regions of Peru. Rocz. Panstw. Zakl. Hig. 2023, 74, 49–57. [Google Scholar] [CrossRef] [Scilit] [PubMed]
- Wang, R.; Hartel, R.W.; Zhai, X.; Fu, W.; Sun, Y.; Wang, S. Phase separation and gelation of gelatin-glucose syrup mixtures and gummy confections: Effects of moisture content, sugars, citric acid, and citrates. Food Hydrocoll. 2024, 153, 110006. [Google Scholar] [CrossRef] [Scilit]
- Nandiyanto, A.B.D.; Oktiani, R.; Ragadhita, R. How to read and interpret FTIR spectroscope of organic material. Indones. J. Sci. Technol. 2019, 4, 97–118. [Google Scholar] [CrossRef] [Scilit]
- Rigolon, T.C.B.; Silva, R.R.A.; de Oliveira, T.V.; Nascimento, A.L.A.A.; de Barros, F.A.R.; Martins, E.; Campelo, P.H.; Stringheta, P.C. Exploring anthocyanins-polysaccharide synergies in microcapsule wall materials via spray drying: Interaction characterization and evaluation of particle stability. Meas. Food 2024, 13, 100126. [Google Scholar] [CrossRef] [Scilit]
- Shakoury, N.; Aliyari, M.A.; Salami, M.; Emam-Djomeh, Z.; Vardhanabhuti, B.; Moosavi-Movahedi, A.A. Encapsulation of propolis extract in whey protein nanoparticles. LWT 2022, 158, 113138. [Google Scholar] [CrossRef] [Scilit]
- Roudbari, M.; Barzegar, M.; Sahari, M.A.; Gavlighi, H.A. Formulation of functional gummy candies containing natural antioxidants and stevia. Heliyon 2024, 10, e31581. [Google Scholar] [CrossRef] [Scilit] [PubMed]
- Gorjanović, S.; Zlatanović, S.; Laličić-Petronijević, J.; Dodevska, M.; Micić, D.; Stevanović, M.; Pastor, F. Enhancing composition and functionality of jelly candies through apple and beetroot pomace flour addition. npj Sci. Food 2024, 8, 85. [Google Scholar] [CrossRef] [Scilit] [PubMed]
- Vareltzis, P.; Kyroglou, S.; Pasidi, E.; Oikonomou, G.; Gkogkou, T.; Govari, M.; Kalogiannis, K.; Gortzi, O. Food Matrix Effects on Plant-Derived Bioactive Compounds and Micronutrients: Implications for Functional Food Development. Int. J. Mol. Sci. 2026, 27, 5503. [Google Scholar] [CrossRef] [Scilit] [PubMed]

Disclaimer/Publisher’s Note: The statements, opinions and data contained in all publications are solely those of the individual author(s) and contributor(s) and not of MDPI and/or the editor(s). MDPI and/or the editor(s) disclaim responsibility for any injury to people or property resulting from any ideas, methods, instructions or products referred to in the content. |
© 2026 by the authors. Licensee MDPI, Basel, Switzerland. This article is an open access article distributed under the terms and conditions of the Creative Commons Attribution (CC BY) license.