


Abstract
Stable water-in-crude-oil emulsions remain a bottleneck in the treatment of heavy Uzbek crudes, and the demulsifiers used at field level are almost entirely imported. Two local secondary streams—the xylene-rich Ustyurt pyrolysis distillate and collected waste motor oil—were converted into a multicomponent demulsifier. Xylene was sulfonated with 98 wt.% H2SO4 and neutralised to sodium xylenesulfonate (SXS), reaching 96.8% isolated yield at 110–120 °C and an acid:xylene molar ratio of 1.34:1. Fixed-time yields gave a linear Arrhenius dependence (R2 = 0.998) with an apparent activation energy of 21.7 kJ mol−1, ΔH‡ = 18.4 kJ mol−1 and ΔS‡ = −262 J mol−1 K−1, indicating a transport-influenced electrophilic substitution. FTIR confirmed the –SO3Na group, and TG/DTA showed only 5.9% mass loss below 415 °C. Of four hydrophilic–lipophilic balance estimates, only the Davies value (14.2) is compatible with the observed water solubility. The optimum formulation KS-6 (30 wt.% SXS, 50 wt.% waste oil, 18 wt.% Ca and 2 wt.% Sr stearate) gave water-separation efficiencies of 81.0, 93.7 and 98.9% at water cuts of 60, 70 and 80 vol.%, exceeding the imported reference ND-12 by factors of 1.18–1.26, and lowered the residual salt content to 125 mg dm−3.
1. Introduction
Water is co-produced with crude oil at every mature field, and the intense shear imposed by chokes, pumps and gathering lines disperses it into droplets ranging from about 0.1 to 260 µm. Droplets larger than a few tens of micrometres coalesce readily and can be removed by simple gravity settling, but the sub-micrometre fraction is stabilised by an interfacial film and cannot be separated without chemical intervention [1,2,3,4]. The film is built from the indigenous surface-active fraction of the crude—asphaltenes, resins, naphthenic acids, waxes and finely divided mineral solids—which adsorbs irreversibly at the oil–water boundary and cross-links through hydrogen bonding, π–π stacking and metal-mediated bridging into a viscoelastic, quasi-two-dimensional network [5,6,7,8]. The mechanical rigidity of this network, rather than a simple reduction of interfacial tension, confers the extreme kinetic stability that characterises heavy-crude emulsions [9,10].
The consequences are both economic and technical. Emulsified water increases the volumetric load of pipelines and heat exchangers, raises pumping energy, promotes internal corrosion through dissolved chlorides, and deactivates downstream hydrotreating and cracking catalysts. Refinery feedstock specifications typically require water contents below 0.5 vol.% and salt contents below 100–150 mg dm−3, targets that heavy crudes cannot meet without dedicated dehydration and desalting. Chemical demulsification, usually combined with thermal or electrostatic treatment, remains the most widely deployed solution because of its low capital cost and operational flexibility [11,12,13]. Chemical agents of this kind have a wide-ranging impact across petroleum engineering as a whole: the same coupled transport, interfacial and phase-equilibrium phenomena that govern demulsification also control water-based heat extraction from hot dry rock reservoirs [14], fracture propagation during the stimulation of oil shale formations [15], and the temperature–pressure windows that determine gas recovery from hydrate deposits by carbon dioxide replacement [16]. Progress in any one of these areas therefore depends on an accurate description of how an injected chemical partitions, adsorbs and reorganises the fluid–fluid interface.
A chemical demulsifier must satisfy several partly contradictory requirements. It has to partition into the continuous oil phase and diffuse rapidly to the interface; it has to compete successfully with asphaltene and resin molecules for interfacial area; it has to reduce the viscoelasticity of the adsorbed layer rather than merely the interfacial tension; and it must not itself stabilise a secondary emulsion. In practice these requirements are met by formulating several chemically distinct components rather than by a single molecule, and the performance of a commercial product is largely determined by the balance struck within the blend [17,18,19,20]. Commercially the field is dominated by three families—polyoxyalkylene block copolymers, alkylphenol- and resin-based ethoxylates, and polyamines—while ionic liquids, dendrimers and magnetically responsive nanocomposites remain essentially laboratory chemistries [21,22,23,24,25]. Most of these are proprietary, energy-intensive to manufacture and, from the standpoint of an economy such as that of Uzbekistan, entirely imported.
Two circumstances specific to the Republic of Uzbekistan motivated the present study. First, the Ustyurt gas-chemical complex operated by Uz-Kor Gas Chemical LLC (limited liability company) produces more than 102 kt a−1 of pyrolysis distillate, 8 kt a−1 of pyrolysis oil and 10 kt a−1 of tar as by-products of natural-gas pyrolysis. The pyrolysis distillate is rich in benzene, toluene, xylenes, ethylbenzene and C9 aromatics, yet the original plant design made no provision for its downstream processing, so it is currently sold as low-value fuel or flared. Second, several tens of thousands of tonnes of used lubricating oil are collected annually in the country, a hazardous stream for which no organised re-refining capacity exists. Waste lubricating oils are generated worldwide at more than 24 Mt a−1 and are increasingly regarded as a secondary resource within circular-economy frameworks rather than as waste [26,27,28]. Converting both streams into a single value-added product therefore addresses an environmental liability and an import dependency simultaneously.
Aromatic sulfonates are attractive as the surface-active core of such a product. Sulfonation of xylene with concentrated sulfuric acid is a mature, single-step, catalyst-free electrophilic aromatic substitution that requires no exotic reagents, and the sodium salt of xylenesulfonic acid is an established hydrotrope and coupling agent with excellent hydrolytic and thermal stability [29,30,31,32]. Unlike sulfates, the C–S bond of a sulfonate is not susceptible to hydrolysis, which matters in the hot, saline environment of a desalting unit. What has not been examined systematically is whether a short-chain aromatic sulfonate of this kind, which is too hydrophilic to function as a conventional oil-soluble demulsifier on its own, can be made effective by combining it with hydrophobic alkaline-earth carboxylates and a hydrocarbon carrier derived from waste.
Divalent metal stearates offer exactly the complementary function required. They disperse well in hydrocarbon media, raise the lipophilicity of the blend and, importantly, perturb the packing and mechanical strength of interfacial layers [33]. Within Group II the properties of the stearates vary systematically with cation radius and polarising power [34,35], so that partial replacement of calcium by strontium provides a tuning parameter for the rigidity of the adsorbed film that has received little attention in the demulsification literature.
Three gaps therefore remain open. First, demulsifier formulations built entirely from secondary, locally available feedstocks have not been demonstrated, so the import dependence of oil-producing economies without a petrochemical fine-chemicals base is unresolved. Second, short-chain aromatic sulfonates have been treated as hydrotropes and coupling agents rather than as the active core of a demulsifier, and the question of how such a strongly hydrophilic species can be delivered to a water-in-oil interface has not been addressed. Third, the alkaline-earth soaps used as lipophilic carriers have been treated as inert diluents, and the possibility of deliberately disordering the mixed soap layer in order to weaken the interfacial film has not been exploited.
The present work addresses these gaps in four consecutive steps, which also define the structure of the paper. (i) The sulfonation of pyrolysis-derived xylene is optimised with respect to temperature, acid strength and stoichiometry, and kinetic and activation parameters are extracted from the yield–temperature relationship rather than the optimum being reported empirically (Section 3.1). (ii) The structure of the product and its thermal operating window are established by FTIR and TG/DTA (Section 3.2 and Section 3.3). (iii) The hydrophilic–lipophilic balance of the surfactant is assessed by four independent methods, the substantial divergence between them is explained, and the resulting design requirement for a lipophilic carrier is derived (Section 3.4). (iv) A seven-member family of compositions is designed around that requirement, screened, benchmarked against two commercial products currently used in Uzbek fields, and rationalised mechanistically (Section 3.5, Section 3.6, Section 3.7 and Section 3.8). To the best of our knowledge this is the first report of a demulsifier formulated entirely from secondary feedstocks in which a strontium stearate modifier is used to control interfacial-film rigidity.
2. Materials and Methods
2.1. Materials
Technical-grade xylene (mixed isomers, purity ≥ 98%) was separated from the pyrolysis distillate produced by Uz-Kor Gas Chemical LLC (Karakalpakstan region, Republic of Uzbekistan). Sulfuric acid of 40–98 wt.% concentration and oleum containing 10, 20 and 25 wt.% free SO3 were of analytical grade. Sodium hydroxide (40 wt.% aqueous solution), anhydrous sodium carbonate and sodium chloride were of analytical grade and used as received. Calcium stearate and strontium stearate were prepared from stearic acid by metathesis with purified lime solution and strontium chloride, respectively, then washed, dried at 80 °C and ground to pass a 100 µm sieve. Waste motor oil was collected from municipal vehicle-service stations in Bukhara, allowed to settle for 72 h, and coarse-filtered through a 50 µm cartridge to remove sludge and metallic debris; no further refining was applied, which is deliberate, since any purification step would erode the economic advantage of the route. All compositions reported in this paper were prepared from a single, thoroughly homogenised collection batch, so that the composition screening is not confounded by feedstock variability; the consequences of batch-to-batch variation, and the qualification protocol that would be required before industrial adoption, are addressed separately in Section 3.9.
Crude-oil samples and the associated stable W/O emulsions were taken from the Shimoliy O‘rtabuloq field and from the feed line to the heater of the Sho‘rtan oil and gas production department. For comparison, the imported demulsifier ND-12 (manufactured in Azerbaijan and currently used by SANEG JSC (Kashkadarya region, Republic of Uzbekistan)) and the demulsifier SD-1 were employed as reference products. Distilled water was used throughout.
2.2. Synthesis of Sodium Xylenesulfonate
Sulfonation was carried out in a 500 cm3 three-necked round-bottomed flask fitted with a reflux condenser, a contact thermometer and an overhead motor stirrer, and heated by an electric mantle (Figure 1). In a typical run, 16 cm3 of xylene (0.130 mol) was charged and 9.5 cm3 of 98 wt.% sulfuric acid (0.175 mol) was added dropwise with vigorous stirring (500 rpm). The two-phase mixture was held at 110–120 °C for 60 min under continuous agitation, which is essential because the reaction proceeds only across the acid–hydrocarbon boundary; without efficient dispersion the apparent rate collapses. Overheating was avoided, since above about 130 °C xylene is carried out of the reaction zone by its own vapour and the proportion of disulfonated by-products increases.
Figure 1.
Laboratory assembly used for the sulfonation of pyrolysis-derived xylene: 500 cm3 three-necked round-bottomed flask with reflux condenser, contact thermometer and overhead motor stirrer, mounted on a laboratory stand over an electric heating mantle.
The end of the reaction was recognised by the near-disappearance of the separate xylene layer and by the sharp reduction in the rate of condensate return from the reflux condenser. The hot mixture was poured into 70 cm3 of water, and the excess acid was neutralised by cautious portionwise addition of 8 g of sodium carbonate followed by 20 g of sodium chloride; alternatively, and with equally good results, 50 g of 40 wt.% sodium hydroxide solution was used. The solution was reheated to dissolve any salt that had crystallised, then cooled in an ice bath. The precipitated crystals of sodium xylenesulfonate were collected on a Büchner funnel under suction, washed with a small volume of ice-cold saturated brine, and dried to constant mass at 80 °C. The product was obtained as a pale yellowish-white free-flowing powder. Yields quoted throughout refer to the isolated, dried salt relative to the xylene charged, and each experimental point is the mean of three independent runs. The dispersion of the triplicate determinations is reported explicitly in Table 1 as the half-range of the three values; across the whole temperature series the relative half-range does not exceed 5.5% of the mean, and the corresponding standard deviation estimated from the range (σ ≈ R/d2, with d2 = 1.693 for n = 3) does not exceed 3.5 percentage points (reached at 70 and 90 °C); the individual values are quoted in the caption of Figure 2. The same preparative and analytical procedures were used for every series reported below, so this figure characterises the reproducibility of all the yield data in this work. Replicate records survive only for this series. For every other data set in the paper the dispersion is therefore quoted as the pooled standard deviation of the method derived here—2.5 percentage points for quantities expressed as a percentage, and 4.2% of the mean in relative terms for all other quantities—which is stated as such in the footnote of each table concerned. Those values express the reproducibility expected of a single determination made by this procedure; they are not independent per-point measurements, and they are not presented as such.
Figure 2.
(a) Dependence of the isolated yield of sodium xylenesulfonate on reaction temperature; error bars span the range observed over three independent runs (n = 3; mean ± half-range as listed in Table 1). The corresponding standard deviations, estimated from the range by σ = R/d2 with d2 = 1.693 for n = 3, are 1.2, 2.4, 1.8, 3.5, 3.0, 3.5, 1.2, 2.4, 3.0 and 1.8 percentage points at 40, 50, 60, 70, 80, 90, 100, 110, 120 and 130 °C, respectively. These are per-point values obtained from the ranges actually observed in this series; they are the source of the pooled estimate quoted for the other data sets (Section 2.2). The shaded band marks the optimum window. (b) Arrhenius plot of the apparent pseudo-first-order rate constants derived from the ascending branch of (a).
Table 1.
Effect of reaction temperature on the yield of sodium xylenesulfonate (16 cm3 xylene, 9.5 cm3 98 wt.% H2SO4, 60 min, n = 3).
Table 2.
Effect of the acid-to-xylene ratio on the yield (110–120 °C, 60 min, 16 cm3 xylene = 0.130 mol, n = 3).
The overall transformation is shown in Scheme 1.
Scheme 1.
Sulfonation of xylene with concentrated sulfuric acid and subsequent neutralisation to the sodium xylenesulfonate.
Three parameters were varied independently: the reaction temperature (40–130 °C at a fixed acid-to-xylene charge and 60 min); the concentration of the sulfonating agent (40, 50, 60, 70, 80, 90 and 98 wt.% H2SO4, and oleum with 10, 20 and 25 wt.% free SO3); and the volume of 98 wt.% acid (5.0–15.5 cm3) against a constant 16 cm3 of xylene. The three series were run consecutively, each at the optimum established in the preceding one, so that the highest yield of the study is reached only in the final, fully optimised series (Section 3.1.3).
2.3. Preparation of the Demulsifier Compositions
The dried sodium xylenesulfonate was blended with pre-filtered waste motor oil at 60–70 °C under mechanical stirring at 600 rpm until a homogeneous dark-brown fluid was obtained. Calcium and strontium stearates, pre-mixed in the required mass proportion, were then introduced in small portions and dispersed for a further 30 min. Two composition variables were screened. In the first series the total stearate content was held at 20 parts and the calcium-to-strontium ratio was varied from 20:0 to 16:4 while the surfactant (30 parts) and waste oil (50 parts) were fixed. In the second series the stearate pair was fixed at the optimum 18:2 and the surfactant content was increased from 5 to 35 wt.% at the expense of the waste oil, generating the seven compositions designated KS-1 to KS-7. The full compositions are given in Section 3.5.2.
2.4. Instrumental Characterisation
Infrared spectra of both the xylene feedstock and the isolated sodium xylenesulfonate were recorded in the 4000–400 cm−1 range on an IRTracer-100 (Shimadzu Corporation, Kyoto, Japan) Fourier-transform infrared spectrometer in attenuated-total-reflectance mode with a diamond crystal, at a resolution of 4 cm−1 and 45 accumulated scans. The two spectra were acquired on the same instrument under identical optical conditions, so that the trace of the starting hydrocarbon and that of the product can be compared band for band; a fresh background was collected before each measurement and the crystal was cleaned with acetone and dried between samples. Band assignments were made on the basis of standard group-frequency correlations for aromatic rings, methyl groups and sulfonate functionalities.
Thermogravimetric and differential thermal analysis were performed simultaneously on a SHIMADZU DTG-60 thermoanalyser (Shimadzu Corporation, Kyoto, Japan). A sample of 2.297 mg was held in an open alumina crucible and heated from 28.87 to 601.04 °C at 10 °C min−1 under a flow of argon at 80 cm3 min−1. Mass-loss steps were resolved from the first derivative of the TG curve, and the enthalpies associated with the DTA extrema were obtained by peak integration.
2.5. Evaluation of Demulsification Performance
Demulsification was assessed by the standard bottle test. Model emulsions were prepared by adding distilled water to the field crude at water cuts of 60, 70 and 80 vol.% and homogenising at 10,000 rpm for 5 min on an IKA T25 disperser (IKA-Werke GmbH & Co. KG, Staufen, Germany) until no free water separated over 24 h. Aliquots of 100 cm3 were transferred to graduated cylinders, dosed with demulsifier at 0.1 g dm−3, shaken for 2 min, and allowed to settle at 30–35 °C. The volume of water released was read after 60 min. Separate experiments on the stable field emulsion at 50 °C, at a reagent consumption of 90 g t−1 (equivalent to approximately 0.08 g dm−3 at the crude density measured here), were used to measure the settling time required for complete phase separation and to determine the degree of dehydration and the residual salt content. Because the two test systems differ in emulsion origin, temperature and dosing basis, the settling times reported for the model emulsions (Section 3.5.2) and for the field emulsion (Section 3.6.1) not directly comparable and are discussed separately. Two efficiency measures must be distinguished, and their conflation is a common source of error in the applied literature. The volume of water released, Vw, expressed as a percentage of the total emulsion volume, is not the demulsification efficiency; it is bounded above by the water cut itself. The water-separation efficiency E is defined here as
where Vw,0 is the volume of water originally emulsified. All efficiencies reported in Section 3.6 have been calculated on this basis, which allows compositions to be compared meaningfully across different water cuts.
E = 100 × Vw/Vw,0
The degree of dehydration was determined by Dean–Stark distillation of the treated oil phase, and the residual chloride content by aqueous extraction followed by argentometric titration. The pH of a 1% aqueous dispersion, the surface tension of a 1.0 g L−1 aqueous solution at 25 °C by the du Noüy ring method, the washing ability and the foaming volume at 25 °C were measured by standard procedures. Emulsion microstructure before and after treatment was examined by optical microscopy in transmitted light (Leica DM750, Leica Microsystems, Wetzlar, Germany; 100× magnification)on thin films of the emulsion placed between a slide and a cover glass, two independent fields of view being recorded for each state.
2.6. Kinetic and Thermodynamic Treatment of the Sulfonation Data
Because the sulfonation was run for a fixed time of 60 min at every temperature, the isolated yield may be treated as a conversion x and an apparent pseudo-first-order rate constant extracted as k = −ln(1 − x)/t. Plotting ln k against 1/T yields the apparent activation energy from the slope and the pre-exponential factor from the intercept. Activation parameters were then obtained from transition-state theory as ΔH‡ = Ea − RT, ΔS‡ = R[ln(kh/(kBT)) + Ea/(RT) − 1] and ΔG‡ = ΔH‡ − TΔS‡, evaluated at the mid-point of the optimum window, 393.15 K, with k expressed in s−1. Only the ascending branch of the yield–temperature curve (40–110 °C) was used, since above 120 °C the yield is limited by volatilisation of the substrate and by disulfonation rather than by the rate of the target reaction, and the pseudo-first-order assumption is no longer valid there. Throughout the temperature series the stirring rate, the charge, the vessel geometry and the reaction time were held constant, so that the temperature coefficient extracted from the Arrhenius plot is not confounded by a change in the interfacial area generated by agitation.
3. Results and Discussion
3.1. Sulfonation of Pyrolysis-Derived Xylene
3.1.1. Effect of Temperature
The dependence of the isolated yield of sodium xylenesulfonate on reaction temperature is given in Table 1 and plotted in Figure 2a. The yield rises monotonically from 30 to 32% at 40 °C to 84–89% at 120 °C and then falls back to 78–81% at 130 °C.
The shape of the curve is characteristic of an electrophilic aromatic substitution that competes with two temperature-activated losses. Below 100 °C the process is rate-limited: sulfonation is reversible and the equilibrium is shifted towards the product only as the water generated is retained by the excess acid, so higher temperatures both accelerate the forward step and speed the dispersion of the two immiscible phases. Above 120 °C two effects reverse the trend. Xylene, boiling at 138–144 °C depending on isomer, is progressively stripped from the reaction zone by its own vapour, reducing the effective concentration of the substrate at the interface; and the increased electrophile activity favours a second substitution, producing disulfonic acids whose sodium salts remain in the mother liquor and are lost on filtration. The optimum window of 110–120 °C represents the balance between these opposing tendencies.
Treating the fixed-time yields as conversions gives an excellent Arrhenius correlation over the whole ascending branch (Figure 2b), with a coefficient of determination R2 = 0.998. The apparent activation energy is 21.7 kJ mol−1 and the pre-exponential factor 2.68 × 101 min−1. The corresponding activation parameters at 393.15 K are ΔH‡ = 18.4 kJ mol−1, ΔS‡ = −262 J mol−1 K−1 and ΔG‡ = 121.5 kJ mol−1.
These numbers deserve comment, because they are considerably lower than the 60–90 kJ mol−1 typically quoted for the intrinsic electrophilic sulfonation of alkylbenzenes in homogeneous media [29,30]. The discrepancy is not an inconsistency but a diagnostic. An apparent activation energy in the 20 kJ mol−1 range is the signature of a process in which mass transfer across a liquid–liquid boundary, rather than the chemical step itself, controls the observed rate; the temperature coefficient then reflects mainly the temperature dependence of viscosity and of the interfacial area generated by stirring. The contrast is worth stating quantitatively. In homogeneous sulfonation, where substrate and electrophile share a single phase and the rate-determining step is formation of the Wheland intermediate, activation energies of 60–90 kJ mol−1 are routinely reported [29,30]; molecular diffusion in a low-viscosity liquid, by contrast, carries a temperature coefficient equivalent to only 12–25 kJ mol−1, because it is governed by the Arrhenius behaviour of the viscosity rather than by bond reorganisation. The value of 21.7 kJ mol−1 obtained here falls squarely in the second range and roughly a factor of three below the first, which is the conventional criterion for assigning a two-phase reaction to the transport-influenced regime. It should be stated plainly, however, that the present data establish this assignment from the magnitude of Ea alone: because every run in the series was carried out at the same stirring rate of 500 rpm, the data set cannot by itself separate the chemical from the transport contribution. The decisive test is a stirring-speed series at constant temperature, in which a transport-influenced reaction shows a yield that rises with agitation until the interface is saturated, whereas a kinetically controlled one does not. That series is the first step of the scale-up study now in progress.
The strongly negative activation entropy is consistent with this picture and with the mechanism itself: the rate-determining formation of the Wheland intermediate requires a highly ordered, charge-separated arrangement of the aromatic substrate, the sulfonating electrophile and at least one solvating acid molecule, so a large loss of translational and rotational freedom is expected. The large positive ΔG‡ confirms that the reaction remains kinetically demanding and therefore requires the elevated temperatures identified experimentally. A practical consequence follows directly: since the process is transport-influenced, improvements in agitation and in the dispersion of the acid phase should raise the yield at a given temperature more effectively than a further increase in temperature, which is precisely what is observed on scale-up of such systems.
3.1.2. Effect of the Concentration of the Sulfonating Agent
Figure 3a shows that the yield increases steadily with acid strength, from 38.8% with 40 wt.% acid to 88.8% with 98 wt.% acid, and then falls when oleum is used. The corresponding numerical values are listed in Table S1 of the Supplementary Materials; they are not repeated here as a main-text table, since the figure conveys the trend and the table would duplicate it.
Figure 3.
(a) Yield of sodium xylenesulfonate as a function of the concentration of the sulfonating agent; the last three bars correspond to oleum containing 10, 20 and 25 wt.% free SO3; each bar is the mean of three independent runs (n = 3), the individual values being listed in Table S1. (b) Yield as a function of the molar ratio of sulfuric acid to xylene, showing the optimum at 1.34:1; the shaded band marks the flat maximum between 1.13:1 and 1.55:1, and each point is the mean of three independent runs (n = 3; Table 2). Error bars are ± s, where s is the pooled standard deviation of the method derived from the triplicate temperature series of Table 1 (Section 2.2): 2.5 percentage points for quantities expressed as a percentage and 4.2% of the mean for all other quantities. The numerical values are given in Table S1 for panel (a) and Table 2 for panel (b).
Two distinct chemical regimes are visible. In aqueous sulfuric acid the active electrophile is generated by the self-ionisation equilibrium 2 H2SO4 ⇌ H3SO4+ + HSO4−, and the concentration of the reactive species rises very steeply with acid strength because water suppresses the equilibrium and simultaneously drives the reverse desulfonation. The sharp increase between 90 and 98 wt.%—a gain of 17.4 percentage points for an 8% change in composition—reflects the passage through the region in which the last of the free water is consumed and the medium acidity function increases by several orders of magnitude.
Oleum, by contrast, delivers free SO3, a far more powerful electrophile that does not require pre-activation. That it gives a lower isolated yield than 98 wt.% acid, and that the yield falls monotonically as the free SO3 content rises from 10 to 25%, therefore indicates a selectivity rather than an activity problem. With SO3 in excess the second substitution becomes competitive at the reaction temperature, and sulfone formation through condensation of the sulfonic acid with a second aromatic molecule also becomes significant. Both by-products are water-soluble or remain in the acid layer and are removed during work-up, so they appear as a loss of isolated yield. For the present purpose 98 wt.% sulfuric acid is thus optimal on chemical grounds as well as on grounds of cost, handling and corrosion—an important consideration if the process is to be operated at a facility that already has sulfuric acid but not oleum in its inventory.
3.1.3. Effect of Stoichiometry
Table 2 lists the yields obtained when the volume of 98 wt.% acid was varied against a constant 16 cm3 of xylene, at the temperature and acid strength optimised in the two preceding series. The original data were reported as volume ratios; they have been recalculated here to molar ratios, which is the physically meaningful quantity, using densities of 0.864 g cm−3 for xylene and 1.836 g cm−3 for the acid.
The maximum yield of 96.8% is reached at a molar ratio of 1.34:1, that is, with a 34% molar excess of acid over the stoichiometric requirement. This excess is not arbitrary. Each sulfonation event liberates one molecule of water, which dilutes the acid phase locally and both slows the forward reaction and promotes the reverse. The excess acid acts as a chemical desiccant, sequestering the water of reaction as hydronium hydrogensulfate and keeping the acidity function of the medium above the threshold at which sulfonation remains effectively irreversible. Below 1.13:1 the yield falls sharply because this buffering capacity is exhausted before the reaction reaches completion; the drop from 90.1 to 62.4% as the ratio decreases from 1.13 to 0.70 corresponds closely to the point at which the water generated becomes comparable to the free acid available to absorb it.
Above 1.34:1 the yield declines gently and almost linearly, losing about 8 percentage points over the range 1.34–2.18. This is the expected consequence of a shift towards disulfonation: at high acid-to-substrate ratios the monosulfonate, which remains dissolved in the acid layer, encounters an excess of electrophile and undergoes a second substitution. The gentleness of the decline compared with the steep rise on the acid-lean side indicates that the second substitution is substantially slower than the first, as expected from the strongly deactivating and meta-directing character of the sulfonic acid group already present. From a process standpoint the flat maximum between 1.13 and 1.55 is a favourable feature, since it means the process is robust to moderate errors in metering.
3.2. Structural Confirmation by FTIR Spectroscopy
The infrared spectrum of the xylene feedstock and that of the isolated product are shown side by side in Figure 4, and the band positions of both traces are collected and compared in Table 3. Because the two spectra were recorded on the same instrument under identical conditions (Section 2.4), they can be read band for band, and the comparison separates three questions that are usually left entangled: what has been added to the molecule, what has survived it, and what has not happened at all. It should be stated at the outset that infrared spectroscopy cannot distinguish between the positional isomers that a mixed-isomer xylene feedstock necessarily produces; the product is therefore referred to throughout as sodium xylenesulfonate (mixed isomers), consistent with the commercial material of the same name.
Figure 4.
ATR–FTIR spectra recorded in this work on an IRTracer-100 spectrometer (diamond crystal, 4000–400, resolution 4 cm−1, 45 accumulated scans): (a) the isolated sodium xylenesulfonate; (b) the xylene feedstock from which it was prepared. The band positions marked on the two traces are those listed in Table 3. Both panels are transmittance spectra; note that the ordinate scales of the two panels are not identical, so the traces are compared in terms of the presence, absence and position of bands rather than of their absolute intensities.
Table 3.
Band-by-band comparison of the FTIR spectra of the xylene feedstock and of the sodium xylenesulfonate prepared from it. A dash denotes that no absorption is observed in that region of the corresponding spectrum.
The first conclusion that the comparison supports is that the hydrocarbon skeleton survives the reaction unaltered. The aromatic C–H stretching band of the feedstock at 3031 cm−1 is still present in the product at 3028 cm−1; the methyl stretching pair at 2920 and 2850 cm−1 reappears at 2918 and 2863 cm−1; and the two ring skeletal modes at 1605 and 1494 cm−1 are found at 1600 and 1499 cm−1. The most telling of these correspondences is the symmetric methyl deformation, which lies at 1376.9 cm−1 in the feedstock and at 1376.9 cm−1 in the product: the position is reproduced to within the digitisation of the instrument, which would not be the case if the methyl groups had been attacked. This matters because oxidation of a methyl substituent to a carboxyl group is the principal side reaction to be feared when an alkylbenzene is heated with concentrated sulfuric acid; no carbonyl absorption whatever is observed in the 1730–1700 cm−1 window of the product spectrum, and the methyl deformation bands are undiminished. Neither ring opening, nor hydrogenation, nor oxidation has occurred.
The second conclusion concerns what has been added, and it is read in the 1250–1000 cm−1 window. In the feedstock this region carries only three weak in-plane C–H bending absorptions, at 1179, 1091 and 1016 cm−1, none of which is among the stronger features of that spectrum. In the product the same window contains the most intense group of bands in the whole trace: 1216, 1177, 1123, 1038 and 1011 cm−1. The band at 1216 cm−1 has no counterpart at all in the feedstock, and the transmittance minima at 1177 and 1123 cm−1 are deeper than any band in the hydrocarbon spectrum, so the change is one of addition and not of displacement. The pair at 1216 and 1177 cm−1 is assigned to the asymmetric S=O stretching of the sulfonate anion and the group at 1123, 1038 and 1011 cm−1 to its symmetric S=O and S–O stretching, the last of these overlapping the surviving in-plane C–H bend of the ring. Their positions identify the group as an ionised –SO3− associated with a sodium counter-ion rather than as a free sulfonic acid: in the acid the asymmetric S=O band lies appreciably higher, near 1350 cm−1, and is accompanied by a very broad acidic O–H absorption extending below 2800 cm−1. The product spectrum is flat between 1377 and 1216 cm−1 and shows no such continuum, so neutralisation to the sodium salt is complete.
The third conclusion concerns the out-of-plane region below 900 cm−1, which carries the information about where the sulfonate group has entered the ring. The feedstock shows two strong bands there, at 814 and 679 cm−1. Both survive in the product, at 814 and 673 cm−1, and the first of them is unshifted; a fraction of the original substitution pattern is therefore still present, as must be the case if only one of the four available ring positions is substituted. Superimposed on them, however, is a set of bands that the feedstock does not possess at all: 956, 854, 801 and 711 cm−1. A third substituent on the ring reduces the number of adjacent unsubstituted hydrogens and lowers the local symmetry, and the appearance of this richer pattern is the expected consequence. Below 600 cm−1 the product shows four further absorptions, at 564, 551, 495 and 409 cm−1, which belong to the deformation modes of the –SO3− group and to skeletal modes involving the C–S bond; the feedstock is featureless in this region.
One qualification should be entered against the third argument. The feedstock is a technical mixture of xylene isomers, and its own out-of-plane pattern—two strong bands at 814 and 679 cm−1 rather than the single band a pure isomer would give—already reflects that mixture. The out-of-plane region of the product is accordingly the superposition of the patterns of several isomeric sulfonates, and it establishes that substitution has taken place without identifying the position at which it occurred in any one isomer. The first two arguments are unaffected by the isomer composition, because neither the sorbed-water bands nor the sulfonate bands belong to the hydrocarbon skeleton at all.
Taken together, the spectrum confirms the formation of a sodium dimethylbenzenesulfonate with an intact aromatic nucleus, intact methyl substituents and a fully ionised sulfonate head group. The simultaneous presence of a strongly hydrophilic anionic head and a compact hydrophobic aromatic tail is the structural basis of the amphiphilic behaviour exploited in the formulation described below.
3.3. Thermal Stability: TG and DTA
The thermal behaviour of the salt determines whether it can survive the conditions of a field dehydration unit, where temperatures of 50–90 °C are routine and excursions to 120 °C occur in heater-treaters. Thermogravimetry under argon (Figure 5) resolves three distinct stages. The stage-resolved mass losses and their assignments are tabulated in Table S2 of the Supplementary Materials rather than in the main text, since they restate in numerical form what the thermogram already shows.
Figure 5.
Simultaneous TG (blue) and DTA (red) curves of sodium xylenesulfonate recorded on a SHIMADZU DTG-60 analyser under argon (80 cm3 min−1) at a heating rate of 10 °C min−1. Sample mass 2.297 mg. The three resolved mass-loss stages and the DTA extrema at 449.24 and 544.35 °C are annotated on the instrument trace. The double-headed arrows are the instrument’s own annotation of the three mass-loss steps; the two single arrows mark the DTA extrema at 449.24 and 544.35 °C.
The most technologically relevant number is the cumulative mass loss below 415 °C, which is only 5.92%, and essentially all of it is water. Between ambient temperature and 146 °C the sample loses 3.35%, which corresponds to the broad O–H absorption at 3370 cm−1 and the H–O–H bending band at 1660 cm−1 in the infrared spectrum and confirms that these bands arise from sorbed moisture rather than from a hydroxylated impurity. In the interval 146–415 °C a further 2.57% is lost, attributable to more tightly bound lattice water and to the onset of local rearrangement of the sulfonate group. In practical terms, the material is thermally inert across the entire operating envelope of an oilfield dehydration train, with a margin of more than 300 °C before structural decomposition begins.
The principal degradation occurs in stage III with a mass loss of 30.48%. The DTA trace shows an exothermic maximum at 449.24 °C (5.41 µV, 2.36 µV mg−1, 285.10 mcal, 124.12 cal g−1) and an endothermic minimum at 544.35 °C (−11.84 µV, −5.16 µV mg−1, −952.56 mcal, −414.70 cal g−1). The exotherm is assigned to homolytic scission of the C–S bond with subsequent recombination of the resulting radicals and the beginning of char formation, a process that releases energy; the much larger endotherm at higher temperature corresponds to the strongly endothermic deep degradation of the aromatic framework and to the decomposition of the sodium-containing residue.
The residue can be used as an independent check on the assigned composition. Two moles of C8H9SO3Na (M = 208.21 g mol−1) contain the sodium and sulfur required for one mole of Na2SO4 (M = 142.04 g mol−1), so complete conversion of the anhydrous salt to sodium sulfate alone would leave 71.02/208.21 = 34.1% of the anhydrous mass. The measured residue at 601 °C is 63.60% of the initial mass; after correcting for the 5.92% of water lost below 415 °C, this corresponds to 67.6% of the anhydrous salt. The difference, 33.5%, is carbonaceous char. Since the carbon content of the salt is 96.09/208.21 = 46.15%, this implies that roughly 73% of the carbon is retained as char at 601 °C—a value entirely consistent with the pyrolysis of an aromatic sulfonate under an inert atmosphere, where oxidative burn-off of the char cannot occur. The mass balance therefore supports the assigned composition. The integrated onset and endset temperatures of the two thermal events, 427.63–468.08 °C for the exotherm and 515.72–594.29 °C for the endotherm, bracket the two degradation regimes and confirm that they are well separated rather than overlapping.
One caveat should be entered against this calculation. The residue has been treated as a simple binary mixture of sodium sulfate and carbon, but thermogravimetry alone cannot establish that all the sulfur originally present has either been evolved as SO2/SO3 or been retained as sulfate. Under an inert atmosphere a fraction of the sulfur may remain chemically bound in the char as thiophenic or sulfidic structures, or as sodium sulfite or sulfide formed by reduction of the sulfate by the carbonaceous residue, and these species are isobaric with the assumed mixture to within the precision of the measurement. The 73% carbon retention derived above should therefore be read as an upper estimate, and the agreement between the measured and calculated residues as a consistency check rather than as proof of the residue composition. Elemental analysis of the residue, or evolved-gas analysis coupled to the thermobalance, would be required to settle the point; neither affects the conclusion that matters for the application, namely that the salt is thermally inert below 415 °C.
3.4. Hydrophilic–Lipophilic Balance: Reconciling Four Estimates
The product is a sodium dimethylbenzenesulfonate, C8H9SO3Na, of molar mass 208.21 g mol−1, comprising a hydrophilic –SO3Na head of 103.05 g mol−1 and a lipophilic dimethylphenyl residue of 105.16 g mol−1. The near-equality of these two masses is precisely what makes the HLB of this molecule an instructive case, because mass-based and group-contribution methods diverge sharply [36].
Davies group-contribution method [37]. Summing group numbers according to HLB = 7 + Σ(hydrophilic) − Σ(lipophilic), with 11.0 for –SO3Na and 0.475 for each lipophilic group, gives HLB = 7 + 11.00 − 3.80 = 14.20 when all eight carbon atoms of the dimethylphenyl residue are counted as lipophilic groups. Counting only the four unsubstituted aromatic =CH– units and the two methyl groups, which is the stricter reading of the Davies scheme, gives 7 + 11.00 − 2.85 = 15.15. Both readings place the compound well above 13, so the conclusion drawn below is unaffected; the value 14.2 is quoted throughout for the conservative, eight-group count. If the sulfonate is instead assigned the higher group number quoted for sulfate (38.7), the result becomes 41.9, which should be regarded as an upper bound; values above 20 are legitimate on the Davies scale for ionic surfactants (sodium dodecyl sulfate is conventionally assigned about 40), but the sulfonate-specific value of 11.0 is the appropriate one here.
Griffin mass-fraction method [38,39]. HLB = 20 Mh/M = 20 × 103.05/208.21 = 9.90. The complementary form HLB = 20(1 − Ml/M) = 20 × (1 − 105.16/208.21) = 9.90 reproduces the same value exactly, which serves as an arithmetic check but not as independent evidence.
Logarithmic (Kawakami-type) correlation. HLB = 7 + 11.7 log(Mh/Ml) = 7 + 11.7 × log(0.9799) = 6.90.
Empirical solubility scale. A 1% aqueous solution of the salt is completely clear and transparent, which on Griffin’s observational scale [38] corresponds to HLB ≥ 13. The four estimates are compared in Table 4.
Table 4.
Comparison of hydrophilic–lipophilic balance estimates for sodium xylenesulfonate.
The divergence is systematic and its cause is chemical rather than computational. Both the Griffin and the logarithmic expressions weight the hydrophilic contribution by mass alone. In this molecule the sulfonate head and the xylyl tail happen to weigh almost the same, so any purely gravimetric method must return a value close to the neutral midpoint of the scale, and indeed the logarithmic method returns 6.9, only 0.1 units from perfect balance. But mass is a poor proxy for hydrophilicity when the polar group is ionic. On dissociation the –SO3− anion and the Na+ cation each acquire a substantial primary hydration shell; the effective hydrodynamic hydrophilic volume is therefore several times the formula mass of the head group. The Davies scheme accounts for this implicitly, because its group numbers were derived by fitting emulsion-inversion data rather than from stoichiometry [37], and it is the only method whose prediction is compatible with the experimentally observed complete water solubility. Griffin’s original formulation was, in any case, explicitly developed for non-ionic ethoxylated surfactants and was never intended to apply to ionic species [38,39].
An HLB of about 14 places the compound in the region of detergents and oil-in-water emulsifiers, and above the 3–6 window classically associated with W/O demulsifiers [36,40]. This is not a contradiction but the central design problem of the present work, and it explains why sodium xylenesulfonate cannot function as a demulsifier on its own. It is insoluble in the oil phase and would remain in the aqueous droplets, unable to reach the interface from the continuous side. The molecule behaves as a hydrotrope rather than as a classical surfactant: it does not form conventional micelles but increases the solubility of sparingly soluble organic species through cooperative, loosely structured aggregation [31,32]. The role of the calcium and strontium stearates and of the waste motor oil in the formulation is therefore not merely to dilute the active component but to carry it—to build a lipophilic vehicle with an effective blend HLB low enough to disperse in crude oil while delivering a strongly hydrophilic anionic head to the interface. Viewed this way, the composition is a designed HLB-matching system, and the optimum found empirically in Section 3.5 acquires a quantitative rationale.
3.5. Formulation Design and Screening
3.5.1. The Calcium–Strontium Stearate Pair
Table 5 and Figure 6a show the effect of replacing part of the calcium stearate by strontium stearate while holding the surfactant and waste-oil contents constant.
Table 5.
Effect of the calcium-to-strontium stearate ratio on the laboratory phase-separation time (30 parts SXS, 50 parts waste motor oil, 20 parts total stearate).
Figure 6.
(a) Effect of the strontium stearate content of the stearate pair on the laboratory phase-separation time; the optimum at 10 wt.% is highlighted. (b) Effect of the sodium xylenesulfonate loading of the composition on the settling time (left axis, black squares) and on the degree of dehydration (right axis, red squares); the minimum in settling time and the maximum in dehydration both occur at 30 wt.%, which is composition KS-6. Error bars are ± s, where s is the pooled standard deviation of the method derived from the triplicate temperature series of Table 1 (Section 2.2): 2.5 percentage points for quantities expressed as a percentage and 4.2% of the mean for all other quantities. The numerical values are given in Table 5 for panel (a) and Table 6 for panel (b).
The response is sharply non-monotonic, with a well-defined minimum at 10 wt.% strontium in the stearate pair. This pattern is the classic signature of a synergistic mixed-adsorption effect, and it can be rationalised in terms of the crystal chemistry of the two soaps. Strontium(II) has an effective ionic radius of 118 pm against 100 pm for calcium(II) in six-fold coordination [35], and a correspondingly lower charge density and polarising power. Strontium distearate therefore has a lower lattice energy, a lower melting point and a weaker tendency to form the ordered lamellar aggregates characteristic of calcium soaps in hydrocarbon media [33,34]. Introduced at low concentration into a calcium stearate matrix, the larger cation acts as a lattice defect: it disrupts the regular packing of the calcium soap both in the bulk dispersion and, more importantly, in the mixed layer that the stearates form at the oil–water boundary. A disordered mixed layer is mechanically weaker and more permeable than either pure component, which is exactly what is required to break the viscoelastic asphaltene–resin film. Beyond about 10%, the strontium soap ceases to act as a defect and begins to form its own domains. The mixed layer then reorganises into a two-phase structure whose interfacial coverage is more complete and whose combined rigidity is higher than that of the optimally disordered layer, and the separation time increases again—at 20% strontium it is 9% worse than with calcium alone. The 27% improvement obtained at the optimum is therefore not a simple additive contribution from a second active component but a genuine synergism arising from the disruption of packing order, and it explains why so small an addition produces so large an effect.
The resolution of this screen should be stated honestly. The composition axis was sampled at five points in steps of 5 wt.%, which is sufficient to establish that the response is non-monotonic and that the optimum lies near 10 wt.%, but not to locate that optimum more closely than ±2.5 wt.%. The curvature on either side of the minimum is steep—a 5 wt.% change in either direction costs 6 to 10 min of separation time—so a finer sampling in the 8–12 wt.% interval is warranted and could plausibly shift the optimum by one or two percentage points and improve the separation time further. Such a series, in steps of 1 wt.% and with the triplicate dispersion reported for each point, is part of the process-optimisation work now in progress; the composition used for all the performance testing reported below is the best of those examined here, so the benchmarking of Section 3.6 and Section 3.7 is unaffected by the precise position of the minimum.
3.5.2. Surfactant Loading: The KS Series
With the stearate pair fixed at 18:2, the surfactant content was varied from 5 to 35 wt.% at the expense of the waste-oil carrier, giving compositions KS-1 to KS-7 (Table 6, Figure 6b). The last column of Table 6 gives the blend HLB calculated as the mass-weighted sum of the component values, taking HLB = 14.2 for the sulfonate (Section 3.4), 1.0 for the metal stearates and 0 for the waste-oil carrier.
Table 6.
Composition of the KS-series demulsifiers, their calculated blend HLB and their laboratory settling times on the model emulsion at 50 °C.
The value adopted for the stearates requires justification, since it is not derived in this work. Calcium stearate and the other alkaline-earth soaps of long-chain fatty acids are conventionally assigned HLB ≈ 1 in the emulsifier tables that derive from Griffin’s classification, which places them with the strongly lipophilic, oil-dispersible, water-insoluble agents [36]; this is consistent with their observed behaviour here, since both soaps disperse readily in the waste-oil carrier and are insoluble in water. The waste motor oil, a non-amphiphilic hydrocarbon, is assigned 0. Because the stearate content is held constant at 20 wt.% throughout the KS series, the choice of this value shifts every entry in the last column of Table 6 by the same constant and cannot alter the position of the optimum. Its influence on the absolute blend HLB is also small: taking the stearate contribution as 0 instead of 1.0 lowers the KS-6 value from 4.5 to 4.3, and taking it as 2.0 raises it to 4.7. All three estimates lie inside the 3–6 window discussed below, so the interpretation is robust against the assumption.
Reference ND-12 gave a settling time of 32 min under the same conditions.
The settling time falls steadily as the surfactant content rises to 30 wt.% and then increases again at 35 wt.%. The existence of an interior optimum is significant because it demonstrates that the active component is not simply being diluted by the carrier; if it were, performance would improve monotonically with loading. Two competing effects are at work. Increasing the surfactant loading raises the flux of anionic head groups available to compete with asphaltenes and resins for interfacial sites, which accelerates film disruption. But the surfactant is strongly hydrophilic, and as its proportion rises the effective HLB of the blend rises with it. Beyond about 30 wt.% the composition becomes too hydrophilic to disperse efficiently in the continuous oil phase; a growing fraction of the reagent partitions directly into the aqueous droplets, where it is useless, and the residual fraction that does reach the interface may even begin to stabilise a secondary oil-in-water emulsion.
The degree of dehydration plotted on the right-hand axis of Figure 6b behaves in the same way and for the same reason, falling from 98.8% for KS-6 to 88.3% for KS-7 when the surfactant loading is raised from 30 to 35 wt.%. Three consequences of the excess hydrophilicity act together here. First, the fraction of reagent that partitions into the aqueous droplets instead of the continuous oil phase no longer contributes to film disruption at all, so the effective dose delivered to the interface falls even though the nominal dose has risen. Second, the sulfonate that does adsorb now forms a denser, more hydrated and more strongly charged interfacial layer; the electrostatic repulsion between droplets carrying such a layer opposes the close approach that must precede coalescence, so droplets that have been stripped of their asphaltene armour nevertheless fail to merge. Third, at the highest loading the blend begins to behave as an oil-in-water rather than a water-in-oil emulsifier, and a fraction of the oil is re-emulsified into the separated aqueous phase, which both retains water in the oil layer and lowers the measured degree of dehydration. The same three effects explain why the settling time of KS-7 (33 min) returns almost exactly to that of KS-5 (32 min), whose blend HLB of 3.8 lies symmetrically on the other side of the optimum.
The calculated blend HLB values in Table 6 give this argument a quantitative form. KS-6, the empirical optimum, has a blend HLB of 4.5, which falls almost exactly at the centre of the 3–6 window classically associated with water-in-oil demulsifiers and emulsifiers [36,40]. KS-4 and KS-5, at 3.0 and 3.8, lie at the lower edge of that window and are under-dosed in active material; KS-7, at 5.2, is approaching its upper edge; and KS-1 to KS-3, at 0.9–2.3, are essentially lipophilic diluents with too little surfactant to act at all. The optimum at KS-6 is therefore the point at which the blend HLB matches the requirement of the crude, and this interpretation ties the formulation result directly to the HLB analysis of Section 3.4.
3.6. Demulsification Performance
3.6.1. Field-Emulsion Tests
Table 7 summarises the separation time, degree of dehydration and residual salt content obtained with each composition on the stable field emulsion at a dosage of 90 g t−1, together with the imported reference ND-12. These tests were run on the field emulsion rather than on the model emulsions of Table 6, and the separation times are correspondingly longer.
Table 7.
Demulsification of the stable field W/O emulsion (dosage 90 g t−1, 50 °C).
KS-6 outperforms the imported reference on all three criteria simultaneously, which is the more demanding test: it separates the phases in 2.7 h against 4.2 h, reaches 98.8% dehydration against 92.5%, and leaves 125 mg dm−3 of residual salt against 265 mg dm−3. The last figure is the most consequential in practice, because residual chloride is the direct precursor of hydrogen chloride in the atmospheric distillation overhead and hence of the corrosion that limits refinery run length; the value obtained with KS-6 falls below the 150 mg dm−3 threshold commonly specified for refinery feed, whereas the reference does not. It is worth noting that the three performance measures are not perfectly correlated across the series. KS-3, for example, achieves a low residual salt content (167 mg dm−3) with only moderate dehydration (77.4%), while KS-5 gives good dehydration (83.4%) but poor desalting (309 mg dm−3). Dehydration and desalting are governed by different steps—the former by the coalescence and settling of the bulk water, the latter by the efficiency with which the small, highly saline droplets that remain dispersed after primary separation are captured [41]. Compositions rich in the hydrophilic surfactant favour the second process. Only KS-6 optimises both, and the scatter in Figure 7a makes the point graphically.
Figure 7.
(a) Relationship between degree of dehydration and residual salt content for the KS series and the reference ND-12; each point is labelled with the corresponding composition. (b) Comparison of the physicochemical characteristics of KS-6 with those of the commercial demulsifiers ND-12 and SD-1; σ denotes the surface tension of a 1.0 g L−1 aqueous solution in mN m−1, and the four parameters are plotted on a common numerical axis.
Optical microscopy of the crude before and after treatment with KS-6 confirms that the improvement in the bulk measurements has a corresponding change in microstructure (Figure 8). The untreated water-bearing crude shows a dense population of water droplets spanning roughly one to several tens of micrometres, many of them surrounded by a visibly dark, thick boundary corresponding to the adsorbed asphaltene–resin layer, and closely packed enough that neighbouring droplets are in near-contact without coalescing—the hallmark of a film-stabilised system. After treatment the field of view is almost entirely continuous oil phase, with only a small number of isolated residual droplets remaining and no evidence of the dense flocculated clusters seen before. The disappearance of the dark interfacial rims in the treated samples is the direct visual counterpart of the film-disruption step proposed in Section 3.8.
Figure 8.
Optical micrographs of the crude oil in transmitted light. (a,b) Water-bearing crude before treatment, two independent fields of view, showing a dense population of water droplets with dark asphaltene–resin rims. (c,d) The same crude after treatment with composition KS-6, two independent fields of view, showing an almost continuous oil phase with only isolated residual droplets. All four panels were recorded at 100× magnification (Leica DM750).
3.6.2. Model Emulsions at Varying Water Cut
The visual outcome of the bottle tests is presented in Figure 9, and the corresponding quantitative data for the three water cuts are collected in Table 8. The photographs make the ranking immediately apparent: at every water cut the tube charged with KS-6 shows the deepest column of released water and the sharpest, flattest oil–water boundary, while KS-1 and KS-2 leave a thick, poorly resolved emulsion band and SD-1 gives a diffuse and irregular interface. The clarity of the boundary is itself informative, since a sharp meniscus indicates that the interfacial film has been destroyed rather than merely thinned, and that little residual emulsion remains trapped between the phases. Following the definition introduced in Equation (1), the results are expressed both as the volume of water released from a 100 cm3 sample and as the true water-separation efficiency E.
Figure 9.
Bottle tests on model emulsions. (a) Untreated water-in-oil emulsion after 24 h, showing no free water. (b–d) The same emulsion at water cuts of 60, 70 and 80 vol.%, 60 min after dosing with 0.1 g dm−3 of each demulsifier at 30–35 °C. Tubes are labelled KS-1 to KS-7 and the commercial references ND-12 and SD-1. The lower, straw-coloured layer is the released aqueous phase. The numerals 1–9 at the top of the tubes identify the reagents from left to right in every panel, in the order KS-1 to KS-7, ND-12 and SD-1; the same names are printed beneath the tubes in panels (b–d).
Table 8.
Water released and water-separation efficiency after 60 min at 30–35 °C, dosage 0.1 g dm−3, for model emulsions of three water cuts.
Recalculating the raw volumes as true efficiencies changes the interpretation substantially, and this is worth emphasising. Reading the volume column alone, one would conclude that every demulsifier performs better at higher water cut, and that KS-6 improves from 48.6 to 79.1 as the water content rises. The efficiency column shows that the improvement is real but much smaller than the raw volumes suggest, and it makes possible a direct comparison across water cuts: KS-6 recovers 81.0% of the emulsified water at 60% water cut, 93.7% at 70%, and 98.9% at 80%. The systematic increase in efficiency with water cut has a straightforward physical basis. At higher internal-phase volume fraction the mean interdroplet distance decreases and the collision frequency rises as roughly the square of the droplet number density, so the coalescence rate increases even at constant film strength. In addition, at 80% water cut the system is close to the inversion point at which the dispersed phase becomes continuous, and the interfacial film is already under geometric strain; a modest chemical perturbation then suffices to trigger separation. Conversely, at 60% water cut the droplets are well separated, the film is under no strain, and the demulsifier must do more work. The practical implication is that KS-6 is best suited to late-life, high-water-cut wells—which is precisely the situation at the mature Uzbek fields for which it was developed.
The full comparison across all nine reagents and three water cuts is displayed in Figure 10. Against the commercial references, KS-6 delivers efficiency ratios of 1.20, 1.26 and 1.18 relative to ND-12 at water cuts of 60, 70 and 80%, respectively, and 1.59, 1.97 and 1.38 relative to SD-1. It is notable that the largest relative advantage over ND-12 occurs at 70% water cut rather than at the extremes, which suggests that the two products have somewhat different optimum operating windows and that KS-6 is better matched to the mid-range conditions typical of gathering-station feed. The behaviour of SD-1 is anomalous: its efficiency falls from 51.0% at 60% water cut to 47.6% at 70% before recovering to 71.6% at 80%. Since SD-1 is oil-soluble, a plausible explanation is that at intermediate water cuts it partitions unfavourably and transiently stabilises a multiple emulsion, a known failure mode of oil-soluble demulsifiers near the inversion region [42].
Figure 10.
Water-separation efficiency of the KS-series compositions and of the commercial references ND-12 and SD-1 at water cuts of 60, 70 and 80 vol.% (dosage 0.1 g dm−3, 30–35 °C, 60 min settling). Within each group the three bars correspond, from left to right, to water cuts of 60, 70 and 80 vol.%. Error bars are ± s, where s is the pooled standard deviation of the method derived from the triplicate temperature series of Table 1 (Section 2.2): 2.5 percentage points for quantities expressed as a percentage and 4.2% of the mean for all other quantities. The numerical values are given in Table 8.
3.7. Physicochemical Characteristics
Table 9 compares the key physicochemical properties of KS-6 with those of the two commercial demulsifiers.
Table 9.
Physicochemical characteristics of KS-6 and the reference demulsifiers.
Three observations merit discussion. First, KS-6 has the highest active-matter content of the three (62.0 wt.%) and by a clear margin the best washing ability (93.3% against 80.2 and 82.0%), the latter being a direct measure of the ability to displace adsorbed organic material from a solid or liquid surface, and therefore a good laboratory proxy for the displacement of asphaltenes from the interface. Second, the near-neutral pH of 8.6 is an operational advantage over ND-12 at pH 10.3. Strongly alkaline demulsifiers promote the in situ saponification of naphthenic acids present in the crude, generating sodium naphthenates that are themselves powerful natural emulsifiers and can partially counteract the demulsifier. The milder alkalinity of KS-6 also reduces the corrosion burden on carbon-steel vessels and pipework. Third, and requiring an honest interpretation, the measured surface tension of KS-6 (37 mN m−1) is slightly higher than that of ND-12 (34 mN m−1). Since KS-6 is nevertheless the more effective demulsifier, its advantage cannot be attributed to a superior depression of surface tension, and any claim to that effect would be inconsistent with the data. This is in fact one of the more instructive findings of the study.
The equilibrium air–water surface tension of a demulsifier solution is a bulk property that correlates only loosely with demulsification efficiency, because the rate-limiting factor in breaking a stable W/O emulsion is not the thermodynamic reduction of interfacial free energy but the mechanical destabilisation of the adsorbed asphaltene–resin network [42]. The literature contains many examples of demulsifiers that lower interfacial tension strongly yet perform poorly, and of others, including polymeric and particle-stabilised systems, that perform well while lowering interfacial tension only modestly [18,19]. The performance of KS-6 is therefore best attributed to the mixed calcium–strontium stearate layer, which reduces the viscoelastic modulus of the interfacial film, rather than to bulk surface activity. A dedicated interfacial-rheology study, measuring the dilational elastic and viscous moduli of the crude–water interface in the presence and absence of KS-6, would test this interpretation directly and is the obvious next step.
3.8. Proposed Mechanism of Demulsification
The evidence assembled above supports a five-stage mechanism in which the three components of the formulation perform distinct and sequential roles. The sequence is summarised in Figure 11.
Figure 11.
Proposed mechanism of demulsification by the sodium xylenesulfonate/calcium–strontium stearate/waste-oil composition: (a) the individual components; (b) formation of a homogeneous composition in the waste-oil carrier; (c) transport to and competitive adsorption at the oil–water interface; (d) disruption of the asphaltene–resin film by the disordered mixed stearate layer; (e) coalescence of the liberated droplets and gravitational phase separation.
Stage 1—Component functions. Sodium xylenesulfonate provides the anionic head group and the aromatic nucleus; the latter is not incidental, since the π system can engage in stacking interactions with the polyaromatic cores of asphaltenes and so provides an affinity anchor at the interface [43]. Calcium stearate raises the lipophilicity and viscosity of the blend and secures compatibility with the oil phase. Strontium stearate, at 10% of the stearate pair, disrupts the packing order of the mixed soap layer. Waste motor oil serves as the dispersion medium, ensuring uniform distribution of the active species and rapid transport through the continuous phase.
Stage 2—Formation of a homogeneous composition. On mixing, the sulfonate is dispersed throughout the waste oil while the metal stearates form a colloidally stable suspension in the hydrocarbon medium. Van der Waals and hydrophobic interactions between the stearate alkyl chains and the oil, and between the aromatic nucleus of the sulfonate and the aromatic fraction of the oil, hold the system together as a stable single-phase dispersion. The aggregative stability achieved at this stage determines the reproducibility of the subsequent performance.
Stage 3—Transport and competitive adsorption. Injected into the emulsion, the composition disperses in the continuous oil phase and its active species reach the oil–water boundary. The water droplets are armoured by asphaltenes, resins and other high-molar-mass species. The sulfonate head groups adsorb at vacant interfacial sites and compete with the natural emulsifiers for occupancy; the interfacial tension falls and the natural protective layer begins to be displaced.
Stage 4—Disruption of the interfacial film. As adsorption proceeds, the stearate molecules penetrate the asphaltene–resin layer. Because the mixed Ca/Sr soap layer is intrinsically disordered, it cannot substitute a film of equivalent mechanical strength for the one it displaces. The consequences are the fragmentation of asphaltene aggregates [43], the loss of elasticity of the resin layer, a fall in the interfacial viscoelastic modulus, and finally the rupture of the protective film separating adjacent droplets. This is the decisive step: emulsion stability collapses here.
Stage 5—Coalescence and phase separation. Once the film is breached, colliding droplets merge instead of rebounding. Droplet growth increases the Stokes settling velocity as the square of the radius, so coalescence and sedimentation reinforce one another autocatalytically. Water accumulates in the lower layer, dehydrated oil in the upper, and the emulsion resolves into two phases.
The mechanism accounts for the two experimental optima found in this work. The optimum in strontium content (Stage 4) reflects the packing-disruption argument set out in Section 3.5.1: too little strontium leaves the calcium soap layer ordered, too much allows a new ordered phase to form. The optimum in surfactant loading (Stage 3) reflects the partitioning argument of Section 3.5.2: too little sulfonate provides an insufficient flux of competing molecules to the interface, too much raises the blend HLB above the point at which the composition disperses effectively in the oil phase. That both optima emerge naturally from the mechanism, and that neither is a monotonic dose response, provides internal consistency between the mechanistic and the empirical parts of the study.
It is worth setting this scheme against the way conventional demulsifiers are understood to work. The established picture, summarised in the recent state-of-the-art review of interface structure and phase interaction in the petroleum industry [44], treats demulsification as a sequence of flocculation, film drainage and coalescence in which the demulsifier acts chiefly by lowering the dynamic interfacial tension and by increasing the interfacial mobility, so that the thin film between two approaching droplets drains faster. Commercial polyether demulsifiers are designed on exactly this principle: a high-molar-mass, strongly surface-active block copolymer adsorbs at the interface, displaces the asphaltenes and replaces their rigid network with a mobile, low-tension layer of its own. The rate-limiting step in that picture is film drainage, and the design variable is interfacial activity.
The composition described here differs from that picture in three respects, and the differences are what the data of Section 3.5 and Section 3.7 actually demand. First, the active species is not a single high-molar-mass surfactant but a pair of functionally separated components: a small, strongly hydrophilic hydrotrope that supplies the competing head group, and a lipophilic soap pair that supplies both the carrier and the film-disrupting agent. Neither component is an effective demulsifier alone—the sulfonate because its HLB of 14.2 keeps it out of the oil phase (Section 3.4), the stearates because they provide no competing head group—and the activity is created by the combination. Second, the destabilising action is mechanical rather than tensiometric. The measured surface tension of KS-6 is higher than that of the imported reference it outperforms (Section 3.7), so the advantage cannot be a lower interfacial tension; what the mixed soap layer does is to replace a rigid, cross-linked asphaltene network with a layer that is intrinsically unable to sustain shear, which attacks the elasticity of the film rather than its drainage rate. Third, and as a direct consequence, the design variable is the packing order of the adsorbed layer rather than the surface activity of a single molecule, which is why a 2 wt.% change in the strontium content of the stearate pair produces a 27% change in separation time while leaving the bulk surface tension essentially unaltered. In the terminology of [44], the present formulation acts on the interfacial rheology branch of the stability problem rather than on the interfacial-tension branch, and the two approaches should in principle be complementary.
The mechanism is nevertheless a proposal, and the evidential basis of each stage should be stated explicitly. Stage 1 rests on the composition of the blend and on the literature behaviour of its components, together with the ionic-radius argument of Section 3.5.1; it is inference from known chemistry rather than direct measurement. Stage 2 is supported by direct observation: the blend remains a single, homogeneous, non-settling dispersion over the period of the tests, and the reproducibility of the performance data implies that the dispersion is aggregatively stable. Stage 3 is supported indirectly and quantitatively—the existence of an interior optimum in surfactant loading, and its coincidence with a calculated blend HLB of 4.5 at the centre of the window expected for water-in-oil systems, is difficult to explain except by competitive partitioning and adsorption—but no direct measurement of interfacial coverage was made. Stage 4 is supported by the optical micrographs of Figure 8, in which the dark asphaltene–resin rims that surround the untreated droplets are absent after treatment, and by the non-monotonic strontium response, which is a packing argument and not a dose–response; it is not supported by any direct mechanical measurement of the film. Stage 5 is supported by the bottle tests and by the micrographs, which show the disappearance of the flocculated droplet clusters.
The weakest link is therefore Stage 4, the step that the whole interpretation turns on, and three experiments would test it directly. Interfacial dilational and shear rheometry of the crude–water interface, with and without KS-6 and across the strontium series, would show whether the elastic modulus of the adsorbed layer passes through a minimum at 10 wt.% strontium as the mechanism requires; this is the decisive measurement and is already proposed in Section 3.7. Atomic force microscopy of Langmuir–Blodgett films transferred from the interface would image the packing disorder of the mixed soap layer directly and establish whether the strontium soap forms separate domains above 10 wt.%, as the loss of synergy at higher loadings implies. Molecular dynamics simulation of a mixed Ca/Sr stearate monolayer in contact with a model asphaltene aggregate would provide the molecular-scale counterpart, quantifying the dependence of layer order on cation substitution. Until these are available, Stages 3 and 4 should be read as the most economical explanation of the two optima rather than as independently demonstrated facts.
3.9. Technological, Economic and Environmental Assessment
The composition of the optimum formulation is itself the clearest statement of its economic logic: KS-6 consists of 50 wt.% waste motor oil, a negative-cost feedstock; 30 wt.% of a surfactant synthesised in a single step from a currently unvalorised refinery by-product using commodity sulfuric acid; and 20 wt.% of metal stearates prepared from stearic acid, lime and strontium chloride, all available domestically. No component requires ethoxylation, no high-pressure equipment is involved, and the synthesis proceeds at atmospheric pressure below 120 °C. By contrast, the imported polyether-based demulsifiers currently in use require ethylene and propylene oxide, pressurised alkoxylation reactors and international logistics.
The environmental case rests on three points. Diverting waste lubricating oil from uncontrolled disposal into a chemical product removes a hazardous stream from the environment; waste lubricating oils contain polycyclic aromatic hydrocarbons and heavy metals and are a recognised soil and groundwater contaminant at the global scale of more than 24 Mt a−1 [26,27,28]. Valorising the pyrolysis distillate replaces flaring or low-value fuel use with chemical conversion. And the improved desalting performance of KS-6 reduces the chloride load reaching the refinery, with corresponding reductions in corrosion-driven maintenance and in the acid-neutralisation chemicals consumed downstream. The toxicity class of KS-6 is IV, the least hazardous category, and identical to that of both commercial references, so no additional handling burden is introduced.
The variability of the waste-oil feedstock deserves to be treated at length, because it is the principal obstacle between the laboratory result and industrial adoption. Used lubricating oil is not a specification product. Its composition depends on the base-oil group of the original lubricant, on the additive package (zinc dialkyldithiophosphates, calcium and magnesium sulfonate and phenate detergents, polymeric viscosity-index improvers, succinimide dispersants), on the duty cycle and age of the engine, and on the degree of contamination with fuel, water, coolant and wear metals at the point of collection. Several of these are not neutral diluents in the present context. The calcium and magnesium sulfonates and phenates carried over from the detergent package are themselves interfacially active and would add to the soap layer described in Stage 4; the succinimide dispersants are, in effect, demulsifier antagonists, since their function in the engine is to keep polar material suspended; and residual water or glycol would alter the effective HLB of the blend. A batch unusually rich in dispersant or unusually dilute in base oil could therefore shift both the optimum surfactant loading and the absolute performance.
All of the data reported here were obtained with a single, thoroughly homogenised collection batch, precisely so that the composition screening should not be confounded by this variability; no comparison between batches or collection points was made, and the sensitivity of performance to feedstock variation is accordingly unquantified. This is a genuine limitation of the present study and it is not resolved by the data in hand. What can be proposed is the qualification protocol that would control it. Four inexpensive determinations characterise an incoming batch adequately for this purpose: kinematic viscosity at 40 and 100 °C, which fixes the base-oil grade and detects dilution by fuel; sulfated ash and total base number, which together quantify the residual metallic detergent and therefore the uncontrolled contribution to the soap layer; water content by Karl Fischer titration, with a proposed limit of 0.3 wt.% and a settling or centrifugation step for batches that exceed it; and a single-point bottle test of a reference KS-6 formulation prepared from the candidate batch against the field emulsion, with acceptance if the degree of dehydration falls within 5% of the value obtained with the qualified reference batch. A batch that fails the last test would be blended with qualified material rather than rejected. Establishing the acceptance windows of this protocol over a representative set of collection points, and quantifying the resulting spread in demulsification performance, is the first task of the pilot programme.
Two further limitations should be stated plainly. The xylene feedstock is a mixture of isomers, so the surfactant is necessarily a mixture of positional isomers whose individual contributions to performance have not been separated. And all results reported here are from laboratory bottle tests and static settling; they establish the ranking of the compositions but do not substitute for pilot trials under the dynamic, electrostatically assisted conditions of a field dehydration unit. Such trials, together with the interfacial-rheology measurements proposed in Section 3.7 and a formal life-cycle assessment, constitute the natural continuation of this work.
4. Conclusions
A multicomponent demulsifier for stable water-in-crude-oil emulsions has been assembled entirely from two secondary streams that are currently discarded in Uzbekistan—the xylene-rich pyrolysis distillate of the Ustyurt gas-chemical complex and collected waste motor oil—and benchmarked against the imported products in industrial use. The principal results are the following.
- (1)
- Synthesis. Pyrolysis-derived xylene was sulfonated and neutralised to sodium xylenesulfonate in 96.8% isolated yield at 110–120 °C with 98 wt.% H2SO4 at an acid:xylene molar ratio of 1.34:1 over 60 min; concentrated acid outperformed oleum, which promotes disulfonation and sulfone formation.
- (2)
- Kinetics. The fixed-time yields follow a linear Arrhenius dependence (R2 = 0.998) with Ea = 21.7 kJ mol−1, ΔH‡ = 18.4 kJ mol−1, ΔS‡ = −262 J mol−1 K−1 and ΔG‡ = 121.5 kJ mol−1 at 393 K. An activation energy three times below the homogeneous-phase value identifies the reaction as transport-influenced, so agitation rather than temperature is the productive scale-up variable.
- (3)
- Characterisation. FTIR confirms an intact aromatic nucleus, unoxidised methyl substituents and a fully ionised sulfonate head group; TG/DTA shows a cumulative mass loss of only 5.92% below 415 °C, so the salt is thermally inert across the whole operating envelope of a field dehydration unit.
- (4)
- Design principle. Of four HLB estimates only the Davies value (14.2) is compatible with the observed water solubility. That value is far above the 3–6 window of water-in-oil demulsifiers and explains why the sulfonate cannot act alone; it converts the formulation problem into an explicit HLB-matching exercise, and the empirical optimum KS-6 is found at a calculated blend HLB of 4.5, at the centre of that window.
- (5)
- Performance. KS-6 (30 wt.% sulfonate, 50 wt.% waste oil, 18 wt.% Ca and 2 wt.% Sr stearate) gives water-separation efficiencies of 81.0, 93.7 and 98.9% at water cuts of 60, 70 and 80 vol.%, exceeding ND-12 by factors of 1.20, 1.26 and 1.18. On the stable field emulsion at 90 g t−1 it resolves the phases in 2.7 h against 4.2 h, reaches 98.8% dehydration against 92.5%, and lowers the residual salt content to 125 mg dm−3 against 265 mg dm−3, bringing the treated crude below the 150 mg dm−3 refinery feed limit that the imported reference fails to meet.
Two findings constitute the novelty of the work. The first is the packing-disruption strategy: replacing just 2 wt.% of the calcium stearate by strontium stearate shortens the phase-separation time from 33 to 24 min, a 27% gain that is sharply non-monotonic and is lost again above 10 wt.% strontium. The effect is attributed to the larger, less polarising Sr2+ cation acting as a lattice defect that prevents the mixed soap layer from forming an ordered, mechanically coherent film—a design variable that has not previously been exploited in demulsifier formulation. The second is the demonstration that this advantage is mechanical rather than tensiometric: KS-6 has a higher surface tension than the reference it outperforms (37 against 34 mN m−1), so its performance cannot be explained by the conventional interfacial-tension mechanism and must instead be ascribed to the loss of viscoelasticity of the adsorbed asphaltene–resin network. Together these results show that a competitive, import-substituting demulsifier can be built from waste streams, and that the active principle is the deliberate engineering of disorder in the adsorbed layer rather than the surface activity of any single component. Direct interfacial rheometry, a finer composition screen around the strontium optimum, quantification of the sensitivity to waste-oil batch variability, and pilot trials under dynamic electrostatic conditions are the necessary next steps.
Supplementary Materials
The following supporting information can be downloaded at: https://www.mdpi.com/article/10.3390/chemistry8110150/s1. Table S1: effect of the concentration of the sulfonating agent on the yield of sodium xylenesulfonate; Table S2: thermogravimetric and differential thermal data for sodium xylenesulfonate.
Author Contributions
Conceptualization, K.O.; methodology, K.O.; validation, B.R. and V.A.; formal analysis, K.O.; investigation, K.O., B.R., V.A., S.F. and D.M.; resources, B.O.; data curation, B.O. and D.M.; writing—original draft preparation, K.O.; writing—review and editing, B.R., V.A. and B.O.; visualization, B.R., V.A. and S.F.; supervision, B.O.; project administration, B.O. All authors have read and agreed to the published version of the manuscript.
Funding
This research received no external funding.
Institutional Review Board Statement
Not applicable.
Informed Consent Statement
Not applicable.
Data Availability Statement
The original data presented in this study are contained within the article and the Supplementary Materials. Further inquiries can be directed to the corresponding author.
Acknowledgments
The authors thank the scientific laboratories of Bukhara State Technical University, where this work was carried out between 2024 and 2026, and acknowledge Uz-Kor Gas Chemical LLC for the supply of pyrolysis-distillate-derived xylene and the Sho̒rtan Oil and Gas Production Department for providing field crude and emulsion samples.
Conflicts of Interest
The authors declare no conflicts of interest.
Abbreviations
The following abbreviations are used in this manuscript:
| Abbreviation | Definition |
| SXS | Sodium xylenesulfonate |
| W/O | Water-in-oil |
| HLB | Hydrophilic–lipophilic balance |
| FTIR | Fourier-transform infrared spectroscopy |
| ATR | Attenuated total reflectance |
| TG | Thermogravimetry |
| DTA | Differential thermal analysis |
| KS-1 to KS-7 | Demulsifier compositions developed in this work |
| ND-12, SD-1 | Commercial reference demulsifiers |
| LLC | Limited liability company |
| JSC | Joint-stock company |
References
- Kokal, S. Crude oil emulsions: A state-of-the-art review. SPE Prod. Facil. 2005, 20, 5–13. [Google Scholar] [CrossRef] [Scilit]
- Sjöblom, J.; Aske, N.; Auflem, I.H.; Brandal, Ø.; Havre, T.E.; Sæther, Ø.; Westvik, A.; Johnsen, E.E.; Kallevik, H. Our current understanding of water-in-crude oil emulsions: Recent characterization techniques and high pressure performance. Adv. Colloid Interface Sci. 2003, 100–102, 399–473. [Google Scholar]
- Wong, S.F.; Lim, J.S.; Dol, S.S. Crude oil emulsion: A review on formation, classification and stability of water-in-oil emulsions. J. Pet. Sci. Eng. 2015, 135, 498–504. [Google Scholar] [CrossRef] [Scilit]
- Abdulredha, M.M.; Siti Aslina, H.; Luqman, C.A. Overview on petroleum emulsions, formation, influence and demulsification treatment techniques. Arab. J. Chem. 2020, 13, 3403–3428. [Google Scholar] [CrossRef] [Scilit]
- Kilpatrick, P.K. Water-in-crude oil emulsion stabilization: Review and unanswered questions. Energy Fuels 2012, 26, 4017–4026. [Google Scholar] [CrossRef] [Scilit]
- Czarnecki, J.; Moran, K. On the stabilization mechanism of water-in-oil emulsions in petroleum systems. Energy Fuels 2005, 19, 2074–2079. [Google Scholar] [CrossRef] [Scilit]
- Yang, F.; Tchoukov, P.; Pensini, E.; Dabros, T.; Czarnecki, J.; Masliyah, J.; Xu, Z. Asphaltene subfractions responsible for stabilizing water-in-crude oil emulsions. Energy Fuels 2014, 28, 6897–6904. [Google Scholar] [CrossRef] [Scilit]
- Song, F.; Zheng, H.; Li, T.; Fu, X.; Feng, C.; Ma, C.; Jiang, S.; Wang, J.; Huang, Y.; Zhou, F. The influence of asphaltene and resin on the stability of crude oil emulsion and its demulsification mechanism. J. Mol. Liq. 2024, 413, 125924. [Google Scholar] [CrossRef] [Scilit]
- Schramm, L.L. Emulsions, Foams, and Suspensions: Fundamentals and Applications; Wiley-VCH: Weinheim, Germany, 2005; 448p. [Google Scholar]
- Tadros, T.F. Emulsion Formation and Stability; Wiley-VCH: Weinheim, Germany, 2013; 258p. [Google Scholar]
- Zolfaghari, R.; Fakhru’l-Razi, A.; Abdullah, L.C.; Elnashaie, S.S.E.H.; Pendashteh, A. Demulsification techniques of water-in-oil and oil-in-water emulsions in petroleum industry. Sep. Purif. Technol. 2016, 170, 377–407. [Google Scholar] [CrossRef] [Scilit]
- Raya, S.A.; Mohd Saaid, I.; Abbas Ahmed, A.; Abubakar Umar, A. A critical review of development and demulsification mechanisms of crude oil emulsion in the petroleum industry. J. Pet. Explor. Prod. Technol. 2020, 10, 1711–1728. [Google Scholar] [CrossRef] [Scilit]
- Tang, L.; Wang, T.; Xu, Y.; He, X.; Yan, A.; Zhang, Z.; Li, Y.; Chen, G. Research and application progress of crude oil demulsification technology. Processes 2024, 12, 2292. [Google Scholar] [CrossRef] [Scilit]
- Li, Q.; Zhang, G.; Cao, H.; Li, Q.; Wang, F.; Wu, J.; Chen, W.; Ma, W. Multiphysics modeling and microscopic analysis of water-based heat extraction from hot dry rock reservoirs. Energies 2026, 19, 4513. [Google Scholar] [CrossRef] [Scilit]
- Ao, F.; Li, Q.; Li, Q.; Wu, J.; Wang, F.; Yan, C. Numerical simulation investigation of fracture propagation behavior patterns and sensitivity factors of oil shale reservoirs in the Xunyi region considering the influence of natural fracture. Geofluids 2025, 2025, 2762142. [Google Scholar] [CrossRef] [Scilit]
- Wu, J.; Li, Q.; Li, Q.; Wang, F.; Cheng, Y.; Yan, C. Design and optimization of bottom-hole temperature–pressure combinations in gas production from gas hydrates via carbon dioxide replacement strategy. Energies 2026, 19, 3536. [Google Scholar] [CrossRef] [Scilit]
- Yang, X.; Chen, S.; Chen, H.; He, L.; Ni, Y.; Liu, S.; Chen, Z.; Tian, Y. Comprehensive review of stabilising factors, demulsification methods, and chemical demulsifiers of oil–water emulsions. Sep. Purif. Technol. 2025, 358, 130206. [Google Scholar] [CrossRef] [Scilit]
- Feng, X.; Xu, Z.; Masliyah, J. Biodegradable polymer for demulsification of water-in-bitumen emulsions. Energy Fuels 2009, 23, 451–456. [Google Scholar] [CrossRef] [Scilit]
- Li, Z.; Chakraborty, A.; Fuentes, J.; Zamora, E.; Vázquez, F.; Xu, Z.; Liu, Q.; Flores, C.; McCaffrey, W.C. Study on demulsifier–crude oil interactions at oil–water interface for crude oil dehydration. Colloids Surf. A 2021, 630, 127526. [Google Scholar] [CrossRef] [Scilit]
- Hirasaki, G.J.; Miller, C.A.; Raney, O.G.; Poindexter, M.K.; Nguyen, D.T.; Hera, J. Separation of produced emulsions from surfactant enhanced oil recovery processes. Energy Fuels 2011, 25, 555–561. [Google Scholar] [CrossRef] [Scilit]
- Javadian, S.; Sadrpoor, S.M.; Khosravian, M. Taking a look accurately at the alteration of interfacial asphaltene film exposed to ionic surfactants as demulsifiers. Sci. Rep. 2023, 13, 12837. [Google Scholar] [CrossRef] [Scilit] [PubMed]
- Husain, A.; Adewunmi, A.A.; Gbadamosi, A.; Al-Harthi, M.A.; Patil, S.; Kamal, M.S. Demulsification of asphaltene stabilized crude oil emulsions by biodegradable ethylcellulose polymers with varying viscosities. Sci. Rep. 2023, 13, 1090. [Google Scholar] [CrossRef] [Scilit] [PubMed]
- Elmobarak, W.F.; Almomani, F. Application of magnetic nanoparticles for the removal of oil from oil-in-water emulsion: Regeneration/reuse of spent particles. J. Pet. Sci. Eng. 2021, 203, 108591. [Google Scholar] [CrossRef] [Scilit]
- Atta, A.M.; Al-Lohedan, H.A.; Abdullah, M.M.S.; ElSaeed, S.M. Application of new amphiphilic ionic liquid based on ethoxylated octadecylammonium tosylate as demulsifier and petroleum crude oil spill dispersant. J. Ind. Eng. Chem. 2016, 33, 122–130. [Google Scholar] [CrossRef] [Scilit]
- Zhang, Z.; Xu, G.; Wang, F.; Dong, S.; Chen, Y. Demulsification by amphiphilic dendrimer copolymers. J. Colloid Interface Sci. 2005, 282, 1–4. [Google Scholar] [CrossRef] [Scilit] [PubMed]
- Tanirbergenova, S.; Tugelbayeva, D.; Zhylybayeva, N.; Aitugan, A.; Akimbek, A.; Tazhu, K.; Moldazhanova, G.; Mansurov, Z. Recycling of petroleum-based lubricants into high-value petrochemicals and carbon-based materials. C 2026, 12, 54. [Google Scholar] [CrossRef] [Scilit]
- Lau, P.J.; Ng, W.P.Q.; How, B.S.; Lim, C.H.; Lam, H.L. Paving a way toward circular economy for oil and gas industry: A conceptual modelling of re-refining process through solvent extraction and hydrofinishing pathway. J. Clean. Prod. 2022, 380, 134839. [Google Scholar] [CrossRef] [Scilit]
- Palos, R.; Gutiérrez, A.; Vela, F.J.; Olazar, M.; Arandes, J.M.; Bilbao, J. Waste refinery: The valorization of waste plastics and end-of-life tires in refinery units. A review. Energy Fuels 2021, 35, 3529–3557. [Google Scholar] [CrossRef] [Scilit] [PubMed]
- Cerfontain, H. Mechanistic Aspects in Aromatic Sulfonation and Desulfonation; Interscience Publishers: New York, NY, USA, 1968; 320p. [Google Scholar]
- Gilbert, E.E. Sulfonation and Related Reactions; Interscience Publishers: New York, NY, USA, 1965; 529p. [Google Scholar]
- Kunz, W.; Holmberg, K.; Zemb, T. Hydrotropes. Curr. Opin. Colloid Interface Sci. 2016, 22, 99–107. [Google Scholar] [CrossRef] [Scilit]
- Eastoe, J.; Hatzopoulos, M.H.; Dowding, P.J. Action of hydrotropes and alkyl-hydrotropes. Soft Matter 2011, 7, 5917–5925. [Google Scholar] [CrossRef] [Scilit]
- Mishra, S.; Daniels, C.A. Metallic stearates. In Plastics Additives Handbook, 6th ed.; Hanser Publishers: Munich, Germany, 2009. [Google Scholar]
- Barman, S.; Vasudevan, S. Melting of saturated fatty acid zinc soaps. J. Phys. Chem. B 2006, 110, 22407–22414. [Google Scholar] [CrossRef] [Scilit] [PubMed]
- Shannon, R.D. Revised effective ionic radii and systematic studies of interatomic distances in halides and chalcogenides. Acta Crystallogr. Sect. A 1976, 32, 751–767. [Google Scholar] [CrossRef] [Scilit]
- Rosen, M.J.; Kunjappu, J.T. Surfactants and Interfacial Phenomena, 4th ed.; John Wiley & Sons: Hoboken, NJ, USA, 2012; 616p. [Google Scholar]
- Davies, J.T. A quantitative kinetic theory of emulsion type. I. Physical chemistry of the emulsifying agent. In Proceedings of the 2nd International Congress of Surface Activity, London, UK, 1957; Butterworths: London, UK, 1957; Volume 1, pp. 426–438. [Google Scholar]
- Griffin, W.C. Classification of surface-active agents by “HLB”. J. Soc. Cosmet. Chem. 1949, 1, 311–326. [Google Scholar]
- Griffin, W.C. Calculation of HLB values of non-ionic surfactants. J. Soc. Cosmet. Chem. 1954, 5, 249–256. [Google Scholar]
- Salager, J.-L.; Forgiarini, A.M.; Bullón, J. How to attain ultralow interfacial tension and three-phase behavior with a surfactant formulation. J. Surfactants Deterg. 2013, 16, 449–472. [Google Scholar] [CrossRef] [Scilit]
- Fingas, M.; Fieldhouse, B. Studies on crude oil and petroleum product emulsions: Water resolution and rheology. Colloids Surf. A 2009, 333, 67–81. [Google Scholar] [CrossRef] [Scilit]
- Kang, W.; Yin, X.; Yang, H.; Zhao, Y.; Huang, Z.; Hou, X.; Sarsenbekuly, B.; Zhu, Z.; Wang, P.; Zhang, X.; et al. Demulsification performance, behaviour and mechanism of different demulsifiers on the light crude oil emulsions. Colloids Surf. A 2018, 545, 197–204. [Google Scholar] [CrossRef] [Scilit]
- Ganeeva, Y.M.; Yusupova, T.N.; Romanov, G.V. Asphaltene nano-aggregates: Structure, phase transitions and effect on petroleum systems. Russ. Chem. Rev. 2011, 80, 993–1008. [Google Scholar] [CrossRef] [Scilit]
- Hong, J.; Wang, Z.; Li, J.; Xu, Y.; Xin, H. Effect of interface structure and behavior on the fluid flow characteristics and phase interaction in the petroleum industry: State of the art review and outlook. Energy Fuels 2023, 37, 9914. [Google Scholar] [CrossRef] [Scilit]
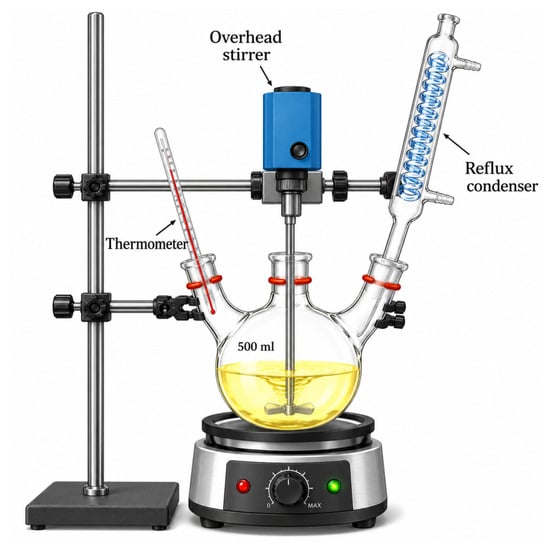
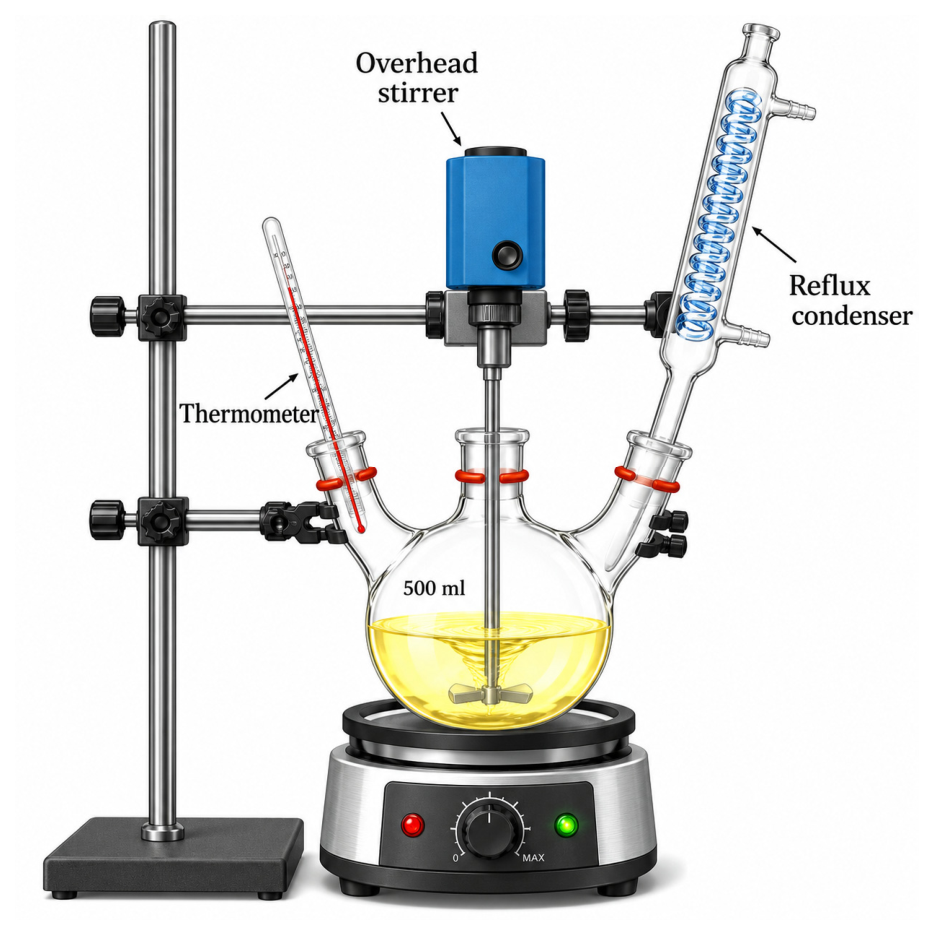
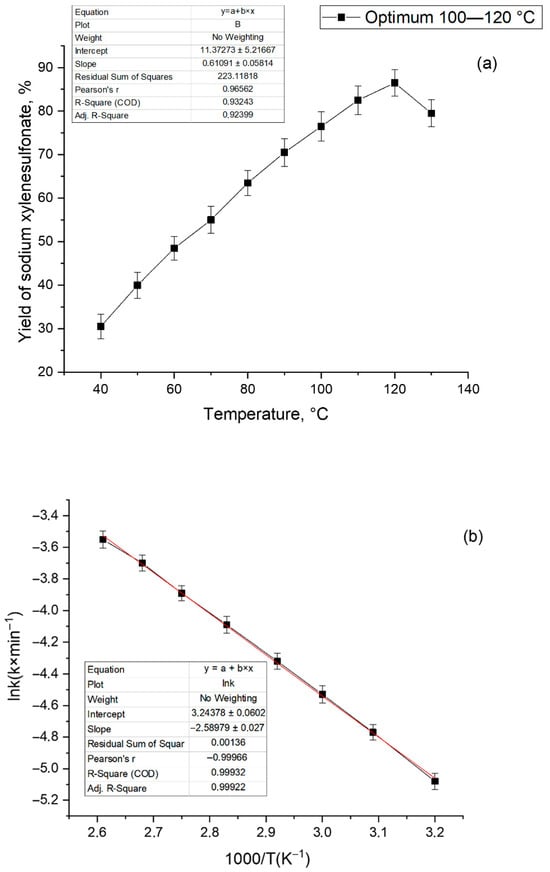
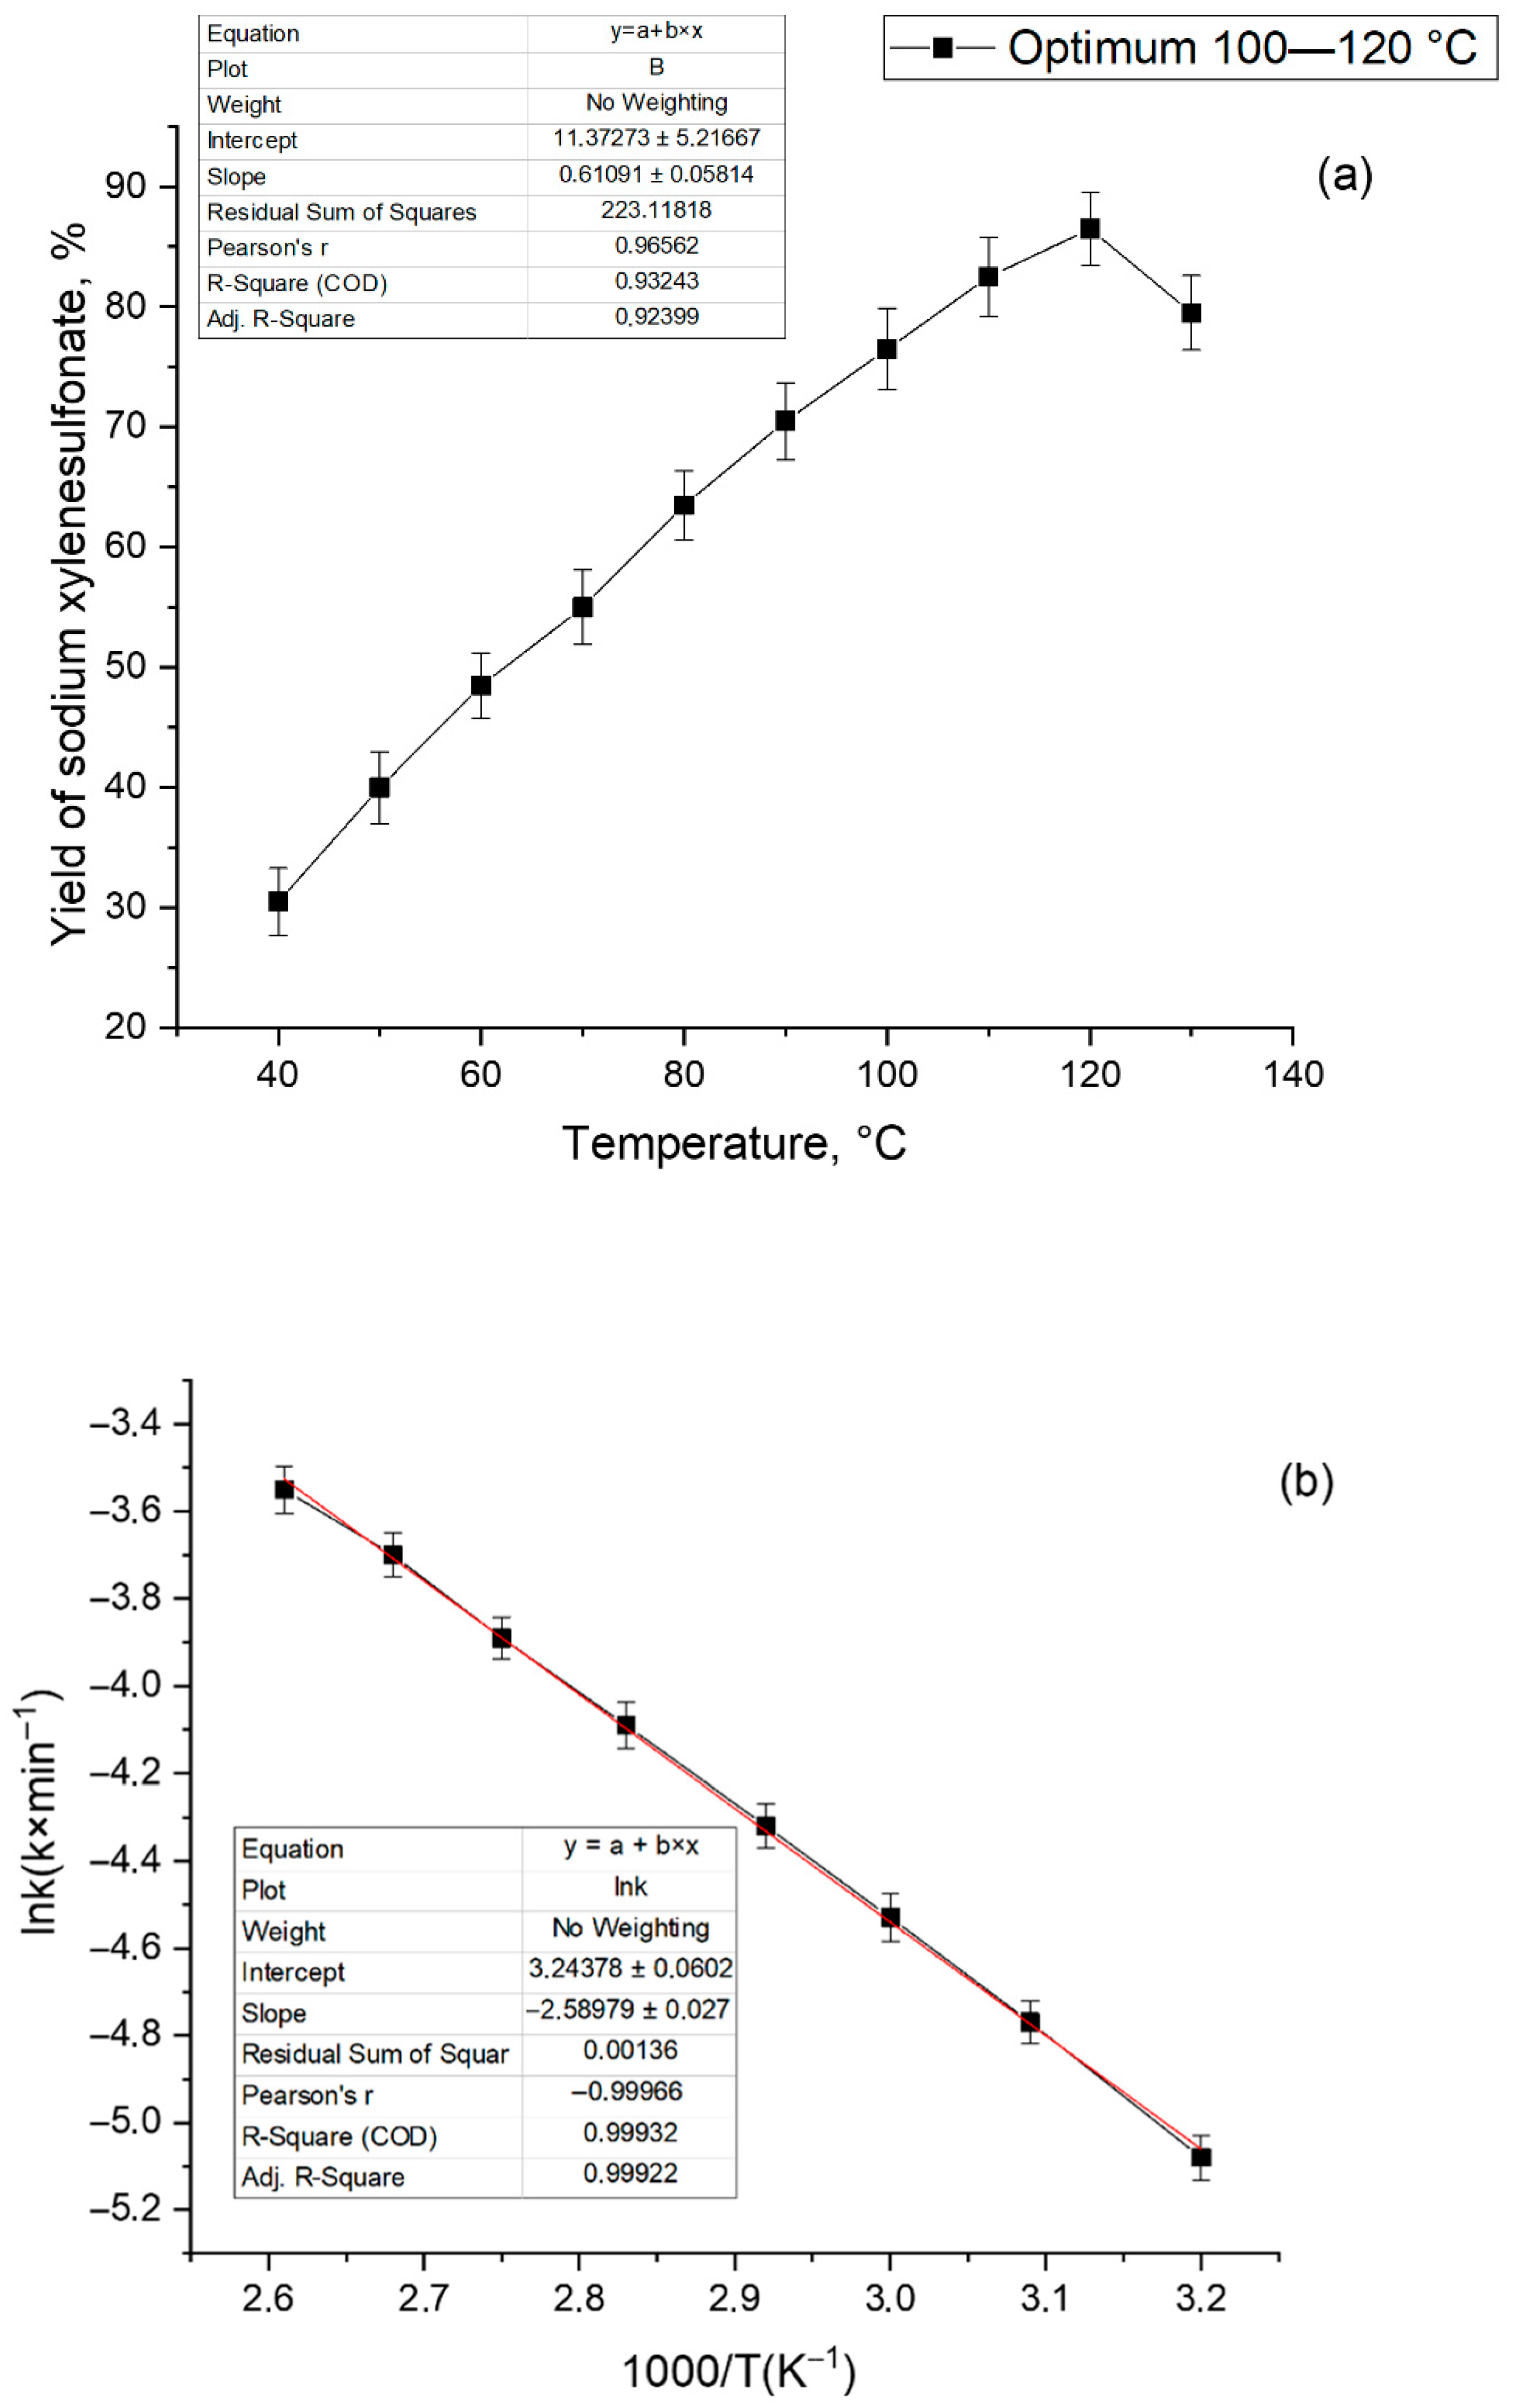
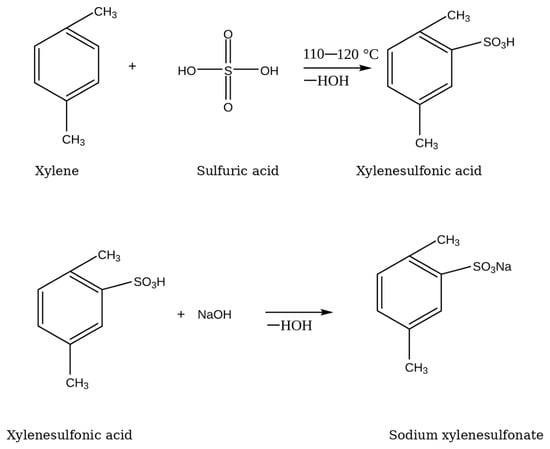
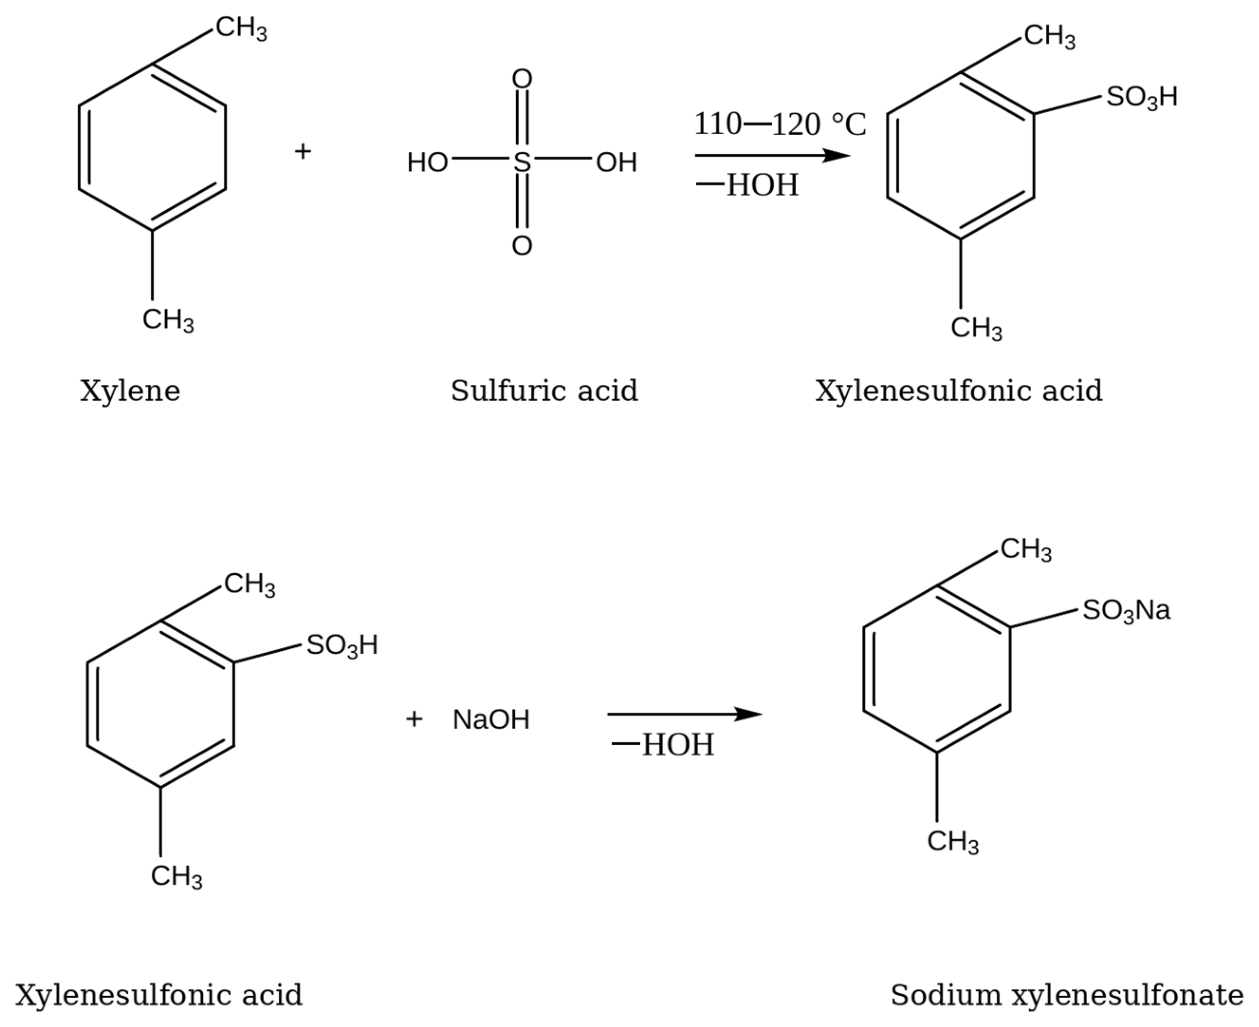
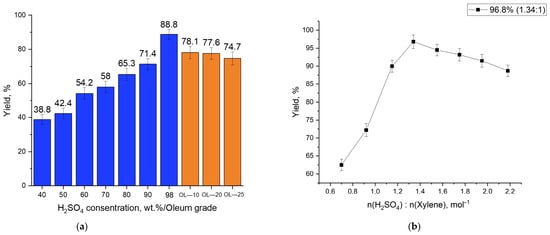
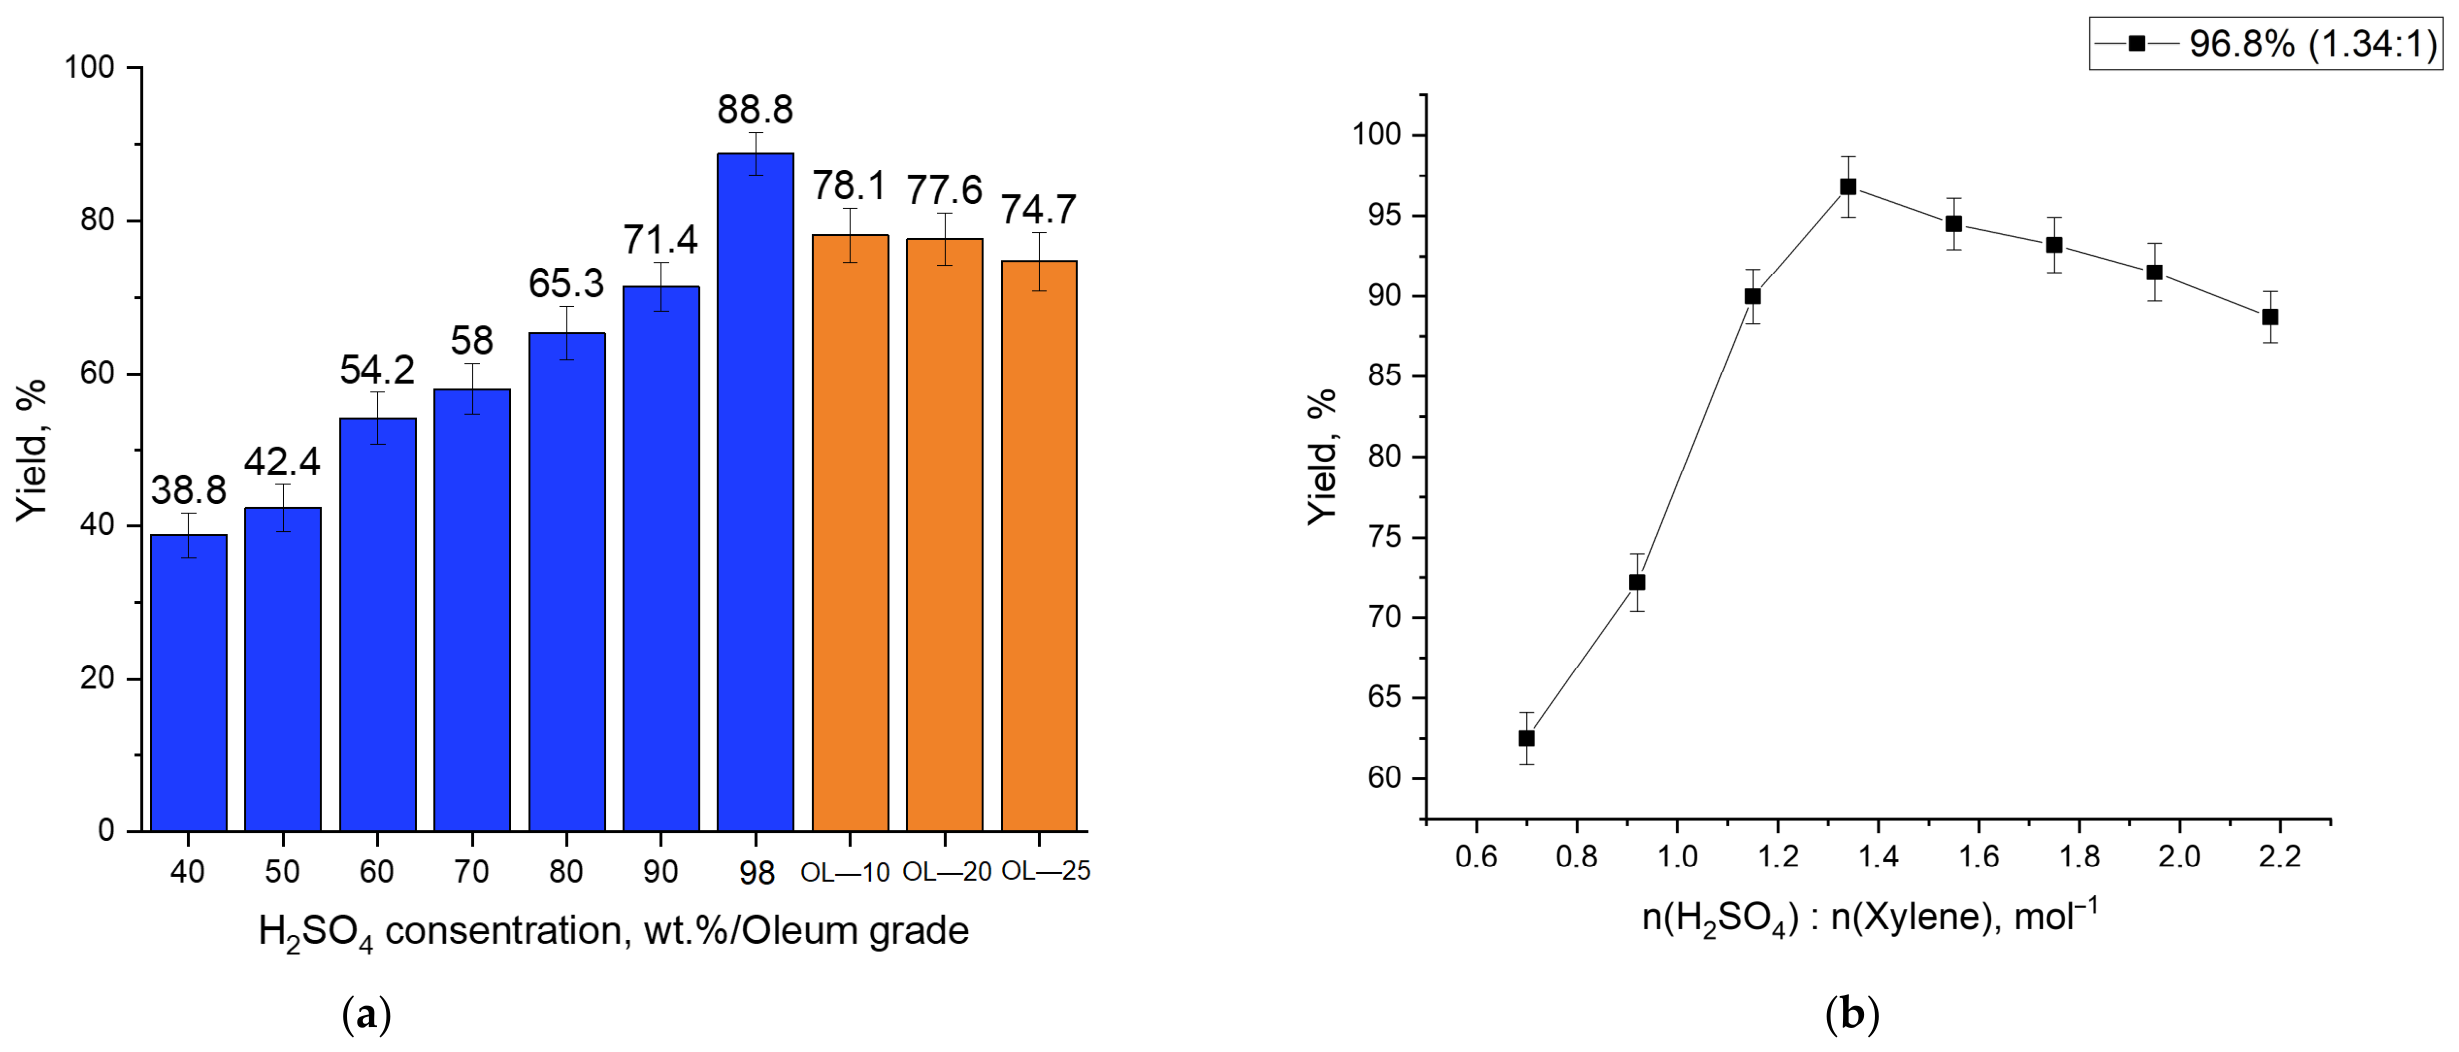
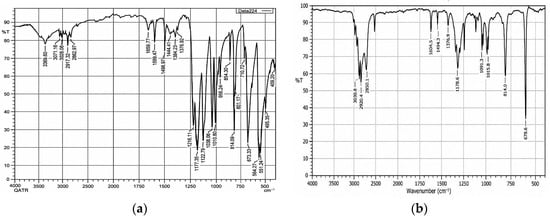
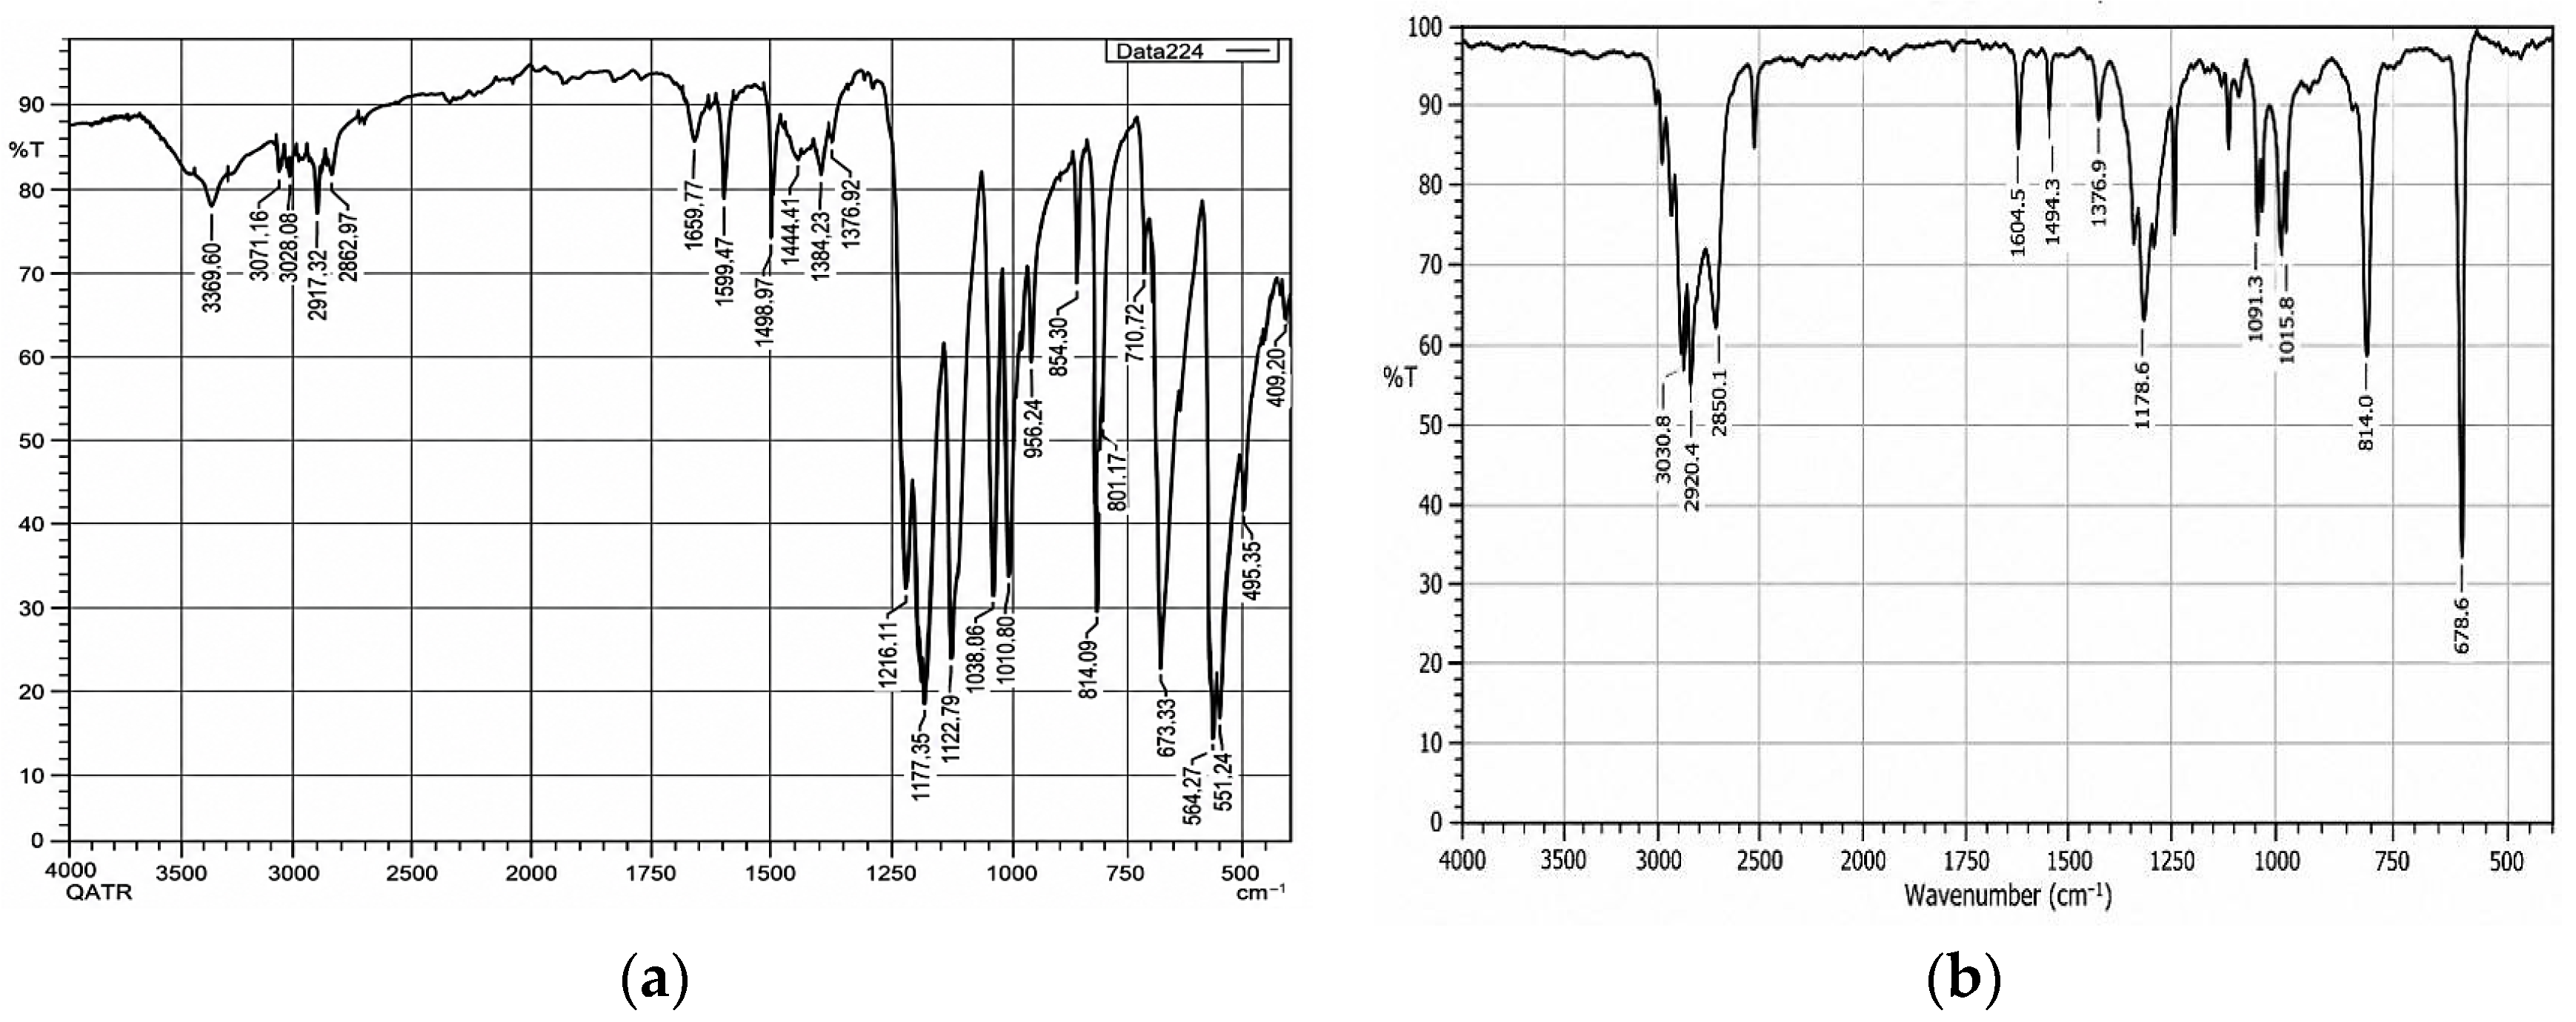
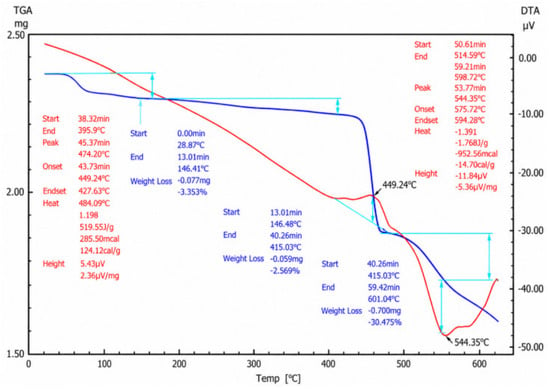
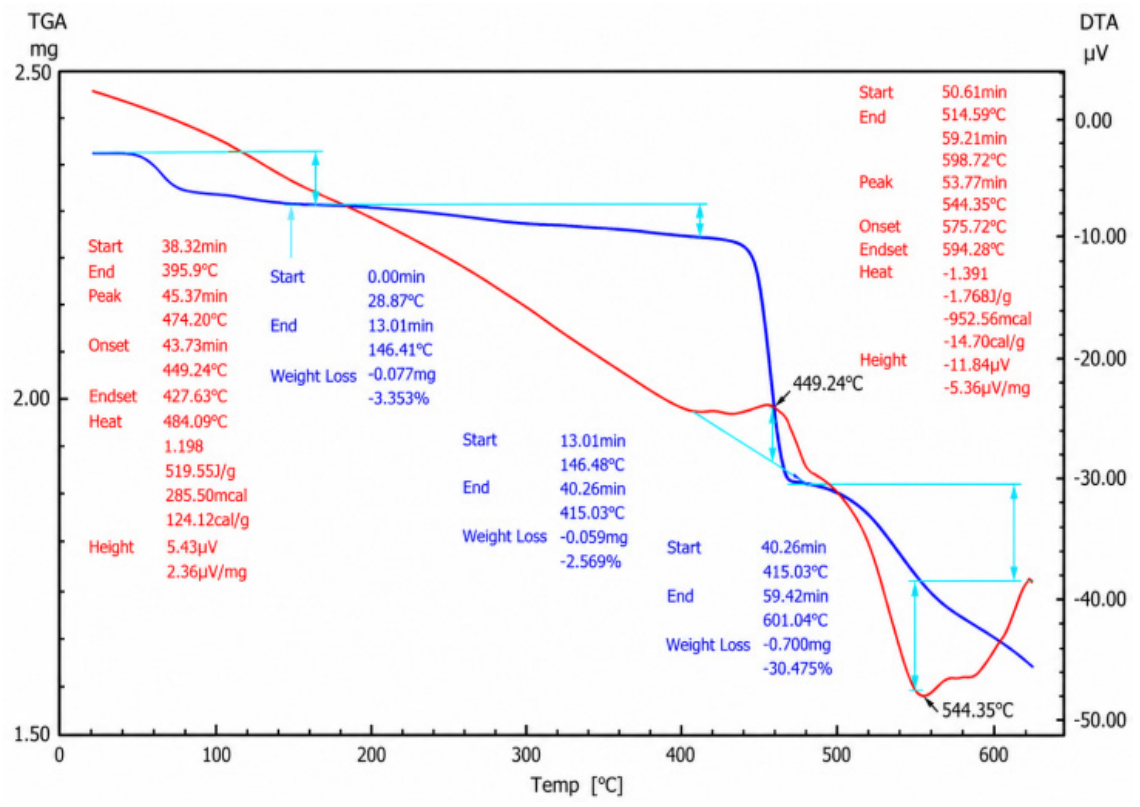
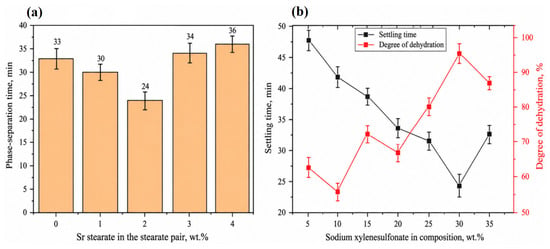
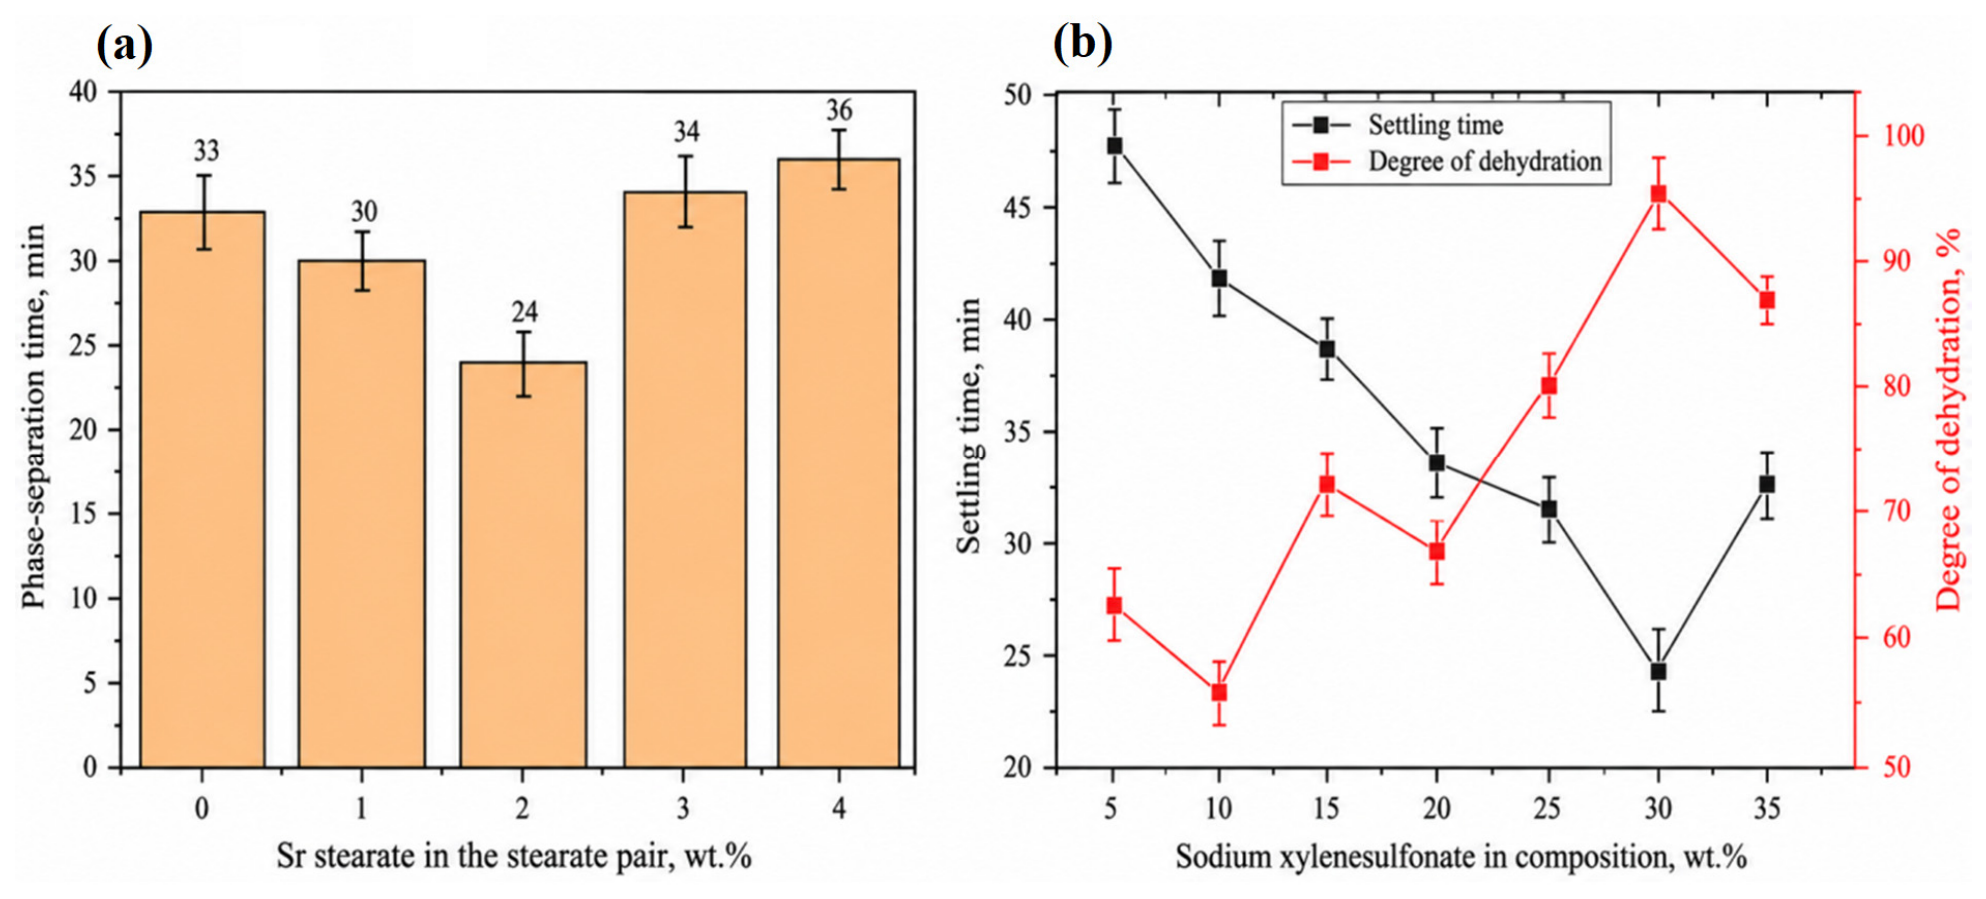
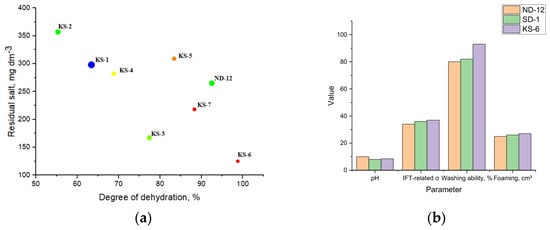
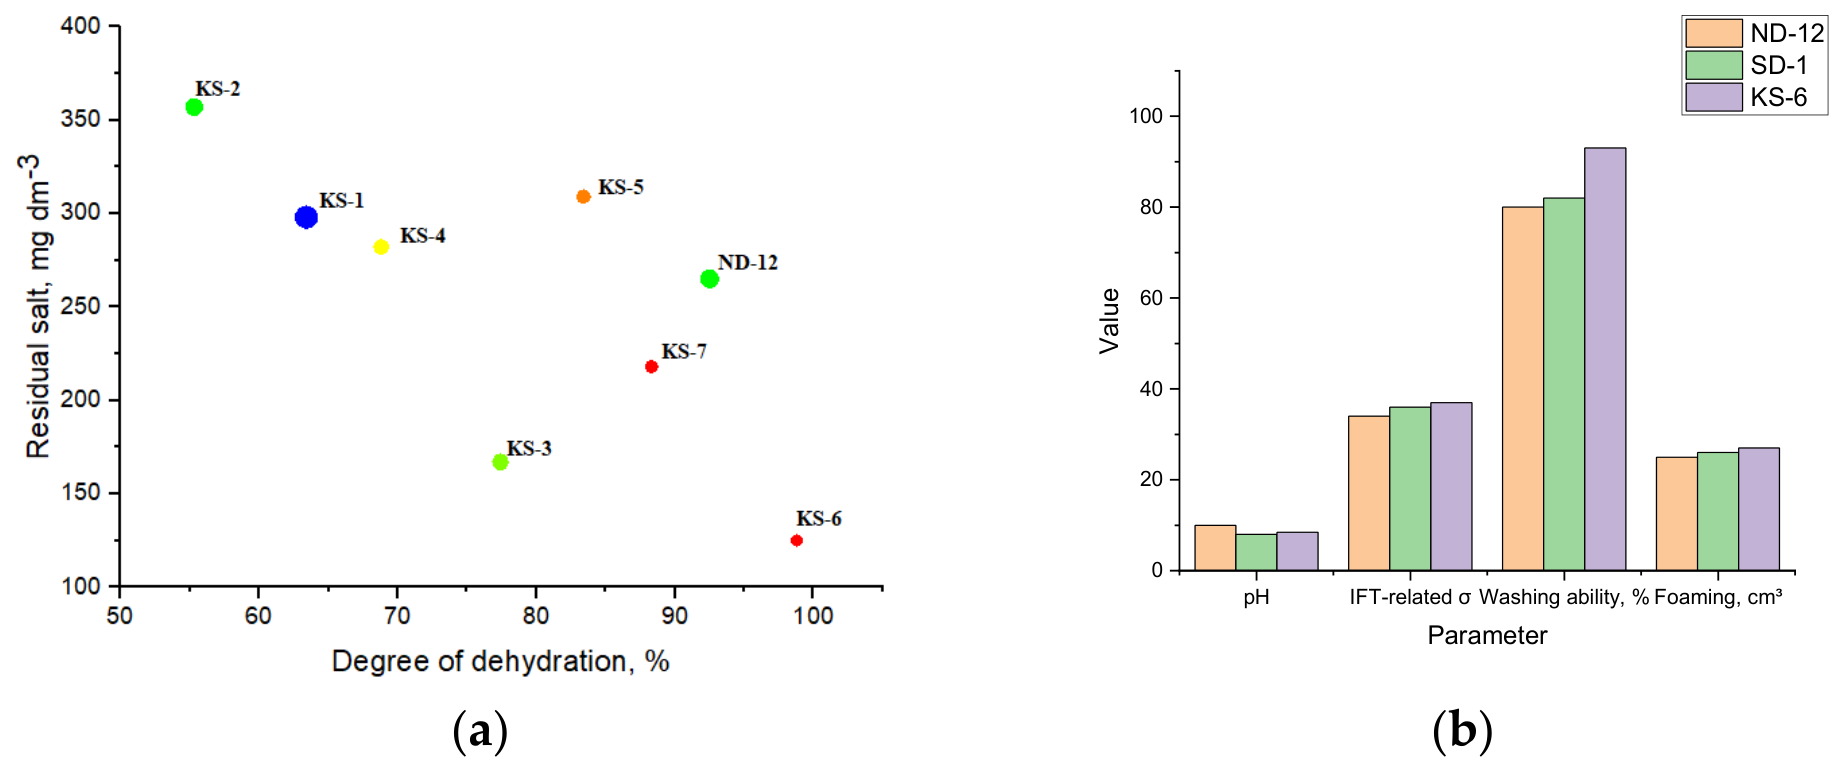
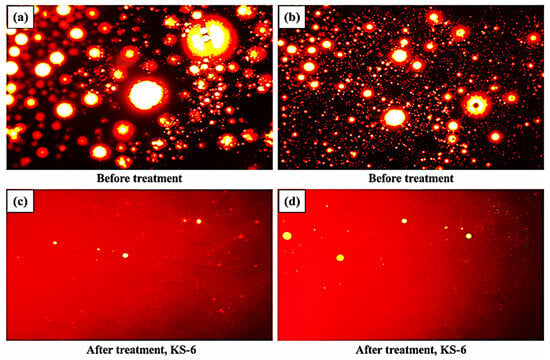
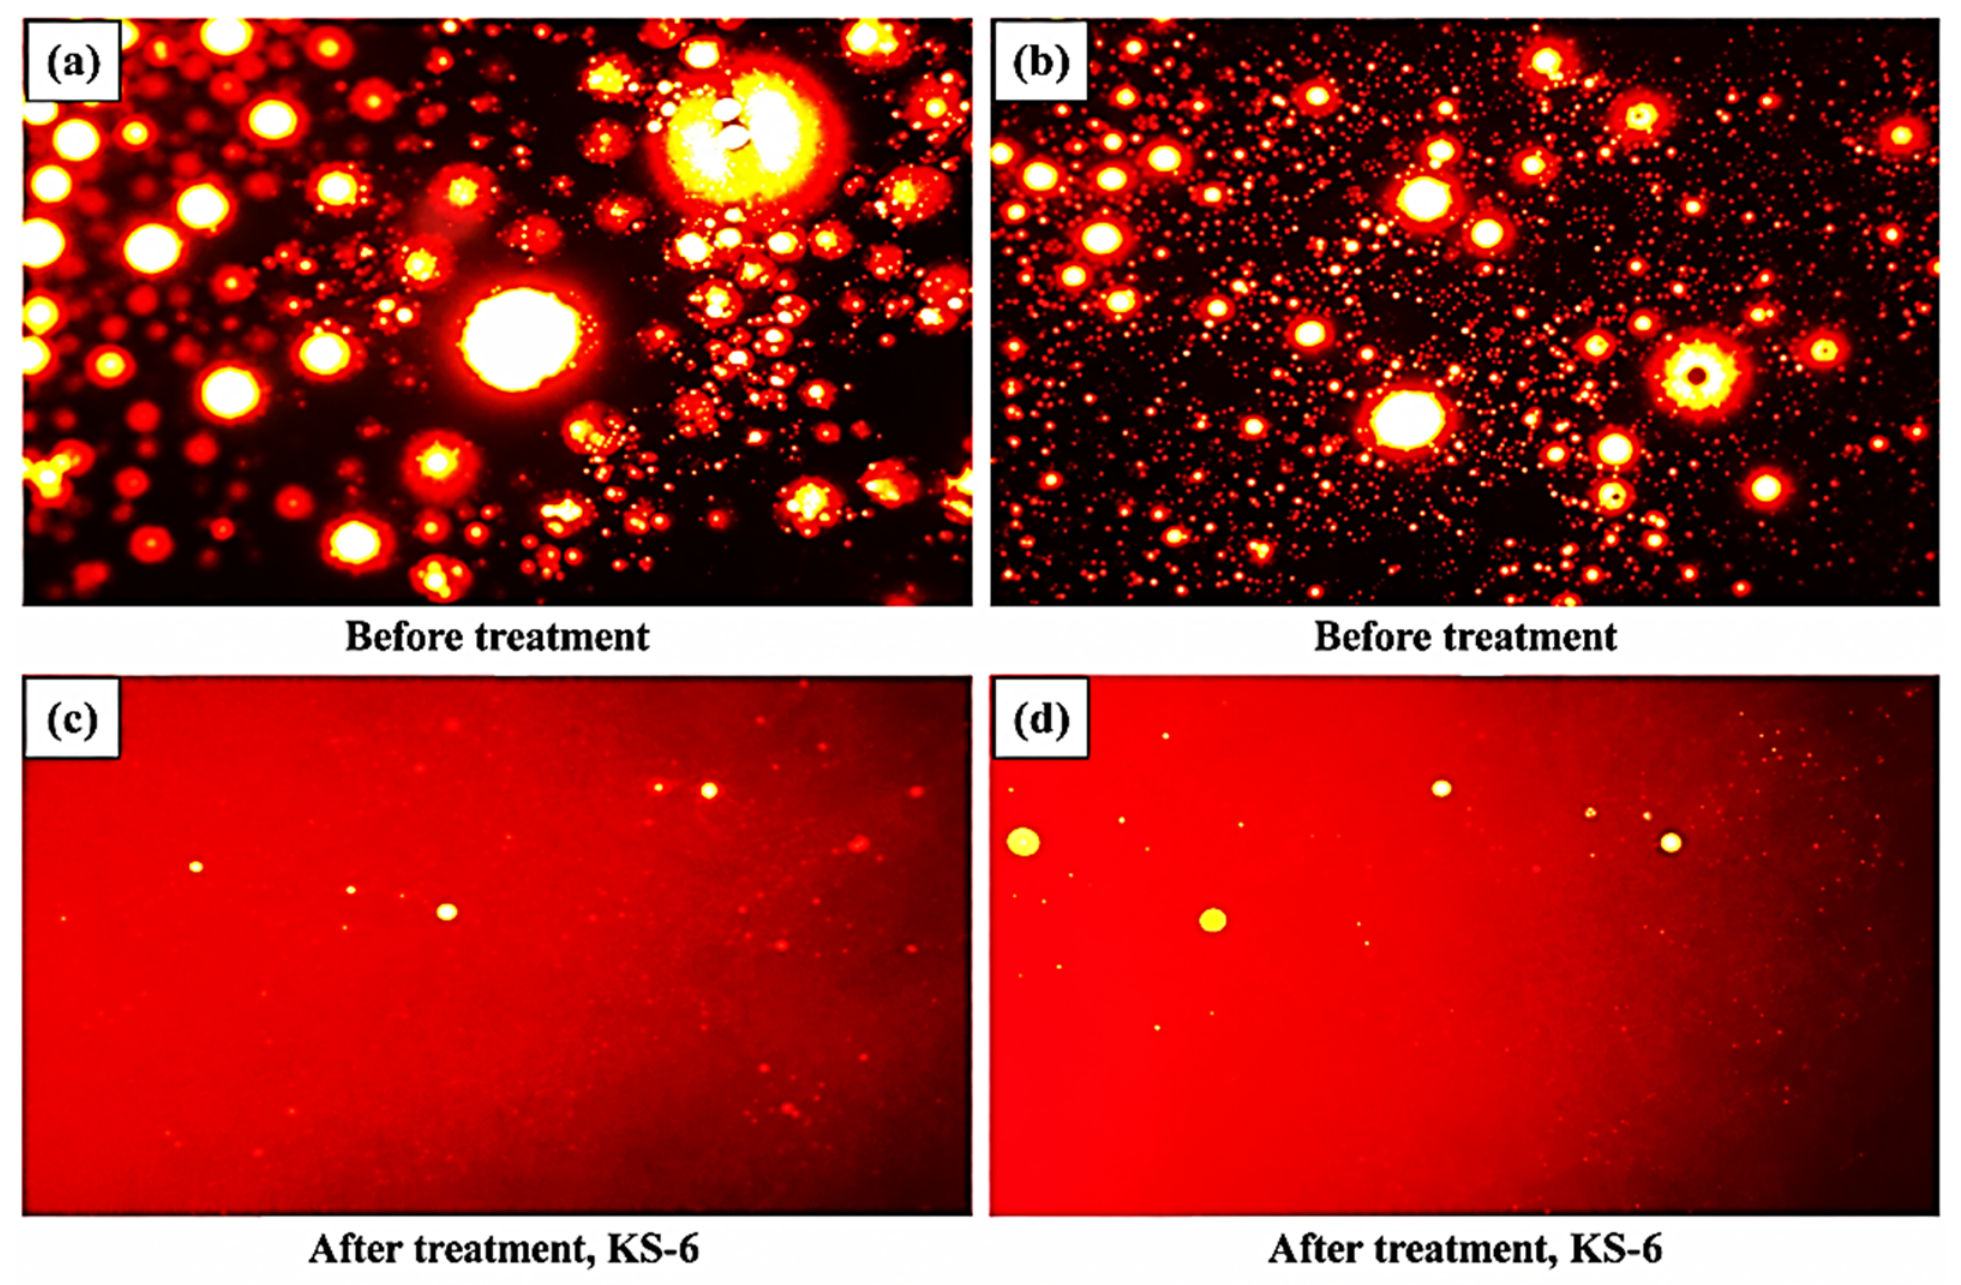
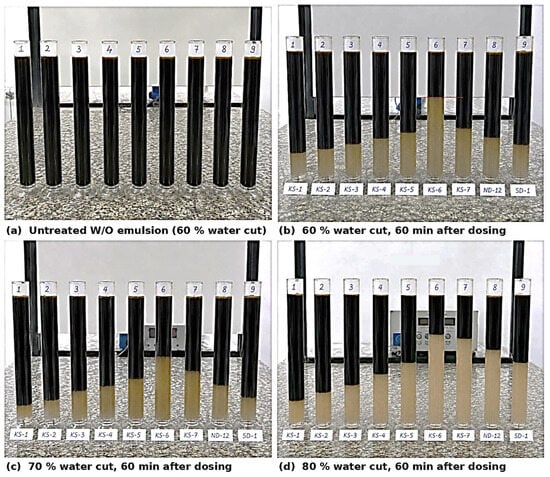
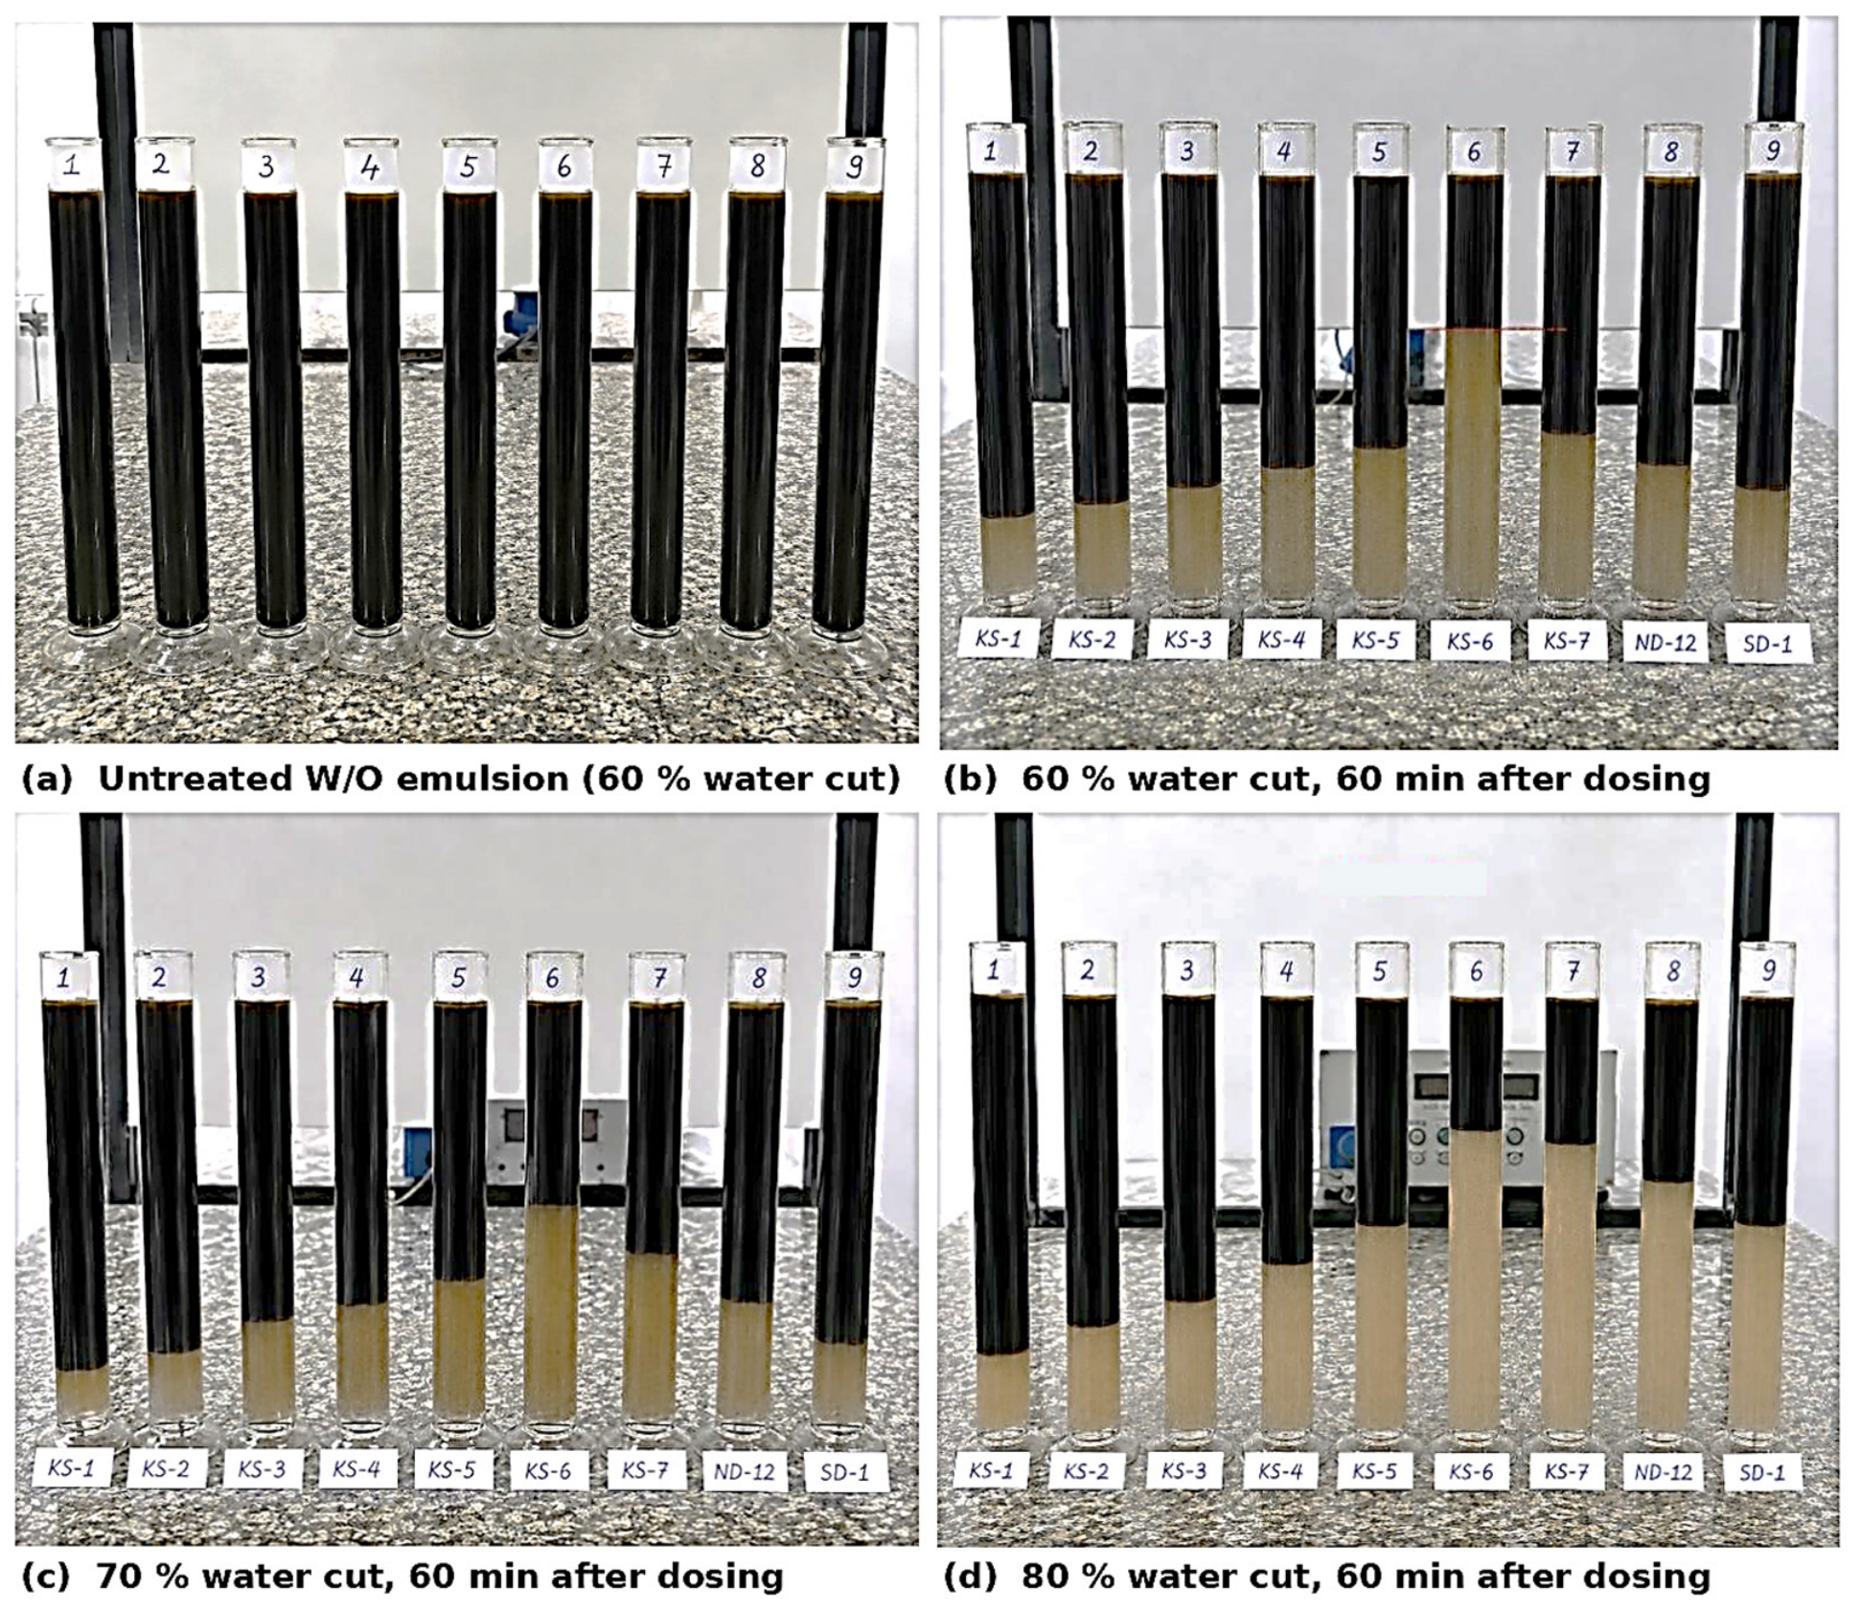
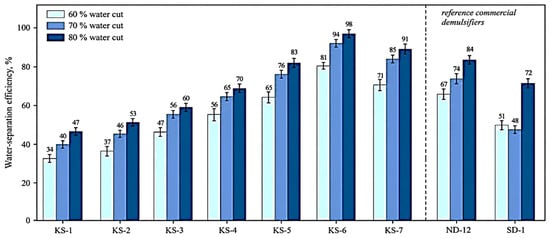
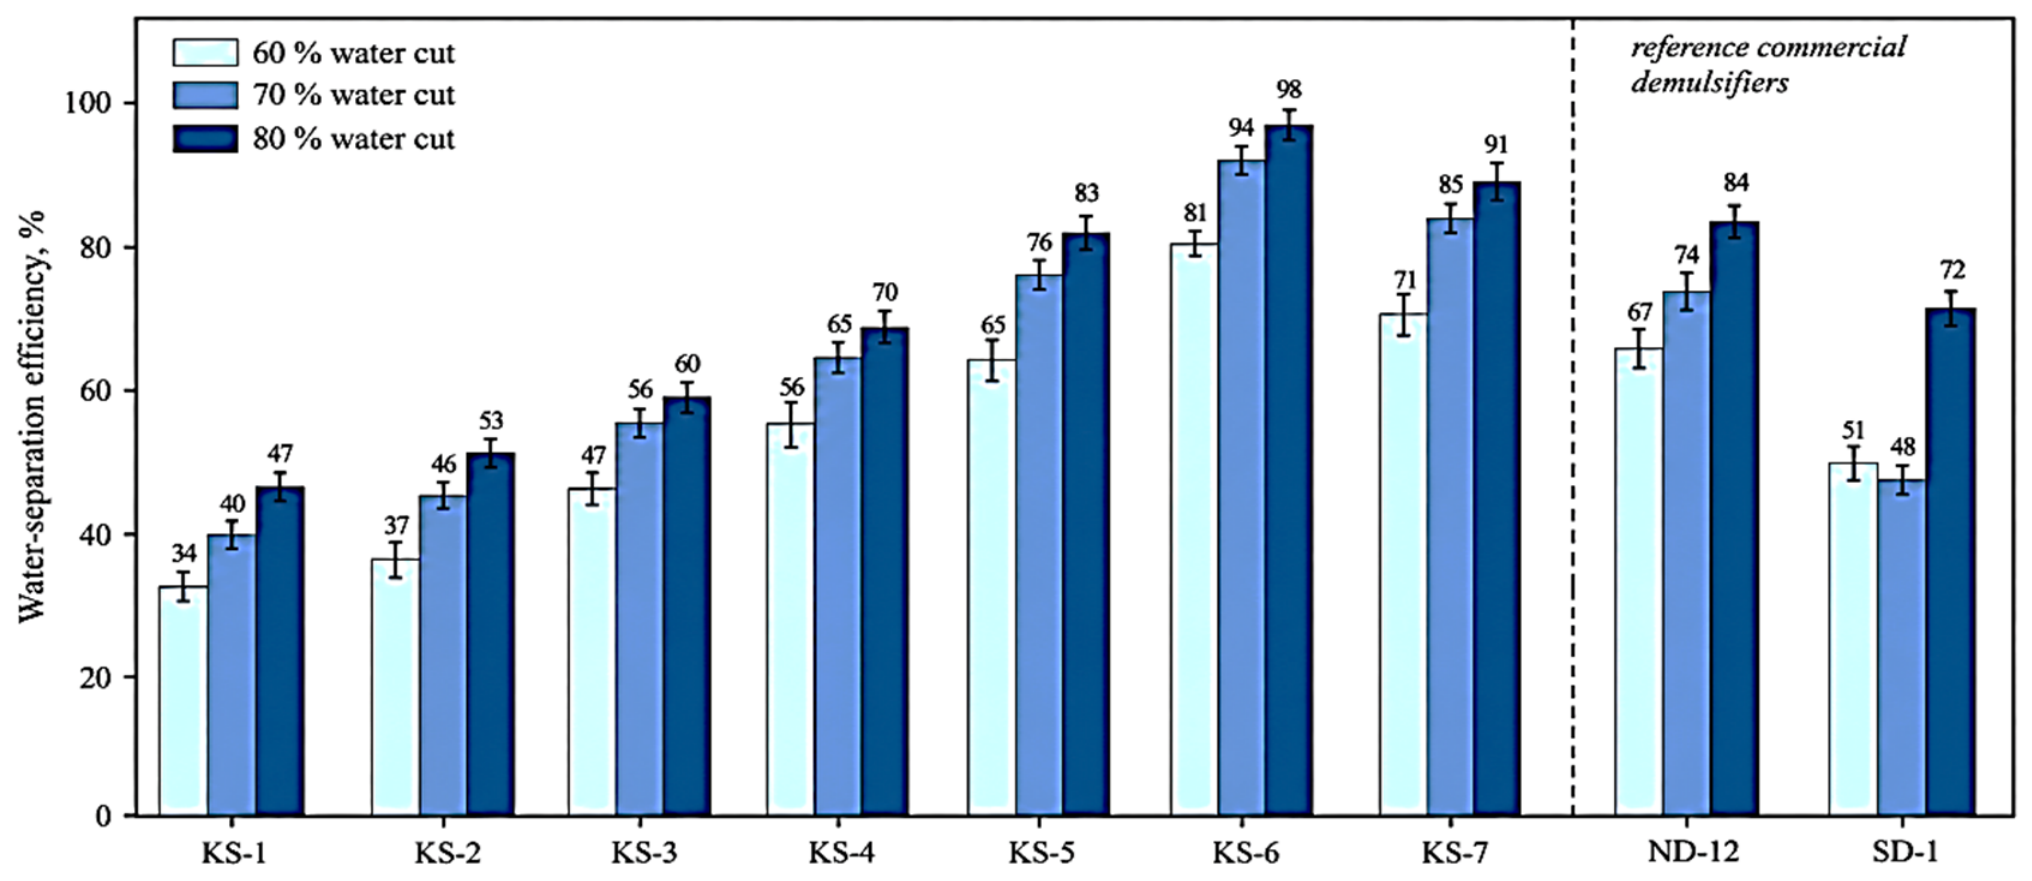
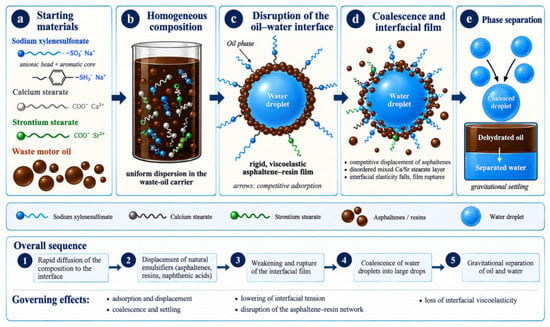
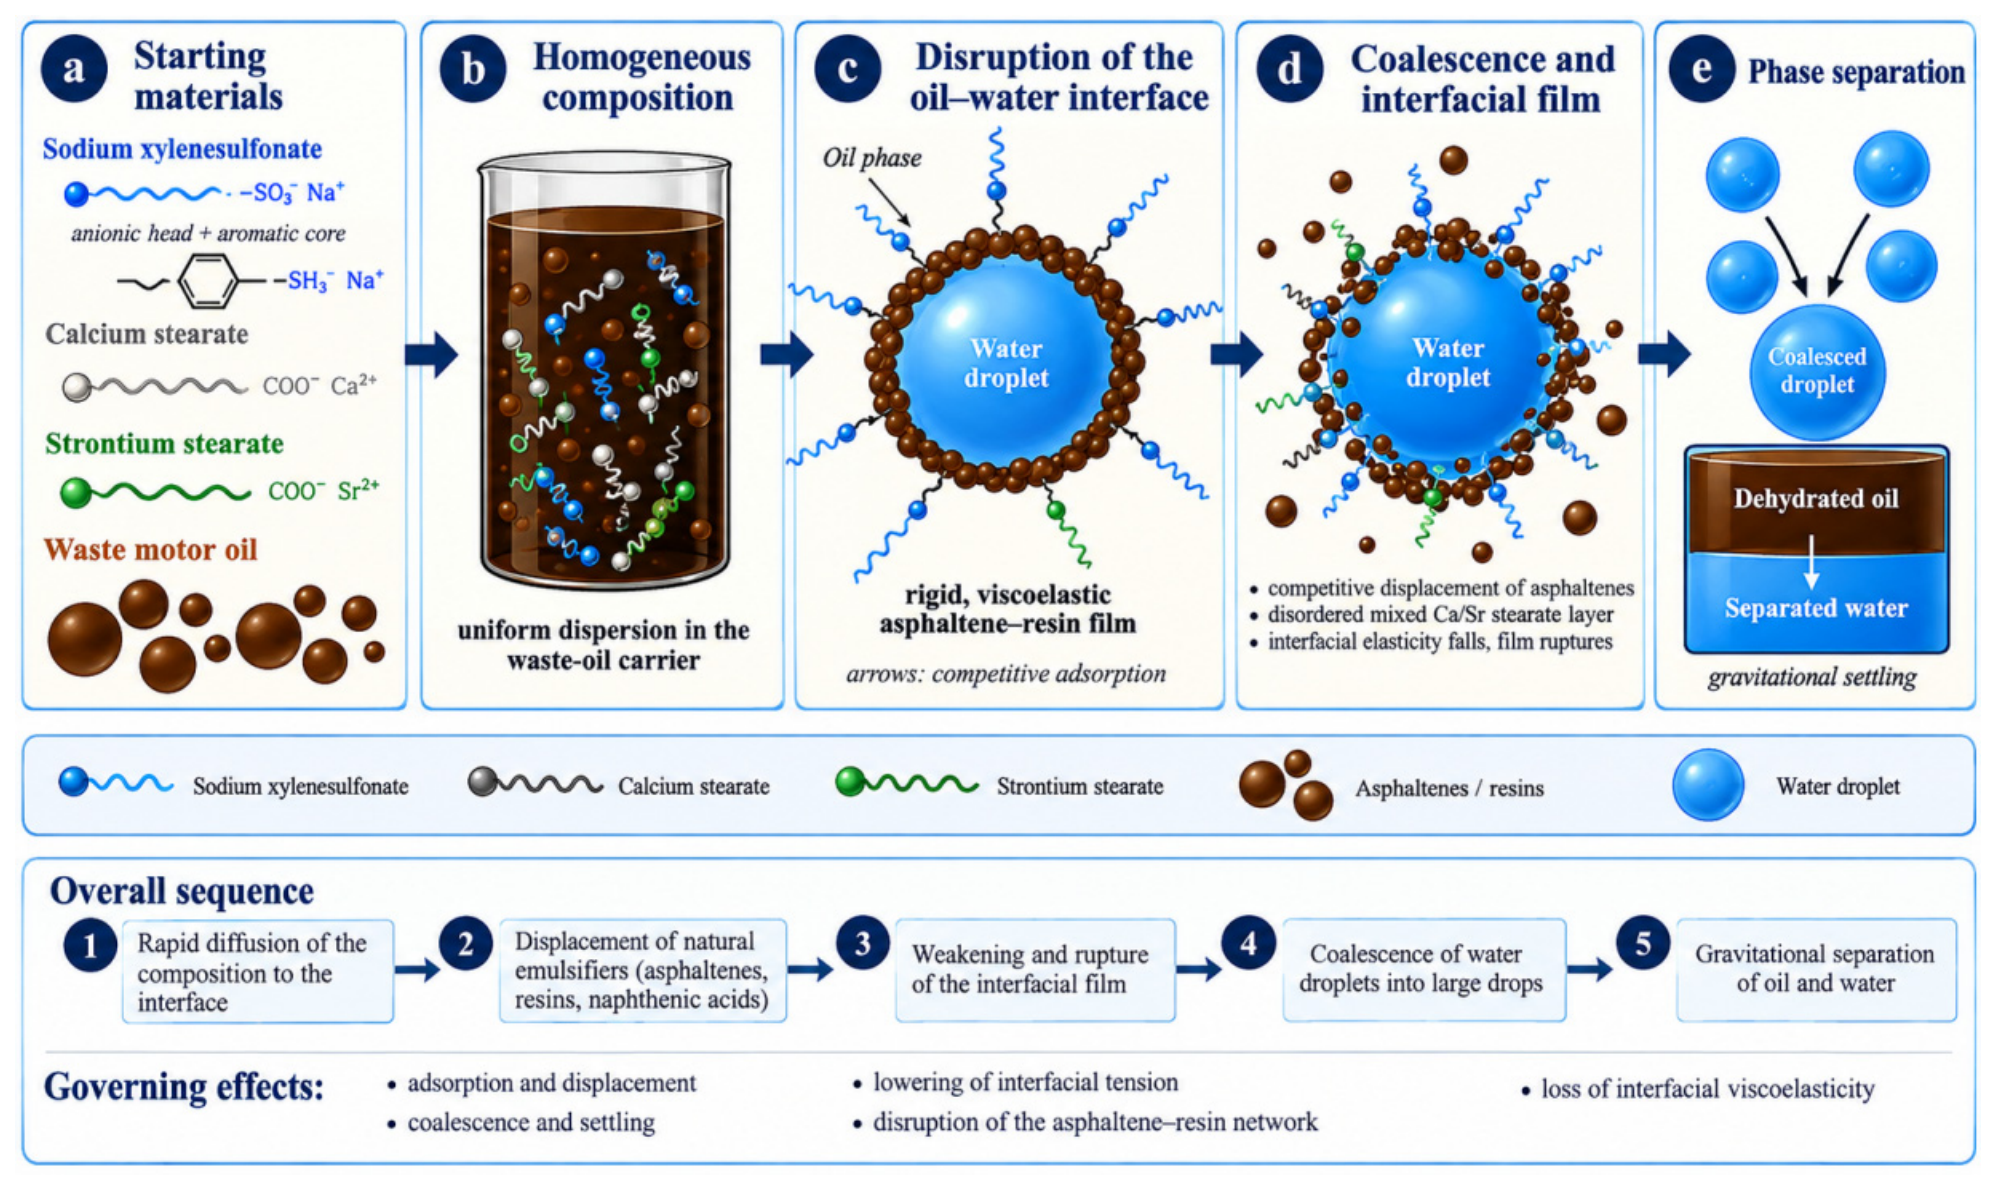

Disclaimer/Publisher’s Note: The statements, opinions and data contained in all publications are solely those of the individual author(s) and contributor(s) and not of MDPI and/or the editor(s). MDPI and/or the editor(s) disclaim responsibility for any injury to people or property resulting from any ideas, methods, instructions or products referred to in the content. |
© 2026 by the authors. Licensee MDPI, Basel, Switzerland. This article is an open access article distributed under the terms and conditions of the Creative Commons Attribution (CC BY) license.