


Abstract
Patient recovery prediction and hospital length of stay estimation remain critical challenges in healthcare resource allocation and clinical decision-making. Inaccurate discharge planning drives substantial avoidable hospital costs, while existing machine learning models remain limited by narrow, single-domain data that fail to capture the multimodal complexity of modern smart ward environments. This study proposes IoT-ClinXAI, an explainable multimodal framework that fuses IoT environmental data, wearable physiological signals, and clinical records for accurate and transparent patient recovery prediction in smart hospital wards. A Multi-domain Hierarchical Consensus Feature-Selection method groups features into structured domains, applies Borda–Kemeny weighted consensus within each domain, and reduces cross-domain redundancy while preserving complementary information. A Snake Optimization–tuned Random Forest Regressor optimizes predictive performance through adaptive hyperparameter search, while a multi-scale SHAP framework provides global and patient-level explanations for transparent clinical inference. Experiments were conducted on a real-world IoT-enabled smart ward dataset comprising patient data and recovery duration. The proposed framework achieved strong predictive performance on the held-out test set, with of 0.964, RMSE of 0.476 days, MAE of 0.342 days, and MAPE of 3.13%, yielding a 23.3% RMSE reduction over the unselected baseline and outperforming all feature-selection methods by 10.9–17.6% in RMSE. Statistical superiority was consistently confirmed across all pairwise comparisons using Wilcoxon signed-rank tests with Bonferroni correction (). SHAP analysis identified ward allocation, respiratory rate, and oxygen saturation as the dominant recovery predictors, while environmental IoT variables showed minimal predictive contribution. These results highlight IoT-ClinXAI as a reliable and useful framework for supporting bed management, discharge planning, and hospital resource optimization in resource-constrained healthcare settings.
1. Introduction
Efficient hospital resource management is fundamental to delivering high-quality, timely, and cost-effective healthcare services. Among these operational factors, hospital length of stay (LOS) and recovery duration directly influence bed allocation, staffing, discharge planning, and patient flow [1]. Hospital care accounts for approximately 30% of U.S. national health expenditure, while inefficient length-of-stay management, poor discharge planning, and fragmented transitional care contribute to avoidable costs and readmissions [1,2]. In critical care, ICU services account for 8–30% of hospital expenditure across health systems, compared with 13.4% in historical U.S. estimates from 2000–2005 [3,4]. During peak demand, ICU occupancy can exceed 85%, underscoring persistent capacity pressures [3]. In resource-constrained lower-middle-income countries, where hospital capacity is frequently overstretched, reliable forecasting of patient recovery trajectories could significantly enhance both operational efficiency and equitable care delivery [5,6].
Wearable and embedded Internet of Things (IoT) sensors can capture vital signs such as heart rate, respiration rate, oxygen saturation, and body temperature at high-frequency intervals, supporting AI-based prediction of patient deterioration up to 24 h in advance with strong validation performance [7,8]. In parallel, IoT-based environmental monitoring systems enable automated control of temperature, humidity, air quality, ventilation, and filtration, contributing to substantial reductions in CO2, PM2.5, and VOC levels while improving comfort, alertness, and health outcomes [9,10]. Collectively, these advances show that IoT-enabled hospitals have evolved into operational systems that generate rich multimodal data for patient monitoring, environmental optimization, and recovery analytics.
Beyond technical feasibility, evidence suggests that hospital settings act as therapeutic agents where improved indoor conditions such as daylight, thermal comfort, acoustics, and air quality reduce stress, shorten stays, and enhance care outcomes [11,12,13]. In a mixed-methods study of Saudi Arabian hospital wards, Alessa et al. [14] found that enhanced healing environments reduced hospital stays from to days, with lower pain and improved sleep quality. Although context-specific, these findings support the link between environmental quality and patient recovery [14,15]. Conversely, hospital noise often exceeds WHO limits of 35 dB(A) during daytime and 30 dB(A) during nighttime, with reported levels reaching 37–88.6 dB(A) during the day and 38.7–68.8 dB(A) at night, thereby disrupting sleep and delaying recovery [16]. Experimental evidence further shows that restorative music soundscapes can improve environmental restorativeness by 7.9–15.0% [17]. Collectively, these findings suggest that IoT-enabled monitoring and optimization of hospital conditions may meaningfully support patient healing trajectories.
Machine learning (ML) has shown considerable potential for predicting hospital LOS, supporting improved clinical decision-making, early intervention, scheduling efficiency, and resource allocation [18,19,20]. However, existing models remain structurally limited by their reliance on narrow data streams. Electronic Health Record (EHR)-based OMOP models have achieved strong internal performance for binary LOS classification, with an AUROC of 0.891, but declined to 0.804 under external validation because of data heterogeneity and limited contextual representation [21]. Similarly, wearable sensor systems can predict clinical deterioration up to 17 h in advance, detecting 83.6% of unplanned ICU transfers and 100% of cardiac arrests, yet they remain confined to unimodal physiological monitoring and exclude environmental variables [7]. In resource-constrained settings, ML models based on EHR data have demonstrated promising performance for prolonged length-of-stay classification, with Gradient Boosting achieving an accuracy of 81% [5]. Consistent with recent systematic evidence, most LOS prediction studies rely primarily on clinical or physiological variables, leaving environmental intelligence from smart wards largely underutilized in recovery prediction systems [18].
Conventional feature-selection methods (mRMR, RFE-RF, LASSO) often ignore clinically meaningful differences across environmental, physiological, and clinical modalities [22,23], while consensus rank aggregation methods such as Borda count and Robust Rank Aggregation improve ranking stability and reduce method-specific bias, with reported EKI gains in omics datasets [24,25]. Existing methods are largely single-domain and lack domain-aware hierarchical selection with cross-modal redundancy control, while clinical ML requires transparent and trustworthy interpretability for regulatory compliance. Explainable AI (XAI) has shifted from post hoc explanations to design-level integration, with SHapley Additive exPlanations (SHAP) widely adopted for its game-theoretic and axiomatic properties [26]. In IoT systems, it should address data, model, evaluation, and human-centric needs for both technical and clinical users. However, despite its use in IoMT security [27,28], SHAP remains underutilized in healthcare IoT. Interpretable multi-modal IoT-clinical recovery prediction for ward allocation is therefore largely unexplored [29].
Existing systems typically treat physiological, environmental, and clinical data as separate operational streams: wearable devices capture high-fidelity physiological signals [7], while smart HVAC systems regulate ward-level environmental conditions [9], yet their integration for holistic recovery forecasting remains limited. Although consensus-based feature selection improves ranking stability [25,30], it generally treats all variables uniformly without considering clinical, physiological, and environmental distinctions. Snake Optimization (SO) has shown promise for tuning Random Forest (RFR) hyperparameters, but its application to clinical regression with multimodal IoT data remains limited [31]. Finally, while SHAP offers robust feature-attribution capabilities [28], explainable multimodal healthcare prediction systems that interpret environmental, physiological, and clinical variables within a unified IoT-clinical fusion framework remain scarce [27,29]. Together, these limitations underscore the need for an integrated, domain-aware, optimized, and interpretable framework for precision recovery prediction in smart wards.
This study addresses three questions: whether domain-aware hierarchical feature selection improves performance in multimodal IoT-clinical data, whether SO enhances clinical regression through superior hyperparameter tuning, and how SHAP-based XAI can deliver actionable insights at global, population, and individual levels. To address these limitations, this study proposes IoT-ClinXAI, an explainable IoT-driven framework for smart ward recovery prediction. It combines Multi-domain Hierarchical Consensus Feature Selection (MHCFS) to structure and refine environmental, physiological, and clinical variables while reducing redundancy, SO-RFR for RMSE-optimized prediction, and SHAP-based explanations for global, patient-level, and population-level clinical decision support. The principal contributions of this study are summarized as follows:
- This study proposes the MHCFS framework to identify a compact yet clinically meaningful subset of variables while preserving complementary multimodal information from environmental, physiological, and clinical domains.
- An SO-based RFR model is developed to improve predictive performance through systematic hyperparameter tuning.
- SHAP-based explainability is incorporated to provide multi-scale interpretation, identifying ward allocation, respiratory rate, and oxygen saturation as key factors influencing recovery prediction and supporting actionable clinical decision-making.
- A clinically oriented decision-support pipeline is proposed, translating multimodal smart-ward outputs into interpretable insights for bed management and discharge planning, supporting effective hospital resource optimization.
The remainder of this paper is organized as follows. Section 2 reviews related studies on IoT-enabled healthcare monitoring, feature selection, metaheuristic optimization, and clinical XAI. Section 3 presents the proposed methodology. Section 4 reports the results, including comparative evaluation, statistical analysis, and interpretability analysis. Section 5 discusses clinical implications and limitations, while Section 6 concludes the paper and outlines future directions.
2. Related Work
This section reviews IoT-based environmental intelligence and smart healthcare monitoring systems, along with feature selection, optimization techniques in clinical prediction, and XAI for decision support.
2.1. IoT-Driven Environmental Intelligence and Smart Healthcare Monitoring
The integration of IoT in healthcare enables real-time, data-driven monitoring through simultaneous capture of multimodal patient data. Abdulmalek et al. [32] report that IoT-based architectures can monitor parameters such as body temperature, heart rate, CO, CO2, and humidity with around 95% accuracy, allowing remote access for clinicians and faster emergency response. However, existing systems often lack epidemic sensing and robust security and scalability. Beyond physiological tracking, recent research emphasizes the importance of environmental conditions in patient recovery. Studies synthesized by Alessa et al. [14] show that factors such as lighting, noise, and spatial organization significantly affect healing outcomes through their impact on patient comfort and psychological wellbeing. Supporting this, Dijkstra et al. [15] and Selçuk et al. [33] highlight that natural light, vegetation views, and interior design features are associated with shorter recovery times. IoT hospitals incorporate smart HVAC systems for real-time temperature and humidity control.
Technological implementations have expanded through mobile and embedded IoT platforms. Li et al. [34] integrated vital sign and environmental monitoring using Arduino and Wi-Fi, but faced limitations in communication range and power management. Recent work improves continuous sensing through cooperative wireless energy and data transfer mechanisms. Parkavi et al. [10] introduced air-quality monitoring systems using MQ135, GP2Y1010AU0F, and DHT11 sensors with cloud-based predictive analytics. Despite these advancements, a major gap persists in integrating environmental IoT data with clinical prediction models. ML applications in hospital management [35] and wearable-based recovery prediction [12] demonstrate potential but often exclude contextual variables. Similarly, OMOP-based models [21] show moderate predictive performance but suffer from reduced external validity due to data heterogeneity. Despite these advances, environmental systems [9,10,34] and physiological wearables [7,8] largely operate as separate data silos, limiting feature level fusion for recovery prediction. Conventional feature selection also overlooks their distinct semantic, noise, and clinical characteristics. Therefore, MHCFS Tier 1 adopts three domain partitioning (Environmental, Physiological, and Clinical) to evaluate features within their native modalities before cross-domain aggregation.
2.2. Feature Selection and Metaheuristic Optimization in Clinical Predictive Modeling
Due to their high dimensionality and heterogeneity, healthcare data demand advanced feature selection and hyperparameter optimization to improve prediction accuracy and interpretability. Recent studies [22] increasingly adopt hybrid frameworks combining evolutionary algorithms with ML models. Evolutionary feature selection, such as the modified Dragonfly Algorithm (mDA), improves accuracy while reducing feature subsets, outperforming GA, PSO, and GWO across medical datasets [36]. Consensus ranking using Borda and Nash voting further enhances feature robustness by integrating multiple ranking perspectives [37]. Swarm intelligence-based optimization consistently improves ML performance, achieving accuracy in clinical datasets and reducing regression error [38]. Extensions to deep learning (DL) models, such as VGG-16 optimized via WOA and GWO, further confirm the effectiveness of nature-inspired optimizers in medical image classification [30]. Therefore, IoT ClinXAI employs intra-domain multi-scorer ranking in Tier 1 and weighted cross-domain consensus using Borda Kemeny aggregation in Tier 2 to preserve domain structure while identifying robust predictive features.
For regression tasks, SO has shown strong convergence and predictive performance in tree-based regression models by balancing exploration and exploitation [31]. However, its effectiveness for small, multimodal clinical regression datasets remains insufficiently validated, while PSO and GWO may converge prematurely in high-dimensional spaces [38]. This gap motivates SO RFR, which optimizes feature subset and Random Forest hyperparameters to improve prediction on the MHCFS-selected features.
2.3. XAI for Clinical Decision Support
XAI in clinical settings requires robust interpretability to ensure transparency, trust, and regulatory compliance. XAI has evolved from post hoc methods to integrated design approaches, with SHAP emerging as a leading framework due to its axiomatic properties such as efficiency, symmetry, dummy, and linearity [39]. Recent studies show broad SHAP applications in healthcare, including cardiology, oncology, endocrinology, and diabetes prediction, where it explains risk factors, biomarkers, treatment decisions, and patient-specific outcomes [27,40,41]. SHAP visualizations such as beeswarm, waterfall, decision, and force plots support both global model interpretation and individual patient-level explanations [42]. Moreover, SHAP-based pipelines combined with feature selection and clustering can improve predictive performance and provide actionable clinical insights [42]. Despite its strengths, SHAP is computationally expensive, struggles with correlated clinical features, and is sensitive to baseline choice [43], motivating a shift toward action-oriented XAI that directly supports clinical decision-making [44]. Existing healthcare SHAP applications mainly explain unimodal models or medical imaging systems [40,41]. However, multimodal IoT clinical models require explanations that validate feature selection and support both population level and patient level decisions [44]. Therefore, IoT ClinXAI employs multi-scale SHAP analysis using beeswarm, waterfall, decision, and force plots to provide global, patient-level, and instance-specific interpretations.
2.4. Critical Research Gap Analysis
The preceding review identifies persistent gaps in IoT healthcare monitoring, feature selection, clinical regression, and XAI that motivate the proposed IoT-ClinXAI framework. Representative studies were selected based on four criteria: coverage of the framework’s four technical pillars—multimodal IoT-clinical fusion (C1), feature selection and consensus ranking (C2), metaheuristic optimization for clinical regression (C3), and explainable decision support (C4); recency to reflect recent advances in the field; direct alignment between identified limitations and proposed solutions; and prior discussion in Section 2.1, Section 2.2 and Section 2.3. Accordingly, Table 1 provides a representative gap-to-solution mapping, with each study highlighting a distinct limitation addressed by the proposed IoT-ClinXAI framework.
Table 1.
Systematicgap-to-solution mapping of representative studies and the proposed IoT-ClinXAI framework.
3. Methodology
This section presents the proposed methodology and study workflow for IoT-ClinXAI. The framework integrates data collection and preprocessing, multi-domain feature selection, ML model development, swarm-intelligence-based hyperparameter optimization, and XAI for interpreting model predictions. Figure 1 presents the complete methodological pipeline and provides a structured overview of each component.
Figure 1.
End-to-end methodological pipeline of the proposed IoT-ClinXAI framework.
3.1. Data Collection and Preprocessing
The study utilizes the IoT-Integrated Smart Ward Dataset, comprising records from 688 inpatients admitted to a digitally monitored hospital in Bangladesh between April and October 2025 [45].The dataset integrates environmental, physiological, and clinical information to investigate factors associated with patient recovery. It comprises 21 raw input fields across three domains. The environmental domain includes IoT-based ward measurements such as Room Temperature, Humidity, Noise Level, Air Quality Index, and Light Intensity. The physiological domain covers objective vital signs, including Heart Rate, Body Temperature, Respiration Rate, Oxygen Saturation, and Blood Pressure. The clinical domain encompasses demographic, diagnostic, treatment, and patient reported attributes, including Age, Gender, Blood Group, Pain-Level Score, Sleep Quality, Primary Diagnosis, Severity Level, Treatment Type, and Ward Type. The target variable, Recovery_Speed_days, ranges from 5 to 19 days and represents the duration required for patient recovery. Data were collected from the hospital’s IoT infrastructure and EMRs. Subsequently, the dataset underwent cleaning, standardization, missing-value imputation, and anonymization to ensure both data quality and patient privacy. Table 2 presents the descriptive statistics of the study variables, with continuous variables summarized by mean ± standard deviation (SD), median (IQR), and range, and categorical and ordinal variables summarized by frequency (%).
Table 2.
Descriptive statistics of the study variables. Continuous variables are presented as mean ± standard deviation (SD), median (IQR), and range; categorical and ordinal variables are presented as frequency (%).
Missing values were identified in a small subset of variables, including Humidity_% (two instances), Air_Quality_Index (three instances), Light_Intensity_Lux (two instances), and Blood_Pressure (4 instances). To enhance clinical interpretability, the Blood_Pressure attribute was decomposed into two distinct variables: Systolic_BP and Diastolic_BP. All missing values were handled using median imputation, which provides robustness against distributional outliers.
Prior to model development, categorical variables were systematically encoded. Specifically, Gender, Blood_Group, and Primary_Diagnosis were transformed using label encoding, while Treatment_Type (seven categories) and Ward_Type (four categories) were converted using one-hot encoding. After all preprocessing and feature transformation procedures, the final dataset consisted of 688 instances and 28 features.
Continuous variables were standardized using z-score normalization to ensure scale invariance across heterogeneous feature domains. The dataset was split into 80% training and 20% held-out test sets using stratified random sampling. Because the target variable is continuous, it was discretized into five quantile-based bins for stratified sampling, preserving the recovery-duration distribution across the training and test sets. All preprocessing steps (imputation, encoding, normalization) were fitted on the training set and applied to the test set. Feature selection, model selection, and hyperparameter tuning used 5-fold cross-validation on the training set only, with all design parameters, including K and , determined exclusively from training data; the test set was reserved for final evaluation.
3.2. Feature-Selection Methods
Feature selection reduces dimensionality by keeping only informative variables and removing redundant or irrelevant ones, improving performance, generalization, efficiency, and interpretability. In this study, both traditional baseline methods and the proposed MHCFS framework are applied for comparative evaluation. Three widely used feature selection baselines are employed, each representing a distinct methodological paradigm. Recursive Feature Elimination with Random Forest (RFE-RF) is a wrapper-based approach that iteratively removes the least important features according to Random Forest importance scores; while effective, it is susceptible to model bias and feature instability across datasets [46]. Boruta is an ensemble wrapper method that introduces shadow features and performs statistical testing to identify all statistically relevant variables; it serves as a strong but computationally expensive benchmark for robust feature relevance estimation [47]. Minimum Redundancy Maximum Relevance (mRMR) is a filter-based method that selects features by maximizing mutual information with the target while simultaneously minimizing inter-feature redundancy, making it a direct traditional counterpart to redundancy-aware selection [48]. Together, these baselines enable a comprehensive evaluation of the proposed MHCFS framework with respect to feature stability, redundancy control, and predictive consistency.
3.3. Proposed Multi-Domain Hierarchical Consensus Feature Selection (MHCFS)
We propose the MHCFS framework for IoT-enabled smart ward environments, where patient data are inherently heterogeneous across multiple sensing modalities. Unlike conventional filter, wrapper, or embedded methods that treat all features uniformly [22,49], MHCFS leverages domain-aware partitioning of the feature space into three clinically meaningful groups—Environmental (), Physiological (), and Clinical ()—enabling structured and context-sensitive feature selection. The framework operates through three hierarchical tiers: (i) intra-domain multi-scorer ranking, which evaluates feature relevance within each semantic group; (ii) cross-domain weighted Borda–Kemeny aggregation, which consolidates domain-specific rankings into a global consensus; and (iii) a redundancy-aware penalty, which ensures the final feature subset preserves complementary information across modalities. The complete MHCFS architecture is illustrated in Figure 2.
Figure 2.
Proposed MHCFS three-tier feature-selection architecture showing domain partitioning, multi-scorer ranking, Borda–Kemeny aggregation, and redundancy penalization.
3.3.1. Domain Partitioning and Feature Space Definition
Let the complete feature set be denoted as
where the feature space is composed of three distinct domains. The environmental feature subset is defined as
with cardinality . The physiological feature subset is
with . The clinical feature subset, denoted by , comprises demographic, diagnostic, treatment, and ward-related variables, including age, gender, blood group, pain level, sleep quality, primary diagnosis, treatment type, and ward type, among others, with cardinality .
Categorical variables (Treatment Type and Ward Type) are one-hot-encoded to assign independent importance scores to each category and prevent multi-class variables from biasing rank aggregation [46,47]. Therefore, the total number of features is
Let
denote the feature matrix, where n represents the number of patient records, and let
represent the target vector corresponding to the patient recovery duration, measured in days (Recovery_Speed_days).
3.3.2. Tier 1—Intra-Domain Multi-Scorer Ranking
For each domain , four complementary scorers (MI, Spearman, LASSO, and RF) capture statistical dependency, rank correlation, linear sparsity, and non-linear interactions, reducing scorer-specific bias and improving feature-selection robustness [24,36,50,51].
- Scorer 1—Mutual Information (MI):
The MI between each feature and the target variable y is computed as
where is the joint probability density and , are the marginal densities. MI captures both linear and non-linear statistical dependencies between features and the target variable.
- Scorer 2—Spearman Rank Correlation:
The absolute Spearman correlation between feature and target y is computed as
where represents the rank difference for each observation and n is the sample size. Spearman correlation is a non-parametric, outlier-robust measure suitable for clinical and physiological data, which often exhibit skewed distributions due to patient heterogeneity and acute events [5,7].
- Scorer 3—LASSO Regression Coefficient:
The LASSO optimization problem is solved as
where is the standardized feature matrix in domain d, is the coefficient vector, and is tuned via 5-fold cross-validation. Feature importance is defined as , and LASSO performs embedded feature selection by shrinking irrelevant coefficients to zero [50].
- Scorer 4—Random Forest Impurity-Based Importance:
The importance score for feature is defined as the mean decrease in impurity (MDI) across all T trees:
where is the set of split nodes using feature in tree t, is the sample proportion at node s, and is the impurity reduction, measured as variance reduction in regression.
Each scorer produces a raw importance vector for domain d, which is min-max normalized to to preserve relative ranking and ensure scale consistency across heterogeneous scoring methods [24], enabling reliable downstream rank aggregation:
where is the raw score for feature from scorer k, yielding normalized scores .
3.3.3. Tier 2—Cross-Domain Borda–Kemeny Consensus Aggregation
Tier 2 applies Borda count for intra-domain ranking and Kemeny optimal rank aggregation for cross-domain consensus, enabling robust fusion across semantically meaningful clinical IoT domains rather than a single feature space [24,25].
- Borda Count Within Each Domain (Step 2a):
For domain d, the Borda count assigns points to feature from scorer k based on its rank position. The aggregate Borda score is given by
where is the number of scorers and is the rank of feature under scorer k. Borda count aggregates ranks by sorting in descending order, reducing outlier influence and improving stability over mean-score aggregation [24,25].
- Domain Predictive Weight Estimation (Step 2b):
Domain weights are defined using the 5-fold cross-validated of a Random Forest on , following stacked generalization principles [52], with a small floor to retain weak but potentially interactive domains:
where is a floor value to prevent zero weights for weak domains with potential interaction effects. The normalized weights satisfy .
- Kemeny Cross-Domain Consensus (Step 2c):
The three domain-specific rankings (obtained via Borda counts in Step 2a) are aggregated into a global consensus ranking using Kemeny optimal rank aggregation, which minimizes the weighted sum of Kendall tau distances to the input rankings:
where is the set of all feature rankings, is the Kendall tau distance between and , and are domain weights from Step 2b. With and , the Kemeny consensus is efficiently solved via integer linear programming [53], yielding the optimal ranking.
To convert the Kemeny ranking into continuous importance scores (Tier 3), each feature is assigned a Borda–Kemeny (BK) score from its weighted Borda support:
where is the min-max normalized Borda score of in domain d (0 if absent). The BK score preserves Kemeny ordering while providing a continuous importance measure through Borda–Kemeny aggregation. Features absent from a domain receive a normalized Borda score of zero (), contributing to the global consensus only through domains where they are present. Tied feature scores are assigned average ranks before aggregation to avoid arbitrary ordering bias.
The Kemeny ranking provides the optimal ordinal consensus (Equation (14)), while the BK score (Equation (15)) offers a continuous importance measure from the same weighted Borda support. Thus, sorting features by preserves the Kemeny ordering. Tier 3 applies the redundancy penalty to and selects the top-K features based on rather than directly.
3.3.4. Tier 3—Cross-Domain Redundancy Penalty
Tier 3 quantifies cross-domain redundancy and penalizes highly dependent features to ensure the final subset retains complementary rather than overlapping information across domains.
- Cross-Domain Dependency Score:
The cross-domain dependency of feature is defined as its mean absolute Spearman correlation with all features in the complementary domains :
where denotes the absolute Spearman correlation between features and . Higher CDD reflects greater cross-domain redundancy, where shares overlapping information across modalities. Mean aggregation is used to penalize global redundancy, while Spearman ensures robustness to heterogeneous scales and non-linear monotonic relationships [48]. The CDD scores are normalized:
- Final MHCFS Score:
The final importance score for each feature is obtained by subtracting a weighted cross-domain redundancy penalty from its BK score:
where controls the redundancy penalty. Sensitivity analysis via 5-fold CV over shows stable performance in , with the best RMSE at , while extremes degrade generalization [54], and denotes min-max normalization across features. Higher MHCFS scores indicate strong predictive consensus with low redundancy, and features are ranked in descending order of . This relevance–redundancy trade-off extends mRMR by replacing pairwise filtering with cross-domain consensus [48].
3.3.5. Computational Complexity and Properties
The MHCFS framework operates with a time complexity of , primarily driven by the pairwise Spearman correlation computation in Tier 3. Tier 1 requires for Spearman ranking and for MI and RF-based scoring, while Tier 2 aggregation operates in with scorers. For the current dataset, the complete MHCFS pipeline executes in under 30 s on a standard Intel Core i7-12700H CPU (16 GB RAM), demonstrating practical clinical feasibility. Because the number of feature modalities is fixed, computational complexity increases linearly with patient volume. For a cohort of 2000 patients, the estimated runtime is approximately 87 s (≈1.5 min), indicating that the pipeline remains clinically feasible for routine batch processing. The framework satisfies three key properties: relevance (strong feature–target dependency), non-redundancy (cross-domain CDD penalization), and stability (multi-scorer consensus reducing variance across scoring functions). These align with established feature-selection desiderata [24,54].
3.3.6. Optimal Feature Subset Selection
The top-K features from the global MHCFS ranking were selected using 5-fold cross-validation on the training set, with both K and optimized without accessing the held-out test set. Among , achieved the best RMSE on the training set, while larger values increased validation error. Features were grouped into three importance tiers based on their MHCFS scores: primary (), secondary (), and low-contribution (). These quartile-based thresholds serve as interpretability markers rather than strict statistical cutoffs, facilitating clinical prioritization by distinguishing dominant, supportive, and negligible predictors [40].
As shown in Figure 3, the MHCFS framework produces a globally ranked feature set that prioritizes clinical predictors while consistently suppressing redundant IoT environmental sensors. Clinical features dominate the primary tier (): Ward_Type_ICU achieves the highest score (1.000), followed by Sleep_Quality (0.907) and Pain_Level_Score (0.893), the latter exhibiting the highest cross-domain dependency () with a corresponding redundancy penalty of 0.250. Among physiological variables, Respiration_Rate_bpm attains a strong initial Borda–Kemeny consensus () but incurs a redundancy penalty of 0.244, yielding a final MHCFS score of 0.796. Age (5th; 0.739) reflects age-related physiological vulnerability and comorbidity burden, which may prolong recovery. Ward_Type_Semi-Private (6th; 0.661) reflects institutional factors such as staffing, monitoring, and resource allocation, acting as a proxy for intermediate-acuity care rather than patient social status. Oxygen_Saturation_SpO2_% and Body_Temperature_C are downgraded to the secondary tier (0.571 and 0.263, respectively) due to elevated CDD values (0.267 and 0.242). In contrast, all five environmental features are consistently suppressed into the lowest importance tier, including Air_Quality_Index (0.027), Noise_Level_dB (0.019), and Humidity_% (0.000), indicating that their predictive information is largely subsumed by clinical and physiological signals. The top 12 features () were selected for downstream model training, with a clear importance threshold evident before a substantial decline in feature relevance.
Figure 3.
MHCFS-based global feature ranking illustrating Borda–Kemeny consensus scores, cross-domain dependency (CDD), redundancy penalties, and final feature importance scores across 28 IoT-derived features grouped by domain.
3.4. ML Models and Hyperparameter Optimization
Following data preprocessing and feature selection, a diverse set of representative ML and DL models was evaluated to assess predictive performance across multiple learning paradigms. Model selection was guided by prior clinical regression studies: tree-based ensembles (Random Forest, XGBoost, CatBoost) are consistently reported as top performers in length-of-stay and recovery prediction tasks [5,18,35]; support vector and nearest-neighbor regressors serve as strong nonlinear baselines [18]; linear regression provides an interpretable lower bound [18]; and artificial neural networks capture complex feature interactions in medical exam scoring and clinical forecasting [18,38]. Table 3 summarizes the evaluated regression models and their corresponding hyperparameter configurations. All models were implemented using standard Python libraries, including scikit-learn, XGBoost, CatBoost, and TensorFlow/Keras.
Table 3.
Evaluated regression models and hyperparameter configurations.
Among the evaluated models, the RFR model achieved the best baseline performance and was selected for swarm intelligence-based hyperparameter optimization due to its stable feature importance estimates for SHAP and optimization-friendly hyperparameter space [38,39,55]. To identify the most effective optimization strategy, five bio-inspired metaheuristic algorithms were compared: Particle Swarm Optimization (PSO), Artificial Bee Colony (ABC), Grey Wolf Optimizer (GWO), Genetic Algorithm (GA), and Snake Optimization (SO). Experimental results demonstrated that SO consistently produced the greatest performance improvement across all evaluation metrics.
SO is a population-based metaheuristic inspired by the foraging, hunting, and mating behaviors of snakes [31]. The algorithm balances exploration and exploitation to efficiently search the hyperparameter space of the RFR model. The position update rule for the i-th snake at iteration is defined as
where denotes the globally best solution, represents a randomly selected individual, and are uniformly distributed random vectors. The adaptive exploration and exploitation coefficients are defined as
where denotes the maximum number of iterations. The mating probability mechanism is expressed as
where represents the SO temperature parameter controlling population diversity.
The objective of the SO algorithm is to minimize the five-fold cross-validated root mean square error (RMSE) of the RFR model over the hyperparameter vector:
where T denotes the number of trees, m is the maximum number of selected features, represents the maximum tree depth, and corresponds to the minimum number of samples required for node splitting. The optimization objective is formulated as
where denotes the validation subset associated with the k-th fold. The optimization process is subject to the following bound constraints:
where p represents the number of selected input features. The SO implementation employs a population size of , a maximum iteration count of , a temperature parameter , and a fixed random seed to ensure reproducibility [56].
Figure 4 shows the convergence behavior of five metaheuristic algorithms for RFR hyperparameter tuning on the MHCFS-selected feature set using 5-fold CV RMSE. SO converges fastest and reaches the lowest final error (RMSE = 0.481) with stable late-stage behavior, while other methods plateau at higher error levels, indicating inferior exploration–exploitation balance. These results justify SO as the optimization strategy in the proposed framework.
Figure 4.
Convergence curves of five metaheuristic algorithms for Random Forest hyperparameter tuning using the MHCFS-selected feature subset, showing 5-fold CV RMSE over 100 iterations on the training set. SO achieves the lowest RMSE and fastest convergence.
3.5. Evaluation Metrics
Each model is evaluated using six regression metrics: Mean Absolute Error (MAE), Mean Squared Error (MSE), Root Mean Squared Error (RMSE), R-squared (), Root Mean Squared Logarithmic Error (RMSLE), and Mean Absolute Percentage Error (MAPE). MAE, MSE, RMSE, RMSLE, and MAPE quantify prediction errors where lower values indicate better performance, while measures the proportion of variance explained by the model where higher values indicate better performance. The corresponding formulations are provided below:
where N is the total number of samples, and are the actual and predicted values respectively, and denotes the mean of the observed target values.
3.6. Explainable Artificial Intelligence (XAI) Using SHAP
XAI enhances model transparency by explaining prediction behavior in an interpretable manner. In this study, SHAP quantifies feature contributions through game-theoretic marginal effects and provides consistent, locally accurate explanations across medical, IoT, imbalanced, and diverse application domains [57,58]. This relationship is formalized in Equation (31).
The SHAP value measures the contribution of feature i to a prediction x by evaluating the change in the model output when the feature is included versus excluded across all possible feature subsets. Here, denotes the model prediction using a subset S of the full feature set with p features. SHAP is applied only to the MHCFS-selected feature subset, preserving domain awareness through prior domain-based scoring and cross-domain consensus. Thus, explanations reflect a modality-curated feature space rather than an undifferentiated matrix. Four complementary SHAP visualizations are applied to the trained SO-RFR+MHCFS model: a beeswarm summary plot for global feature importance and directional effects, a waterfall plot for patient-level attribution decomposition, a decision plot for cumulative contributions across multiple patient trajectories, and a force plot for individual prediction explanation relative to the baseline.
4. Experimental Results and Analysis
This section presents a comprehensive evaluation of the proposed IoT-ClinXAI framework. We first report baseline model performance without feature selection, then evaluate the impact of the proposed MHCFS method against three competitive feature-selection baselines, followed by SHAP-based interpretability analysis. All experiments were conducted in Python 3.10 on an Intel Core i7 system with 16 GB RAM. Feature selection, model selection, and hyperparameter optimization were performed using stratified 5-fold cross-validation on the training set, with fold-averaged results, while final performance was obtained by retraining the optimal model on the full training set and evaluating it once on the held-out test set. The results demonstrate that the proposed framework consistently achieves superior predictive performance and interpretability compared to all existing approaches.
4.1. Baseline Model Performance Without Feature Selection
Table 4 reports the performance of nine regression models on the full 28-feature dataset without feature selection. The proposed SO-RFR model achieves the best overall baseline results, with MAE 0.462, MSE 0.386, RMSE 0.621, 0.923, RMSLE 0.074, and MAPE 5.43%. It is followed by RFR (RMSE 0.641, 0.914), ANN (RMSE 0.654, 0.903), and Linear Regression (RMSE 0.662, 0.901), which show competitive but weaker performance than ensemble approaches. In contrast, SVR and KNN exhibit higher prediction errors, with RMSE values of 0.855 and 0.832 and scores of 0.874 and 0.890, indicating limited suitability for capturing nonlinear relationships in the dataset. Overall, SO-RFR improves upon standard RFR performance, reducing RMSE by 3.1% and reflecting the benefit of metaheuristic optimization even without feature selection.
Table 4.
Comparativeperformance of regression models on the held-out test set using the full feature set without feature selection.
To provide visual insight into baseline model performance, Figure 5 presents a grouped bar chart comparing all models in terms of and RMSE. A clear performance stratification is observed among ensemble methods (RFR, SO-RFR), neural approaches (ANN), linear models (LR), and distance-based methods (SVR, KNN). The SO-RFR model achieves the highest and the lowest RMSE among all baselines, establishing it as the most effective base architecture for subsequent feature-selection enhancement.
Figure 5.
Baseline model comparison on and RMSE without feature selection. Higher and lower RMSE indicate better performance.
4.2. Comparative Performance with Feature-Selection Methods
Table 5 presents a comprehensive comparative evaluation of four feature-selection methods, namely, RFE-RF, Boruta, mRMR, and the proposed MHCFS, combined with the best-performing regression models on the test set. The proposed MHCFS consistently outperforms all competing feature-selection approaches across all models and evaluation metrics, achieving the best overall performance with SO-RFR: MAE 0.342, MSE 0.227, RMSE 0.476, 0.964, RMSLE 0.047, and MAPE 3.13%. This corresponds to a 23.3% reduction in RMSE and a 4.4% improvement in compared to the SO-RFR baseline without feature selection, demonstrating the effectiveness of domain-aware, redundancy-penalized feature selection for this clinical prediction task.
Table 5.
Comparative performance of feature-selection methods on the held-out test set.
Among the baseline feature-selection methods, mRMR+SO-RFR achieved the best performance (RMSE = 0.534, = 0.948, MAPE = 4.05%), followed by Boruta+SO-RFR (RMSE 0.556, 0.941) and RFE-RF+SO-RFR (RMSE 0.578, 0.935). In comparison, MHCFS+SO-RFR achieved RMSE 0.476, 0.964, MAE 0.342 days, and MAPE 3.13%, corresponding to 10.9% lower RMSE, 1.6% higher , and 22.7% lower MAPE than the strongest baseline. These results are also competitive with published benchmarks: a systematic review of ICU length-of-stay regression reported values of 0.35–0.86 and RMSE values of 1.2–3.9 days, while general-ward studies frequently reported MAE > 1.5 days [18]. Although differences in clinical settings and target ranges should be considered, the substantially lower errors achieved by MHCFS+SO-RFR demonstrate its strong predictive performance and practical potential for recovery prediction and discharge planning.
Figure 6 presents a multi-axis radar chart comparing four feature-selection methods across five evaluation metrics (, RMSE, MAE, MAPE, and RMSLE) when paired with SO-RFR. The visualization clearly shows that MHCFS dominates all competing methods across every metric, with the largest enclosed area indicating superior overall multi-metric performance. Figure 7 presents the predicted versus actual recovery duration for the MHCFS+SO-RFR model. The results show tight clustering around the 45° identity line across the clinically critical 5–19 day range, with an OLS fit slope of approximately 1.0, indicating no systematic over- or under-prediction. The density-colored scatter demonstrates that most test samples are concentrated near perfect agreement, while the ±RMSE band (0.476 days) further confirms low prediction error, supported by strong overall performance (, MAE = 0.342 days, MAPE = 3.13%).
Figure 6.
Multi-metric radar comparison of the four feature-selection methods with SO-RFR. MHCFS encloses the largest area across all five performance dimensions.
Figure 7.
Predicted versus actual recovery duration for the proposed MHCFS+SO-RFR model on the test set, showing density-colored points (red: high density, blue: low density), agreement with the identity line, OLS fit indicating no systematic bias, and a ± RMSE error band.
To further validate residual behavior, Figure 8 presents the residual distribution (histogram and Q–Q plot) for the best-performing MHCFS+SO-RFR model. The residuals are approximately normally distributed with near-zero mean (, ), as evidenced by the fitted normal overlay in panel (a) and the near-linear alignment of sample quantiles with the theoretical reference line in panel (b). Normality is further supported by the Shapiro–Wilk test [59] (, ), indicating no statistically significant deviation from Gaussianity. The near-zero mean residual indicates minimal systematic bias, while the Shapiro–Wilk test supports normality.
Figure 8.
Residual analysis on the held-out test set. (a) Residual histogram showing near-zero bias with an overlaid normal density. (b) Q–Q plot with 95% confidence band, with Shapiro–Wilk test confirming no significant deviation from normality, indicating unbiased residual behavior.
4.3. Ablation Study of MHCFS Components
The ablation results in Table 6 show that each MHCFS tier contributes to performance and ranking stability. Single-domain results (A1–A3) indicate strong predictive power from clinical variables (RMSE = 0.604) and weak performance from environmental features (RMSE = 0.856), confirming their limited standalone utility. Domain-aware partitioning (A5 vs. A4) reduces RMSE by 2.7%, showing that separating feature domains improves relevance estimation. Multi-scorer aggregation (A6 vs. A5) further improves RMSE by 3.1%, demonstrating reduced scorer bias. Finally, Kemeny consensus (A7 vs. A6) provides the largest gain with a 5.5% RMSE reduction and improved rank stability (0.87 → 0.91).
Table 6.
Ablation study of MHCFS components on the held-out test set using the SO-RFR model.
The cross-domain redundancy penalty critically refines feature ranking and performance. At (A7), Respiration ranks third due to high BK (0.895) but remains redundant (CDD = 0.244). At (A9), the penalty suppresses Respiration below Pain, yielding the best subset and lowest RMSE (0.476). This separates primary clinical drivers (Ward type, Sleep, Pain) from secondary physiological signals. Sensitivity analysis shows optimal performance at , while weaker () and stronger () penalties degrade RMSE by 1.7% and 2.7–14.9%, respectively. Rank stability also peaks at for , confirming that moderate redundancy control yields the most stable feature rankings.
4.4. Metaheuristic Optimization Comparison
Table 7 presents the optimized RFR configurations and inner 5-fold CV performance of five metaheuristic algorithms using the MHCFS-selected features. Here, denotes the mean held-out validation-fold RMSE. SO achieved the best configuration (, , , ), with and . SO consistently outperforms PSO, ABC, GWO, and GA, with relative RMSE improvements of 20.2%, 19.3%, 18.5%, and 17.6%, respectively.
Table 7.
Optimized hyperparameters and inner 5-fold cross-validation performance of metaheuristic optimizers for Random Forest regression.
To ensure a fair comparison, all optimizers were evaluated under an identical computational budget of 3000 function evaluations (30 particles × 100 iterations). On the same hardware, mean runtimes were 48.1 ± 2.3 s (PSO), 49.5 ± 2.1 s (ABC), 50.8 ± 2.4 s (GWO), 51.2 ± 2.6 s (GA), and 52.3 ± 2.2 s (SO). Although SO introduces only an 8.7% increase in runtime relative to PSO, it achieves a 20.2% reduction in RMSE, indicating improved search efficiency rather than higher computational cost. The optimized SO-RFR model achieves a per-patient inference latency of <5 ms, enabling real-time clinical decision support even in resource-constrained hospital environments.
4.5. Statistical Significance Analysis
All algorithmic comparisons used nested repeated stratified 5-fold CV (5 repeats × 5 folds), with five quantile-based target bins and fixed seeds (42, 52, 62, 72, 82). Within each outer fold, MHCFS and SO were independently refit using inner 5-fold CV and evaluated on the untouched validation fold, preventing data leakage. All RMSE values in Table 8 denote outer-loop held-out validation RMSE and therefore reflect generalization performance.
Table 8.
Statistical robustness of MHCFS+SO-RFR against baseline methods using nested repeated stratified 5-fold cross-validation, followed by a Wilcoxon signed-rank test with Bonferroni-corrected p-values.
The Friedman test applied to the 25 fold-level validation RMSE values indicated significant differences among feature-selection methods (, ) and optimizers (, ). Pairwise comparisons were conducted using the Wilcoxon signed-rank test (paired, two-tailed). The test statistic W denotes the sum of ranks for folds in which the proposed method achieved lower validation RMSE than the baseline; with paired folds, the theoretical maximum is . Bonferroni-adjusted significance thresholds were set at for the three feature-selection comparisons and for the four optimizer comparisons. As reported in Table 8, the proposed MHCFS+SO-RFR achieved significantly lower validation RMSE than every baseline across the 25 folds (, all exact ). The mean validation RMSE from repeated nested CV () closely matched the single inner 5-fold CV result used for model selection in Table 7 (), confirming the stability of the optimization landscape across independent random splits. Using 10,000 bias-corrected and accelerated (BCa) bootstrap resamples on the final test set, the estimates were RMSE 0.476 days (95% CI: 0.412–0.543), 0.964 (95% CI: 0.951–0.976), and MAPE 3.13%.
4.6. SHAP-Based Explainability Analysis
The optimal MHCFS-selected feature subset is used to train the final SO-RFR model, which is then subjected to comprehensive SHAP-based XAI analysis. Four complementary visualization types are applied to reveal both global feature importance patterns and patient-level prediction explanations, addressing the critical interpretability requirements for clinical AI systems.
4.6.1. Global Feature Importance—SHAP Beeswarm Summary Plot
Figure 9 presents the SHAP beeswarm summary plot, which simultaneously encodes global feature importance (vertical ranking) and directional effects (horizontal SHAP value distribution), with feature values indicated by color (red high, blue low). Ward_Type_ICU emerges as the dominant predictor: ICU admission (high feature values, red dots) consistently produces large positive SHAP contributions, strongly increasing predicted recovery duration, while non-ICU status (blue) substantially reduces predictions. This finding aligns with clinical understanding that ICU patients typically present with more severe conditions requiring longer recovery. Ward_Type_Semi_Private and Respiration_Rate_bpm show positive associations at higher values, indicating that patients in semi-private wards with elevated respiratory rates tend to have longer recovery trajectories. Conversely, lower Oxygen_Saturation_SpO2_% (blue) is associated with increased recovery duration, reflecting hypoxemia severity. Age and Pain_Level_Score contribute mild positive effects, while Sleep_Quality, Primary_Diagnosis, and other ward and treatment variables exhibit progressively smaller contributions.
Figure 9.
SHAP beeswarm summary plot showing global feature importance ranking and directional effects for the proposed MHCFS+SO-RFR model.
4.6.2. Patient-Level Attribution—SHAP Waterfall Plot
Figure 10 presents the SHAP waterfall plot for a representative high-risk patient (Instance 0), illustrating how the prediction increases from the baseline value, , to the final predicted recovery duration, days. Ward_Type_ICU is the dominant contributor (+3.61), accounting for approximately 79% of the total increase above the baseline. This effect is partially offset by Ward_Type_Semi_Private (−0.55). Additional positive contributions include Age (75 years, +0.21), Oxygen_Saturation_SpO2_% (90%, +0.18), Respiration_Rate_bpm (24 bpm, +0.16), Sleep_Quality (4, +0.14), and Pain_Level_Score (7, +0.07). All remaining features contribute minimally (<±0.04), confirming that ICU admission is the primary driver of the prolonged recovery prediction.
Figure 10.
SHAP waterfall plot for a representative high-risk patient (Instance 0), decomposing the prediction from baseline expectation to final model output.
4.6.3. Population-Level Trajectories—SHAP Decision Plot
Figure 11 presents the SHAP decision plot, illustrating the cumulative contribution of features across all test-set predictions. Each colored line represents an individual patient’s prediction, progressing from the global baseline (approximately 8 days) to the final predicted recovery duration. Feature values are color-coded, with blue indicating lower values and red indicating higher values. Ward_Type_ICU is the primary source of prediction variability, where ICU patients (red trajectories) show a marked increase in recovery duration, often exceeding 14 days, whereas non-ICU patients (blue trajectories) remain below this level. Additional variation is introduced by Ward_Type_Semi_Private, Respiration_Rate_bpm, and Oxygen_Saturation_SpO2_%, indicating that recovery risk is jointly influenced by ward type and respiratory-related clinical variables rather than any single feature.
Figure 11.
SHAP decision plot illustrating cumulative feature contributions across all test-set patient predictions, revealing ICU admission as the dominant divergence point.
4.6.4. Individual Prediction Explanation—SHAP Force Plot
Figure 12 presents the SHAP force plot for the same high-risk patient (Instance 0), illustrating how individual features shift the prediction from the baseline value, , to the final predicted recovery duration, days. Red arrows denote features that increase the prediction, whereas blue arrows indicate features that decrease it. Ward_Type_ICU (1) is the dominant positive contributor, substantially increasing the predicted recovery duration, while Ward_Type_Semi_Private (0) provides the primary negative contribution. Additional positive effects from Age (75 years), Oxygen_Saturation_SpO2_% (90%), Respiration_Rate_bpm (24 bpm), and Sleep_Quality (4) collectively increase the prediction by approximately 0.65 days, demonstrating the combined influence of multiple clinical risk factors beyond ICU admission.
Figure 12.
SHAP force plot decomposing the prediction for a high-risk patient from baseline (12.16) to final output (15.89 days), with red forces increasing and blue forces decreasing the prediction.
Collectively, the four SHAP visualizations provide a multi-scale interpretability framework, covering global feature importance (Figure 9), individual patient attribution (Figure 10), population-level prediction trajectories (Figure 11), and single-instance decomposition (Figure 12). The results indicate that ward allocation, particularly ICU versus non-ICU status, is the primary driver of recovery prediction, while respiratory rate and oxygen saturation act as key secondary risk factors. The consistent suppression of IoT environmental variables in the MHCFS-selected feature set, supported by near-zero SHAP contributions for temperature, humidity, and noise, further validates the ability of the proposed framework to isolate clinically relevant signals from redundant sensor noise.
5. Discussion
The proposed IoT-ClinXAI framework integrates real-world environmental, clinical, and physiological data for predictive recovery analytics. Our results show that the proposed MHCFS with SO-RFR achieves high predictive performance for recovery prediction, reaching an of 0.964, RMSE of 0.476 days, and MAPE of 3.13% on the test set. Our findings confirm and refine prior evidence reviewed in Section 2. Multimodal fusion of environmental, physiological, and clinical data extends the OMOP-based LOS models of Lee et al. [21] and wearable-focused approaches reviewed in [18], while MHCFS outperforms mRMR, RFE-RF, and Boruta [46,47,48], supporting the value of domain-aware Borda–Kemeny consensus aggregation [24]. The 17.6–20.2% RMSE improvement of SO over PSO, ABC, GWO, and GA further supports its effectiveness for clinical regression [38]. Finally, the multi-scale SHAP framework extends existing XAI approaches [40,44] by combining global, patient-level, and population-level explanations for clinical decision support.
MHCFS assigned all environmental sensor variables to the lowest importance tier (<0.03), suggesting limited independent predictive value in this dataset. This finding is context-specific and does not contradict prior evidence linking healing environments, natural light, and acoustic quality with patient recovery [14,15,17]. Rather, it suggests that ward-level environmental averages and static admission-time measurements may provide limited additional information once clinical severity, ward type, and physiological signals are incorporated. Patient-level and longitudinal environmental sensing, which were unavailable here, may capture effects not reflected in aggregated measurements. Thus, our results refine rather than challenge the existing environmental-health evidence. Ward allocation, particularly ICU admission, emerges as the dominant predictor (MHCFS score 1.000, SHAP +3.61 days), while SHAP analysis further reveals interactions with respiratory rate and oxygen saturation that stratify non-ICU patients into distinct recovery trajectories, capturing clinically meaningful heterogeneity beyond a single dominant feature. SHAP values indicate predictive contribution rather than causality [39,44]. The high importance of Ward_Type_ICU likely captures differences in patient acuity and clinical decision-making, highlighting its value for risk stratification and resource planning rather than as a direct treatment effect.
The proposed framework extends existing approaches across data integration, feature selection, optimization, and interpretability. Most LOS prediction models rely on narrow clinical or physiological data; EHR-based OMOP models show strong internal performance but reduced external validity due to heterogeneity [16]. Wearable-based systems enable early warning but are often limited by unimodal sensing [6]; continuous multimodal streams were unavailable in our dataset, which contains aggregated admission-time measurements. To our knowledge, this study is the first to systematically evaluate the incremental value of environmental IoT data within a unified multimodal prediction framework. In feature selection, MHCFS differs from methods such as mRMR, RFE-RF, and Boruta [46,47,48] by introducing a three-tier hierarchy with domain-aware partitioning, multi-scorer consensus, and cross-domain redundancy control. MHCFS significantly outperforms mRMR, indicating that domain-partitioned consensus captures complementary information beyond global redundancy minimization. In optimization, SO improves cross-validated RMSE over PSO, ABC, GWO, and GA, owing to its adaptive exploration–exploitation strategy that avoids premature convergence [28]. SHAP visualizations provide complementary interpretability perspectives for different clinical decision needs, aligning with multi-stakeholder requirements in healthcare XAI [36,39].
The findings have actionable clinical implications for smart hospital operations and bedside decision support. Ward allocation emerges as the dominant predictor (≈79% contribution in high-risk cases), supporting IoT-ClinXAI as a tool for bed management and patient flow optimization, with potential to reduce preventable costs from inaccurate discharge planning [1]. SHAP-based interpretability supports real-time clinical decision-making by decomposing individual predictions into clinically meaningful contributions. In high-risk cases, factors such as age (75 years), oxygen saturation (90%), and respiratory rate (24 bpm), in addition to ICU admission, jointly increase predicted recovery duration by 0.65 days, enabling transparent and informed clinical discussions. The consistent low importance of environmental features indicates a clear division of roles in smart wards where environmental IoT systems focus on comfort optimization while clinical–physiological models handle predictive analytics, aligning sensor deployment with decision-support objectives.
Several limitations should be carefully considered in interpreting the results. The study uses a single-center dataset, and although internal validation is strong (5-fold CV), the lack of external validation limits generalizability; prior studies report 8% performance drops across institutions due to data heterogeneity [5,16]. Additionally, the framework relies on static admission-time features and therefore cannot capture temporal patient changes or post-admission deterioration, which longitudinal monitoring can better detect and predict [6]. Environmental features are aggregated at ward level, which may underestimate their true patient-level relevance. SHAP-based interpretations are also sensitive to feature correlation and baseline selection, despite being applied to a reduced feature set [43].
The framework advances multimodal healthcare analytics by integrating domain-aware feature selection, swarm-intelligence-based optimization, and multi-scale XAI within a unified decision-support architecture. It achieves strong predictive performance while maintaining clinically interpretable explanations aligned with medical knowledge. The low contribution of environmental variables provides insight into the functional separation between predictive modeling and environmental control in smart hospital systems. Despite limitations including single-center data, static modeling, and SHAP correlation sensitivity, the performance gains remain statistically robust, reproducible across cross-validation folds, and supported by clinically meaningful feature attributions. These advances provide a foundation for trustworthy clinical tools that can improve patient outcomes and operational efficiency, contingent on future validation addressing external generalizability, temporal dynamics, and regulatory compliance across diverse healthcare settings.
6. Conclusions and Future Work
This study presented IoT-ClinXAI, a multimodal framework that integrates domain-aware hierarchical feature selection, SO-based RFR, and SHAP-based XAI for patient recovery prediction in smart wards. The proposed framework consistently outperformed conventional feature-selection and optimization approaches, while the ablation study confirmed the contribution of each MHCFS tier to predictive performance and ranking stability. SHAP analysis identified clinically meaningful recovery drivers and provided transparent explanations that support trustworthy clinical decision-making. Furthermore, the low importance of environmental sensor features indicates that ward-level environmental measurements offer limited independent predictive value once clinical and physiological information is available, providing practical guidance for the design of smart hospital systems. These findings establish IoT-ClinXAI as a trustworthy and interpretable clinical decision-support framework for bed management, discharge planning, and hospital resource optimization, supported by robust and clinically meaningful predictions.
While the proposed IoT-ClinXAI framework demonstrates strong internal validity, several limitations remain. The small, single-center dataset limits generalizability, motivating future multi-center external validation across larger and more diverse populations. Integrating continuous wearable streams with temporal learning models could enable dynamic risk prediction and early detection of post-admission complications. Patient-level IoT sensing may also capture individualized environmental effects beyond ward-level measurements. Furthermore, causal inference methods, including propensity-score matching, directed acyclic graphs, and instrumental-variable analysis, should be explored to distinguish true physiological drivers of recovery from predictive associations and administrative proxies such as ward allocation. Future work should also investigate severity-aware modeling, fairness across demographic groups, distribution-shift monitoring, and compliance with emerging clinical AI regulations to support reliable, equitable, and trustworthy clinical decision support.
Author Contributions
Conceptualization, A.S.M. and S.S.A.; methodology, A.S.M. and S.S.A.; software, A.S.M., A.C. and S.S.A.; validation, A.S.M., A.C. and S.S.A.; formal analysis, A.C. and S.S.A.S.; investigation, A.T.S. and M.H.R.; resources, A.S.M., A.C., S.S.A.S. and S.S.A.; data curation, A.S.M., A.C., S.S.A.S., S.S.A. and A.T.S.; writing—original draft preparation, A.S.M., A.C., S.S.A.S., S.S.A. and A.T.S.; writing—review and editing, M.H.R. and A.T.S.; visualization, A.S.M., A.C. and S.S.A.; supervision, M.H.R.; project administration, M.H.R. All authors have read and agreed to the published version of the manuscript.
Funding
This research received no external funding.
Institutional Review Board Statement
Not applicable.
Informed Consent Statement
Not applicable.
Data Availability Statement
Data are contained within the article.
Acknowledgments
During the preparation of this study, the authors used ChatGPT (OpenAI, v.3.5) for grammar, language style, and spelling checks. The authors have reviewed and edited the output and take full responsibility for the content of this publication.
Conflicts of Interest
The authors declare no conflicts of interest.
References
- Hirani, R.; Podder, D.; Stala, O.; Mohebpour, R.; Tiwari, R.K.; Etienne, M. Strategies to reduce hospital length of stay: Evidence and challenges. Medicina 2025, 61, 922. [Google Scholar] [CrossRef] [Scilit] [PubMed]
- Siddique, S.M.; Tipton, K.; Leas, B.; Greysen, S.R.; Mull, N.K.; Lane-Fall, M.; McShea, K.; Tsou, A.Y. Interventions to reduce hospital length of stay in high-risk populations: A systematic review. JAMA Netw. Open 2021, 4, e2125846. [Google Scholar] [CrossRef] [Scilit] [PubMed]
- Halpern, N.A.; Pastores, S.M. Critical care medicine in the United States 2000–2005: An analysis of bed numbers, occupancy rates, payer mix, and costs. Crit. Care Med. 2010, 38, 65–71. [Google Scholar] [CrossRef] [Scilit] [PubMed]
- Bruyneel, A.; Larcin, L.; Martins, D.; Van Den Bulcke, J.; Leclercq, P.; Pirson, M. Cost comparisons and factors related to cost per stay in intensive care units in Belgium. BMC Health Serv. Res. 2023, 23, 986. [Google Scholar] [CrossRef] [Scilit] [PubMed]
- Mengistu, A.K.; Getinet, K.; Alemayehu, T.; Yeneakal, K.A.; Gedefaw, A.E.; Teym, A.; Endalew, B.; Assaye, B.T. Machine learning predicts prolonged patient length of stay in a resource constrained Ethiopian hospital. Discov. Artif. Intell. 2026, 6, 88. [Google Scholar] [CrossRef] [Scilit]
- Zeng, W.; Boiangiu, M.; Trachsel, N.; Jarawan, E.; Turbat, V.; Meessen, B. What affects the performance of hospital financing interventions in low-and lower-middle-income countries from the program design and implementation perspective? A scoping review. Health Policy Plan. 2025, 40, czaf065. [Google Scholar] [CrossRef] [Scilit] [PubMed]
- Scheid, M.R.; Friedmann, B.; Oppenheim, M.; Hirsch, J.S.; Zanos, T.P. Development and validation of a clinical wearable deep learning based continuous inhospital deterioration prediction model. Nat. Commun. 2025, 16, 9513. [Google Scholar] [CrossRef] [Scilit] [PubMed]
- Huang, J.D.; Wang, J.; Ramsey, E.; Leavey, G.; Chico, T.J.; Condell, J. Applying artificial intelligence to wearable sensor data to diagnose and predict cardiovascular disease: A review. Sensors 2022, 22, 8002. [Google Scholar] [CrossRef] [Scilit] [PubMed]
- Ahmed, S.; Pasha, A.; Kumer, T.; Akhtaruzzaman, M.; Hossain, M. Advancements in Air Quality Monitoring Systems: A Comprehensive Review of Emerging Technologies for Enhancing Environmental Health. Indoor Air 2026, 2026, 3080684. [Google Scholar] [CrossRef] [Scilit]
- Parkavi, A.; Sowmya, B.; Alex, S.A.; Supreeth, S.; Shruthi, G.; Rohith, S.; Chatterjee, S.; Lingaraj, K. Air quality and dust level monitoring systems in hospitals using IoT. Discov. Internet Things 2025, 5, 23. [Google Scholar] [CrossRef] [Scilit]
- Wu, Q.; Li, N.; Cai, X.; He, Y.; Du, Y. Impact of indoor environmental quality (IEQ) factors on occupants’ environmental perception and satisfaction in hospital wards. Build. Environ. 2023, 245, 110918. [Google Scholar] [CrossRef] [Scilit]
- Ogasawara, T.; Mukaino, M.; Matsunaga, K.; Wada, Y.; Suzuki, T.; Aoshima, Y.; Furuzawa, S.; Kono, Y.; Saitoh, E.; Yamaguchi, M.; et al. Prediction of stroke patients’ bedroom-stay duration: Machine-learning approach using wearable sensor data. Front. Bioeng. Biotechnol. 2024, 11, 1285945. [Google Scholar] [CrossRef] [Scilit] [PubMed]
- Ayon, S.S.; Al Mamun, A.; Hossain, M.E.; Alamro, W.; Allawi, Y.M.; Prova, N.N.I.; Miah, M.S.U.; Sultan, S.M.; Abadleh, A. Explainable AI framework for improved Thalassemia mental health classification and feature selection. PLoS ONE 2026, 21, e0341168. [Google Scholar] [CrossRef] [Scilit] [PubMed]
- Alessa, A.M.; Alwallan, M.B.; Albedeiwy, O.M.; Alkahtani, S.A.; Almangour, D.F.; Almodhiy, H.S.; Alruwaili, A.A.; Alhaidari, S.A.; AlEssa, R.H.; Ababtain, L.A. The Impact of Hospital Environment on Patient Recovery: A Mixed-Methods Study of Psychological and Sociological Perspectives. IJSAT-Int. J. Sci. Technol. 2024, 15, 1–12. [Google Scholar] [CrossRef]
- Dijkstra, K.; Pieterse, M.; Pruyn, A. Physical environmental stimuli that turn healthcare facilities into healing environments through psychologically mediated effects: Systematic review. J. Adv. Nurs. 2006, 56, 166–181. [Google Scholar] [CrossRef] [Scilit] [PubMed]
- de Lima Andrade, E.; da Cunha e Silva, D.C.; de Lima, E.A.; de Oliveira, R.A.; Zannin, P.H.T.; Martins, A.C.G. Environmental noise in hospitals: A systematic review. Environ. Sci. Pollut. Res. 2021, 28, 19629–19642. [Google Scholar] [CrossRef] [Scilit] [PubMed]
- Zhou, T.; Wu, Y.; Meng, Q.; Kang, J. Influence of the acoustic environment in hospital wards on patient physiological and psychological indices. Front. Psychol. 2020, 11, 1600. [Google Scholar] [CrossRef] [Scilit] [PubMed]
- Zepeda-Lugo, C.; Insfran-Rivarola, A.; Sanchez-Lizarraga, M.; Macias-Velasquez, S.; Arevalos, A.P.; Baez-Lopez, Y.; Tlapa, D. Evaluating Artificial Intelligence Models for ICU Length of Stay Prediction: A Systematic Review and Meta-Analysis. Healthcare 2026, 14, 1131. [Google Scholar] [CrossRef] [Scilit] [PubMed]
- Hossain, M.E.; Das, B.C.; Ayon, S.S.; Mia, J.; Hasan, M.M.; Khan, M. Explainable AI for NAFLD Prediction Using Clinical and Lifestyle Data. In Proceedings of the 2026 5th International Conference on Electrical, Computer & Telecommunication Engineering (ICECTE), Rajshahi, Bangladesh, 29–31 January 2026; IEEE: New York, NY, USA, 2026; pp. 1–6. [Google Scholar] [CrossRef] [Scilit]
- Abubakkar, M.; Khan, M.M.; Hossain, M.Z.; Islam, R.; Khan, N.I.; Nahar, K. AI in Neurology: Speech-Based Detection of Parkinson’s Disease using Machine Learning Models. In Proceedings of the 2025 IEEE 9th Forum on Research and Technologies for Society and Industry (RTSI), Tunis, Tunisia, 24–26 August 2025; IEEE: New York, NY, USA, 2025; pp. 152–157. [Google Scholar] [CrossRef] [Scilit]
- Lee, H.; Kim, S.; Moon, H.W.; Lee, H.Y.; Kim, K.; Jung, S.Y.; Yoo, S. Hospital length of stay prediction for planned admissions using observational medical outcomes partnership common data model: Retrospective study. J. Med. Internet Res. 2024, 26, e59260. [Google Scholar] [CrossRef] [Scilit] [PubMed]
- Palanisamy, S.; Thangaraju, V.; Kandasamy, J.; Salau, A.O. Towards precision in IoT-based healthcare systems: A hybrid optimized framework for big data classification. J. Big Data 2025, 12, 190. [Google Scholar] [CrossRef] [Scilit]
- Sharif, K.S.; Abubakkar, M.; Uddin, M.M.; Khaled, A.A. A comparative framework integrating hybrid convolutional and unified graph neural networks for accurate parkinson’s disease classification. In Proceedings of the 2024 7th International Seminar on Research of Information Technology and Intelligent Systems (ISRITI), Yogyakarta, Indonesia, 11–12 December 2024; IEEE: New York, NY, USA, 2024; pp. 31–37. [Google Scholar] [CrossRef] [Scilit]
- Luo, J.; Du, J.; He, J.; Huang, Q.; Liu, Z.; Huang, G. A Stability-Oriented Biomarker Selection Framework Synergistically Driven by Robust Rank Aggregation and L1-Sparse Modeling. Metabolites 2025, 15, 806. [Google Scholar] [CrossRef] [Scilit] [PubMed]
- Aghdam, R.; Shan, S.; Lankau, R.; Solís-Lemus, C. A hybrid framework for disease biomarker discovery in microbiome research combining Bayesian networks, machine learning, and network-based methods. Biol. Methods Protoc. 2026, 11, bpaf089. [Google Scholar] [CrossRef] [Scilit] [PubMed]
- Ma, T.; Ni, H.; Luo, X.; Zhang, M.; Shen, L.; Chen, C.; Luo, K.; Xie, S.; Yang, Z.; Lin, Y.; et al. Application of swarm intelligence optimization techniques and explainable data-driven methods in predicting the shear strength of serrated jointed rock masses. Int. J. Geo-Eng. 2026, 17, 9. [Google Scholar] [CrossRef] [Scilit]
- Georgiades, M.; Hussain, F. An explainable ai approach for interpretable cross-layer intrusion detection in internet of medical things. Electronics 2025, 14, 3218. [Google Scholar] [CrossRef] [Scilit]
- Molla, A.S.; Datta, T.; De Florence, F.; Rayhan, R.; Rahman, M.K.; Kabir, M.H. Explainable AI Framework for Multiclass Attack Classification in Wireless Network Intrusion Detection Systems. In Proceedings of the 2025 IEEE 2nd International Conference on Computing, Applications and Systems (COMPAS), Kushtia, Bangladesh, 17–18 October 2025; IEEE: New York, NY, USA, 2025; pp. 1–6. [Google Scholar] [CrossRef] [Scilit]
- Moss, J.; Gordon, J.; Duclos, W.; Liu, Y.; Wang, Q.; Wang, J. Explainable AI in IoT: A Survey of Challenges, Advancements, and Pathways to Trustworthy Automation. Electronics 2025, 14, 4622. [Google Scholar] [CrossRef] [Scilit]
- Abdelhay, E.H.; Elgamily, K.M.; Badr, W.O.E.F. Metaheuristic optimization of deep CNNs for multi-class diagnosis of cervical cancer and lymphoma. Sci. Rep. 2026, 16, 15110. [Google Scholar] [CrossRef] [Scilit] [PubMed]
- Li, P. Optimizing Random Forest Models with Snake Optimization Algorithm for Predicting E-commerce User Purchase Behaviour. Informatica 2025, 49, 397–414. [Google Scholar] [CrossRef] [Scilit]
- Abdulmalek, S.; Nasir, A.; Jabbar, W.A.; Almuhaya, M.A.; Bairagi, A.K.; Khan, M.A.M.; Kee, S.H. IoT-based healthcare-monitoring system towards improving quality of life: A review. Healthcare 2022, 10, 1993. [Google Scholar] [CrossRef] [Scilit] [PubMed]
- Selçuk, E.; Gündeş, S. Evidence based lighting design in healthcare facilities. In International Research in the Field of Architecture; Eğitim Yayınevi: Konya, Turkey, 2024. [Google Scholar]
- Li, J.; Zhai, C. Patient-environment monitoring for smart healthcare in hospitals with cooperative power-data transfer. Sci. Rep. 2026, 16, 5794. [Google Scholar] [CrossRef] [Scilit] [PubMed]
- Rampengan, D.; Permana, N.J.; Wuisan, D. Machine Learning in Hospital Bed Management and Patient Flow: A Comprehensive Review of Evidence Synthesis and Implementation Guidance. J. Cult. Anal. Soc. Change 2025, 10, 3110–3125. [Google Scholar] [CrossRef]
- Aljarah, I.; Alzaqebah, A.; Al-Madi, N.; Al-Zoubi, A.; Saleh, A. mDA: Evolutionary Machine Learning Algorithm for Feature Selection in Medical Domain. Computation 2025, 13, 292. [Google Scholar] [CrossRef] [Scilit]
- Duan, W.; Liang, D.; Zhang, Y. Towards improving decision quality for rank aggregation through consensus and utility dual-driven method. J. Oper. Res. Soc. 2026, 77, 1380–1395. [Google Scholar] [CrossRef] [Scilit]
- Tuan, N.M.; Duy, T.T.; Meesad, P.; Son, N.H.; Hien, N.T.; Thua, H.T.; Van Tinh, V.; Van Van, C.; Trang, N.L.N. Optimizing predictive accuracy in general medical exams using hybrid machine learning and metaheuristic optimization methods. Int. J. Optim. Control. Theor. Appl. 2026, 16, 888–907. [Google Scholar] [CrossRef] [Scilit]
- Lundberg, S.M.; Lee, S.I. A unified approach to interpreting model predictions. arXiv 2017, arXiv:1705.07874. [Google Scholar] [CrossRef] [Scilit]
- Abbas, Q.; Jeong, W.; Lee, S.W. Explainable AI in clinical decision support systems: A meta-analysis of methods, applications, and usability challenges. Healthcare 2025, 13, 2154. [Google Scholar] [CrossRef] [Scilit] [PubMed]
- Paneru, B.; Paneru, B.; Sapkota, S.C.; Poudyal, R. Enhancing healthcare with AI: Sustainable AI and IoT-Powered ecosystem for patient aid and interpretability analysis using SHAP. Meas. Sens. 2024, 36, 101305. [Google Scholar] [CrossRef] [Scilit]
- Deshmukh, S. SHAP-Based Explainable Framework for Disease Prediction and Comorbidity Risk Assessment in Healthcare. SSRN 2025. [Google Scholar] [CrossRef] [Scilit]
- Givisis, I.; Kalatzis, D.; Christakis, C.; Kiouvrekis, Y. Comparing explainable AI models: SHAP, LIME, and their role in electric field strength prediction over urban areas. Electronics 2025, 14, 4766. [Google Scholar] [CrossRef] [Scilit]
- Carriero, A.; de Hond, A.; Cappers, B.; Paulovich, F.; Abeln, S.; Moons, K.G.; van Smeden, M. Explainable AI in healthcare: To explain, to predict, or to describe? Diagn. Progn. Res. 2025, 9, 29. [Google Scholar] [CrossRef] [Scilit] [PubMed]
- Das, B.C.; Likhon, M.R.I.; Hossain, M.E.; Ayon, S.S.; Arafin, B.M.M.; Miah, M.S.U.; Hossen, M.J.; Mridha, F. IoT-Integrated Smart Ward Dataset for Environmental, Physiological, and Clinical Analysis of Patient Recovery. Mendeley Data 2025. [Google Scholar] [CrossRef]
- Chen, C.; Liang, J.; Sun, W.; Yang, G.; Meng, X. An automatically recursive feature elimination method based on threshold decision in random forest classification. Geo-Spat. Inf. Sci. 2025, 28, 1494–1519. [Google Scholar] [CrossRef] [Scilit]
- Subbiah, S.; Anbananthen, K.S.M.; Thangaraj, S.; Kannan, S.; Chelliah, D. Intrusion detection technique in wireless sensor network using grid search random forest with Boruta feature selection algorithm. J. Commun. Netw. 2022, 24, 264–273. [Google Scholar] [CrossRef] [Scilit]
- Ahmed, Y.A.; Huda, S.; Al-Rimy, B.A.S.; Alharbi, N.; Saeed, F.; Ghaleb, F.A.; Ali, I.M. A weighted minimum redundancy maximum relevance technique for ransomware early detection in industrial IoT. Sustainability 2022, 14, 1231. [Google Scholar] [CrossRef] [Scilit]
- Walling, S.; Lodh, S. Enhancing IoT intrusion detection through machine learning with AN-SFS: A novel approach to high performing adaptive feature selection. Discov. Internet Things 2024, 4, 16. [Google Scholar] [CrossRef] [Scilit]
- Ranalli, M.G.; Salvati, N.; Petrella, L.; Pantalone, F. M-quantile regression shrinkage and selection via the Lasso and Elastic Net to assess the effect of meteorology and traffic on air quality. Biom. J. 2023, 65, 2100355. [Google Scholar] [CrossRef] [Scilit] [PubMed]
- Bach, R.L. Applied Statistical Learning—With Case Studies in Stata. J. R. Stat. Soc. Ser. A (Stat. Soc.) 2024, 187, 854. [Google Scholar] [CrossRef] [Scilit]
- Ahrens, A.; Hansen, C.B.; Schaffer, M.E. pystacked: Stacking generalization and machine learning in Stata. Stata J. 2023, 23, 909–931. [Google Scholar] [CrossRef] [Scilit]
- Conitzer, V.; Davenport, A.; Kalagnanam, J. Improved bounds for computing Kemeny rankings. AAAI 2006, 6, 620–626. [Google Scholar]
- Guyon, I.; Elisseeff, A. An introduction to variable and feature selection. J. Mach. Learn. Res. 2003, 3, 1157–1182. [Google Scholar] [CrossRef] [Scilit]
- Xu, M.; Qiu, Y.; Khandelwal, M.; Kadkhodaei, M.H.; Zhou, J. Optimizing Random Forest with Hybrid Swarm Intelligence Algorithms for Predicting Shear Bond Strength of Cable Bolts. Machines 2025, 13, 758. [Google Scholar] [CrossRef] [Scilit]
- Hashim, F.A.; Hussien, A.G. Snake Optimizer: A novel meta-heuristic optimization algorithm. Knowl.-Based Syst. 2022, 242, 108320. [Google Scholar] [CrossRef] [Scilit]
- Gummadi, A.N.; Napier, J.C.; Abdallah, M. XAI-IoT: An explainable AI framework for enhancing anomaly detection in IoT systems. IEEE Access 2024, 12, 71024–71054. [Google Scholar] [CrossRef] [Scilit]
- Siddique Ayon, S.; Ebrahim Hossain, M.; Ullah Miah, M.S.; Rahman, M.M.; Mahmud, M. Explainable ai in feature selection: Improving classification performance on imbalanced datasets. In International Conference on Neural Information Processing; Springer: Berlin/Heidelberg, Germany, 2024; pp. 303–318. [Google Scholar] [CrossRef] [Scilit]
- Kwak, S.G.; Park, S.H. Normality test in clinical research. J. Rheum. Dis. 2019, 26, 5–11. [Google Scholar] [CrossRef] [Scilit]
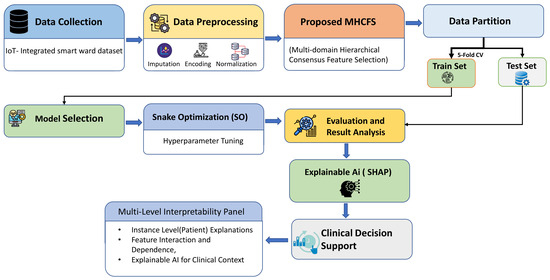
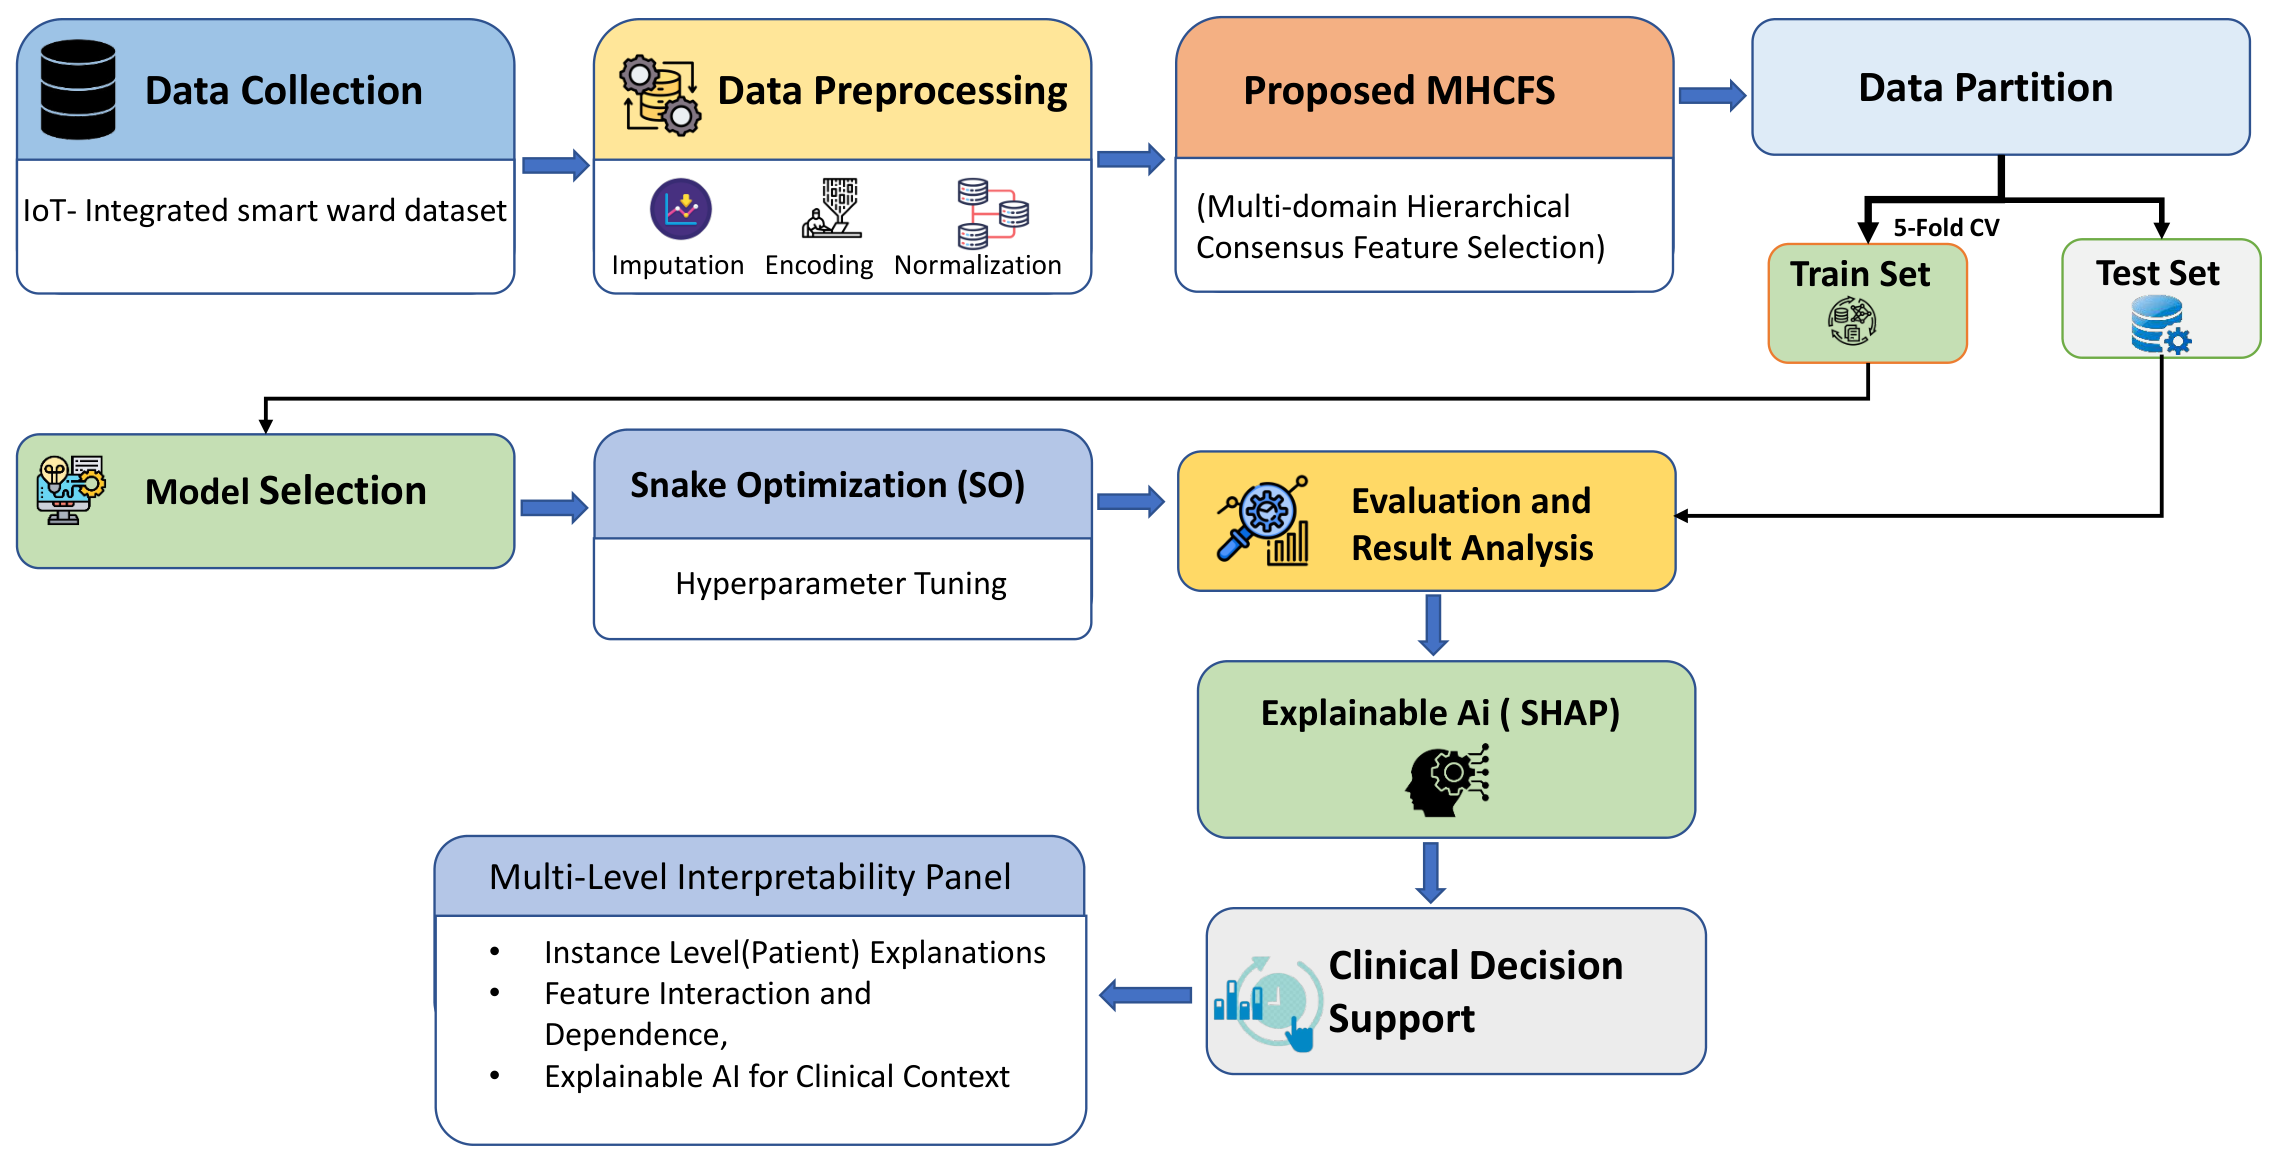
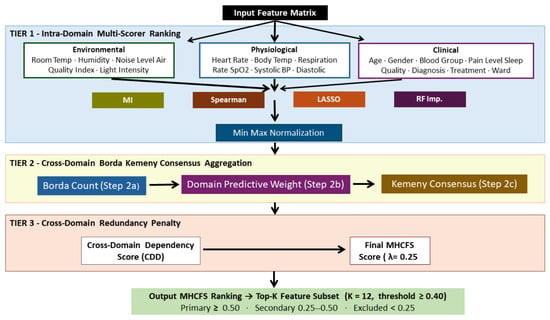
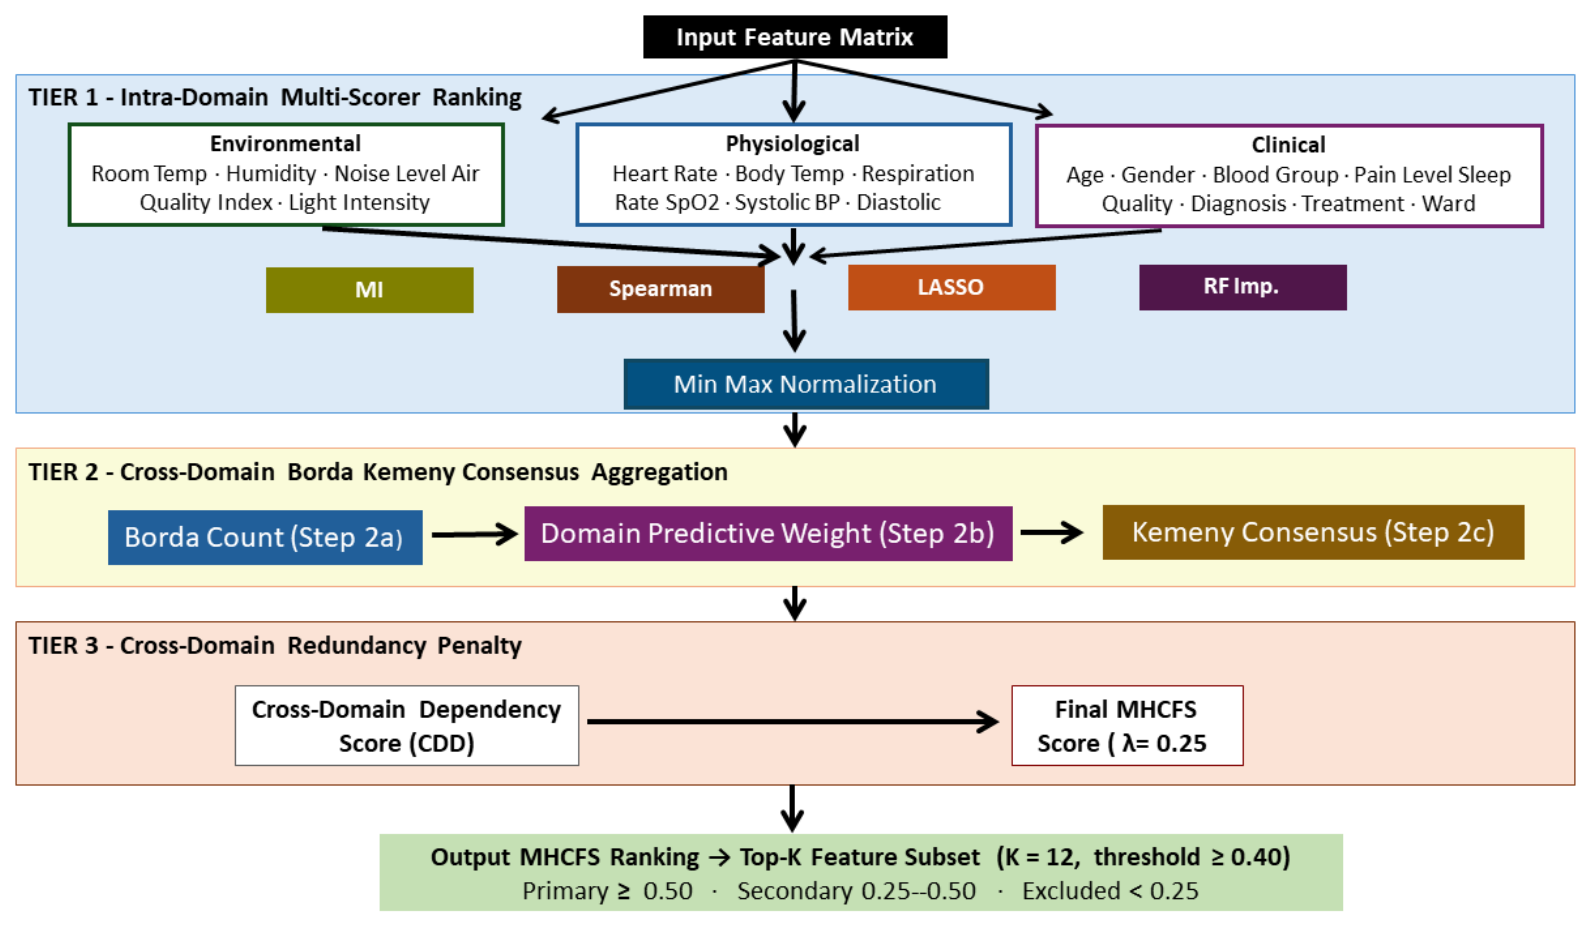
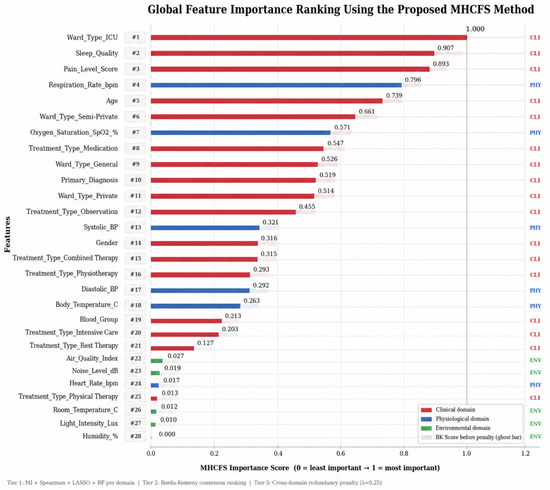
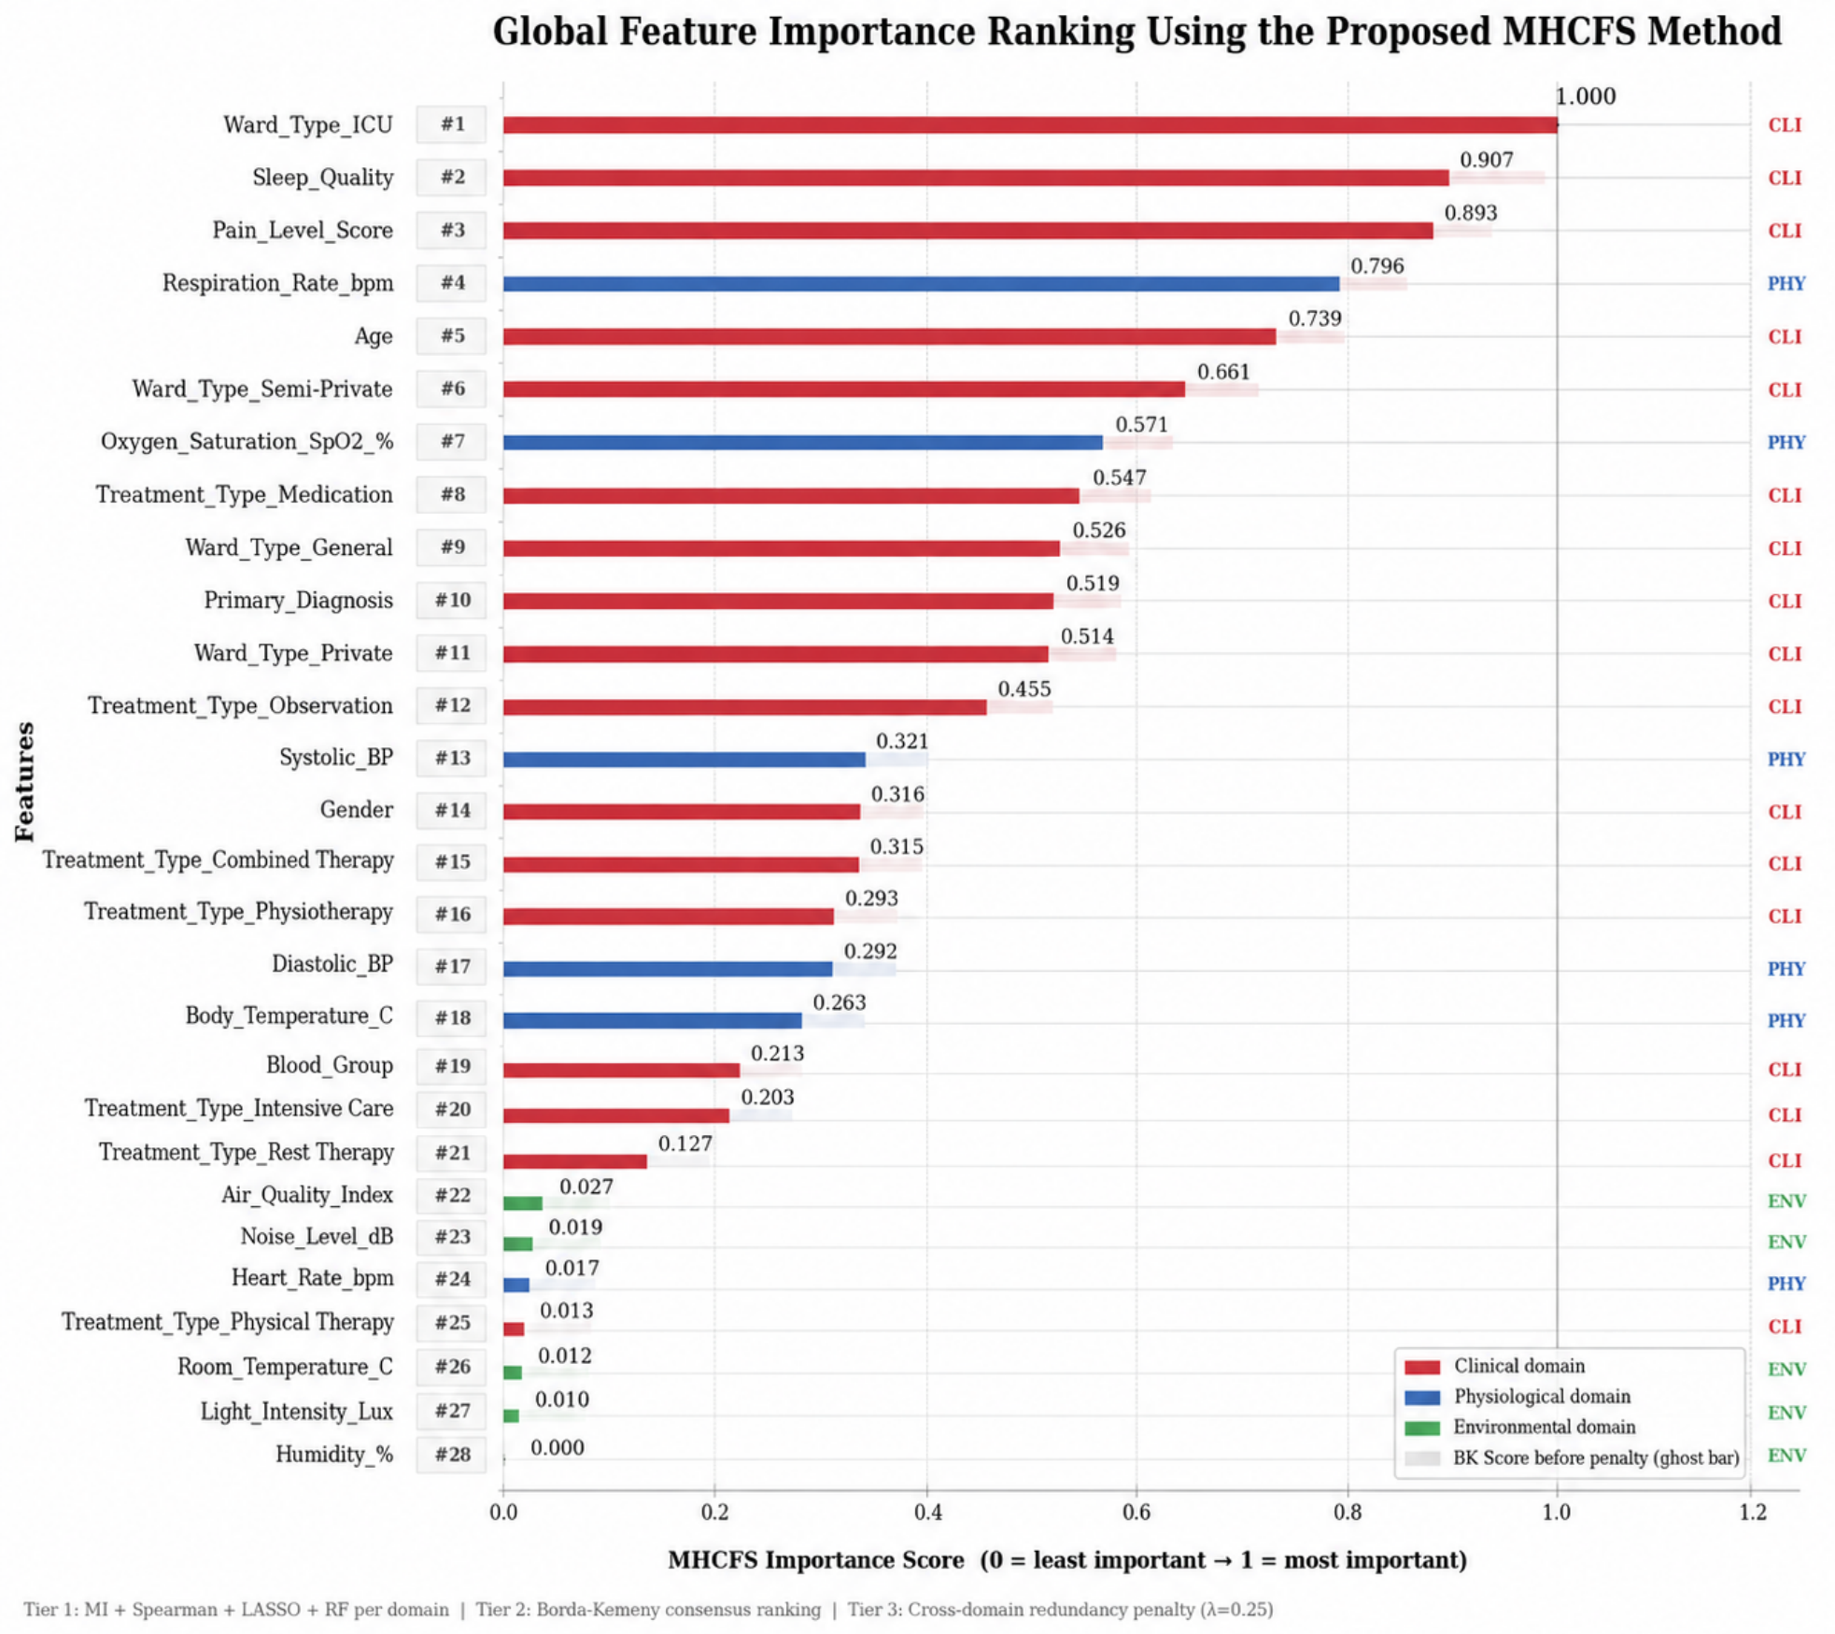
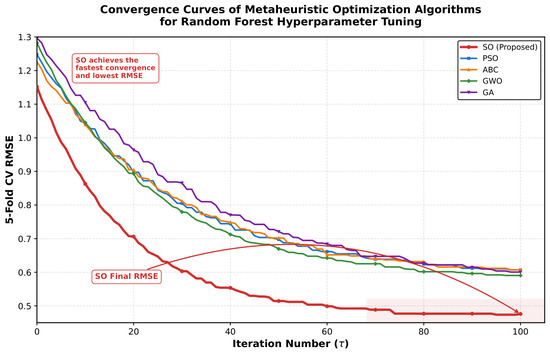
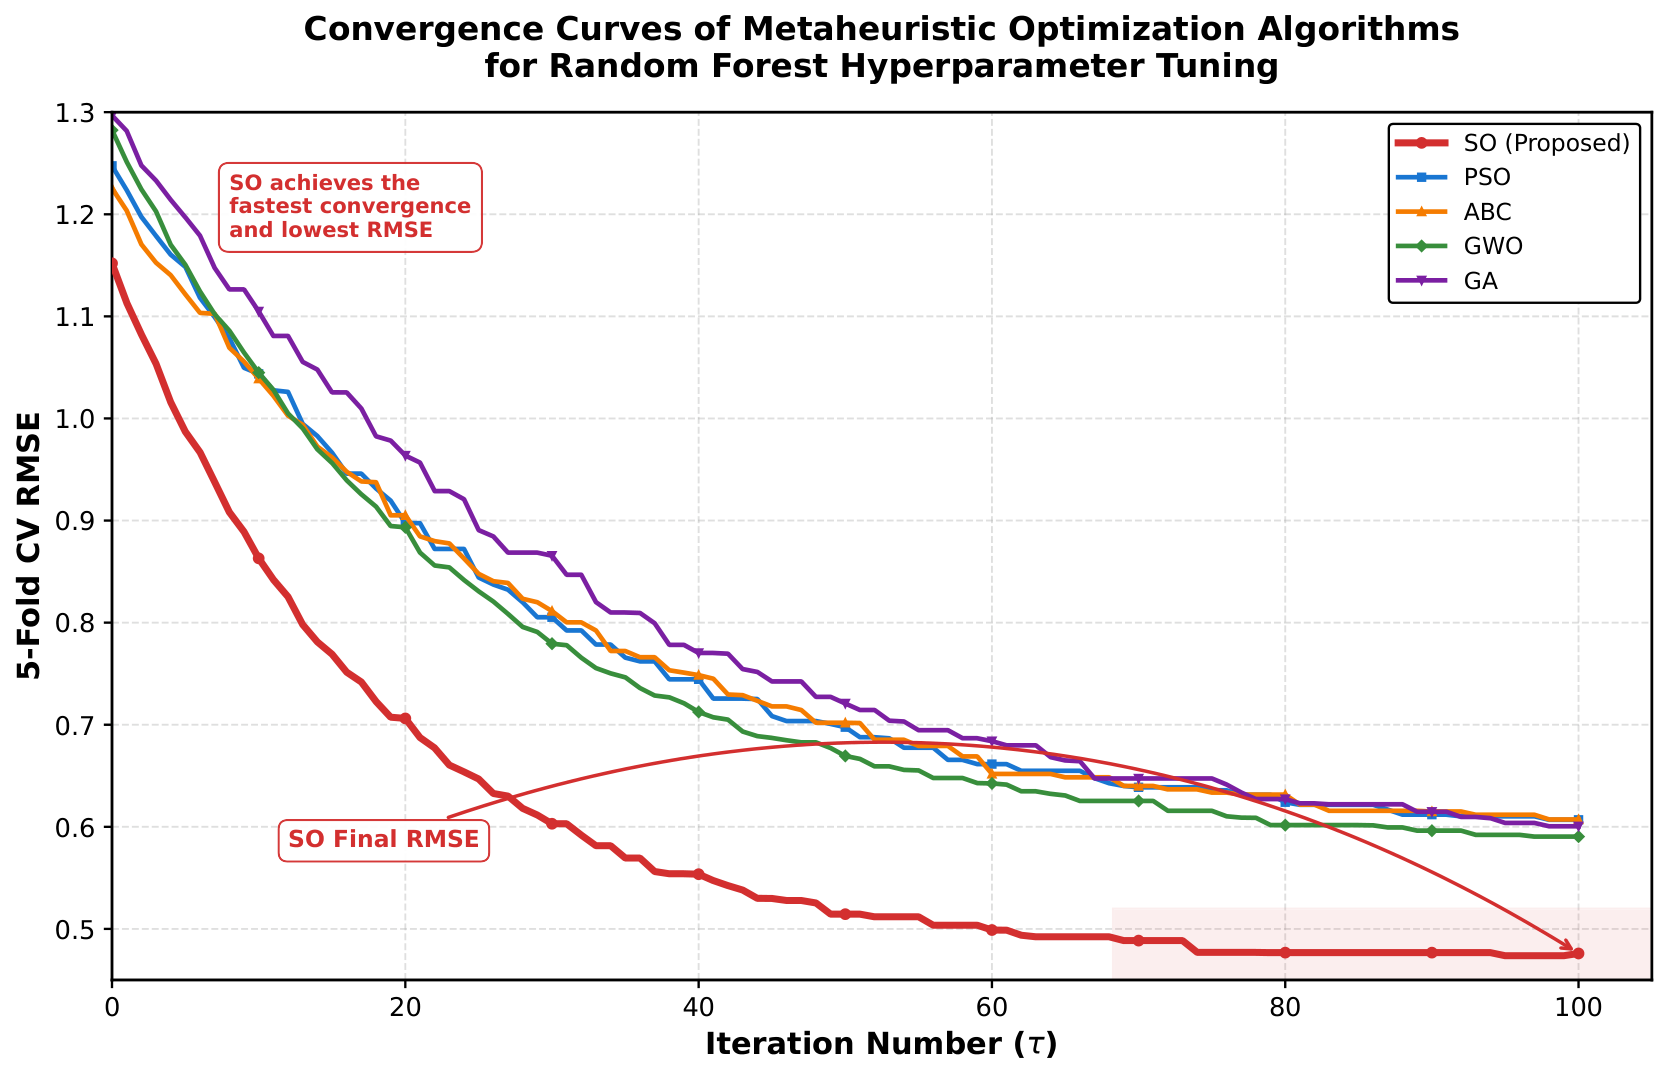
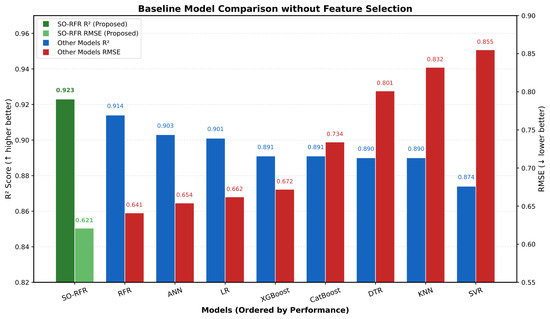
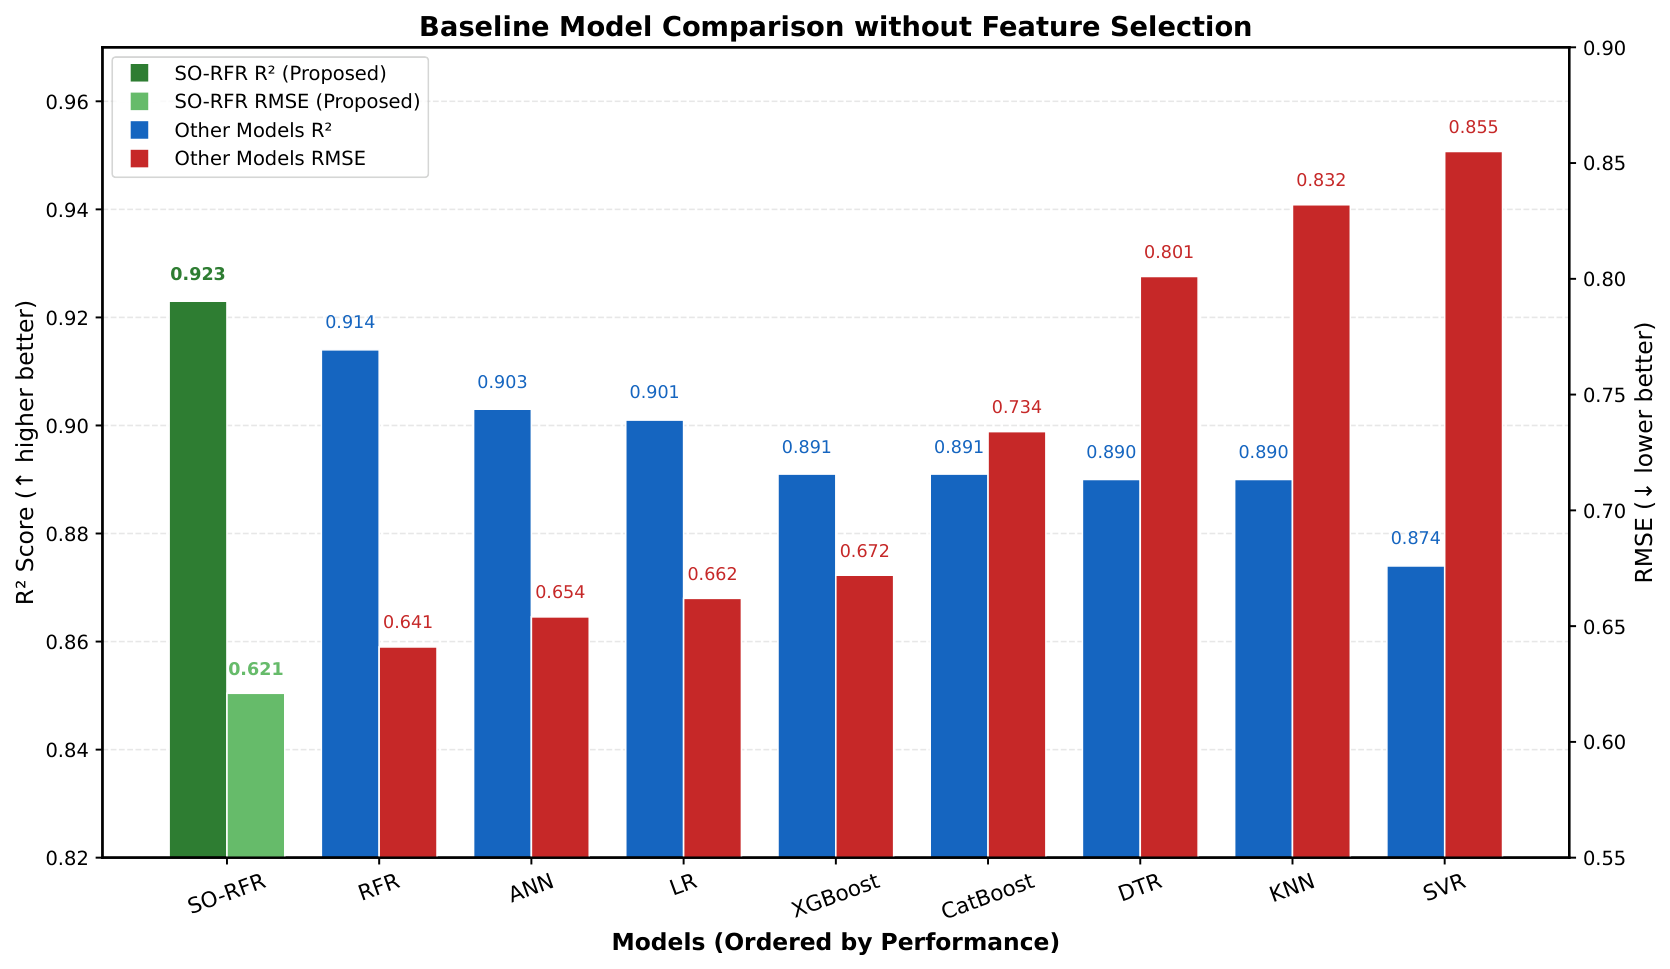
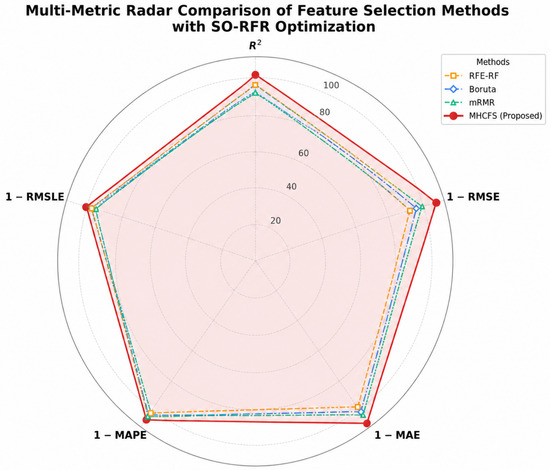
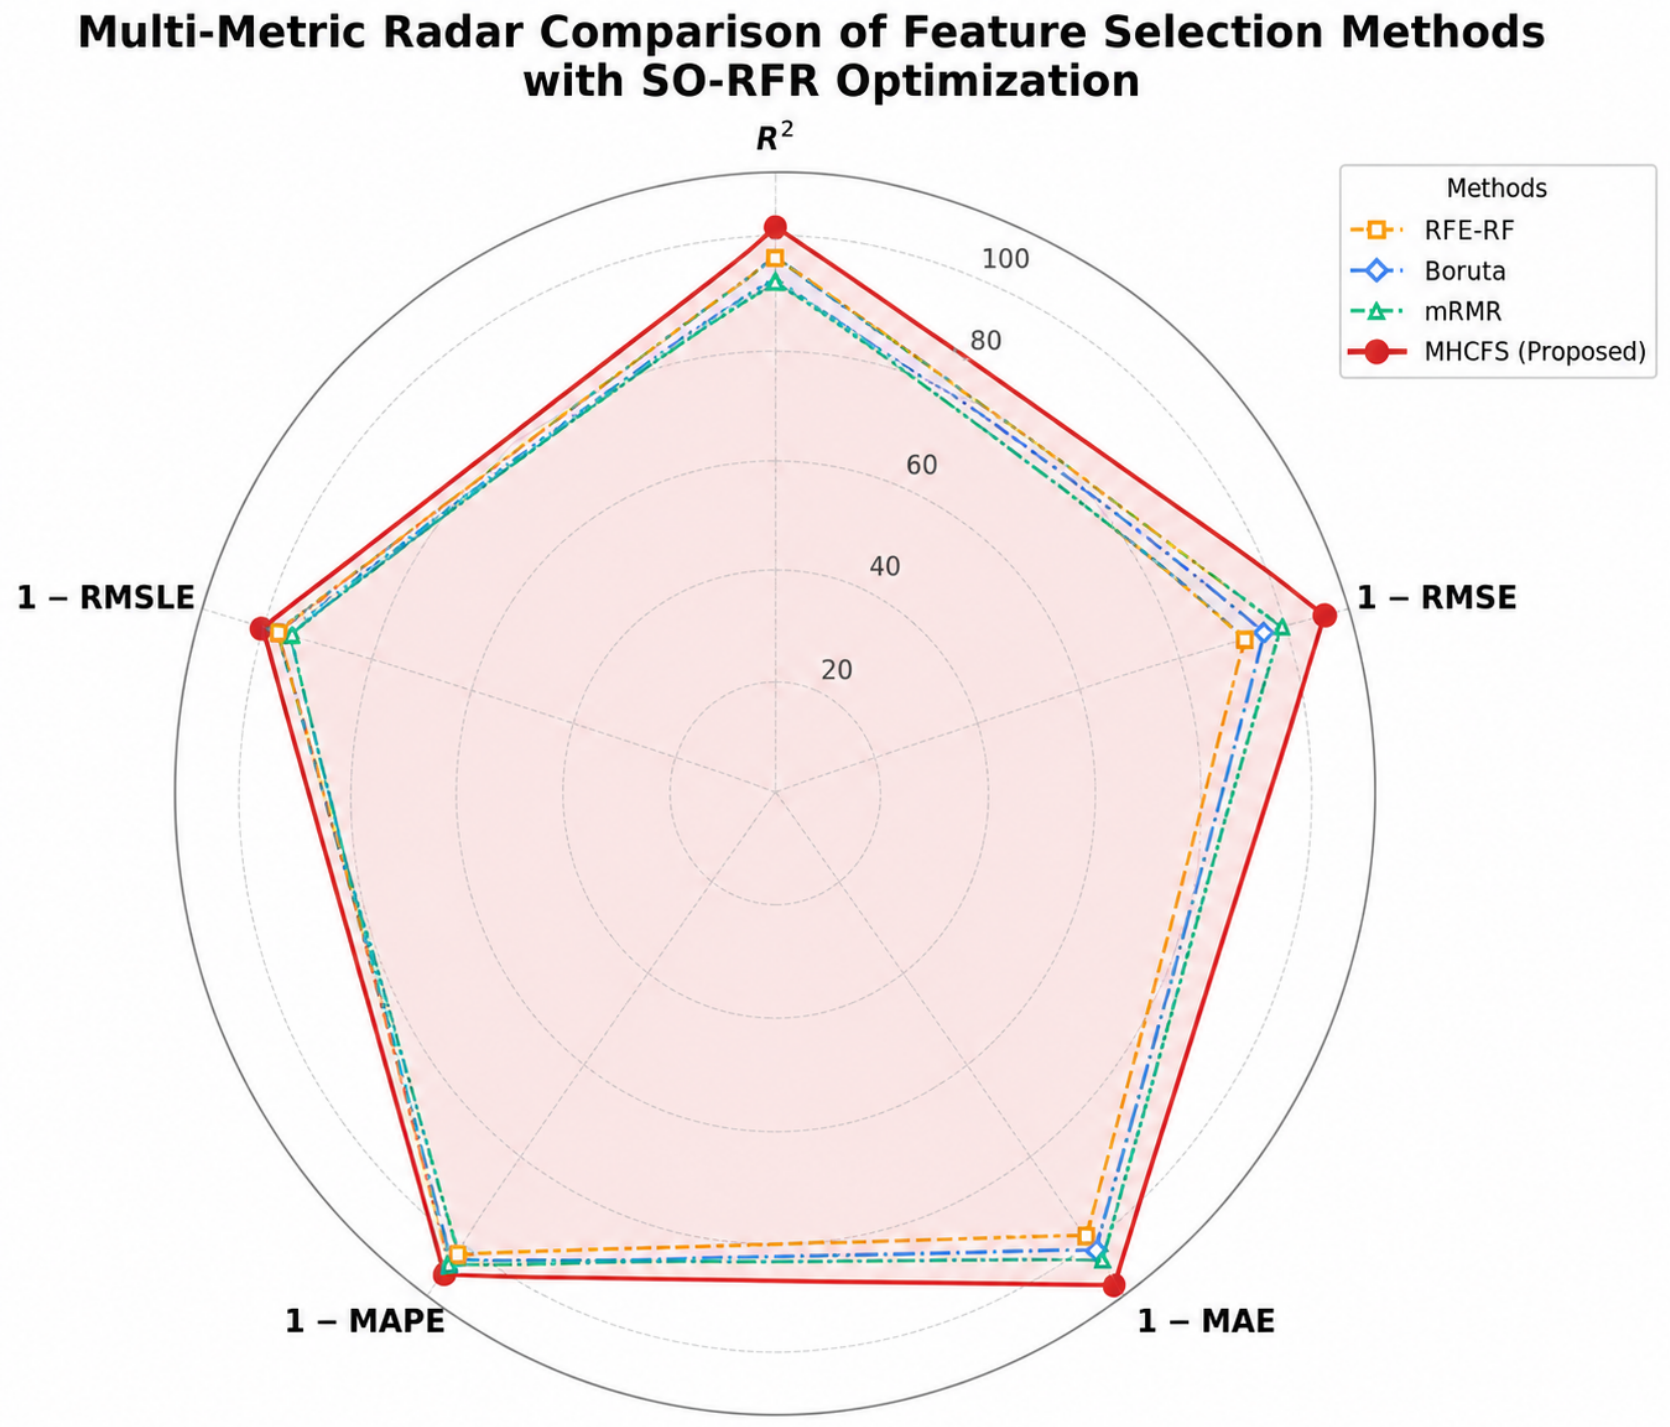
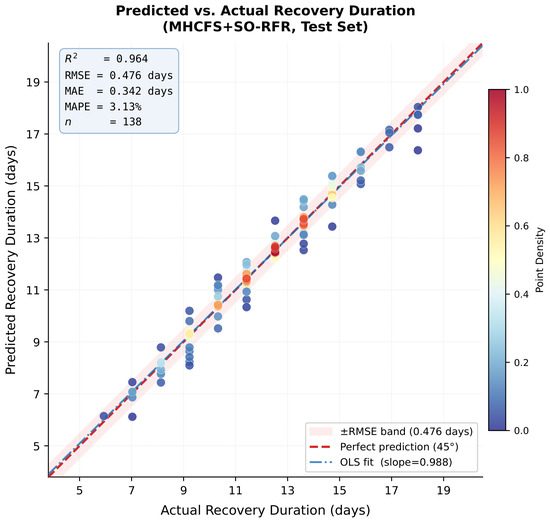
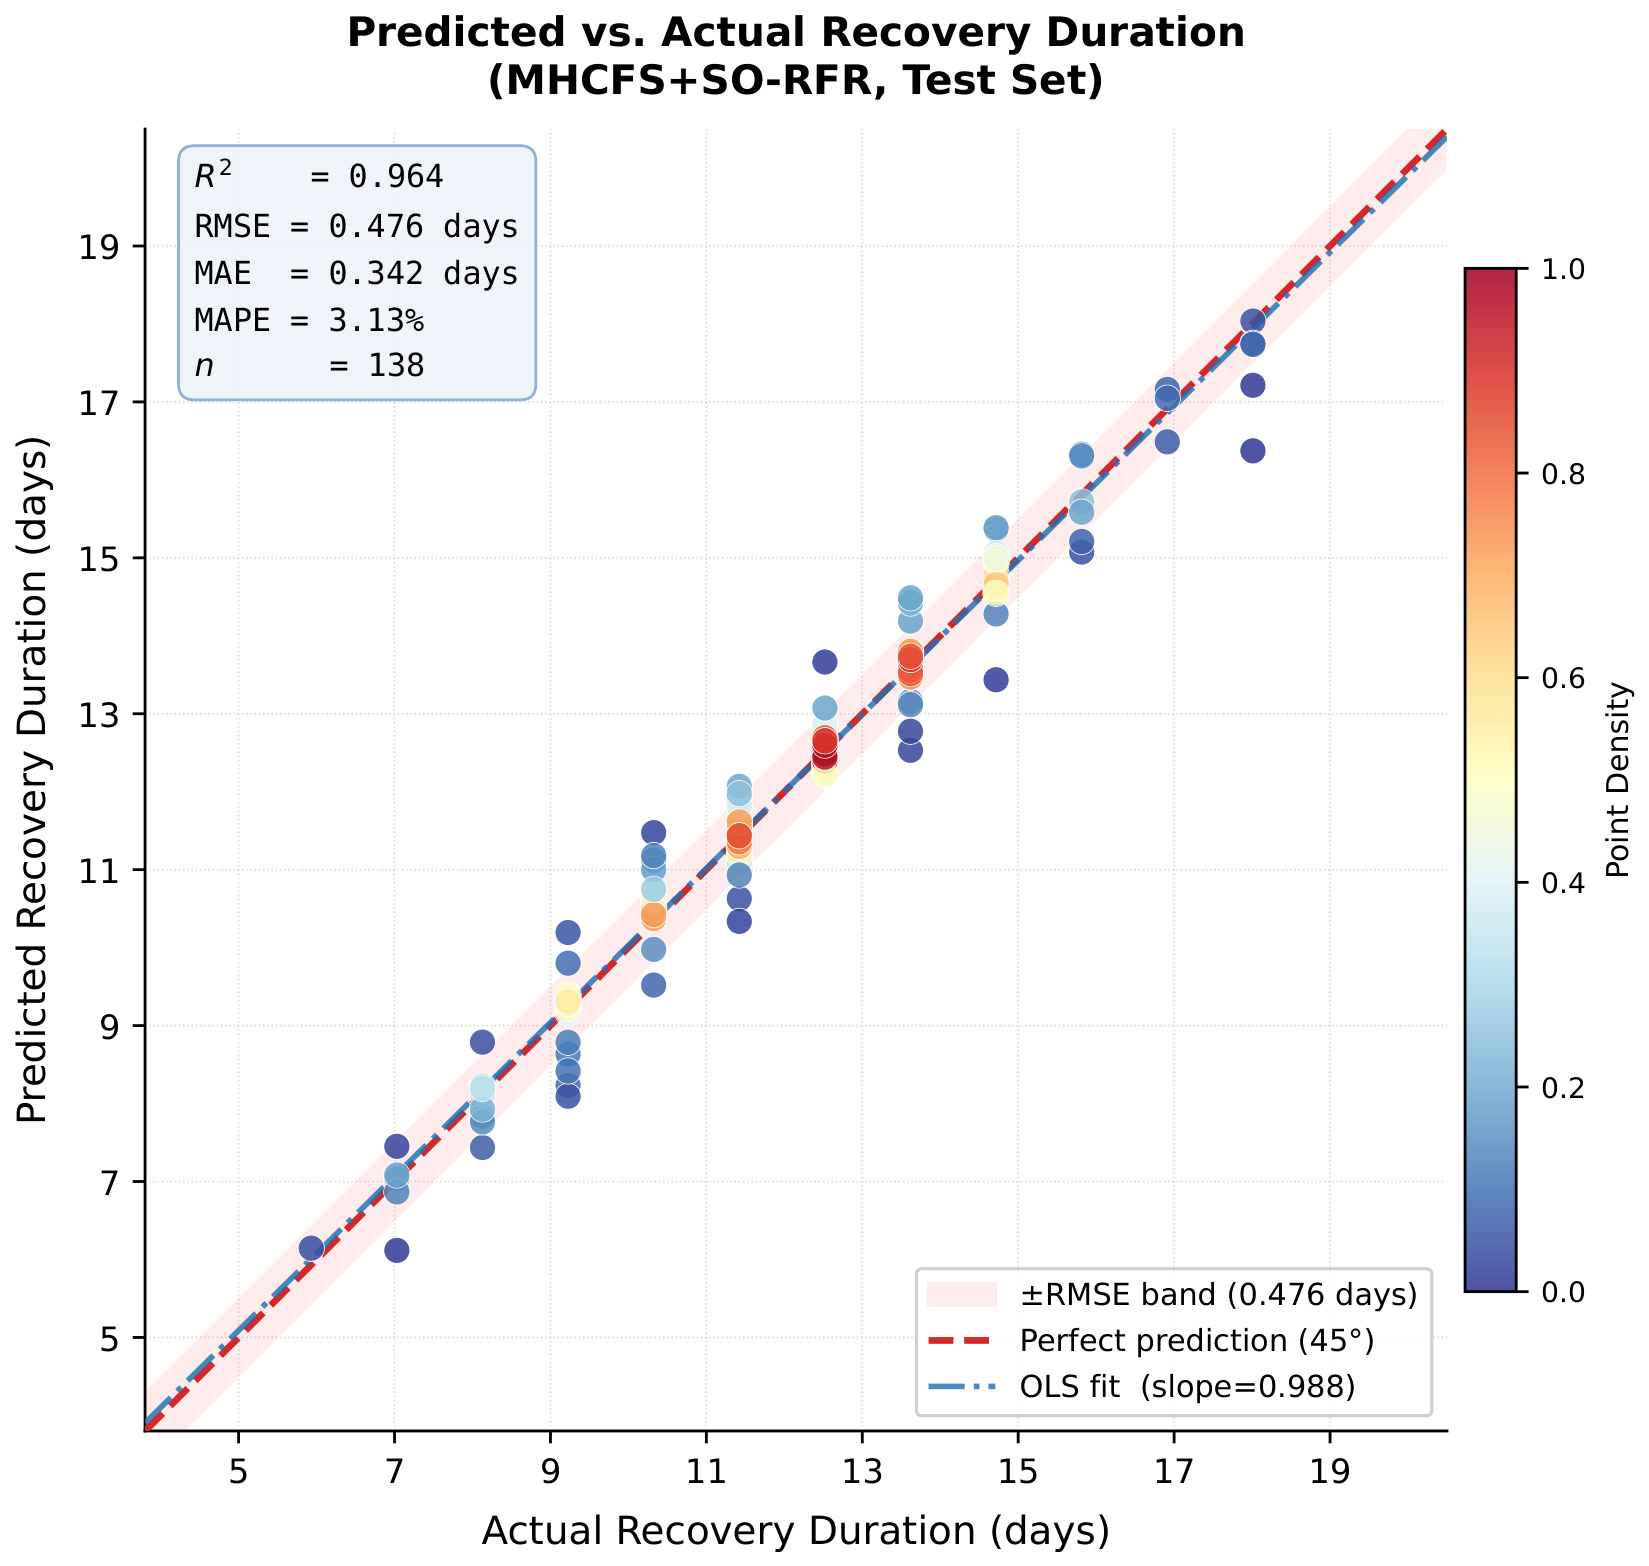
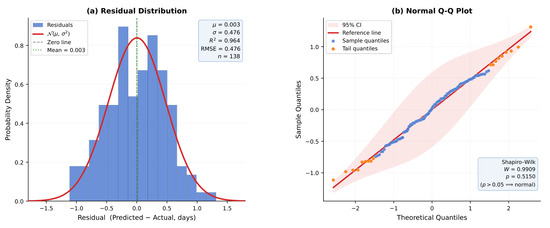
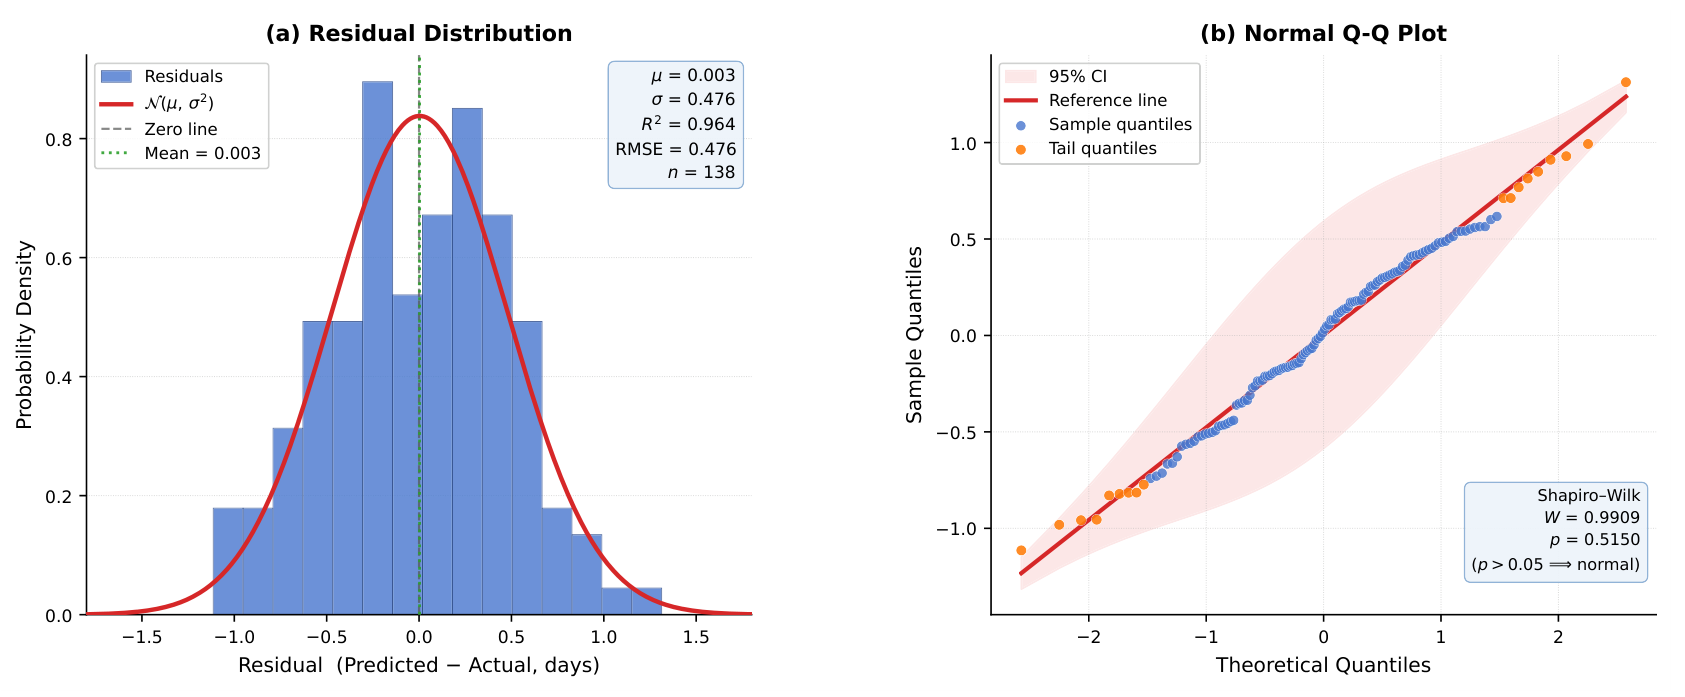
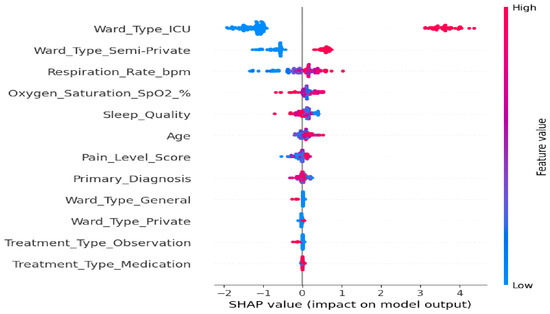
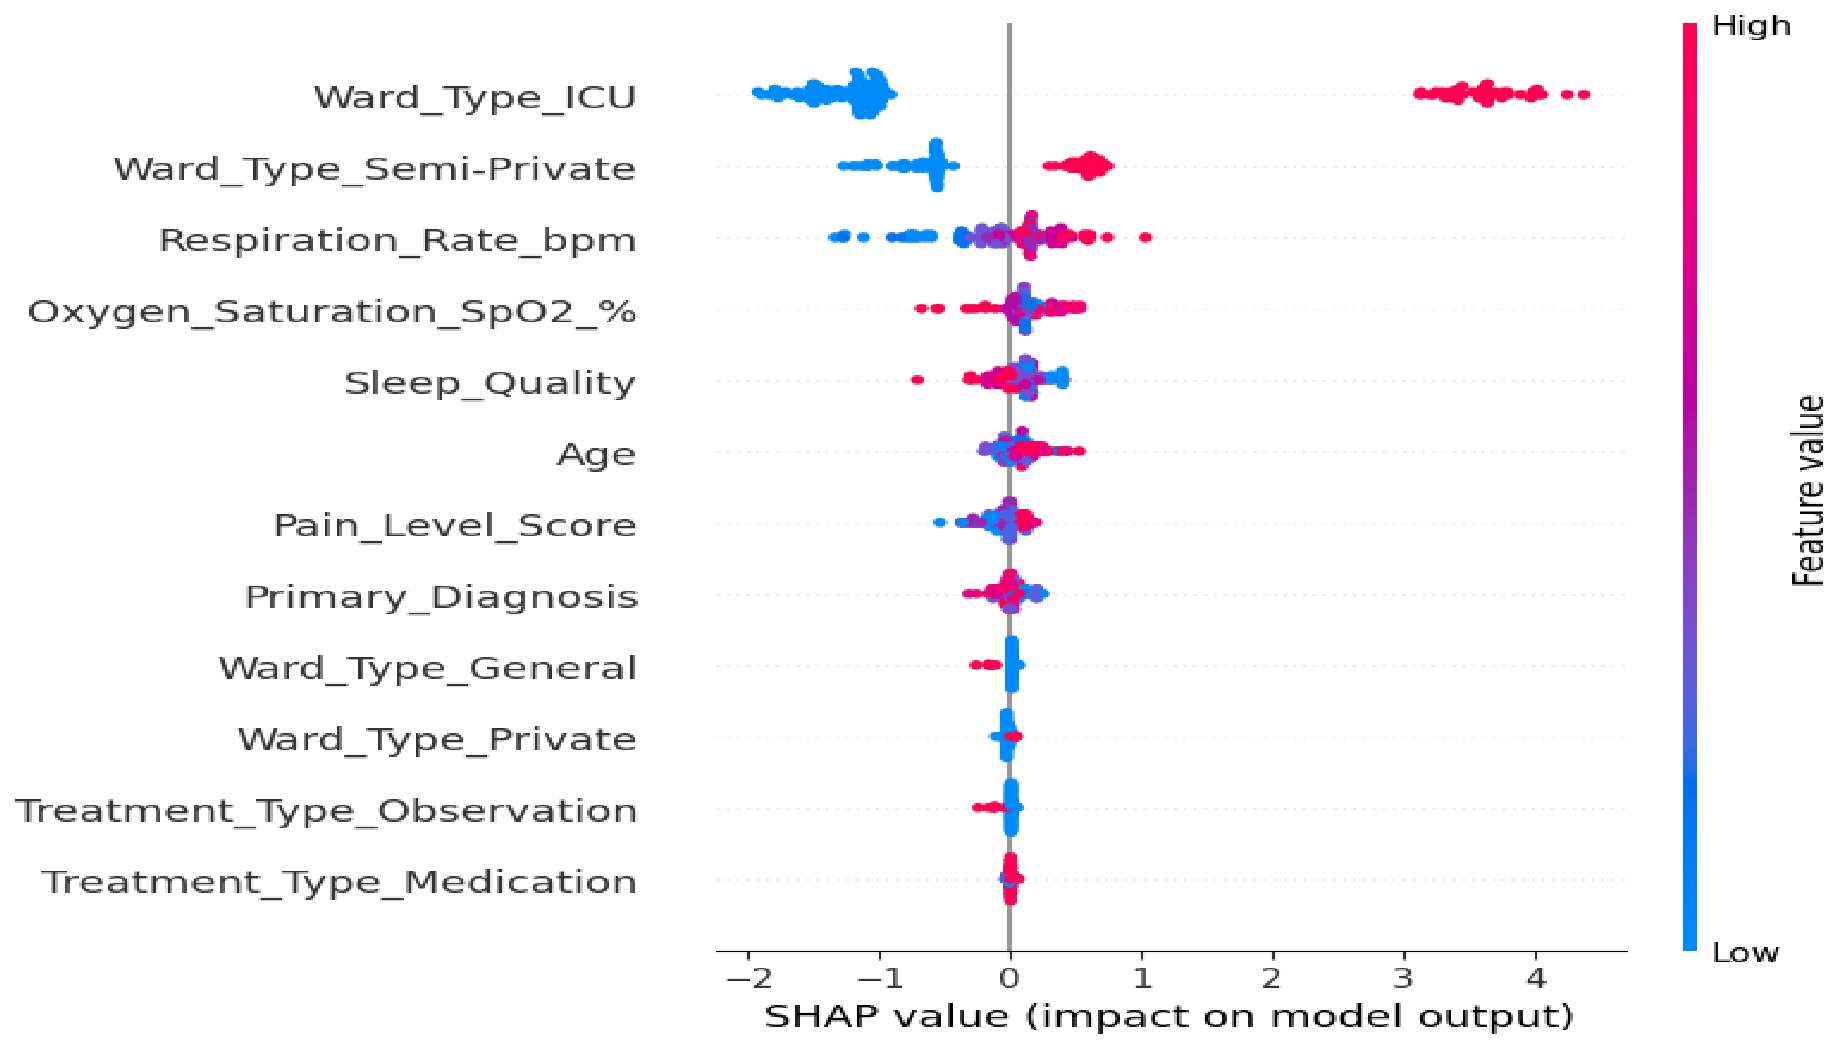
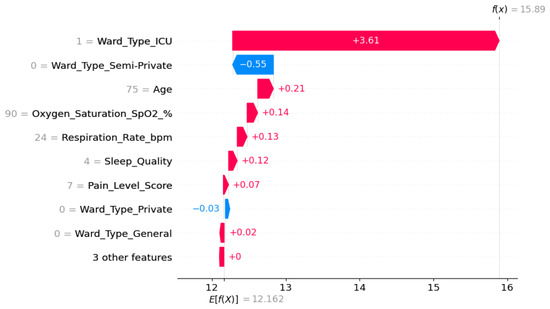
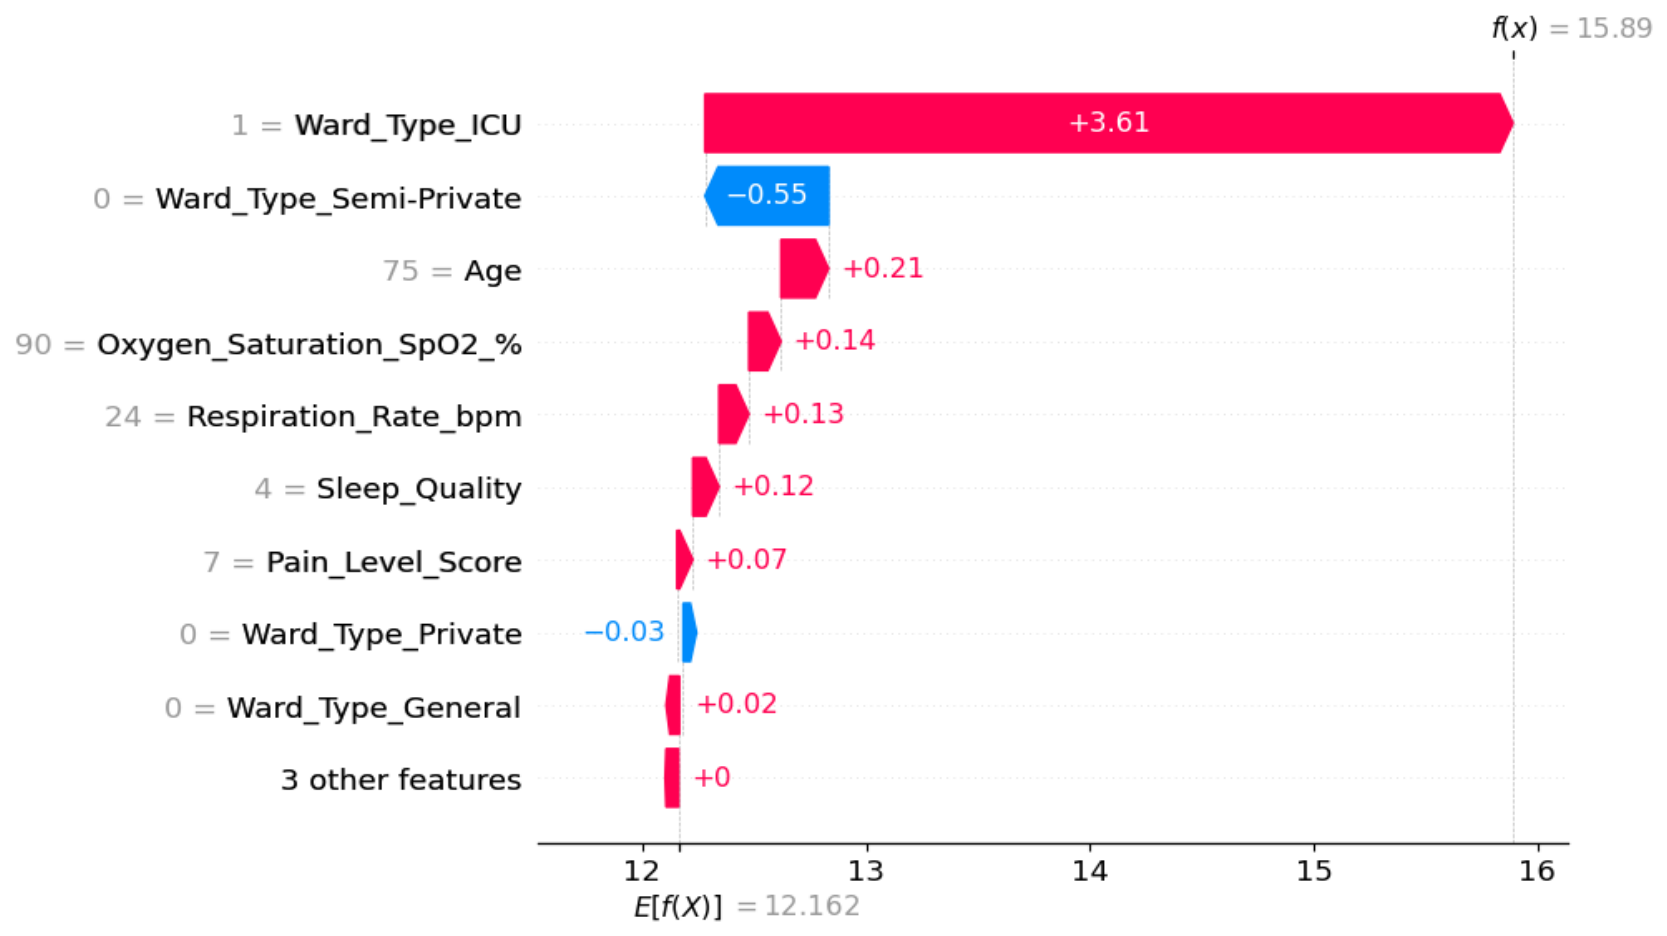
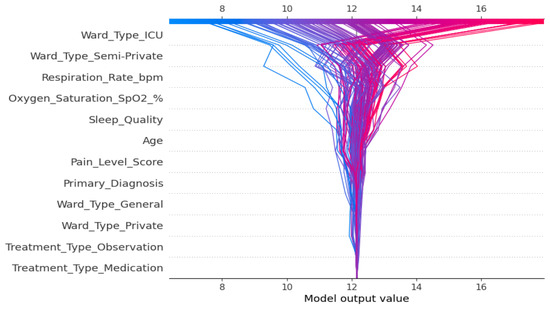
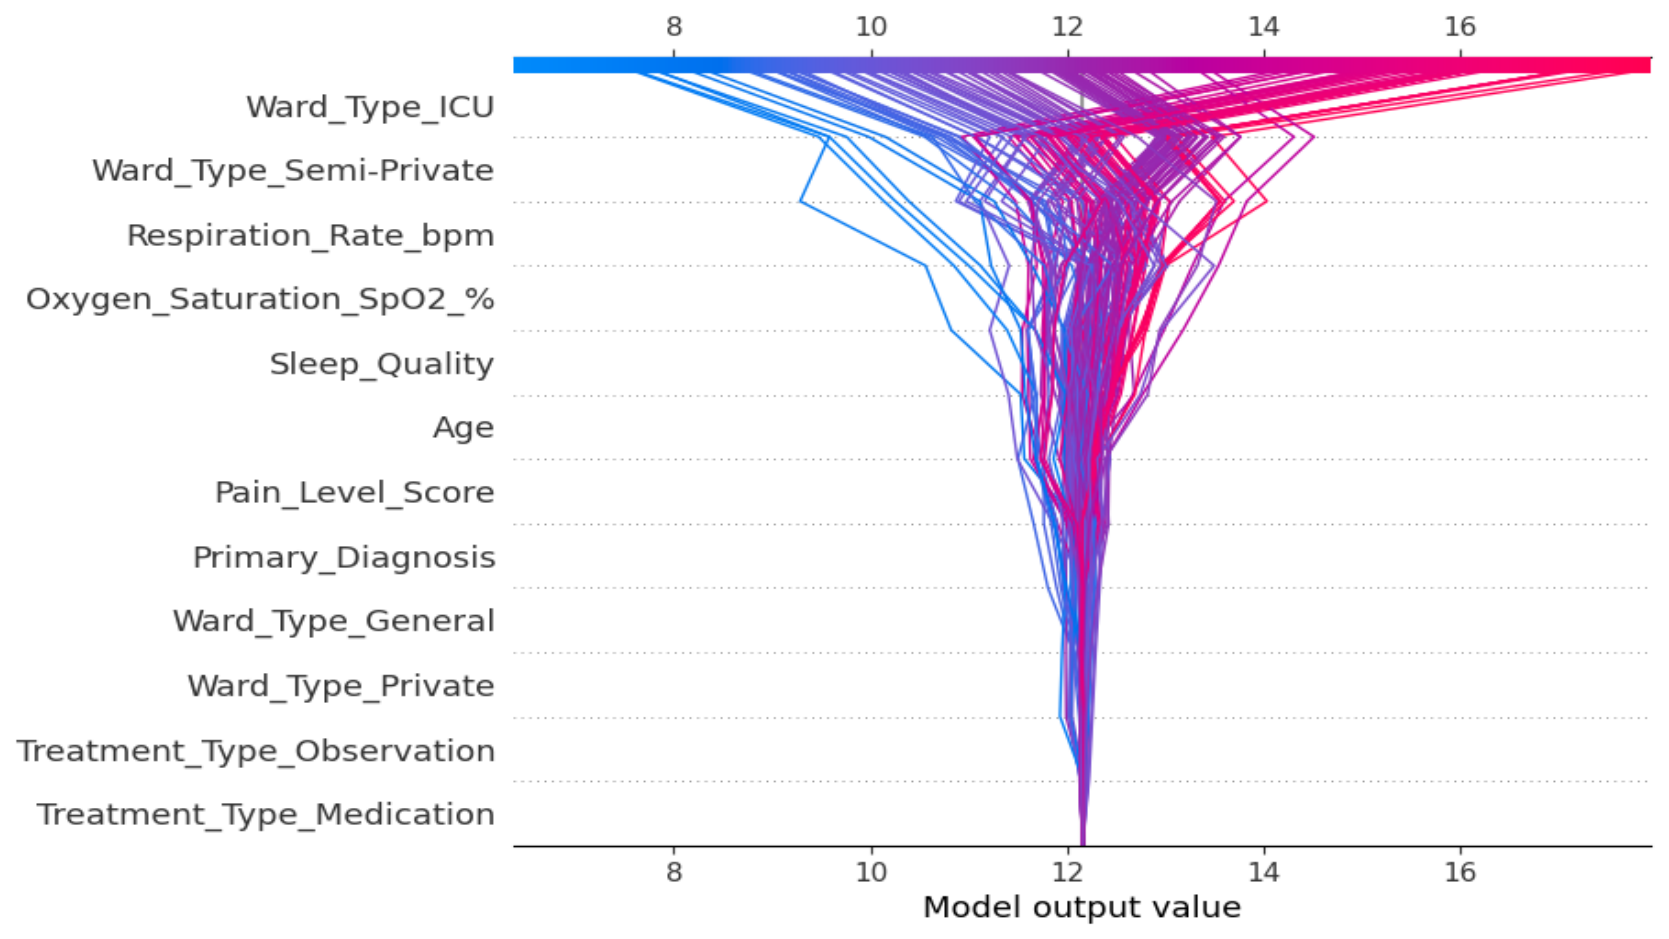



Disclaimer/Publisher’s Note: The statements, opinions and data contained in all publications are solely those of the individual author(s) and contributor(s) and not of MDPI and/or the editor(s). MDPI and/or the editor(s) disclaim responsibility for any injury to people or property resulting from any ideas, methods, instructions or products referred to in the content. |
© 2026 by the authors. Licensee MDPI, Basel, Switzerland. This article is an open access article distributed under the terms and conditions of the Creative Commons Attribution (CC BY) license.