


Abstract
Industrial Control Systems (ICSs), which are essential components of critical infrastructures, are inherently complex and vulnerable to cyberattacks. Advanced Persistent Threats (APTs) that target these systems are multi-stage, coordinated attacks that can lead not only to information loss but also to physical damage and loss of life. Traditional threat modeling approaches fall short in adapting to the dynamic nature of ICSs, necessitating new methodologies to predict and prevent such complex attacks. This work presents a digital twin-assisted dynamic threat modeling framework for ICS environments. The framework leverages a knowledge graph that integrates system data and cyber threat intelligence to predict potential attacks. In addition, the digital twin environment enables the validation of mitigation strategies before deployment in the physical system, while also supporting adaptive response and real-time mitigation. To predict the attacker’s next move, we propose a Relational Graph Convolutional Network (RGCN)-based model that utilizes enriched relational data such as tactics, campaigns, groups, techniques, and assets. The proposed RGCN model achieves a recall of 0.887, an F1-score of 0.893, and an AUC of 0.957 in predicting potential attack sequences. These results demonstrate that the model provides reliable and well-balanced predictive performance.
1. Introduction
Attacks on Industrial Control Systems (ICSs) are complex and have led to serious problems, potentially resulting not only in information loss but also in physical damage and even loss of life. Attackers targeting ICSs rarely limit themselves to a single incident or breach; rather, they frequently execute a series of coordinated attacks to gain access and gather sufficient information for a successful attack [1]. Those coordinated attacks, called Advanced Persistent Threats (APTs), represent a particularly significant risk to ICS environments, and detecting these attacks early is essential for mitigating potential damage. For this reason, understanding the system and potential attackers in depth is crucial, as it enables defenders to assess the attacker’s intent and capabilities more accurately, allowing for better prediction and system protection. Threat modeling is an effective method to achieve these objectives and to prepare for future attacks. However, traditional threat modeling approaches are primarily designed for Information Technology (IT) systems; therefore, they are mostly static and unsuitable for the requirements of ICS environments, often struggling to capture the dynamic, interconnected, and safety-critical nature of ICSs [2]. As a result, they are insufficient for addressing the evolving and complex cyber threats targeting ICSs, particularly APTs.
At this stage, the MITRE ATT&CK knowledge base is a promising resource that enables systematic and standardized modeling. It provides a systematic framework to analyze and understand attacker behavior, offering valuable insights for threat modeling and defense strategies [3]. Several approaches have been proposed to predict and analyze APTs, including Bayesian networks, Markov models, transformers, and collaborative filtering, often leveraging the MITRE ATT&CK framework [4,5,6,7,8,9,10,11]. While effective in next-step attack prediction, they remain constrained by their reliance on IT-centric assumptions, limited data sources, and insufficient modeling of relationships among techniques, assets, campaigns, and adversary behaviors. Moreover, existing deep learning–based models often require large labeled datasets and lack the adaptability needed to represent real-time ICS environments [10,11,12]. They cannot provide the continuous, context-aware, and system-specific situational awareness required for proactive and dynamic defense in ICS. These limitations highlight the need for a dynamic, system-oriented, and relationally enriched threat modeling approach that can continuously integrate operational context with cyber threat intelligence and support robust attack inference in ICS environments.
In this context, digital twin technology has emerged as a promising approach to enhance system-level visibility and support dynamic cybersecurity analysis. Digital twin technology has been widely utilized in cybersecurity applications, primarily for attack detection, security testing, deception, and forensics. In addition, digital twin-based cybersecurity approaches have been employed for security analytics and risk assessment, enabling the evaluation of system behavior and vulnerabilities through simulation and what-if analysis, with artificial intelligence also serving as a supporting tool in this domain [13]. However, studies focusing on threat modeling remain limited, despite its importance as a proactive security approach. A notable study by Jbair et al. [14] examines the integration of digital twin technology within threat modeling approaches. In this work, system assets are identified using design data derived from the digital twin, and potential cyberattacks are modeled by security experts using tactics, techniques, and procedures (TTPs) within the MITRE ATT&CK for ICS framework. However, existing digital twin-based approaches remain largely limited to static analysis and lack predictive capabilities for capturing evolving and multi-stage cyberattacks such as APTs. To address this limitation, this study proposes a Digital Twin-Assisted Threat Modeling (DT-TM) architecture that leverages digital twin technology not only for system representation, simulation, monitoring, and analysis but also for proactive threat modeling and the prediction of APT attack flows. The research questions of this study are outlined as follows.
- How can a DT-TM framework be developed to provide dynamic, system-specific threat modeling for ICSs?
- How can a data management approach be designed to ensure seamless integration of system and cyber threat intelligence within the DT-TM framework?
- How can a more effective attack inference method be developed for ICS environments under constrained or limited attack scenarios?
This framework provides a dynamic and comprehensive DT-TM approach for ICS environments by integrating system-level data with cyber threat intelligence (CTI) through knowledge graphs and employing relational graph-based learning methods. It leverages the real-time and bi-directional connectivity capabilities of digital twin technology to enable comprehensive system representation, dynamic analysis, and predictive identification of potential attack chains. The knowledge graph–based data management structure enables the integration of heterogeneous data sources into a unified representation, supporting more comprehensive system analysis and providing diverse inputs for threat prediction, while maintaining flexibility to adapt to evolving system conditions.
Previous studies utilizing MITRE ATT&CK have primarily focused on Enterprise environments and mostly used technical information to predict the attacker’s next step in APT attacks; some studies have also used group and software relationships. In contrast, this study concentrates on ICS, where the number of documented attack examples is considerably lower compared to Enterprise. To address this data scarcity, having additional sources of information beyond the dataset itself is more valuable. Specifically, all nodes in the graph and feature-level information were integrated to enrich the analytical process. Furthermore, the impact of incorporating graph and feature information was systematically evaluated. In our method, we propose using tactics, campaigns, groups, software, attack flow, and asset information at the same time to predict APT attack chains. For prediction, we use a Relational Graph Convolutional Network (RGCN) that is suitable for heterogeneous relational graphs [15].
The proposed threat modeling structure can be used in the steady-state phase to prepare for possible threats and during the active attack phase to predict the next step of the attacker. In addition, the created knowledge graph provides a convenient system monitoring window to detect ongoing attacks. Our approach captures complex relational dependencies and predicts both known and novel attack sequences, providing richer insights for proactive defense and informed decision-making.
Building on this, the framework further combines digital twin capabilities with heterogeneous relational learning, resulting in a more comprehensive and system-aware approach for improved threat modeling and attack prediction in ICS environments. The main contributions of this study can be summarized as follows:
- A unified data-management approach for DT-TM that semantically integrates system-level data with cyber-threat intelligence within a knowledge graph, enabling richer contextual representation.
- An RGCN-based attack-inference model that mitigates the scarcity of labeled attack data in ICS environments. By leveraging relational dependencies across heterogeneous node types derived from the MITRE ATT&CK for ICS framework (e.g., techniques, assets, campaigns, and groups), the model reduces reliance on large labeled datasets and supports relational reasoning beyond simple technique-to-technique transitions.
- Targeting ICS environments rather than generic enterprise IT and introducing a DT-TM framework that captures system-specific operational context, addressing the limitation of existing studies that focus mainly on enterprise IT and rely on isolated data sources or technique-level modeling.
This article is structured as follows. Section 2 provides an overview of key concepts, including digital twin data management, knowledge graphs, and APT prediction studies, establishing the foundational knowledge for our methodology. Section 3 details the proposed methodology, outlining the digital twin-assisted threat modeling stages, from system mapping to the prediction of APT attack chains using a knowledge graph. Section 4 describes the experimental setup, including the architecture of our RGCN model, the dataset construction, and the evaluation metrics. Finally, Section 5 presents and discusses the results of our experiments, comparing the model’s performance against baseline methods, and Section 6 concludes the paper by summarizing our key findings and suggesting directions for future research.
2. Background
2.1. Digital Twin Data Management and Knowledge Graphs
The efficacy of a digital twin is fundamentally dependent on its ability to accurately manage and interpret vast amounts of data from diverse sources. This data management process, which constitutes the first step in the ISO 23247 standard for digital twins, is crucial for creating a high-fidelity digital replica of a physical system [16]. It consists of three functional entities: the data collection, which gathers data from the physical system; the Data Pre-processing, which performs operations such as filtering and aggregation; and the collection identification, which identifies the required data from the physical system (see Figure 1).
Figure 1.
Digital twin data collection sub-entity [2], derived and adapted from ISO 23247.
This section outlines the types of data essential for ICSs’ digital twins and explains why knowledge graphs are a superior framework for managing the complexity of the data.
2.1.1. Data Collection
To create a comprehensive digital twin of an ICS environment, data must be collected from a wide array of sources, spanning both the physical and cyber domains. The gathered data predominantly comprises static modeling data, dynamic interaction data, and service knowledge data. Sensor data is an example of dynamic interaction data [17]. Data collected for an ICS digital twin comes from diverse sources, and its structures vary accordingly. This data can be broadly categorized by its structure and its temporal nature. Data categorized by structure:
- Structured Data: This includes highly organized data that adheres to a predefined model, such as measurements from machines or production records stored in relational databases (.csv, .db)
- Unstructured Data: This category comprises data without a predefined structure, such as maintenance team reports (.pdf, .docx), network information (.pcap), log files (.log)
- Semi-structured Data: This data does not conform to a formal data model but contains tags or markers to separate semantic elements. Examples include JSON-formatted data packets from IoT devices (.json), and configuration files (.xml)
Data categorized by time:
- Real-time Data: This is data collected and updated continuously, providing an instantaneous snapshot of the system’s state. It is essential for monitoring and immediate response.
- Historical Data: This represents a record of past events and processes, such as fault logs or production history. It is invaluable for trend analysis, predictive maintenance, and forensic investigations.
- Event-Based Data: Unlike time-series data collected at regular intervals, event-based data is generated in response to specific triggers or actions, such as user interactions, system alerts, or security alarms. This is particularly relevant for detecting anomalies and understanding attack sequences.
After the data collection process, in which data of different structures are gathered from various sources, the data must go through a pre-processing phase to ensure it is available for further analysis. Data analysis then focuses on transforming and examining the collected data to make it suitable for decision-making and domain-specific applications. In this way, the digital twin can accurately replicate, analyze, and predict the behavior of the physical system.
2.1.2. Data Pre-Processing
The primary challenge lies in integrating these heterogeneous, multi-format data sources into a unified, queryable, and intelligent system. Since the collected data are in different formats and noisy, meaningful information must be extracted and the data must be stored in a unified structure. The processing steps for each collected data item must be predefined and automated. Furthermore, ensuring synchronization between data sources is another significant challenge. As noted by Correia et al. (2023), combining data from disparate sources introduces significant interoperability and data integration challenges [18]. This is where knowledge graphs provide a powerful solution.
A knowledge graph is essentially a semantic network of real-world entities (nodes) and the relationships (edges) between them [19]. In practice, a knowledge graph provides a structured representation of knowledge by integrating information from various sources into a graph of nodes (e.g. people, places, events, or in cybersecurity: vulnerabilities, attacks, threat actors) connected by labeled relations (e.g., is part of, located in, exploits) [20]. This graph structure not only organizes data but also encodes domain semantics (often via an ontology or schema) that enable machines to interpret and reason about the relationships. In other words, knowledge graphs serve as knowledge bases that are both human-readable and machine-understandable, supporting advanced querying and inference.
In the context of an ICS digital twin, knowledge graphs offer several key advantages:
- Unified Data Model: Knowledge graphs play a key role in structuring knowledge by aggregating and linking diverse data in a unified format. A knowledge graph serves as a centralized and flexible data structure, creating a single, consistent view of the entire system.
- Semantic Enrichment: Raw data on its own is often insufficient for decision-making. Following the principles of the DIKW (Data, Information, Knowledge, Wisdom) hierarchy, data must be transformed into higher-level forms. A knowledge graph facilitates reaching a higher level of semantic enrichment sufficient for decision-making.
- Enhanced Querying and Analysis: The graph structure allows for complex queries that are difficult to perform with traditional databases. An analyst can easily traverse relationships to ask questions like, “Show me all assets that use this vulnerable software version and have communicated with a suspicious IP address in the last 24 h.”
- Scalability and Adaptability: ICS environments are dynamic. New devices are added, and network configurations change. A knowledge graph’s flexible schema can easily accommodate new data sources and relationships without requiring a complete redesign, making it highly adaptable to evolving systems.
- Reasoning: Knowledge graphs facilitate reasoning about the stored knowledge. Because the relationships are explicit, the algorithms can traverse the graph to find implicit connections or answer complex queries.
2.1.3. Collection Identification
In addition to general data categories, purpose-specific data is also required. The data used for the creation of a digital twin varies based on the purpose of the digital twin [21]. For instance, in the context of cybersecurity, the systematic collection of attack indicators is essential to effectively distinguish between different types of attacks. It is essential to understand what an indicator is and its types. Indicators of Compromise (IoCs) and Indicators of Attack (IoAs) are the most well-known types in cybersecurity. These concepts represent different detection approaches. IoCs are typically static indicators that reflect traces of past attacks; they include easily changeable elements such as IP addresses, hashes, and malicious domains, and are commonly used in signature-based detection mechanisms. IoCs are primarily utilized in post-incident forensic investigations. In contrast, IoAs represent the behavioral steps an attacker must take, providing dynamic analysis aimed at understanding the intent and progression of an attack [22]. IoAs focus on identifying the attacker’s objectives, regardless of the malware or exploit employed. An IoA represents a sequence of actions an attacker must perform to succeed. Therefore, IoAs play a critical role, especially in Endpoint Detection and Response (EDR) solutions and threat hunting processes. Based on this information, it can be stated that the lower levels of the Pyramid of Pain correspond to IoCs, while the upper TTP levels represent IoAs (see Figure 2). However, it is important to emphasize that IoCs and IoAs should be evaluated together for the detection and analysis of complex attacks such as APTs. While IoCs support signature-based detection mechanisms, IoAs play a critical role in enabling behavior-based detection.
Figure 2.
Pyramid of pain [23] and indicator types.
2.2. Cybersecurity Knowledge Graphs
In the cybersecurity domain, knowledge graphs help characterize security situations, support decision-making, and predict warnings [24]. They enable analysts to reason over connected data for situational awareness and threat prediction.
Knowledge graphs serve as a unifying language to represent security knowledge, ranging from attacker tactics to software vulnerabilities. They convert cybersecurity data into graph form, showing how threats and defenses interconnect. Key applications include:
- Representing Attack Patterns: Knowledge graphs can encode known attack behaviors, such as those cataloged in MITRE ATT&CK and CAPEC. Existing security knowledge bases have been transformed into knowledge graph triples [25], providing a structured ontology for pattern matching and inference. For instance, if an attacker uses certain techniques, the graph can suggest likely next tactics based on known patterns.
- Vulnerabilities and Weaknesses: Knowledge graphs can model software vulnerabilities (CVEs) and weaknesses (CWEs). Each vulnerability is linked to the affected software or hardware, its severity (CVSS score), related weaknesses, and known exploits. By integrating databases like NVD or CVE into a knowledge graph, analysts can query which systems are affected or trace chains of exploits. This structured knowledge supports tasks such as automatic impact assessment and predicting potential vulnerabilities [26].
- Threat Intelligence Fusion: Knowledge graphs can aggregate threat intelligence from multiple sources, including incident reports, malware analyses, and attacker profiles. For example, Piplai et al. (2020) built a Cybersecurity Knowledge Graph (CKG) by extracting entities and relationships from malware After-Action Reports (AARs) [27]. This fused graph captures a wide range of attack instances and enables complex queries, pattern searches, and reasoning that would be difficult or time-consuming using individual reports.
A notable capability of cybersecurity knowledge graphs is predicting adversarial attack sequences, forecasting the likely next steps an attacker might take. By leveraging the relationships and patterns encoded in the knowledge graph, analysts can perform proactive threat assessment and anticipate potential intrusions.
In summary, knowledge graphs structure cybersecurity knowledge and facilitate reasoning. By representing entities such as attacks, vulnerabilities, and defenses in a connected graph, they reveal complex relationships and support use cases ranging from simple queries to advanced threat predictions.
Building and leveraging such predictive knowledge graphs heavily relies on existing cybersecurity frameworks and databases. MITRE ATT&CK, CAPEC, and CVE provide structured, vetted information about attacks and vulnerabilities which can be encoded into knowledge graphs. For instance, MITRE ATT&CK classifies attack phases and methods under technique and tactic headings. Similarly, CAPEC offers a catalog of attack patterns that can link to concrete exploits or vulnerabilities in the knowledge graph. The CVE database provides details on thousands of vulnerabilities; integrating CVEs into the knowledge graph allows the prediction system to reason about what an attacker might exploit next on a targeted system.
In practice, a cybersecurity knowledge graph used for prediction will pull together:
- real-time inputs (CTI feeds, alerts, logs),
- a background knowledge base (graphs of ATT&CK tactics/techniques, CAPEC patterns, CVEs/CWEs, etc.), and
- possibly organizational context (like the network topology or security requirements as in Zhang et al. [10]).
Beyond structured repositories, knowledge graphs can also integrate dynamic CTI from intrusion detection alerts, logs, or incident reports. Observed malware samples or exploits can be linked to ATT&CK techniques, CVEs, and CAPEC patterns, effectively mapping real-time incidents into the broader adversarial knowledge base. This enriched context enables defenders to understand the current attack state and estimate the attacker’s next steps [11].
2.3. APT Attacks and Attack Step Prediction
As discussed in Section 2.2, knowledge graphs are widely used to represent cyber threat data and to predict multi-stage attacks. Building on this foundation, this section focuses on their application to APT modeling and prediction.
An APT refers to targeted long-term campaigns using multiple attack vectors against critical systems. These campaigns are conducted by highly skilled and well-resourced adversaries [28]. Unlike traditional attacks, APTs are characterized by their persistence, stealth, and multi-stage nature. Attackers continuously adapt their strategies to compromise high-value assets while maintaining long-term unauthorized access and avoiding detection.
To support the development of a dynamic DT-TM framework for ICS, it is essential to review existing APT analysis and prediction approaches. These studies provide a foundation for understanding adversarial behavior and forecasting potential attack paths.
Several studies have explored probabilistic models for predicting APT behavior. For example, the Bayesian ATT&CK Network (BAN) utilizes Bayesian networks to model attack techniques and infer potential countermeasures. In this approach, nodes represent MITRE ATT&CK techniques, and both manually and automatically labeled datasets are used for training [4]. This method enables next-step prediction and countermeasure recommendation.
Similarly, Markov Chain-based models have been used to predict the sequence of attacker actions. These models estimate both the number of steps required to achieve a goal and the next likely attack step based on the current state [7]. A limitation of the model is its dependence solely on the current state.
While these approaches provide structured probabilistic reasoning, they often rely on strong assumptions about state transitions and may struggle to capture complex, multi-relational dependencies in APT scenarios.
Analytical approaches focus on interpreting attack behavior and improving defense strategies. For instance, the APTer framework clusters threat alerts and removes irrelevant signals to identify APT stages. It then predicts subsequent stages and correlates vulnerabilities with attack techniques through CVE–ATT&CK mapping [6]. However, this approach does not fully cover the entire attack lifecycle.
The OPTIMA-DEM method analyzes co-occurrence relationships between techniques using causal modeling. By linking techniques that appear together in attack events, it improves interpretability and provides insights into attacker behavior [8].
In addition, collaborative filtering techniques have been applied to compare previously observed attack patterns with current observations. These methods estimate the likelihood of future techniques and help reduce analyst workload by filtering irrelevant alerts [9]. However, they may struggle to predict rarely used techniques.
Overall, these methods improve interpretability and alert management but often lack the capability to model complex and evolving multi-stage attack dependencies.
Machine learning and deep learning models have been widely used to predict complex attack sequences. For example, LiteATNet employs a lightweight Transformer architecture with causal attention mechanisms. It uses Word2Vec embeddings and positional encoding to model sequences of attack techniques derived from real-world reports [11].
Similarly, the DeepOP framework integrates deep learning with ontology-based reasoning. It extracts causally related attack sequences and parallel attack paths from threat intelligence reports to predict multi-step attacks with high accuracy [10]. Another approach, AFP, combines clustering, time-series analysis, and genetic algorithms to generate predictions based on historical attack data [5].
Despite their strong predictive performance, these models typically require large-scale labeled datasets and may struggle to generalize in ICS environments where data is limited.
Graph-based models have gained attention for their ability to represent relationships between entities. For example, IOTEKG constructs a knowledge graph using vulnerability and attack pattern data (CPE, CVE, CWE, CAPEC) to predict potential attacks through link prediction techniques [29].
Similarly, CL-AP2 employs a Temporal Attack Knowledge Graph derived from system logs and ATT&CK techniques. It models attacker behavior using tactical profiles and predicts subsequent attack steps [12].
More recently, Graph Neural Networks (GNNs) have been used to model complex relationships in attack data. These models learn correlations between techniques and uncover hidden dependencies by propagating information across graph structures [30].
Although graph-based approaches improve relational modeling, they often remain focused on cyber threat data and lack integration with real-time system context and operational dynamics.
Despite promising progress, several limitations remain in existing APT prediction approaches. First, most studies are designed for enterprise IT environments, while ICS environments have received limited attention. ICS systems involve unique characteristics, such as physical process dependencies and safety-critical constraints, which are not adequately captured by existing models.
Second, many approaches focus on technique-level transitions and fail to capture higher-order relationships among campaigns, threat actors, software, and assets. This limits their ability to model complex, real-world attack scenarios.
Third, existing models are largely cyber-centric and rely on historical threat intelligence without incorporating the dynamic operational state of the physical system.
These limitations highlight two critical gaps: (i) the lack of system-aware, ICS-specific threat modeling approaches, and (ii) the absence of integration between attack prediction and real-time system context.
To address these gaps, this study proposes a digital twin–assisted threat modeling framework. The proposed approach integrates heterogeneous knowledge graphs with real-time system data, enabling context-aware and adaptive prediction of APT attack flows. By combining relational learning with digital twin capabilities, the framework provides a more comprehensive and dynamic solution for threat modeling in ICS environments.
3. Methodology
This study presents a digital twin-assisted threat modeling framework for ICS. The proposed framework consists of four main phases: system mapping, discovering potential threats, mitigation, and validation, as proposed in our previous work [2].
This section provides a description of the threat modeling stages and the role of the digital twin in supporting the proposed system. An overview of the threat modeling process and the utilization of the digital twin is summarized in Figure 3. In brief, a knowledge graph is created by processing the data collected from the physical system and the CTI. Even though we focus on the discovering potential threats phase in the experiments in Section 4, this knowledge graph can be used in every stage of the threat modeling for various purposes like analyses, simulations, predictions, and replication. Next, potential threats to the system are predicted using sub-knowledge graphs that contain all the necessary nodes and edges. Based on the CTI information and system mapping data, appropriate mitigation mechanisms are determined for the identified threats. Finally, all mitigation processes are tested within the digital twin environment using simulations. The steps of the structure developed for this purpose are illustrated in Figure 4.
Figure 3.
Illustration of different usage of the digital twin (inner circle) mapped to the four basic stages of threat modeling (outer circle) derived from [2].
Figure 4.
Suggested digital twin-assisted threat modeling structure. The framework illustrates the interaction between the physical system and the digital twin, integrating system data and cyber threat intelligence, and supports the main phases of threat modeling. Colored nodes represent different types of entities in the knowledge graph.
The proposed system can be used not only as a proactive security measure before an attack, but also during an attack by immediately incorporating newly observed anomalies into the representation of the cyber–physical system, thanks to its ability to perform real-time monitoring. It can be updated in real-time with observed system measurements and threat intelligence , producing a knowledge graph (see Equation (1)):
Here, is the function that integrates the latest observations and CTI information to build or update the graph. When a technique is detected at time t, the observation is recorded as an incremental update to the knowledge graph and the twin’s state; this update is then used together with the twin’s predictive model (e.g., an RGCN link-prediction encoder) to recompute threat propagation scores and next-step attacker actions. The predictions generated by the RGCN model are defined in Equation (2):
These predictions are then applied to update the knowledge graph itself, as shown in Equation (3):
Finally, the updated knowledge graph is integrated into the digital twin to form the state at the next time step. Let denote the model of the system based on all data collected up to time t; the integration is expressed in Equation (4):
now contains the updated knowledge graph and other system information, continuously propagating observed data and predictive insights. These predictions enable real-time assessment of attacker behavior and support the evaluation of mitigation strategies. This allows the selection of appropriate actions that minimize expected damage while respecting operational constraints. This continuous update mechanism enables dynamic threat modeling by allowing the knowledge graph to evolve incrementally over time as new system data, cyber threat intelligence, and analytical outputs become available. Because the knowledge graph is continuously updated, it provides an up-to-date basis for analytical calculations and allows for periodic retraining of the model as new data becomes available.
After potential attack techniques are predicted, appropriate mitigation strategies are determined based on system-specific information and cyber threat intelligence. Digital twins support the evaluation of candidate mitigation actions through simulation, enabling informed decision-making and validation.
The proposed framework positions the digital twin as the central orchestrating component of the overall system, acting as a unified and continuously evolving hub for both operational and security-related information. Within the proposed framework, the knowledge graph used for data management is kept continuously up-to-date due to digital twin’s real-time connection capabilities. This increases situational awareness and supports perception, comprehension, and prediction capabilities. Thus, threat models for system protection can be developed proactively. This approach also enhances the system’s response speed. When suspicious activity is detected, the system status can be monitored in real time, even under attack conditions, enabling the development of attack-specific threat models.
In addition, the digital twin approach enables security testing through system simulations. This allows mitigation strategies to be tested and validated before being implemented on the physical system, significantly reducing operational risk.
In practical deployments, the framework can operate with real-time monitoring and intrusion detection systems, where alerts from security information and event management systems, intrusion detection systems, or similar platforms trigger the prediction process. Alternatively, the digital twin can perform a certain level of intrusion detection using indicator data. The detailed implementation of these mechanisms is beyond the scope of this study, and the model is positioned as a decision support tool for predicting possible next attack steps.
The predictions generated by the proposed framework are interpretable through the digital twin, which leverages a knowledge graph to represent system entities and their relationships. The MITRE ATT&CK for ICS framework defines a total of 82 techniques. However, not all techniques are equally applicable to every system component. For instance, in a PLC-centric context, approximately 48 techniques may be considered potentially relevant. In this study, instead of treating all possible techniques equally, the proposed approach narrows down the search space by identifying the most probable next-step techniques based on the current system state and observed events. This significantly reduces the cognitive burden on cybersecurity analysts. Subsequently, the analyst evaluates these predicted techniques in the context of system-specific asset information, network connections, and security policies. Based on this contextual assessment, the most relevant threats are prioritized, and appropriate mitigation strategies are applied to proactively prevent or disrupt potential attack progression.
3.1. System Mapping
As illustrated in Figure 5, the proposed framework consists of three main stages: data collection, data pre-processing, and knowledge graph construction.
Figure 5.
Overview of the methodological stages for system mapping.
At this stage, the initial step involves the collection of data. In this context, data is collected from both observable manufacturing elements and CTI, using the data collection sub-entity of the digital twin. The digital twin, which forms the basis of this structure, is fed by two primary data sources:
- 1.
- System-specific data, such as the assets of the protected physical system and the connection information between these assets ()
- 2.
- Historical attack information obtained from threat intelligence sources ()
Following data gathering and pre-processing, the objective is to transform the available data into meaningful knowledge. The data must be preprocessed to prepare it for replication, cybersecurity analysis, and prediction. Additionally, it should be stored in an efficient structure within the digital twin.
To achieve this, a knowledge graph-based data management structure has been proposed. The knowledge graph is embedded within the digital twin and serves as the core mechanism for data management and system mapping. This knowledge graph is used to ensure that incoming data is systematically organized and collected within a centralized system. The heterogeneous knowledge graph, created by combining these two different data feeds, provides comprehensive and in-depth system visibility for the "system mapping" phase of threat modeling. By integrating system-level data obtained from the digital twin with cyber threat intelligence, it constructs a unified and semantically enriched representation. The knowledge graph, synchronized with the digital twin, enables real-time system monitoring. At the same time, threat intelligence can be updated in determined time intervals. This system mapping approach provides a structure that is more adaptable to the dynamic requirements of cyber–physical systems compared to traditional static threat modeling approaches.
Figure 6 shows the proposed knowledge graph structure. In this knowledge graph, different standardized data models are used to support interoperability. The structures for Technique, Tactic, Software, Group, Campaign, Mitigation, Asset, and Data-component are derived from the STIX data model [31].
Figure 6.
Proposed knowledge-graph structure.
To further enhance the integration of cyber threat intelligence into the system mapping phase, IoCs and IoAs are explicitly included in the Indicator node within the information graph structure of the ICS digital twin, enabling easier tracking of critical cybersecurity-related information and supporting more accurate analysis. For indicator information, data model structures like MITRE CAR, which are also compatible with ICS, must be used [32].
Additionally, based on the ISO 23247-3: Digital Representation of Production Elements standard, it also includes nodes related to physical production such as Equipment, Personnel, Process, Environment, Facility, Product, and Material [33]. Beyond these, other vendor-specific data model structures, such as NGSI-LD, can be employed to monitor the system [34].
According to ISO 23247, equipment is defined as a physical element that directly or indirectly performs an operation in a manufacturing process. In this context, physical assets are modeled as equipment assets representing the actual machines performing operations in industrial systems. In contrast, within the MITRE ATT&CK for ICS framework, assets encompass multiple Purdue levels, ranging from field devices such as sensors and actuators to higher-level systems including PLCs, HMIs, and SCADA, and are not classified as equipment in the sense of ISO 23247. In this study, we extend the ISO-based representation by establishing a link between ISO 23247 equipment assets and MITRE ATT&CK assets. This approach enables the virtualization of both physical equipment and related cyber assets within a unified framework. This hierarchical mapping facilitates the integration of physical system components with cyber threat intelligence within the knowledge graph.
For nodes that are fully populated from MITRE ATT&CK and CTI sources such as Mitigation, Tactic, Software, Group, Campaign, Technique, and Attack Flow, real-time processing is not required; instead, these nodes can be updated at regular intervals. For nodes fed by the physical system, status information can be retrieved or real-time monitoring can be performed, depending on the chosen threat modeling strategy. For real-time approaches, adding time as an attribute can be employed to enable more efficient use of the knowledge graph.
This knowledge graph structure allows for a unified view of system-related information, potential attackers, and historical attacks. Nodes such as Mitigation, Tactic, Software, Group, Campaign, Attack Flow, and Technique enable TTP analysis, while Asset, Data Flow, Data Component, and Indicator nodes support indicator analysis. Additionally, by tracking physical changes in the system, the structure facilitates behavioral analysis.
A knowledge graph can be mathematically defined as in Equation (5):
where:
- is the set of nodes, e.g., techniques, tactics, software, and threat actors:
- is the set of relation types,:
- is the set of edges, representing relationships between nodes:
This structure prevents unnecessary data redundancy by enabling the storage of data transferred from various entities and databases within a single data model in the digital twin. Thanks to its comprehensive data structure, it offers the advantage of facilitating 360-degree system analysis. This structure also provides a more adaptable system design to changes in dynamic environments. By capturing structural dependencies and relational dynamics, it enables continuous monitoring of system-level changes and facilitates the real-time detection of anomalous or high-risk behavior; it also allows for the proactive prediction of potential APT attack chains and potential threats to our system.
3.2. Discovering Potential Threats
In practice, APT campaigns are highly dynamic and adaptive, making it challenging to represent them using a purely rule-based framework. However, although cyber attack phases are often depicted as a linear sequence, in complex scenarios such as APTs, multiple stages may occur simultaneously [35]. Learning-based relational modeling approaches can be useful for capturing these kinds of latent and nonlinear relationships. In this study, we use an RGCN algorithm for link prediction to find the relationships between techniques.
The scarcity of ICS attack data is a significant factor in model selection. Due to the limited and structured nature of existing datasets, graph-based models like RGCN are more suitable as they can effectively capture relational dependencies between entities without needing large-scale datasets. In contrast, deep learning models like transformer-based models generally require large-scale datasets and may not perform well in data-scarce conditions. Therefore, RGCN offers a more appropriate choice for the proposed framework.
Furthermore, the proposed model offers flexibility and scalability as it can naturally integrate new data sources and relationships. As the dataset expands, system configurations evolve, or additional data from the digital twin becomes available in future studies, the same modeling approach can be extended without requiring fundamental changes to the framework.
The general link prediction process is shown in Figure 7. The process begins with the extraction of a task-specific sub-graph that contains relevant nodes and relationships. This sub-graph is then encoded using RGCN. The learned embedded vectors are then fed into a similarity-based decoder where scoring functions such as cosine similarity and dot product are applied to estimate the probability of potential inter-technique links. Based on these similarity scores, the model predicts the most likely next technique in an attack sequence. Finally, the recursively extracted links can be combined to form potential attack chains.
Figure 7.
Overview of the methodological stages in this study contains discovering potential threats-link prediction sequence.
The proposed heterogeneous knowledge graph structure is flexible, requiring the use of different nodes and relationships for different analytical objectives. For discovering potential APTs, sub-knowledge graphs containing only the necessary nodes and relationships are employed. This process primarily leverages relationships and nodes derived from MITRE ATT&CK data, CTI information to construct attack flows, and system asset and data-component information. All the nodes and relationships used in the sub-knowledge graph with relationships are shown in Figure 8.
Figure 8.
Top: Sub-knowledge graph node relationships and vector representations. Bottom: RGCN model architecture.
- Software: This general term encompasses commercial, open-source, operating system tools, and specialized software used to perform specific behaviors [3].
- Campaign: These are groups of cyberattack activities conducted with common goals and objectives within a specific time-frame. These activities can sometimes be linked to a threat actor or software exploit [3].
- Group: These are cyber-attack groups defined as threat actors or clusters of activities that are tracked by a common name in the security community and can be associated with specific techniques, software, and campaigns [3].
- Tactic: ICS tactics refer to the purpose behind the application of an ATT&CK technique or sub-technique, the attacker’s reason for carrying out the action [3].
- Asset: Assets represent devices and systems within ICS, and each entity is associated with techniques an attacker can target.
- Data Components: Data components are attributes or values used to identify a specific ATT&CK technique or sub-technique within a data source.
- Data Flows: Data flows represent the transfer of data between two entities and the potential attacker actions that may occur during this transfer. These flows are useful for constructing data components, which serve as potential indicators similar to assets.
- Attack Flow: Attack flow information from past attacks of varying magnitudes is incorporated to enhance prediction. With this information, technical-to-technical relationships are established.
For a specific analysis, we extract a subgraph (see Equation (6)):
where are the nodes of interest and contains the edges connecting them within .
RGCNs are a graphical convolutional neural network method used in multi-relational graphs. These multi-relational graphs contain different nodes and edges, and can be used for classification and link prediction purposes. RGCNs provide a powerful framework for learning representations in complex, multi-relational graphs, making them highly effective for tasks that involve inferring and completing knowledge within structured data [36].
Every edge represents a different relationship between nodes, and RGCN helps to model these relationships by assigning different weight matrices for each relationship type. Each layer takes the node representations (i.e., ) from the previous layer and combines them with information from neighboring nodes to produce new, more refined representations () (see Figure 8). Formally, the update rule for the -th layer of an RGCN is defined in Equation (7):
where denote the set of all relation types in the graph. For a given node i, represent the set of its neighboring nodes connected through relation . Each relation type r is associated with a learnable weight matrix at layer l, while denotes the weight matrix corresponding to the self-loop that captures the node’s own features. The hidden representation of node i at layer l is denoted by . A normalization constant is applied to control the contribution of neighbors under relation r, which is often defined as or treated as a learnable parameter. Finally, denotes a nonlinear activation function, such as the ReLU function.
Figure 8 illustrates the technique node and its neighboring nodes, along with their vector representations and the associated computation process. Calculating whether a link exists between nodes is essentially done through a scoring function to evaluate the likelihood of potential connections. Similarity score functions are used to find relationships between techniques. With recursion functions, we calculated possible attack flows in our system (see Figure 9).
Figure 9.
Prediction of next step of the attacker (example).
To estimate potential threats, we compute the similarity between each node and its neighbors . Scoring functions such as cosine similarity and dot product can be used since all relationships in our prediction are of the same type (technique-to-technique), and other decoders that consider relationship types, such as DistMult, are not preferred in this scenario. The threat scores are defined as follows (see Equations (8) and (9)):
The dot product measures the similarity between two vectors based on both direction and magnitude. Cosine similarity considers only the angle between vectors and provides a magnitude-independent measurement. Both methods are non-parametric similarity measures based on fixed algebraic operations and do not involve learning from data. In contrast, the Multi-Layer Perceptron (MLP) is a feedforward neural network composed of fully connected layers and trained using backpropagation [37]. Rather than computing a fixed similarity score, the MLP learns a nonlinear mapping between input representations and target outputs.
where and are the weight matrices of the hidden and output layers, respectively. and are the corresponding bias terms. All parameters are learnable and optimized via backpropagation.
Here, , and represent the potential threat from node to node as computed by cosine similarity, dot product, and MLP respectively. For each node , the set of threat scores to its neighbors is
This formulation allows for quantifying potential threat propagation within the sub-graph by considering the pairwise similarity between node embeddings.
All these nodes, combined in a sub-graph, are used to predict the attackers’ next steps using an RGCN model. In this way, the model infers the most probable actions in an adversary’s attack chain. These predictions aim to enhance situational awareness by forecasting the potential evolution of emerging threats.
3.3. Mitigation
After potential attack techniques are predicted, appropriate mitigation strategies are determined by leveraging system-specific information obtained from the system mapping phases. A continuously updated knowledge graph in the digital twin environment provides a unified representation of system entities, their relationships, and the attack context, enabling context-aware mitigation selection.
Each predicted attack technique is associated with a set of candidate mitigation actions derived from sources such as MITRE ATT&CK for ICS and the MITRE D3FEND framework, extended for operational technology (D3FEND for OT) [3,38]. These mitigation actions may include technical measures such as network segmentation and configuration controls and system hardening through software updates and watchdog mechanisms, as well as input validation techniques to ensure safe and reliable system operation. However, the effectiveness of a mitigation strategy depends on factors such as the current system state, asset criticality, network structure, and operational constraints. By analyzing this type of system information and its alignment with operational objectives, appropriate mitigation actions can be identified and prioritized accordingly.
To address this, mitigation selection is formulated as an optimization problem. Candidate mitigations can be evaluated by performing tests in the digital environment. Let denote the set of all possible mitigation actions and a candidate set of actions. Each represents a specific mitigation, such as applying a patch, isolating a network segment, or updating firewall rules. The optimal mitigation set is then selected to minimize the expected impact on critical system assets, as formalized in Equation (11):
where quantifies the expected damage to system assets given the current state of the digital twin and the applied mitigation actions.
Although the mitigation process is defined and structured within the proposed framework, its full-scale implementation and comprehensive experimental evaluation are left to future studies. It is expected that these aspects will be further improved through the integration of real-time system data into a digital twin, enabling more accurate and context-aware risk mitigation decisions.
3.4. Validation
The simulation capabilities of the digital twin provide an appropriate environment for validating the effectiveness of mitigation strategies. Within this environment, candidate mitigation actions can be evaluated through simulation before being deployed in the physical system. By testing different mitigation scenarios in a controlled setting, the framework supports both automated and human-in-the-loop decision-making processes.
In this context, threat modeling can be evaluated through digital twin simulations, where performance is assessed using cyber resilience metrics [39]. The detailed methodology and full implementation of this validation stage are left for future work.
4. Experiment
This section details the experimental setup, methodology, and evaluation metrics employed to assess the efficacy of the proposed RGCN model in predicting APT attack sequences. The experiments focus on the “Discovering Potential Threats” phase of the digital twin-assisted threat modeling framework. The RGCN model was configured and trained with specific parameters to optimize its performance in predicting relationships between techniques. The training process involved 120 epochs with batch sizes of 64 and 32. Key configuration details are as follows:
- Loss Function: Binary Cross-Entropy Loss (for cosine similarity, Euclidean), BCEWithLogitsLoss (dot product, bilinear, MLP)
- Optimizer: Adam (learning rate = 0.01)
- Violation Filter: A Cyber Kill Chain violation filter was applied to model predictions to ensure compliance with established attack methodologies
The nodes to be used in the sub-knowledge graph for calculations were prepared using the ics-attack-17.1 datasets published by MITRE ATT&CK [40]. These datasets provide a comprehensive framework for understanding adversary tactics and techniques. Figure 10 illustrates the MITRE ATT&CK nodes and logical relationships that are used in MITRE ATT&CK and ics-attack-17.1 source. Based on this, the relationships used in the methodology and experiments are shown in the left panel of Figure 10. Tactical relationships are also not present in the ics-attack-17.1. In our graph, these relationships, derived from the MITRE ATT&CK framework, were incorporated to enrich the knowledge graph and provide a more complete representation of attack sequences. The resulting graph consists of 251 nodes and 1360 relationships.
Figure 10.
MITRE ATT&CK nodes and relationships.
Each node in our graph is characterized by two complementary feature sets: the count of relations and the node’s group type. We concatenate them into a unified node representation. Formally, each node is represented by an 8-dimensional feature vector , constructed as
where denotes a 4-dimensional relation-count vector and denotes a 4-dimensional one-hot encoded cluster membership vector. The resulting node feature matrix is therefore .
- The count of relations: These features capture the structural relationships and interdependencies between nodes in the graph. Relation-count features complement the relational information captured through graph message passing by providing a compact structural summary of how each node participates in different relation types.
- The node’s group type: Nodes belonging to the same threat group generally exhibit similar attack behaviors and have comparable capabilities. By performing clustering based on threat group relationships, additional features are generated that encode these similarities, allowing the model to leverage aggregate group behavior in addition to individual node features.We analyze the structural organization of technique embeddings under different relational configurations using hierarchical agglomerative clustering. Figure 11 illustrates the clustering results for campaign, software, and group-based configurations. In each dendrogram, the horizontal axis represents individual ICS techniques, while the vertical axis indicates the distance between clusters, where larger separations correspond to more distinct groupings. The objective of this analysis is to evaluate how relational context influences the geometry of the learned embedding space. The results show that clustering based on threat group relationships yields substantially stronger structural separation compared to campaign- and software-based configurations. Specifically, group-based clustering achieves a silhouette score of 0.876 for ICS, significantly outperforming campaign-based clustering (0.652) and software-based clustering (0.335). A high silhouette value indicates that the resulting clusters are both well-separated and internally coherent. These findings suggest that technical similarity in ICS environments is strongly influenced by threat group identity.
Figure 11.
Hierarchical clustering results under different relational configurations: (top) campaign, (middle) software, and (bottom) group.
Our sub-knowledge graph does not contain any inter-technique relationships. This study aims to estimate them using the relationships in the graph, features and attack flows from old campaigns. For this purpose, a dataset containing 152 ICS technical relationships compiled from different real-world campaigns was prepared for training the model and evaluating its performance. These examples were generated using the open-source FlowViz attack flow tool developed by Dave Johnson. FlowViz leverages large language models (LLMs) to automatically extract attack chains from campaign reports [41]. The generated outputs were partially validated through manual inspection of a subset of the relationships to assess their consistency and plausibility.
Moreover, negative examples were generated using sample relationships that do not comply with basic cyber kill chain rules. The quality of negative samples is important for model performance, as it enables the model to distinguish between valid and invalid attack transitions. Using meaningful negative samples reduces noise in the training data and helps the model learn clearer decision boundaries, leading to more reliable predictions. To avoid over-restricting the model, only explicitly invalid transitions were considered rather than all possible invalid cases. In this context, the following rules were applied when generating negative examples:
- Transitions that go back to earlier tactics after reaching stages such as impact, inhibit response function, or impair process control were considered invalid, since these stages represent the end of an attack.
- Since the initial access tactic is expected to appear at the beginning of an attack, any transitions where it appears after later stages were considered invalid.
In this experiment, to ensure that the model’s results are robust and not dependent on a particular split of the data, we used 5-fold cross-validation to evaluate our model’s performance. Mainly, the dataset was divided into 5 equal parts. In each iteration, 4 folds were used for training the model and one fold for testing. This process was repeated 5 times, each time with a different fold used as the test set. The experiment is summarized in the Algorithm 1.
| Algorithm 1 Predicting Attacker’s Next Technique using RGCN on Sub-Knowledge Graph |
|
5. Results and Discussion
This section presents the experimental results from the evaluation of the RGCN model against several baseline algorithms. At the same time, the model is compared with Long Short-Term Memory (LSTM) neural network model and another GNN method Relational Graph Attention Network (RGAT). Since the datasets and algorithms used in previous studies are not publicly available, and those studies were conducted on the MITRE Enterprise dataset, we performed the experiments using these baseline algorithms. The performance metrics Recall, F1-Score, and Area Under the Curve (AUC) are used to evaluate the performance of the model.
As a first step, the most suitable similarity score function to be used in the RGCN model was examined. For this purpose, several functions were tested, including dot product, cosine similarity, MLP, Euclidean distance, and bilinear scoring (see Figure 12, Table 1). After the experiments, the MLP product was found to be the most effective similarity function among the alternatives, followed by dot product and cosine similarity. Due to the superior performance of the MLP, it was selected for use in the subsequent experiments.
Figure 12.
Comparison of similarity score functions in RGCN.
Table 1.
Numerical results corresponding to Figure 12—Comparison of similarity score functions in RGCN.
To evaluate the contribution of different information sources, we conducted a component-wise analysis by training models with varying input configurations. Specifically, we assessed the predictive performance using graph structure only, features only, their combination, identity information only, and the full configuration (see Figure 13 and Table 2). The Identity configuration adds a node-specific identity vector to the RGCN embeddings before classification, allowing the model to retain node-level distinctiveness alongside relational information. The Identity configuration provides additional gains (F1-score = 0.855), indicating that node-specific information further enhances predictive performance. The full model achieves the highest overall performance (F1-score = 0.893), confirming that integrating all information sources yields the most expressive representation. In addition to that, graph information alone provides strong predictive power (F1-score = 0.750), while feature-based modeling yields slightly lower performance (F1-score = 0.700). Combining graph and feature representations significantly improves performance (F1-score = 0.796). The results indicate that both graph structure and node features contribute to predictive performance.
Figure 13.
Ablation study of graph and feature contribution.
Table 2.
Numerical results corresponding to Figure 13—Ablation study of graph and feature contribution.
To assess the contribution of each relation type in graph, we conducted a relation-wise ablation study by systematically removing one edge type at a time from the full RGCN model (see Figure 14 and Table 3). In this experiment, we used a graph-only configuration, where the model relies solely on the graph structure. The full configuration (RGCN0), which incorporates all relation types, served as the reference model. Each ablation variant removes a specific relation type from the graph: mitigation relations (RGCN1), tactic relations (RGCN3), campaign relations (RGCN4), group relations (RGCN5), software relations (RGCN6), data component relations (RGCN7), and inner relationships (RGCN8), where inner relationships refer to campaign–software, group–software, and campaign–group connections. The results show that removing inner relationships containing (RGCN8) led to the most significant performance decrease; this indicates that these relationships are structurally critical for representation learning. Similarly, excluding data component relations (RGCN7), group (RGCN5), software (RGCN6), campaign (RGCN4), tactic (RGCN3) reduces performance, suggesting their strong discriminative contribution. In contrast, removing mitigation relations (RGCN1) results in minimal change, implying a comparatively lower impact on predictive performance. Overall, the findings demonstrate that heterogeneous relation types contribute unequally to the model.
Figure 14.
Relational-level ablation study (Graph-only contribution).
Table 3.
Numerical results corresponding to Figure 14—Relational-level ablation study (Graph-only contribution).
The 5-fold cross-validation results confirmed the stability of RGCN across folds. The 95% Confidence Interval (CI) for these metrics was narrow, demonstrating low variability and strong performance. In the comparative experiments conducted using Markov models, Logistic Regression, Random Forest, and Bayesian approaches, RGCN achieved consistently high recall and F1-score. In contrast, Bayesian model showed moderate F1-score but low recall. The Markov, Logistic Regression and Random Forest models achieved low recall and F1-score (see Figure 15 and Table 4).
Figure 15.
Comparison of RGCN with classical models.
Table 4.
Numerical results corresponding to Figure 15—Comparison of RGCN with classical models.
The RGCN model, which outperforms classical models, was also compared with the LSTM and RGAT models, which are more advanced deep learning approaches. To demonstrate the contribution of graph-based structures, a comparison was made with LSTM, which relies solely on sequential dependencies. Similarly, to highlight the advantages of RGCN, a comparison was conducted with the graph-based RGAT model, which handles edges and their relationships differently. In the experiment, we used cosine similarity and the same features with RGCN. Although LSTM achieved high F1-score (0.830) the RGCN achieved the highest overall performance across all models with F1-score (0.893) (see Figure 16 and Table 5). RGAT demonstrated the weakest performance among the three models, implying that its attention mechanism was less effective in representing the structural dependencies compared to RGCN. The results indicate that incorporating relational information through the RGCN architecture does not merely introduce additional complexity; rather, it provides a performance enhancement.
Figure 16.
Comparison of RGCN model with deep learning models.
Table 5.
Numerical results corresponding to Figure 16—Comparison of RGCN with LSTM and RGAT models.
In the current implementation, the experimental evaluation primarily focuses on next-step prediction, which forms the basis for constructing multi-step attack chains through recursive application, using structured MITRE ATT&CK for ICS data within a graph-based framework.
Although the proposed framework is designed to support real-time integration with digital twin data, this aspect has not been explicitly evaluated in this study. In future work, we plan to extend the approach by incorporating system-level data obtained from the digital twin and by making attack chain generation dependent on the dynamic state of the system. This enhancement is expected to enable more context-aware and adaptive attack path inference.
The limited availability of documented ICS attack cases remains both the motivation for our experiment and a practical limitation of this study. Collecting a large-scale ICS-specific dataset would require the accumulation and public disclosure of real-world incidents over many years. To address this constraint, we focus on improving attack inference by incorporating additional relevant information sources beyond isolated attack examples. Our experimental results demonstrate that integrating contextual information related to attack techniques improves prediction performance.
Another limitation is that the digital twin component has not been empirically evaluated and is currently addressed only at a conceptual level. Additionally, the mitigation and validation phases are not fully implemented and are left for future work. In this context, technical and operational data obtained through the digital twin framework are expected to further enhance contextual modeling and predictive performance. Incorporating these data sources will be the focus of our future work.
In future work, technical and operational data obtained through digital twin frameworks could provide additional contextual signals for modeling complex attack scenarios. Incorporating such data sources may further enhance contextual modeling and predictive performance.
In addition to these directions, platforms such as OpenCTI could be integrated alongside structured data repositories like MITRE ATT&CK to provide continuously updated, real-world CTI data. Such integration is expected to further enhance the practical applicability of the proposed framework.
6. Conclusions
This study proposes a contextual and dynamic approach to more effectively modeling and predicting APT attacks in ICS environments.
Two key contributions are presented. First, a dynamic threat modeling framework based on digital twin and knowledge graph is proposed. This structure integrates system data with cyber threat intelligence, increasing contextual awareness and providing proactive attack chain prediction capabilities. Second, the contribution of modeling different node types together within MITRE ATT&CK to attack inference performance is empirically demonstrated. The results show that using multidimensional relational information improves prediction success. The proposed approach exhibited higher and more stable performance compared to basic models and clearly demonstrated the contribution of different node types within the graph. These findings indicate that additional contextual data that can be integrated via digital twin also has the potential to similarly improve performance.
However, this study has several limitations. The empirical evaluation primarily focuses on next-step prediction, and digital twin integration is addressed conceptually without empirical validation. Furthermore, the mitigation and validation phases of the framework have not yet been fully implemented, and the limited availability of publicly documented ICS attack cases restricts the evaluation.
Future work will focus on integrating real-time data from digital twin environments, establishing a stateful attack chain, and completing the mitigation and validation components of the framework. Additionally, the inclusion of continuously updated cyber threat intelligence sources such as OpenCTI is expected to enhance the practical applicability and robustness of the proposed approach.
Author Contributions
Conceptualization, G.E., V.G., A.A.; methodology, G.E.; software, G.E.; investigation, G.E. and D.A.; writing—original draft preparation, G.E., D.A.; writing—review and editing, G.E., D.A., V.G., A.A. and S.P.; supervision, V.G., A.A. and S.P. All authors have read and agreed to the published version of the manuscript.
Funding
This work has received funding from the Research Council of Norway through the SFI Norwegian Centre for Cybersecurity in Critical Sectors (NORCICS) project No. 310105 and the PERSEUS project, European Union’s Horizon 2020 research and innovation programme under the Marie Skłodowska-Curie grant agreement No. 101034240.
Data Availability Statement
Data available on request from the corresponding author.
Conflicts of Interest
The authors declare no conflicts of interest.
References
- Assante, M.J.; Lee, R.M. The industrial control system cyber kill chain. SANS Inst. InfoSec Read. Room 2015, 1, 2. [Google Scholar]
- Erceylan, G.; Akbarzadeh, A.; Gkioulos, V. Leveraging digital twins for advanced threat modeling in cyber-physical systems cybersecurity. Int. J. Inf. Secur. 2025, 24, 151. [Google Scholar] [CrossRef] [Scilit]
- MITRE. MITRE ATT&CK, 2025. Available online: https://attack.mitre.org/matrices/ics (accessed on 15 August 2025).
- Kim, Y.; Lee, I.; Kwon, H.; Lee, K.; Yoo, J. Ban: Predicting apt attack based on bayesian network with mitre att&ck framework. IEEE Access 2023, 11, 91949–91968. [Google Scholar] [CrossRef] [Scilit]
- Kaiser, F.K.; Budig, T.; Goebel, E.; Fischer, T.; Muff, J.; Wiens, M.; Schultmann, F. Attack forecast and prediction. C&ESAR 2021, 21, 77–97. [Google Scholar] [CrossRef]
- Sachidananda, V.; Patil, R.; Sachdeva, A.; Lam, K.Y.; Yang, L. APTer: Towards the investigation of APT attribution. In Proceedings of the 2023 IEEE Conference on Dependable and Secure Computing (DSC); IEEE: Piscataway, NJ, USA, 2023. [Google Scholar] [CrossRef] [Scilit]
- Lakhdhar, Y.; Rekhis, S.; Fourati, L.C. MITRE-Based APT Attack Generation and Prediction. In Proceedings of the European Symposium on Research in Computer Security; Springer Nature: Cham, Switzerland, 2024. [Google Scholar] [CrossRef] [Scilit]
- Jiang, Y.; Ren, Y.; Wang, Z.; Tang, Y.; Lu, S.; Hu, N. OPTIMA-DEM: An Optimized Threat Behavior Prediction Method using DEMATEL-ISM. In Proceedings of the 2023 IEEE 12th International Conference on Cloud Networking (CloudNet); IEEE: Piscataway, NJ, USA, 2023. [Google Scholar] [CrossRef] [Scilit]
- Kuwano, M.; Okuma, M.; Okada, S.; Mitsunaga, T. The attacker might also do next: ATT&CK behavior forecasting by attacker-based collaborative filtering and graph databases. J. Inf. Process. 2023, 31, 802–811. [Google Scholar] [CrossRef] [Scilit]
- Zhang, S.; Xue, X.; Su, X. DeepOP: A Hybrid Framework for MITRE ATT&CK Sequence Prediction via Deep Learning and Ontology. Electronics 2025, 14, 257. [Google Scholar] [CrossRef] [Scilit]
- Zhang, S.; Xue, X. LiteATNet: Predicting APT Attack Using Transformer Model With MITRE ATT&CK Framework. In Proceedings of the 2024 IEEE Smart World Congress (SWC); IEEE: Piscataway, NJ, USA, 2024. [Google Scholar] [CrossRef] [Scilit]
- Liu, Y.; Guo, Y. CL-AP2: A composite learning approach to attack prediction via attack portraying. J. Netw. Comput. Appl. 2024, 230, 103963. [Google Scholar] [CrossRef] [Scilit]
- Homaei, M.; Mogollón-Gutiérrez, Ó.; Sancho, J.C.; Ávila, M.; Caro, A. A review of digital twins and their application in cybersecurity based on artificial intelligence. Artif. Intell. Rev. 2024, 57, 201. [Google Scholar] [CrossRef] [Scilit]
- Jbair, M.; Ahmad, B.; Maple, C.; Harrison, R. Threat modelling for industrial cyber physical systems in the era of smart manufacturing. Comput. Ind. 2022, 137, 103611. [Google Scholar] [CrossRef] [Scilit]
- Gümüş, H.T.; Eyüpoğlu, C. Grafik sinir ağlarına genel bir bakış. EMO Bilimsel Dergi 2023, 13, 39–56. [Google Scholar]
- Automation Systems and Integration Digital Twin Framework for Manufacturing—Part 2: Reference Architecture. ISO: Geneva, Switzerland, 2021. Available online: https://www.iso.org/standard/78743.html (accessed on 15 August 2025).
- Wu, H.; Ji, P.; Ma, H.; Xing, L. A comprehensive review of digital twin from the perspective of total process: Data, models, networks and applications. Sensors 2023, 23, 8306. [Google Scholar] [CrossRef] [Scilit]
- Correia, J.B.; Abel, M.; Becker, K. Data management in digital twins: A systematic literature review. Knowl. Inf. Syst. 2023, 65, 3165–3196. [Google Scholar] [CrossRef] [Scilit]
- Peng, C.; Xia, F.; Naseriparsa, M.; Osborne, F. Knowledge Graphs: Opportunities and Challenges. Artif. Intell. Rev. 2023, 56, 13071–13102. [Google Scholar] [CrossRef] [Scilit]
- Jozashoori, S.; Vidal, M.E. MapSDI: A scaled-up semantic data integration framework for knowledge graph creation. In Proceedings of the OTM Confederated International Conferences ‘On the Move to Meaningful Internet Systems’; Springer: Berlin/Heidelberg, Germany, 2019; pp. 58–75. [Google Scholar] [CrossRef] [Scilit]
- Segovia, M.; Garcia-Alfaro, J. Design, modeling and implementation of digital twins. Sensors 2022, 22, 5396. [Google Scholar] [CrossRef] [Scilit] [PubMed]
- Fortinet. Indicators of Compromise (IOCs), 2025. Available online: https://www.fortinet.com/resources/cyberglossary/indicators-of-compromise (accessed on 15 August 2025).
- Bianco, D. The Pyramid of Pain. SANS Institute. 2025. Available online: https://www.sans.org/tools/the-pyramid-of-pain/ (accessed on 15 August 2025).
- Sikos, L.F. Cybersecurity Knowledge Graphs. Knowl. Inf. Syst. 2023, 65, 3511–3531. [Google Scholar] [CrossRef] [Scilit]
- Pingle, A.; Piplai, A.; Mittal, S.; Joshi, A.; Holt, J.; Zak, R. Relext: Relation extraction using deep learning approaches for cybersecurity knowledge graph improvement. In Proceedings of the 2019 IEEE/ACM International Conference on Advances in Social Networks Analysis and Mining (ASONAM); IEEE: Piscataway, NJ, USA, 2019; pp. 879–886. [Google Scholar] [CrossRef] [Scilit]
- Shi, Z.; Matyunin, N.; Graffi, K.; Starobinski, D. Uncovering Product Vulnerabilities with Threat Knowledge Graphs. In Proceedings of the 2022 IEEE Secure Development Conference (SecDev); IEEE: Piscataway, NJ, USA, 2022; pp. 84–90. [Google Scholar] [CrossRef] [Scilit]
- Piplai, A.; Ranade, P.; Kotal, A.; Mittal, S.; Narayanan, S.N.; Joshi, A. Using knowledge graphs and reinforcement learning for malware analysis. In Proceedings of the 2020 IEEE International Conference on Big Data (Big Data); IEEE: Piscataway, NJ, USA, 2020. [Google Scholar] [CrossRef] [Scilit]
- Tatam, M.; Shanmugam, B.; Azam, S.; Kannoorpatti, K. A review of threat modelling approaches for APT-style attacks. Heliyon 2021, 7, hle05969. [Google Scholar] [CrossRef] [Scilit] [PubMed]
- Zhang, S.; Zhao, C.; Wang, S.; Li, S.; Chen, P.; Han, Y. Attack prediction in Internet of Things using knowledge graph. In Proceedings of the 3rd International Conference on Internet of Things and Smart City (IoTSC 2023); SPIE: Bellingham, WA, USA, 2023; p. 12708. [Google Scholar] [CrossRef] [Scilit]
- Zhang, Y.; Chen, J.; Cheng, Z.; Shen, X.; Qin, J.; Han, Y.; Lu, Y. Edge propagation for link prediction in requirement-cyber threat intelligence knowledge graph. Inf. Sci. 2024, 653, 119770. [Google Scholar] [CrossRef] [Scilit]
- Open, O.A.S.I.S. Introduction to STIX, 2024. Available online: https://oasis-open.github.io/cti-documentation/stix/intro.html (accessed on 15 August 2025).
- MITRE. Analytic Coverage Comparison, 2024. Available online: https://car.mitre.org/coverage/ (accessed on 15 August 2025).
- Automation Systems and Integration: Digital Twin Framework for Manufacturing—Part 3: Digital Representation. ISO: Geneva, Switzerland, 2021. Available online: https://www.iso.org/standard/78744.html (accessed on 15 August 2025).
- NGSI-LD. Official Website for NGSI-LD, 2025. Available online: https://ngsi-ld.org/ (accessed on 15 October 2025).
- Akbarzadeh, A.; Erdodi, L.; Houmb, S.H.; Soltvedt, T.G. Two-stage advanced persistent threat (APT) attack on an IEC 61850 power grid substation. Int. J. Inf. Secur. 2024, 23, 2739–2758. [Google Scholar] [CrossRef] [Scilit]
- Schlichtkrull, M.; Kipf, T.N.; Bloem, P.; van den Berg, R.; Titov, I.; Welling, M. Modeling relational data with graph convolutional networks. In Proceedings of the European Semantic Web Conference; Springer International Publishing: Berlin/Heidelberg, Germany, 2018. [Google Scholar] [CrossRef] [Scilit]
- Taud, H.; Mas, J.F. Multilayer perceptron (MLP). In Geomatic Approaches for Modeling Land Change Scenarios; Springer: Berlin/Heidelberg, Germany, 2017; pp. 451–455. [Google Scholar] [CrossRef] [Scilit]
- MITRE Corporation. MITRE D3FEND for Operational Technology (OT). 2025. Available online: https://d3fend.mitre.org/domain/ot/ (accessed on 30 January 2026).
- Erceylan, G.; Akbarzadeh, A.; Gkioulos, V. Balancing Automation and Human Involvement in Threat Modeling for Optimal Cyber Resilience. In Proceedings of the International Conference on Human-Computer Interaction; Springer Nature: Berlin/Heidelberg, Germany, 2025. [Google Scholar] [CrossRef] [Scilit]
- MITRE. MITRE ATT&CK for Industrial Control Systems (ICS) STIX Data, 2024. Available online: https://github.com/mitre-attack/attack-stix-data (accessed on 1 October 2025).
- Johnson, D. FlowViZ—Visualize Attack Flows. Available online: https://www.flowviz.io/ (accessed on 1 October 2025).
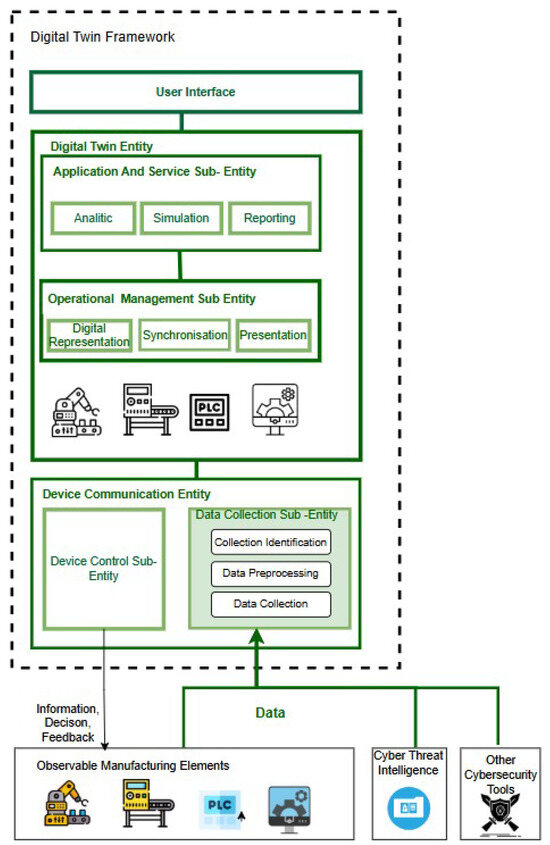
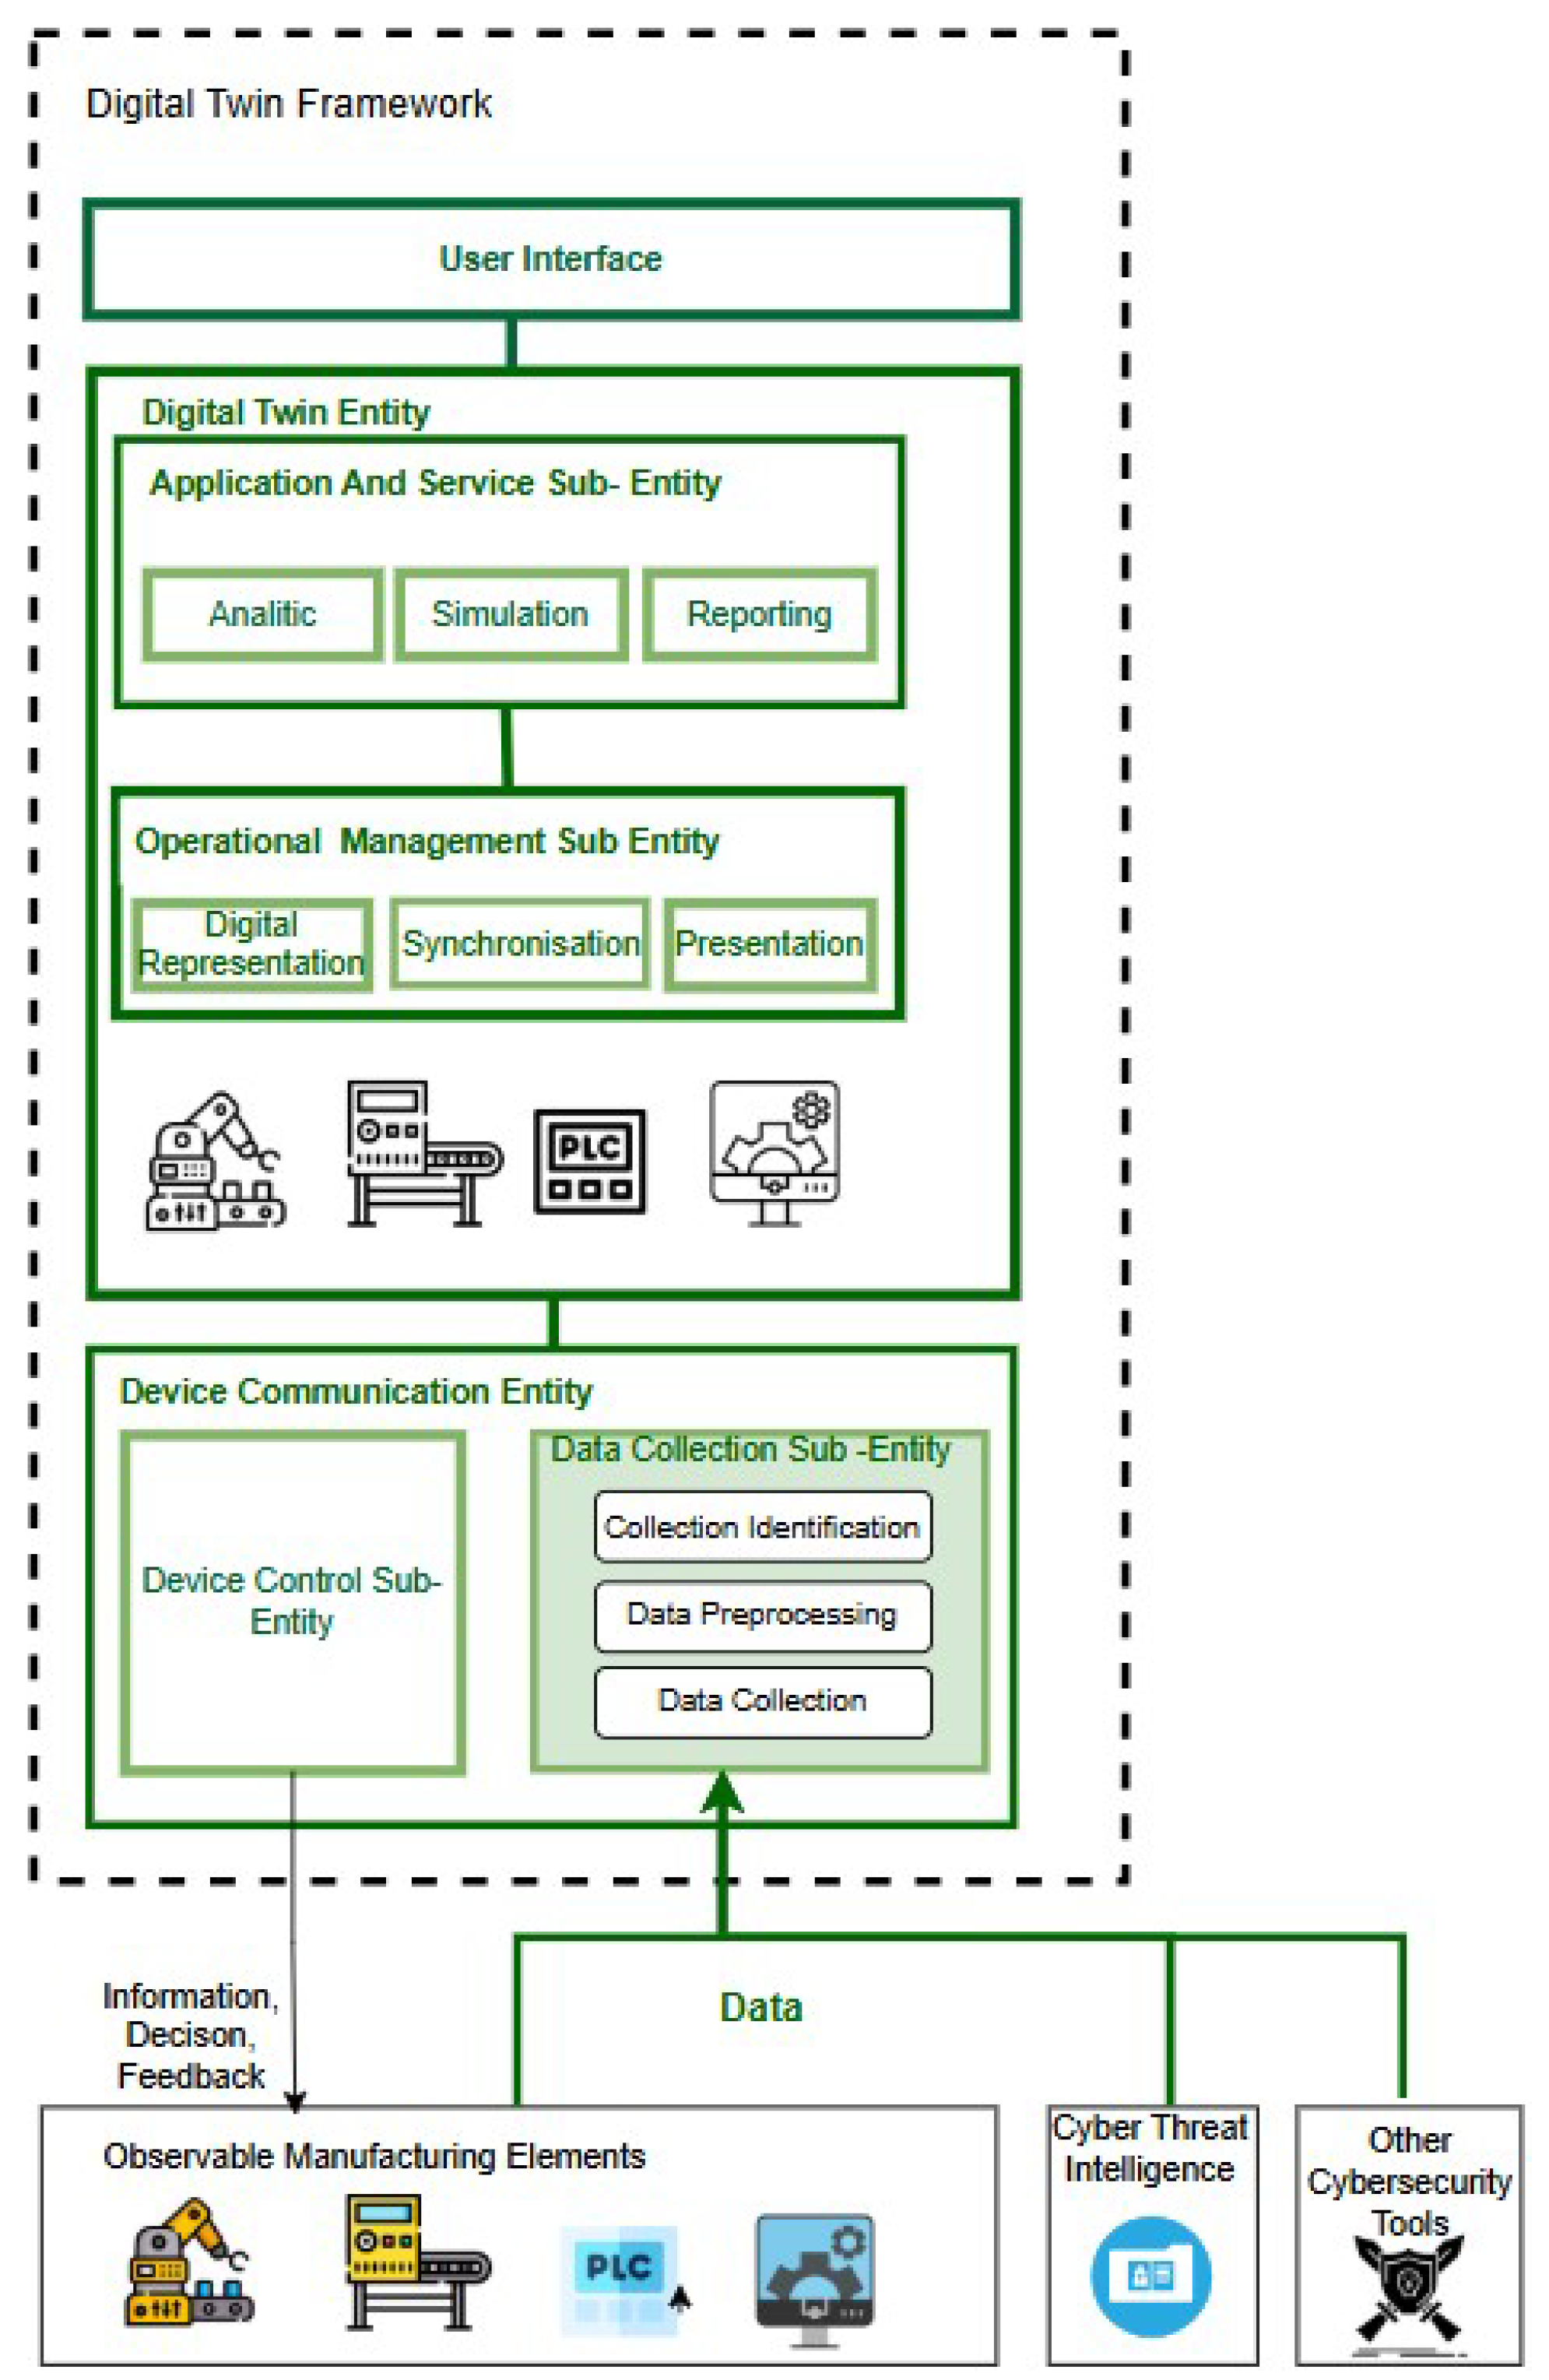
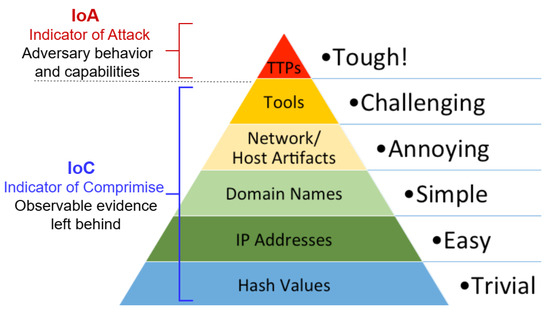
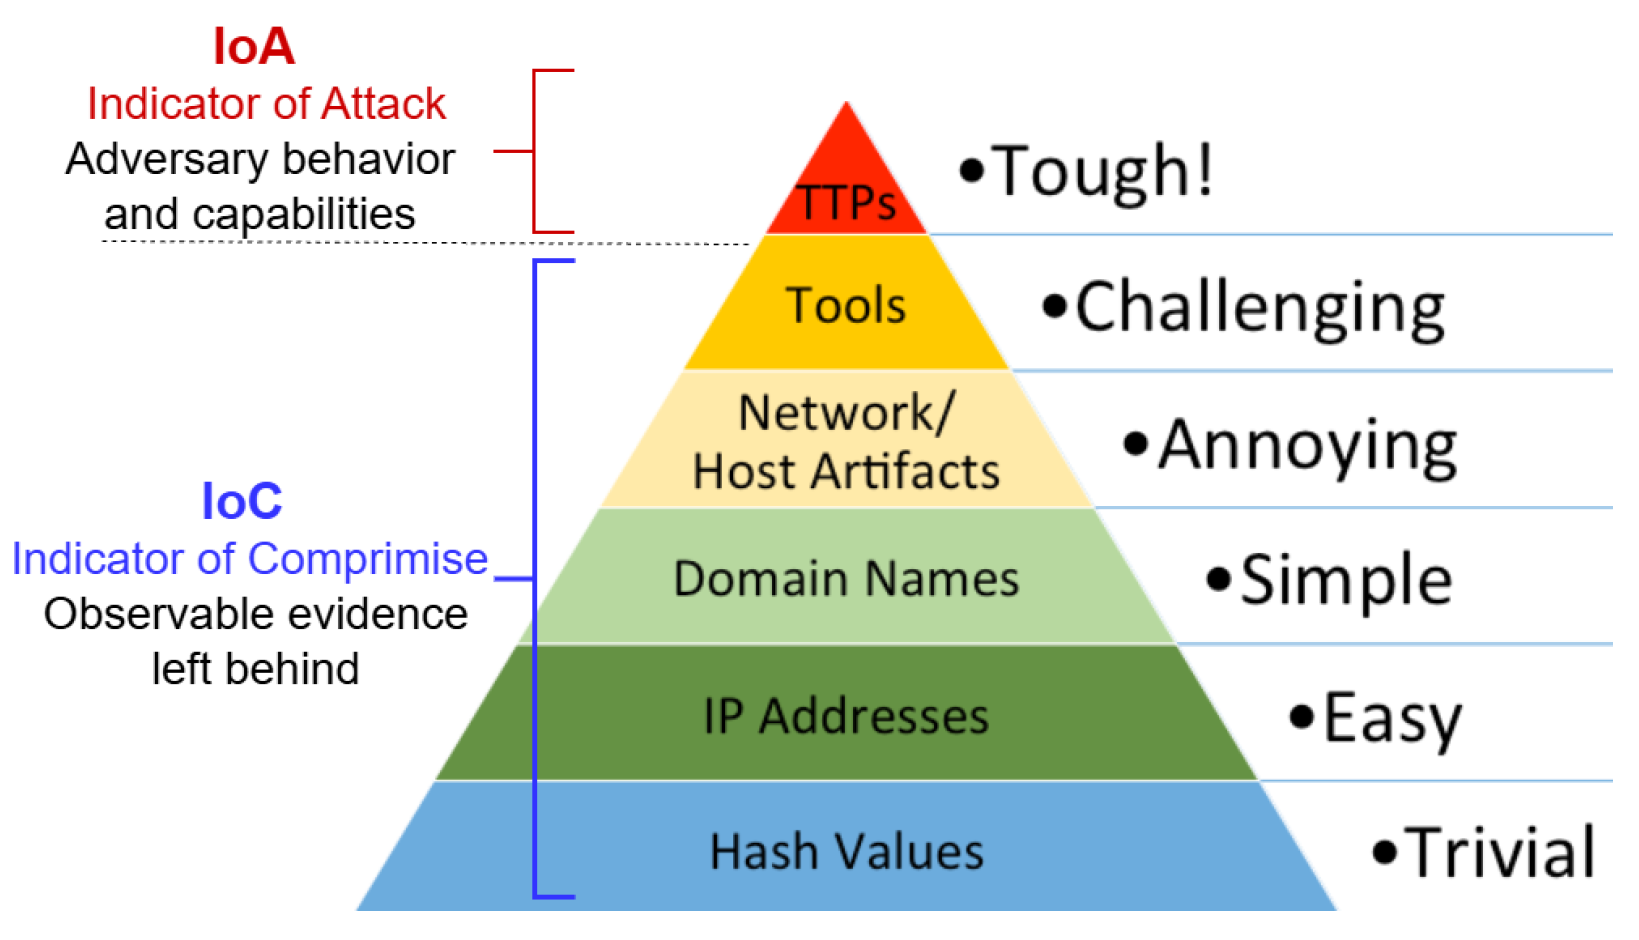
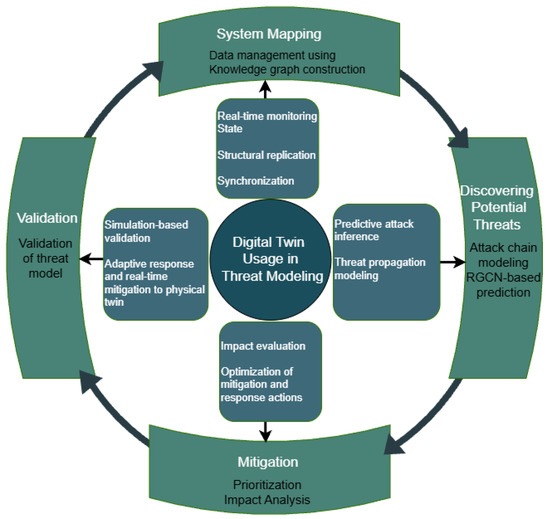
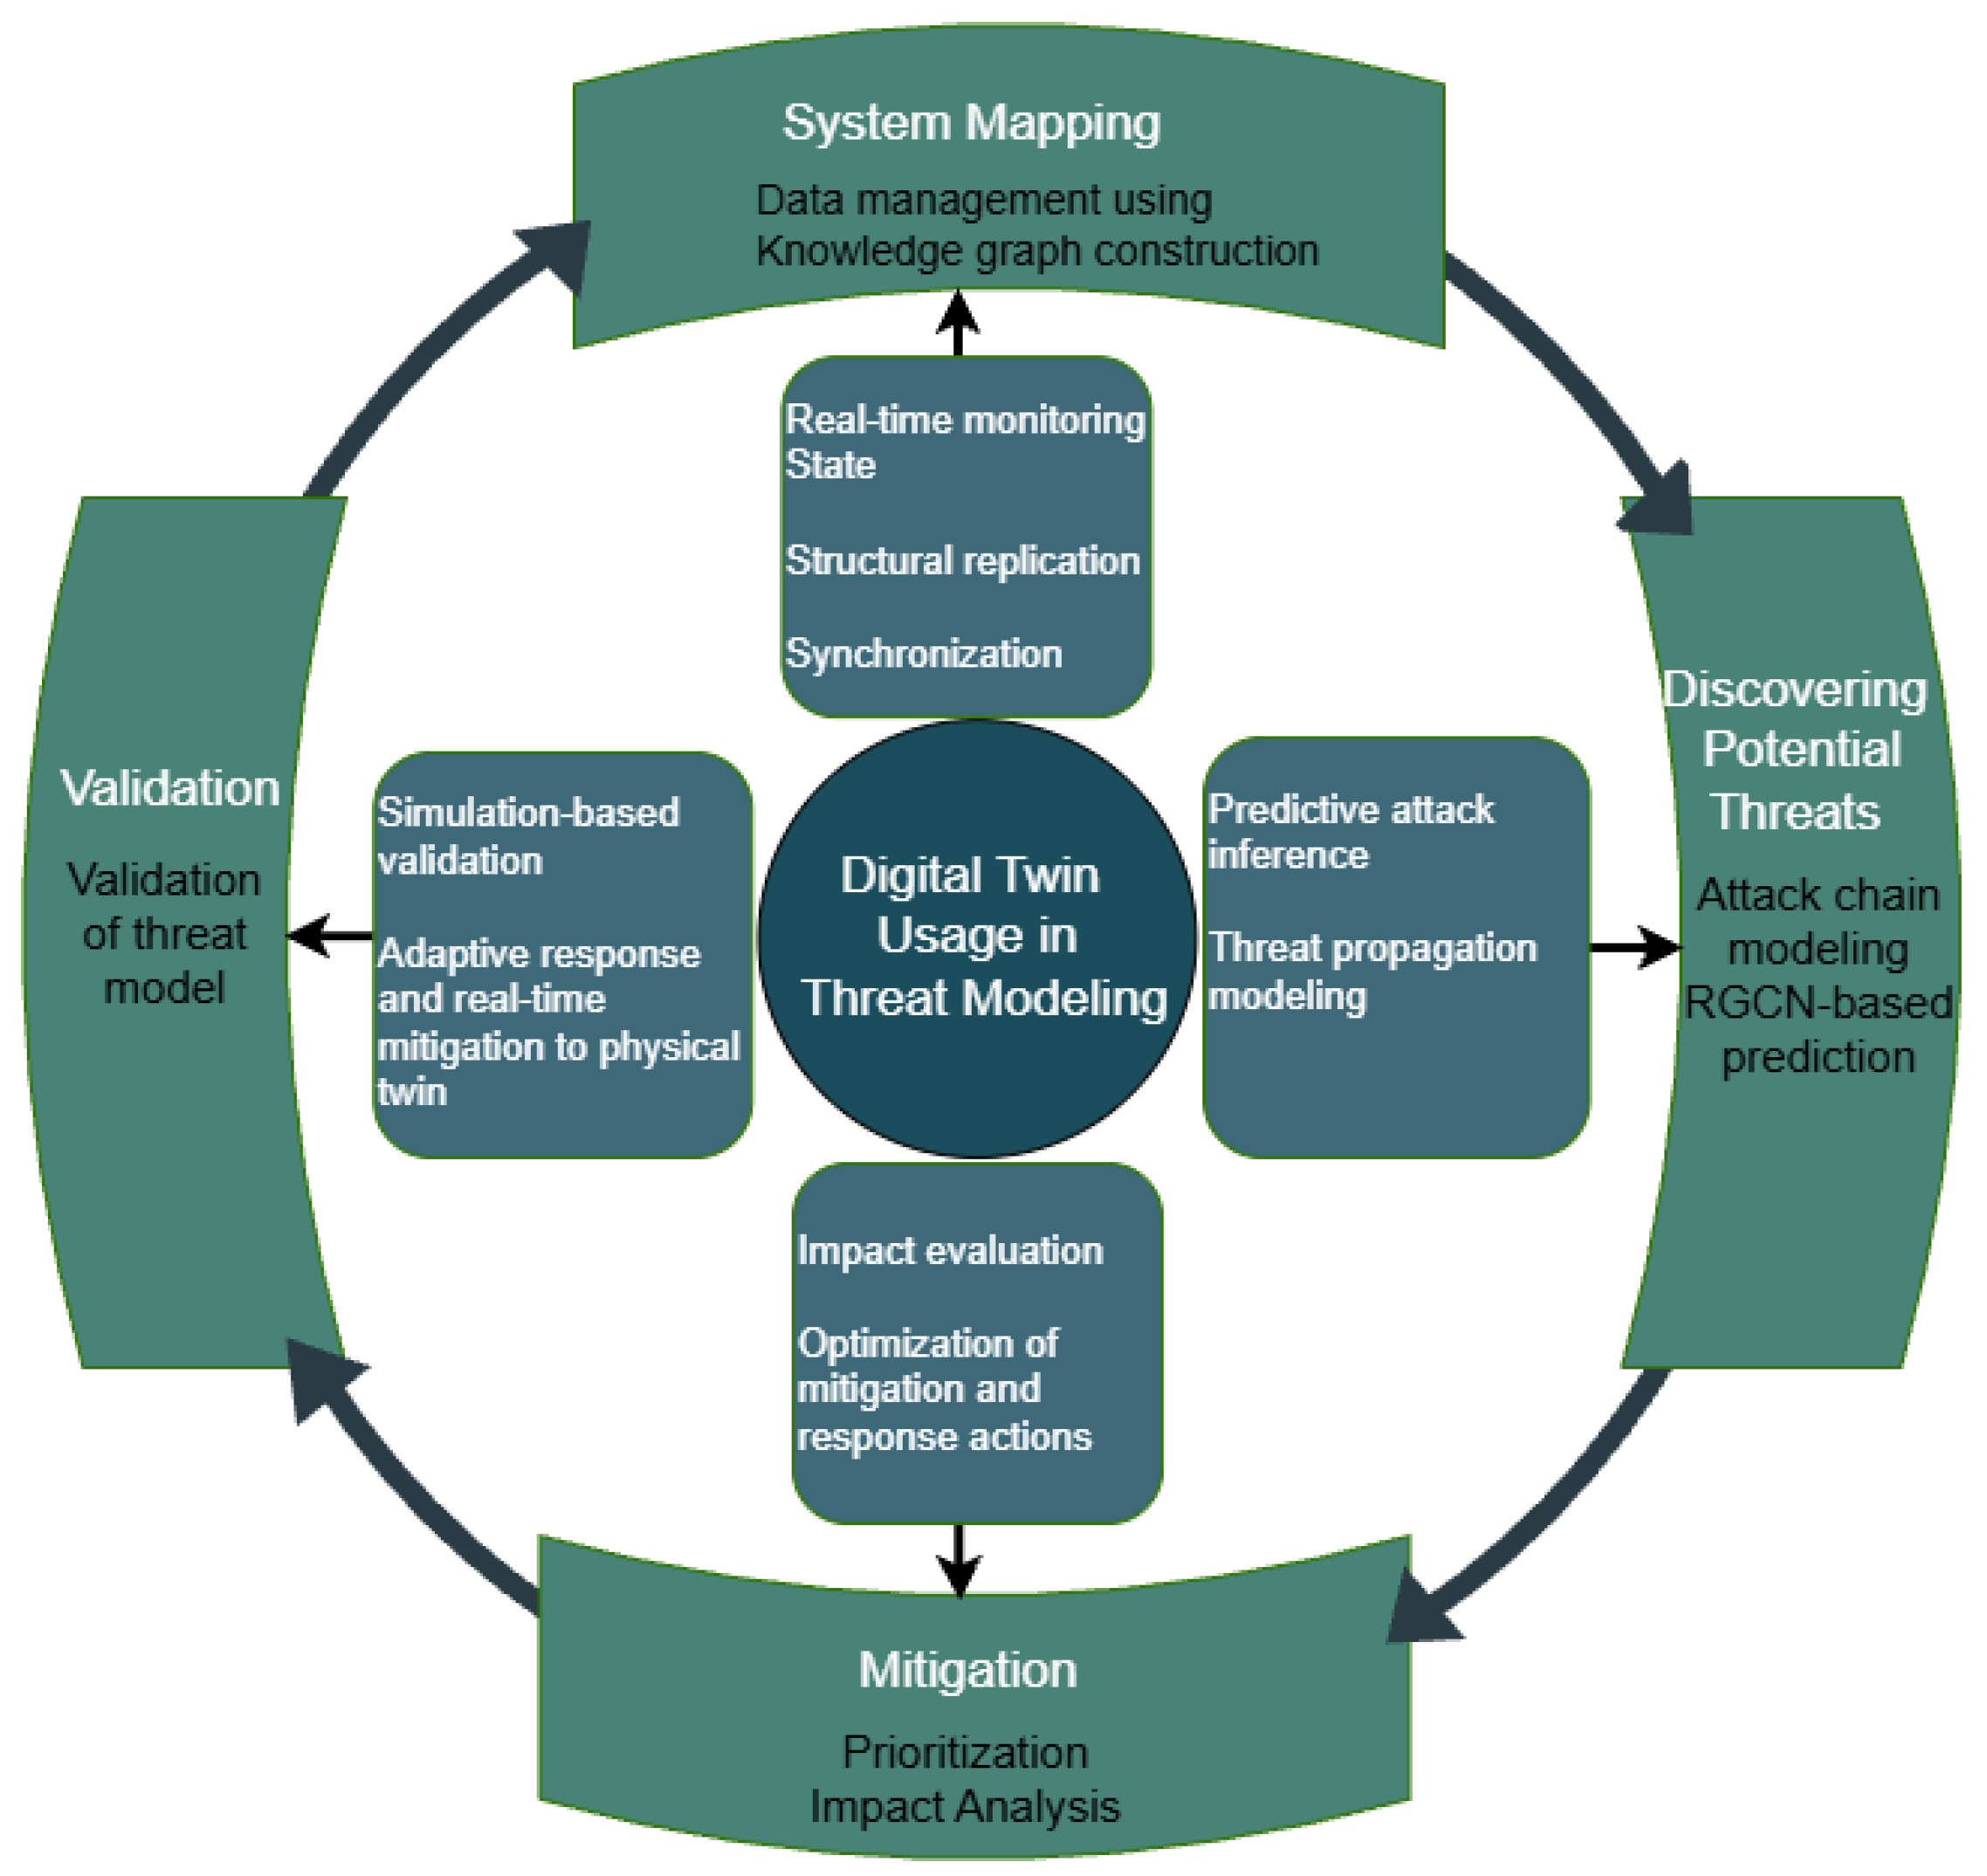
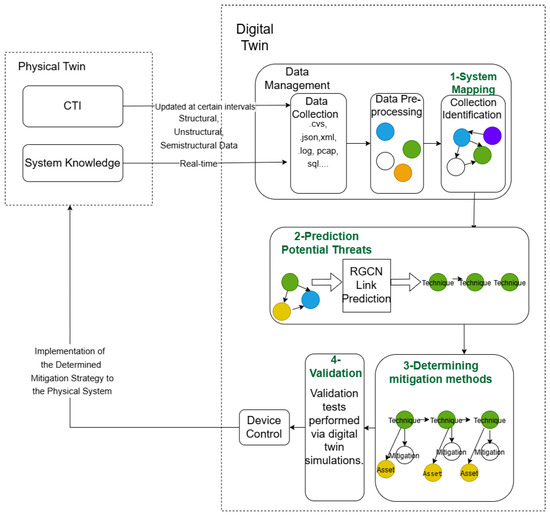
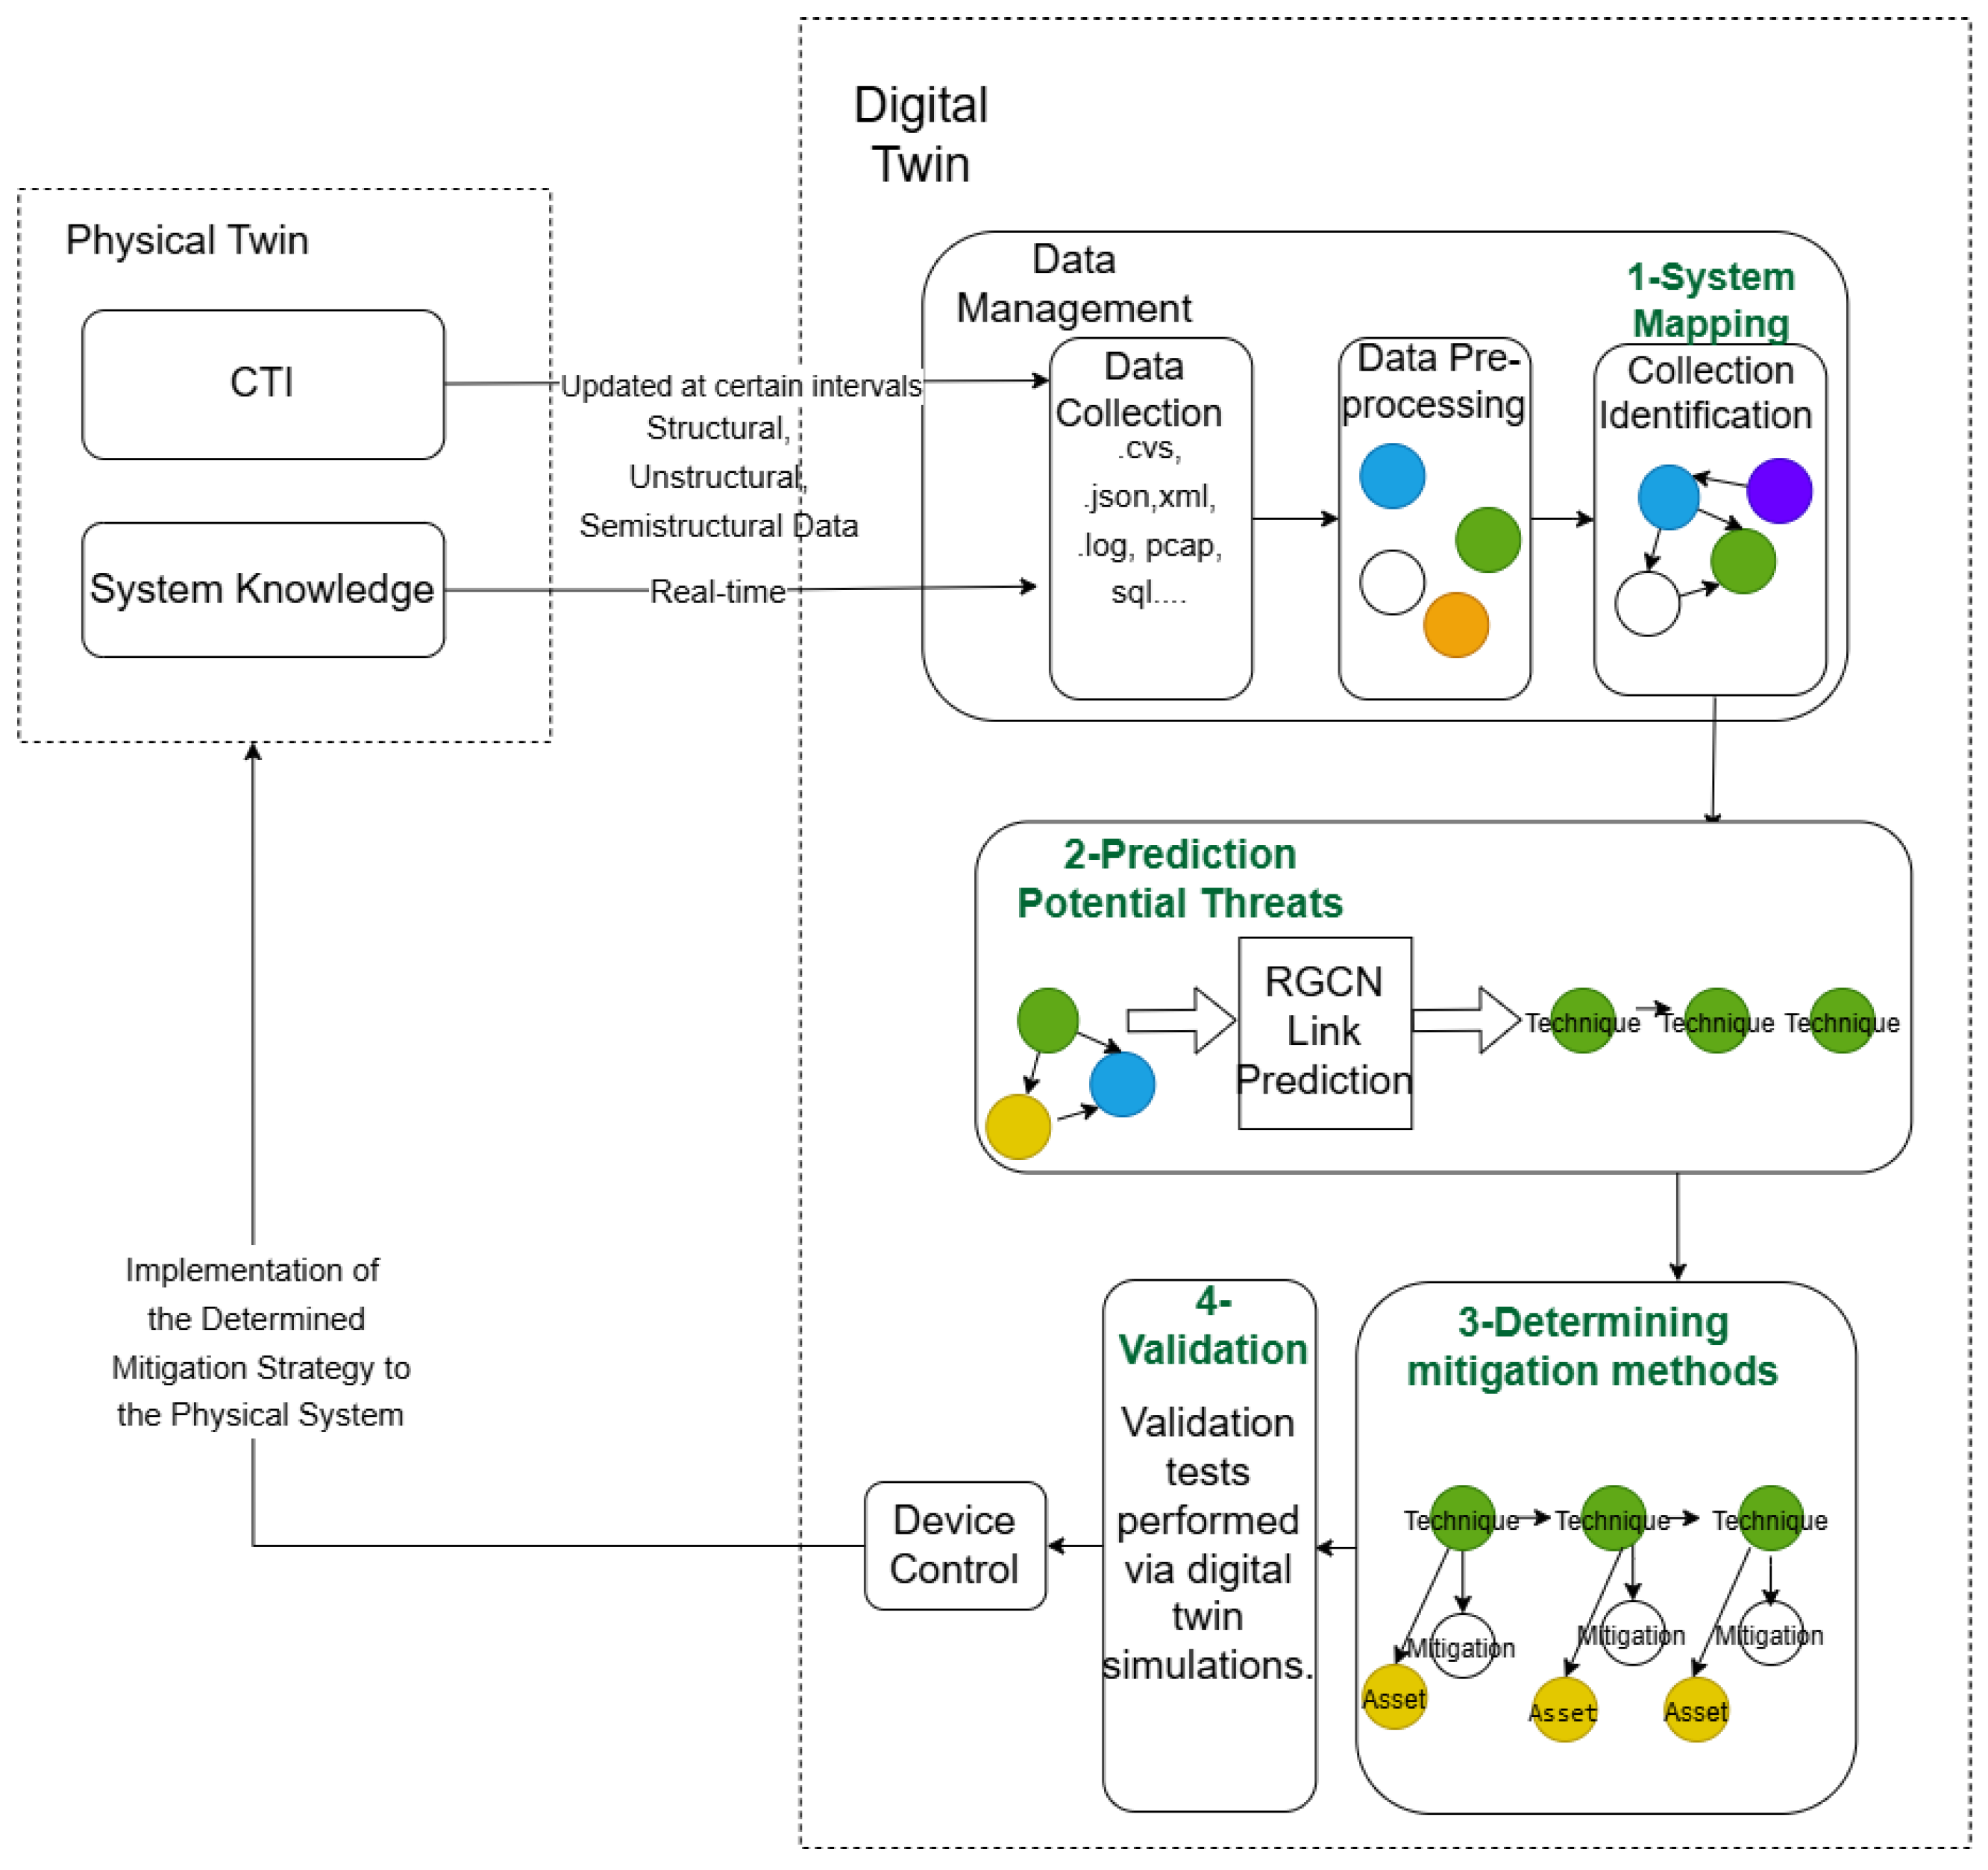
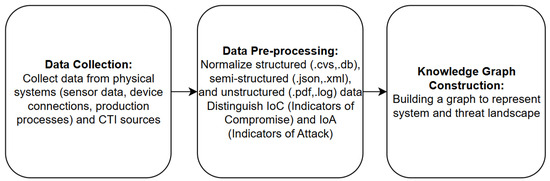
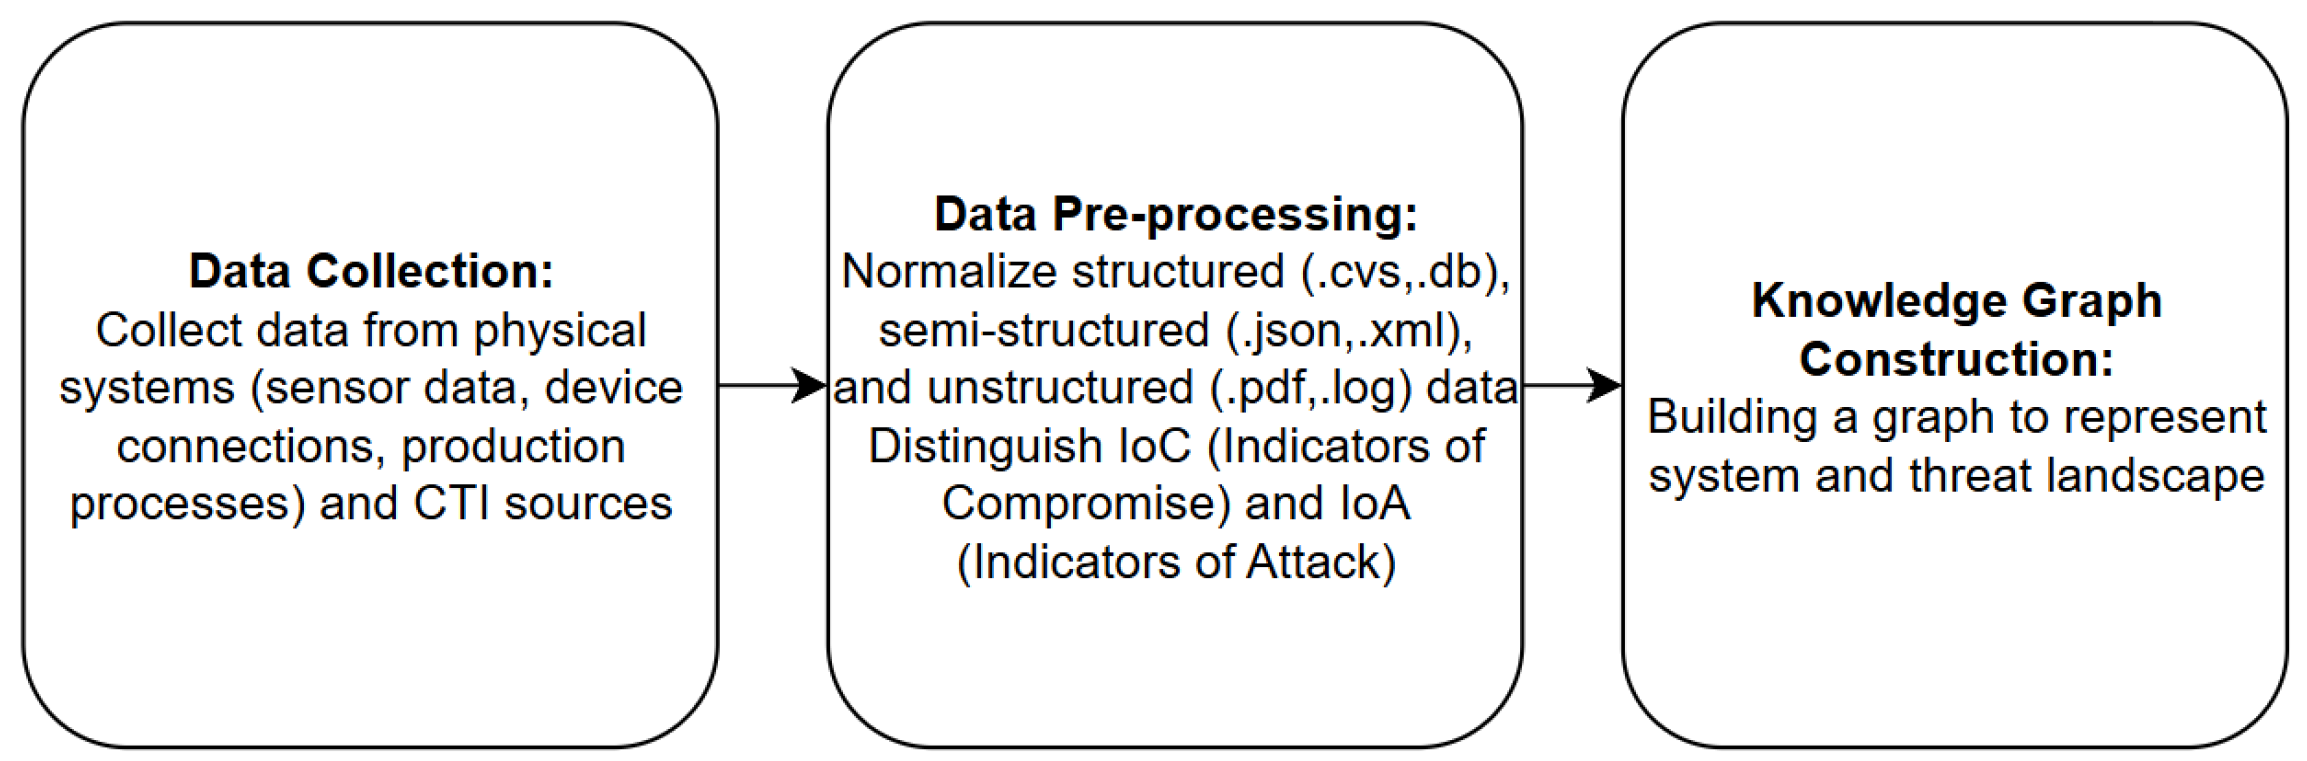
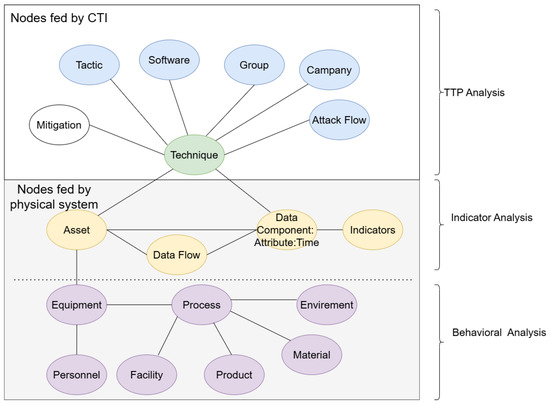
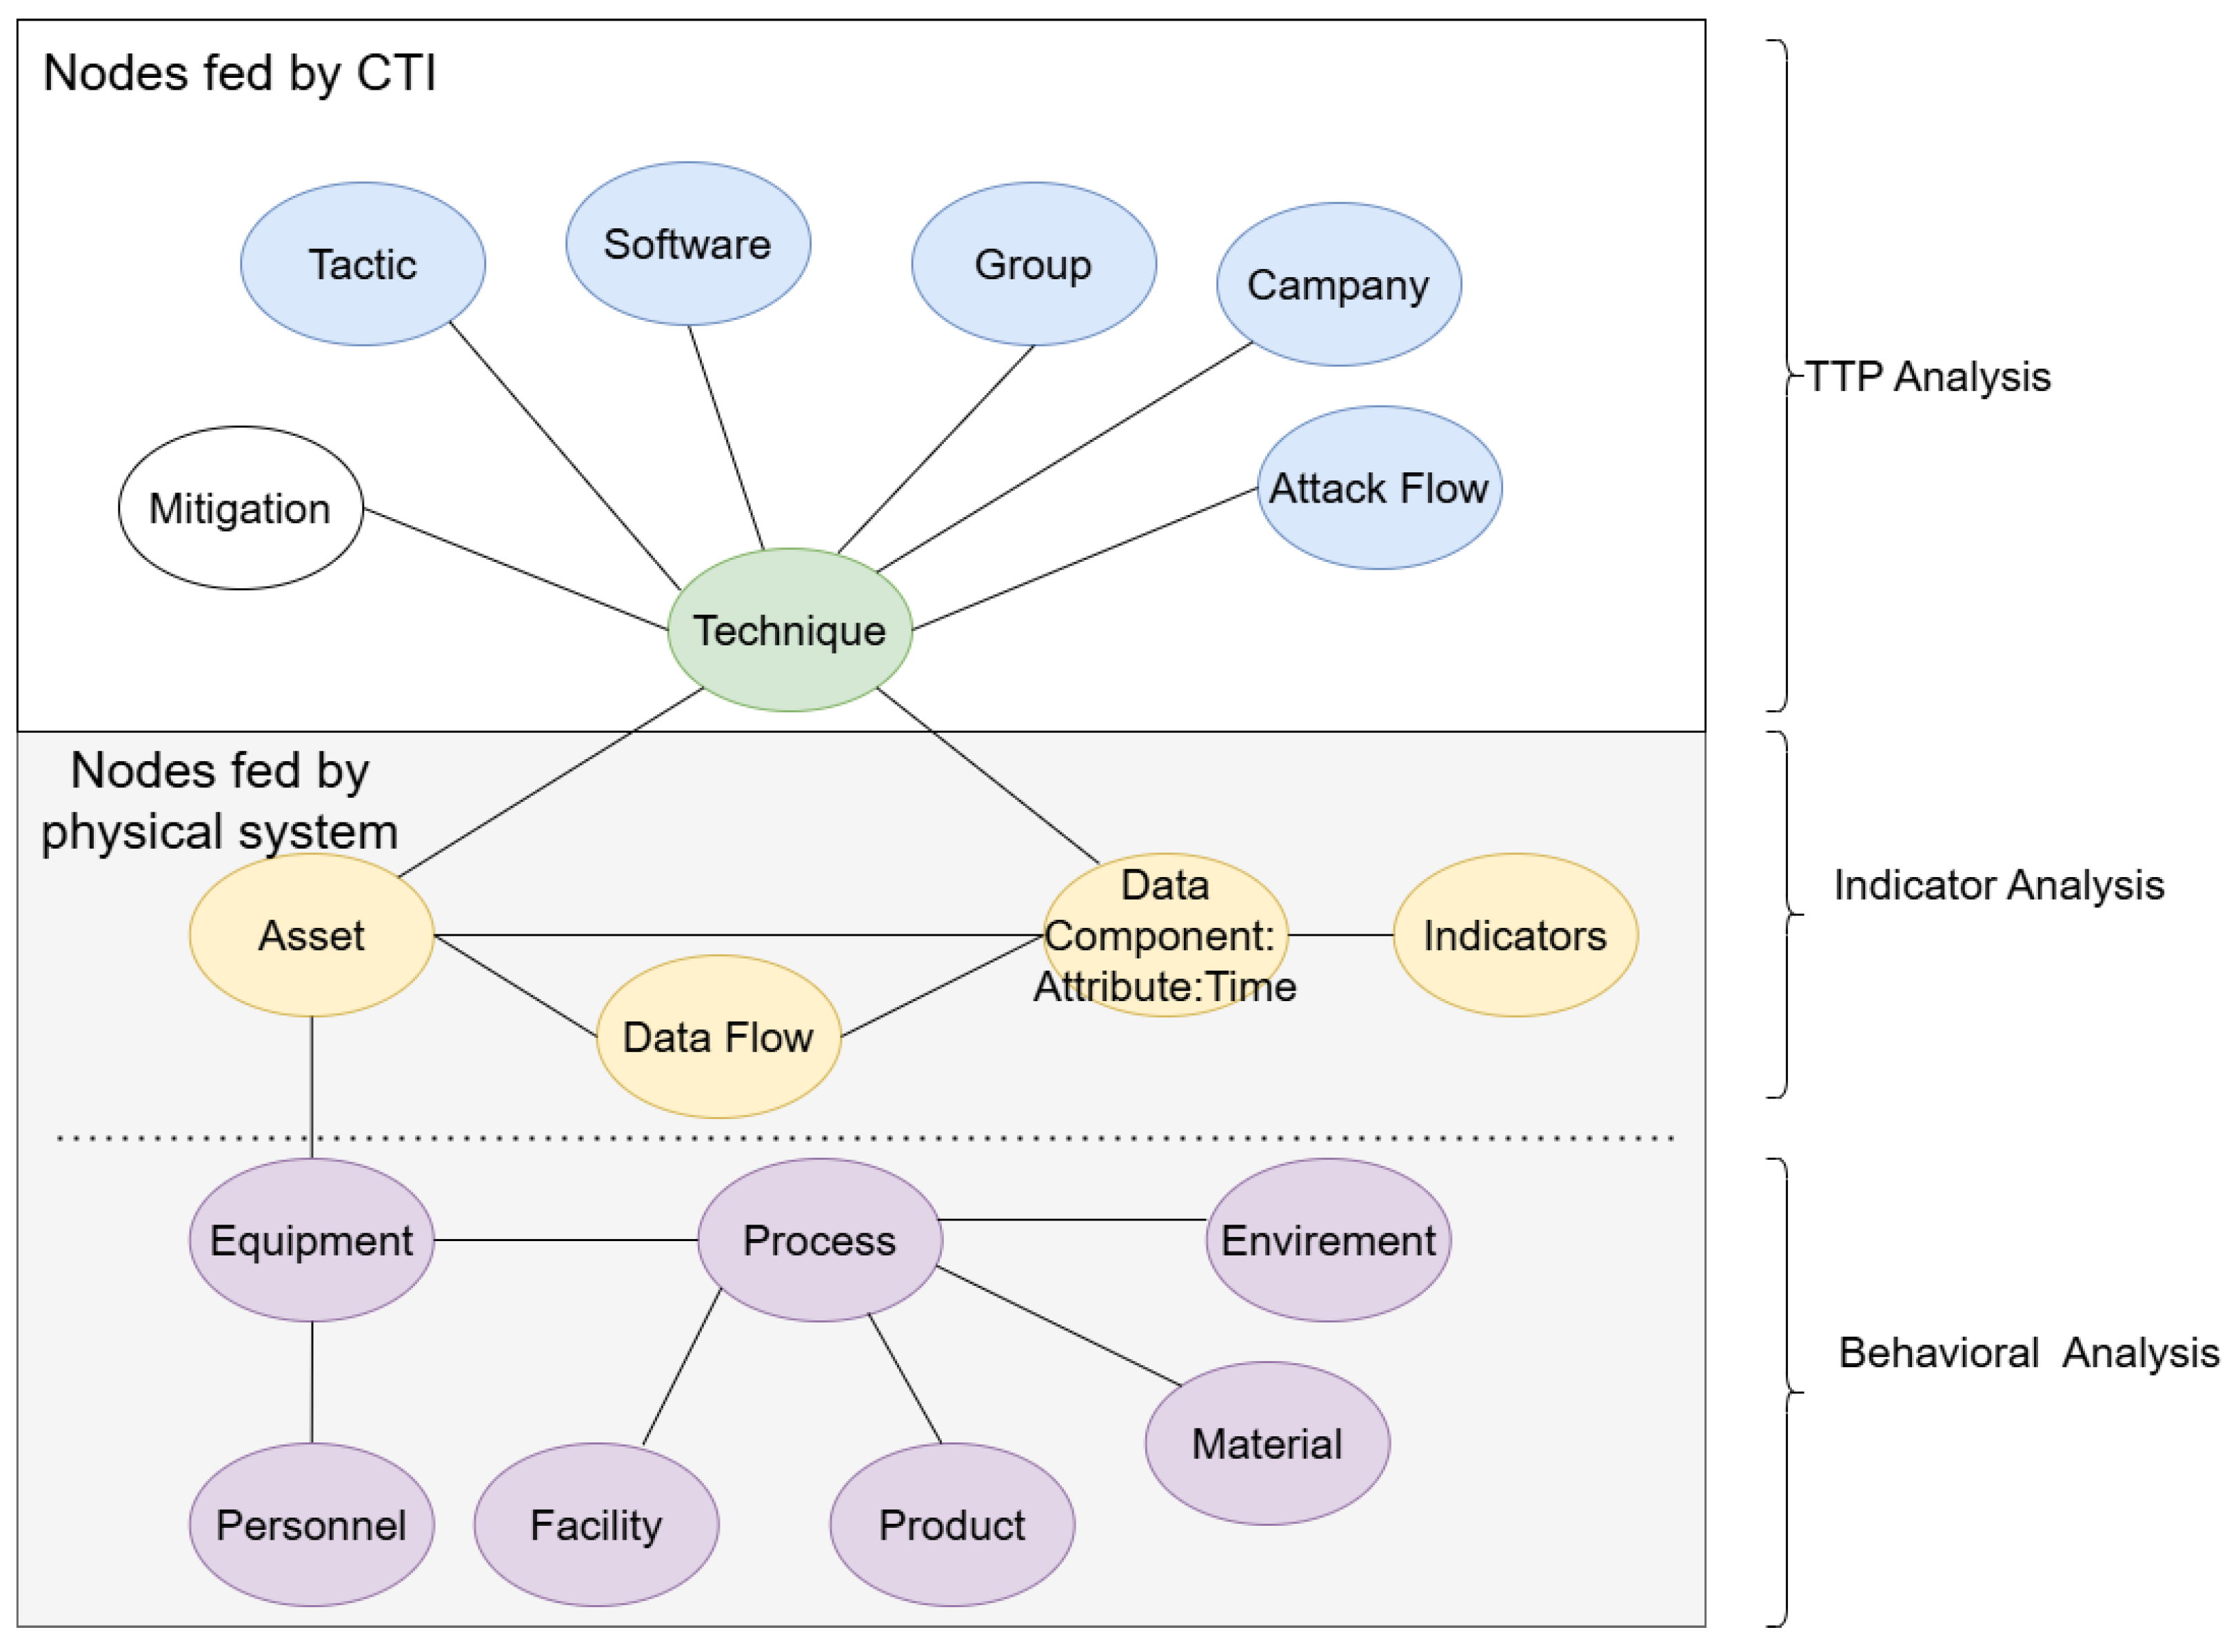


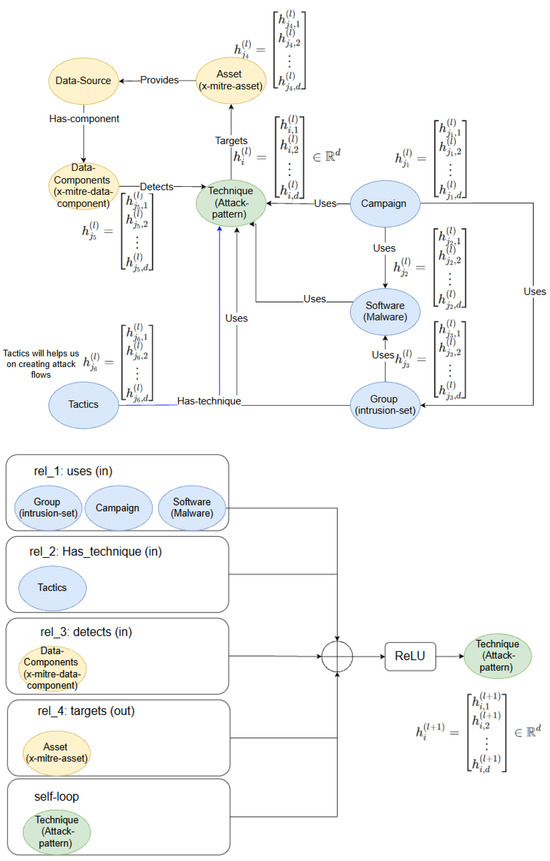
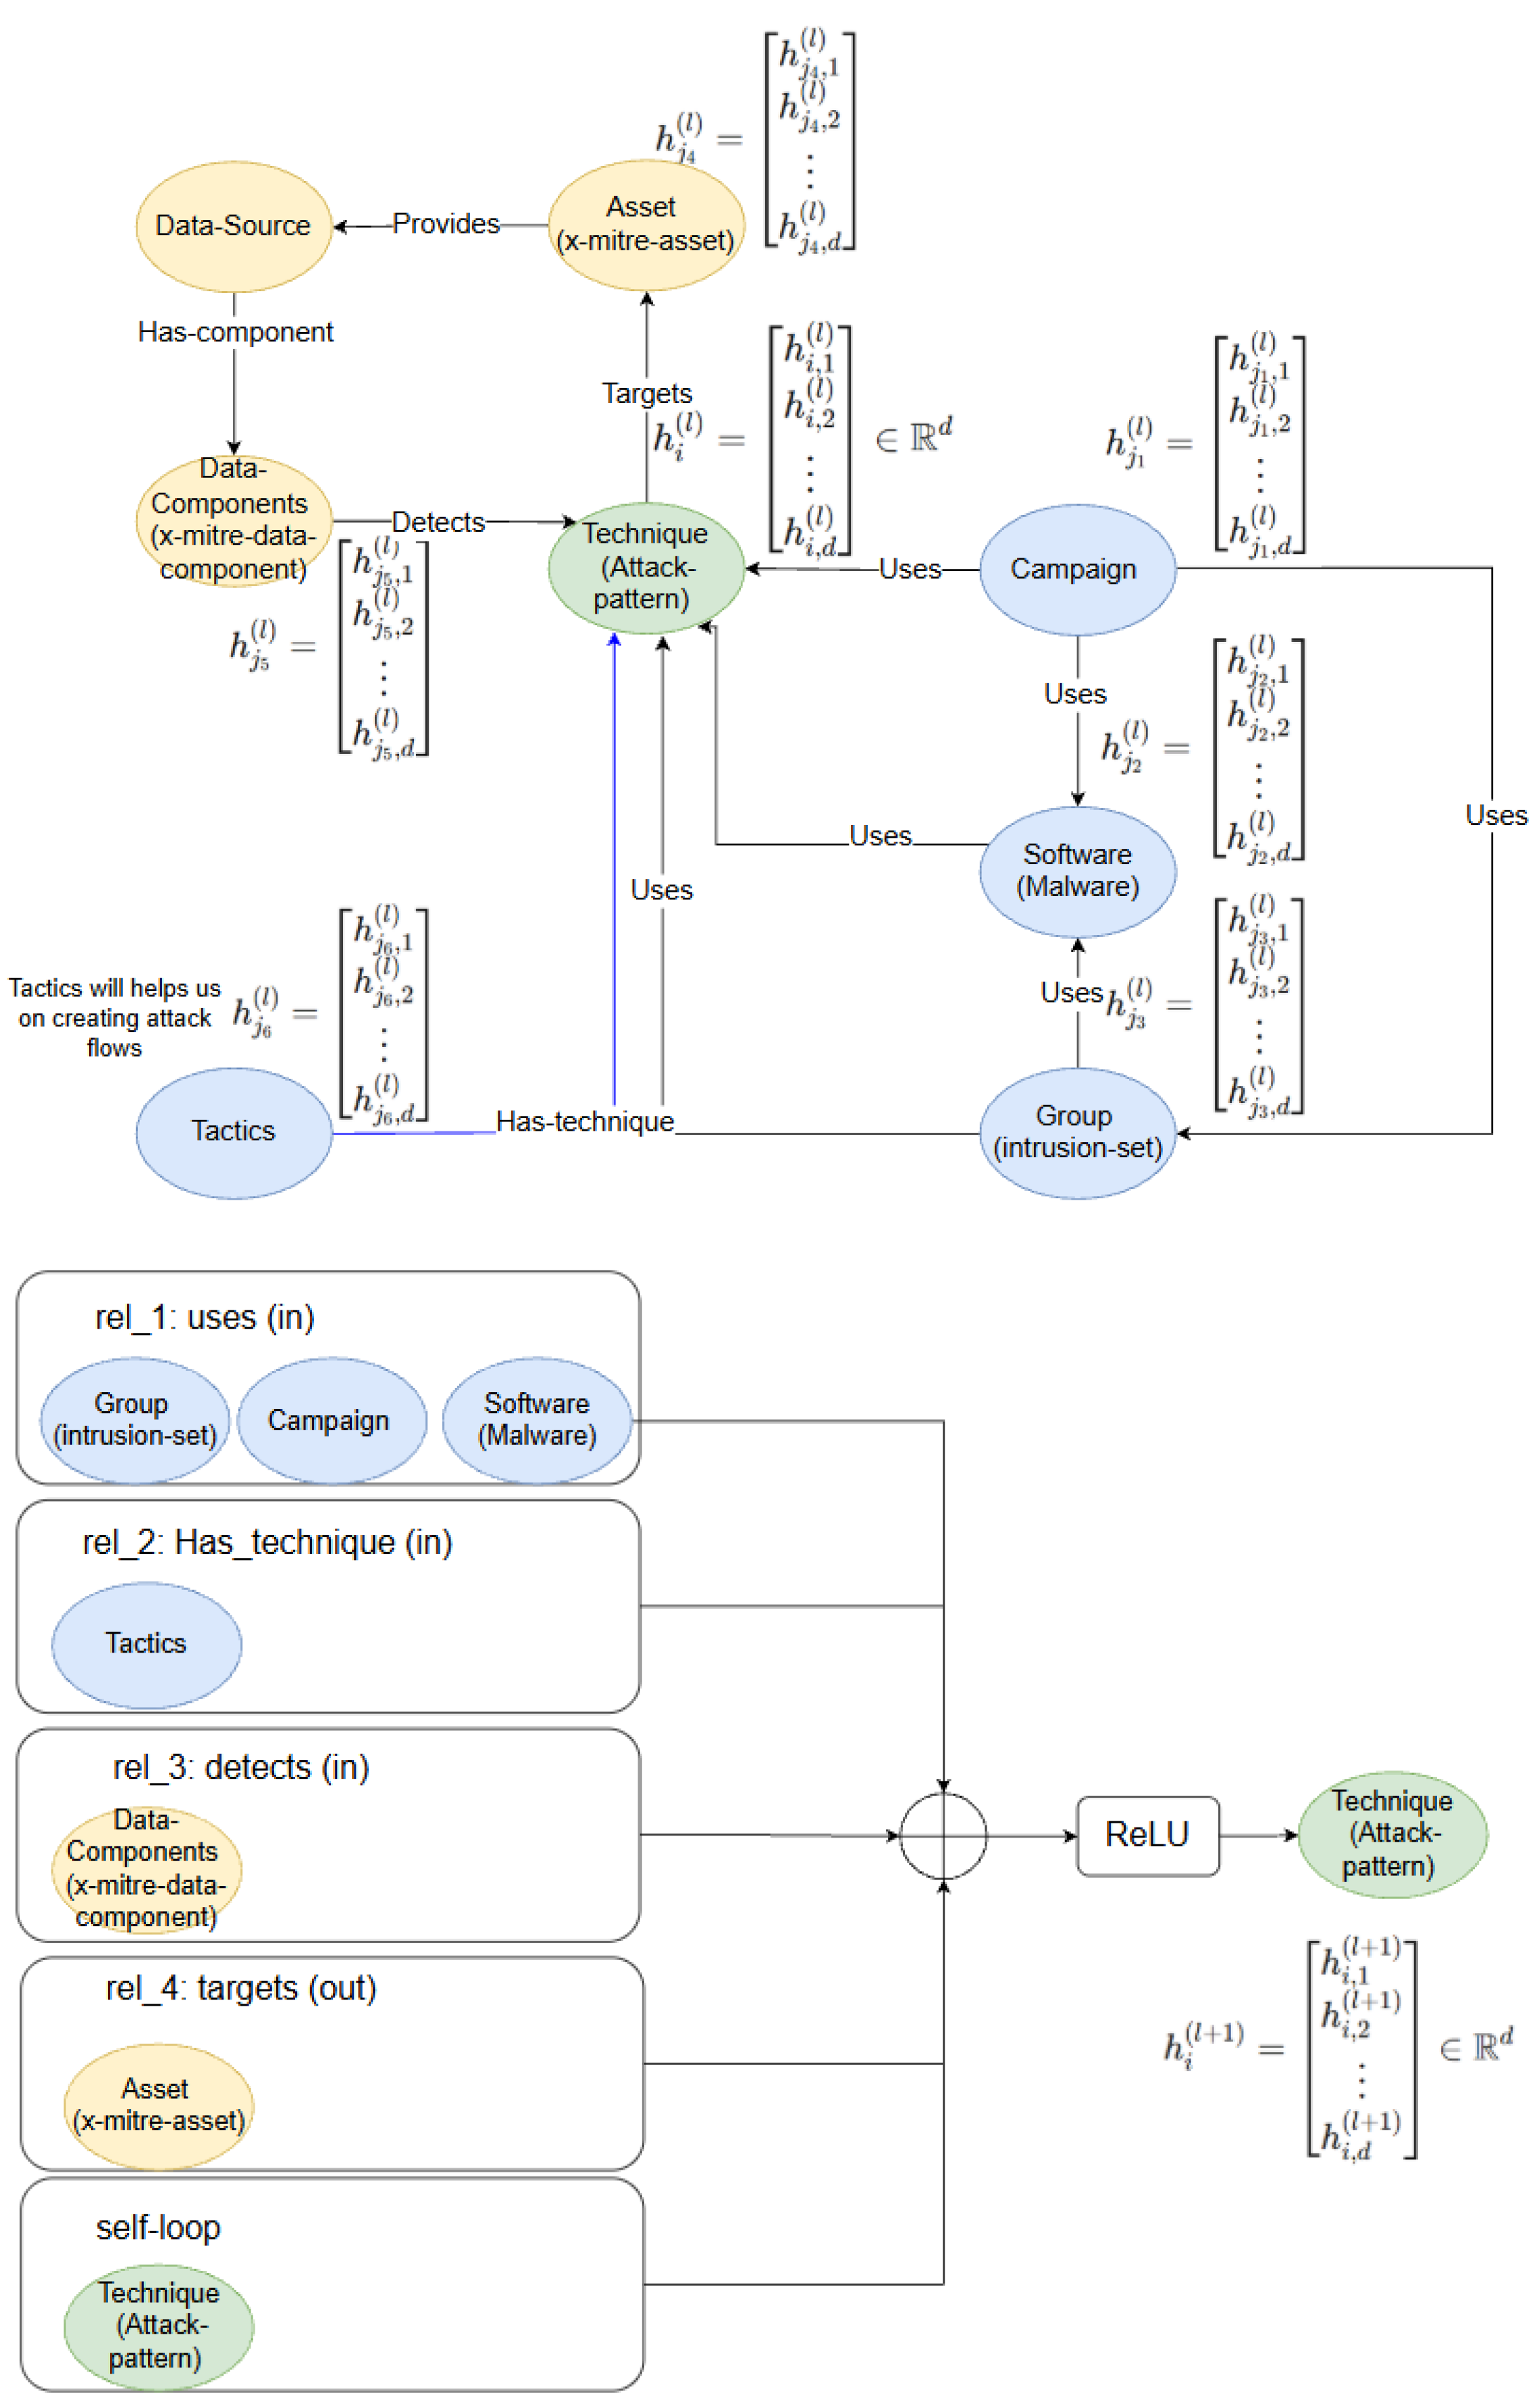
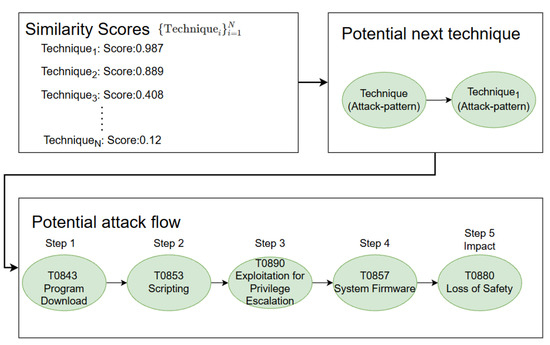
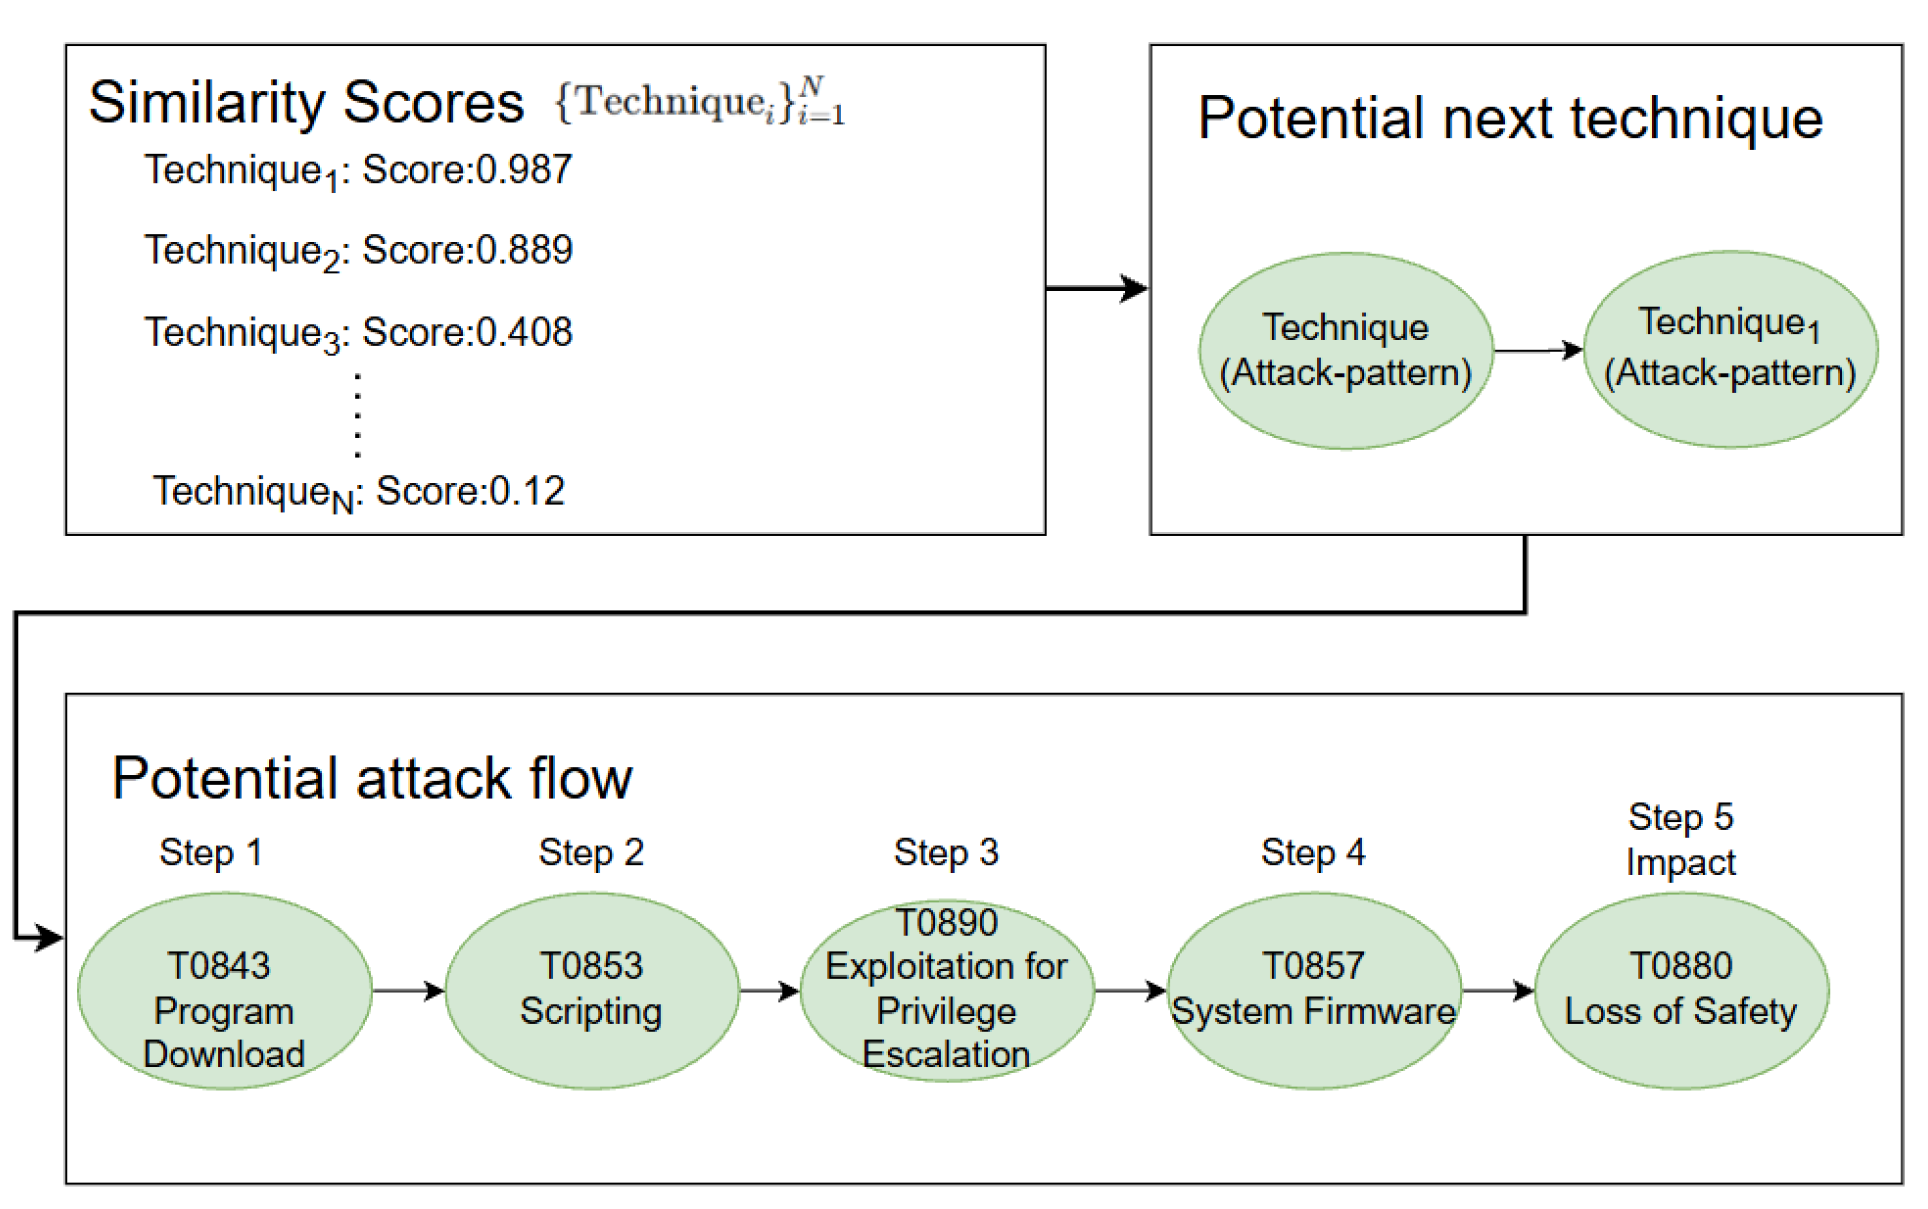
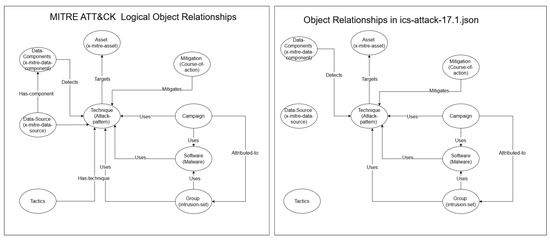
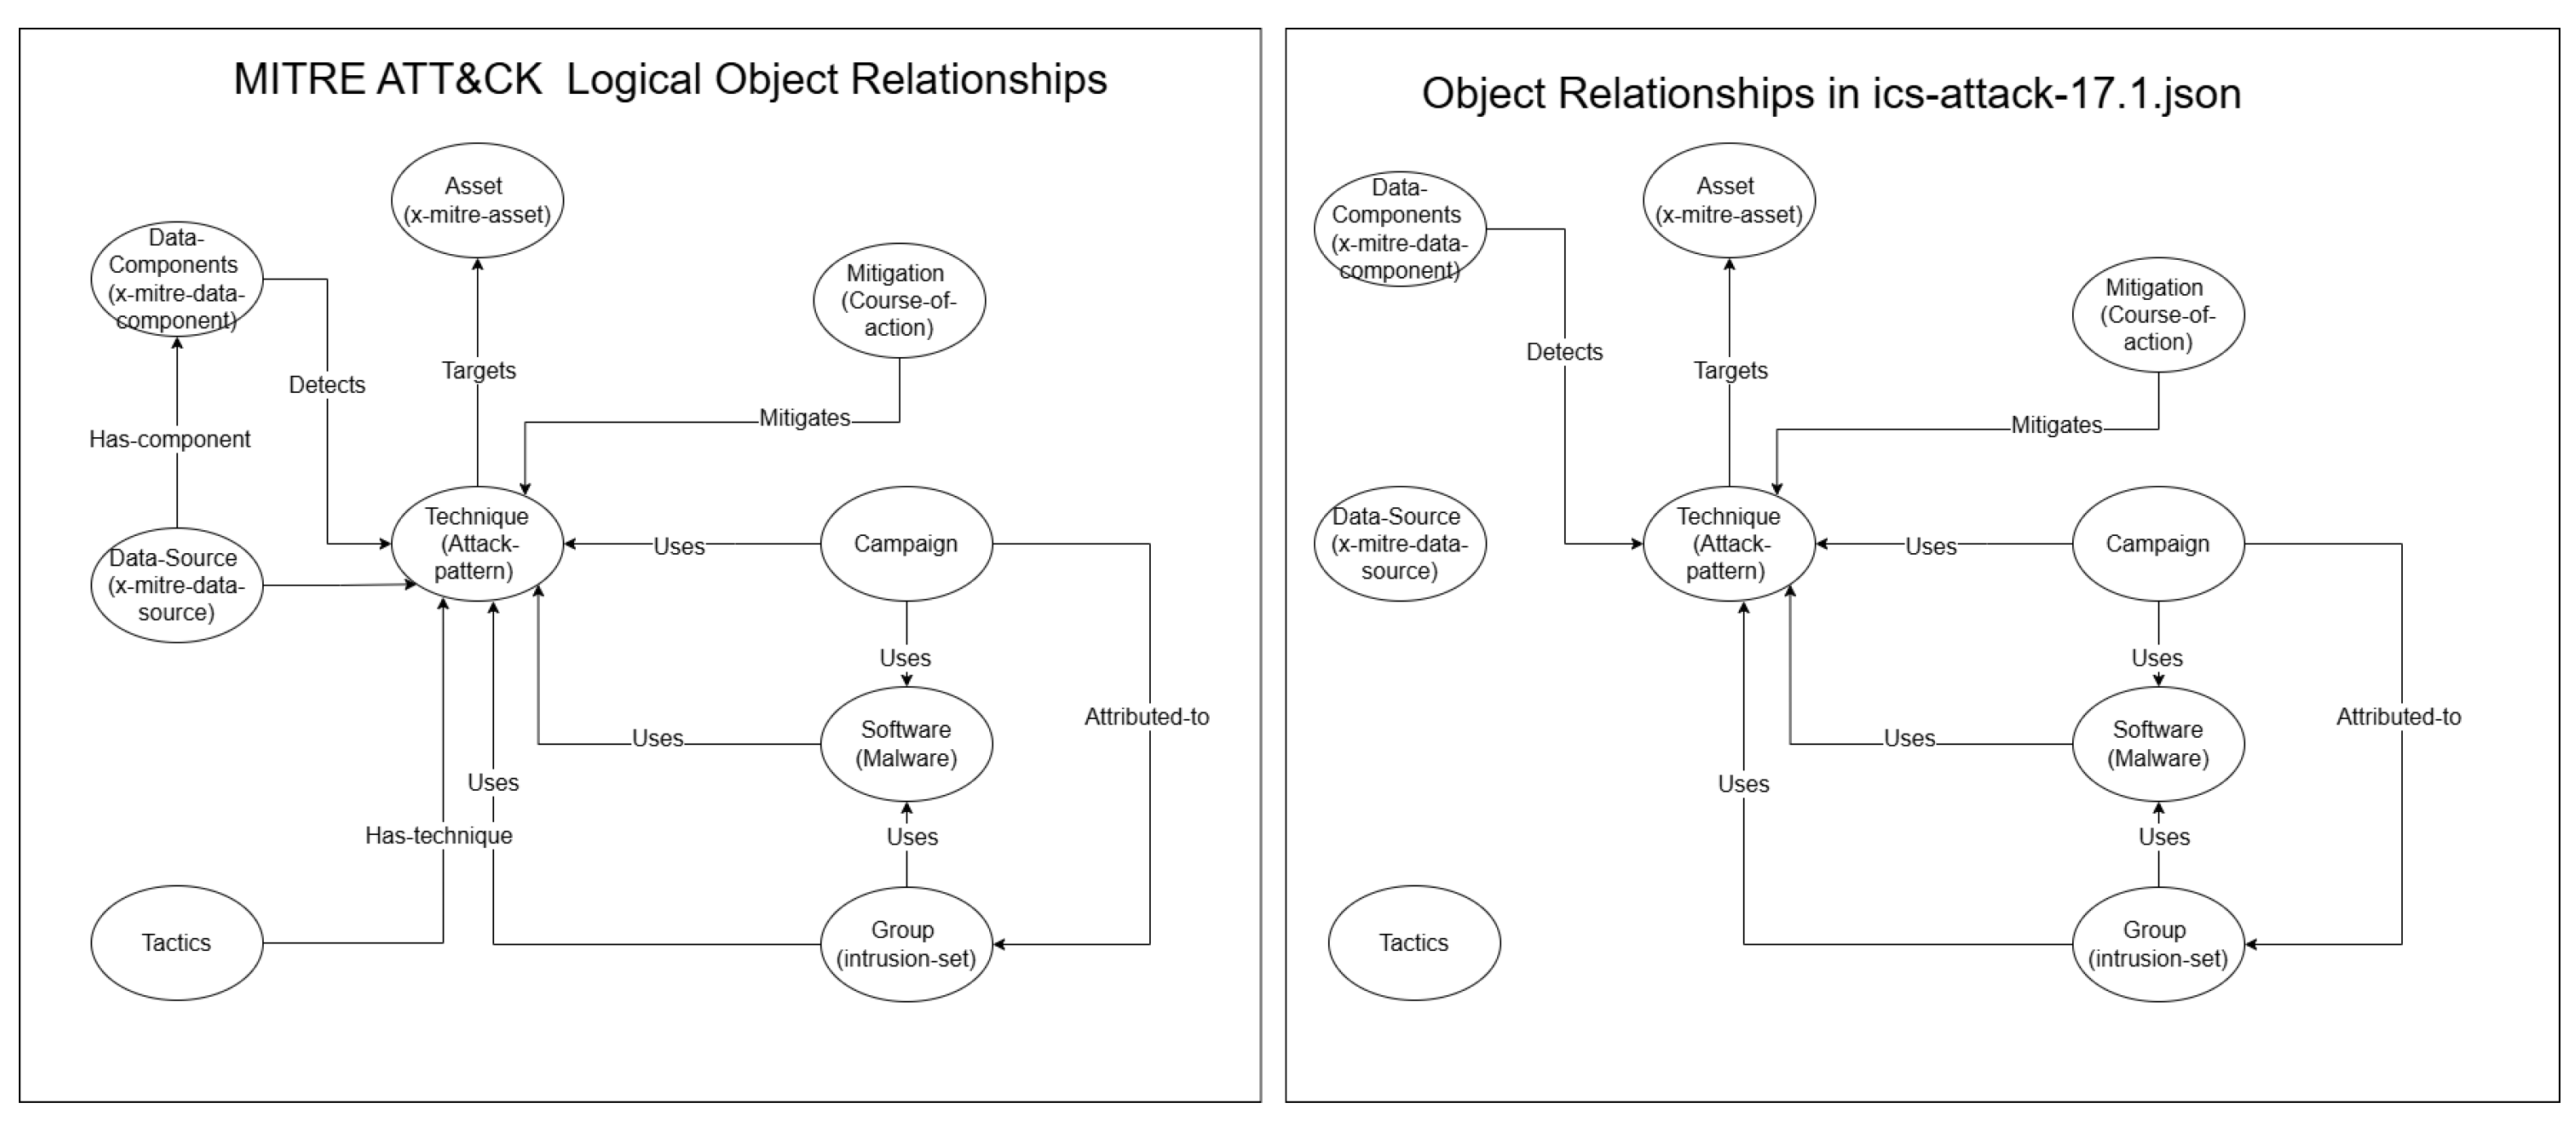
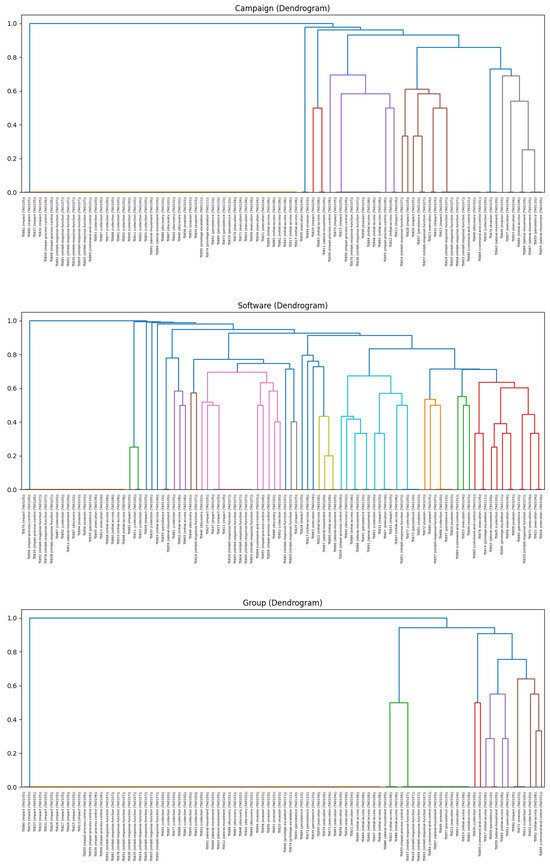
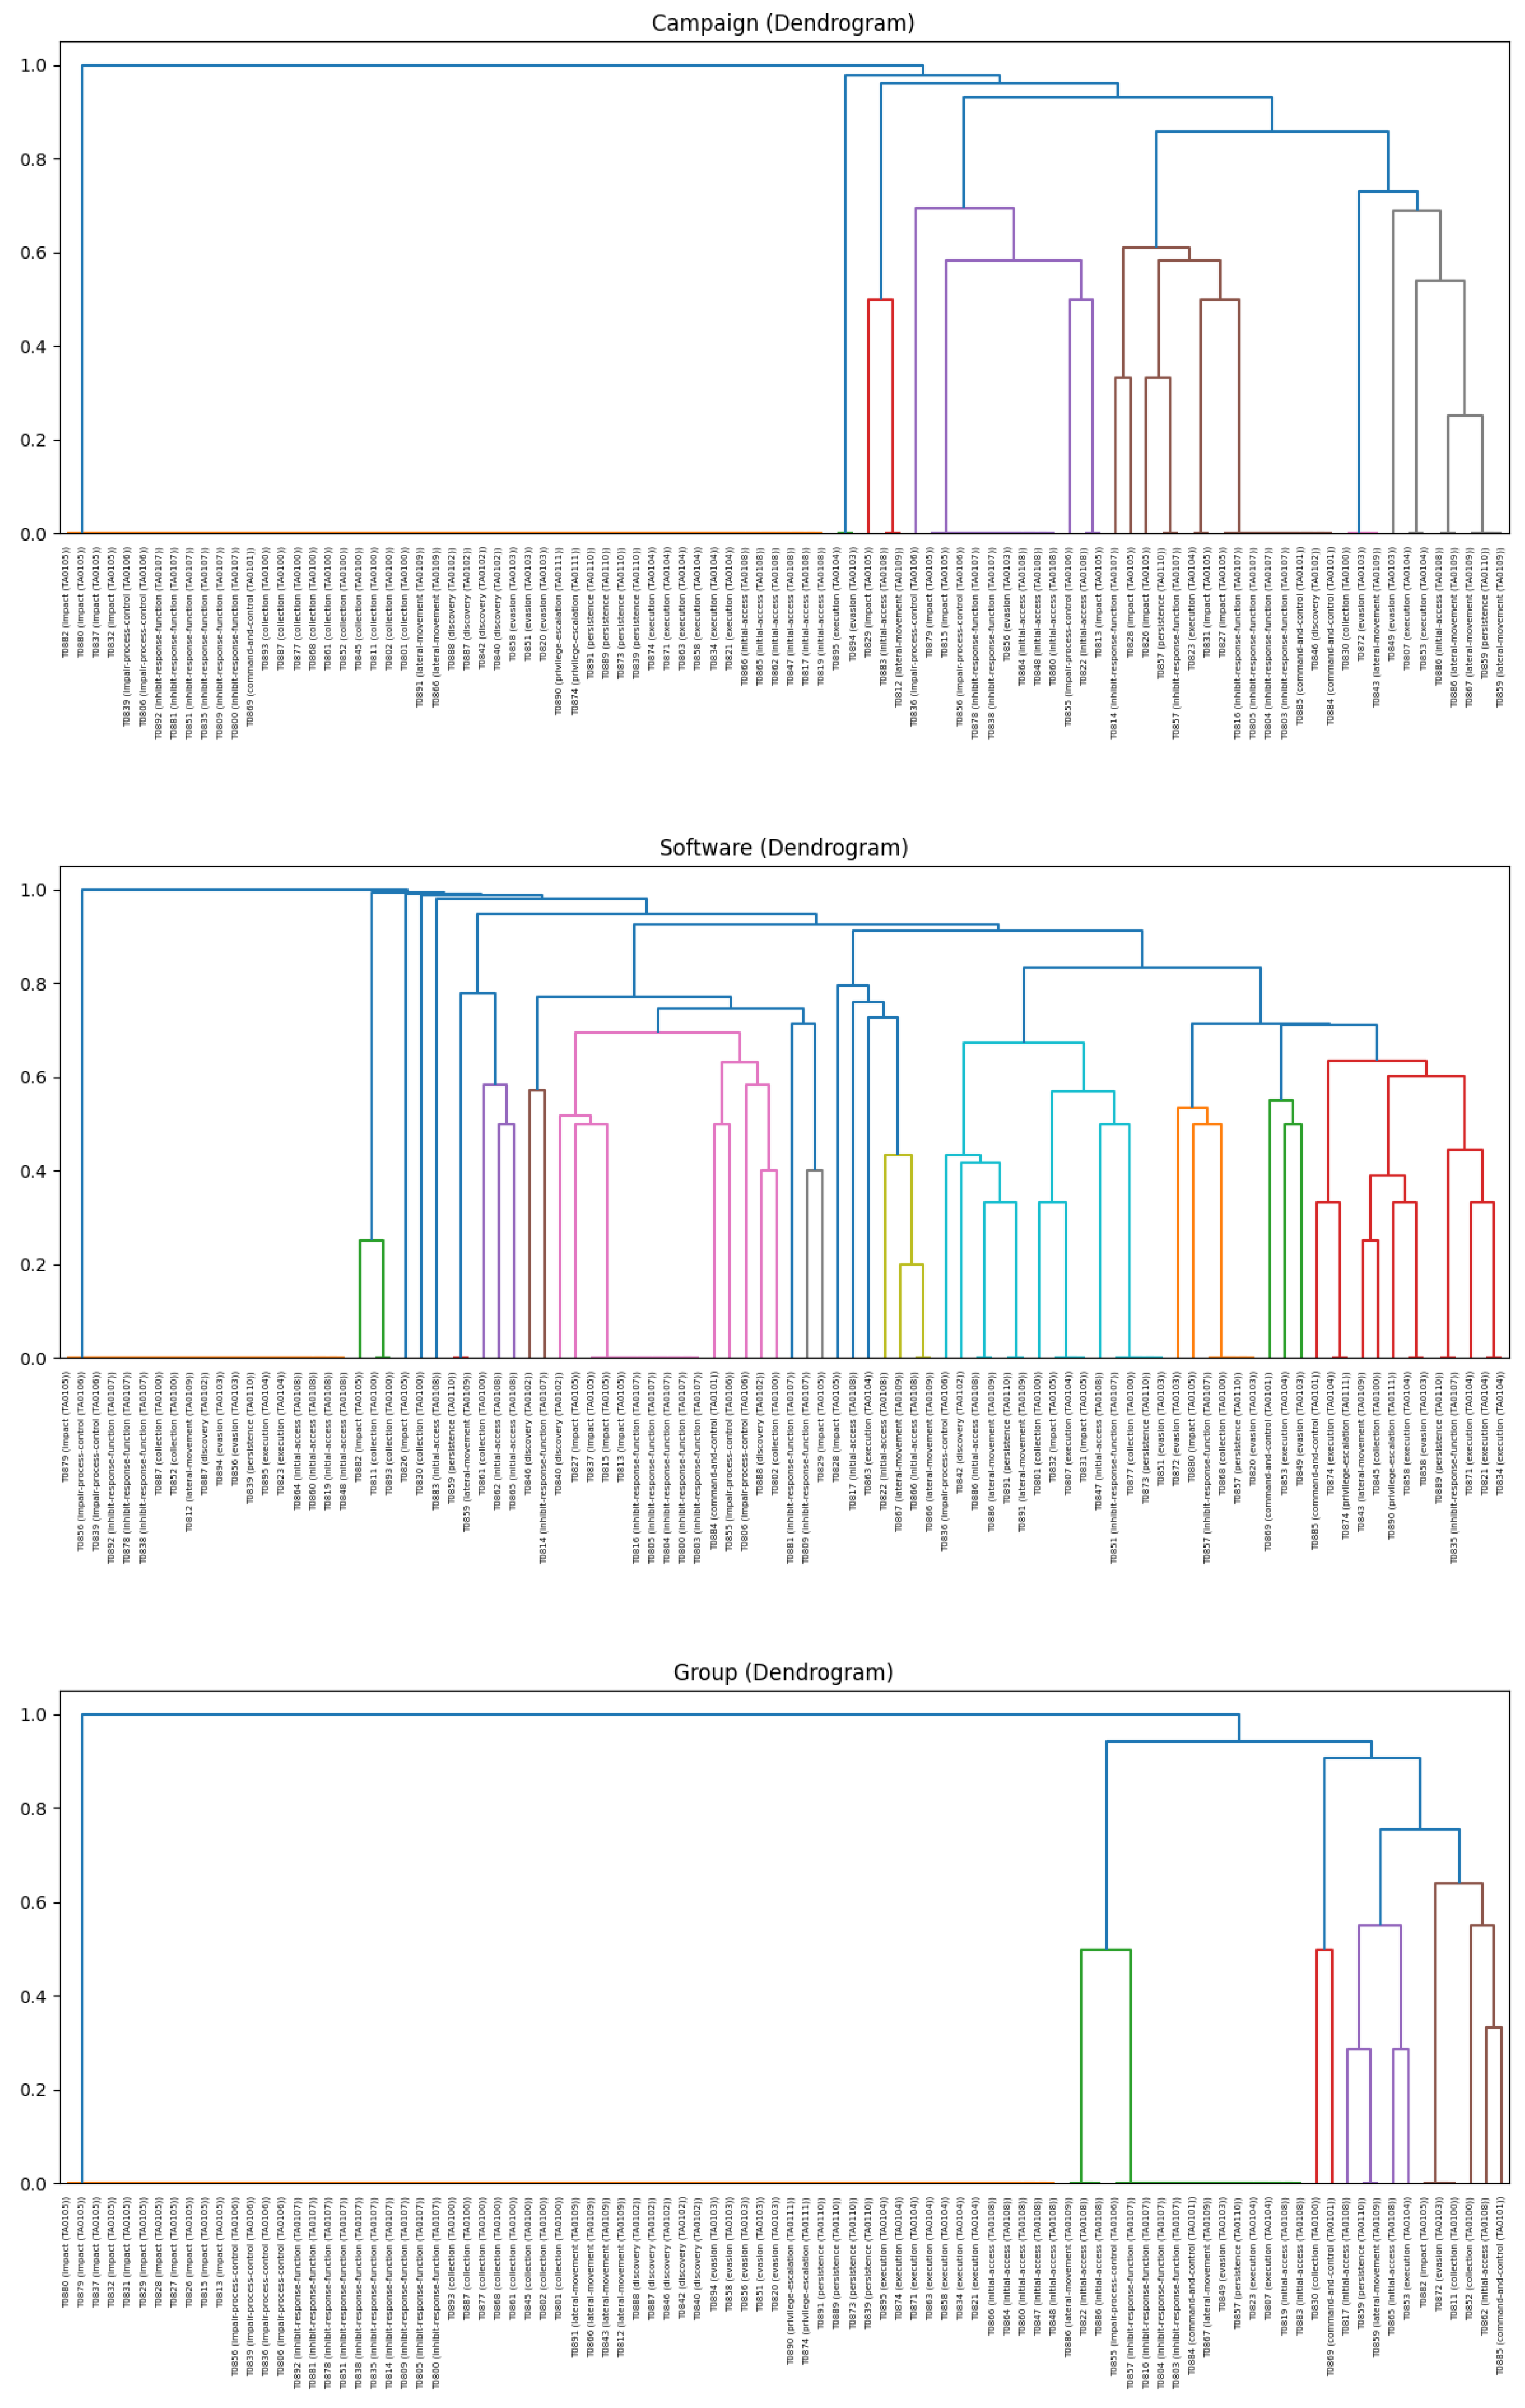
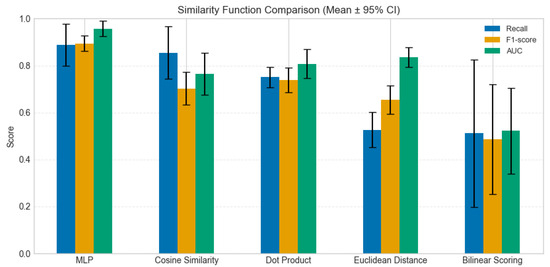
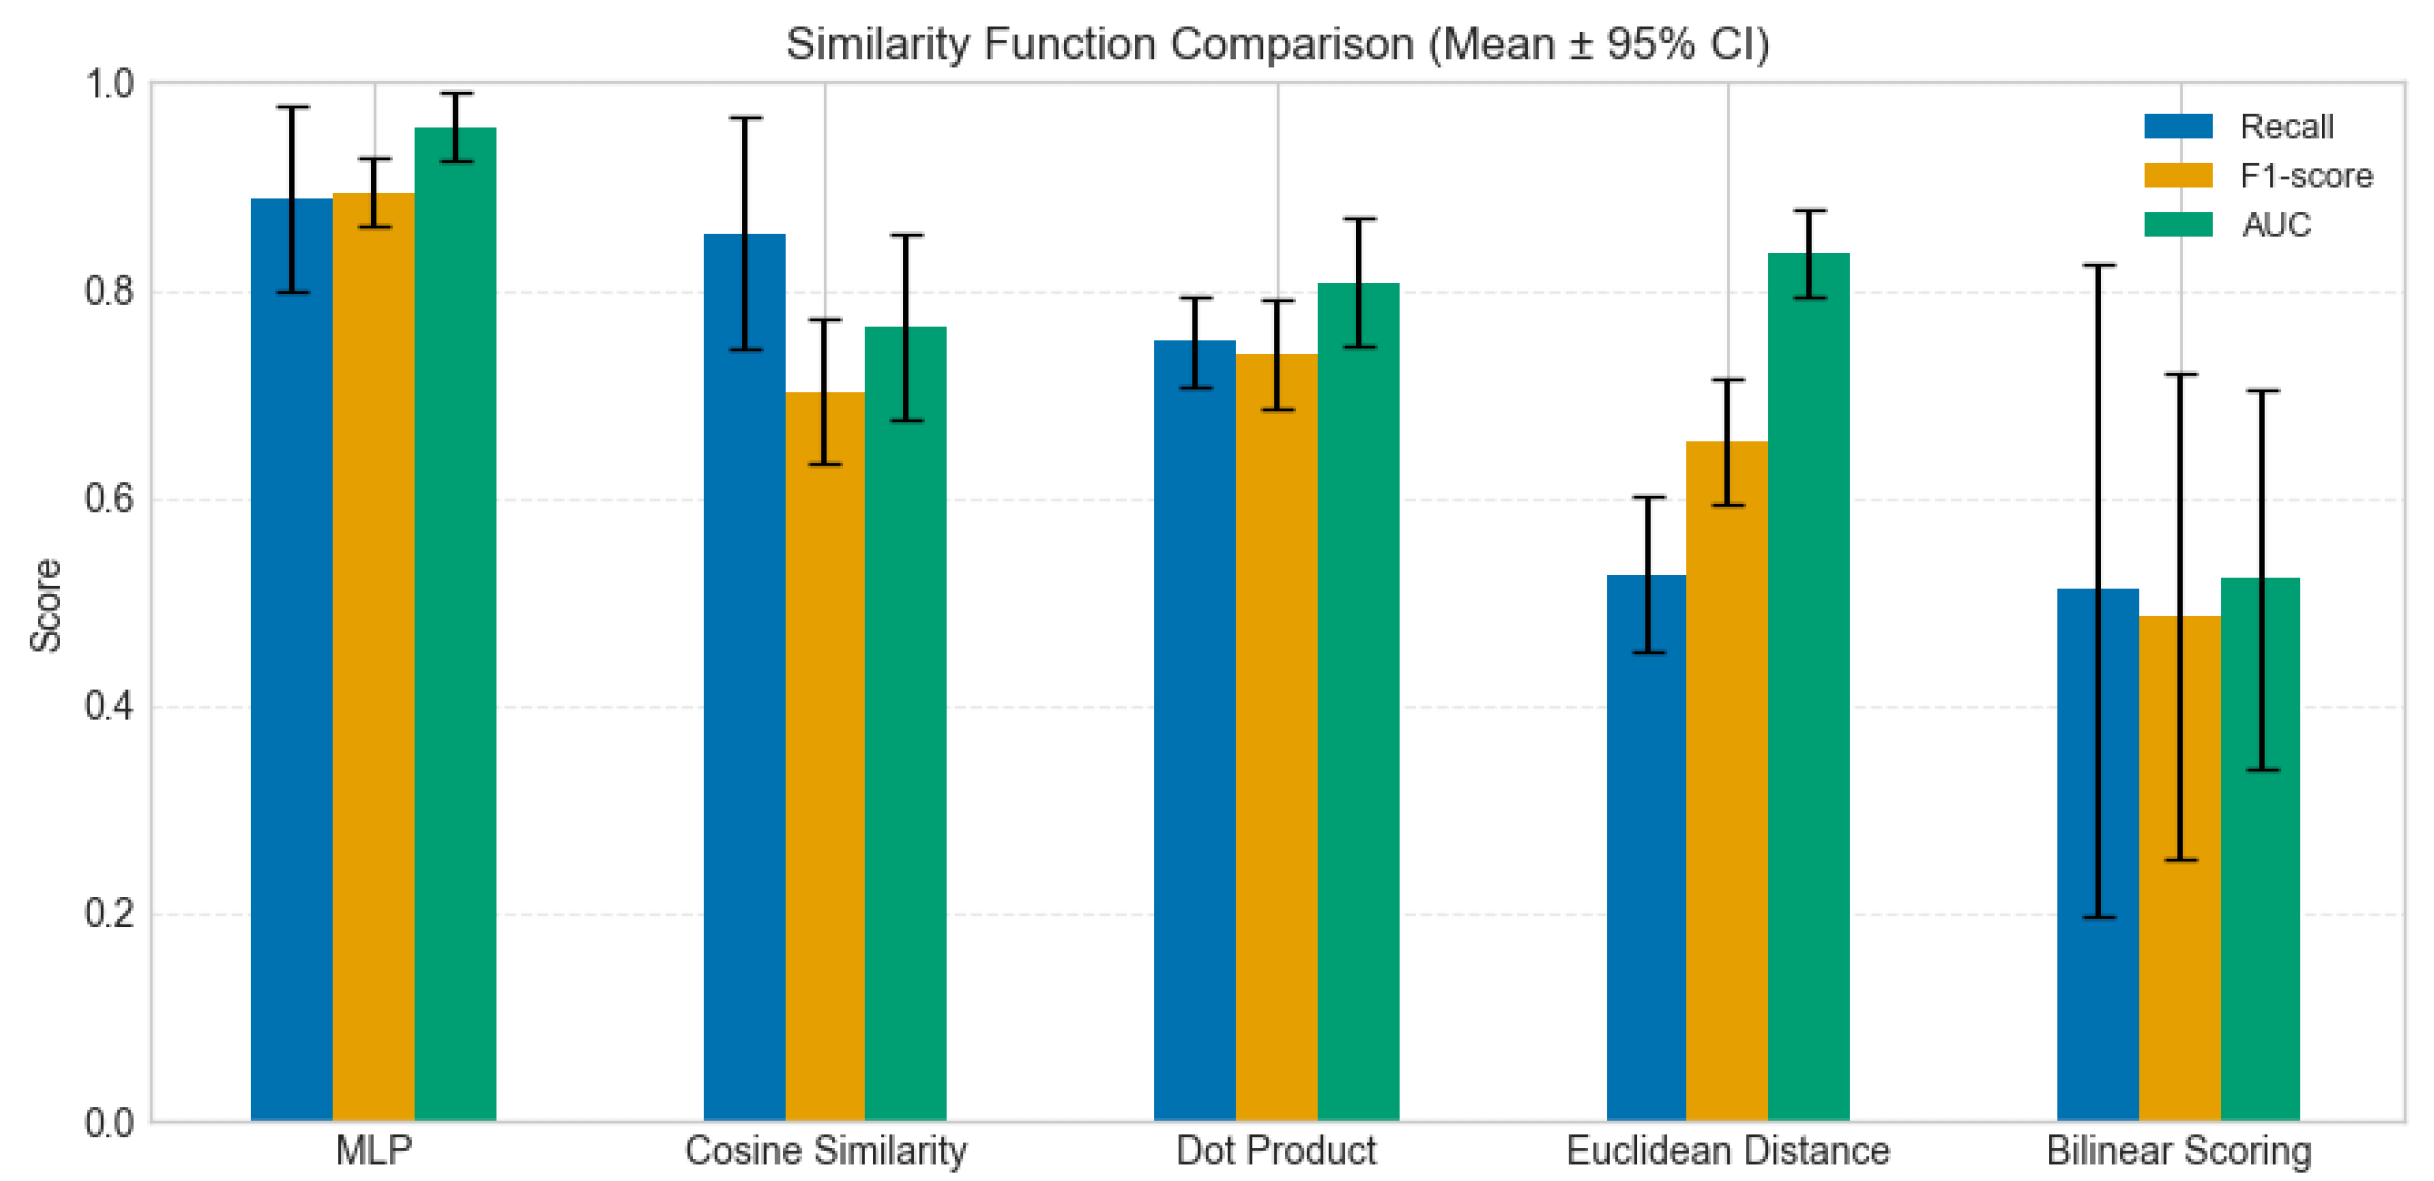
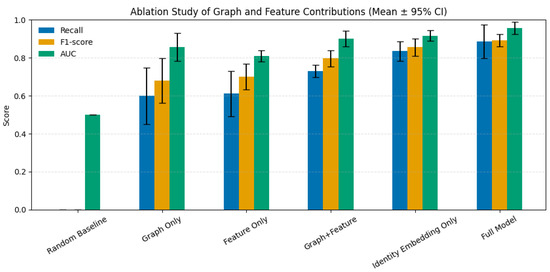
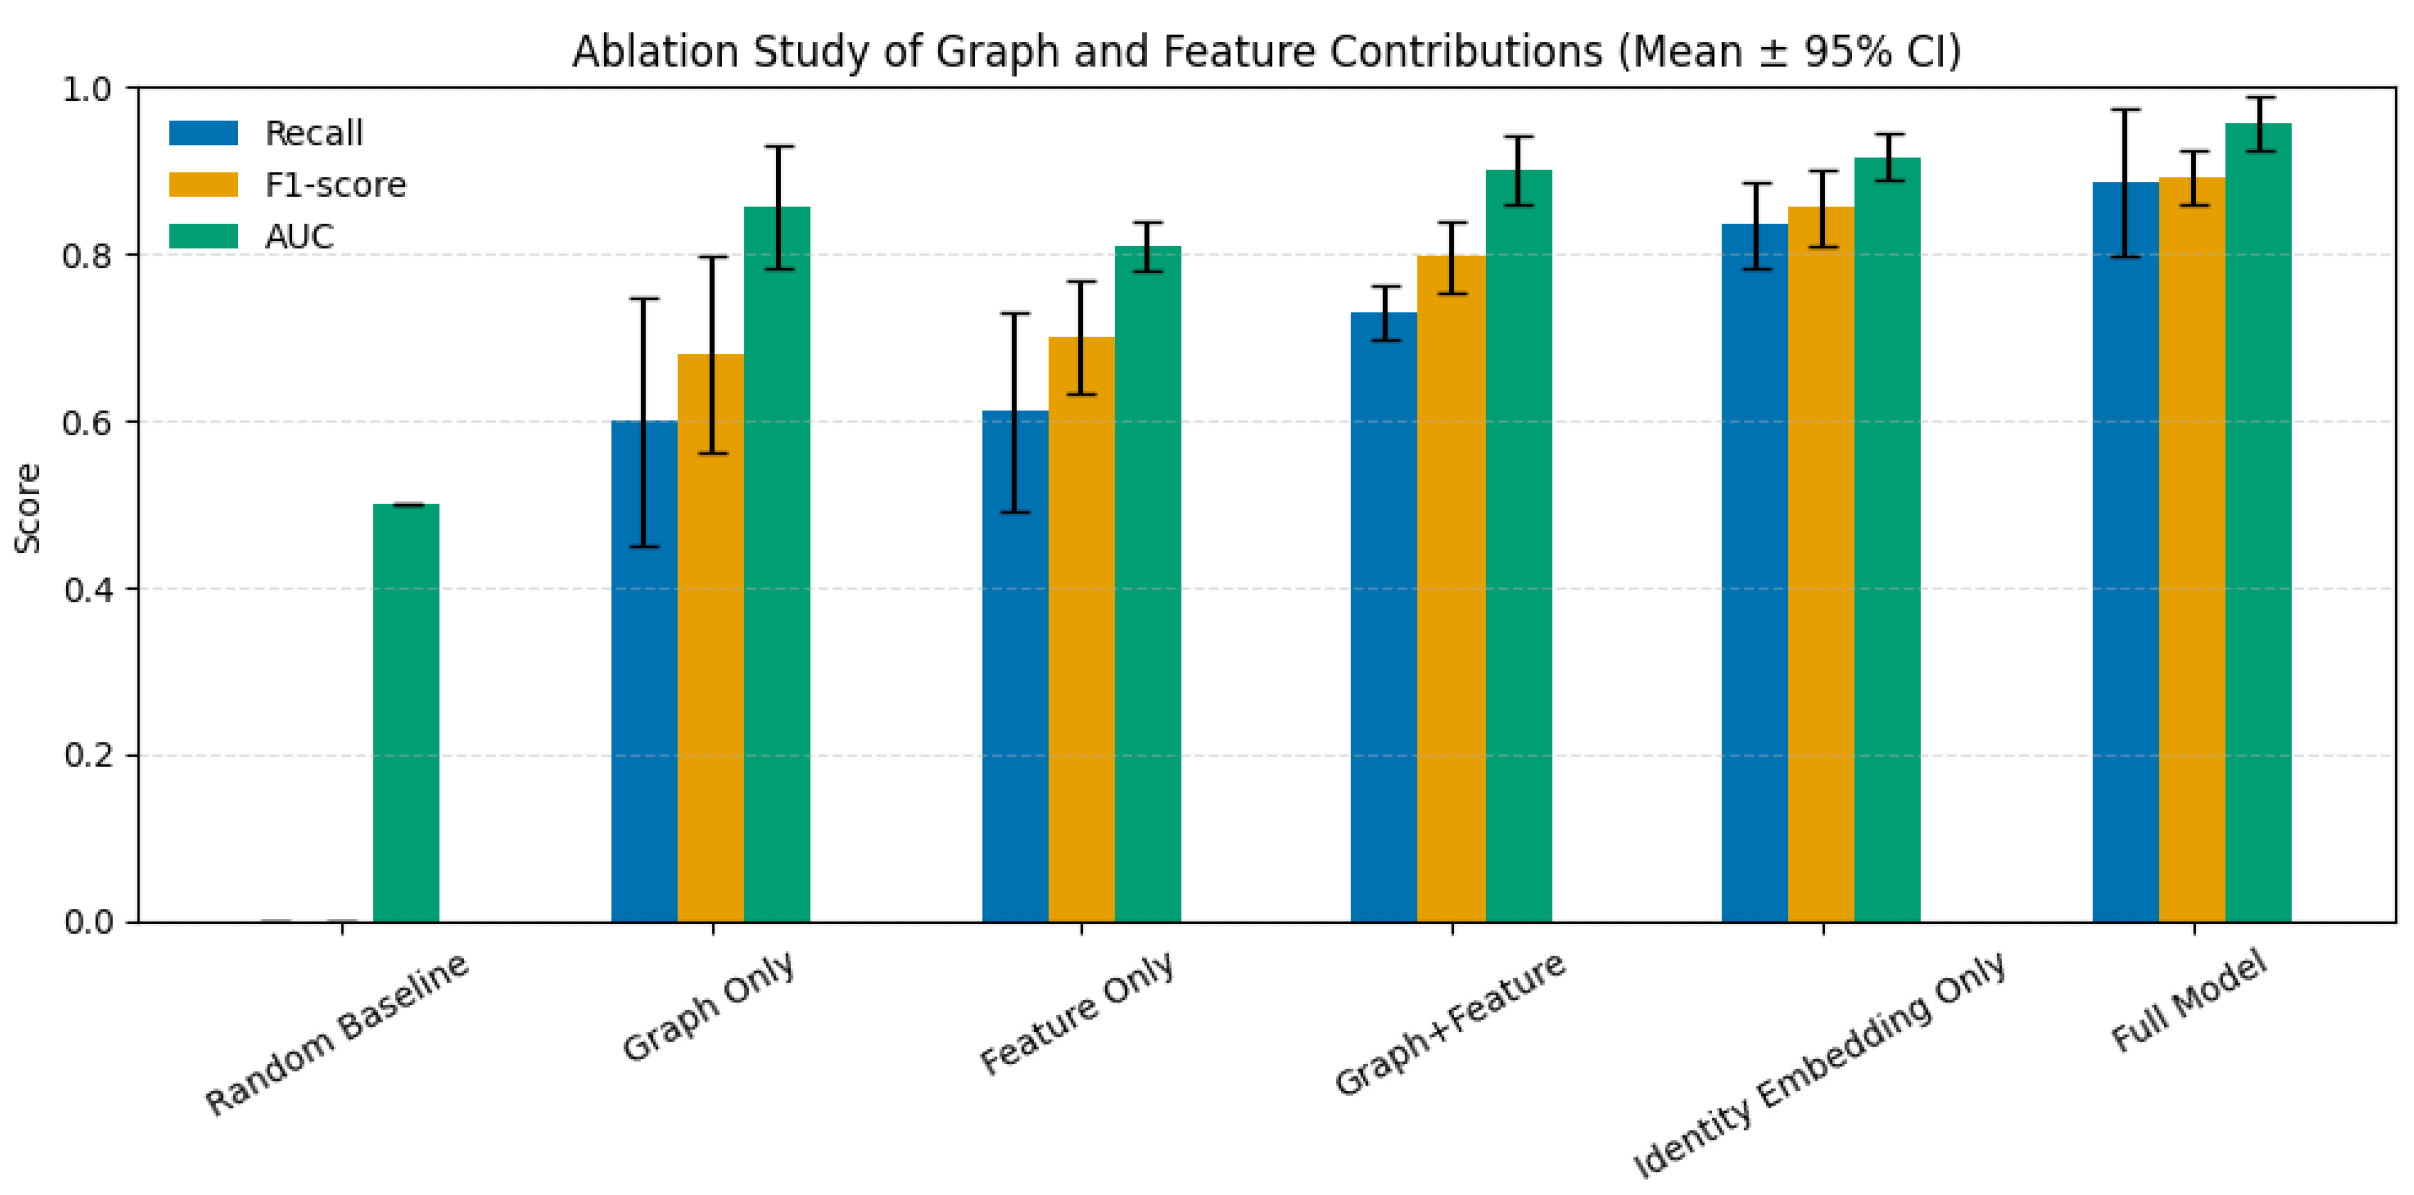
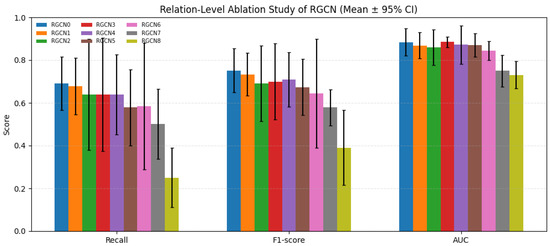
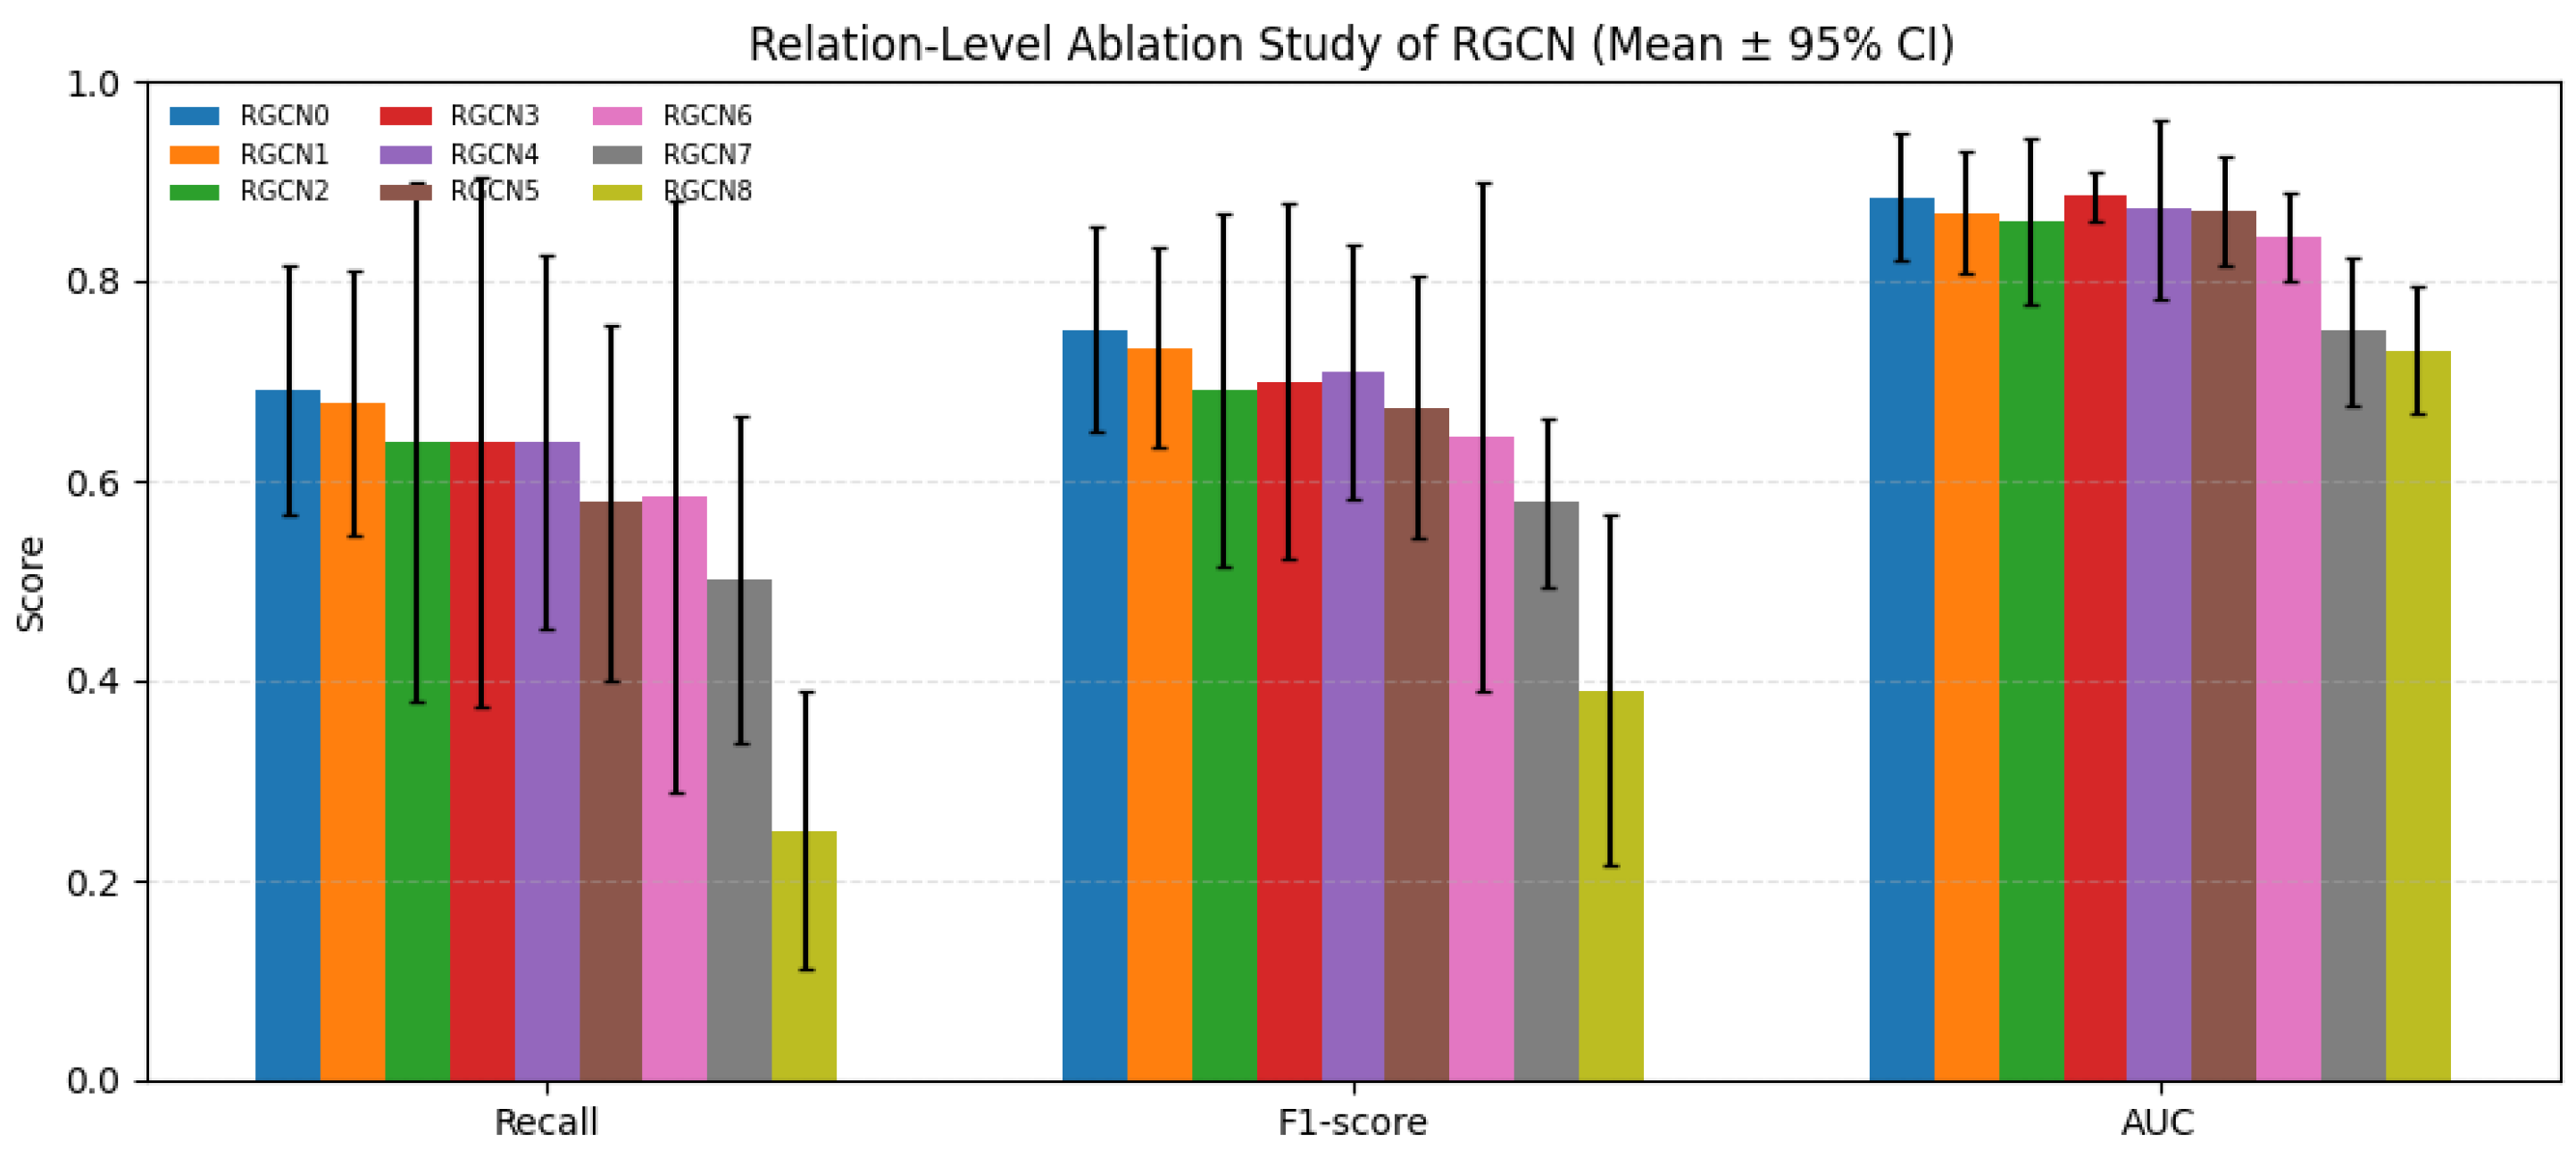
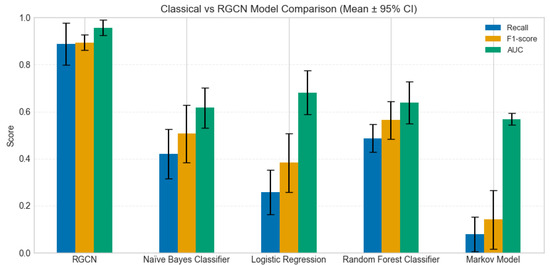
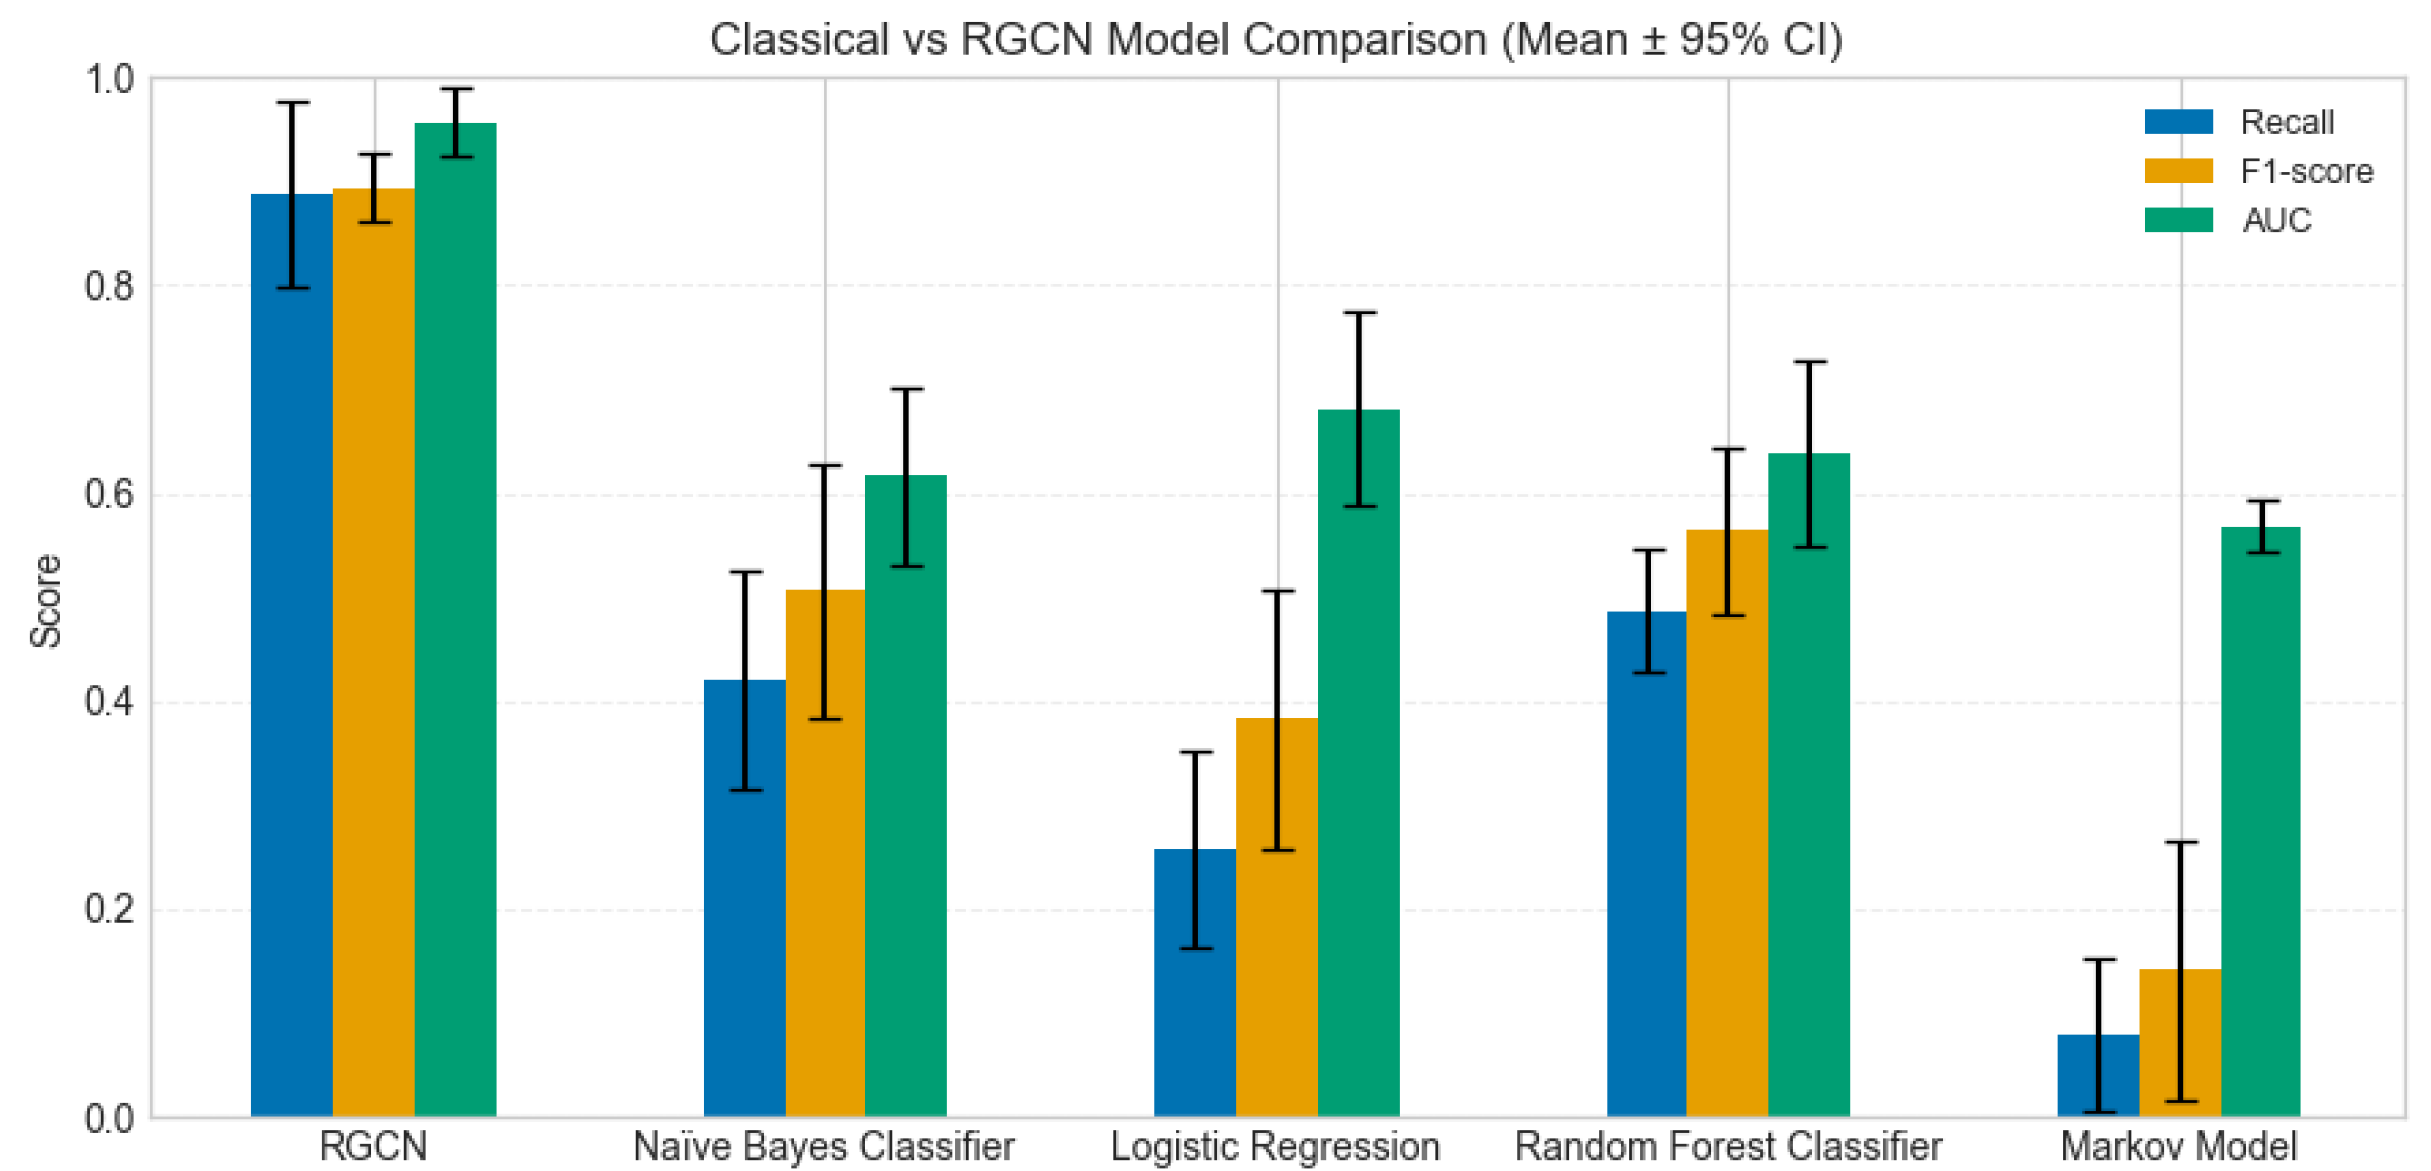
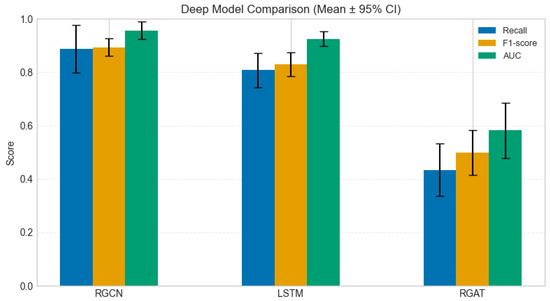
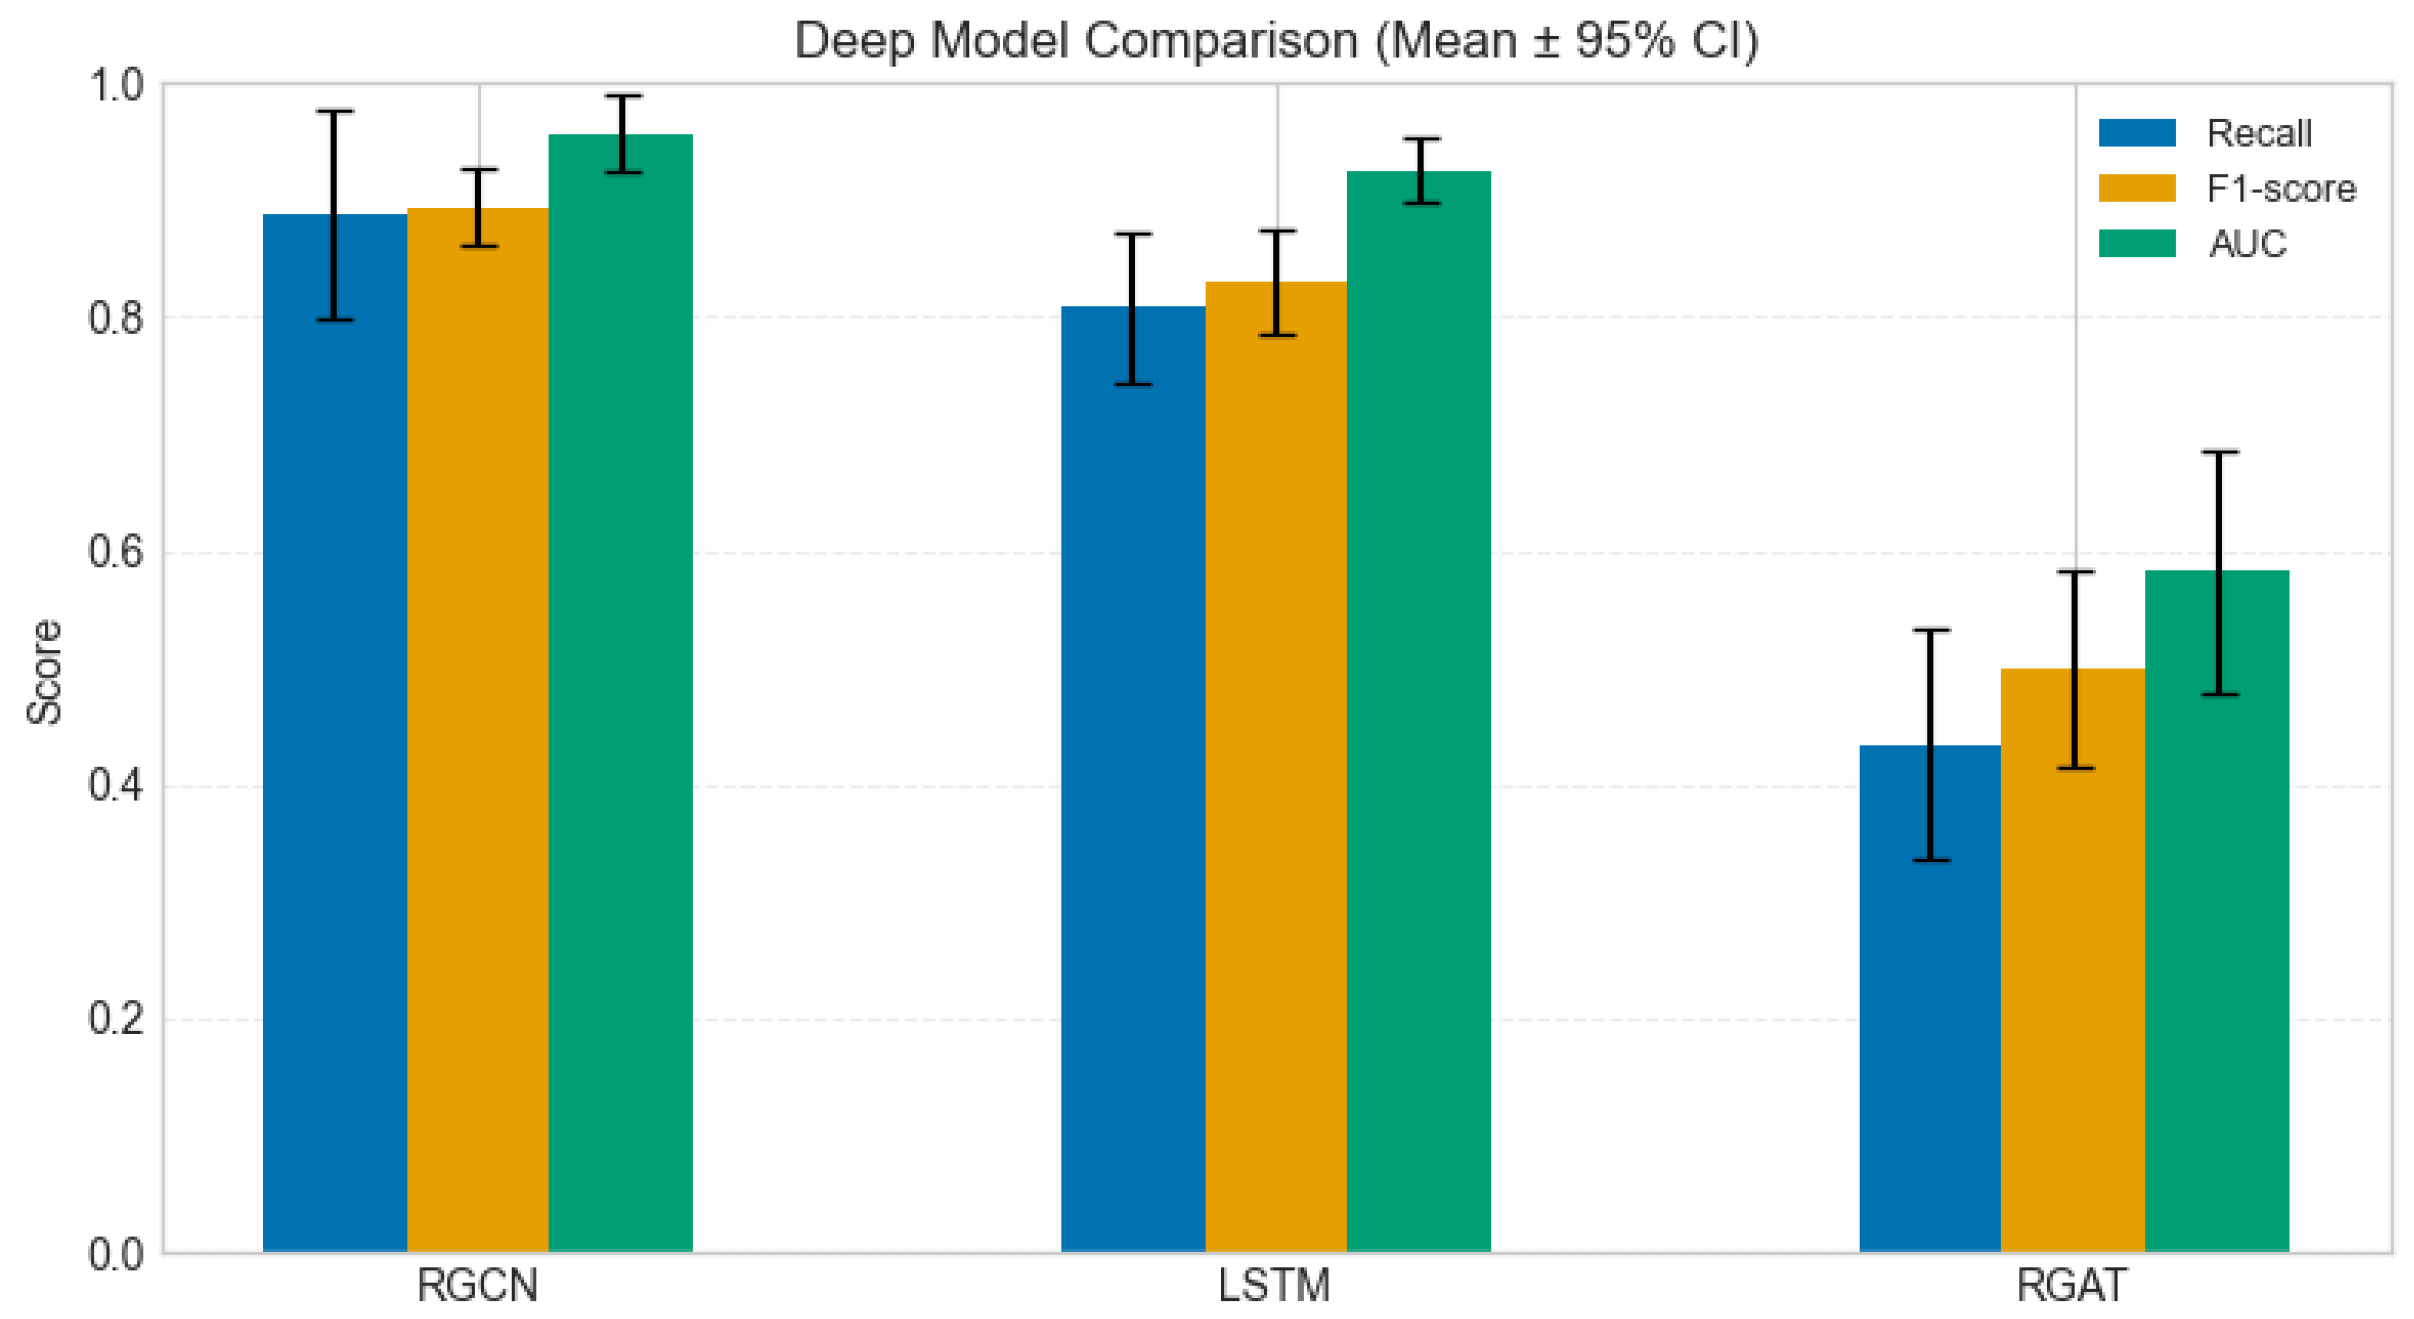

Disclaimer/Publisher’s Note: The statements, opinions and data contained in all publications are solely those of the individual author(s) and contributor(s) and not of MDPI and/or the editor(s). MDPI and/or the editor(s) disclaim responsibility for any injury to people or property resulting from any ideas, methods, instructions or products referred to in the content. |
© 2026 by the authors. Licensee MDPI, Basel, Switzerland. This article is an open access article distributed under the terms and conditions of the Creative Commons Attribution (CC BY) license.