


Abstract
Mangrove and coastal-forest vegetation can influence tsunami inundation by increasing hydraulic resistance along coastlines. This study evaluates Mangrove Disaster Capacity Protection (MDCP) in Bengkulu City as the difference in modelled inundation and associated economic exposure between alternative coastal-vegetation configurations under fixed tsunami forcing. The Cornell Multi-Grid Coupled Tsunami Model (COMCOT) was applied to a specified Mw 8.9 Mentawai–Pagai earthquake with five active nested grids and land-cover-dependent Manning resistance in the innermost domain. Three conditions were compared: removal of mapped coastal forests and mangroves (Scenario 1), their distribution in 2023 (Scenario 2), and expanded coastal vegetation (Scenario 3). Simulated citywide inundation covered 4698.60, 4655.78, and 4483.61 ha, respectively. The expanded-vegetation case reduced inundation by 214.99 ha (4.57%) compared with vegetation removal. Estimated exposure-based monetary consequences were USD 372.71–654.30 million in Scenario 1 and USD 341.77–591.92 million in Scenario 3, under lower and upper asset-valuation assumptions. The differences reflect a single design earthquake and simultaneous changes in mangroves and coastal forests, not measured structural damage or expected annual loss. The findings support a preliminary appraisal of coastal vegetation for risk reduction, subject to further validation, model-sensitivity analysis, ecological suitability assessment, and the costs of land conversion and long-term restoration.
1. Introduction
Mangrove forests can reduce the flow of tsunami water across coastal terrain by increasing hydraulic resistance [1]. We use the term Mangrove Disaster Capacity Protection (MDCP) to describe the potential contribution of mangrove and coastal-forest cover to reducing inundation and the exposure of economic assets. Coastal urbanization and land-cover change can affect ecosystem condition [2], while coastal protection is also influenced by the structure and functioning of the vegetation [3]. Ecosystem resilience [4] and vulnerability [5] are therefore relevant to the ability of coastal vegetation to provide protection. Field and numerical studies have examined mangrove forests [6] and other forms of coastal vegetation as components of disaster risk reduction.
Observations and modelling after the 2004 Indian Ocean tsunami documented the protective effect of mangroves in parts of Banda Aceh [7]. The 2018 Sunda Strait tsunami highlighted the exposure of coastal communities and fisheries in Pandeglang [8]. The effectiveness of mangrove vegetation varies with forest condition and stand structure [9], including forest width, stem density, and trunk dimensions [4]. These characteristics influence hydraulic resistance through surface roughness [10], which affects the movement of tsunami water across vegetated land.
Vegetation drag and wave attenuation depend on forest width, species composition, stand density, stem and root geometry, tree condition, water depth, and incident-wave characteristics [6,9,10,11,12,13,14,15].Their combined effect can be approximated using land-cover-dependent roughness, but a roughness class does not resolve individual trees or ecological performance. In this study, the three vegetation maps represent different spatial distributions of mangroves and coastal forests rather than different measured forest structures.
MDCP is treated here as a measurable protective service under a specified tsunami scenario, not as a new index of ecosystem health or recovery. This differs from ecological resilience, which concerns how an ecosystem resists and recovers from disturbance, and from ecosystem-based disaster risk reduction (Eco-DRR), which describes the use and management of ecosystems within risk-reduction strategies. The present analysis measures changes in inundation and economic exposure associated with combined mangrove and coastal-forest cover; it does not quantify ecosystem recovery, species-specific attenuation, or the independent benefit of mangroves [4,9,14,16].
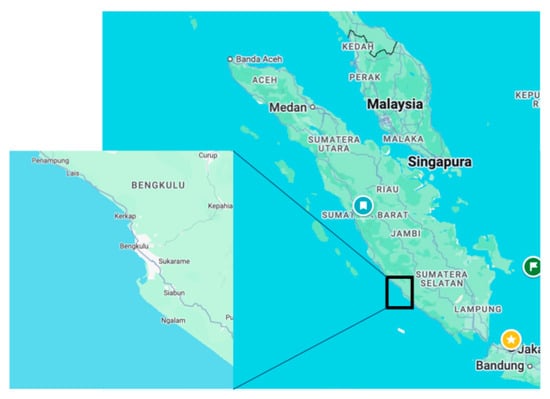
Bengkulu City occupies the western coast of Sumatra along the Indian Ocean (Figure 1), close to the Sunda subduction zone. The earthquake and tsunami of 12 September 2007 demonstrate the region’s exposure to large offshore seismic events [17,18,19]. Together with the concentration of settlements and infrastructure on low-lying coastal land, this hazard provides a strong basis for examining tsunami inundation and potential economic losses in the city [20,21].
Figure 1.
Research location in Bengkulu City.
We examine three vegetation configurations under a common Mw 8.9 earthquake source: (1) removal of mapped mangroves and coastal forests, (2) existing land cover in 2023, and (3) expansion of these vegetation types into selected non-residential areas. The objectives are to quantify differences in inundated areas, estimate corresponding changes in monetary exposure, and evaluate the strength and limitations of the evidence for vegetation-based tsunami protection. Scenario 3 is a hypothetical land-cover alternative, not the outcome of a formal spatial or economic optimization procedure.
The analysis is deterministic. The results represent the consequences of one specified tsunami-generating earthquake rather than frequency-weighted estimates of risk. Probabilistic tsunami hazard and risk assessment (PTHA/PTRA) would require earthquake occurrence rates, multiple source realizations, uncertainty in inundation, and calibrated asset vulnerability. Behrens et al. [22] review these uncertainties, while Triantafyllou et al. [23] examine probabilistic consequences derived from incomplete historical impact records. The distinction is explained in Section 2.4.
We combine COMCOT simulations, geographic information system (GIS, Esri, Redlands, CA, USA) overlays, and sector-specific valuation to compare the inundation and potential economic consequences of alternative coastal-vegetation maps. The key contribution is a transparent, event-conditioned comparison for Bengkulu City, together with an assessment of spatial variability, interpretation of monetary outcomes, and the practical information needed to evaluate the feasibility of coastal restoration [9,14,15,16].
2. Materials and Methods
2.1. Study Area
Bengkulu City, on the western coast of Sumatra, was selected because of its exposure to tsunamis and the concentration of people and economic assets in coastal areas [20,21]. The assessment covers the city’s nine administrative sub-districts, including six that border the sea.
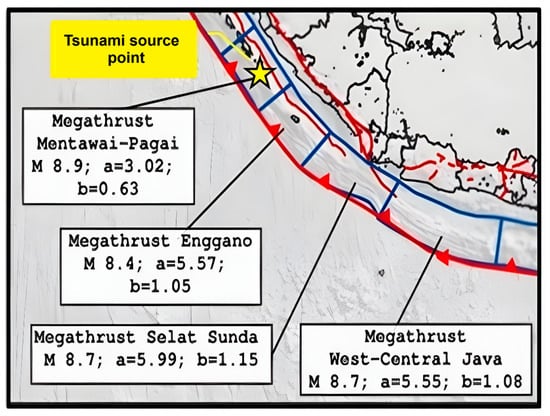
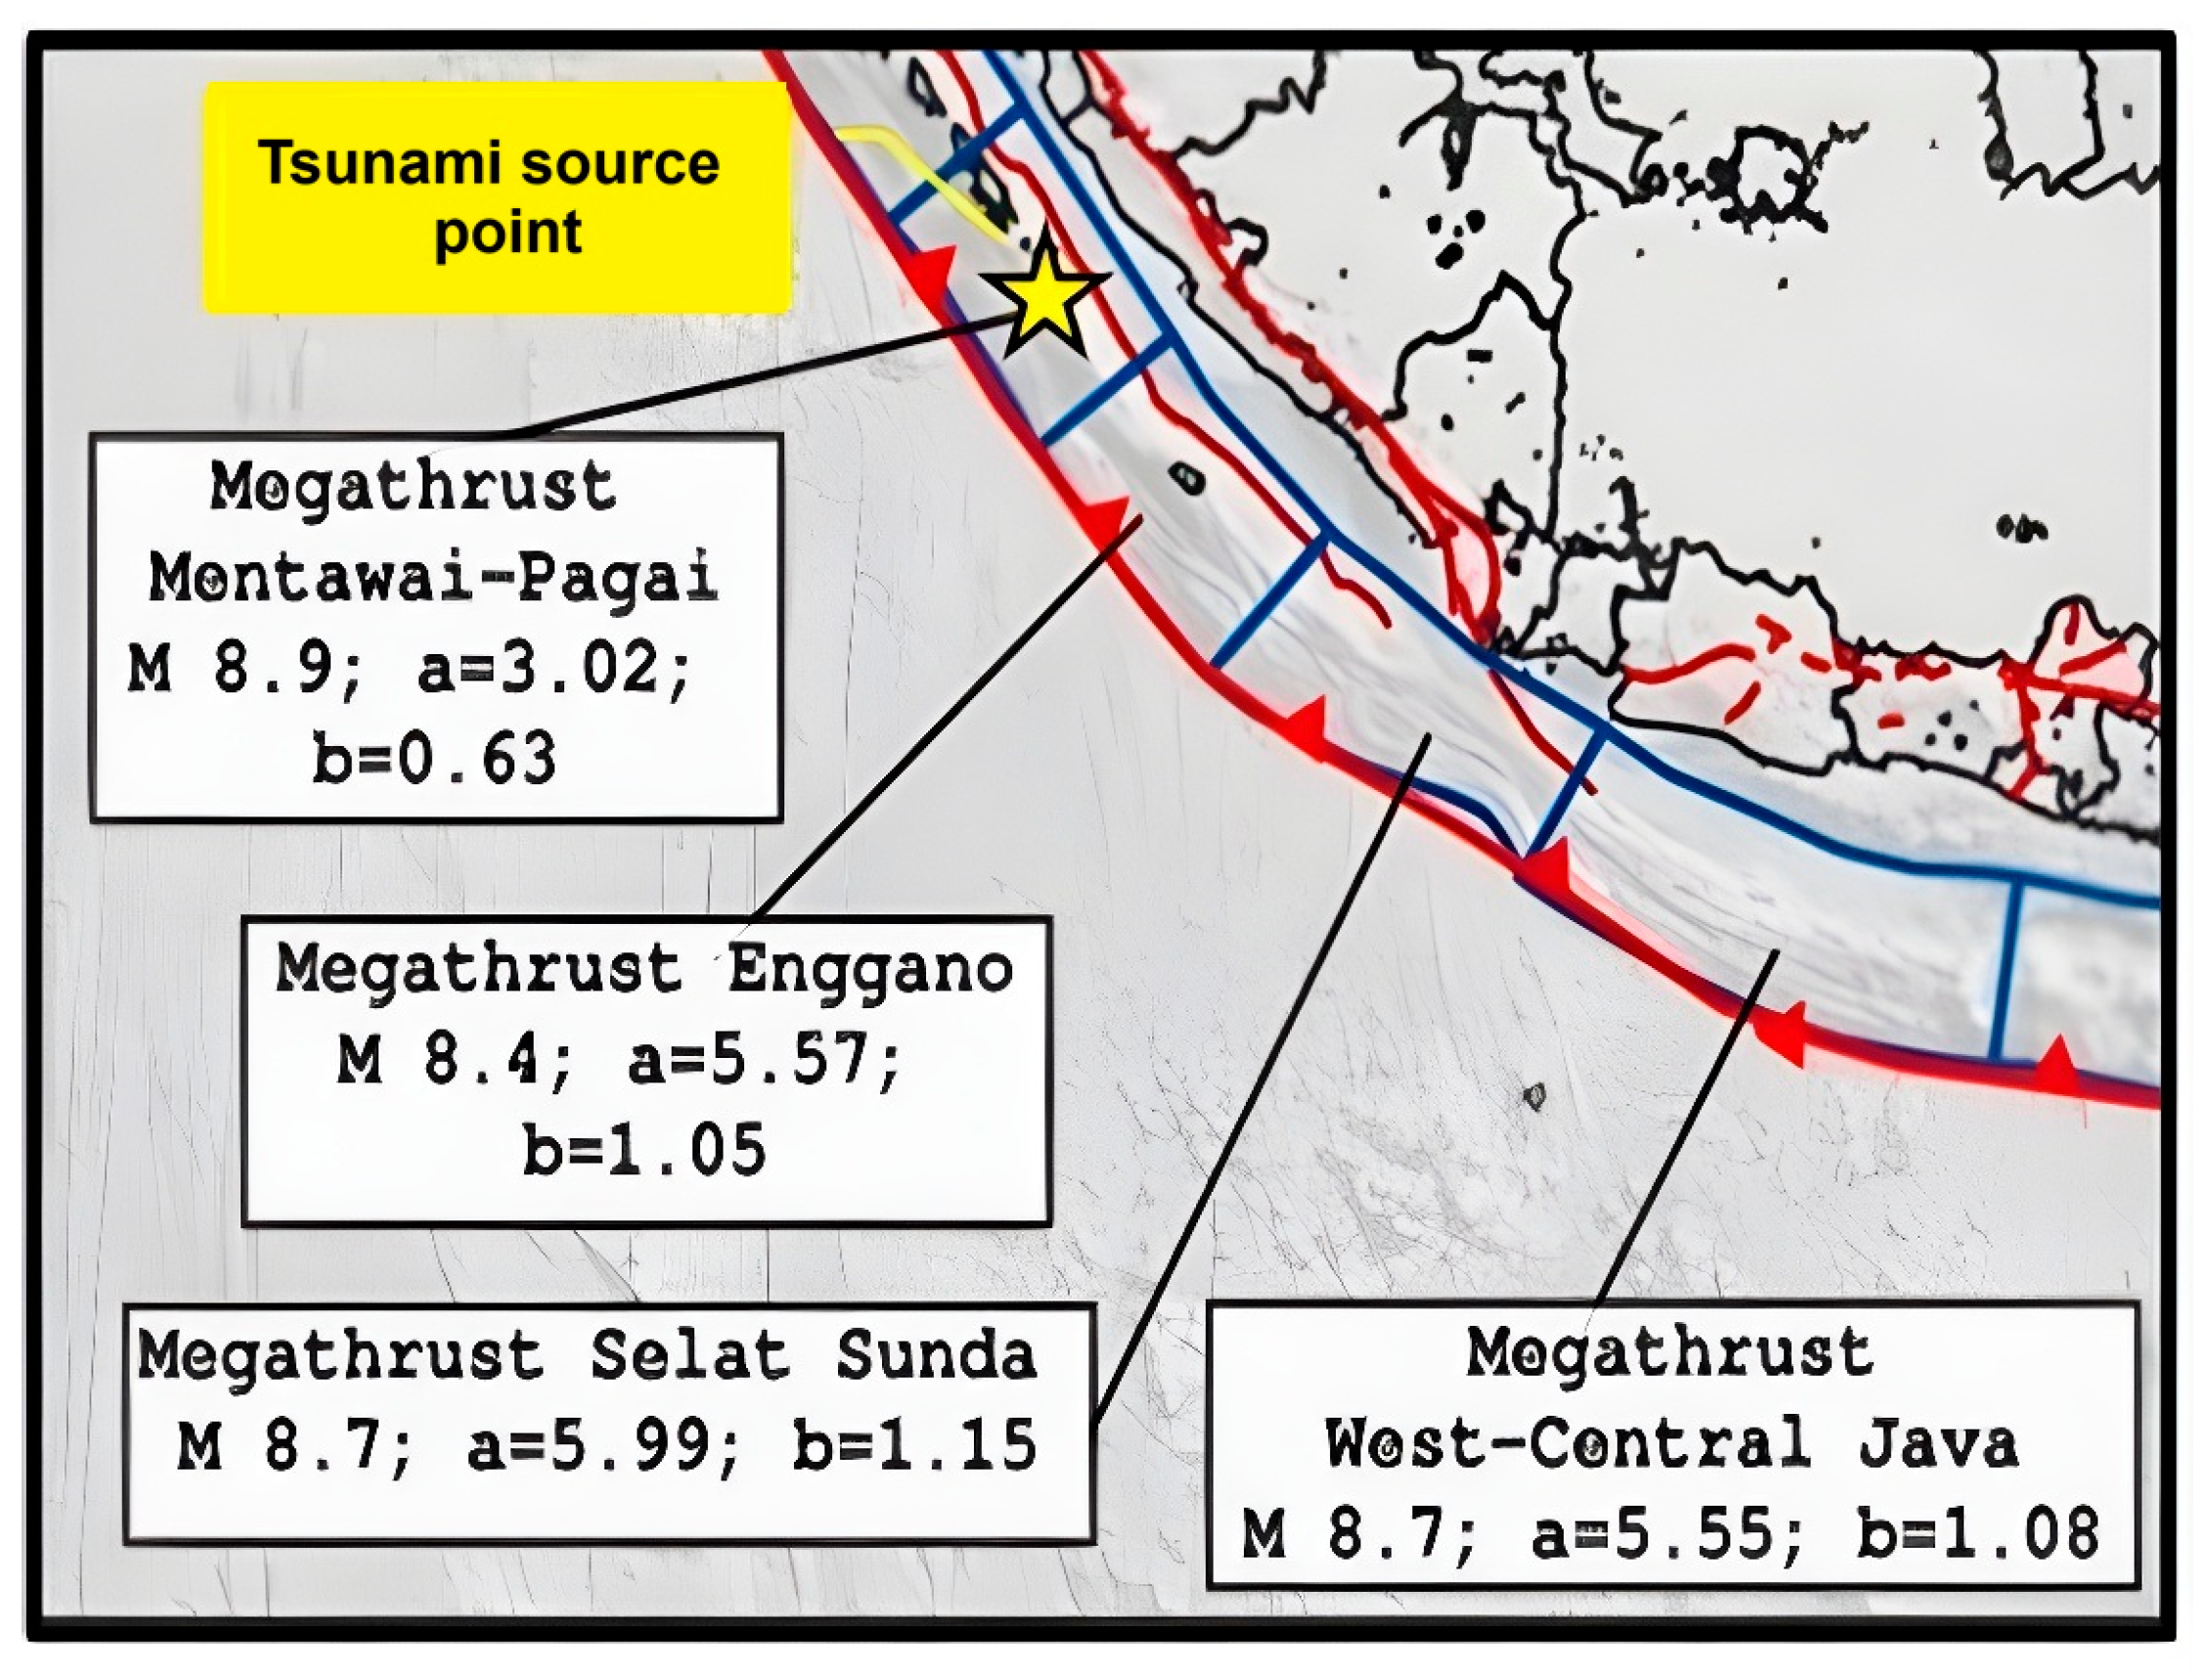
The city lies approximately between 3°43′37″ and 3°56′41″ S and between 102°14′49″ and 102°24′21″ E. Figure 1 shows its coastal location and administrative setting. The offshore source region used for the tsunami simulations is shown separately in Figure 2.
Figure 2.
Mentawai–Pagai megathrust and the location of the tsunami-source reference point (yellow star) used to illustrate the Mw 8.9 simulation scenario (Base map reproduced from Pusat Studi Gempa Nasional, 2017 [24]).
2.2. MDCP: Conceptual Definition and Operational Measures
For this study, MDCP denotes the scenario-dependent protection provided by mapped mangroves and coastal forests against the consequences of a specified tsunami event. It is operationalized as the difference in inundation footprint and exposure-based monetary consequence between a vegetation reference scenario and an alternative land-cover scenario, with earthquake forcing held constant. It is therefore an outcome-based comparison rather than an independent ecological resilience score or a validated mangrove-specific index [4,9,14,16].
The assessment follows four steps. First, land-cover classes define spatially varying surface-roughness inputs for COMCOT. Second, each hydrodynamic simulation produces a tsunami inundation footprint. Third, the footprints are intersected with land-cover and road-network asset layers, and exposed areas or lengths are valued using sector-specific coefficients. Fourth, inundation and monetary outcomes are compared between land-cover scenarios. COMCOT does not itself calculate economic damage, and the valuation method does not feed back into tsunami propagation.
Let A denote the simulated inundated area and L the total indicative monetary consequence. For a reference scenario b and comparison scenario s, the absolute change in inundation is A(b) minus A(s), and the percentage change is 100 times that difference divided by A(b). Similarly, avoided monetary exposure is L(b) minus L(s), calculated separately for the lower and upper asset-valuation assumptions. Positive differences mean smaller modelled inundation or monetary exposure under the comparison scenario; they are not measures of annual probability, wave-energy dissipation, or net restoration benefit.
2.3. COMCOT Configuration, Tsunami Source, and Spatial Inputs
Tsunami propagation and inundation were simulated with the Cornell Multi-Grid Coupled Tsunami Model (COMCOT), a finite-difference shallow-water model [25,26,27,28]. The modelling framework uses spherical spatial coordinates and combines seabed relief, topography, a seismic deformation source, and land-cover-dependent hydraulic roughness. The Mentawai–Pagai megathrust was selected for a design earthquake of Mw 8.9, consistent with the 2017 Indonesian earthquake source and hazard map [24]. Source characteristics were kept identical in all three simulations to distinguish the effects of the alternative vegetation maps from changes in seismic forcing.
The specified source geometry comprised a focal depth of 35 km, rupture length of 260 km, rupture width of 180 km, slip of 15.34 m, strike of 323°, dip of 12°, and rake of 110.03°. The reference source point was located at 3.72° S and 100.72° E and is illustrated by the yellow star in Figure 2. The three simulations used the same magnitude, fault geometry, and source position. Strike, dip, rake, depth, slip, and rupture dimensions were not varied independently, so the model contrasts cannot be interpreted as an exploration of seismic-source uncertainty.
Topographic input was derived from the Indonesian National Digital Elevation Model (DEMNAS), and offshore bathymetry from the Indonesian National Bathymetric Dataset (BATNAS), both maintained by the Geospatial Information Agency (BIG; https://tanahair.indonesia.go.id/). The datasets were transformed and spatially prepared in ArcGIS Pro version 3.5.0 (Esri, Redlands, CA, USA) [29,30]. In the COMCOT control-file configuration, the calculation begins from a cold start (t = 0 s), lasts 10,800 s (3 h), and specifies a 60 s snapshot interval. The source is represented by one fault plane, with five active, spherical nested grids; their geographical extents and equation/friction settings are listed in Table 1. The outermost grid uses a 1 arcmin spacing and a 2 s time step, with 3:1 refinement between successive grids. The boundary-condition field is set to the pair “1, 0”, denoting absorbing and open conditions in the file’s legend. Because boundary locations are not separately identified in that field, the particular edges assigned each treatment cannot be confirmed from the control file alone.
Table 1.
Active COMCOT nested grids and governing-equation and friction settings for the Bengkulu model configuration.
The first four nested layers refer to BATNAS_SUMATRA_PRJ.asc, whereas the finest layer refers to dembat_tes1.asc for the higher-resolution topobathymetry. The five nominal grid spacings implied by the control-file refinement settings are 1, 1/3, 1/9, 1/27, and 1/81 arcmin, respectively; the finest corresponds to approximately 23 m in the east–west direction near Bengkulu. Grids 1–4 solve the linear shallow-water equations without bottom friction, while grid 5 uses the nonlinear equations with spatially variable Manning resistance. This refinement is a model setting, not evidence of a completed grid-convergence test.
The 2023 land-cover classification used Landsat 8 OLI/TIRS Collection 2 Level-2 imagery processed in Google Earth Engine [31,32]. Earthquake-source information was obtained from the Global CMT Project (https://www.globalcmt.org/; accessed on 28 August 2024) and BMKG’s Earthquake and Tsunami Centre (https://inatews.bmkg.go.id/; https://data.bmkg.go.id/gempabumi/; accessed on 28 August 2024) [33]. The numerical simulations were conducted using a COMCOT implementation provided by the Indonesian Agency for Meteorology, Climatology, and Geophysics (BMKG). The supplied model configuration follows a control-file structure consistent with the COMCOT version 1.7 [28]. The land-cover categories were converted to spatially varying Manning-resistance inputs, as specified in Table 2; vegetation characteristics such as stem diameter and root density were not modelled separately.
Table 2.
Land-cover-based Manning roughness coefficients used to construct the alternative coastal-vegetation scenarios (source: BNPB, 2018 [34]).
Land-cover classes were translated into class-specific Manning roughness coefficients following the BNPB (2018) values listed in Table 2 [34]. The coefficients range from 0.007 for water to 0.070 for natural and coastal forests; values for mangroves, open land, and aquaculture ponds are 0.060, 0.015, and 0.010, respectively. The finest grid activates the spatially variable Manning-friction option (switch 2), while bottom friction is disabled in the outer four grids (switch 1). The value 0.013 also appears in the control-file template but corresponds to its separate uniform-friction option, which was not selected for the innermost grid. This representation changes bed-resistance parameters according to land-cover class; it does not directly resolve vegetation density, forest width, stem diameter, roots, or forest failure. Scenario-specific friction rasters would be necessary to reconstruct the applied cell-by-cell resistance fields.
The thematic accuracy of the 2023 Landsat-derived land-cover map was assessed using 330 reference points, with 30 points allocated to each of 11 land-cover classes and interpreted from field observations and Google Earth images. The overall classification accuracy was 85.15%, and a kappa coefficient of 0.8511 was reported for the classification. This assessment addresses land-cover mapping; it does not validate COMCOT water levels, flow velocities, arrival times, or inundation footprints. Independent comparisons of the simulated Mw 8.9 event with observed run-up, tide-gauge records, or inundation marks were not available.
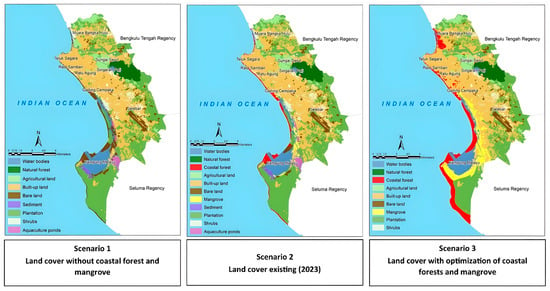
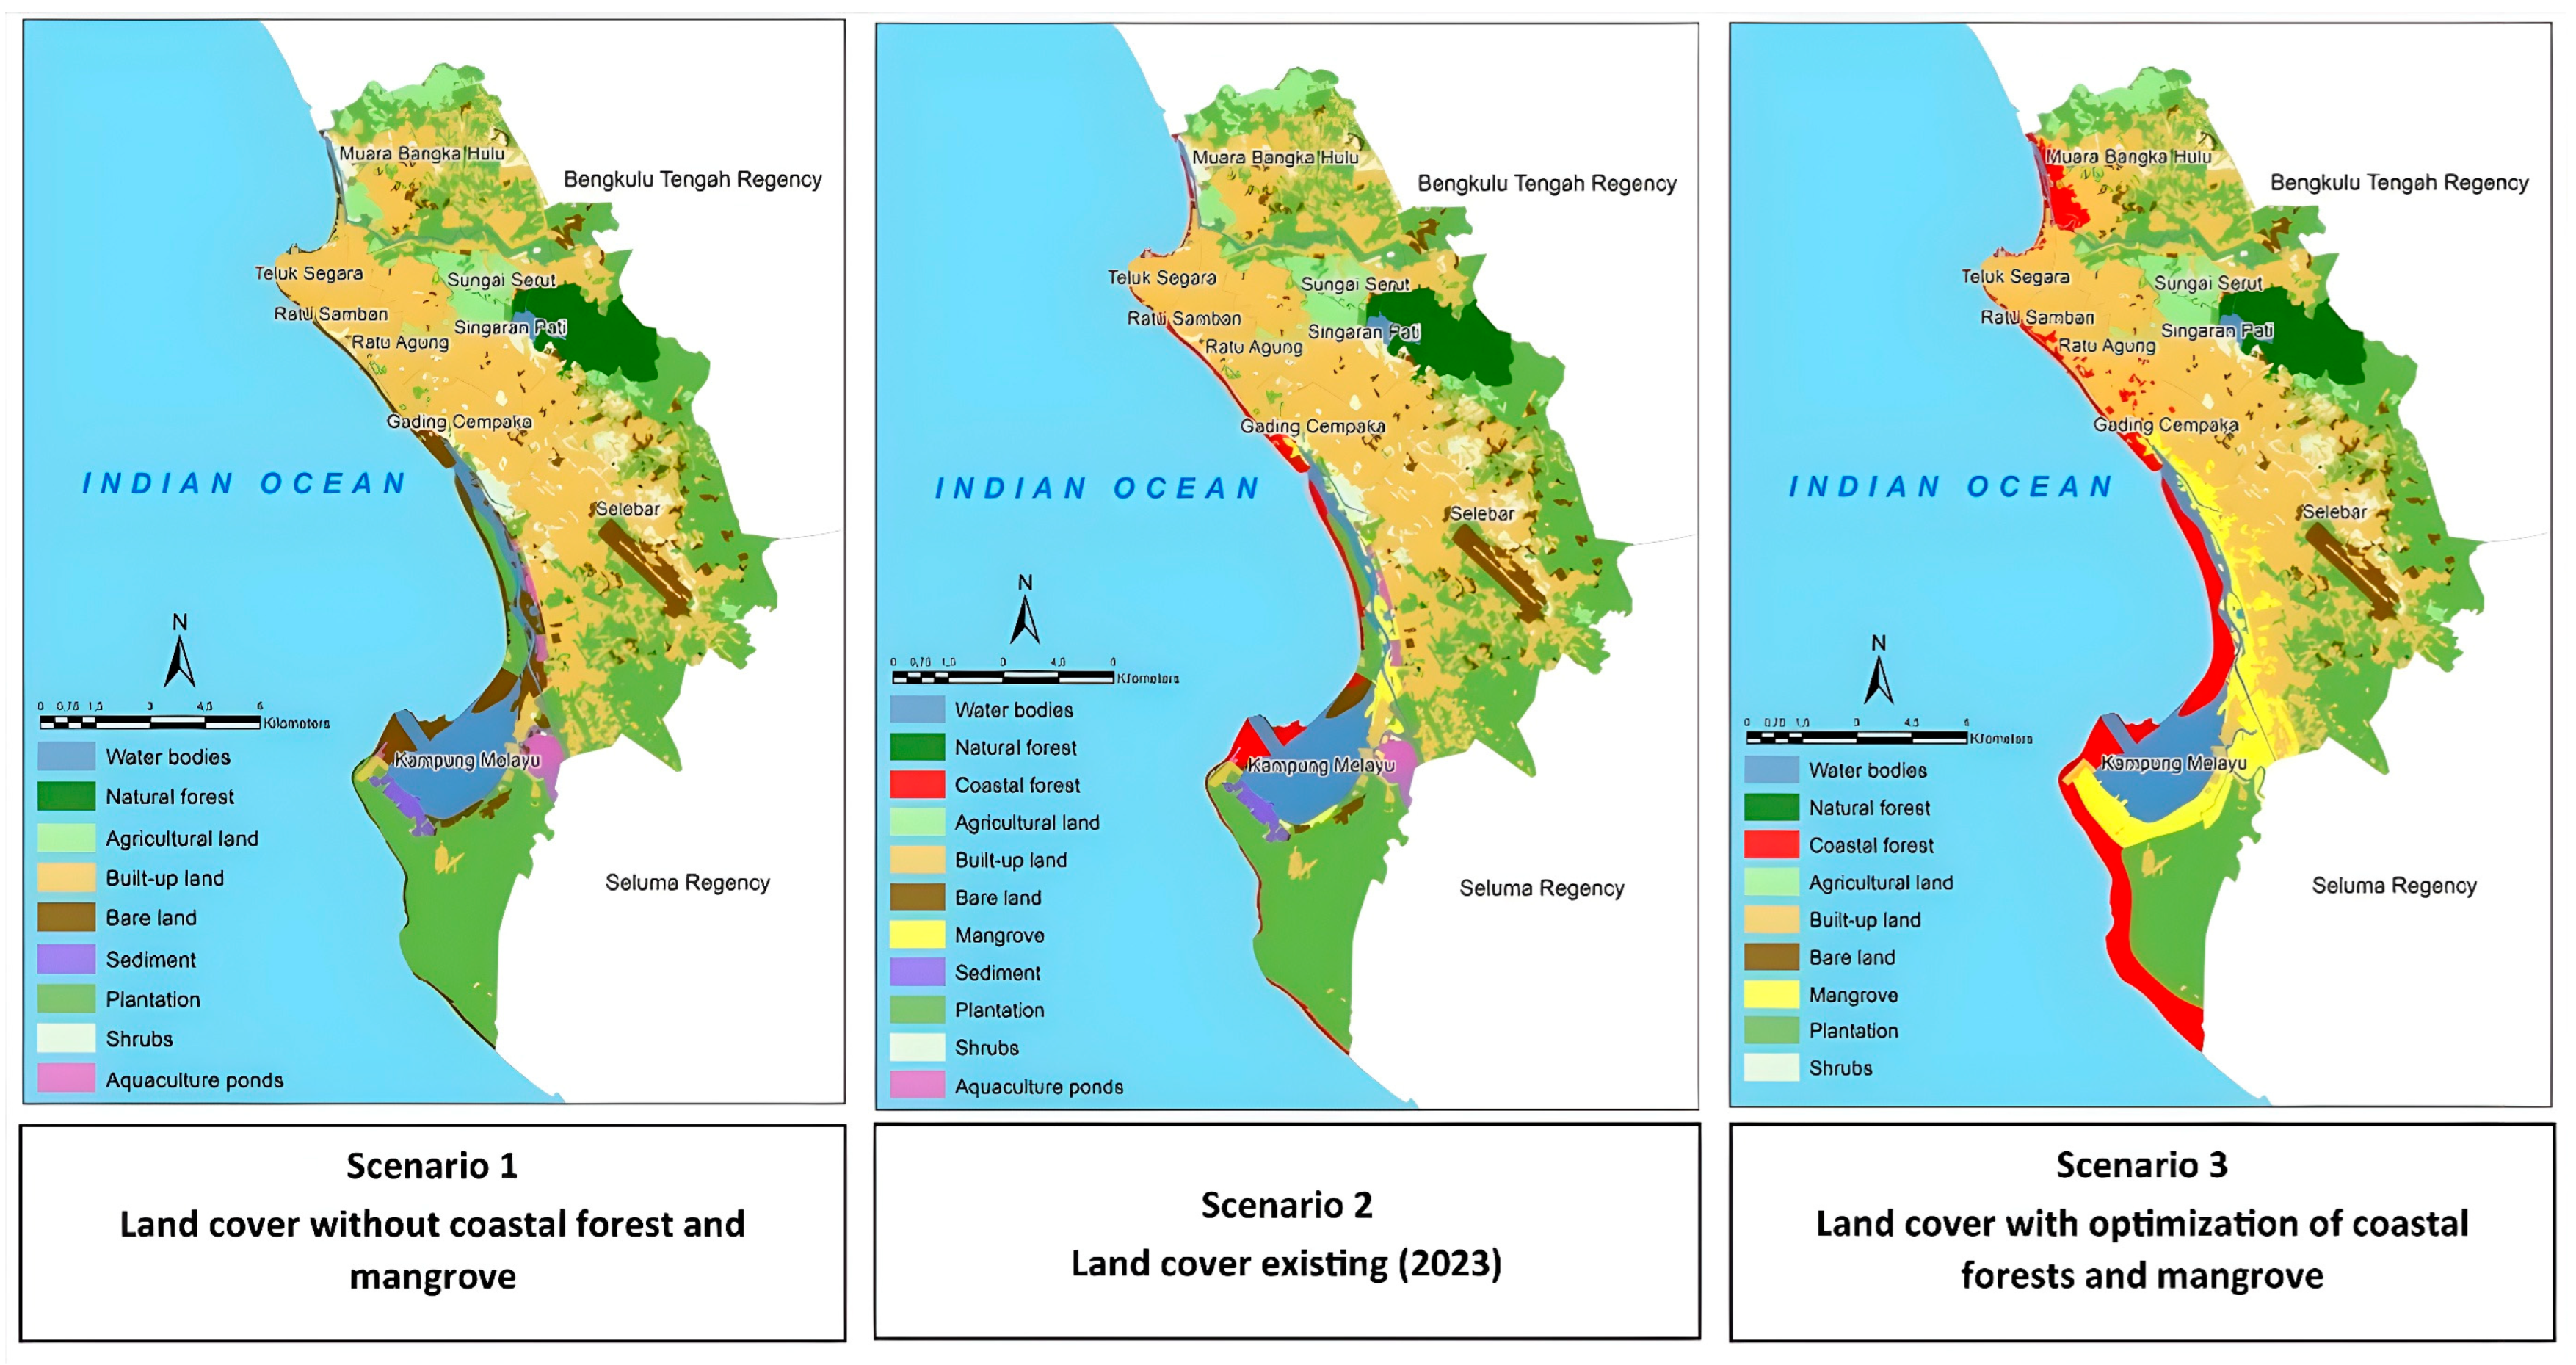
Three land-cover configurations were compared (Table 2 and Table 3; Figure 3). Scenario 1 removes mapped coastal forest (340.23 ha) and mangroves (189.78 ha) from the hydraulic roughness map by assigning those cells to open land. Under the class-based assumptions in Table 2, these conversions replace forest and mangrove coefficients of 0.070 and 0.060 with an open-land coefficient of 0.015. Scenario 2 retains the 2023 classification. Scenario 3 expands coastal forest from 340.23 to 1182.73 ha and mangroves from 189.78 to 1036.58 ha, with additions of 842.50 and 846.80 ha, respectively. Selected portions of agricultural land, plantations, bare sand, shrubs, open land, and all 165.37 ha of mapped ponds are converted. These changes are hypothetical map adjustments, not vegetation growth measured in the field or a completed ecological suitability optimization. Because mangroves and coastal forests are altered simultaneously, their individual hydraulic effects cannot be separated.
Table 3.
Land-cover area (ha) in the three vegetation scenarios (mapped areas rounded to 0.01 ha).
Figure 3.
Spatial model of land cover for each scenario.
2.4. Deterministic Scenario Scope and Probabilistic Risk Considerations
The three COMCOT simulations vary the spatial distribution of roughness while retaining the same earthquake source and other specified inputs. They therefore provide conditional comparisons, not a probabilistic ensemble. For the economic assessment, lower and upper cases vary assumed asset values and production intensities; they are valuation alternatives rather than statistical confidence intervals, seismic probabilities, or formal model-sensitivity bounds.
A probabilistic extension would require a regional source catalogue with occurrence rates, alternative earthquake magnitudes and geometries, and propagation of hazard uncertainty through inundation and asset vulnerability [22,23]. Those data and simulations were not part of this assessment. The estimated differences describe the selected design event and should not be annualized or treated as predictions of future damage frequency.
2.5. GIS-Based Exposure and Economic Consequence Assessment
For each vegetation configuration, the simulated inundation footprint from COMCOT was overlaid in GIS with mapped land-cover assets and road networks. Inundated asset area (ha) and exposed road length (m) were multiplied by sector-specific unit values to obtain lower and upper monetary consequences. The two monetary bounds represent alternative estimates of asset value or production, applied to the same simulated hazard footprint. This is an ECLAC-informed, exposure-based screening approach: COMCOT provides the physical inundation field, whereas GIS overlays and valuation assumptions provide the monetary assessment [35,36]. COMCOT does not calculate economic damage, and the economic estimates do not change the simulated tsunami. Although the MCDA literature informs the inclusion of relevant economic sectors [37], no weighted MCDA index enters the monetary totals. Because depth-dependent damage ratios and asset fragility functions were not applied, exposure of an asset does not establish that its full nominal value would actually be destroyed.
The monetary inputs include building values and assumed building densities, agricultural and aquaculture production values, indicative carbon-stock valuations for vegetation, and reference road costs. ECLAC distinguishes damage to asset stocks from losses to economic flows; the present totals combine exposure-based approximations of both and should not be interpreted as a complete post-disaster DaLA appraisal [35]. All USD equivalents use the analytical conversion of IDR 15,000 per USD. Scenario 3 also displaces some productive uses, particularly aquaculture, plantations, and agriculture. Lost production, land acquisition, planting, ecosystem establishment, maintenance, and livelihood compensation were not deducted from the estimated avoided losses; no net benefit–cost ratio or investment return is reported [38,39,40,41,42,43,44].
2.6. Validation and Treatment of Uncertainty
Uncertainty was considered at three levels. First, earthquake-source and hydrodynamic uncertainty were not quantified because source-parameter ensembles, tests of alternative Manning coefficients, and grid-convergence experiments were not performed. Second, classification accuracy was assessed using 330 reference points, but errors in the land-cover map were not propagated into the spatial roughness fields and resulting inundation. Third, lower and upper asset values reflect economic assumptions and cannot be interpreted as confidence intervals around hazard or damage. Although the control-file geometry and categorical Manning coefficients are now specified in Section 2.3 and Table 1 and Table 2, independent reproduction requires the exact scenario-dependent roughness rasters, grids, and model outputs.
The reported 85.15% thematic accuracy assesses land-cover interpretation only. No observed tsunami water-level or inundation dataset was used here to estimate predictive error, and the modelled inundation differences have no formal sensitivity interval. Interpretation of the results is therefore restricted to the specified source and resistance assignments; it does not support attribution of the residual differences to vegetation type or model parameters independently.
3. Results
3.1. Coastal Land Cover
Table 3 presents the land-cover composition imposed in the three simulations, each covering approximately 15,777.27 ha. Small residual differences between the summed rounded classes and the reported total reflect rounding, not a change in the study boundary. Scenario 3 is a hypothetical expansion of coastal vegetation rather than a field-verified restoration outcome.
Surface roughness varies among land-cover classes and influences the propagation of tsunami water across coastal terrain. Figure 3 shows the three maps used to represent vegetation removal, the 2023 baseline, and expanded coastal vegetation. Only the land-cover/roughness distribution changed between simulations; earthquake-source parameters were fixed [10,22].
Scenario 1 (vegetation removed): coastal forest (340.23 ha) and mangrove cover (189.78 ha) were reclassified as open land. The open-land category consequently increased from 649.43 to 1179.44 ha, while the other categories retained their baseline area. This scenario provides a counterfactual condition in which these two coastal-vegetation types are absent.
Scenario 2 (2023 baseline): the classification mapped 340.23 ha of coastal forest and 189.78 ha of mangroves. This distribution represents present mapped vegetation, but the land-cover classes do not provide direct measures of tree species, stem density, root morphology, health, or cross-shore forest width.
Scenario 3 (expanded coastal vegetation): coastal forest reaches 1182.73 ha and mangroves 1036.58 ha through hypothetical conversion of selected non-residential land (Table 3). Compared with Scenario 2, the combined mapped area of these vegetation types increases by 1689.30 ha, equivalent to 10.71 percentage points of the 15,777.27 ha study area. This represents a substantial land-use change rather than a minor adjustment. Its ecological suitability, social acceptability, maintenance requirements, and costs were not independently tested, so the configuration should not be described as an optimal restoration plan.
3.2. Inundation Exposure
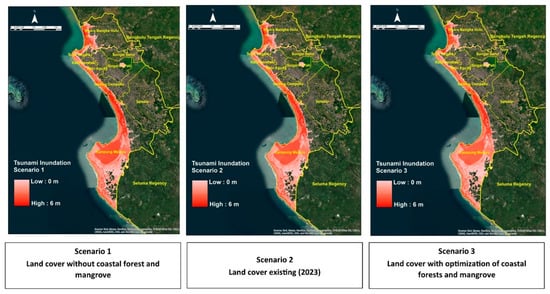
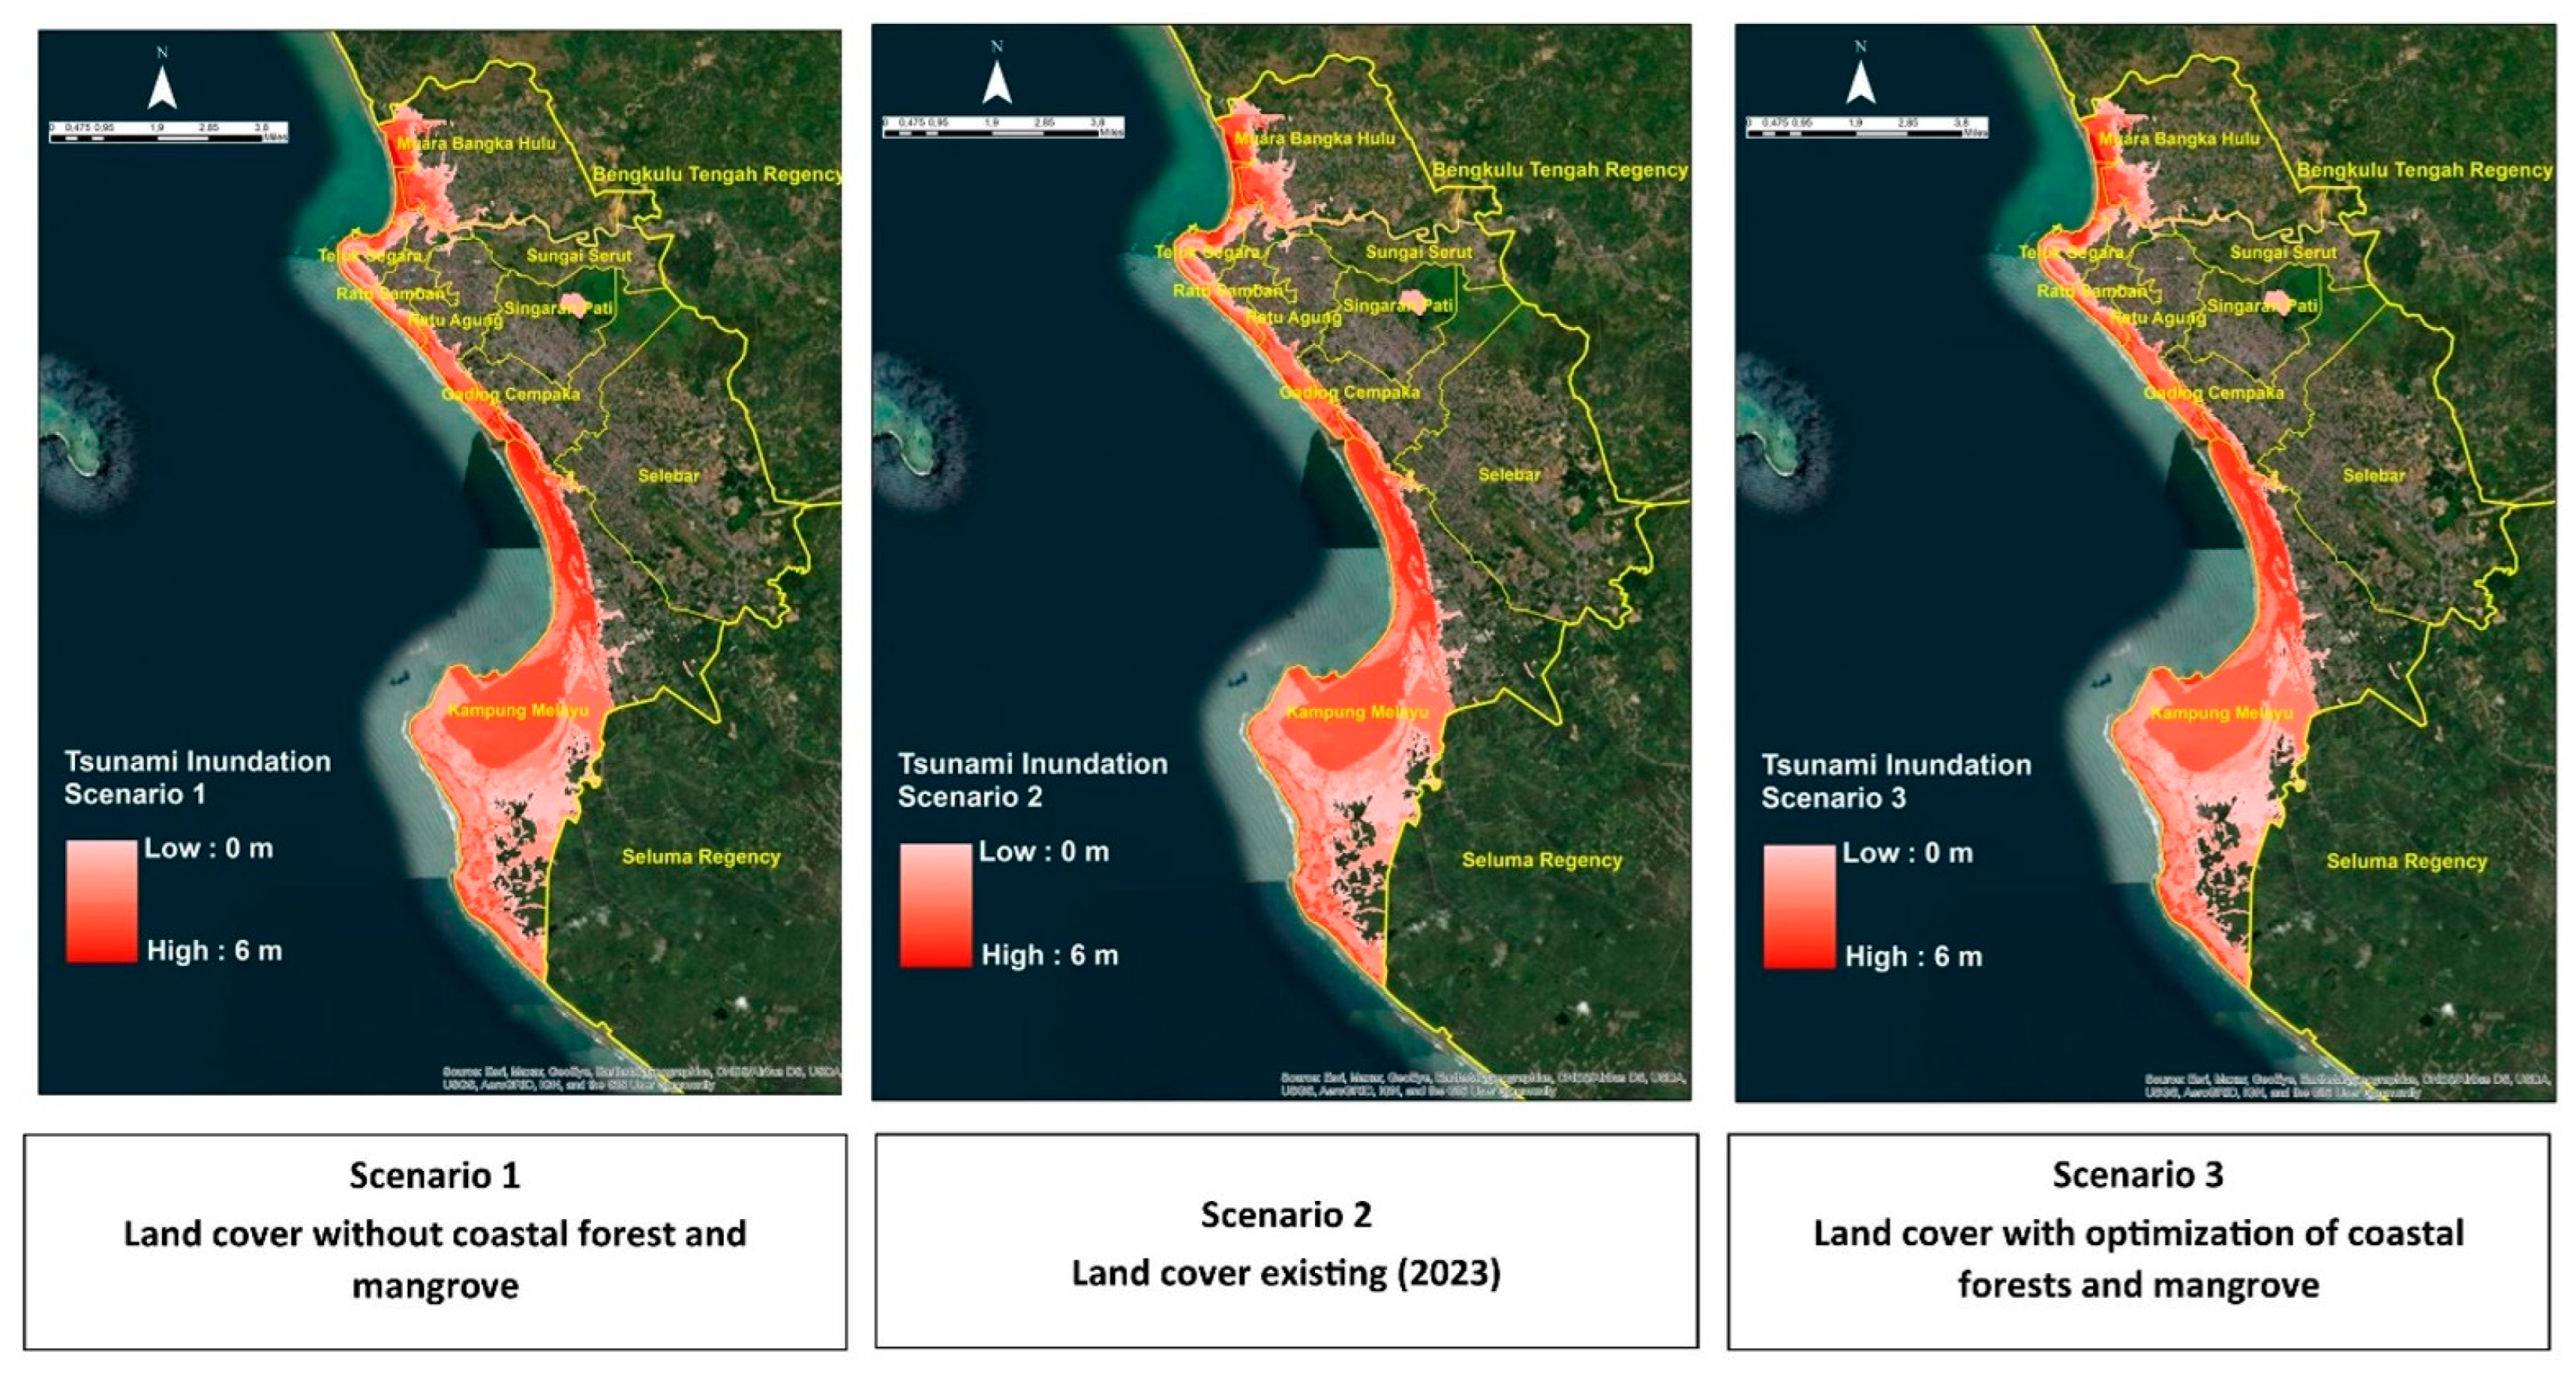
The simulations were compared using the inundated areas for the common Mw 8.9 event. Table 4 lists the inundated area of each of Bengkulu City’s nine sub-districts, and Figure 4 shows the corresponding maps. The citywide figures summarize geographic exposure, not the number of damaged buildings or people affected.
Table 4.
Simulated tsunami inundation area (ha) by Bengkulu City sub-district for the fixed-source vegetation scenarios.
Figure 4.
Simulated tsunami inundation under the three coastal land-cover scenarios in Bengkulu City.
Scenario 1 (vegetation removed): the inundated area reached 4698.60 ha, including 3598.28 ha in Kampung Melayu and 390.13 ha in Muara Bangka Hulu (Table 4). These sub-districts had the largest simulated inundation extents under the vegetation-removal scenario.
Scenario 2 (2023 baseline): citywide inundation decreases to 4655.78 ha, 42.82 ha (0.91%) below Scenario 1. Kampung Melayu decreases by 39.52 ha, from 3598.28 to 3558.76 ha (1.10% relative to the Scenario 1 extent in that sub-district); Muara Bangka Hulu decreases by 2.41 ha. The 1.10% estimate is local and should not be confused with the citywide reduction.
Scenario 3 (expanded coastal vegetation): citywide inundation decreases to 4483.61 ha, 214.99 ha (4.57%) below Scenario 1 and 172.17 ha (3.70%) below Scenario 2. In Kampung Melayu, the area decreases from 3598.28 to 3434.32 ha, a reduction of 163.96 ha (4.56%) under the vegetation-removal comparison. Muara Bangka Hulu decreases from 390.13 to 362.08 ha (28.05 ha). The distribution is not uniformly protective: Table 4 shows small increases in some locations, including Teluk Segara.
3.3. Damage and Loss Estimation
Potential economic losses were estimated for each simulated inundation footprint using lower and upper monetary values for the exposed asset categories. A fixed exchange rate of IDR 15,000 per USD was assumed in the calculations. Forest values, for example, were based on assumed carbon stocks of 180–250 tonnes per hectare and a notional carbon price of USD 20 per tonne [45,46]. These are stock-based valuation assumptions rather than measurements of annual sequestration or independently verified carbon credits.
Rice-field losses were valued using the mean 2021–2023 production of 49.08 quintals (4.908 tonnes) per hectare and an assumed dry-harvested grain price of approximately USD 0.46 per kilogram. With two annual harvests in the lower valuation and four in the upper valuation, the potential production loss was approximately USD 4480–8964 per hectare, assuming complete disruption of the harvests considered. The difference reflects the assumed cropping frequency, not the probability of a tsunami occurring.
Residential building losses were estimated from the assumed average dwelling value of approximately USD 13,333 (IDR 200 million) and residential density, in accordance with the valuation assumptions informed by BNPB Regulation No. 2/2012. The lower and upper cases used densities of 40 and 70 houses per hectare, producing estimated unit losses of USD 533,333 and USD 933,333 per hectare, respectively. These figures reflect full exposure of the assumed housing stock; observed structural damage would also depend on water depth, flow, and building characteristics [47].
Mangrove losses were valued using assumed carbon-stock quantities of 337.02 and 480.608 tonnes per hectare for the lower and upper cases, respectively [48,49]. At a carbon price of USD 20 per tonne and with the stated price adjustments, the adopted values were approximately USD 7415–10,573 per hectare. These coefficients represent indicative carbon-stock values; no site-specific measurement of annual carbon uptake or verified carbon-credit issuance was undertaken.
Plantation losses were based on potential forgone production of fresh fruit bunches from oil-palm plantations. Annual yields were assumed to range from 22 to 36 tonnes per hectare, with a reference price of approximately USD 0.17 per kilogram. The resulting lower and upper values were USD 3667 and USD 6000 per hectare, respectively. These figures represent production losses under the assumed harvest disruption and exclude repair costs, land rehabilitation, and longer-term effects on productivity.
Aquaculture losses were estimated from shrimp harvests of 4.908 tonnes per hectare per production cycle. The assumed average shrimp price was USD 3.87 per kilogram, reflecting the range of prices across different shrimp sizes. For one lost harvest, the estimated production value was USD 18,978 per hectare. With four annual harvests, the upper loss estimate reached USD 75,911 per hectare. Both estimates assume that the respective harvests are fully disrupted by the event.
Road losses were estimated using reference unit costs of IDR 1,480,000 per metre for main roads and IDR 740,000 per metre for city roads, equivalent to approximately USD 98.67 and USD 49.33 per metre at the assumed exchange rate. Unlike land-cover categories, road exposure was measured by length (m). The lower and upper values reported for other assets reflect alternative valuation assumptions, not statistical confidence limits.
In Scenario 1, the estimated direct economic loss ranged from USD 372.71 million to USD 654.30 million (Table 5). The built-up land category contributed the largest share of the total because of its relatively high assumed asset value per hectare. These values represent potential losses under the modelled Mw 8.9 event, not observed tsunami damage or expected annual losses.
Table 5.
Indicative monetary consequence associated with inundated assets in Scenario 1 (vegetation-removal simulation; USD at IDR 15,000/USD).
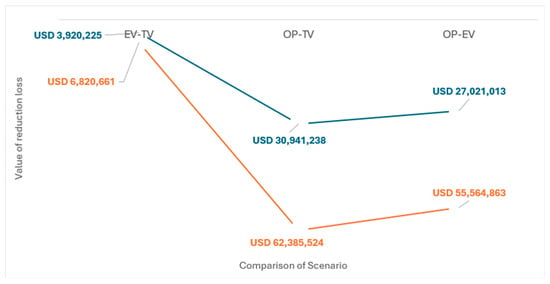
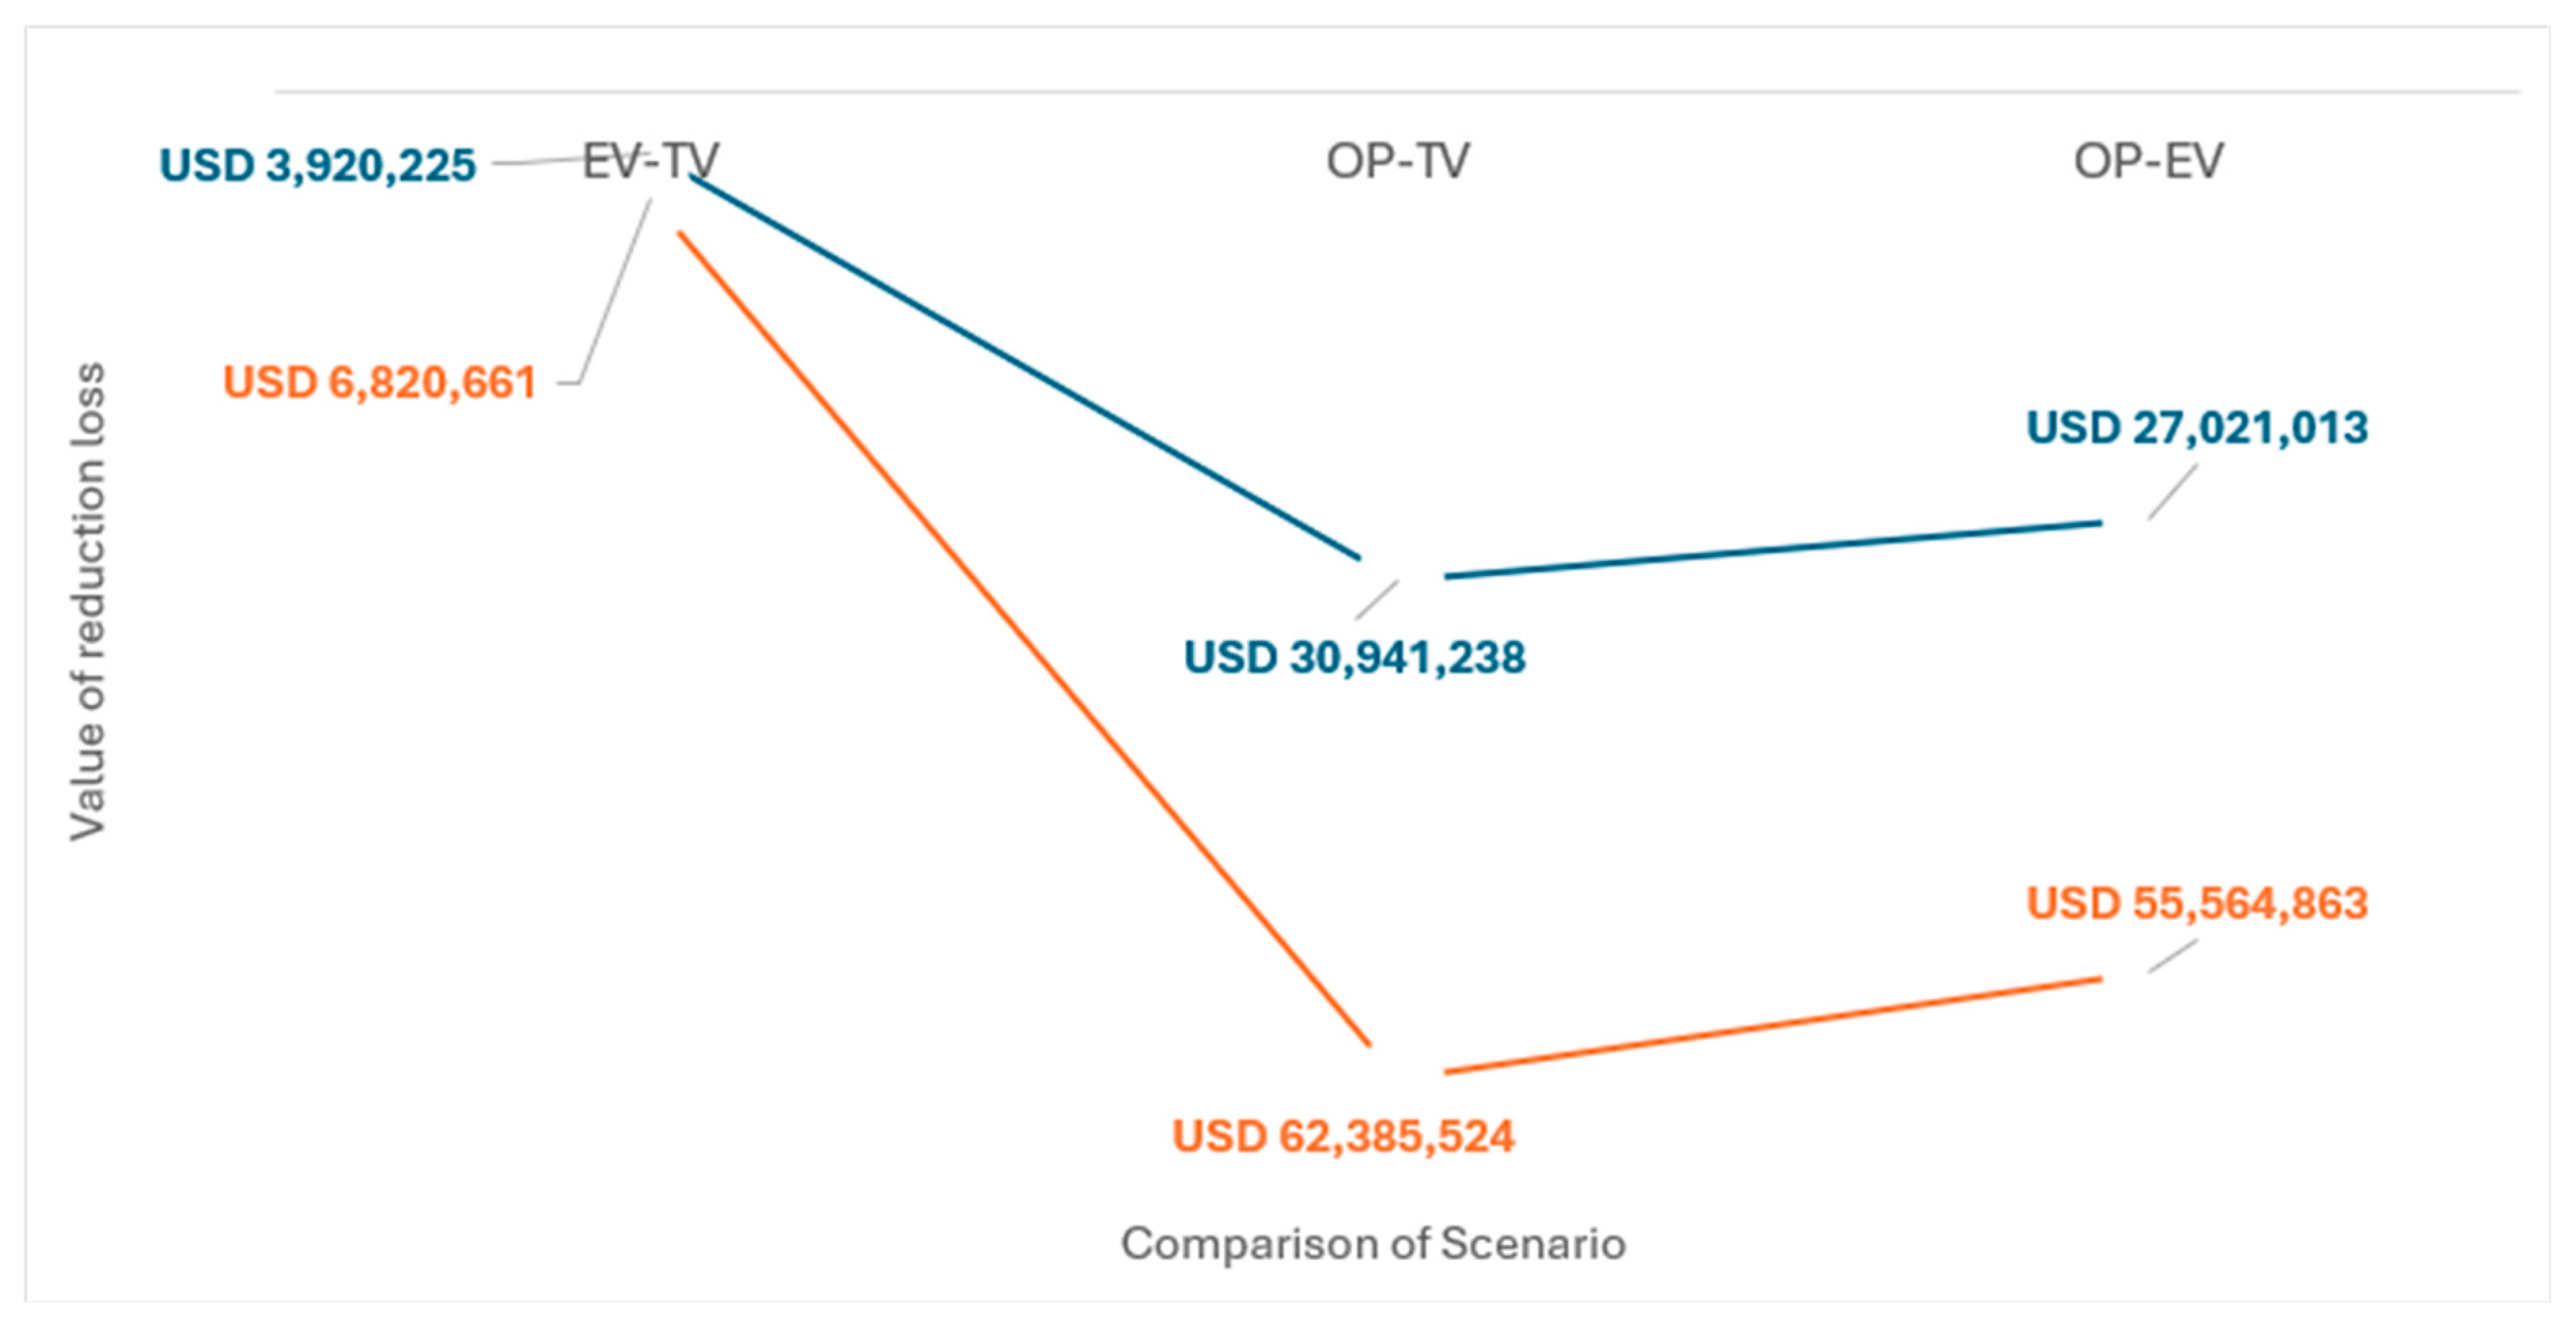
For the existing 2023 vegetation condition (Scenario 2), estimated losses ranged from USD 368.79 million to USD 647.48 million (Table 6). Compared with Scenario 1, the estimated differences were approximately USD 3.92 million in the lower valuation and USD 6.82 million in the upper valuation. The comparison reflects the change in land cover under fixed seismic forcing.
Table 6.
Indicative monetary consequence associated with inundated assets in Scenario 2 (2023 vegetation; USD at IDR 15,000/USD).
With expanded coastal vegetation (Scenario 3), estimated direct losses were USD 341.77–591.92 million (Table 7). Relative to the vegetation-removal scenario, the differences were USD 30.94–62.39 million, equivalent to approximately 8.30–9.53% of the corresponding Scenario 1 losses. Relative to the existing-vegetation condition, the estimated reductions were USD 27.02–55.56 million (7.33–8.58%). Because the scenario changes both mangrove and coastal-forest cover, these amounts cannot be attributed to mangrove expansion alone.
Table 7.
Indicative monetary consequence associated with inundated assets in Scenario 3 (expanded coastal vegetation; USD at IDR 15,000/USD).
The results suggest that changes in coastal land cover can alter the inundation footprint and the value of assets exposed to a specified tsunami. They do not support a general estimate of loss reduction per 1% increase in mangrove area, because there was no mangrove-only simulation or elasticity analysis. Transfer to other coastal settings would require site-specific vegetation characteristics, exposure data, and assessment of the costs of restoring productive land [14,22,40,41,42,43,44].
3.4. Magnitude and Interpretation of the Scenario Contrasts
The 214.99 ha reduction in citywide inundation between Scenarios 1 and 3 equals 4.57% of the modelled Scenario 1 footprint, or 1.36% of the full mapped study area. Kampung Melayu accounts for 163.96 ha (approximately 76.3%) of the net citywide decrease, although its own inundation extent changes by only 4.56%. A small proportional footprint change can be important where valuable infrastructure or vulnerable populations are concentrated, but this study does not quantify avoided casualties, service disruptions, or structural damage by depth. A reduction in inundated area is therefore not equivalent to the same percentage reduction in physical damage or economic loss.
The claim that every 1% increase in mangrove cover produces a 5.2% decline in tsunami losses is not supported by these simulations. Mangroves increase by 846.80 ha from the 2023 baseline to Scenario 3, equivalent to 5.37 percentage points of the entire mapped area; coastal forest also increases by 842.50 ha. With both covers varying simultaneously, the scenarios provide only a few combined land-use contrasts, not an isolated mangrove-response curve. Neither linearity nor a general marginal percentage effect can be inferred, and the 5.2% statement has therefore been excluded from the study’s conclusions.
The lower and upper monetary values in Table 5, Table 6 and Table 7 reflect alternative unit-cost and production assumptions; they are not intervals for the COMCOT-predicted inundation. The available scenarios cannot determine how changes in vegetation roughness, forest width, or earthquake geometry affect the results independently. A formal sensitivity analysis would require parameter perturbation runs and propagation of the resulting inundation variability through the asset-valuation model.
4. Discussion
The scenario contrasts indicate that a combined mangrove and coastal-forest buffer can change the simulated inundation footprint of Bengkulu City under a specified earthquake. This is the operational meaning of MDCP in the present study. It should not be interpreted as evidence that a particular forest species, stand density, or design width will provide the same level of protection at another site. Vegetated buffers are best considered alongside evacuation planning, coastal zoning, warning systems, and engineered measures rather than as a substitute for them [14,15,16,50,51,52].
The ecological significance of a 4.57% citywide reduction in inundation depends on the locations protected and the condition of the coastal vegetation. In the model, mangroves and coastal forests were represented by Manning’s n values of 0.060 and 0.070, respectively, compared with 0.015 for open land (Table 2). This hydraulic simplification does not explicitly resolve mangrove species, stem or root density, forest age, canopy structure, or vegetation failure under extreme flow. Field and numerical studies show that drag also varies with forest width, species, tree architecture, condition, and inundation depth [6,9,11,14,15]. Therefore, the mapped reduction reflects the adopted land-cover roughness assumptions rather than a validated, species-specific attenuation coefficient.
The economic significance must be distinguished from inundation reduction. The lowest modelled exposure-based monetary consequence changes from USD 372.71 million in Scenario 1 to USD 341.77 million in Scenario 3, but these amounts are not direct measurements of avoided building damage. The calculation assigns assumed values to exposed areas or road lengths and does not apply site-calibrated depth–damage curves or fragility functions. The difference in monetary consequence therefore need not equal the proportional change in inundated area; high-value land uses may contribute disproportionately to the economic contrast [35,38,47].
The illustrative economic contrasts are approximately 1.04–1.05% lower in Scenario 2 than Scenario 1, 8.30–9.53% lower in Scenario 3 than Scenario 1, and 7.33–8.58% lower in Scenario 3 than Scenario 2. The ranges reflect lower and upper valuation choices; they are neither probability distributions nor calibrated confidence intervals. Figure 5 presents the corresponding absolute monetary differences. These values should be used to compare the specified scenarios, not extrapolated to a linear response to each additional percentage point of mangrove cover.
Figure 5.
Visualization of differences in conditional economic loss between vegetation scenarios.
Spatial effects are heterogeneous. Table 4 indicates that inundation in Teluk Segara increases from 112.93 ha in Scenario 1 to 117.58 ha in Scenario 3, despite the reduction across Bengkulu as a whole. Local flow pathways, coastal configuration, and redistribution of hydraulic resistance may help explain this result, but the present simulations do not establish which mechanism dominates. Such local increases make site-specific assessment essential before restoration sites are selected.
Restoration feasibility is a second constraint [53]. Scenario 3 requires an additional 846.80 ha of mangroves and 842.50 ha of coastal forest and converts all 165.37 ha of mapped ponds, alongside portions of plantations, agriculture, open land, sand, and shrubs. Not all converted locations are necessarily suitable for mangroves: tidal exchange, salinity, sediment regime, elevation, coastal energy, land tenure, and existing livelihoods require separate assessment [14,15,54]. Implementation also entails nursery supply, establishment time, monitoring, replanting, maintenance, and compensation for displaced production. None of these requirements was priced in the present economic comparison; hence, the reduction in conditional exposure cannot be treated as net financial benefit.
Hydrodynamic uncertainty remains an important limitation. The COMCOT setup identifies five computational grids, a three-hour simulation, the coded outer-boundary conditions, and spatial Manning friction on the finest grid. However, exact reconstruction of the scenario calculations requires the processed bathymetry, topography, and roughness rasters as well as the scenario output files. No grid-convergence test, source-geometry perturbation, roughness-sensitivity experiment, or hydrodynamic validation against independent field measurements was available for this study. The results should therefore be read as conditional estimates rather than probability-based risk or statistically calibrated uncertainty bounds [15,22].
Future work should integrate an ensemble of realistic Mentawai–Pagai and neighbouring tsunami sources, locally constrained occurrence rates, hydrodynamic calibration, sensitivity analysis of vegetation resistance and forest structure, and depth-dependent vulnerability functions. It should also compare ecological suitability, land-use opportunity costs, and long-term management expenditure before inferring the net benefit of restoration. Behrens et al. [22] outline key uncertainties in source-to-consequence modelling, while Triantafyllou et al. [23] show how uncertainty in incomplete impact observations can be treated in probabilistic analyses; neither provides an event rate directly transferable to Bengkulu.
5. Conclusions
For the specified Mw 8.9 Mentawai–Pagai earthquake, simulated citywide inundation was 4698.60 ha in the vegetation-removal scenario, 4655.78 ha with the 2023 vegetation distribution, and 4483.61 ha following hypothetical vegetation expansion. The difference between Scenarios 1 and 3 was 214.99 ha (4.57%) citywide and 163.96 ha (4.56%) in Kampung Melayu. Scenario-based monetary contrasts under the adopted lower and upper valuation assumptions were approximately USD 30.94–62.39 million. Here, MDCP describes the conditional reduction in inundation and monetary exposure associated with the combined mangrove and coastal-forest configurations; it is not an independent index of ecosystem resilience. The simulations do not isolate species or mangrove-only effects, demonstrate a linear 5.2% decrease in loss per 1% additional mangrove cover, or estimate annual expected risk. Before the results are used to prioritize restoration investments, the hydrodynamic model requires independent validation and sensitivity analysis, and proposed land conversion requires assessment of ecological suitability, affected livelihoods, and establishment and maintenance costs.
Author Contributions
Conceptualization, Y. and D.A.L.; methodology, Y., D.A.L., D.I. and I.G.; software, D.A.L. and I.G.; validation, Y., D.I. and I.G.; formal analysis, D.A.L., D.I., N.S.W. and Q.S.; investigation, D.A.L., N.S.W. and Q.S.; resources, Y. and I.G.; data curation, D.A.L., N.S.W. and Q.S.; writing—original draft preparation, Y. and D.A.L.; writing—review and editing, Y., D.A.L., D.I., I.G., N.S.W. and Q.S.; visualization, D.A.L., N.S.W. and Q.S.; supervision, Y.; project administration, Y. and D.A.L.; funding acquisition, Y. All authors have read and agreed to the published version of the manuscript.
Funding
This research was funded by Bank Indonesia through the Research Grant Bank Indonesia (RGBI) 2024 program, grant number 26/28/PKS/BINS/2024.
Data Availability Statement
The raw data supporting the conclusions of this article will be made available by the authors on request.
Acknowledgments
This research was supported by Bank Indonesia through the Research Grant Bank Indonesia (RGBI) 2024 program under grant number 26/28/PKS/BINS/2024. The funding supported research implementation and operational needs. The authors gratefully acknowledge Bank Indonesia for its support and facilitation of this research. During the preparation of this manuscript, the authors used OpenAI′s ChatGPT (GPT-6) was used to assist in preparing this manuscript, particularly to improve academic English, refine sentence structure, enhance clarity and coherence, and support manuscript organization and editing. The authors have reviewed and edited the output and take full responsibility for the content of this publication.
Conflicts of Interest
The authors declare no conflicts of interest.
Abbreviations
The following abbreviations are used in this manuscript:
| MDCP | Mangrove Disaster Capacity Protection |
| DaLA | Damage and Loss Assessment |
| ECLAC | Economic Commission for Latin America and the Caribbean |
| COMCOT | Cornell Multi-Grid Coupled Tsunami Model |
| MCDA | Multi-Criteria Decision Analysis |
| BMKG | Indonesian Agency for Meteorology, Climatology, and Geophysics |
| DEMNAS | National Digital Elevation Model (Indonesia) |
| BATNAS | National Bathymetry (Indonesia) |
| GIS | Geographic Information System |
| DRR | Disaster Risk Reduction |
| Eco-DRR | Ecosystem-based Disaster Risk Reduction |
| SDGs | Sustainable Development Goals |
| PUPR | Ministry of Public Works and Housing (Indonesia) |
| BPS | Statistics Indonesia (Central Statistics Agency) |
| CPI | Consumer Price Index |
| UMR | Regional Minimum Wage |
| GKP | Harvested Dry Grain (Gabah Kering Panen) |
| TBS | Fresh Fruit Bunches (Tandan Buah Segar) |
| SWEs | Shallow-Water Equations |
| OLI | Operational Land Imager |
| TIRS | Thermal Infrared Sensor |
| CMT | Centroid Moment Tensor |
| Mw | Moment Magnitude |
References
- Asari, N.; Suratman, M.N.; Mohd Ayob, N.A.; Abdul Hamid, N.H. Mangrove as a Natural Barrier to Environmental Risks and Coastal Protection. In Mangroves: Ecology, Biodiversity and Management; Springer: Berlin/Heidelberg, Germany, 2021; pp. 305–322. [Google Scholar]
- Wang, X.; Su, F.; Yan, F.; Zhang, X.; Wang, X. Effects of Coastal Urbanization on Habitat Quality: A Case Study in Guangdong-Hong Kong-Macao Greater Bay Area. Land 2022, 12, 34. [Google Scholar] [CrossRef] [Scilit]
- Marois, D.E.; Mitsch, W.J. Coastal Protection from Tsunamis and Cyclones Provided by Mangrove Wetlands—A Review. Int. J. Biodivers. Sci. Ecosyst. Serv. Manag. 2015, 11, 71–83. [Google Scholar] [CrossRef] [Scilit]
- Alongi, D.M. Mangrove Forests: Resilience, Protection from Tsunamis, and Responses to Global Climate Change. Estuar. Coast. Shelf Sci. 2008, 76, 1–13. [Google Scholar] [CrossRef] [Scilit]
- Yonvitner; Agus, S.B.; Lestari, D.F.; Pasaribu, R.; Supriyanto, E.; Widodo, C.; Sugara, A.; Patoka, J.; Akmal, S.G. Vulnerability Status of the Coral Ecosystem in Kepulauan Seribu Marine National Park, Indonesia. Coast. Manag. 2022, 50, 251–261. [Google Scholar] [CrossRef] [Scilit]
- Maza, M.; Lara, J.L.; Losada, I.J. Predicting the Evolution of Coastal Protection Service with Mangrove Forest Age. Coast. Eng. 2021, 168, 103922. [Google Scholar] [CrossRef] [Scilit]
- Yanagisawa, H.; Koshimura, S.; Miyagi, T.; Imamura, F. Tsunami Damage Reduction Performance of a Mangrove Forest in Banda Aceh, Indonesia Inferred from Field Data and a Numerical Model. J. Geophys. Res. Oceans 2010, 115, C06032. [Google Scholar] [CrossRef] [Scilit]
- Yonvitner; Yuliana, E.; Yani, D.E.; Setijorini, L.E.; Nurhasanah; Santoso, A.; Boer, M.; Kurnia, R.; Perdinan; Agus, S.B. Effect of Silent Tsunami Sunda Strait to Fisheries Activity: Record from Labuan Landing Port, Pandeglang. In Proceedings of the AIP Conference Proceedings; AIP Publishing LLC: Melville, NY, USA, 2021; Volume 2320, p. 40027. [Google Scholar]
- Osti, R.; Tanaka, S.; Tokioka, T. The Importance of Mangrove Forest in Tsunami Disaster Mitigation. Disasters 2009, 33, 203–213. [Google Scholar] [CrossRef] [Scilit] [PubMed]
- Lestari, D.A.; Damar, A.; Kurniawan, F.; Nurjaya, I.W. Roughness Ecosystem-Based Approach to Estimate the Exposure Area of Tsunami on a Coastal City: A Case Study in Bengkulu City, Indonesia. Int. J. Adv. Sci. Eng. Inf. Technol. 2024, 14, 1373–1382. [Google Scholar] [CrossRef] [Scilit]
- Mazda, Y.; Magi, M.; Ikeda, Y.; Kurokawa, T.; Asano, T. Wave Reduction in a Mangrove Forest Dominated by Sonneratia sp. Wetl. Ecol. Manag. 2006, 14, 365–378. [Google Scholar] [CrossRef] [Scilit]
- Teo, F.Y.; Falconer, R.A.; Lin, B. Modelling Effects of Mangroves on Tsunamis. In Proceedings of the Institution of Civil Engineers-Water Management; Thomas Telford Ltd.: London, UK, 2009; Volume 162, pp. 3–12. [Google Scholar]
- Teo, F.Y. Attenuation of Tsunami Currents in an Estuary with Mangroves. Master’s Thesis, Cardiff University, Cardiff, UK, 2008. [Google Scholar]
- Van Hespen, R.; Hu, Z.; Borsje, B.; De Dominicis, M.; Friess, D.A.; Jevrejeva, S.; Kleinhans, M.G.; Maza, M.; Van Bijsterveldt, C.E.J.; Van der Stocken, T. Mangrove Forests as a Nature-Based Solution for Coastal Flood Protection: Biophysical and Ecological Considerations. Water Sci. Eng. 2023, 16, 1–13. [Google Scholar] [CrossRef] [Scilit]
- Benazir; Triatmadja, R.; Syamsidik; Nizam; Warniyati. Vegetation-based approached for tsunami risk reduction: Insights and challenges. Prog. Disaster Sci. 2024, 23, 100352. [Google Scholar] [CrossRef] [Scilit]
- Dissanayaka, K.; Tanaka, N.; Vinodh, T.L.C. Integration of Eco-DRR and Hybrid Defense System on Mitigation of Natural Disasters (Tsunami and Coastal Flooding): A Review. Nat. Hazards 2022, 110, 1–28. [Google Scholar] [CrossRef] [Scilit]
- Pratama, A.H.I.N.; Widodo, P.; Saragih, H.J.R.; Putra, D.R.K. Analisis Bahaya Dan Risiko Bencana Gempa Bumi Di Provinsi Bengkulu Menggunakan Tata Ruang Dan InaRISK. J. Kewarganegaraan 2020, 4, 6917–6924. [Google Scholar]
- Fathiyah, D.U.; Arhatin, R.E.; Siregar, V.P. Analysis of Vulnerability Level to Tsunami on the Bengkulu City Coastal Using Geographic Information System. In Proceedings of the BIO Web of Conferences; EDP Sciences: Les Ulis, France, 2024; Volume 106, p. 4008. [Google Scholar]
- Borrero, J.C.; Weiss, R.; Okal, E.A.; Hidayat, R.; Suranto; Arcas, D.; Titov, V.V. The Tsunami of 2007 September 12, Bengkulu Province, Sumatra, Indonesia: Post-Tsunami Field Survey and Numerical Modelling. Geophys. J. Int. 2009, 178, 180–194. [Google Scholar] [CrossRef] [Scilit]
- Santius, S.H. Pemodelan Tingkat Risiko Bencana Tsunami Pada Permukiman Di Kota Bengkulu Menggunakan Sistem Informasi Geografis. J. Permukim. 2015, 10, 92–105. [Google Scholar]
- Fachri, H.T.; Malik, Y.; Murtianto, H. Pemetaan Tingkat Bahaya Bencana Tsunami Menggunakan Sistem Informasi Geografis Di Pesisir Kota Bengkulu. J. Pendidik. Geogr. Undiksha 2022, 10, 166–178. [Google Scholar] [CrossRef] [Scilit]
- Behrens, J.; Løvholt, F.; Jalayer, F.; Lorito, S.; Salgado-Gálvez, M.A.; Sørensen, M.; Abadie, S.; Aguirre-Ayerbe, I.; Aniel-Quiroga, I.; Babeyko, A.; et al. Probabilistic Tsunami Hazard and Risk Analysis: A Review of Research Gaps. Front. Earth Sci. 2021, 9, 628772. [Google Scholar] [CrossRef] [Scilit]
- Triantafyllou, I.; Papadopoulos, G.A.; Kijko, A. Probabilistic Tsunami Risk Assessment from Incomplete and Uncertain Historical Impact Records: Mediterranean and Connected Seas. Pure Appl. Geophys. 2023, 180, 1785–1809. [Google Scholar] [CrossRef] [Scilit]
- Pusat Studi Gempa Nasional (Indonesia). Peta Sumber Dan Bahaya Gempa Indonesia Tahun 2017; Pusat Penelitian dan Pengembangan Perumahan dan Permukiman, Badan Penelitian dan Pengembangan, Kementerian Pekerjaan Umum dan Perumahan Rakyat: West Java, Indonesia, 2017. [Google Scholar]
- Tri Laksono, F.X.A.; Aditama, M.R.; Setijadi, R.; Ramadhan, G. Run-up Height and Flow Depth Simulation of the 2006 South Java Tsunami Using COMCOT on Widarapayung Beach. In Proceedings of the IOP Conference Series: Materials Science and Engineering; IOP Publishing: Bristol, UK, 2020; Volume 982, p. 12047. [Google Scholar]
- Sugianto, D.; Nurjaya, I.W.; Natih, N.M.N.; Pandoe, W.W. Potensi Rendaman Tsunami Di Wilayah Lebak Banten. J. Kelaut. Nas. 2017, 12, 9–18. [Google Scholar] [CrossRef] [Scilit]
- Chusnayah, F. Kajian Efektivitas Vegetasi Pantai Dalam Mereduksi Energi Tsunami Menggunakan Model Numerik. Master’s Thesis, Universitas Gadjah Mada, Yogyakarta, Indonesia, 2019. [Google Scholar]
- Wang, X. User Manual for COMCOT Version 1.7 (First Draft). Cornell Univ. 2009, 65, 480. [Google Scholar]
- Badan Informasi Geospasial (BIG). DEMNAS and BATNAS Geospatial Data Access, Ina-Geoportal. Available online: https://tanahair.indonesia.go.id/ (accessed on 24 October 2026).
- Silviana, M. Tsunami Vulnerability and Risk Assessment of Banda Aceh City through ArcGIS Software. J. Inotera 2020, 5, 35–43. [Google Scholar] [CrossRef] [Scilit]
- Google Earth Engine. Landsat 8 Collection 2 Tier 1 Level-2 (Landsat/LC08/C02/T1_L2), USGS Data Catalog. Available online: https://developers.google.com/earth-engine/datasets/catalog/LANDSAT_LC08_C02_T1_L2 (accessed on 24 October 2026).
- U.S. Geological Survey (USGS). Landsat 8 Data Accessed Using the Google Earth Engine Landsat Archive. Available online: https://www.usgs.gov/landsat-missions/landsat-8 (accessed on 24 October 2026).
- Badan Meteorologi, Klimatologi, dan Geofisika (BMKG). Indonesian Tsunami Early Warning System (InaTEWS) and Open Earthquake Data. Available online: https://inatews.bmkg.go.id/ (accessed on 24 October 2026).
- Badan Nasional Penanggulangan Bencana (BNPB). Modul Teknis Penyusunan Kajian Rawan Tsunami; BNPB: Jakarta Timur, Indonesia, 2018.
- Economic Commission for Latin America and the Caribbean (ECLAC). Handbook for Disaster Assessment; Document LC/L.3691; United Nations: Santiago, Chile, 2014; Available online: https://www.cepal.org/en/publications/36823-handbook-disaster-assessment (accessed on 24 October 2026).
- Bello, O.; Ortiz Malavassi, L.M.; Samaniego, J. Assessment of the Effects of Disasters in Latin America and the Caribbean, 1972–2010; CEPAL: Vitacura, Chile, 2015. [Google Scholar]
- Samanta, S.; Koloa, C.; Kumar Pal, D.; Palsamanta, B. Flood Risk Analysis in Lower Part of Markham River Based on Multi-Criteria Decision Approach (MCDA). Hydrology 2016, 3, 29. [Google Scholar] [CrossRef] [Scilit]
- Barbier, E.B. The Protective Service of Mangrove Ecosystems: A Review of Valuation Methods. Mar. Pollut. Bull. 2016, 109, 676–681. [Google Scholar] [CrossRef] [Scilit] [PubMed]
- Dasgupta, P. The Economics of Biodiversity: The Dasgupta; HM Treasury: London, UK, 2021. [Google Scholar]
- Uddin, M.S.; de Ruyter van Steveninck, E.; Stuip, M.; Shah, M.A.R. Economic Valuation of Provisioning and Cultural Services of a Protected Mangrove Ecosystem: A Case Study on Sundarbans Reserve Forest, Bangladesh. Ecosyst. Serv. 2013, 5, 88–93. [Google Scholar] [CrossRef] [Scilit]
- Barbier, E.B. The Value of Coastal Wetland Ecosystem Services. In Coastal Wetlands; Elsevier: Amsterdam, The Netherlands, 2019; pp. 947–964. [Google Scholar]
- Costanza, R.; De Groot, R.; Sutton, P.; Van der Ploeg, S.; Anderson, S.J.; Kubiszewski, I.; Farber, S.; Turner, R.K. Changes in the Global Value of Ecosystem Services. Glob. Environ. Change 2014, 26, 152–158. [Google Scholar] [CrossRef] [Scilit]
- Adger, W.N.; Hughes, T.P.; Folke, C.; Carpenter, S.R.; Rockstrom, J. Social-Ecological Resilience to Coastal Disasters. Science 2005, 309, 1036–1039. [Google Scholar] [CrossRef] [Scilit] [PubMed]
- Taillardat, P.; Friess, D.A.; Lupascu, M. Mangrove Blue Carbon Strategies for Climate Change Mitigation Are Most Effective at the National Scale. Biol. Lett. 2018, 14, 20180251. [Google Scholar] [CrossRef] [Scilit] [PubMed]
- van Best, S.; van Dijk, S. Tropical Forests—The Facts and Figures; Probos: Wageningen, The Netherlands, 2020. [Google Scholar]
- Lin, B.; Jia, Z. Impacts of Carbon Price Level in Carbon Emission Trading Market. Appl. Energy 2019, 239, 157–170. [Google Scholar] [CrossRef] [Scilit]
- Reese, S.; Cousins, W.J.; Power, W.L.; Palmer, N.G.; Tejakusuma, I.G.; Nugrahadi, S. Tsunami Vulnerability of Buildings and People in South Java–Field Observations after the July 2006 Java Tsunami. Nat. Hazards Earth Syst. Sci. 2007, 7, 573–589. [Google Scholar] [CrossRef] [Scilit]
- Pearce, D.; Moran, D. The Economic Value of Biodiversity; Routledge: London, UK, 2013. [Google Scholar]
- Azzahra, F.S.; Suryanti, S.; Febrianto, S. Estimasi Serapan Karbon Pada Hutan Mangrove Desa Bedono, Demak, Jawa Tengah. JFMR (J. Fish. Mar. Res.) 2020, 4, 308–315. [Google Scholar] [CrossRef] [Scilit]
- Hallegatte, S. A Cost Effective Solution to Reduce Disaster Losses in Developing Countries: Hydro-Meteorological Services, Early Warning, and Evacuation; World Bank policy research working paper; World Bank: Washington, DC, USA, 2012. [Google Scholar]
- Sutton-Grier, A.E.; Wowk, K.; Bamford, H. Future of Our Coasts: The Potential for Natural and Hybrid Infrastructure to Enhance the Resilience of Our Coastal Communities, Economies and Ecosystems. Environ. Sci. Policy 2015, 51, 137–148. [Google Scholar] [CrossRef] [Scilit]
- Spalding, M.D.; McIvor, A.L.; Beck, M.W.; Koch, E.W.; Möller, I.; Reed, D.J.; Rubinoff, P.; Spencer, T.; Tolhurst, T.J.; Wamsley, T. V Coastal Ecosystems: A Critical Element of Risk Reduction. Conserv. Lett. 2014, 7, 293–301. [Google Scholar] [CrossRef] [Scilit]
- Fagliani, F. Coastal Area Management Strategy Towards a Green Economy. Patikala J. Sustain. Bus. Entrep. 2023, 1, 11–19. [Google Scholar]
- Friess, D.A.; Rogers, K.; Lovelock, C.E.; Krauss, K.W.; Hamilton, S.E.; Lee, S.Y.; Lucas, R.; Primavera, J.; Rajkaran, A.; Shi, S. The State of the World’s Mangrove Forests: Past, Present, and Future. Annu. Rev. Environ. Resour. 2019, 44, 89–115. [Google Scholar] [CrossRef] [Scilit]

Disclaimer/Publisher’s Note: The statements, opinions and data contained in all publications are solely those of the individual author(s) and contributor(s) and not of MDPI and/or the editor(s). MDPI and/or the editor(s) disclaim responsibility for any injury to people or property resulting from any ideas, methods, instructions or products referred to in the content. |
© 2026 by the authors. Licensee MDPI, Basel, Switzerland. This article is an open access article distributed under the terms and conditions of the Creative Commons Attribution (CC BY) license.