


Abstract
Data-driven models are increasingly used for flood and landslide susceptibility mapping in rapidly urbanizing regions, particularly in the Global South. In this context, land use and land cover (LULC) is routinely adopted as a conditioning factor, although its geomorphological meaning and temporal consistency with hazard inventories are seldom evaluated. Information Value (IV) models have been widely applied to landslide susceptibility, but their use for flood susceptibility in complex coastal cities remains limited. This study evaluates IV-based flood and landslide susceptibility in Vitória, Brazil, a predominantly insular city characterized by sharp geomorphological contrasts and high population density. Two LULC datasets with different levels of urban detail were tested as conditioning factors alongside topographic and hydrological variables. Eighteen models were constructed for each hazard and validated using Area Under the Curve (AUC) metrics and expert judgement. Morphological attributes were the most important predictors: slope alone achieved an AUC of 0.90 for landslides, whereas elevation reached 0.71 for floods. The inclusion of LULC increased AUC values to 0.94–0.95 for landslides and 0.85–0.89 for floods, but also introduced spatial and temporal biases associated with stationary and coarsely classified land cover. Our findings highlight the limitations of incorporating LULC as a conditioning factor without temporal harmonization with hazard inventories or adequate urban class disaggregation. We argue that, in complex urban settings, LULC is more appropriately interpreted as a proxy for exposure and vulnerability than as a dominant predisposing factor, and that its use in predictive models should be critically assessed to avoid misleading conclusions.
1. Introduction
Urban areas in the Global South are increasingly and disproportionately exposed to multiple hydro-geomorphological hazards, particularly floods and landslides, as a consequence of rapid and frequently unplanned urbanization in the context of ongoing climate change [1,2,3,4]. The expansion and densification of informal settlements on steep slopes, floodplains and coastal lowlands have increased the interface between people and hazardous terrain, contributing to recurrent disasters and the continuous production of risk [2]. In coastal and insular cities, where pronounced geomorphological contrasts coexist with highly engineered shorelines and constrained drainage systems, hazard dynamics become even more complex due to the interaction between intense rainfall, tidal levels and drainage capacity [5,6,7].
Susceptibility mapping has become a cornerstone of quantitative risk assessments because it provides spatially explicit estimates of where hazards are more likely to occur given local environmental conditions. Despite this, understanding the full spatial extent of hazardous events in urban areas remains a difficult task [8]. Among data-driven approaches, statistically based models, ranging from simple bivariate methods to multivariate machine-learning algorithms, use historical events to infer relationships between hazardous processes and geo-hydro-environmental factors [9,10,11,12,13,14].
Within data-driven methods, Information Value (IV) models are particularly popular for landslide susceptibility, owing to their relative simplicity, interpretability and good performance in mountainous terrain [10,15,16,17,18]. By contrast, IV applications to flood susceptibility, especially in densely urbanized or coastal environments, remain scarce and unevenly documented, despite a growing body of work on data-driven and machine-learning flood models more generally [11,19,20,21].
A key stage in the susceptibility analysis of both processes is the selection of predisposing factors that must be relevant to the studied phenomenon [14,22,23]. Among the thematic variables, land use and land cover (LULC) is one of the most frequently used in susceptibility studies for both landslides and floods [23,24,25,26,27], because it acts as a proxy for vegetation, soil disturbance and surface sealing. Numerous studies have documented that deforestation, forest degradation and changes in vegetation structure can increase or decrease landslide susceptibility depending on the type, age and health of the forest cover [27,28,29]. Similarly, the expansion of impervious surfaces, altered drainage networks and compacted soils are widely recognized as key drivers of urban flood susceptibility [13,25,30,31,32,33,34]. Yet, as highlighted by several reviews, the susceptibility-related meaning and data quality of LULC layers are often insufficiently justified, and there is little consensus on how best to represent urban and vegetated classes in susceptibility models [14,35,36,37].
These limitations are particularly critical in complex coastal cities where floods and landslides co-occur, because LULC datasets with coarse or inconsistent urban categories may inflate model performance, obscure process controls, or mislead spatial prioritization for risk reduction. Few studies have systematically examined how different LULC products, degrees of imperviousness or proxies of vegetation structure affect the performance, robustness and spatial patterns of joint flood and landslide susceptibility models in such environments [6,38]. Addressing this gap is essential to avoid over-reliance on LULC-driven susceptibility maps when defining zoning regulations, infrastructure investments and slope-stabilization or drainage interventions.
In this context, this study investigates when and how land use and land cover can mislead data-driven susceptibility modelling for landslides and floods in Vitória, Espírito Santo, Brazil. Specifically, we (i) quantify the relative importance of individual predisposing factors for both hazards through sensitivity analyses in an IV framework; (ii) compare the performance of two LULC datasets with different urban classification schemes in landslide and flood susceptibility models; and (iii) assess the strengths and limitations of LULC as a conditioning factor by examining its spatial agreement and mismatch with the resulting susceptibility patterns. By explicitly testing how LULC representation shapes susceptibility maps for multiple hazards, we aim to provide guidance on the appropriate use of LULC information and to highlight conditions under which it may bias hazard assessments and decision-making.
2. Data and Methods
2.1. Study Area
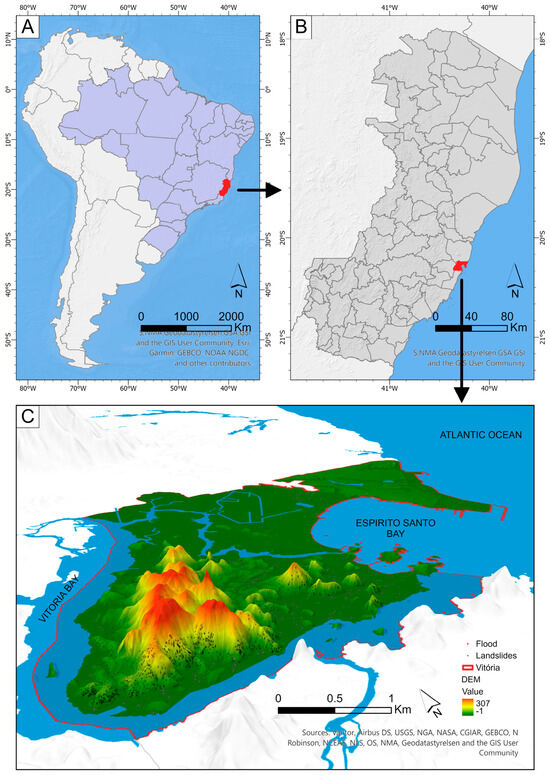
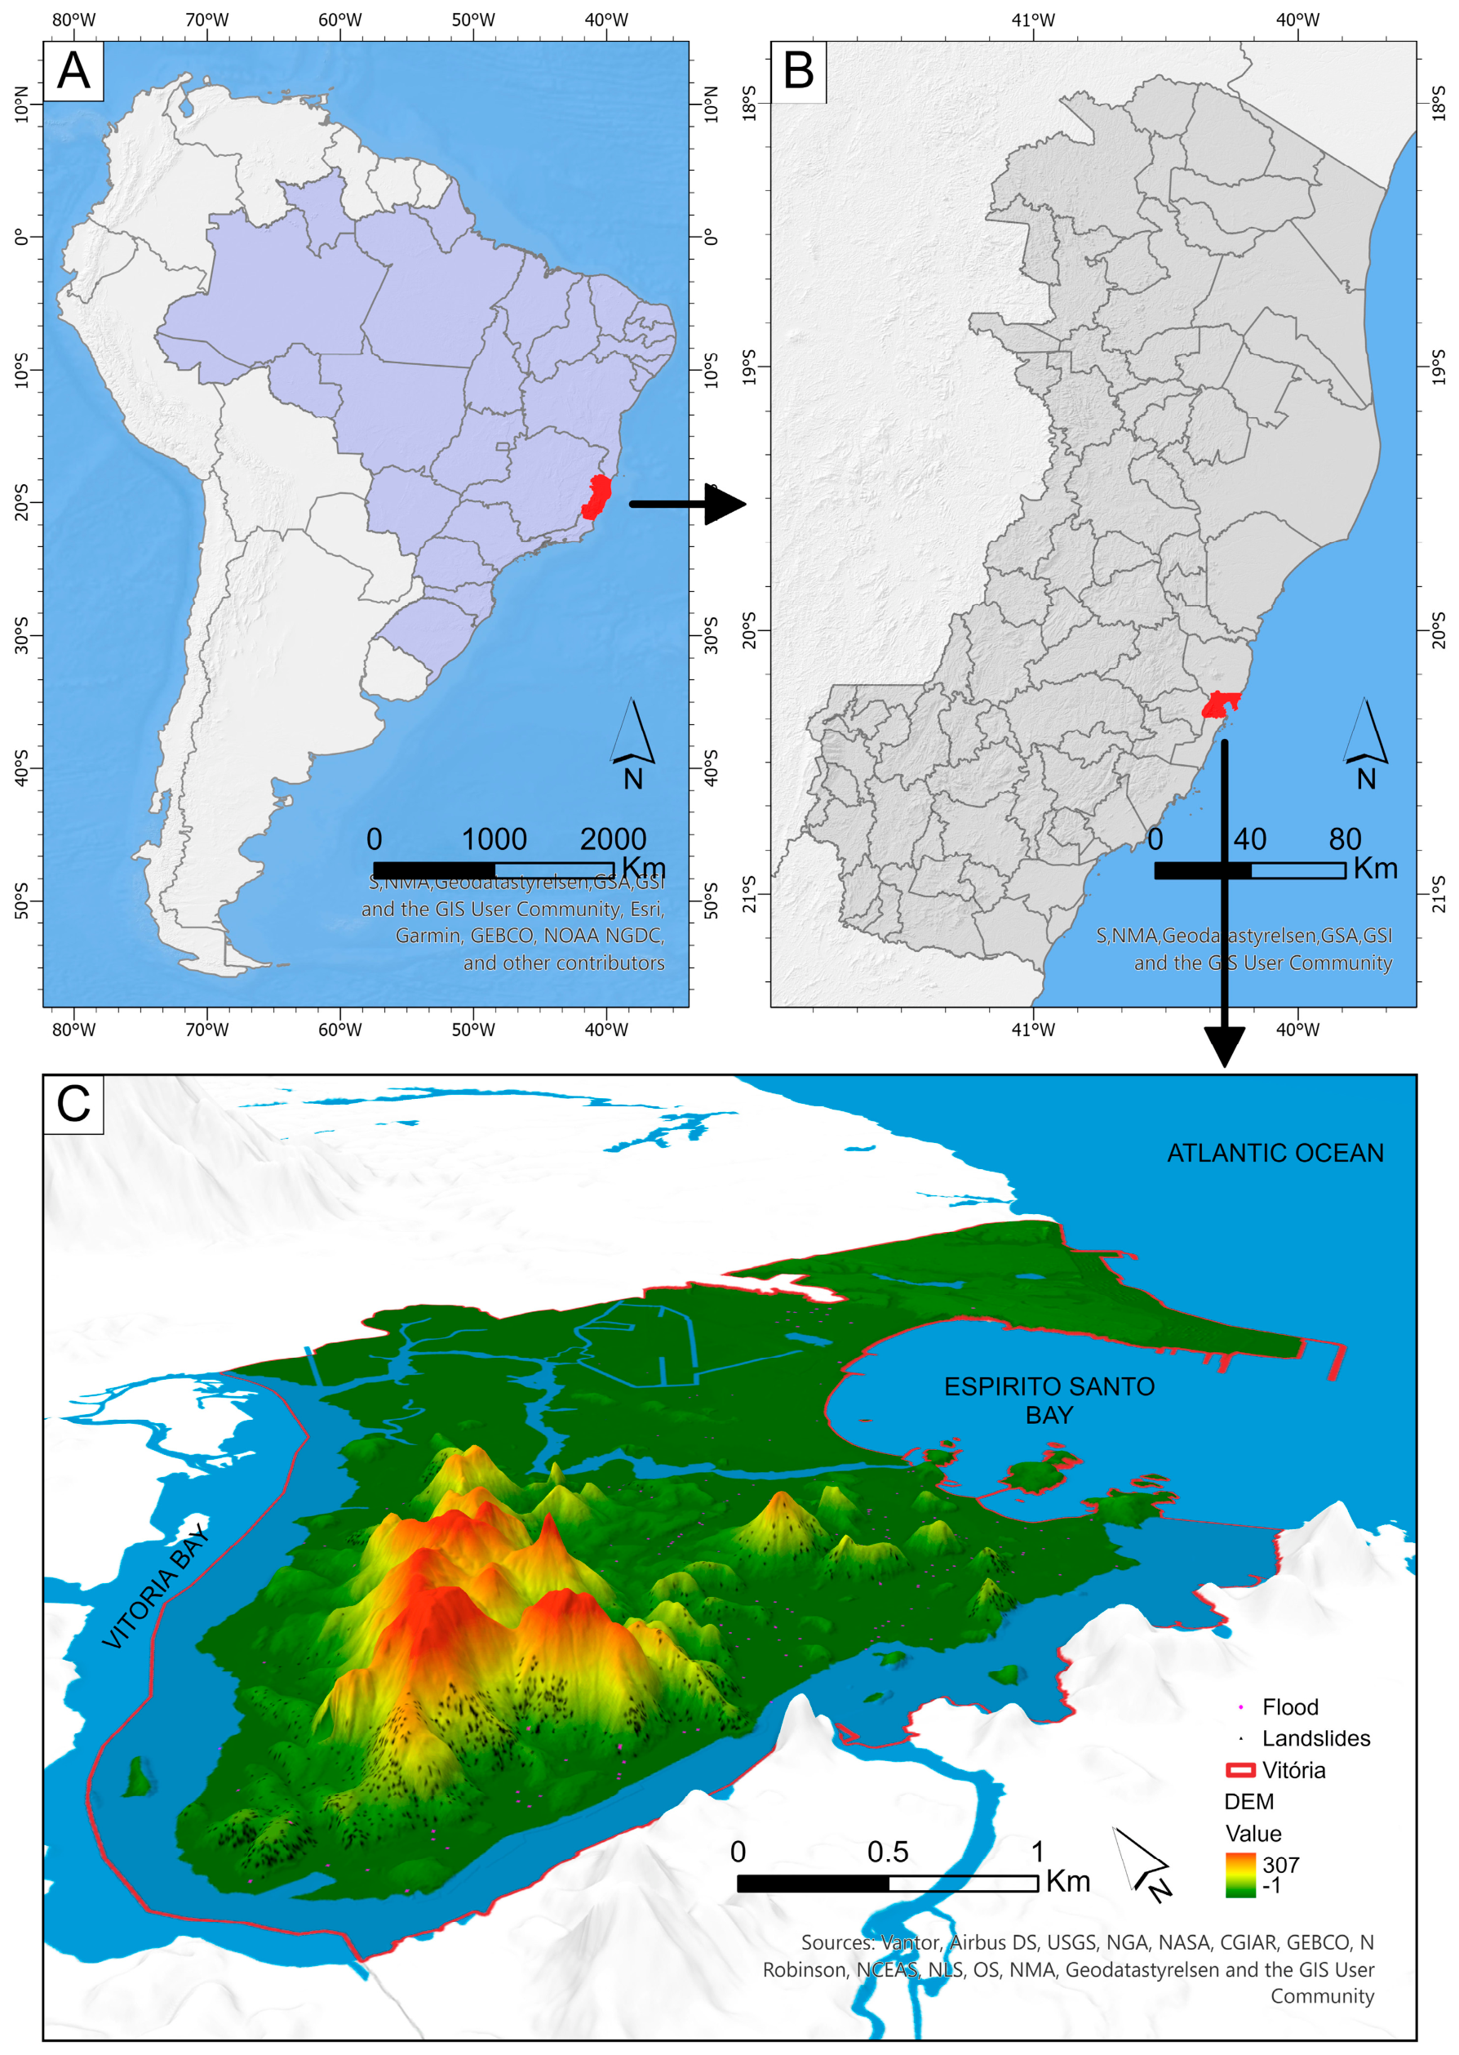
The area selected for this study is the municipality of Vitoria (97 km2), capital of Espírito Santo State, south-eastern Brazil (Figure 1). Most of the city consists of an island, with lithology dominated by the Central Massif, which is formed of granitic rocks, and is characterized by sharp geomorphological contrasts and a high density of exposed populations [39]. Most of the insular landscape is mountainous, while the peninsular area is flat, and elevation ranges from −1 to 601 m. The city has already experienced several natural disasters, the most severe landslide having occurred in 1985, when a rockfall at Morro do Macaco claimed 40 lives and affected at least 150 people. Regarding floods, one of the most significant rainfall events was recorded in 2019, when more than 200 mm of precipitation fell within 24 h, affecting approximately 57,000 people.
Figure 1.
Location of the Espírito Santo state (in red), in relation to Brazil (A) and Vitória municipality (in red), in relation to Espírito Santo state (B), with the landslide and flood events occurred since 1993 in Vitória municipality (C).
A key characteristic of flood hazard in Vitória is its predominantly flash-flood dynamics. In this coastal city, the two main rivers that surround the island do not control flood occurrence; instead, floods are generated by intense, short-duration rainfall over the urban catchments. Accordingly, the two major water bodies were excluded from all conditioning-factor layers to better represent these localized flood mechanisms.
2.2. Database: Inventories and Predisposing Factors
The landslide inventory for Vitoria, produced by the Mapenco Project, was used in this study. The Mapenco Project is a long-term initiative that monitors risk in steep areas. It began its mapping activities in 1995 and includes landslides recorded up to 2023, resulting in a 28-year database [40]. The available dataset consists of 2490 point features, with the location of occurrence, although information on the specific dates of individual events is not available.
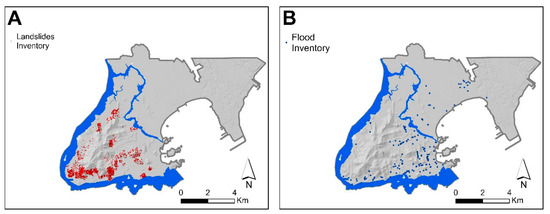
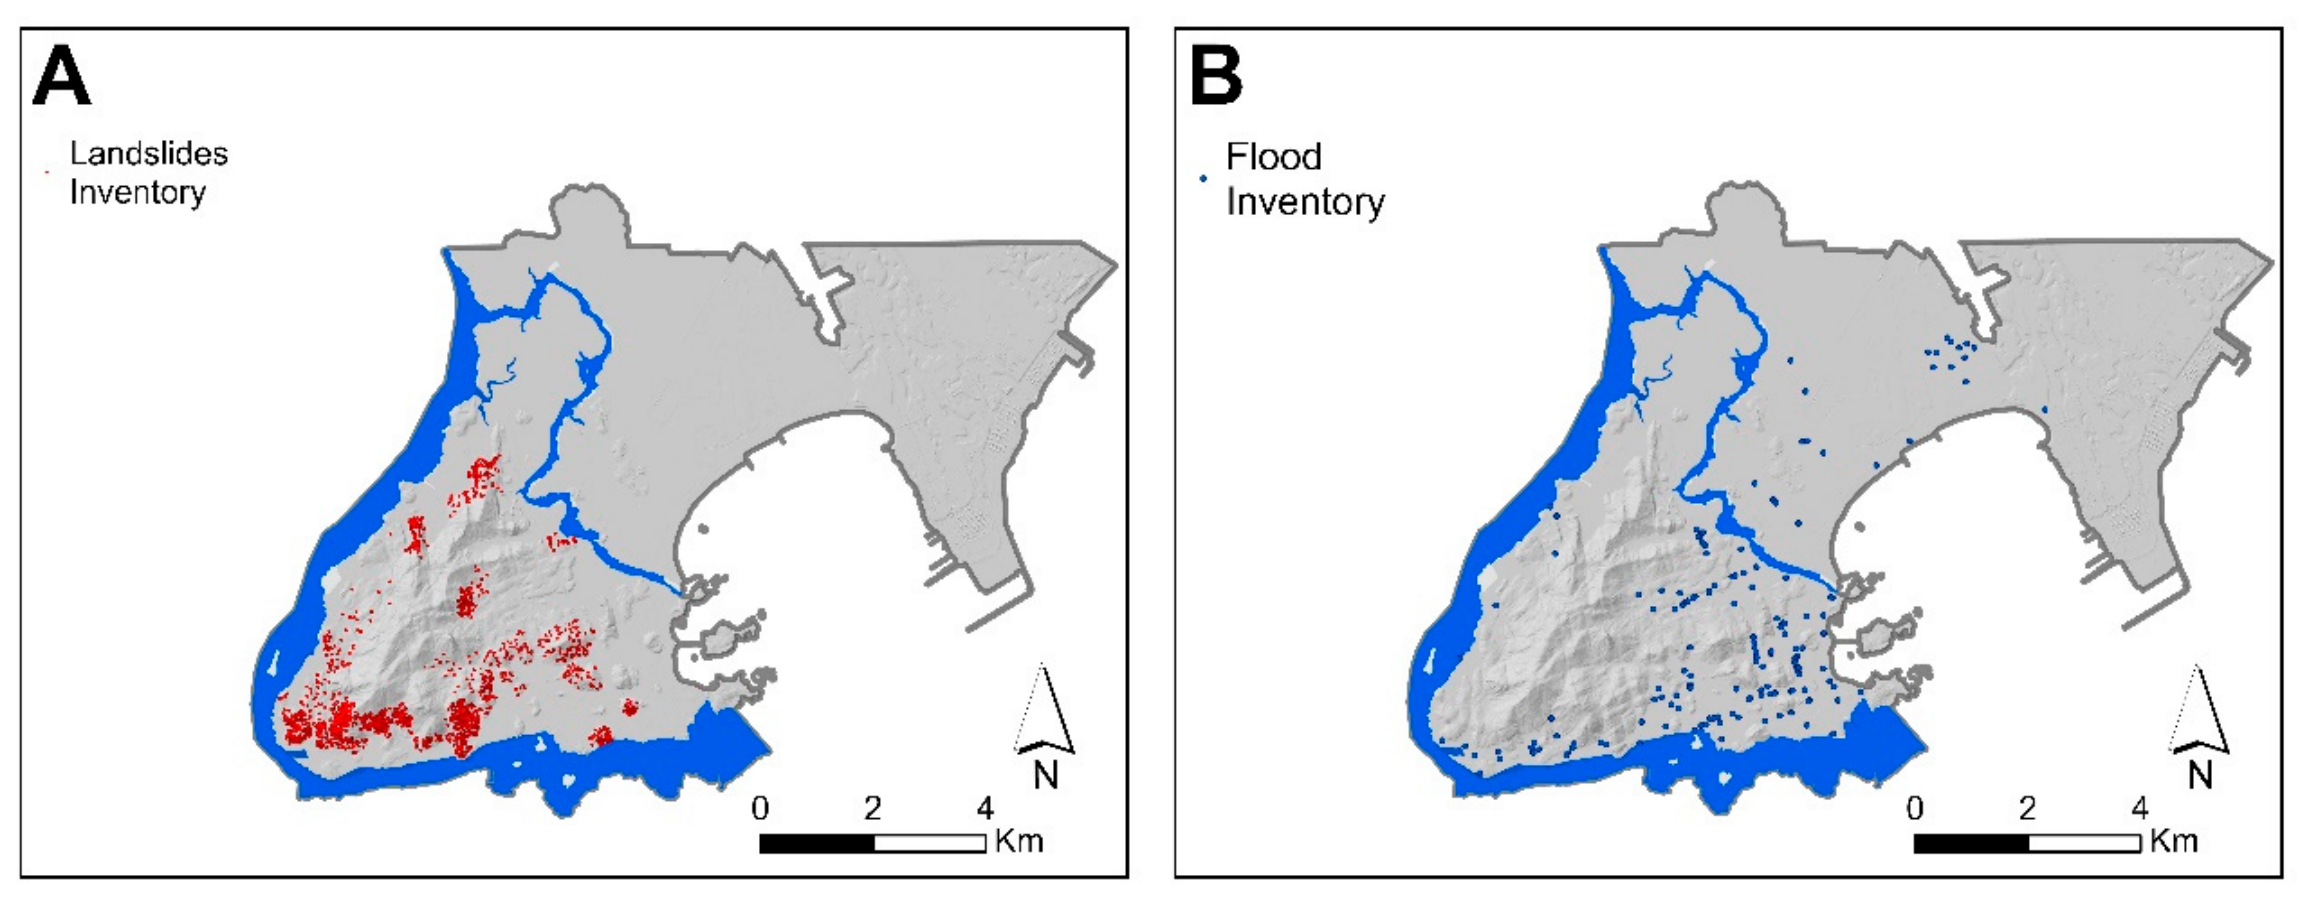
The analysis of the inventory indicated that some points were located in areas with no slope or within landslide impact zones, such as residential buildings or other infrastructure. In such cases, distinguishing scar points from deposit areas is crucial for identifying differences in the associated physical characteristics [41]. To improve the accuracy of the inventory, records located in flat areas were excluded, and contour lines and orthophotos provided by Geobases [42] were used to relocate points from impact zones to starting zones. This refinement resulted in a final dataset of 2190 points (Figure 2A).
Figure 2.
Inventory of landslide points (in red) (A) and flood points (in blue) (B) registered in the study area.
For floods, since the municipality did not systematically record previous flood events, there was no flood database available. To address this lack of information, a multi-temporal database was created based on news reported by the press. News items from the main newspapers (A Gazeta, A Tribuna, ES Hoje, ES Notícias, Folha Vitória and G1) were retrieved, covering the period from 1993 to 2023. The methodology followed a similar approach to that used by the DISASTER project, a GIS database on hydro-geomorphologic disasters in Portugal [43].
The generated data were georeferenced in a point shapefile and include the date of the event and the neighbourhood where the event occurred. In total, 283 flood points were georeferenced, with a positional accuracy ranging from very high (1:1000 scale) to high (1:10,000 scale) (Figure 2B).
To select meaningful predisposing factors for both hazards considered, namely landslides and floods, several studies that had already applied the Information Value method were consulted [10,11,13,15,16,18,44,45]. Despite the extensive use of data-driven methods, there is no consensus on which variables should be used in these models. In this sense, the selection was made based on the quality of available data and the nature of the area [46].
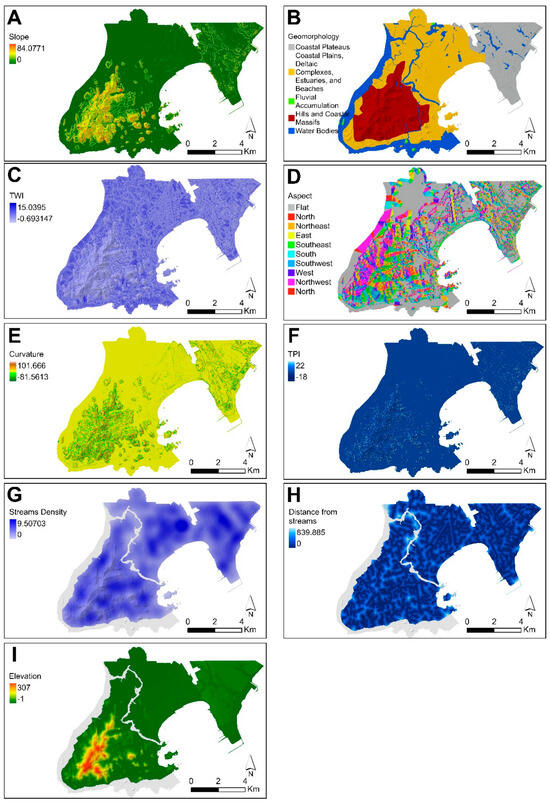
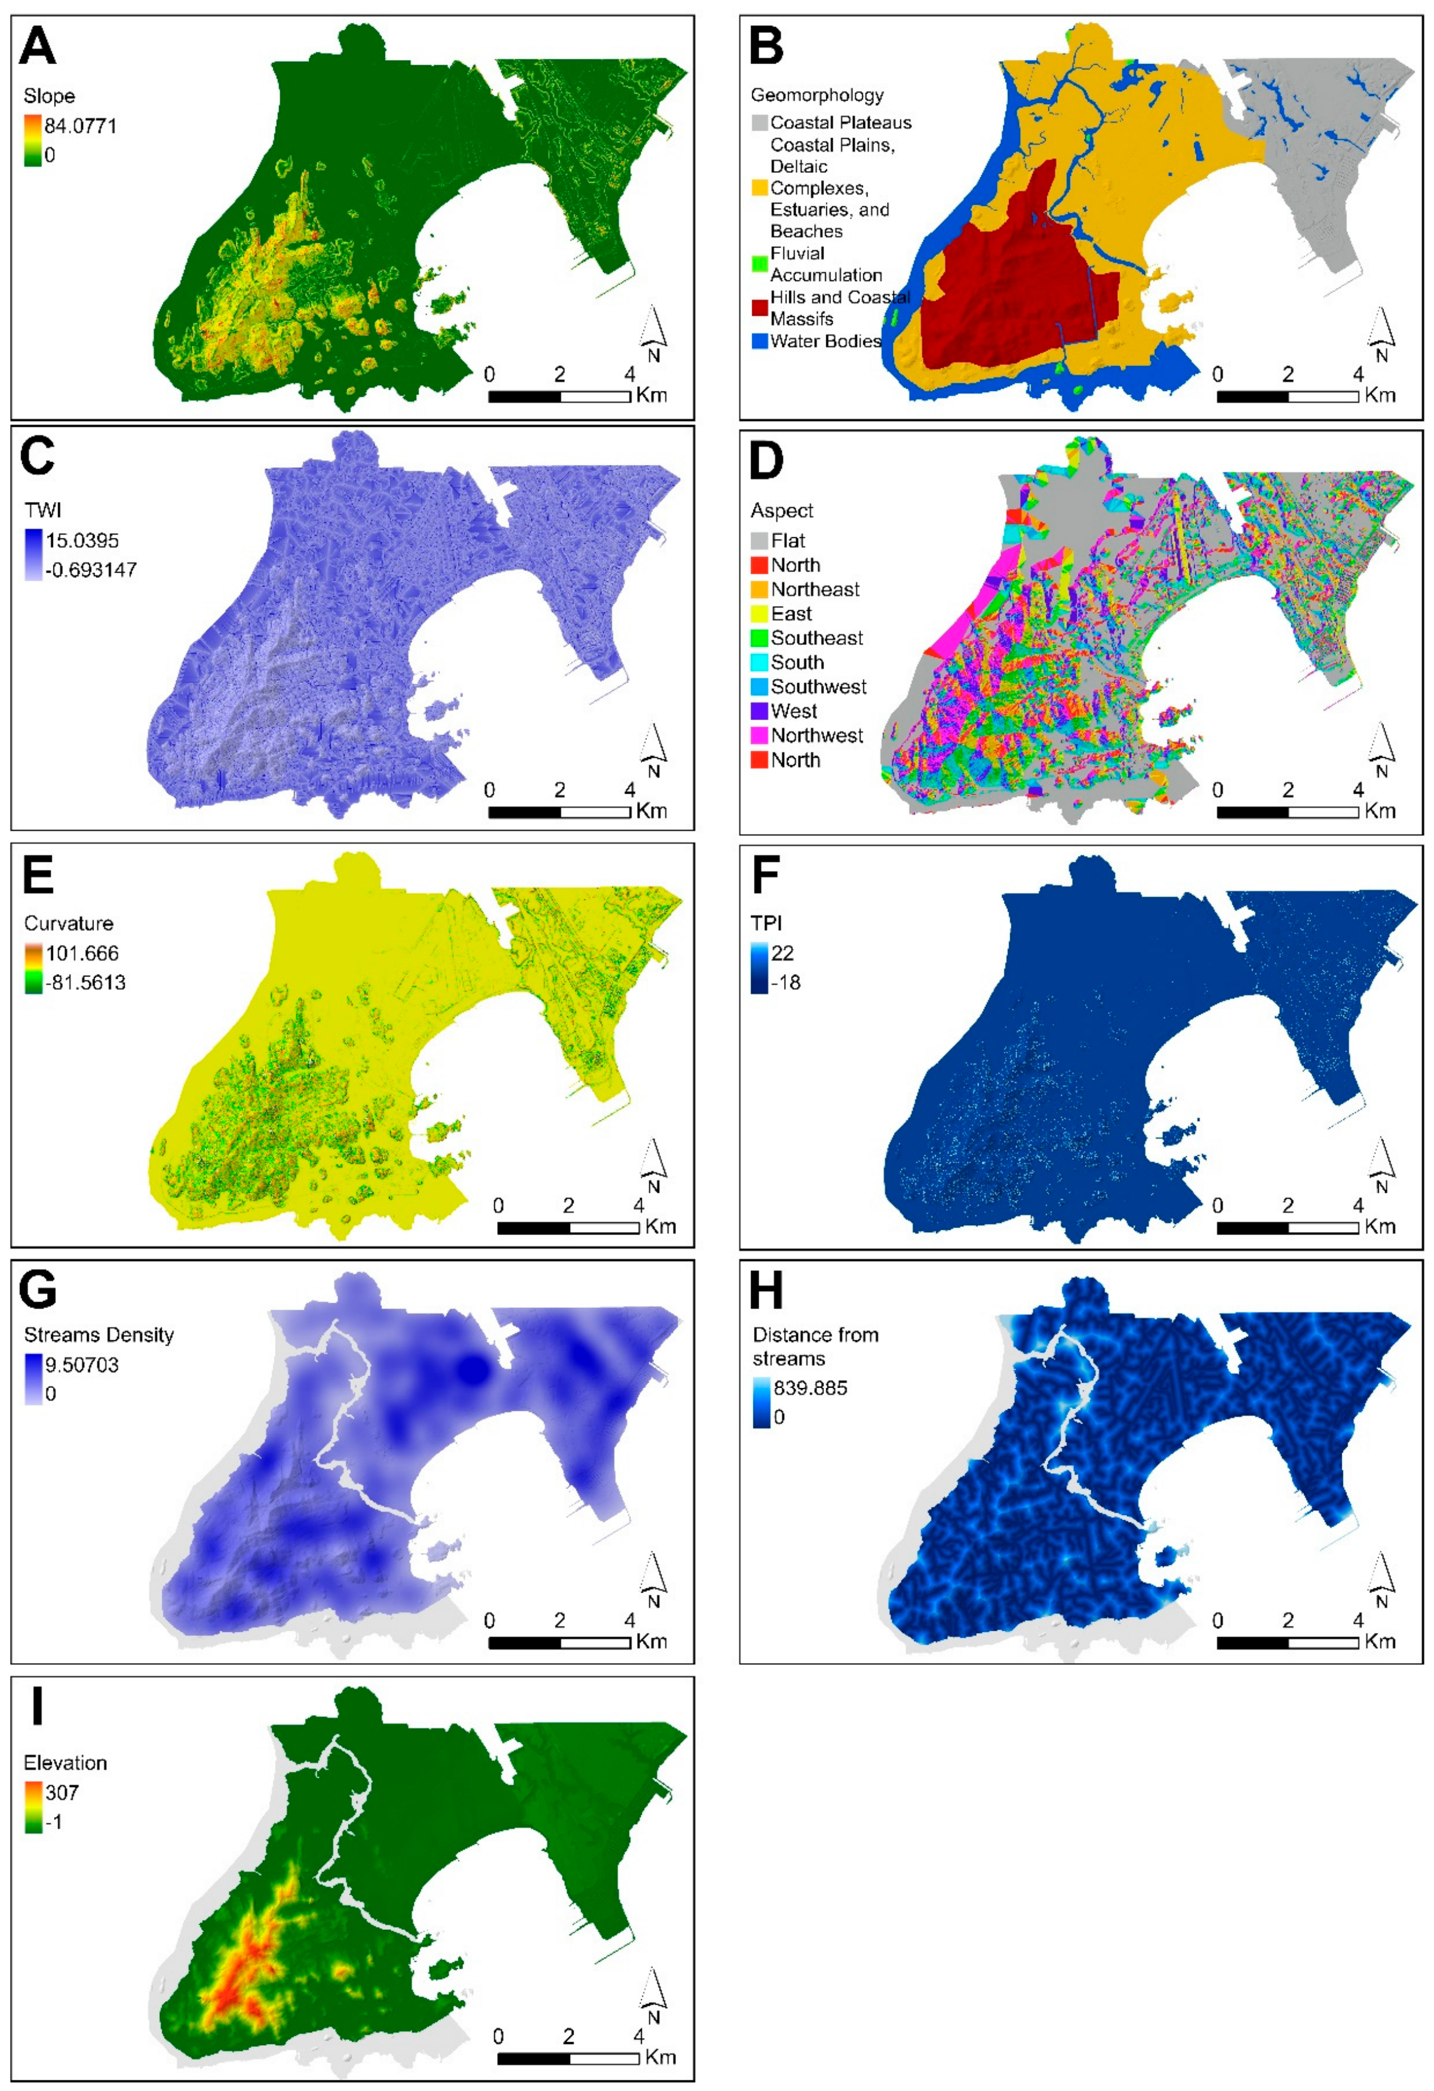
In total, besides LULC datasets, six predisposing factors were considered for each hazard, including both geomorphological and hydrological variables. For landslide susceptibility analysis, the selected factors were slope angle, slope aspect, slope curvature, topographic position index (TPI), topographic wetness index (TWI), and geomorphology. Flood susceptibility analysis, in turn, used distance from streams, elevation, geomorphology, slope, stream density, and TWI (Figure 3). Elevation was included in the flood model because it helps represent low-lying terrain prone to water accumulation, whereas it was excluded from the landslide model because slope-related variables, such as slope angle and TPI, already capture the geomorphological conditions controlling slope instability, making elevation partly redundant.
Figure 3.
Predisposing factors used to model landslide and flood. (A) slope, (B) geomorphology, (C) TWI, (D) slope aspect, (E) slope curvature, (F) TPI, (G) stream density, (H) distance from streams and (I) elevation.
Although rainfall is associated with both floods and landslides, it is generally regarded as a triggering factor rather than a conditioning factor. Consequently, several studies argue that rainfall should not be included as a predictor in susceptibility models, which are intended to represent the intrinsic spatial predisposition of the terrain rather than the occurrence of specific triggering events [47,48]. Furthermore, Vitória has only one meteorological station with a complete rainfall time series. Incorporating rainfall into the susceptibility model would therefore require treating it as a spatially uniform and temporally static conditioning factor, an assumption that is inconsistent with the highly variable nature of precipitation and has been discouraged in previous studies [47,49,50,51].
A digital elevation model (DEM) was generated from a digital topographic map with contour lines at 5 m intervals, available on the municipality’s website. A pixel size of 5 m (25 m2) was adopted to the DEM layer and was the mapping unit adopted in all analyses. The DEM was also used to derive the following landslide predisposing factors layers: slope angle, slope aspect, slope curvature, TWI, TPI, distance from streams, and elevation. Geomorphology information was obtained from the Municipal Urban Plan, at the scale of 1:10.000, and the boundaries were checked and rectified with the aid of the ortho-rectified aerial photos obtained in 2019–2020 [42]. The geomorphological units identified in the study area were categorized into five classes: (i) Coastal Plains, Deltaic Complexes, Estuaries, and Beaches; (ii) Hills and Coastal Massifs; (iii) Water Bodies; (iv) Fluvial Accumulation; and (v) Coastal Plateaus. Stream density was calculated using the standard Kernel Density tool (Spatial Analyst Toolbox in ArcGIS Pro 3.3.1), applied to the stream network. Table 1 summarizes the geo-environmental predisposing factors and their classes considered for landslide and flood susceptibility assessment in the study area.
Table 1.
Landslide and flood predisposing factors and variable classes considered for susceptibility assessment.
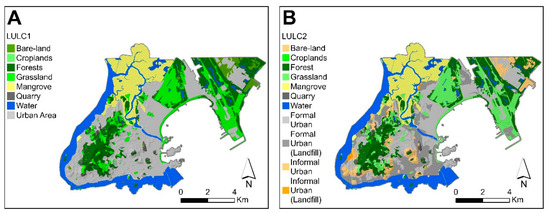
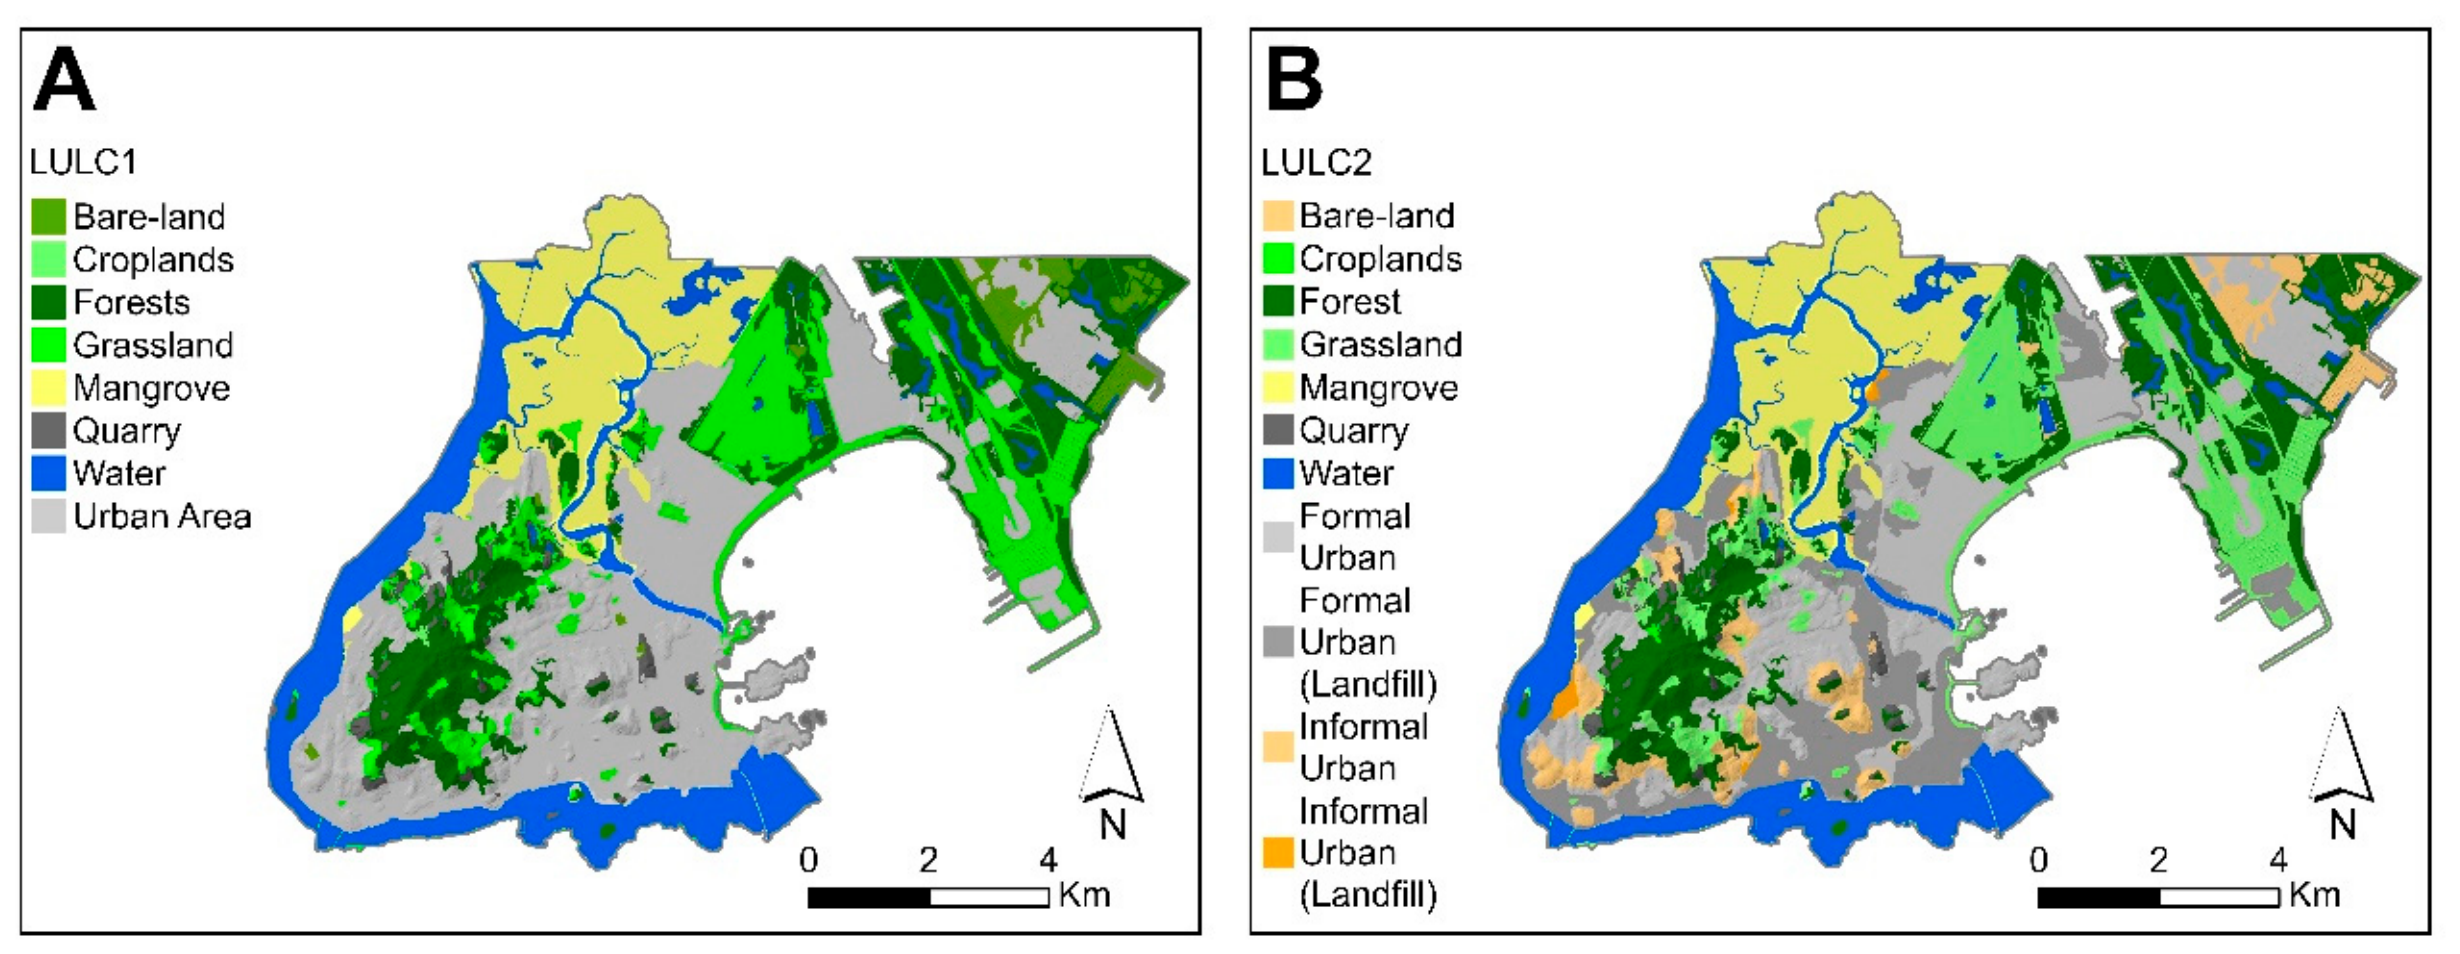
For the susceptible assessment of both landslides and floods, LULC information was obtained from Geobases [42]. The LULC dataset was classified based on aerial orthophotos taken between 2019 and 2020. It was then reclassified to include the following classes: water, grassland, forests, urban areas (built-up areas), croplands, bare land, mangrove, and quarry, forming the first LULC map (LULC1—Figure 4A). This dataset was later modified to include greater urban detail, including the location of slums, based on data representing 2020 conditions, obtained from [52] and landfill areas created from 1970 to 2016 [53], in an attempt to better capture urban characteristics and assess their influence on the susceptibility models [54]. Therefore, adjustments were made to the urban area classification, distinguishing between formal and informal settlements, with and without landfill areas, forming the second LULC map (LULC2–Figure 4B). Table 2 summarizes the LULC1 and LULC2 classes considered for landslide and flood susceptibility analysis in the study area.
Figure 4.
Land use and land cover maps, with generalized urban classes (LULC1—(A)) and detailing of urban classes (LULC2—(B)).
Table 2.
LULC1 and LULC2 and its variable classes considered for susceptibility assessment.
2.3. Individual and Composite Sensitivity Analysis
The number of predisposing factors that can be used in susceptibility mapping is vast, as pointed out by [14]. Nevertheless, increasing the number of variables does not necessarily lead to improved model outcomes [10,44]. In this sense, the degree of influence that each conditioning factor has on hazard susceptibility is one of the key aspects that define the quality of the final models [45]. In our study, the sensitivity of predisposing factors for landslide and flood susceptibility was evaluated in two steps.
In the first step, we evaluated the individual importance of each conditioning factor for landslide and flood occurrence, using the complete inventory of each hazard to train and test individual responses. Using the Information Value method, this analysis involved calculating the area under the success-rate curve (AUC) for each factor, including the land use and land cover datasets. The AUC was also used to rank the variables according to their importance, as suggested by [15].
In the second step, the individual importance of each predisposing factor for landslides and floods was used to establish the order of cartographic integration. To this end, 18 susceptibility models were computed for each hazard, including six models with from-six-to-one predisposing factors, which were also tested with the addition of LULC1 and LULC2, one at a time (Table 3).
Table 3.
Summary table of susceptibility models constructed with different predisposing factors. Landslide predisposing factors: 1. slope, 2. geomorphology, 3. curvature, 4. aspect, 5. TWI and 6. TPI. Flood predisposing factors: 1. elevation, 2. TWI, 3. distance from streams, 4. slope, 5. geomorphology and 6. stream density.
2.4. Susceptibility Mapping with and Without LULC
To assess the influence of the LULC dataset on susceptibility, the Information Value statistical model was used to generate three different model configurations for each hazard. The first model included only the six predisposing factors: model FML for landslides and model FMF for floods. The second and third models consisted of the six predisposing factors selected for each hazard, with the addition of LULC1 and LULC2, resulting in models FML1 and FML2 for landslides, and FMF1 and FMF2 for floods, respectively.
Susceptibility models need to be trained and tested to assess their capability to predict the studied phenomena. This process usually involves the use of different samples, which can be defined based on temporal, spatial, or random criteria [55]. The most common and preferred approach to partitioning the inventory is temporal, since it enables model validation with new observations [10]. Nevertheless, when temporal information is not available, the inventory can be randomly partitioned, using cross-validation. In this study, the flood inventory allowed temporal partitioning, with 149 events recorded up to 2018 used for training and 134 events that occurred after 2018 used for validation. In contrast, for landslides, the absence of event dates made true temporal partitioning impossible. Therefore, the landslide susceptibility model was developed using a fourfold cross-validation approach based on a random partition of the inventory. This procedure generated four subsets (T1, T2, T3, and T4), containing 548, 547, 548, and 547 landslide points, respectively. In each iteration, three subsets were combined for training, and the remaining subset was used for validation. The final landslide susceptibility model was obtained by averaging the Information Value scores for each class of each landslide conditioning factor, as derived from the four models. Since the fourfold cross-validation was based on random partitioning of the landslide inventory, some degree of spatial autocorrelation between training and validation samples cannot be ruled out, and model performance may therefore be slightly overestimated.
The final models for landslides and floods were classified into five susceptibility classes, from very low to very high susceptibility, using the Jenks natural breaks method for visual interpretation, as suggested by [11]). This method aims to reflect natural patterns in data distribution, reducing variance between classes [56]. Moreover, the predictive capacity of susceptibility models was evaluated using prediction curves and computing the corresponding Area Under the Curve (AUC). At every methodological stage, particularly during the classification of the predisposing factors and the evaluation of the final models, the results were analyzed to verify their quality in comparison with real environmental conditions. This step, based on expert judgement, provides insights into model quality that cannot be captured by quantitative methods such as AUC [23]. The expert assessment was carried out by the first author, who has detailed knowledge of the study area, and focused on the geomorphological and hydrological plausibility of susceptibility patterns. In particular, the spatial distribution of the predicted susceptibility classes was visually checked against known terrain conditions, drainage patterns, slope morphology, and the location of previously mapped hazard occurrences. This qualitative evaluation was used to identify whether the model outputs were spatially coherent and physically meaningful, complementing the statistical validation.
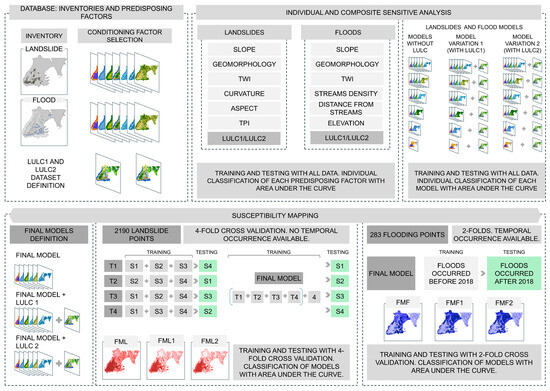
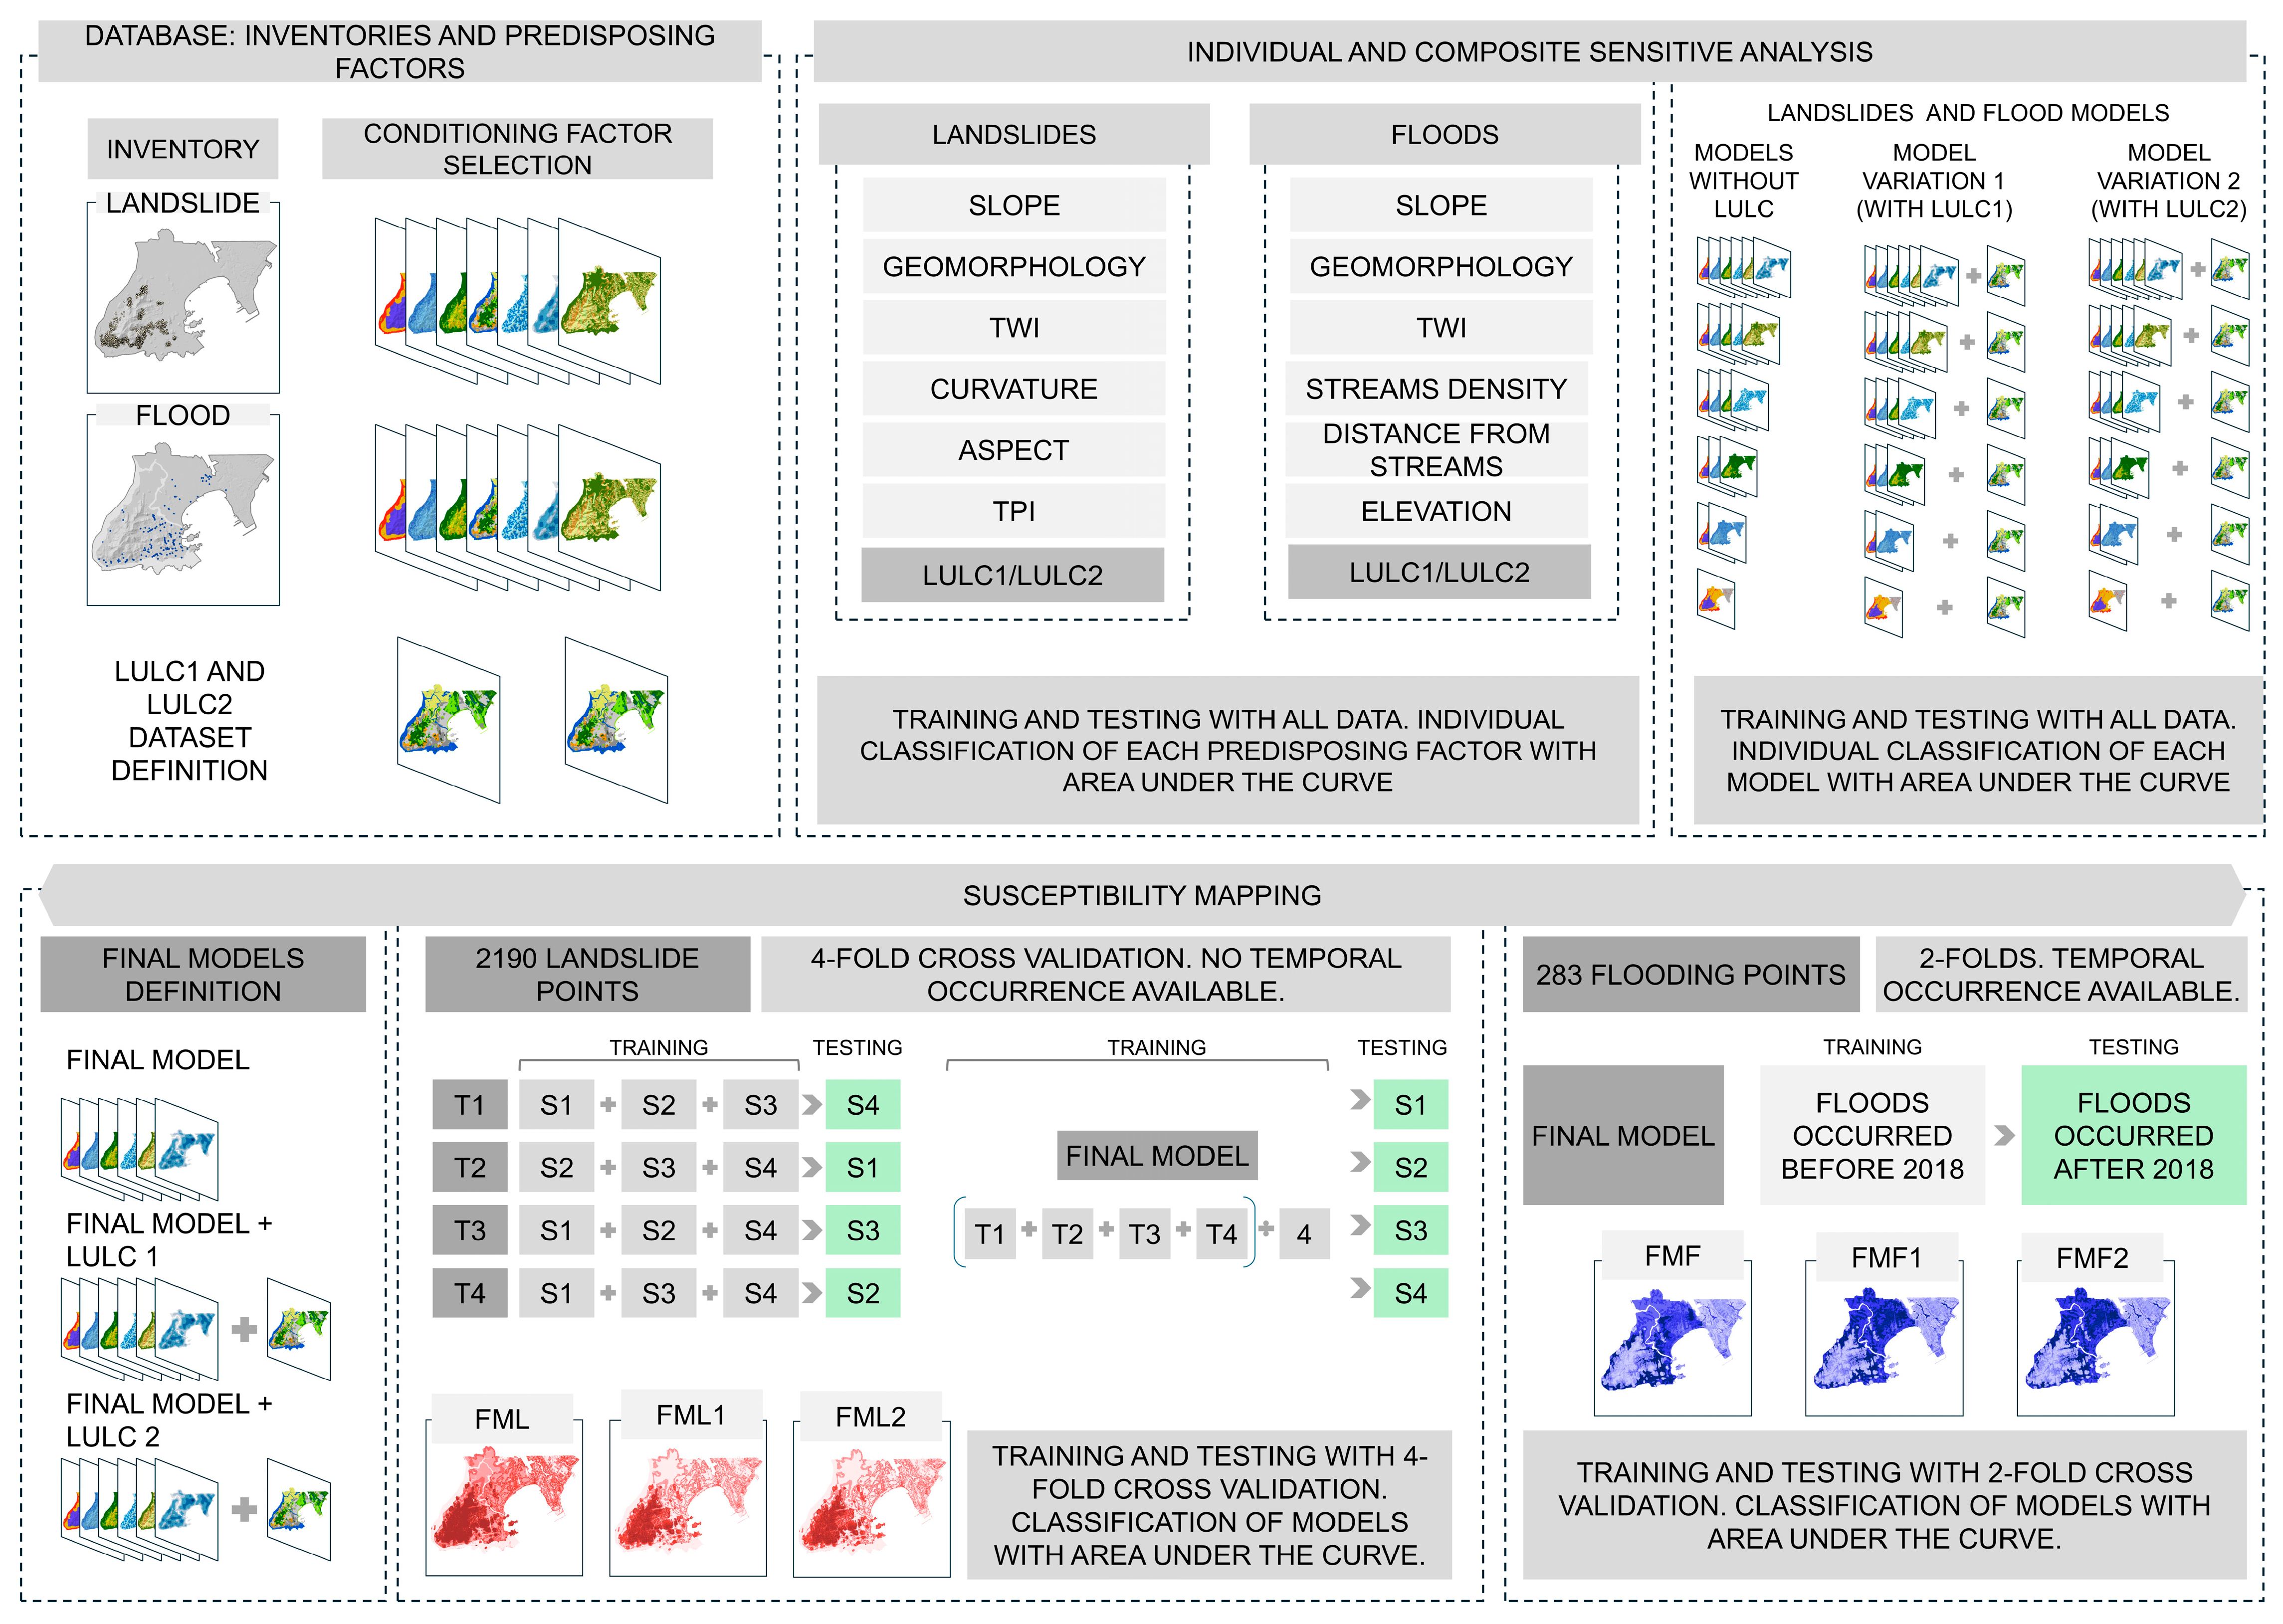
Figure 5 represents the workflow of the adopted methodology, integrating all the steps described in the above-mentioned subsections.
Figure 5.
Methodological flowchart.
3. Results
3.1. Individual and Composite Sensitivity Analysis
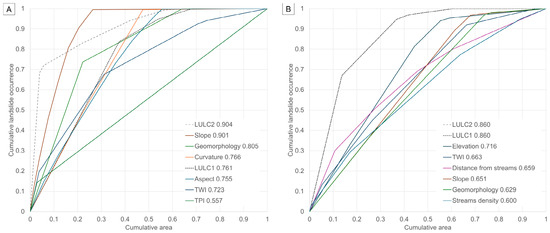
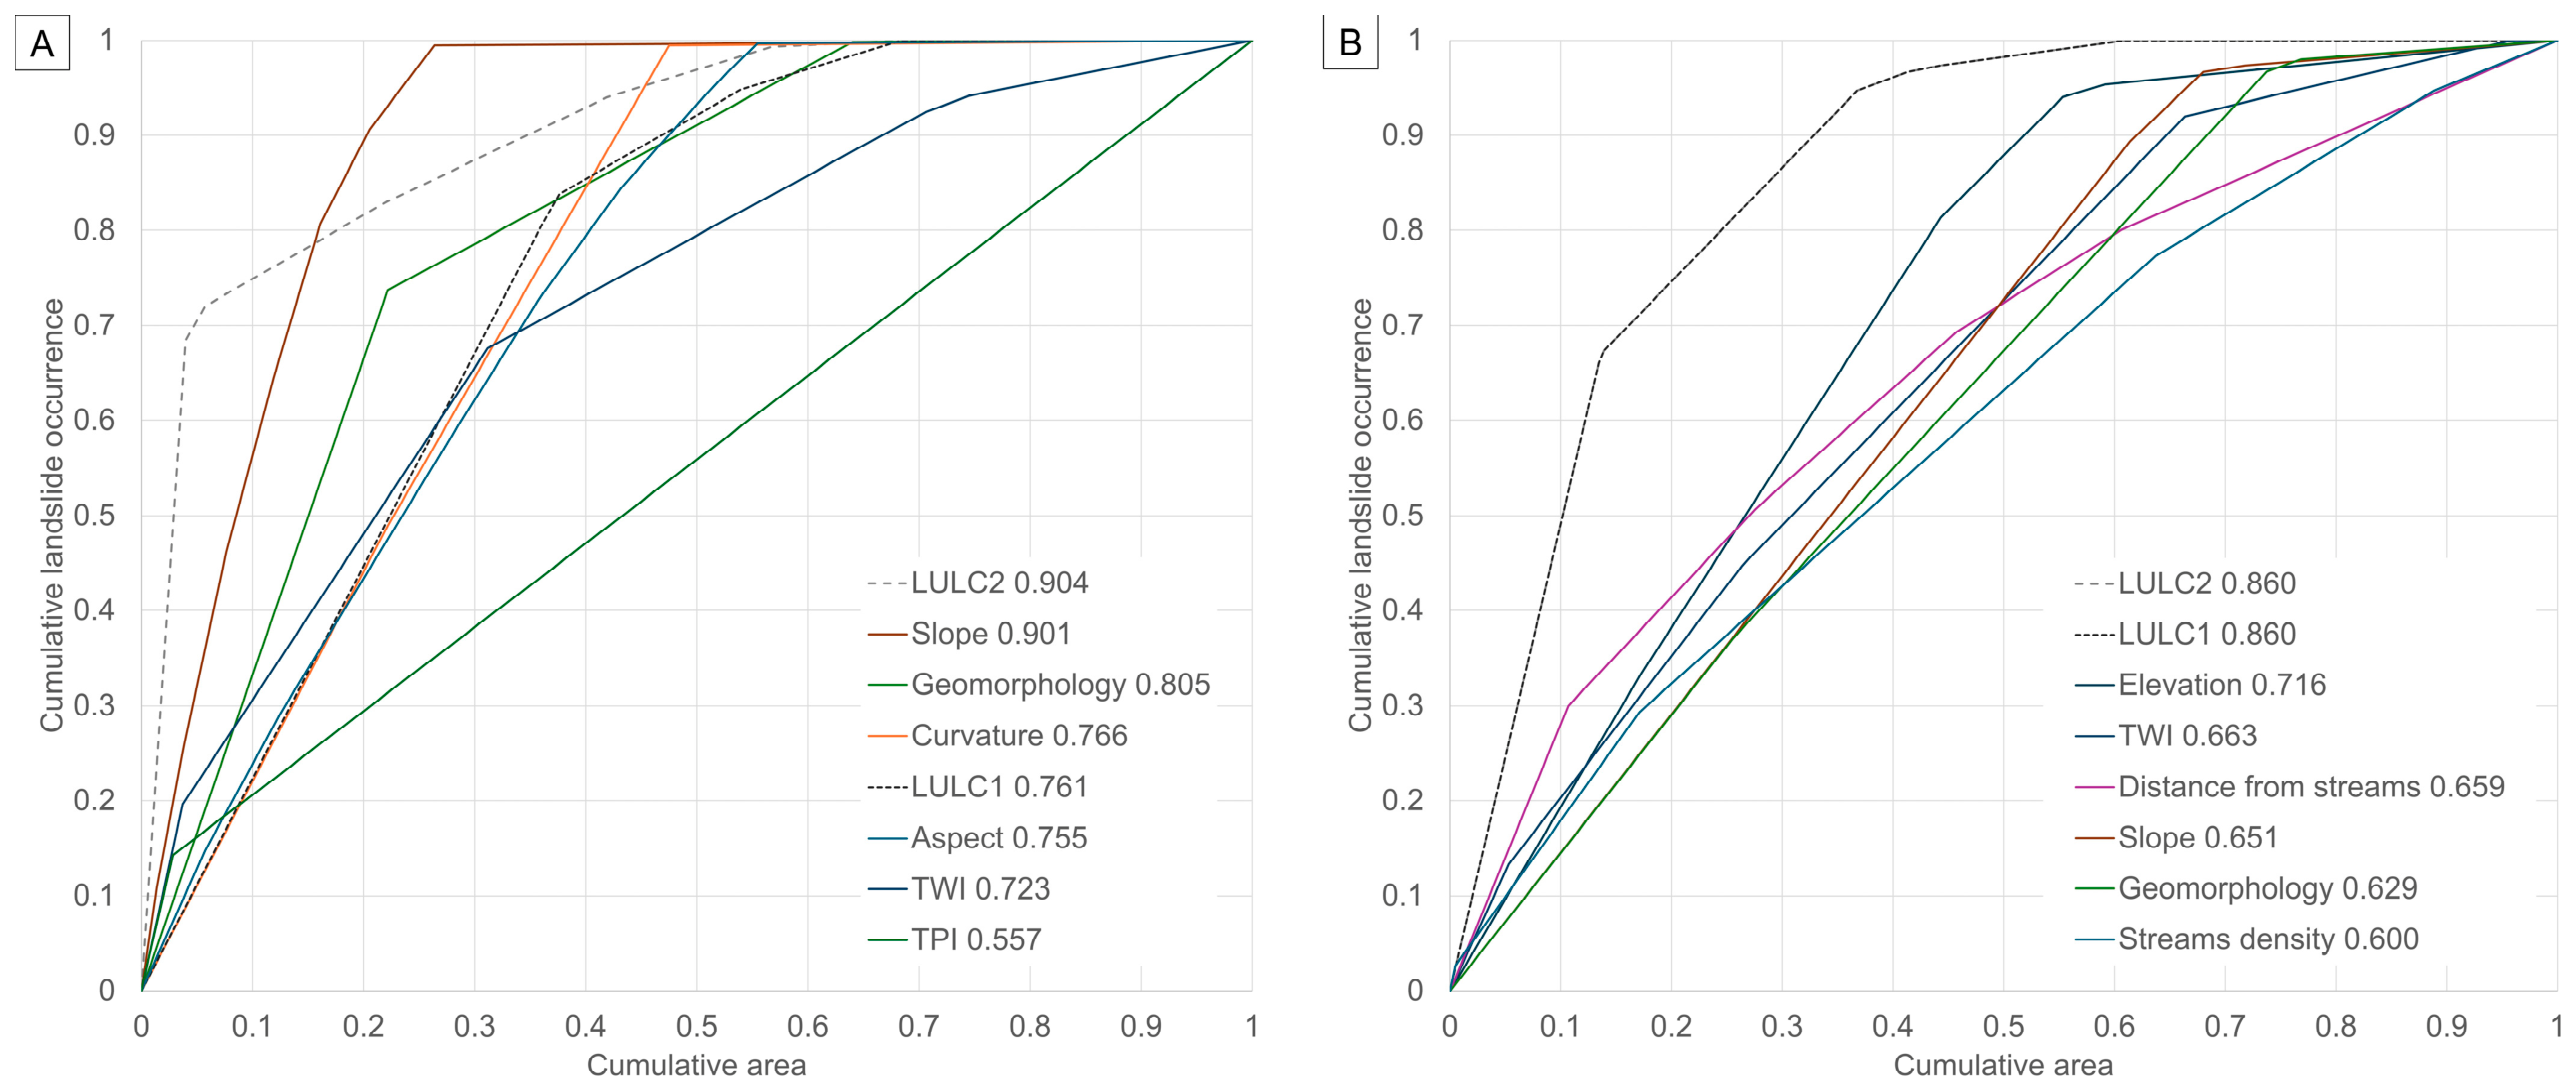
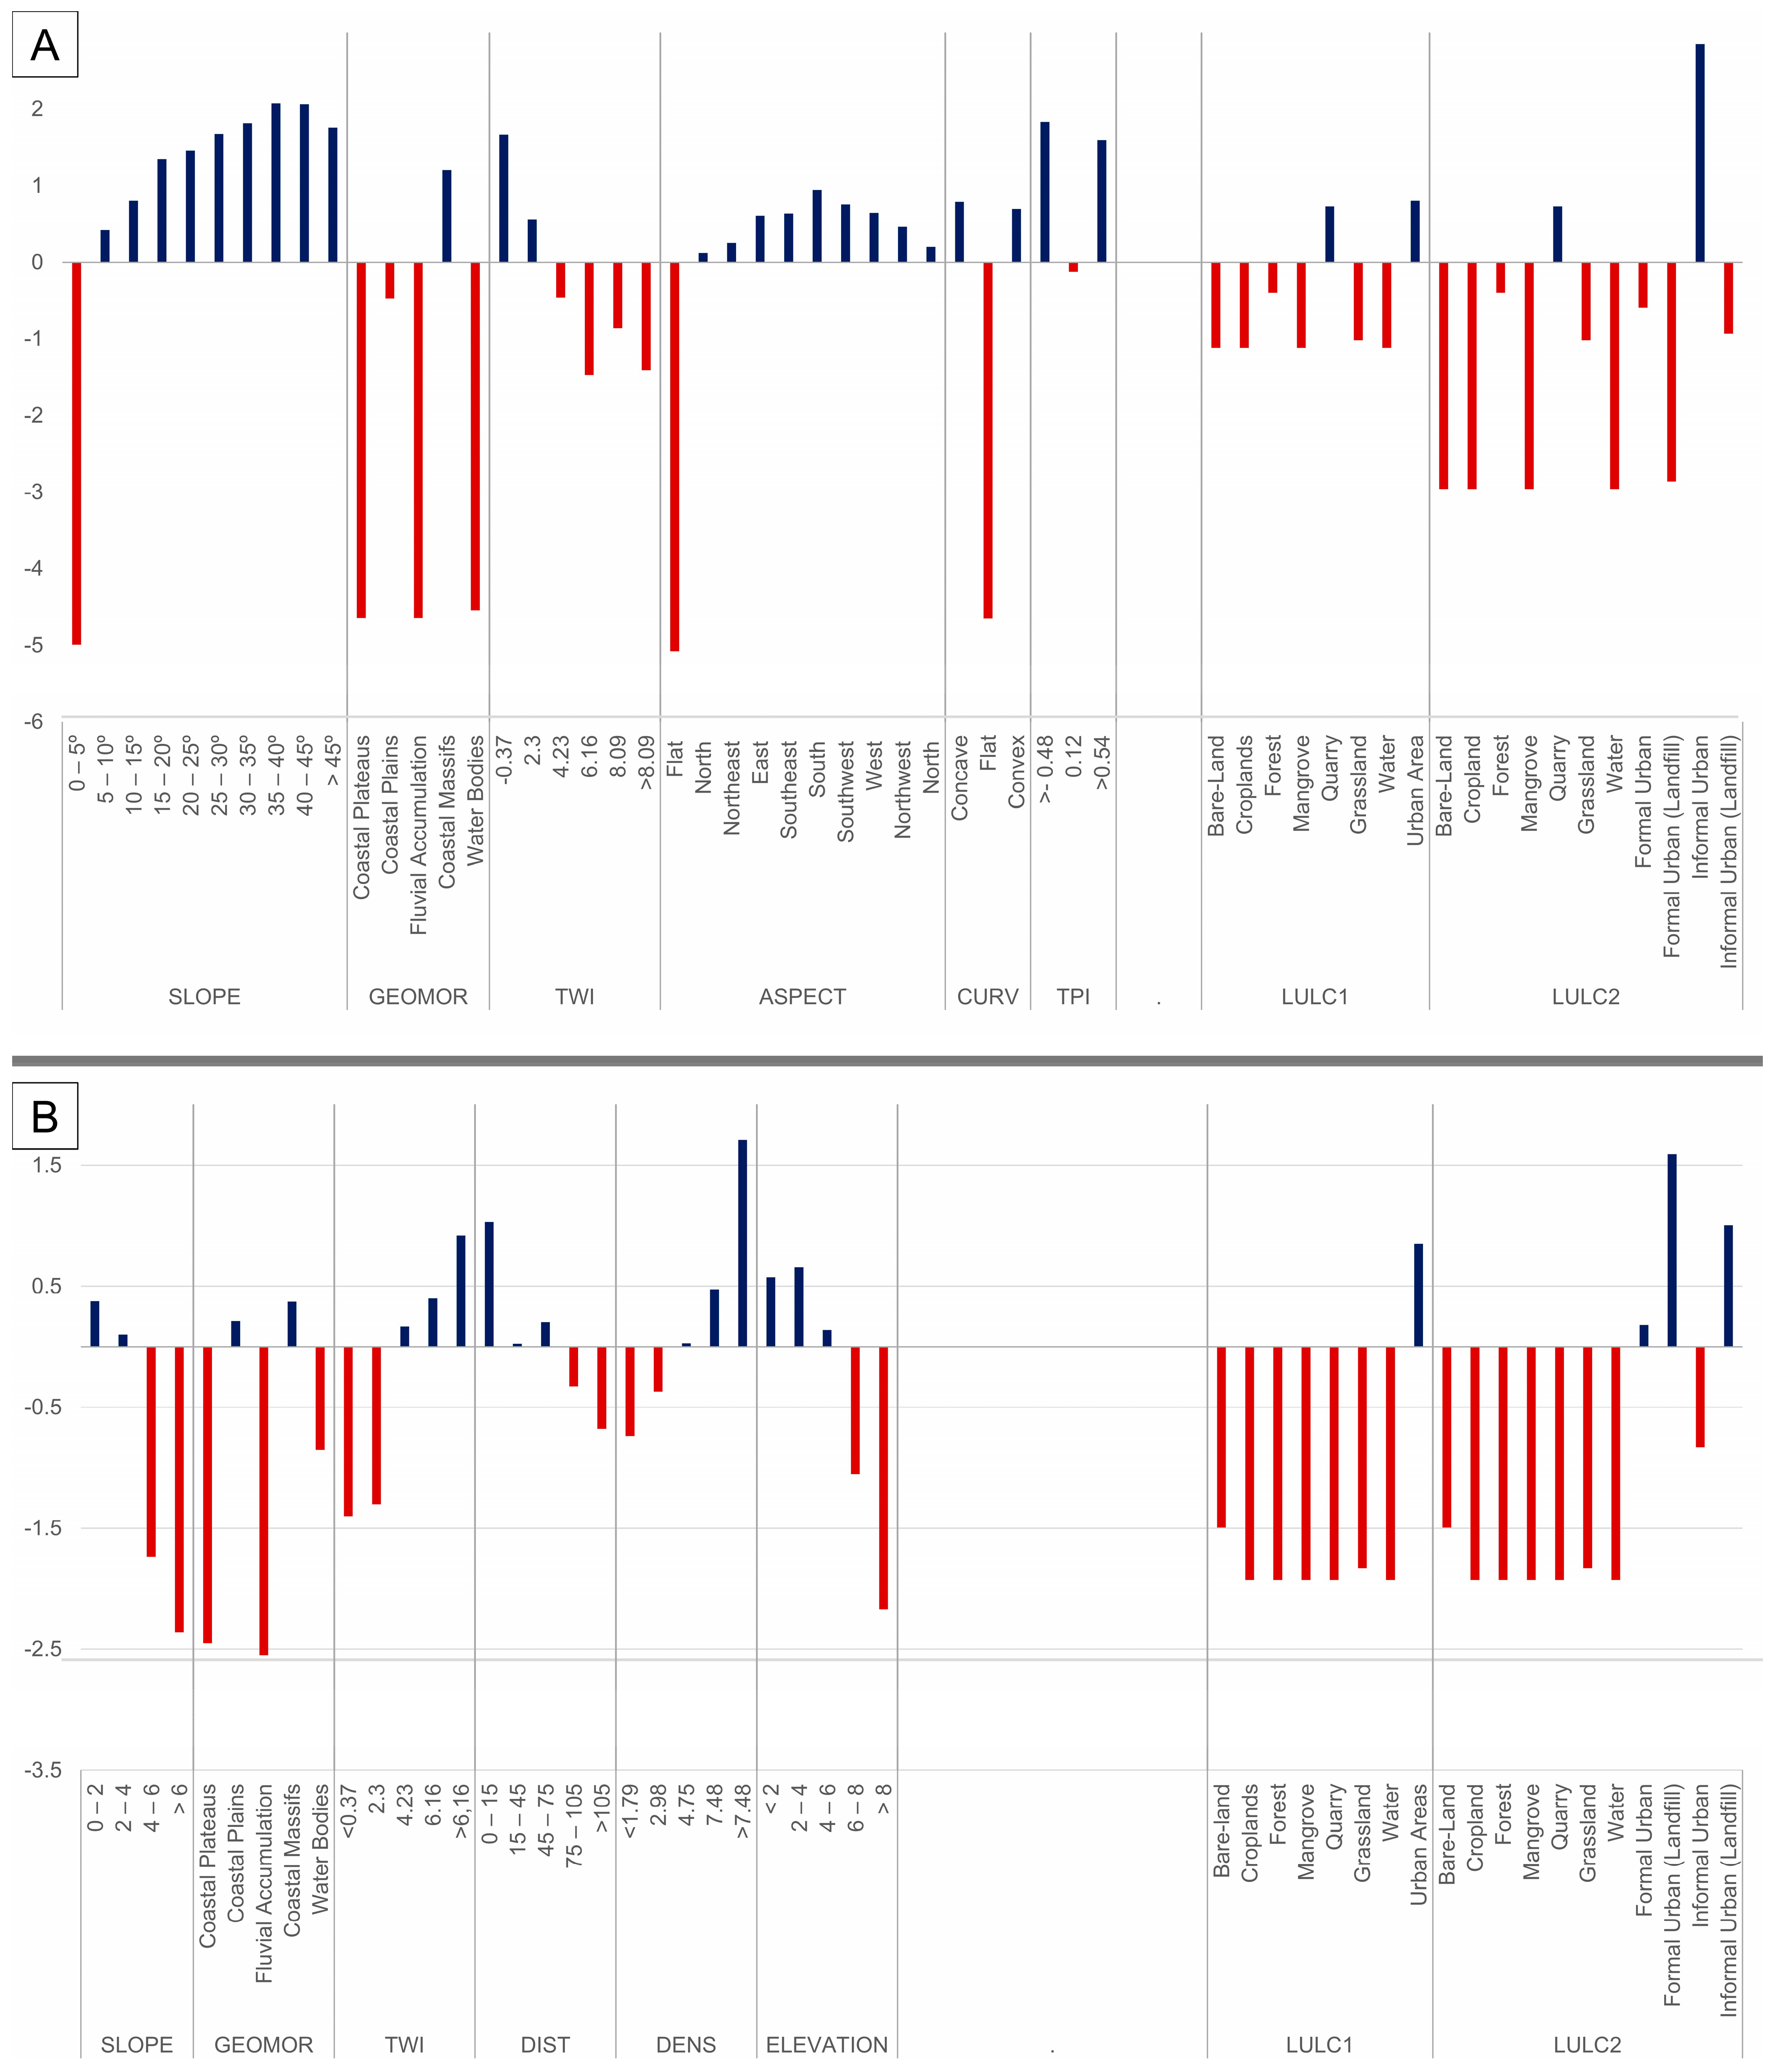
The importance of the predisposing factors as independent variables, based on the spatial distribution of previous landslide and flood events, is presented in Figure 6. The overall importance of each predisposing factor and its respective classes was also analyzed, alongside the LULC datasets and their classes (Figure 7).
Figure 6.
Relevance of predisposing factors for landslides (A) and floods (B), based on AUC values (calculated using the IV method and the complete inventory data sets).
Figure 7.
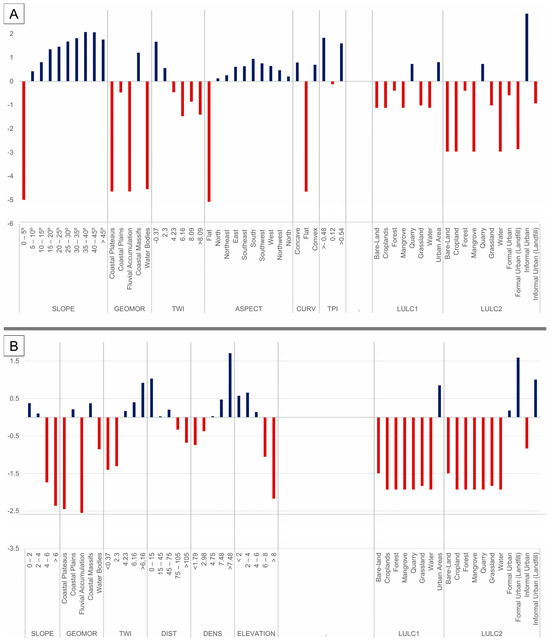
Information Value scores of predisposing factors for landslides (A) and floods (B), with positive values represented in blue and negative values represented in red. The scores of LULC1 and LULC2 are also shown for both processes.
A joint analysis of the success-rate curves and the Information Value scores indicates that morphological attributes are the most important predictors for both hazards. For landslides, slope alone achieved a success rate of 0.90, while for floods, elevation reached 0.71. As expected, susceptibility increases with higher slope classes for landslides, whereas the opposite pattern is observed for floods, with flatter, typically low-lying areas showing the highest susceptibility scores. In both models, topographic attributes play a major role in determining susceptibility, reinforcing the idea that areas naturally prone to landslides and floods due to terrain characteristics have a higher likelihood of process occurrence, regardless of human occupation.
Geomorphology, slope curvature, aspect, and TWI also exert a strong influence on the landslide process, with all parameters producing curves above 0.70. Among the classes, Hills and Coastal Massifs, associated with steep gradients, south- and southwest-facing slopes, and ridge areas show the highest Information Value scores. For floods, TWI, distance from streams, slope, geomorphology, and stream density exhibit similar AUC values, ranging from 0.62 to 0.66. In both processes, all predisposing factors behaved as expected, with higher IVs corresponding to areas naturally more prone to landsliding or flooding.
Regarding the potential impact of land use and land cover on susceptibility performance, our analysis revealed that LULC2 exhibits an extremely high success rate for both processes (0.90 for landslides and 0.86 for floods), while LULC1 shows a higher impact on floods (0.86) compared to landslides (0.76). For landslides, positive IV scores were observed in the Informal Urban class of LULC2. In contrast, for floods, the results differed slightly, with Formal urban areas (with or without landfill) and Informal Urban areas (with landfill) being the only classes with positive IV scores.
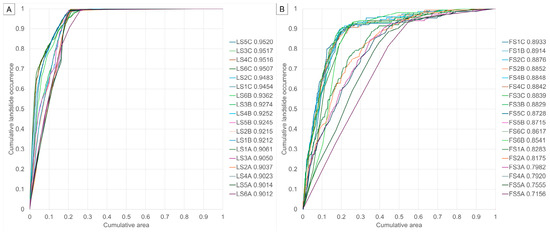
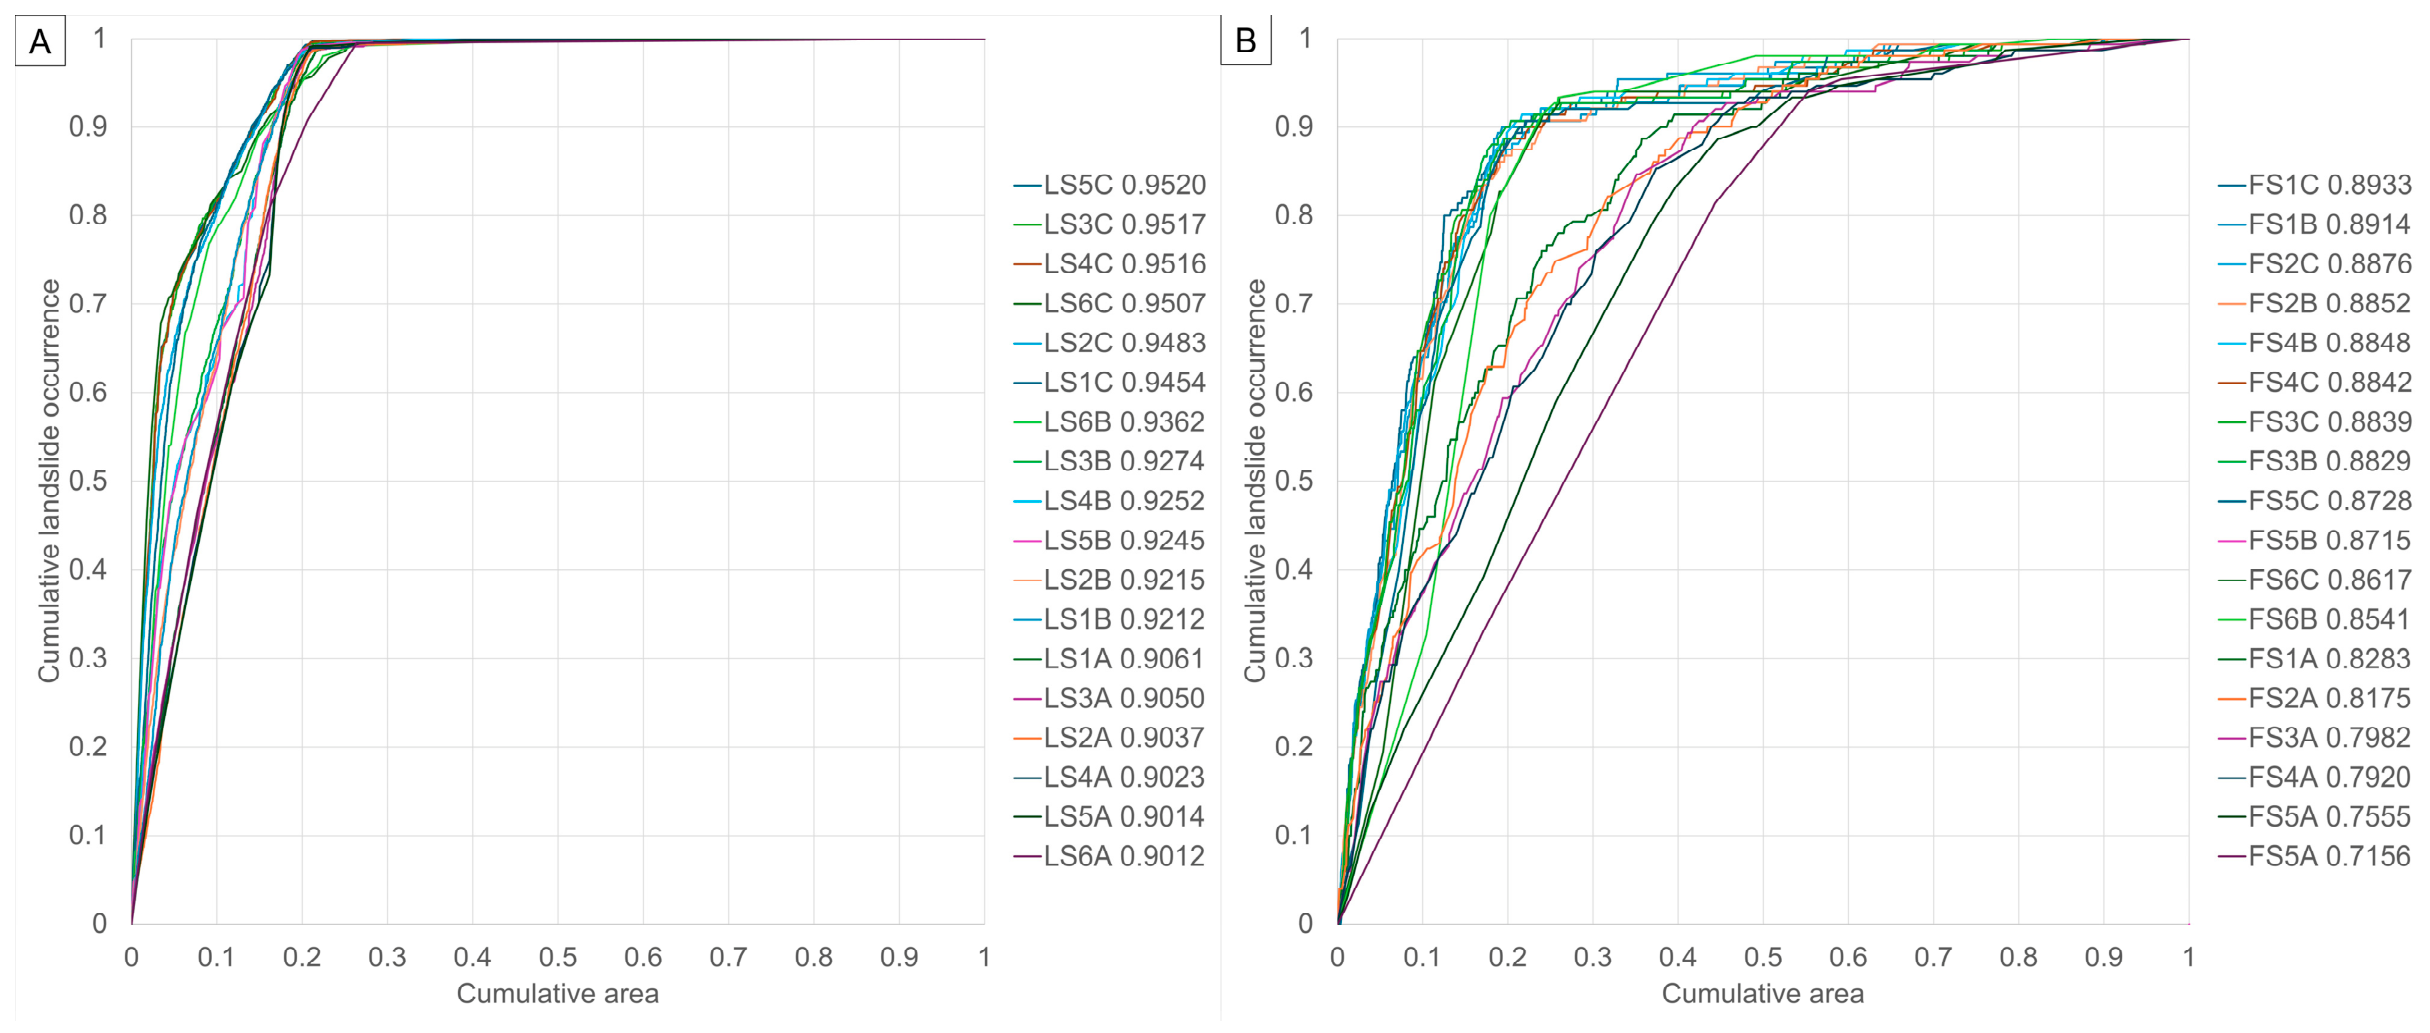
The success-rate curves of the eighteen susceptibility models produced for each hazardous process, combining the respective predisposing factors and considering the individual importance of each variable, are presented in Figure 8. All models obtained produced satisfactory results, with AUC values exceeding 0.70. The landslide models including LULC2 achieved slightly higher values (0.94–0.95), followed by models including LULC1 (0.92–0.93), while the models without LULC presented the lowest AUC values (0.90–0.91) (Figure 8A). In the case of floods (Figure 8B), since the positive values related to urban classes were very close, the models including LULC1 and LULC2 exhibited comparable performance (0.85–0.89), followed by those without LULC (0.71–0.82). These results indicate that the inclusion of LULC datasets enhanced the predictive capacity of susceptibility models for both landslides and floods.
Figure 8.
Success-rate curves of susceptibility models for landslides (A) and floods (B), based on different combinations of predisposing factors, considering the complete inventory data sets and ranked from highest to lowest AUC values.
3.2. Susceptibility Models with and Without LULC
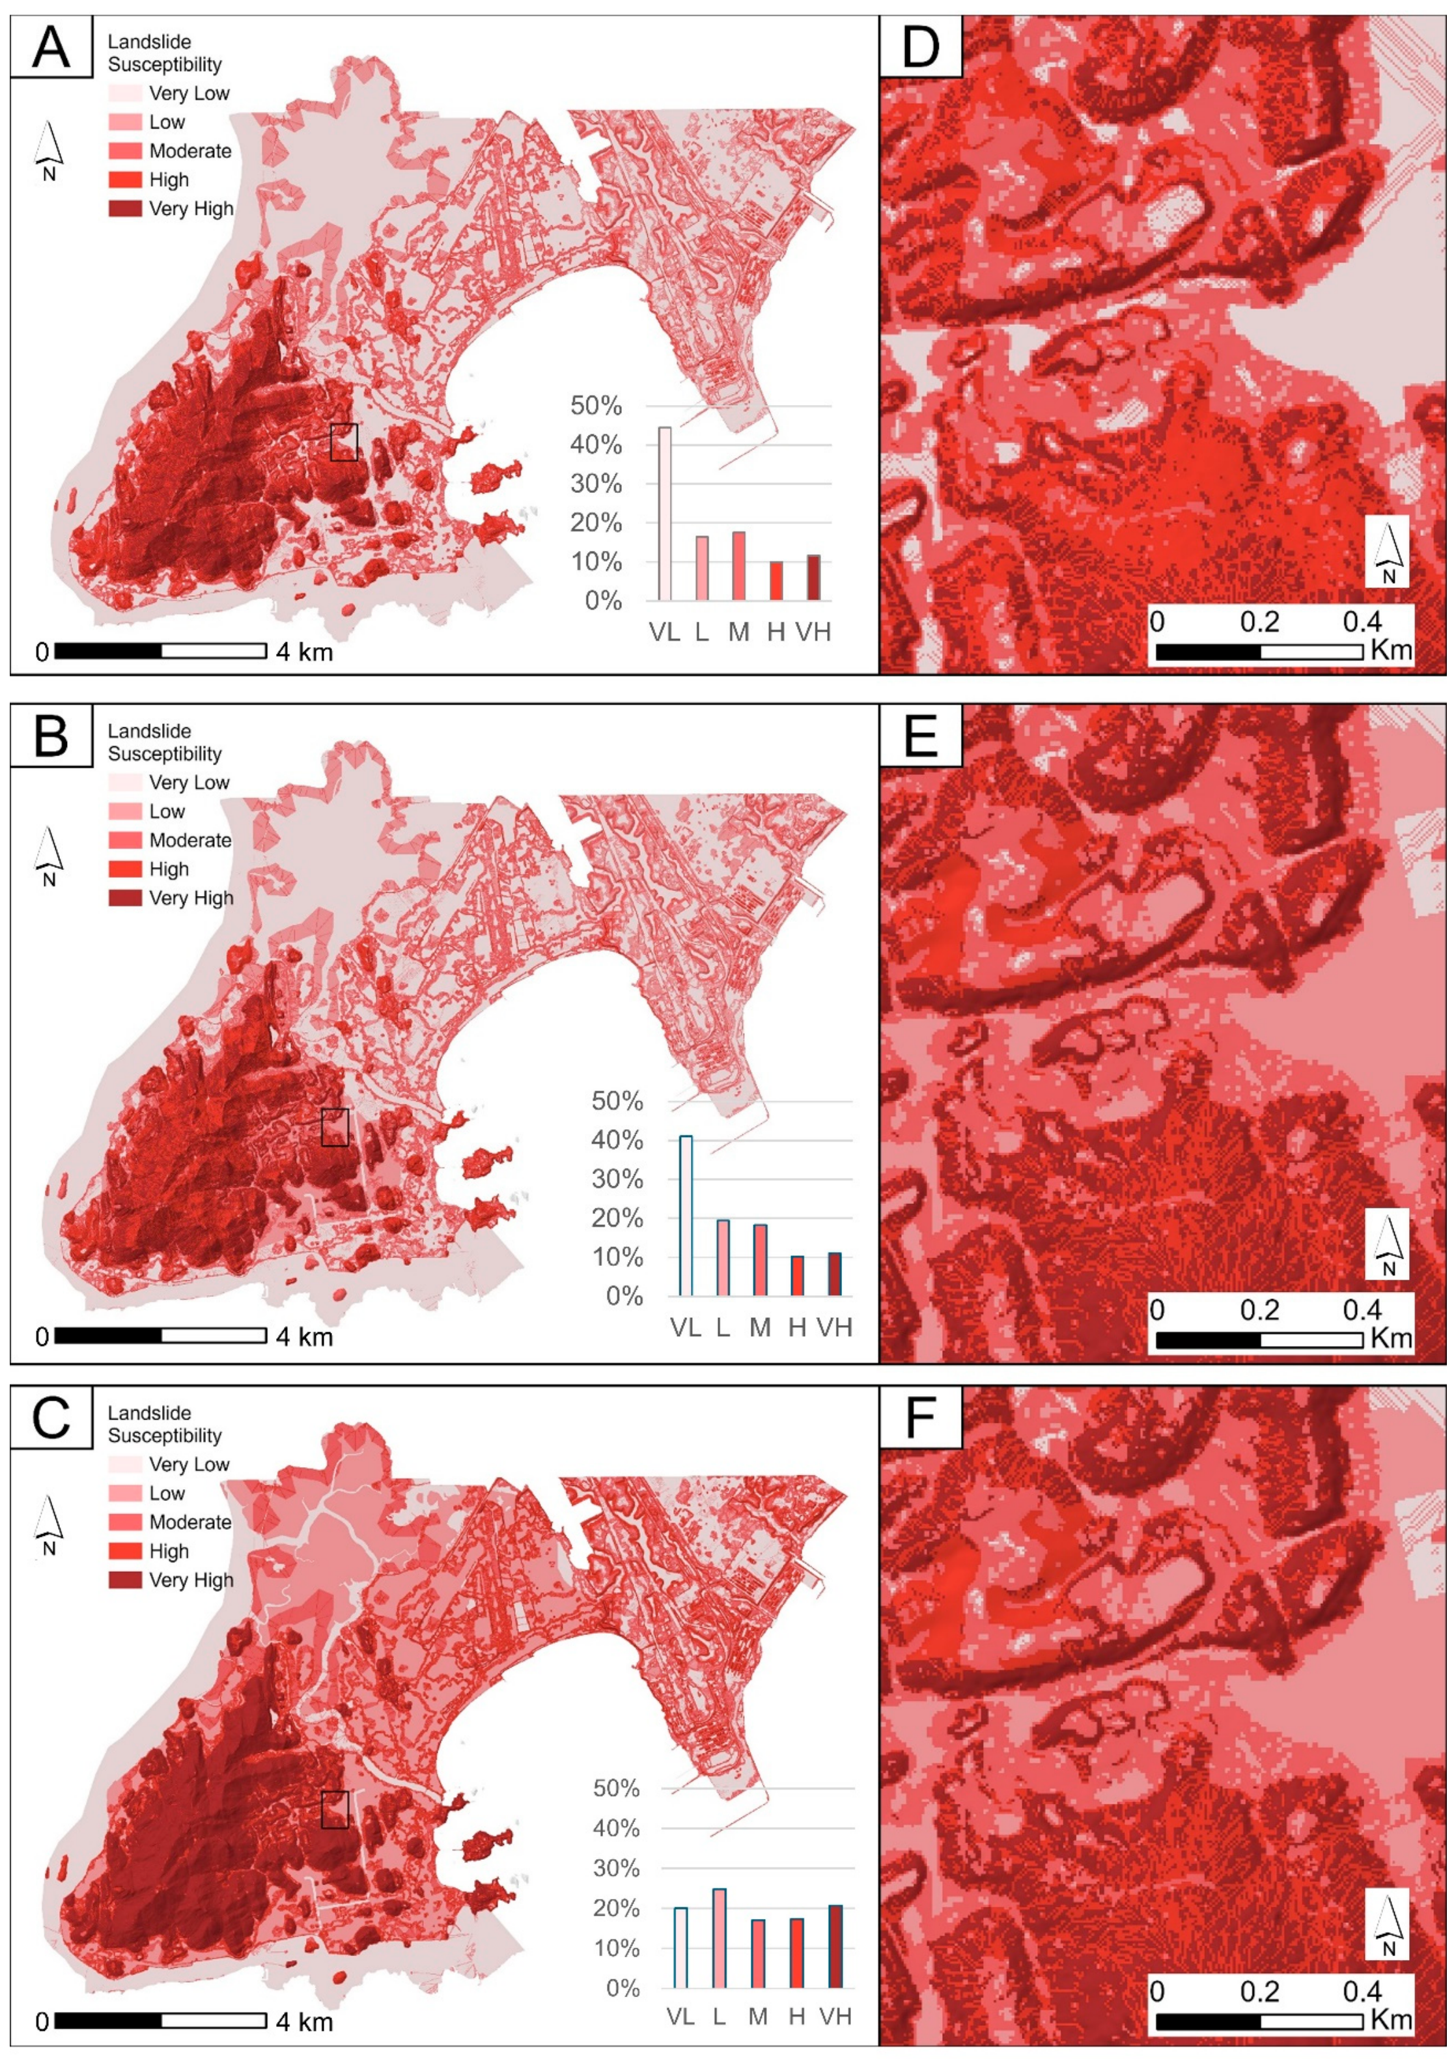
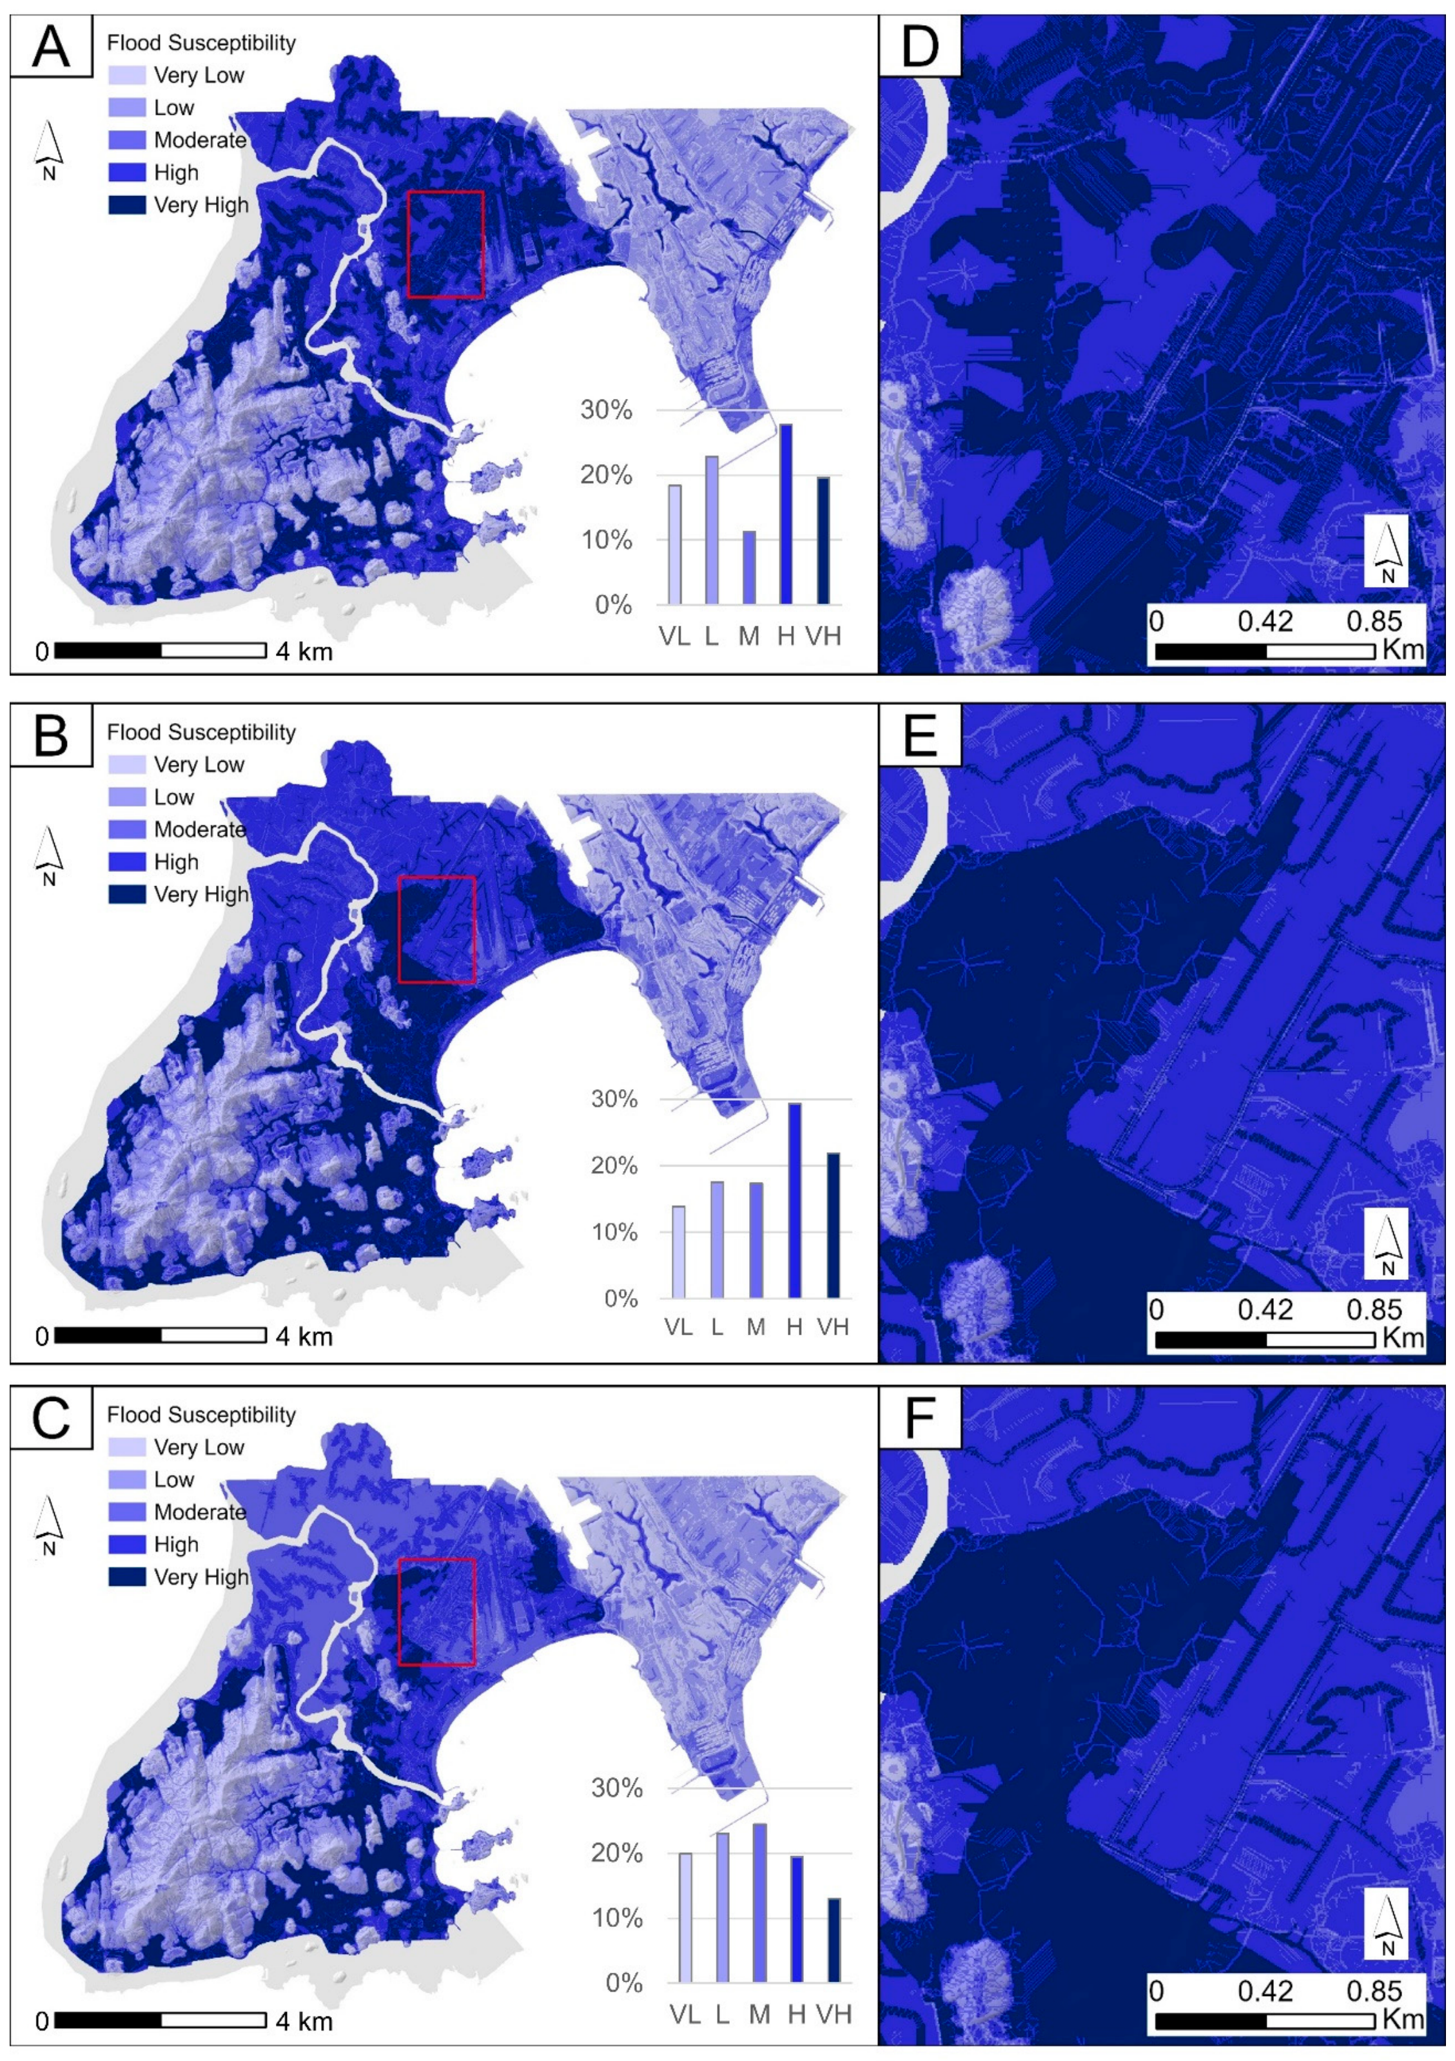
The final susceptibility maps developed for landslides (FML) and floods (FMF) integrate all six predisposing factors (Figure 9A and Figure 10A), as these factors represent the geomorphological and hydrological characteristics of the study area, thereby contributing to the reliability of predictive models. To assess the effect of including or excluding land use as a conditioning factor, a comparative analysis was performed by adding LULC1 (FML1 and FMF1, Figure 9B and Figure 10B) and LULC2 (FML2 and FMF2, Figure 9C and Figure 10C) to the final susceptibility maps.
Figure 9.
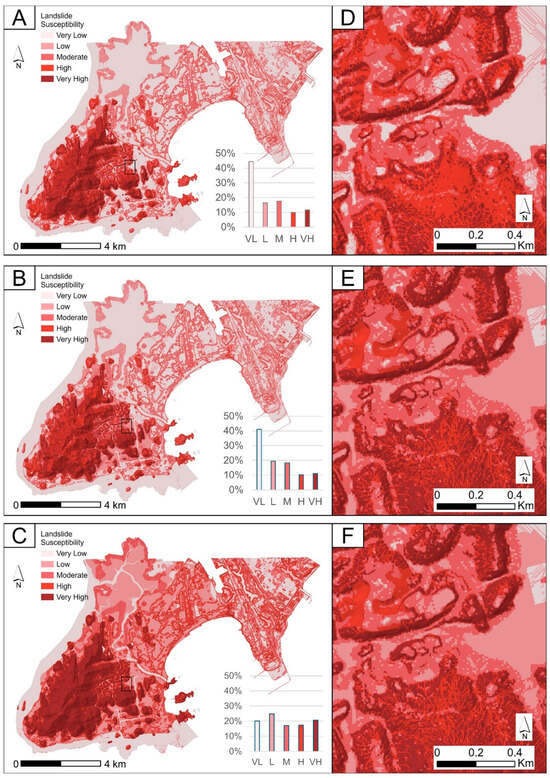
Landslide susceptibility maps generated with six predisposing factors ((A)—FML), six predisposing factors plus LULC1 ((B)—FML1), and six predisposing factors plus LULC2 ((C)—FML2). Panels (D–F) highlight a specific area of the terrain showing significant differences among the three models.
Figure 10.
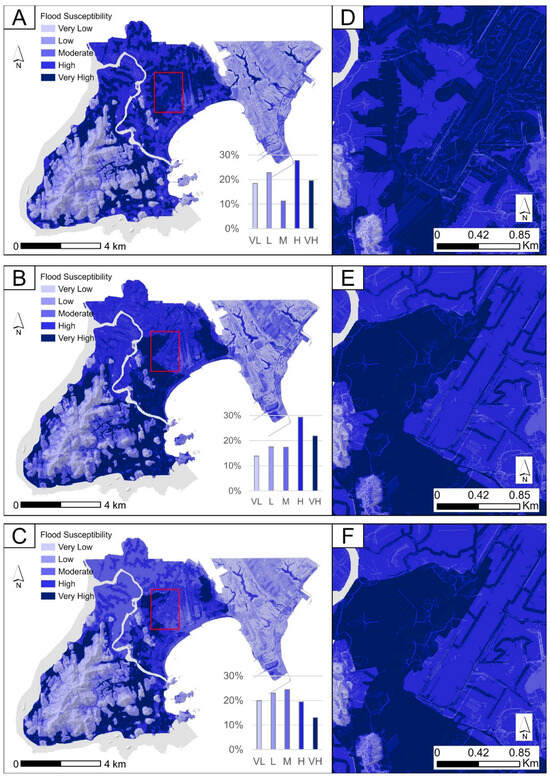
Flood susceptibility maps generated with six predisposing factors ((A)—FMF), six predisposing factors plus LULC1 ((B)—FMF1), and six predisposing factors plus LULC2 ((C)—FMF2). Panels (D–F) highlight a specific area of the terrain showing significant differences among the three models.
For the final landslide modes FML, FML1, and FML2 (Figure 9), the proportion of areas classified as very high, high, moderate, low, and very low susceptibility was distinctly distributed. The FML2 model shows the greatest variation in the very low class, which occupied about 40% of the study area in models FML and FML1 but decreased to 20% in FML2. Conversely, the very high susceptibility class doubled in FML2, reaching 21% of the total area. In all models, the largest concentration of very high susceptibility zones occurs in the central part of the island, corresponding to the Coastal Massif, where most landslides are located. It was observed that slope exerts the greatest influence in all final models, with slope classes between 35 and 40 degrees and 40–45 degrees being the most influential. These areas coincide with informal settlements (slums), contributing to higher susceptibility values in the FML2 model.
The expansion of the very high susceptibility class in the LULC2 model should be interpreted cautiously, because informal settlements are spatially concentrated on steep slopes and may therefore partially reproduce the effect of slope already captured by the topographic variables. In this sense, LULC2 may reflect a real territorial pattern of urban segregation and slope occupation, but it can also inflate susceptibility values where land use information and terrain steepness overlap.
All final landslide models were tested four times, using fourfold cross-validation. The FML model, without LULC, yielded prediction rates between 0.90 and 0.91. The FML1 model, which included LULC1, achieved prediction rates of 0.92, while the FML2 model, incorporating LULC2, produced the highest prediction rates (0.95). These results indicate that the proposed models are well-suited to predicting landslide susceptibility.
The class distribution of the final flood susceptibility models FMF, FMF1, and FMF2 revealed a distinct pattern, with FMF2 exhibiting the greatest differences, including a 50% reduction in the area classified as very high susceptibility. Across all models, stream density was the most influential conditioning factor, followed by zones closer to the channels and flatter areas. This discrepancy suggests that the inclusion of the LULC dataset may have introduced bias into the susceptibility model, leading to spatial patterns that are less consistent with the expected flood dynamics.
In the FMF model, the most susceptible areas are located around the urban areas, whereas in the FMF1 model, higher susceptibility values are slightly more associated with formal and Informal urban areas built over landfills. The AUC value of the FMF model is 0.81, while the FMF1 and FMF2 models reached 0.88, indicating almost no difference between the use of LULC1 and LULC2. In addition to differences in AUC values when comparing the inclusion or exclusion of LULC as a predisposing factor, visual discrepancies are also evident between models, particularly in the flat coastal areas. These areas were classified as high or very high susceptibility near channels in the FMF model (Figure 10D), but as moderate susceptibility in the models including LULC (FMF1 and FMF2; Figure 10E,F).
4. Discussion
4.1. Individual and Composite Sensitivity Analysis
For landslide susceptibility, the sensitivity analysis suggests that slope angle is the most influential predisposing factor, aligning with global studies identifying slope steepness as the primary control on landslide occurrence [14,44]. The highest IVs observed in Vitória’s Central Massif underscore the influence of geological conditions, where granitic rocks have undergone intense chemical and physical weathering processes, contributing to reduced rock strength and increased susceptibility to shallow landslides.
In contrast, for flood susceptibility, elevation showed the strongest influence, confirming the natural tendency of water to accumulate in flat low-lying areas and reinforcing the protective effect typically provided by elevated and steep terrain against flood hazard. Plains adjacent to high-elevation zones tend to experience greater flooding issues, as intense rainfall on steep slopes accelerates runoff, thereby increasing the likelihood of floods [57]).
Despite the identified differences, two topographic attributes related to the physical characteristics of the study area—slope and elevation—are the most influential factors for both processes. These results are aligned with global studies that identity terrain characteristics as the main controls of flood and landslide susceptibility [14,44,58].
Geomorphology, particularly the class Hills and Massifs, proved to be another important predisposing factor for landslides further supporting the relationship between terrain morphology and landslide occurrence. Similar behaviour was also reported in Calabria [59] and South Korea [60], where granitic rocks affected by intense weathering processes increase landslide susceptibility. For floods, TWI also showed high importance, as it indicates preferred flow path, reflecting the relative soil wetness associated with the topography and potential water accumulation areas. This is aligned with previous work on flood susceptibility developed in Bangladesh, which suggests that in lower areas and floodplains, hydrological factors, such as TWI, can have a significant impact on the final models [19]. These results reinforce the contrasting nature of the two phenomena, showing that although similar predisposing factors can be applied, using different classification schemes, they influence susceptibility in opposite ways.
4.2. Susceptibility Models with and Without LULC
All the generated susceptibility models showed acceptable (0.71) to outstanding (0.95) predictive performance, confirming the suitability of the proposed modelling approach for both landslides and floods. In the individual sensitivity analysis, despite the high values achieved by morphological factors, land use and land cover datasets also performed strongly, with LULC2 reaching a prediction rate of 0.92 for landslides and 0.86 for floods. When analyzing the composite approach, the inclusion of these datasets produced progressive positive changes in AUC values, with landslide models being the most affected. Among the 18 proposed models, the inclusion of LULC1 or LULC2 increased predictive capacity by 1–20%, while models without LULC consistently showed the lowest performance for both hazards.
In both cases, the use of LULC1 and LULC2 as predisposing factors in data-driven models suggests a relative concentration of high IVs in urban areas, whether formal or informal and with or without landfills, leading to a significant contribution to hazard prediction. This could lead to the misleading conclusion that only areas with human occupation are prone to hazards. This raises an important question: are urban areas the main control of flood and landslide susceptibility in the study area?
Although there is evidence that the presence of built-up areas may increase the susceptibility [61,62,63], most studies address the relative gains and losses of a given LULC class, as well as the impacts resulting from the conversion of natural areas, such as forests or grasslands, into urban areas [24,27,30,32,64]. Despite the relevance of those studies, they may be too simplistic in assuming that all urban areas share the same characteristics. In built-up urban environments, land cover cannot be adequately represented by general categories typically used, such as urban areas, forest, or bare land, which are more appropriate at regional to global scales [14]. Urban areas, on the other hand, are more complex, since modifications to natural characteristics, such as rainfall-runoff dynamics or even surface water flows, need to be understood in face relation to real conditions and considered in modelling approaches [6].
In this regard, several authors have already discussed the effects of green infrastructure, nature-based solutions, and urban restoration on hazard mitigation [65,66,67], as well as the importance of incorporating variables such as population, road density, floor area, and building footprint into susceptibility analysis [63]. Nevertheless, few studies on susceptibility mapping have examined the importance of including these variables into LULC datasets to achieve finer-scale land cover detail. These factors, often referred to as “non-stationary” drivers of land cover change, can hinder the predictability of the model [68].
The LULC dataset used in this study represents the years 2019–2020, corresponding to the period of satellite image acquisition and classification, whereas the flood and landslide inventories encompass more than 25 years of hazardous events. Because LULC has both spatial and temporal nonstationary characteristics, using it without accounting for past or present changes implies a stationary condition, which can introduce bias into the final susceptibility models [69,70]. Despite this limitation, the LULC dataset may be used for susceptibility assessment, since it provides good consistency with actual conditions. Nevertheless, this approach is constrained by its inability to capture spatio-temporal changes in predisposing factors and their classes, resulting in reduced predictive capacity and lower reliability in susceptibility prediction.
In this context, it is important to acknowledge certain limitations when deciding whether to use LULC as a predisposing factor. First, LULC classes must accurately represent real environmental conditions rather than being selected solely based on data availability [71]. Researchers should also evaluate the insights gained from including or excluding available datasets to determine their actual usefulness. Furthermore, if the LULC dataset lacks quality, high-resolution satellite imagery should be prioritized [38].
Second, urban areas exhibit varying levels of density and permeability; therefore, LULC representation of the built-up environment should at least distinguish between different levels of urban occupancy, including a slum category, whenever relevant. Informal housing is often associated with greater susceptibility [72,73], particularly under climate change scenarios [4]. Therefore, the simple definition of an urban areas class may not be enough to generate better models. This is especially important in cases where it is nearly impossible to relocate the entire population at-risk, as in Vitoria city, where 27% of the population lives within mapped risk zones. Datasets should also differentiate between areas where risk control measures, such as macro-drainage systems and slope-stabilization works, have already been implemented, as these significantly reduce or even eliminate local risk.
Third, the spatial distribution of the drainage network provides insights regarding the surface flow, which can be combined with the inventory data to improve the assessment susceptibility of both landslides and floods. Several authors have suggested that LULC classification should incorporate runoff characteristics [61,68,74,75] or reflect existing drainage network and hydrographic connectivity [31,61], since anthropogenic alterations can disrupt natural flow paths, change the flow direction, and sometimes override the influence of topography [76].
Fourth, although LULC datasets are widely used in data-drive susceptibility models, the assumption of stationarity may overlook temporal shifts in landscape configuration that influence hazard dynamics. Therefore, LULC datasets should encompass long-term variations driven by environmental and socioeconomic changes [14], incorporating past, present, and future scenarios [64,77]. Previous studies have demonstrated that long-term LULC legacies, spanning decadal to centennial scales, are reliable predictors that can mitigate inventory bias and improve model discrimination in susceptibility mapping.
Considering that these results could be used for spatial planning, this study recommends excluding LULC, in its current mapped form, as a conditioning factor from Vitoria susceptibility maps. In other cities, especially coastal ones, where the topographic and physiographic conditions are strongly expressed, models can be influenced by land use, but natural topography may override land use effects, as also observed in Hong Kong [78], suggesting that LULC, as mapped in Vitoria, may exert only limited influence on susceptibility outcomes. Therefore, further studies should ensure that LULC information provides meaningful information related to the phenomena of interest, such as soil permeability, degree of imperviousness, and the existence of drainage systems, thus working as a component of vulnerability analysis, as also discussed in several studies [33,79,80,81]. To achieve more reliable results, we further recommend increasing LULC resolution, improving its classification and refining class definitions to better represent land characteristics associated with the analyzed processes [38,72,82].
We emphasize that the resulting maps represent landslide and flood susceptibility under comparable triggering conditions, and should therefore not be interpreted as flood hazard maps that explicitly incorporate a temporal probability, for example based on rainfall intensity or frequency.
5. Conclusions
This study demonstrates that the use of land use and land cover (LULC) as a conditioning factor in susceptibility modelling can both enhance predictive performance and introduce interpretative challenges. Although LULC emerged as an influential variable and contributed to higher AUC values across all models, qualitative assessments revealed that these statistical improvements do not always translate into physically meaningful representations of hazard dynamics. Our results confirm that morphological variables, such as slope and elevation, remain the dominant predictors of landslides and floods, respectively.
In Vitória, where steep topography and sharp geomorphological contrasts exert a dominant control on hazard occurrence, the role of LULC, as represented by the available datasets, appears to be primarily associated with amplifying pre-existing natural susceptibilities rather than driving them. Similar behaviour can be expected in other coastal cities with strong relief contrasts, where terrain configuration constrains both landslide initiation and flood routing, and LULC mainly modulates, rather than defines, hazard patterns.
The inclusion of LULC datasets introduced significant distortions, particularly when temporal mismatches with the hazard inventories occurred or when the heterogeneity of urban typologies was not adequately captured. Nevertheless, the disaggregation of LULC sub-categories revealed potential contributions to both flood and landslide susceptibility, underscoring the importance of fine-scale characterization of the built environment, especially where informal settlements and post-intervention areas (e.g., drainage works, slope-stabilization measures) are poorly represented. This suggests that, although LULC should not be universally prioritized as a conditioning factor, more refined and process-oriented classifications, reflecting permeability, drainage capacity, and settlement morphology, could improve its applicability in susceptibility modelling.
More broadly, our findings indicate that LULC information may be more appropriately integrated into risk analysis as a component of exposure and vulnerability rather than as a primary driver of susceptibility, particularly in contexts where informal settlements and varying degrees of imperviousness strongly shape patterns of human exposure and potential losses.
Finally, the results confirm that Information Value models can be successfully applied to both landslide and flood susceptibility mapping in coastal urban environments. The insights provided by this study are directly relevant to urban planning and disaster-risk-reduction strategies in areas vulnerable to landslides and floods, and can support local authorities in designing differentiated interventions based on susceptibility information.
Author Contributions
Conceptualization, S.G.F. and J.L.Z.; methodology, J.L.Z. and S.G.F.; validation, S.G.F.; formal analysis, S.G.F. and J.L.Z.; investigation, S.G.F.; writing—original draft preparation, S.G.F.; writing—review and editing, S.G.F., J.L.Z., T.S.G.M. and S.J.C.S.; visualization, S.G.F., J.L.Z.; funding acquisition, S.G.F. All authors have read and agreed to the published version of the manuscript.
Funding
This study was financed in part by the Coordenação de Aperfeiçoamento de Pessoal de Nível Superior—Brasil (CAPES)—Finance Code 001.
Data Availability Statement
Part of the original data presented in the study are openly available in Geobases at [https://geobases.es.gov.br/, accessed on 27 July 2026]. Restrictions apply to the availability of Landslide database. Data were obtained from Prefeitura Municipal de Vitória and are available with the permission of the municipality. For the flood dataset presented in this article, it is not readily available because data are part of an ongoing study. Requests to access the datasets should be directed to scsguerra@gmail.com.
Acknowledgments
We are grateful to the Federal Institute of Education, Science and Technology of Espírito Santo (Ifes), Vitória campus, for the support in developing the research.
Conflicts of Interest
The authors declare no conflicts of interest.
Abbreviations
The following abbreviations are used in this manuscript:
| AUC | Area Under the Curve |
| FMF | Final Model Flood |
| FML | Final Model Landslide |
| LULC | Land Use and Land Cover |
| LULC1 | Land Use and Land Cover with urban areas |
| LULC2 | Land Use and Land Cover with urban areas detailing |
| TPI | Topographic Position Index |
| TWI | Topographic Wetness Index |
References
- Budimir, M.; Trogrlić, R.Š.; Almeida, C.; Arestegui, M.; Vásquez, O.C.; Cisneros, A.; Iriarte, M.C.; Dia, A.; Lizon, L.; Madueño, G.; et al. Opportunities and challenges for people-centered multi-hazard early warning systems: Perspectives from the Global South. IScience 2025, 28, 112353. [Google Scholar] [CrossRef] [Scilit] [PubMed]
- Sandoval, V.; Sarmiento, J.P. A neglected issue: Informal settlements, urban development, and disaster risk reduction in Latin America and the Caribbean. Disaster Prev. Manag. Int. J. 2020, 29, 731–745. [Google Scholar] [CrossRef] [Scilit]
- UNDRR. Global Assessment Report on Disaster Risk Reduction; Imprimerie Centrale: Geneva, Switzerland, 2019. [Google Scholar]
- WBG; GFDRR. Building Resilience: Integrating Climate and Disaster Risk into Development; WBG: Washington, DC, USA, 2013. [Google Scholar]
- Lian, J.; Xu, H.; Xu, K.; Ma, C. Optimal management of the flooding risk caused by the joint occurrence of extreme rainfall and high tide level in a coastal city. Nat. Hazards 2017, 89, 183–200. [Google Scholar] [CrossRef] [Scilit]
- Pakati, S.S.; Shoko, C.; Dube, T. Integrated flood modelling and risk assessment in urban areas: A review on applications, strengths, limitations and future research directions. J. Hydrol. Reg. Stud. 2025, 61, 102583. [Google Scholar] [CrossRef] [Scilit]
- Yuan, J.; Zheng, F.; Duan, H.F.; Deng, Z.; Kapelan, Z.; Savic, D.; Shao, T.; Huang, W.-M.; Zhao, T.; Chen, X. Numerical modelling and quantification of coastal urban compound flooding. J. Hydrol. 2024, 630, 130716. [Google Scholar] [CrossRef] [Scilit]
- Skilodimou, H.D.; Bathrellos, G.D.; Chousianitis, K.; Youssef, A.M.; Pradhan, B. Multi-hazard assessment modeling via multi-criteria analysis and GIS: A case study. Environ. Earth Sci. 2019, 78, 47. [Google Scholar] [CrossRef] [Scilit]
- Guo, Z.; Moosavi, V.; Leitão, J.P. Data-driven rapid flood prediction mapping with catchment generalizability. J. Hydrol. 2022, 609, 127726. [Google Scholar] [CrossRef] [Scilit]
- Zêzere, J.L.; Pereira, S.; Melo, R.; Oliveira, S.C.; Garcia, R.A.C. Mapping landslide susceptibility using data-driven methods. Sci. Total Environ. 2017, 589, 250–267. [Google Scholar] [CrossRef] [Scilit] [PubMed]
- Addis, A. GIS—Based flood susceptibility mapping using frequency ratio and information value models in upper Abay river basin, Ethiopia. Nat. Hazards Res. 2023, 3, 247–256. [Google Scholar] [CrossRef] [Scilit]
- Marchesini, I.; Salvati, P.; Rossi, M.; Donnini, M.; Sterlacchini, S.; Guzzetti, F. Data-driven flood hazard zonation of Italy. J. Environ. Manag. 2021, 294, 112986. [Google Scholar] [CrossRef] [Scilit] [PubMed]
- Tariq, A.; Yan, J.; Ghaffar, B.; Qin, S.; Mousa, B.G.; Sharifi, A.; Huq, E.; Aslam, M. Flash Flood Susceptibility Assessment and Zonation by Integrating Analytic Hierarchy Process and Frequency Ratio Model with Diverse Spatial Data. Water 2022, 14, 3069. [Google Scholar] [CrossRef] [Scilit]
- Reichenbach, P.; Rossi, M.; Malamud, B.D.; Mihir, M.; Guzzetti, F. A review of statistically-based landslide susceptibility models. Earth Sci. Rev. 2018, 180, 60–91. [Google Scholar] [CrossRef] [Scilit]
- Barella, C.F.; Sobreira, F.G.; Zêzere, J.L. A comparative analysis of statistical landslide susceptibility mapping in the southeast region of Minas Gerais state, Brazil. Bull. Eng. Geol. Environ. 2019, 78, 3205–3221. [Google Scholar] [CrossRef] [Scilit]
- Kumar, A.; Sharma, R.K.; Bansal, V.K. GIS-based comparative study of information value and frequency ratio method for landslide hazard zonation in a part of mid-Himalaya in Himachal Pradesh. Innov. Infrastruct. Solut. 2019, 4, 28. [Google Scholar] [CrossRef] [Scilit]
- Liu, Y.; Meng, Z.; Zhu, L.; Hu, D.; He, H. Optimizing the Sample Selection of Machine Learning Models for Landslide Susceptibility Prediction Using Information Value Models in the Dabie Mountain Area of Anhui, China. Sustainability 2023, 15, 1971. [Google Scholar] [CrossRef] [Scilit]
- Wubalem, A.; Meten, M. Landslide susceptibility mapping using information value and logistic regression models in Goncha Siso Eneses area, northwestern Ethiopia. SN Appl. Sci. 2020, 2, 807. [Google Scholar] [CrossRef] [Scilit]
- Chowdhury, M.S. Flash flood susceptibility mapping of north-east depression of Bangladesh using different GIS based bivariate statistical models. Watershed Ecol. Environ. 2024, 6, 26–40. [Google Scholar] [CrossRef] [Scilit]
- Mind’je, R.; Li, L.; Kayumba, P.M.; Mupenzi, C.; Mindje, M.; Hao, J. Exploring a form of pixel-based information value model for flood probability assessment and geo-visualization over an East African basin: A case of Nyabarongo in Rwanda. Environ. Earth Sci. 2023, 82, 402. [Google Scholar] [CrossRef] [Scilit]
- Saha, S.; Sarkar, D.; Mondal, P. Efficiency exploration of frequency ratio, entropy and weights of evidence-information value models in flood vulnerabilityassessment: A study of raiganj subdivision, Eastern India. Stoch. Environ. Res. Risk Assess. 2022, 36, 1721–1742. [Google Scholar] [CrossRef] [Scilit]
- Seleem, O.; Ayzel, G.; Bronstert, A.; Heistermann, M. Transferability of data-driven models to predict urban pluvial flood water depth in Berlin, Germany. Nat. Hazards Earth Syst. Sci. 2023, 23, 809–822. [Google Scholar] [CrossRef] [Scilit]
- Sinčić, M.; Bernat Gazibara, S.; Rossi, M.; Mihalić Arbanas, S. Comparison of conditioning factor classification criteria in large-scale statistically based landslide susceptibility models. Nat. Hazards Earth Syst. Sci. 2025, 25, 183–206. [Google Scholar] [CrossRef] [Scilit]
- Quevedo, R.P.; Velastegui-Montoya, A.; Montalván-Burbano, N.; Morante-Carballo, F.; Korup, O.; Daleles Rennó, C. Land use and land cover as a conditioning factor in landslide susceptibility: A literature review. Landslides 2023, 20, 967–982. [Google Scholar] [CrossRef] [Scilit]
- Roy, D.; Aithal, B.H.; Dhar, A.; Desai, V.R. Impact of Land Use/Land Cover Change on Future Flash Flood Vulnerability and Monsoon Runoff in an Ungauged Himalayan Watershed. J. Hydrol. Eng. 2024, 29, 3. [Google Scholar] [CrossRef] [Scilit]
- Hassan, A.N.; Brahim, I.; Mustapha, N.; Kamal, E.B.; Youssef, B. Landslide susceptibility mapping by remote sensing and GIS using frequency ratio, value of information and logistic regression methods in the N’fis watershed, High Atlas of Marrakech (Morocco). Disaster Adv. 2024, 17, 31–47. [Google Scholar] [CrossRef] [Scilit]
- Zhao, F.; Miao, F.; Wu, Y.; Gong, S.; Zheng, G.; Yang, J.; Zhan, W. Landslide dynamic susceptibility mapping in urban expansion area considering spatiotemporal land use and land cover change. Sci. Total Environ. 2024, 949, 175059. [Google Scholar] [CrossRef] [Scilit] [PubMed]
- Reichenbach, P.; Busca, C.; Mondini, A.C.; Rossi, M. The Influence of Land Use Change on Landslide Susceptibility Zonation: The Briga Catchment Test Site (Messina, Italy). Environ. Manag. 2014, 54, 1372–1384. [Google Scholar] [CrossRef] [Scilit] [PubMed]
- Shu, H.; Hürlimann, M.; Molowny-Horas, R.; González, M.; Pinyol, J.; Abancó, C.; Ma, J. Relation between land cover and landslide susceptibility in Val d’Aran, Pyrenees (Spain): Historical aspects, present situation and forward prediction. Sci. Total Environ. 2019, 693, 133557. [Google Scholar] [CrossRef] [Scilit] [PubMed]
- Soliman, M.; Morsy, M.M.; Radwan, H.G. Assessment of Implementing Land Use/Land Cover LULC 2020-ESRI Global Maps in 2D Flood Modeling Application. Water 2022, 14, 3963. [Google Scholar] [CrossRef] [Scilit]
- Dell’Aira, F.; Meier, C.I. Beyond total impervious area: A new lumped descriptor of basin-wide hydrologic connectivity for characterizing urban watersheds. Hydrol. Earth Syst. Sci. 2025, 29, 1001–1032. [Google Scholar] [CrossRef] [Scilit]
- Nandam, V.; Patel, P.L. On the role of digital terrain topography and land use dynamics in flood hazard assessment of urban floodplain. Nat. Hazards 2024, 120, 11877–11902. [Google Scholar] [CrossRef] [Scilit]
- Nguyen, H.D.; Fox, D.; Dang, D.K.; Pham, L.T.; Viet Du, Q.V.; Nguyen, T.H.T.; Dang, T.N.; Tran, V.T.; Vu, P.L.; Nguyen, Q.-H.; et al. Predicting future urban flood risk using land change and hydraulic modeling in a river watershed in the central province of Vietnam. Remote Sens. 2021, 13, 262. [Google Scholar] [CrossRef] [Scilit]
- Rogger, M.; Agnoletti, M.; Alaoui, A.; Bathurst, J.C.; Bodner, G.; Borga, M.; Chaplot, V.; Gallart, F.; Glatzel, G.; Hall, J.; et al. Land use change impacts on floods at the catchment scale: Challenges and opportunities for future research. Water Resour. Res. 2017, 53, 5209–5219. [Google Scholar] [CrossRef] [Scilit] [PubMed]
- Aksoy, H. Determination of landslide susceptibility with Analytic Hierarchy Process (AHP) and the role of forest ecosystem services on landslide susceptibility. Environ. Monit. Assess. 2023, 195, 1525. [Google Scholar] [CrossRef] [Scilit] [PubMed]
- Aksoy, H. Flood Risk Analysis with AHP and the Role of Forests in Natural Flood Management: A Case Study from the North of Türkiye. Kastamonu Univ. J. For. Fac. 2023, 23, 282–297. [Google Scholar] [CrossRef] [Scilit]
- Tian, J.; Chen, Y.; Yang, L.; Li, D.; Liu, L.; Li, J.; Tang, X. Enhancing Urban Flood Susceptibility Assessment by Capturing the Features of the Urban Environment. Remote Sens. 2025, 17, 1347. [Google Scholar] [CrossRef] [Scilit]
- Ibrahim, A.; Wageeh, A.; Hamouda, M.A.; Ahmed, A.; Gad, A. Impact of LULC Classification Methods on Runoff Simulation in an Arid Mountainous Watershed Using Remote Sensing and Machine Learning. Earth 2026, 7, 26. [Google Scholar] [CrossRef] [Scilit]
- Pimentel, T.B.; Bricalli, L.L. A Relação entre os Padrões de Lineamentos e os Movimentos de Massa no Município de Vitória (Espírito Santo, Sudeste do Brasil). Soc. Nat. 2023, 35, 1. [Google Scholar] [CrossRef] [Scilit]
- Prefeitura Municipal de Vitória. Mapenco Web Mapeamento de Áreas de Risco Geológico-Geotécnico e Monitoramento de Encostas do Município de Vitória—ES. FEST 2023. Available online: https://www.mapenco.com.br/ (accessed on 4 July 2024).
- Emberson, R.; Kirschbaum, D.B.; Amatya, P.; Tanyas, H.; Marc, O. Insights from the topographic characteristics of a large global catalog of rainfall-induced landslide event inventories. Nat. Hazards Earth Syst. Sci. 2022, 22, 1129–1149. [Google Scholar] [CrossRef] [Scilit]
- IJSN. Geobases. Instituto Jones Dos Santos Neves 2025. Available online: https://geobases.es.gov.br/ (accessed on 4 October 2023).
- Zêzere, J.L.; Pereira, S.; Tavares, A.O.; Bateira, C.; Trigo, R.M.; Quaresma, I.; Santos, P.P.; Santos, M.; Verde, J. DISASTER: A GIS database on hydro-geomorphologic disasters in Portugal. Nat. Hazards 2014, 72, 503–532. [Google Scholar] [CrossRef] [Scilit]
- Huang, R.; Zeng, B.; Ai, D.; Yuan, J.; Xu, H. Landslide dynamic hazard prediction based on precipitation variation trend and backpropagation neural network. Geocarto. Int. 2024, 39, 2322058. [Google Scholar] [CrossRef] [Scilit]
- Moazzam, M.F.U.; Lee, B.G.; Rahman, A.U.; Farid, N.; Rahman, G. Spatio-Statistical Analysis of Flood Susceptibility Assessment Using Bivariate Model in the Floodplain of River Swat, District Charsadda, Pakistan. J. Geosci. Environ. Prot. 2020, 8, 159–175. [Google Scholar] [CrossRef]
- Ayalew, L.; Yamagishi, H. The application of GIS-based logistic regression for landslide susceptibility mapping in the Kakuda-Yahiko Mountains, Central Japan. Geomorphology 2005, 65, 15–31. [Google Scholar] [CrossRef] [Scilit]
- Smith, H.G.; Neverman, A.J.; Betts, H.; Spiekermann, R. The influence of spatial patterns in rainfall on shallow landslides. Geomorphology 2023, 437, 108795. [Google Scholar] [CrossRef] [Scilit]
- Pourghasemi, H.R.; Rahmati, O. Prediction of the landslide susceptibility: Which algorithm, which precision? Catena 2018, 162, 177–192. [Google Scholar] [CrossRef] [Scilit]
- Villaça, C.; Santos, P.P.; Morais, A.R.; Oliveira, S.C.; Zêzere, J.L. Unveiling the drivers of rainfall-triggered landslide spatial distribution: Insights from event-based and historical landslide inventories in Lisbon region, Portugal. Geomorphology 2026, 500, 110222. [Google Scholar] [CrossRef] [Scilit]
- Oliveira, S.C.; Zêzere, J.L.; Garcia, R.A.C.; Pereira, S.; Vaz, T.; Melo, R. Landslide susceptibility assessment using different rainfall event-based landslide inventories: Advantages and limitations. Nat. Hazards 2024, 120, 9361–9399. [Google Scholar] [CrossRef] [Scilit]
- Delchiaro, M.; Ruscitto, V.; Iacobucci, G.; Piacentini, D.; Troiani, F.; Dallan, E.; Borga, M.; Struglia, M.V.; Montanari, A.; Marani, M.; et al. Spatio-temporal variability of landslides as indicator of climate change impact: Towards an Italian national scale integrated procedure for the rainfall role analysis in landslide dynamics. Int. J. Disaster Risk Reduct. 2026, 143, 106252. [Google Scholar] [CrossRef] [Scilit]
- IBGE. IBGE|Portal do IBGE 2025. Available online: https://www.ibge.gov.br/ (accessed on 28 June 2025).
- Coelho, A.L.N. Geotecnologias Aplicadas na Distribuição Espacial dos Aterros da Cidade de Vitória (ES)/Geotechnologies applied in the distribution of the landfills of the city of Vitória (ES)—Brazil. Cad. De Geogr. 2017, 27, 760–775. [Google Scholar] [CrossRef] [Scilit]
- Pereira, S.; Zêzere, J.L.; Bateira, C. Technical Note: Assessing predictive capacity and conditional independence of landslide predisposing factors for shallow landslide susceptibility models. Nat. Hazards Earth Syst. Sci. 2012, 12, 979–988. [Google Scholar] [CrossRef] [Scilit]
- Guzzetti, F.; Reichenbach, P.; Ardizzone, F.; Cardinali, M.; Galli, M. Estimating the quality of landslide susceptibility models. Geomorphology 2006, 81, 166–184. [Google Scholar] [CrossRef] [Scilit]
- Chung, C.-J.F.; Fabbri, A.G. Validation of Spatial Prediction Models for Landslide Hazard Mapping. Nat. Hazards 2003, 30, 451–472. [Google Scholar] [CrossRef] [Scilit]
- Hussain, M.; Ullah, K.; Tayyab, M.; Ullah, S.; Shah, A.A.; Zhang, J.; Tong, Z.; Liu, X.; Rahman, Z.U. Data-driven multi-hazard susceptibility and community perceptions assessment using a mixed-methods approach. J. Environ. Manag. 2025, 388, 126009. [Google Scholar] [CrossRef] [Scilit] [PubMed]
- Zhao, G.; Pang, B.; Xu, Z.; Yue, J.; Tu, T. Mapping flood susceptibility in mountainous areas on a national scale in China. Sci. Total Environ. 2018, 615, 1133–1142. [Google Scholar] [CrossRef] [Scilit] [PubMed]
- Borrelli, L.; Ciurleo, M.; Gullà, G. Shallow landslide susceptibility assessment in granitic rocks using GIS-based statistical methods: The contribution of the weathering grade map. Landslides 2018, 15, 1127–1142. [Google Scholar] [CrossRef] [Scilit]
- Pradhan, A.M.S.; Kim, Y.T. Application and comparison of shallow landslide susceptibility models in weathered granite soil under extreme rainfall events. Environ. Earth Sci. 2015, 73, 5761–5771. [Google Scholar] [CrossRef] [Scilit]
- Jodar-Abellan, A.; Valdes-Abellan, J.; Pla, C.; Gomariz-Castillo, F. Impact of land use changes on flash flood prediction using a sub-daily SWAT model in five Mediterranean ungauged watersheds (SE Spain). Sci. Total Environ. 2019, 657, 1578–1591. [Google Scholar] [CrossRef] [Scilit] [PubMed]
- Idowu, D.; Zhou, W. Land use and land cover change assessment in the context of flood hazard in Lagos State, Nigeria. Water 2021, 13, 1105. [Google Scholar] [CrossRef] [Scilit]
- Puente-Sotomayor, F.; Mustafa, A.; Teller, J. Landslide Susceptibility Mapping of Urban Areas: Logistic Regression and Sensitivity Analysis applied to Quito, Ecuador. Geoenviron. Disasters 2021, 8, 19. [Google Scholar] [CrossRef] [Scilit]
- Malek, Ž.; Boerboom, L.; Glade, T. Future Forest Cover Change Scenarios with Implications for Landslide Risk: An Example from Buzau Subcarpathians, Romania. Environ. Manag. 2015, 56, 1228–1243. [Google Scholar] [CrossRef] [Scilit] [PubMed]
- Carter, J.G.; Handley, J.; Butlin, T.; Gill, S. Adapting cities to climate change—Exploring the flood risk management role of green infrastructure landscapes. J. Environ. Plan. Manag. 2018, 61, 1535–1552. [Google Scholar] [CrossRef] [Scilit]
- Webber, J.L.; Fletcher, T.D.; Cunningham, L.; Fu, G.; Butler, D.; Burns, M.J. Is green infrastructure a viable strategy for managing urban surface water flooding? Urban Water J. 2020, 17, 598–608. [Google Scholar] [CrossRef] [Scilit]
- Viezzer, J.; Schmidt, M.A.R.; dos Reis, A.R.N.; Freiman, F.P.; de Moraes, E.N.; Biondi, D. Restoration of urban forests to reduce flood susceptibility: A starting point. Int. J. Disaster Risk Reduct. 2022, 74, 102944. [Google Scholar] [CrossRef] [Scilit]
- Brunner, M.I.; Slater, L.; Tallaksen, L.M.; Clark, M. Challenges in modeling and predicting floods and droughts: A review. Wiley Interdiscip. Rev. Water 2021, 8, e1520. [Google Scholar] [CrossRef] [Scilit]
- Kwan, M.P. The stationarity bias in research on the environmental determinants of health. Health Place 2021, 70, 102609. [Google Scholar] [CrossRef] [Scilit] [PubMed]
- Liu, J.; He, P.; Xiao, J.; Hu, Q.; Ren, Y.; Kornejady, A.; Gao, H. When Time Prevails: The Perils of Overlooking Temporal Landscape Evolution in Landslide Susceptibility Predictions. Remote Sens. 2025, 17, 1752. [Google Scholar] [CrossRef] [Scilit]
- Meneses, B.M.; Pereira, S.; Reis, E. Effects of different land use and land cover data on the landslide susceptibility zonation of road networks. Nat. Hazards Earth Syst. Sci. 2019, 19, 471–487. [Google Scholar] [CrossRef] [Scilit]
- Bozzolan, E.; Holcombe, E.A.; Pianosi, F.; Marchesini, I.; Alvioli, M.; Wagener, T. A mechanistic approach to include climate change and unplanned urban sprawl in landslide susceptibility maps. Sci. Total Environ. 2023, 858, 159412. [Google Scholar] [CrossRef] [Scilit] [PubMed]
- Membele, G.M.; Naidu, M.; Mutang, O. Using local and indigenous knowledge in selecting indicators for mapping flood vulnerability in informal settlement contexts. Int. J. Disaster Risk Reduct. 2022, 71, 102836. [Google Scholar] [CrossRef] [Scilit]
- Bansal, N.; Mukherjee, M.; Gairola, A. Evaluating urban flood hazard index (UFHI) of Dehradun city using GIS and multi-criteria decision analysis. Model. Earth Syst. Environ. 2022, 8, 4051–4064. [Google Scholar] [CrossRef] [Scilit]
- Cea, L.; Costabile, P. Flood Risk in Urban Areas: Modelling, Management and Adaptation to Climate Change: A Review. Hydrology 2022, 9, 50. [Google Scholar] [CrossRef] [Scilit]
- Bell, C.D.; McMillan, S.K.; Clinton, S.M.; Jefferson, A.J. Hydrologic response to stormwater control measures in urban watersheds. J. Hydrol. 2016, 541, 1488–1500. [Google Scholar] [CrossRef] [Scilit]
- Knevels, R.; Brenning, A.; Gingrich, S.; Heiss, G.; Lechner, T.; Leopold, P.; Plutzar, C.; Proske, H.; Petschko, H. Towards the use of land use legacies in landslide modeling: Current challenges and future perspectives in an austrian case study. Land 2021, 10, 954. [Google Scholar] [CrossRef] [Scilit]
- Chen, L.; Ma, P.; Yu, C.; Zheng, Y.; Zhu, Q.; Ding, Y. Landslide susceptibility assessment in multiple urban slope settings with a landslide inventory augmented by InSAR techniques. Eng. Geol. 2023, 327, 107342. [Google Scholar] [CrossRef] [Scilit]
- Gain, A.K.; Mojtahed, V.; Biscaro, C.; Balbi, S.; Giupponi, C. An integrated approach of flood risk assessment in the eastern part of Dhaka City. Nat. Hazards 2015, 79, 1499–1530. [Google Scholar] [CrossRef] [Scilit]
- Foudi, S.; Osés-Eraso, N.; Tamayo, I. Integrated spatial flood risk assessment: The case of Zaragoza. Land. Use Policy 2015, 42, 278–292. [Google Scholar] [CrossRef] [Scilit]
- Tabasi, N.; Fereshtehpour, M.; Roghani, B. A review of flood risk assessment frameworks and the development of hierarchical structures for risk components. Discov. Water 2025, 5, 10. [Google Scholar] [CrossRef] [Scilit]
- Berndtsson, R.; Becker, P.; Persson, A.; Aspegren, H.; Haghighatafshar, S.; Jönsson, K.; Larsson, R.; Mobini, S.; Mottaghi, M.; Nilsson, J.; et al. Drivers of changing urban flood risk: A framework for action. J. Environ. Manag. 2019, 240, 47–56. [Google Scholar] [CrossRef] [Scilit] [PubMed]

Disclaimer/Publisher’s Note: The statements, opinions and data contained in all publications are solely those of the individual author(s) and contributor(s) and not of MDPI and/or the editor(s). MDPI and/or the editor(s) disclaim responsibility for any injury to people or property resulting from any ideas, methods, instructions or products referred to in the content. |
© 2026 by the authors. Licensee MDPI, Basel, Switzerland. This article is an open access article distributed under the terms and conditions of the Creative Commons Attribution (CC BY) license.