


Abstract
Rainfall-induced landslides represent one of the most recurrent geohazards affecting the transportation network of southwestern Calabria (Italy). This study provides an integrated assessment of landslide occurrence and road damage along the Costa Viola by combining detailed geomorphological mapping, multi-temporal analyses, historical documentation (1950–2025), and GIS-based spatial data processing. A total of 261 landslides were mapped, affecting approximately 19% of the study area. Slides constitute the dominant movement type (66.7%), followed by complex landslides, flows, and falls. Landslide distribution is strongly controlled by geological and morphometric factors: more than 80% of mapped phenomena occur in highly fractured granitic and gneissic rocks, over 70% lie within 500 m of faults, and more than 90% are located within 300 m of streams. Slope gradient (25–55°) and local relief (350–550 m) further contribute to slope instability patterns. The historical dataset documents 237 landslide-induced road damage events over 75 years, with a marked increase in occurrence since the early 2000s. Most damage events affected the SS18 road and frequently corresponded to reactivations of pre-existing landslides, highlighting the long-term persistence of slope instability and the seasonal influence of intense autumn–winter precipitation. Overall, the results demonstrate that landslide hazard in the Costa Viola is governed by the interplay between structural, lithological, geomorphic, and climatic factors, compounded by anthropogenic modifications along road corridors. The combined landslide inventory and historical database provide a robust basis for risk mitigation, identification of critical road sectors, and future susceptibility and predictive modelling to support effective territorial planning.
1. Introduction
Landslides represent one of the most widespread natural hazards, often resulting in severe impacts on the environment, populations [1], and critical infrastructure [1,2,3,4]. In recent years, the intensification of climate change has led to more frequent extreme rainfall events, which in turn have increased the likelihood and magnitude of landslide occurrences [3,4,5,6,7,8].
The present research addresses the interaction between the transportation network and landslide phenomena. Research has increasingly focused on the exposure of critical infrastructure to natural hazards, highlighting that damage to transport networks can lead to severe service interruptions and substantial socioeconomic consequences [2].
The road network—ranging from highways to remote service roads—represents the most widespread human-made infrastructure across the landscape. Its extensive spatial distribution and continuous exposure to natural hazards make it particularly vulnerable to slope instability processes, often resulting in traffic disruptions and significant inconvenience for local communities, especially in areas where climatic, geological, and land-use conditions enhance susceptibility to landslides.
Road vulnerability is frequently associated with segments crossing unstable slopes, including areas affected by deep-seated landslides or mid-slope sections exposed to rockfalls and debris from the upslope side. In other cases, instability may be triggered by erosion and undercutting at the base of the road embankment, often linked to inadequate drainage and poor runoff management. The construction of roads across landslide bodies without appropriate stabilization measures can further increase this susceptibility.
Additionally, ageing infrastructure and insufficient maintenance, particularly along secondary roads, may exacerbate these conditions. More generally, roads constructed on unstable slopes, often through cuts that remove soil or rock, alter the equilibrium of the slope and, as a consequence, can be affected by landslide-related damage.
Landslides may directly endanger travellers by striking vehicles or pedestrians, or indirectly create hazardous driving conditions through lane-blocking debris, structural damage to pavement or foundations, impact craters, or flooding caused by blocked culverts. These effects compromise both road safety and network functionality [6,9,10,11,12].
In landslide-prone regions, recurrent damage to roads often reflects the spatial distribution and temporal variability of slope instability [4]. As linear elements traversing diverse geological and geomorphological settings, roads tend to intersect unstable slopes, concentrate runoff, and locally alter drainage patterns—factors that can both trigger and reveal landslide processes. Consequently, road networks are sometimes used as practical indicators of landslide activity and can serve as proxies for assessing slope stability along their paths.
The exposure to landslides of “critical infrastructure” has been shown to produce severe impacts on economies and societies worldwide. Moreover, the widespread diffusion of functional networks such as roads increases the complexity of interdependent systems and heightens their vulnerability to large-scale disruptions, potentially triggering cascading effects [13]. For roads of lower hierarchical importance, the situation remains significant: the damage or destruction of a road can still strongly affect a local community, and the inconvenience and economic losses for the population can be substantial. Entire small communities may even become isolated in the event of widespread landslides triggered by extreme rainfall along the road network, preventing or hindering the arrival of emergency services.
The scientific community is highly attentive to the issue of landslide–road interactions. Detailed studies typically focus on major roads [14,15], or specifically on sections crossing populated areas, as well as on the influence of road construction on slope stability and landslide triggering [16]. Research in the United States indicates that hundreds of sites with high hourly and annual traffic volumes are situated in areas of high landslide susceptibility, representing significant potential risks to life safety and traffic continuity [9].
Wu et al. [17] proposed a probabilistic method to assess the impacts of rainfall-induced landslides on road networks, accounting for key uncertainties in rainfall patterns, landslide occurrence, and runout distances. Focusing on slow-moving landslides, Nappo et al. [18] proposed a simplified procedure to analyze road damage by combining landslide inventory maps, a road damage database compiled from in situ surveys and Google Street View images, and ground displacement measurements derived from satellite SAR imagery.
Despite the extensive exposure of the road network to landslide risk, data collections on landslide damage to roads, as well as systematic approaches and specific analyses of landslide–road interactions, remain limited. This is partly because the authorities responsible for maintenance typically focus on addressing individual disruptions and resolving specific incidents, rather than developing an overall framework to identify common patterns and characteristics at the local or regional scale.
Nevertheless, given the importance of the road network at all scales and the significant impacts of landslide-related disruptions, even minor events are often reported in national and local newspapers. These reports provide valuable historical information on road closures, emergency interventions, and damage-related funding. Systematic analysis of such information sources enables the reconstruction of historical series of landslides affecting specific road segments [6,19]. More broadly, integrating a historical database of documented landslides with a GIS-linked DBMS and a landslide inventory enables development of a system that can serve as a reference for regional landslide studies and support hazard assessment [20,21].
However, these sources have limitations: they rarely provide information on landslide type or magnitude, and the reported data may be influenced by the journalist’s familiarity with geohazards and a tendency toward sensationalism, often hindering accurate event assessment. To overcome these limitations and fully exploit historical records, spatial analyses using topographic maps, landslide inventory maps, aerial photographs, and satellite imagery are essential. Such analyses enable precise localization of landslides, estimation of their size and classification into broad categories [6]. This procedure is relatively straightforward for landslides affecting the road network, as traffic disruptions are often reported with reference to kilometre markers, which can be easily identified on maps within a GIS environment.
In this article, we address this by developing an integrated methodological approach that combines historical documentation with geological and geomorphological analyses to reconstruct and interpret landslide occurrences along the road network in a Mediterranean context. This approach facilitates the assessment of the spatial and temporal evolution of landslide hazards in areas prone to rainfall-induced slope instability.
The paper is organized as follows. The Materials and Methods section begins with a description of the study area, followed by the development of the landslide inventory, the collection of landslide damage data, and the compilation of rainfall records. The results are presented in the Results section in terms of landslide distribution, type and activity; the role of geological and morphometric features on landslide occurrence; and temporal distribution of landslide-induced road damage. The Discussion section addresses the main strengths and limitations of the approach, while the Conclusions section summarizes the key findings and outlines future steps to enhance their impact.
2. Materials and Methods
2.1. Study Area
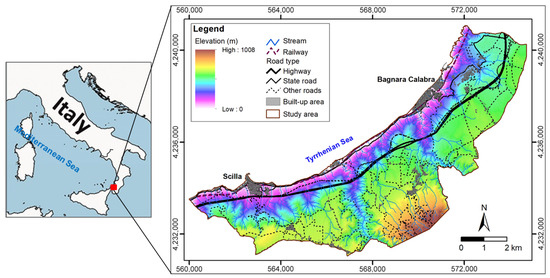
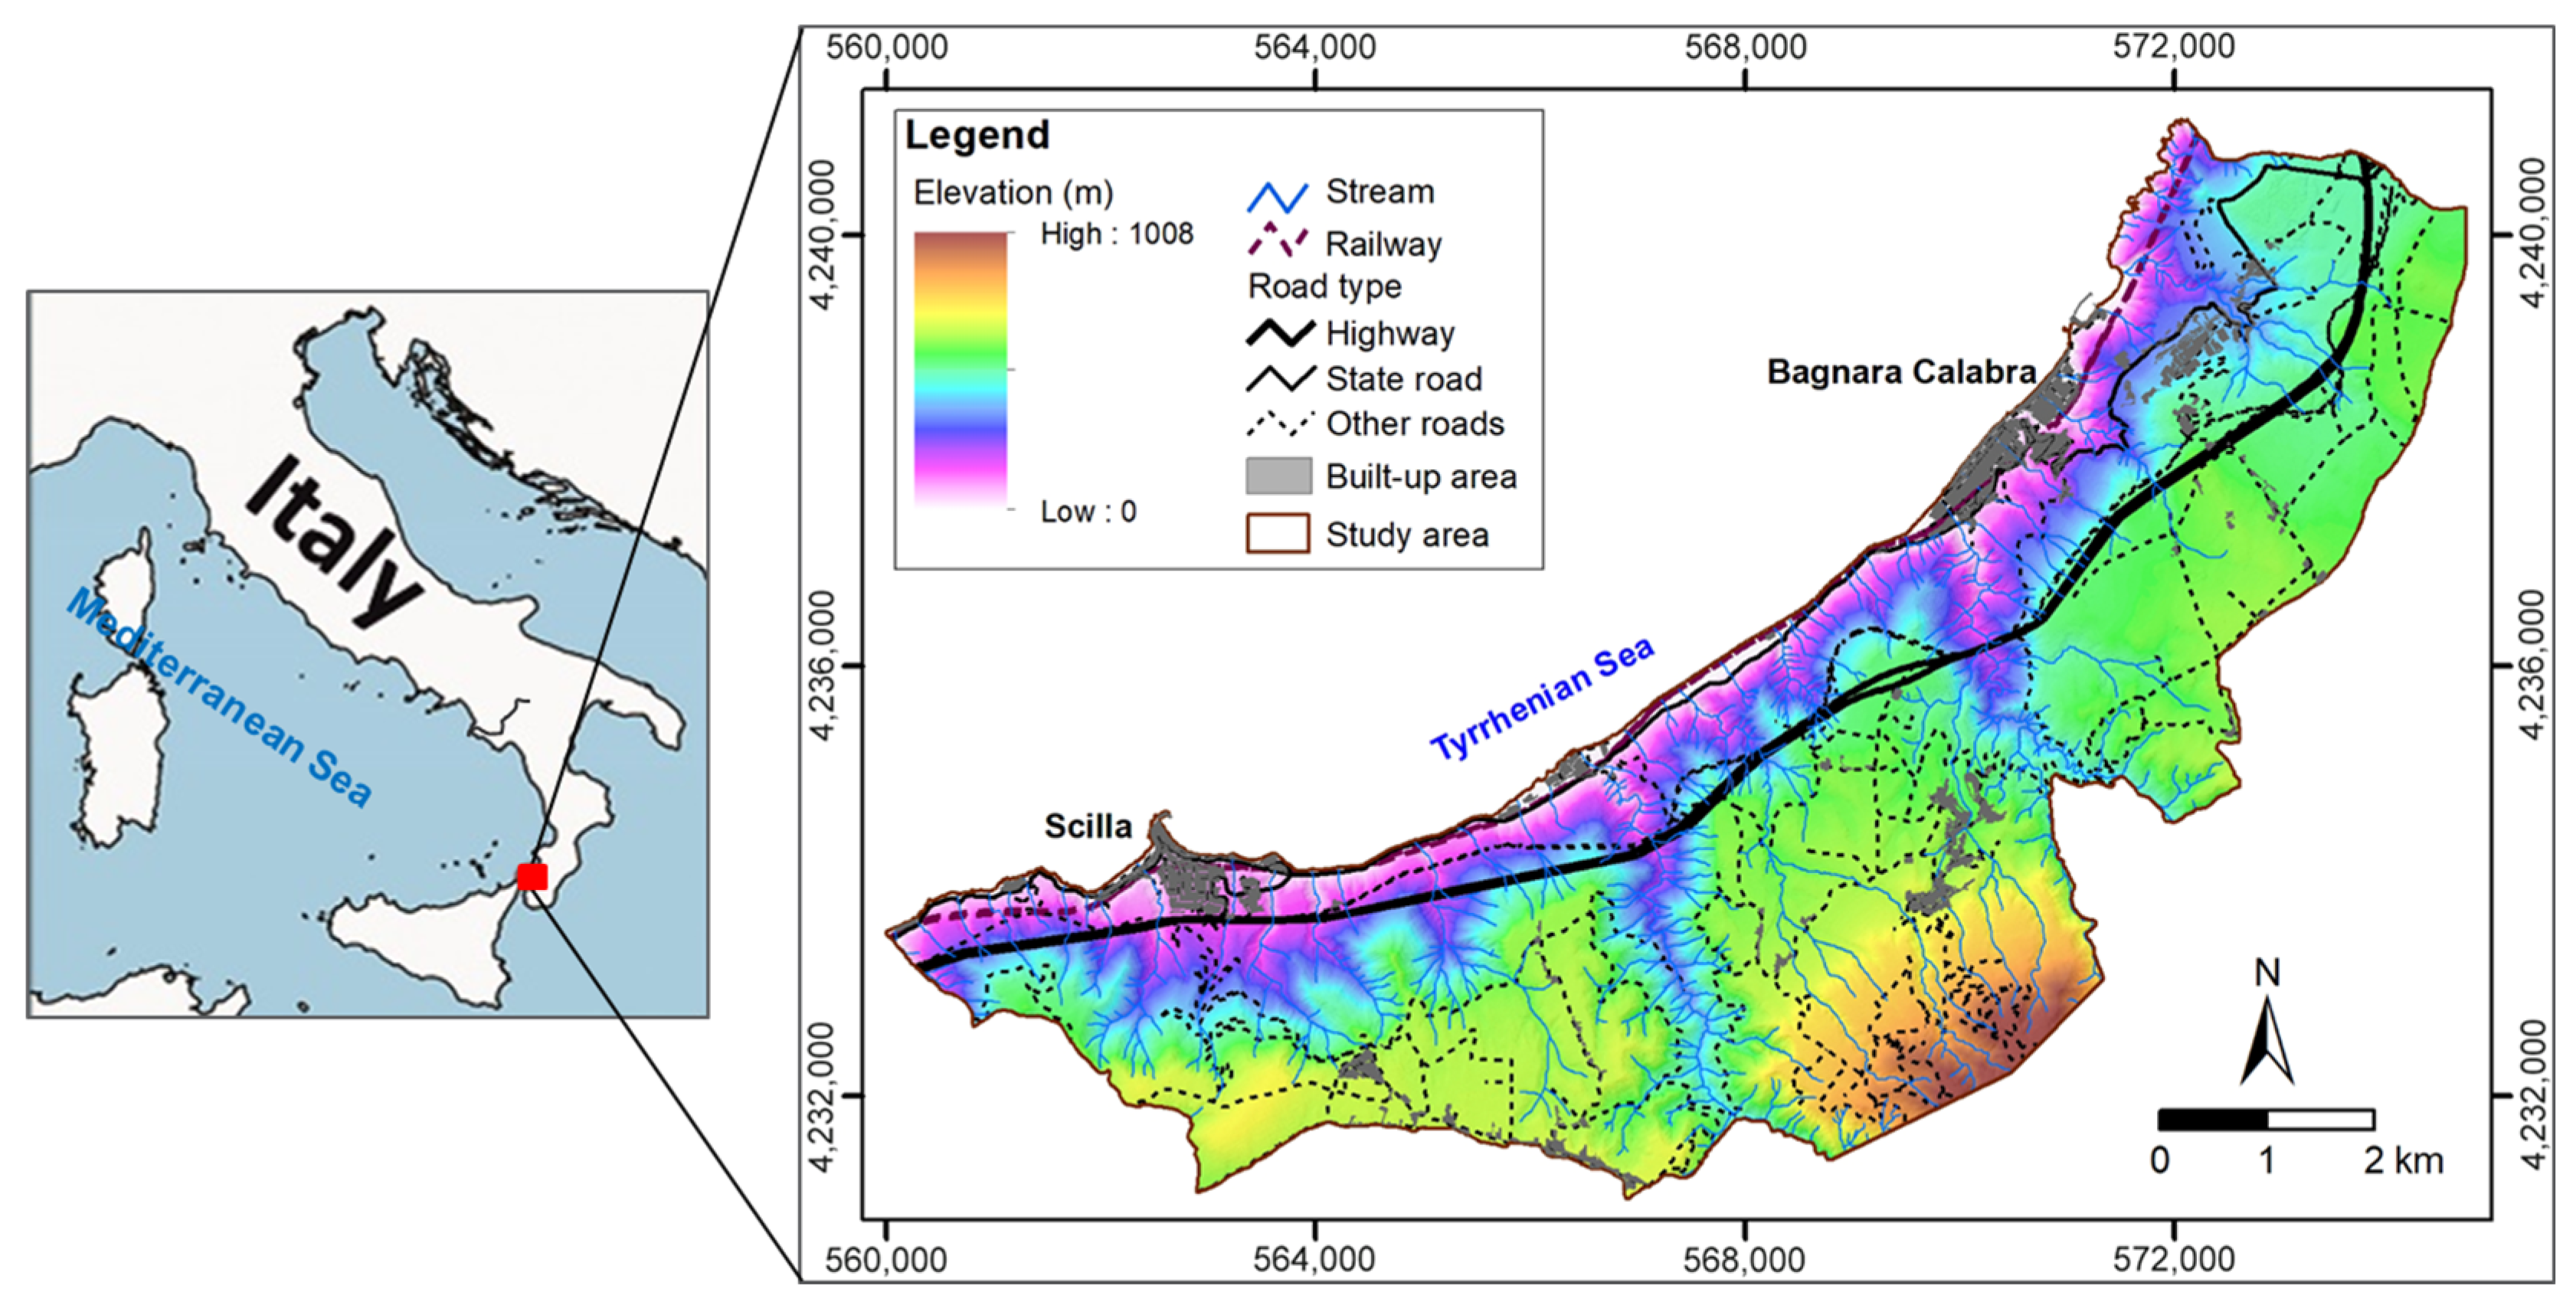
Costa Viola was selected as the study area because of the persistent and well-documented occurrence of landslides affecting both road and railway networks, frequently causing traffic interruptions, delays, and difficulties for infrastructure users. It is located in the southwestern sector of the Calabria region (Italy), facing the Tyrrhenian Sea, in the Mediterranean basin, and encompasses the coastal areas of two municipalities in the province of Reggio Calabria—Scilla and Bagnara Calabra—covering a combined area of 53.1 km2, with elevations ranging from 0 to 1008 m a.s.l. and an average altitude of 455 m a.s.l. (Figure 1). Bagnara Calabra, the northernmost of the two municipalities, has a population density of 370.18 inhabitants/km2, while Scilla (42.83 km2), located further south, has a population density of 101.99 inhabitants/km2 (https://www.istat.it/, accessed 19 May 2025). Both municipalities have a strong tourist vocation, leading to a significant increase in vehicle traffic during the summer season.
Figure 1.
Location of the study area showing main villages, streams, and infrastructure.
2.1.1. The Transportation Network
The transportation network of the study area consists of:
- SS18 (Italian acronym of State Road): The oldest north–south corridor, with origins dating back to the Roman era. It carries traffic to and from Sicily along a single carriageway 7–8 m wide, following a curvilinear path along the mountain slopes, often running mid-slope with views of the sea. It is currently managed by the Azienda Nazionale Autonoma delle Strade Statali (ANAS). Within the two study municipalities, the SS18 extends for 19.7 km (Table 1).
- A2 Highway (formerly part of the Autostrada del Sole, now called Autostrada del Mediterraneo): The newest north–south corridor, carrying traffic to and from Sicily, and the only highway in Calabria. It is a two-lane road, 24.20 m wide, serving both regional and national north–south traffic. The 16.9 km section crossing the study area was inaugurated in 1972 and is also managed by ANAS. Compared to other Italian highways, it is in poor condition, and renovation work is currently underway. Due to the rugged terrain, its layout mainly consists of tunnels and viaducts.
- Tirrenica Meridionale railway: A double-track railway managed by Ferrovie dello Stato (FS), operational since 1886. It carries both national and regional freight and passenger traffic along a north–south axis and crosses the study area over 15.4 km. The railway is part of the southernmost section of the TEN-T Scandinavian–Mediterranean Corridor of the Trans-European Transport Network. Three stations—Scilla, Favazzina, and Bagnara Calabra—serve local rail traffic within the study area.
- Secondary road network: Provincial (SP) and municipal (SC) roads, managed by the Città Metropolitana di Reggio Calabria and the municipalities of Bagnara Calabra and Scilla. These roads have experienced significant changes over time, with their density increasing in response to urban development. As a result, they are less reliable indicators of long-term landslide-related impacts compared to major transportation routes, whose alignments have remained largely unchanged since the early 20th century.
Table 1.
Types and symbols of the main transportation networks crossing the study area, along with their lengths within the Bagnara Calabra and Scilla municipalities (Italian acronyms explanation: (SP): provincial road; (SC): municipal road; (SS): state road; (FFSS): state railways).
Although ANAS maintains a Traffic Observatory providing Average Annual Daily Traffic (AADT), no monitoring stations are located within the study area. The nearest stations are both just north of Bagnara Calabra (No. 317 on the SS18, and No. 1897 on the A2 motorway). Data available revealed that between 2016 and 2024, AADT values remained stable, ranging from 15,000 to 20,000 vehicles on the A2 and from 2800 to 3000 on the SS18. The only exception was in 2020, when a decrease in AADT was observed on the SS18, and no data were available from the A2 station, likely due to traffic restrictions imposed during the COVID-19 pandemic (https://www.stradeanas.it/it/le-strade/osservatorio-del-traffico/; accessed 19 May 2025).
The data related to roads and the railway network were extracted from OpenStreetMap and were downloaded from the Geofabrik server (https://download.geofabrik.de/europe/italy.html, accessed 8 April 2025). Additional data were obtained from the Geoportale della Regione Calabria (http://geoportale.regione.calabria.it/opendata, accessed 21 May 2025).
2.1.2. Geological and Geomorphological Setting
From a geological perspective, the study area lies within the Calabrian–Peloritane geodynamic domain. It is mainly composed of Hercynian and Alpine high-grade metamorphic and igneous rocks, overlain by Mesozoic marine sedimentary deposits [22,23]. The metamorphic and igneous rocks are primarily Paleozoic gneiss and granite, which are often highly fractured and deeply weathered. The outcropping sedimentary units mainly consist of carbonate rocks (Miocene), sand deposits (Pliocene), conglomerate deposits (Pleistocene), and Holocene alluvial deposits.
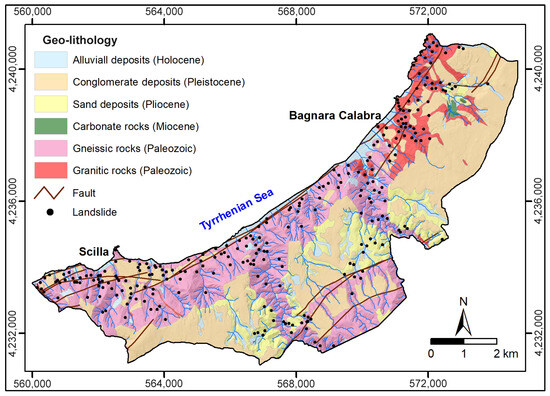
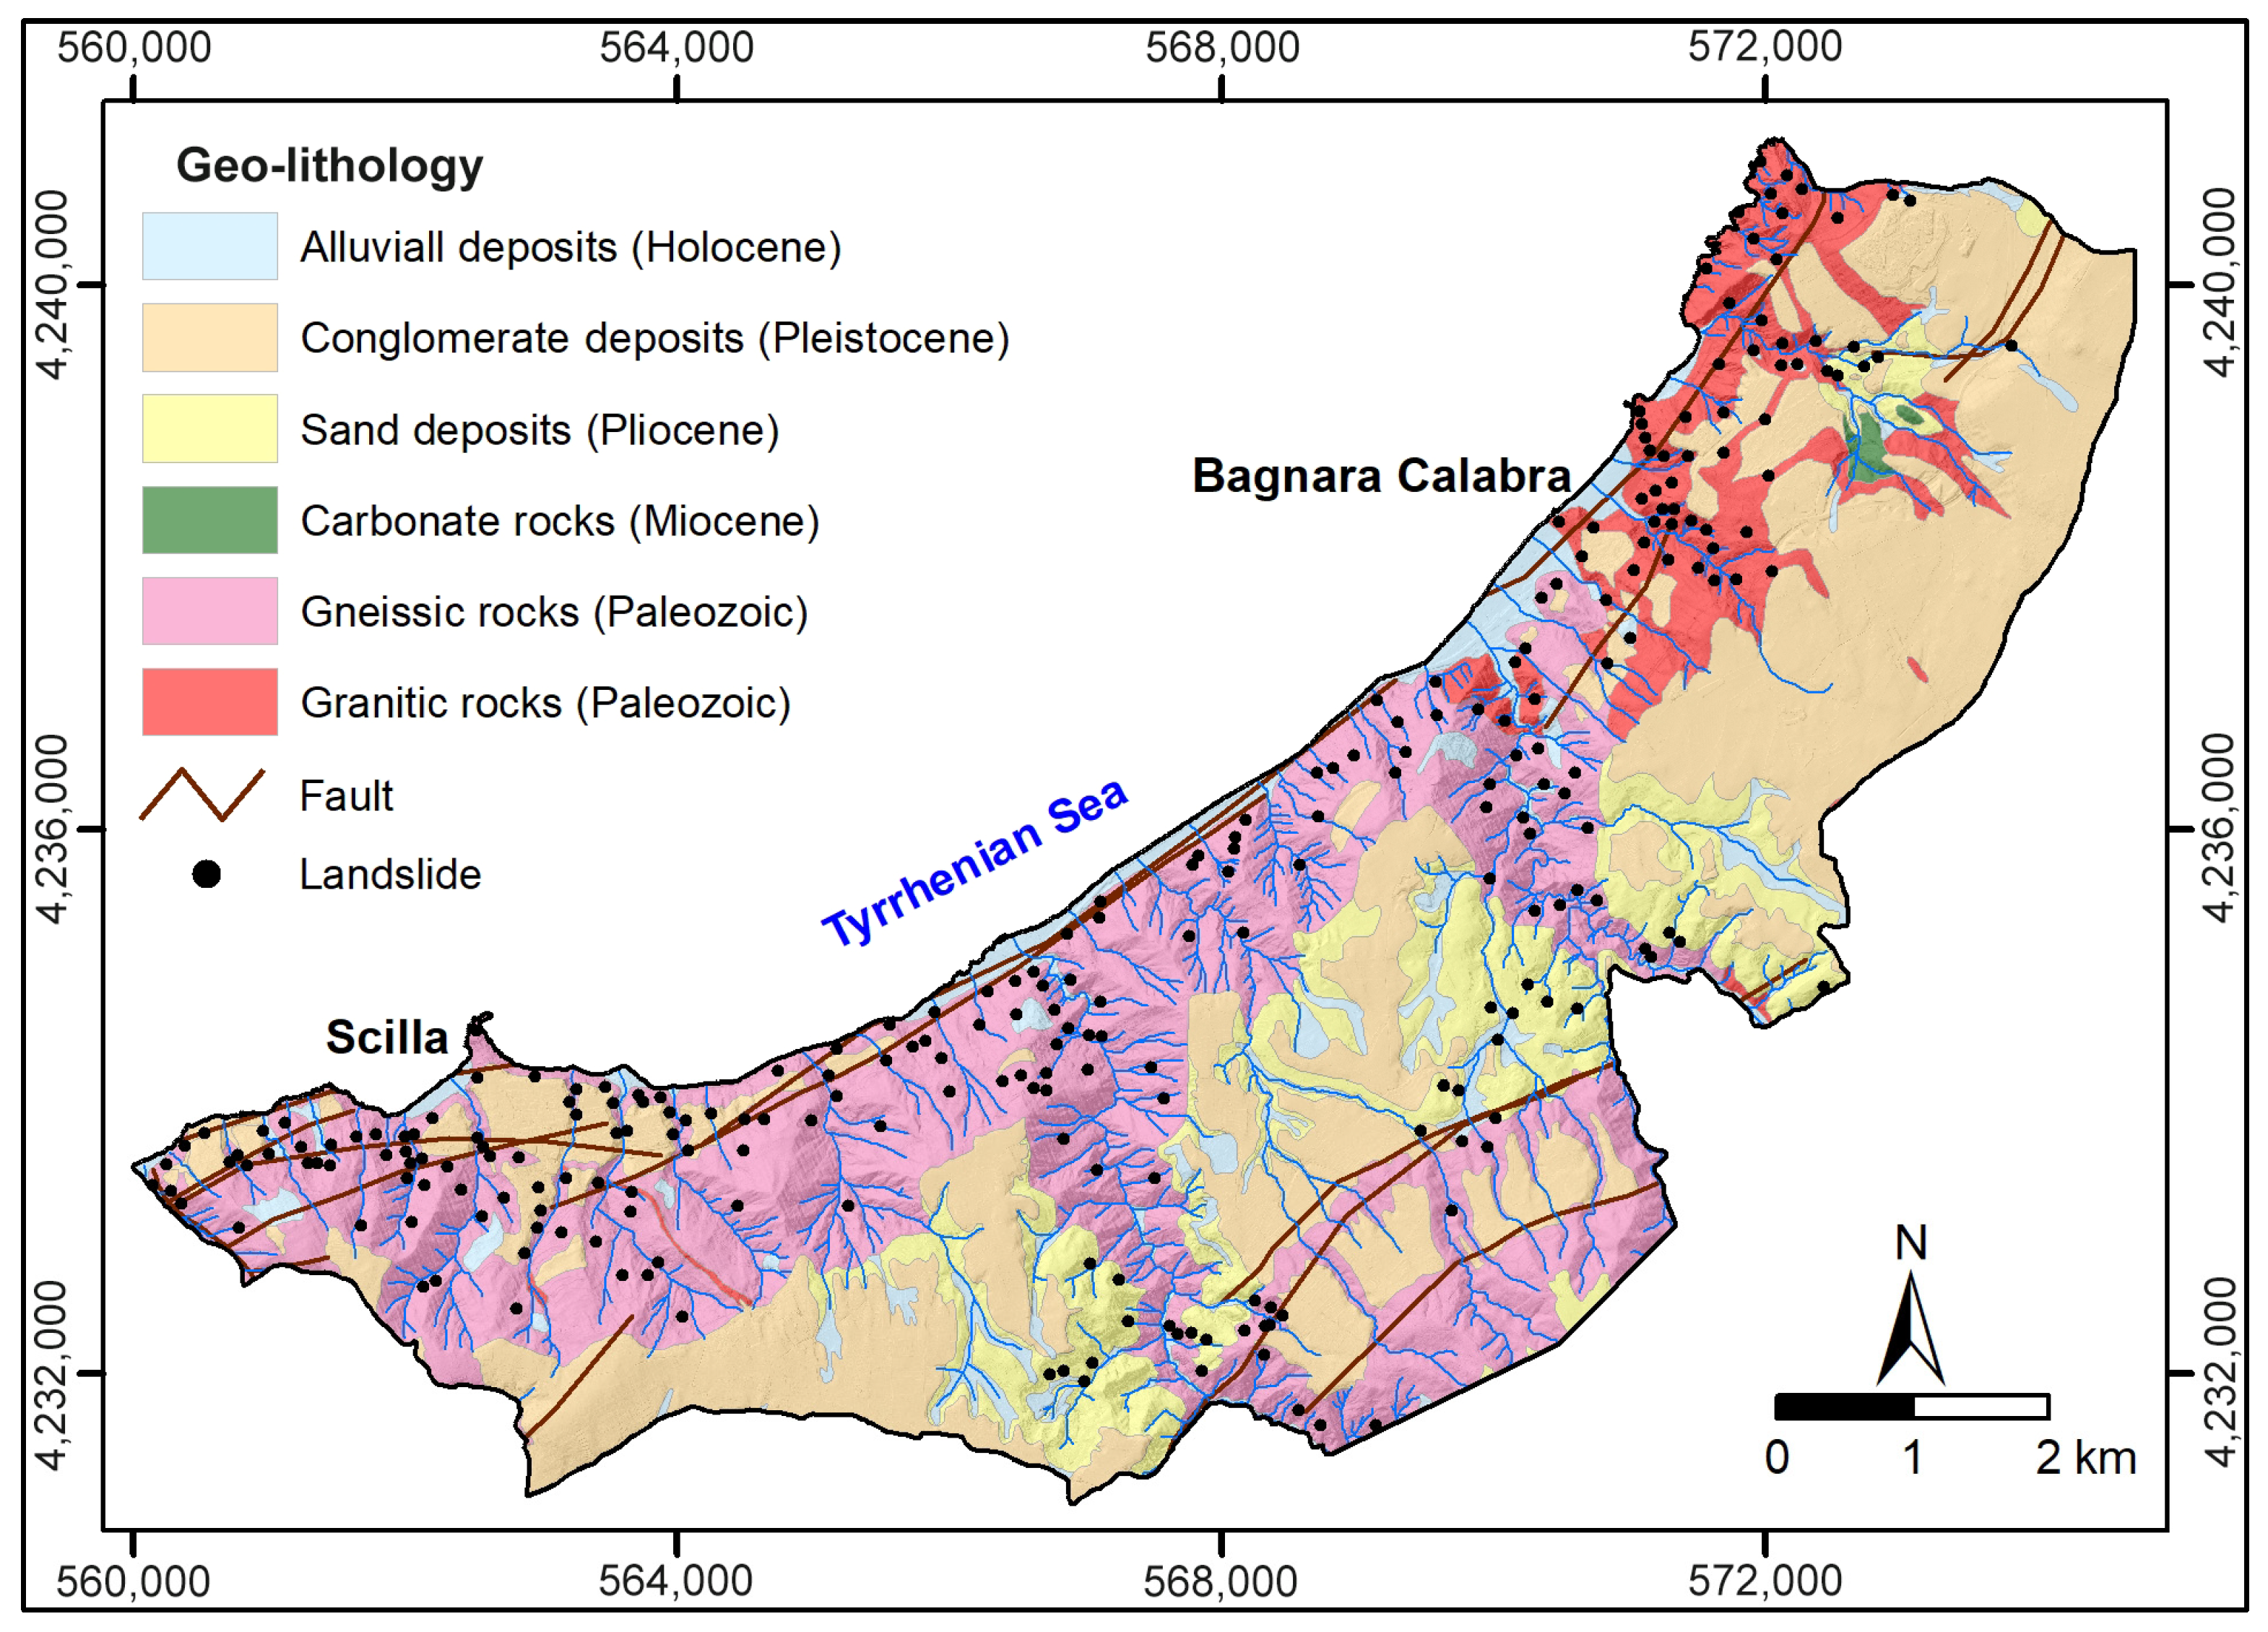
The area is crossed by several faults, mainly oriented NE–SW and NW–SE, associated with the Scilla–Palmi structural high [23]. The NE–SW normal faults are arranged in a northwestward stepwise system. Figure 2 shows the geo-lithological map of the area, produced by integrating field survey data with refined pre-existing geological and structural information from the Calabria geological map at a scale of 1:25,000 (http://geoportale.regione.calabria.it/opendata, accessed 21 June 2021) and the vector layer of the ITHACA Catalogue (http://sgi2.isprambiente.it/ithacaweb/Mappatura.aspx, accessed 3 December 2021).
Figure 2.
Geo-lithological map of the study area. The spatial distribution of landslides is also reported.
The landscape is characterized by steep cliffs and multiple orders of marine terraces [22], shaped by the combined effects of regional uplift and eustatic sea-level fluctuations. Tectono-eustatic uplift has produced a rugged terrain with an average slope of approximately 23°, dissected by short, steep, and deeply incised watercourses. The area also features gently sloping summits bordered by steep escarpments and cut by deep canyons. These geomorphological characteristics make the area highly prone to landslides, particularly during high-intensity rainfall events [24,25,26].
From a climatic standpoint, Calabria falls within the mesothermal climate zone, predominantly classified as Csa (Mediterranean climate with hot, dry summers), while the higher Apennine areas exhibit characteristics of the Csb type (Mediterranean climate with warm, dry summers). The interplay between the region’s geographical location and its orographic structure results in pronounced spatial variability in meteorological conditions, particularly in precipitation patterns. Calabria is exposed to so-called Mediterranean cyclones—extratropical low-pressure systems capable of producing extremely intense rainfall, which can trigger landslides, flash floods, and storm surges [27].
In the study area, annual temperatures range from −0.3 °C to 44 °C, with an average yearly temperature of 19 °C. It is exposed to westerly air currents and receives abundant rainfall, particularly in the hilly and mountainous areas, with the highest average monthly precipitation occurring during the autumn and winter months. Despite the three main roadways running parallel to the coastline at elevations of approximately 100 m a.s.l. (SS18 and the railway line) and 200 m a.s.l. (A2), they are influenced by rainfall originating from the nearby mountain slopes, where precipitation is more frequent and intense due to the rapid increase in elevation. The area’s average annual precipitation is 864 mm, ranging from a minimum of 243.8 mm in 2001 to a maximum of 1492.2 mm in 1930. The mean annual number of rainy days is 81, ranging from a minimum of 33 days in 1999 to a maximum of 121 days in 1963 and 1966. Monthly analysis indicates that rainfall is highest between October and March, accounting for about 72% of the annual total. November and December are typically the wettest months, while June to August represent the driest period, generally characterized by only a few short but intense rain showers [26].
2.2. Methodology
The methodological approach adopted in this study consists of three consecutive phases: (i) the creation of a detailed landslide inventory, including the recognition, mapping, classification, and digitisation of landslides using field data, historical aerial photographs, orthophotos, and LiDAR-derived products; (ii) the analysis of the main geological and morphometric factors controlling landslide distribution, performed through GIS-based spatial overlay procedures and statistical testing; and (iii) the compilation and georeferencing of historical landslide damage to the transportation network, together with the collection and processing of long-term rainfall data.
These phases are described in detail in the following subsections (Section 2.2.1, Section 2.2.2 and Section 2.2.3). These subsections outline the procedures used to create the landslide inventory map, analyze the geological and morphometric factors, and reconstruct the historical record of landslide damage and rainfall for comparison with landslide occurrence.
2.2.1. Landslide Inventory Creation
Landslide recognition and mapping were performed by integrating field surveys, visual interpretation of historical black and white aerial photographs from 1954 (1:36,000 scale) and 1990 (1:33,000 scale), 2008 colour orthophotos (1:10,000 scale), Google Earth imagery from 2009 to 2023, and thematic maps (slope gradient, hillshade, and contour lines) derived from a 1 m resolution Digital Terrain Model (DTM) produced from LiDAR scanning conducted in 2012 by the Italian Ministry for the Environment, Land and Sea (http://wms.pcn.minambiente.it, accessed 10 March 2025). The interpretation of the 1954 and 1990 aerial photographs was performed using traditional stereoscopic techniques with a mirror stereoscope [4,28]. Landslides identified from the stereoscopic analysis were delineated on a 1:10,000 topographic base map, then scanned, georeferenced, and digitized to ensure alignment with more accurate recent datasets and digitized within a GIS environment.
Additional data were obtained from the preexisting landslide inventory compiled by the Regional Basin Authority (Piano di Assetto Idrogeologico—Italian Law 267/98) adopted in 2001 and updated in 2016 (http://geoportale.regione.calabria.it/opendata, accessed 15 June 2023), as well as from previous studies conducted in the area [25,29]. This investigation enabled the identification of the spatial distribution, typology, and state of activity of landslides, following the classification proposed by Cruden and Varnes [30].
The state of activity of landslides was evaluated through a detailed geomorphological detection of recent imagery and field observations, focusing on the preservation (“freshness”) of key morphological features [4,28]. The main diagnostic elements considered were sharp main scarps, secondary scarps and counterscarps, ground cracks (tensional, compressional, or shear), and deformation of anthropogenic structures (e.g., tilted retaining walls, pavement fractures, building distortions, and damaged linear infrastructure).
Field observations were integrated with multi-temporal analyses of orthophotos, DTM, and Google Earth imagery to distinguish active or recently active landslides from dormant ones. Nevertheless, the geomorphic criteria adopted for the recognition of the state of landslide activity are clearly subjective, and the validity of the image interpretation results may be closely dependent on the experience of an analyst.
The landslide dataset was digitized as both polygon and point features and stored within a dedicated GIS geodatabase. Polygon features delineate the entire landslide extent, whereas point features correspond to the centroids of the source areas and include detailed attributes describing landslide typology, estimated magnitude, and geo-environmental setting. The resulting geodatabase provided the basis for generating the landslide inventory map and the landslide density map, both produced using QGIS software (v. 3.34.6).
Landslide density is a commonly used index to evaluate the spatial arrangement and concentration of landslides within a study area [31,32,33]. In this study, the landslide density map was generated using Gaussian kernel density estimation. Based on the spatial extent and distribution of landslides, a search radius of 1 km was selected, and the density surface was computed using the Heatmap tool in QGIS. The resulting density values represent the number of landslides per km2, allowing the detection of high-density zones and spatial patterns of landslide occurrence. To classify spatial variations in landslide concentration, the density values were grouped into five classes using Jenks’ natural breaks method.
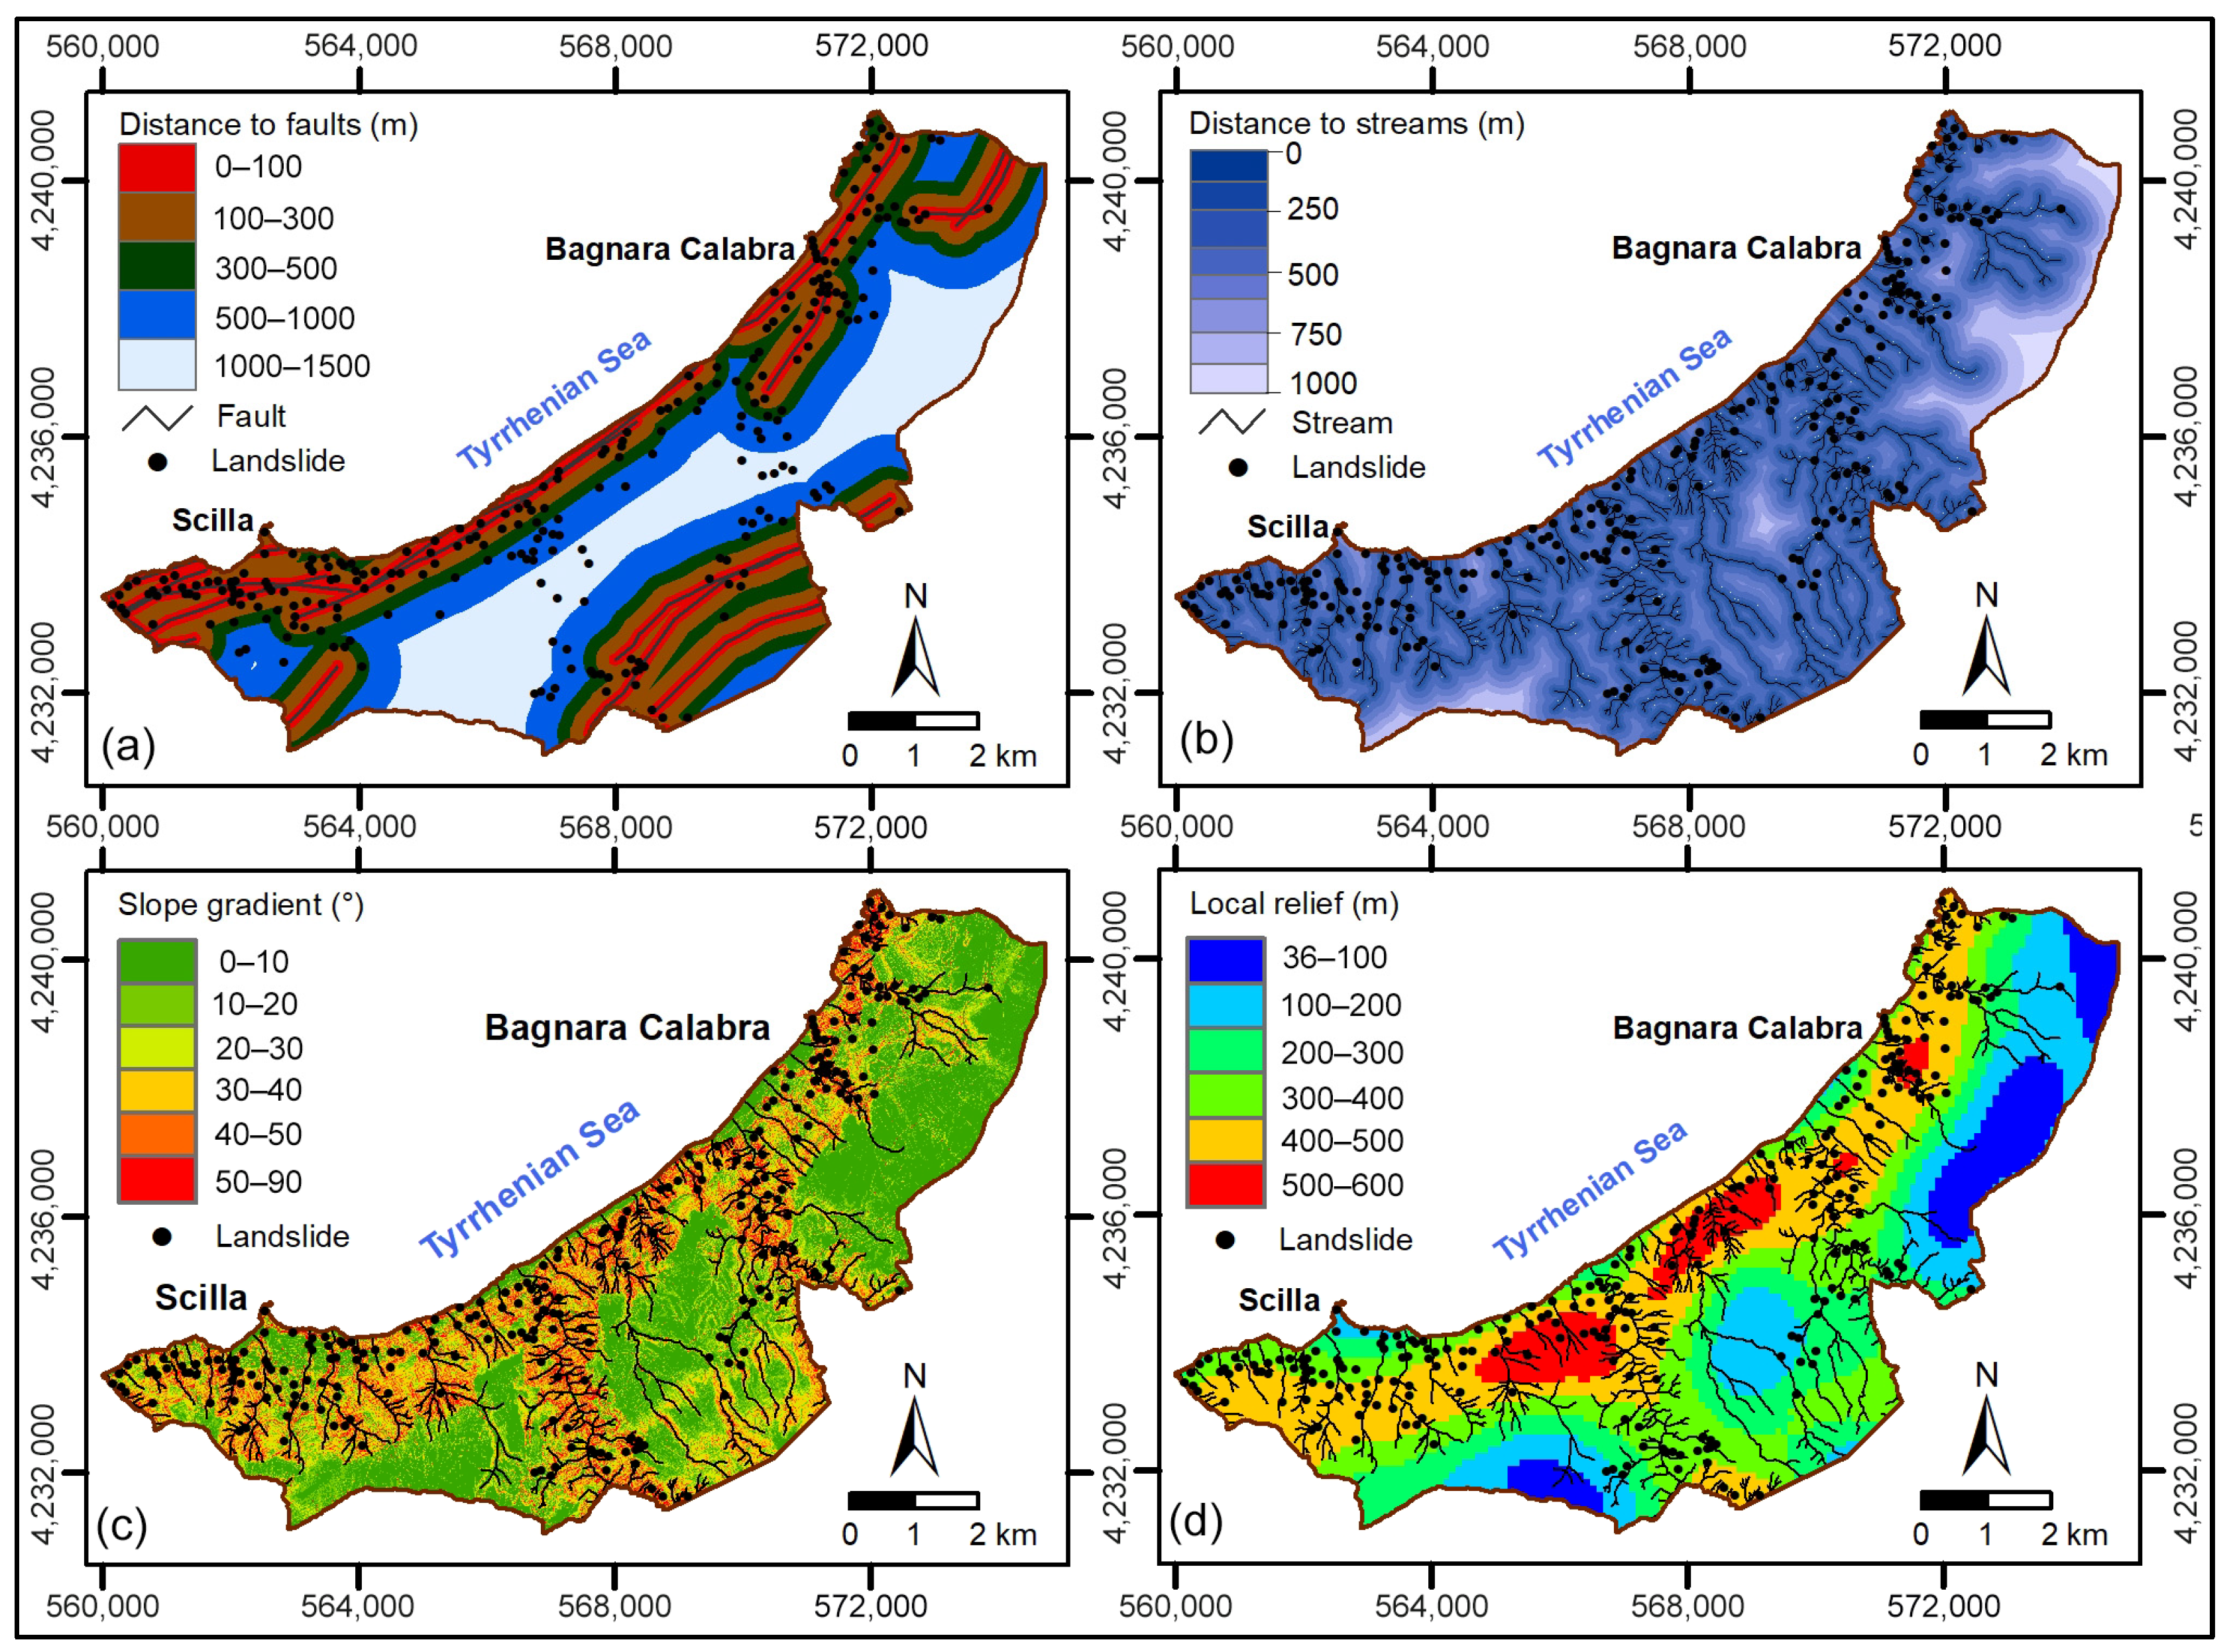
To assess the role of geology and the main morphometric features in landslide distribution, the landslide inventory map was compared with lithology, distance-to-faults, distance-to-streams, slope, and local relief maps (Figure 2 and Figure 3). Morphometric parameters were derived from a LiDAR-based DTM resampled to a 5 × 5 m pixel size. The local relief map represents the elevation range calculated within a 1 km2 moving window [31]. The comparison between landslide distribution and the various thematic layers was performed using the QGIS zonal statistics function. Specifically, we performed a spatial overlay between the landslide inventory—mapped as point features—and each thematic layer. For continuous raster variables (e.g., slope, local relief), we extracted the pixel values intersecting each landslide point. For lithology (categorical variable), we extracted the corresponding class at each landslide point and analyzed the distribution of categories associated with landslide occurrences.
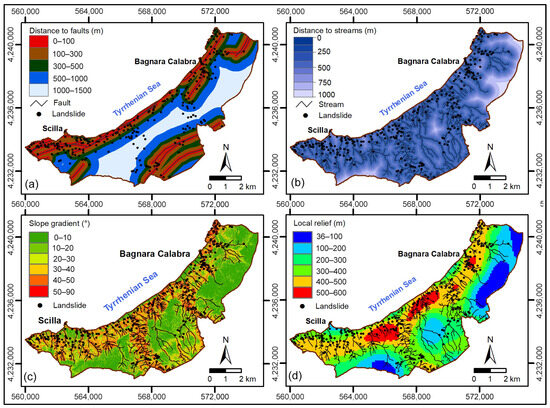
Figure 3.
Maps of (a) distance to faults, (b) distance to streams, (c) slope gradient, and (d) local relief. Each map also shows the spatial distribution of landslides. The maps highlight a high concentration of landslides within 500 m of faults and within 200 m of streams. In addition, a high occurrence of landslides was recorded along slopes characterized by steep gradients (>25°) and high values of local relief (>400 m).
Additionally, statistical analyses were conducted on the identified geological and morphometric factors to assess their specific effects on the distribution and size of the landslides, using the non-parametric Mann–Whitney test. In this study, landslide types were compared pairwise, and the Mann–Whitney test was applied to assess significant differences in the medians between the two considered landslide types, adopting a significance threshold of 0.05. When p < 0.05, differences were considered statistically significant. The statistical analyses were performed using SPSS software (v. 29.01).
Finally, to quantify the road and railway sections affected by landslides, a spatial intersection analysis was carried out in a GIS environment. Specifically, the landslide inventory map was overlaid with the transportation network layers, which included the different road typologies (highway, state road, and provincial or municipal road) and the railway network. The geometric intersection operation allowed identifying and extracting the portions of each road typology and of the railway lines that spatially overlapped with the mapped landslides. The lengths of the affected segments were then calculated for each transportation type, allowing a quantitative assessment of the impact of landslides on the local infrastructure.
2.2.2. Landslide Damage Data Collection
Documentary sources, widely used in the literature to reconstruct historical landslide series [34], were employed to compile the record of past landslides involving the study area [35], and particularly the road network.
The data sources included a digital catalogue created in 1996 and continuously updated by the Research Institute for Geo-Hydrological Protection in Cosenza, which compiles information on Calabrian landslides from:
- Scientific and technical reports;
- Regional newspapers;
- Regional news websites.
Additional information was obtained for the present research from:
- The local State Archive;
- The Regional Civil Protection Archive;
- The Regional Department of Public Works Archive;
- Notifications of road closures provided by the roads management company (ANAS).
From these sources, we selected descriptions of rainfall-triggered landslides that affected the road network and used this information to populate the database. Events caused by excavations, earthquakes, or water pipe leaks were excluded. Each database record has a unique ID and contains spatial information (e.g., municipality, road, milestone, and site) and temporal information (day, month, and year of occurrence). When a single event affected multiple locations on the same day, separate records were created for each affected location.
In this study, the historical investigation covered the period from 1950 to 2025, which closely corresponds to the timeframe of the multi-temporal geomorphological analysis.
The dataset was processed in a GIS environment and georeferenced using available location descriptors. Geographic coordinates for each landslide event were determined through a combination of automated geocoding and manual verification and then added to the dataset to complete its spatial referencing.
2.2.3. Rainfall Data Collection
In the study area, rainfall data over the past century were continuously recorded at the Scilla rain gauge (73 m a.s.l., operational since 1953) and more sporadically at the Bagnara Calabra station (170 m a.s.l., operational since 1928) (ARPACAL Multi-Risk Functional Center, https://www.cfd.calabria.it/index.php/dati-stazioni/dati-storici, accessed on 20 May 2025). To fill gaps in both series, a synthetic rainfall series was created by merging data from the two stations.
A synthetic monthly precipitation series was derived by combining the gap-filled final series of Bagnara and Scilla. For each month–year , the synthetic value was defined as:
where and represent the final values for Bagnara and Scilla, respectively—i.e., the observed precipitation when available, or when the observation was missing. This row-by-row mean ensures that if only one station provides a valid value, takes that value; if both are missing, the synthetic value is left undefined.
Monthly regressions were calibrated separately for each calendar month using only years where both stations had valid data, producing coefficients , , and and a sample size . Missing values were reconstructed using these month-specific relationships. The monthly climatology was then computed as the temporal mean of the synthetic series for each month of the year.
Monthly rainfall values derived from this combined dataset were then used to graphically compare the temporal distribution of landslide events with monthly precipitation patterns, allowing for the identification of periods in which rainfall conditions were likely to have contributed to landslide triggering.
3. Results
3.1. Landslides Distribution, Type and Activity
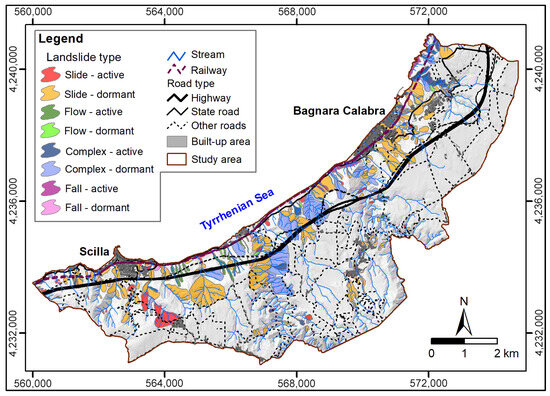
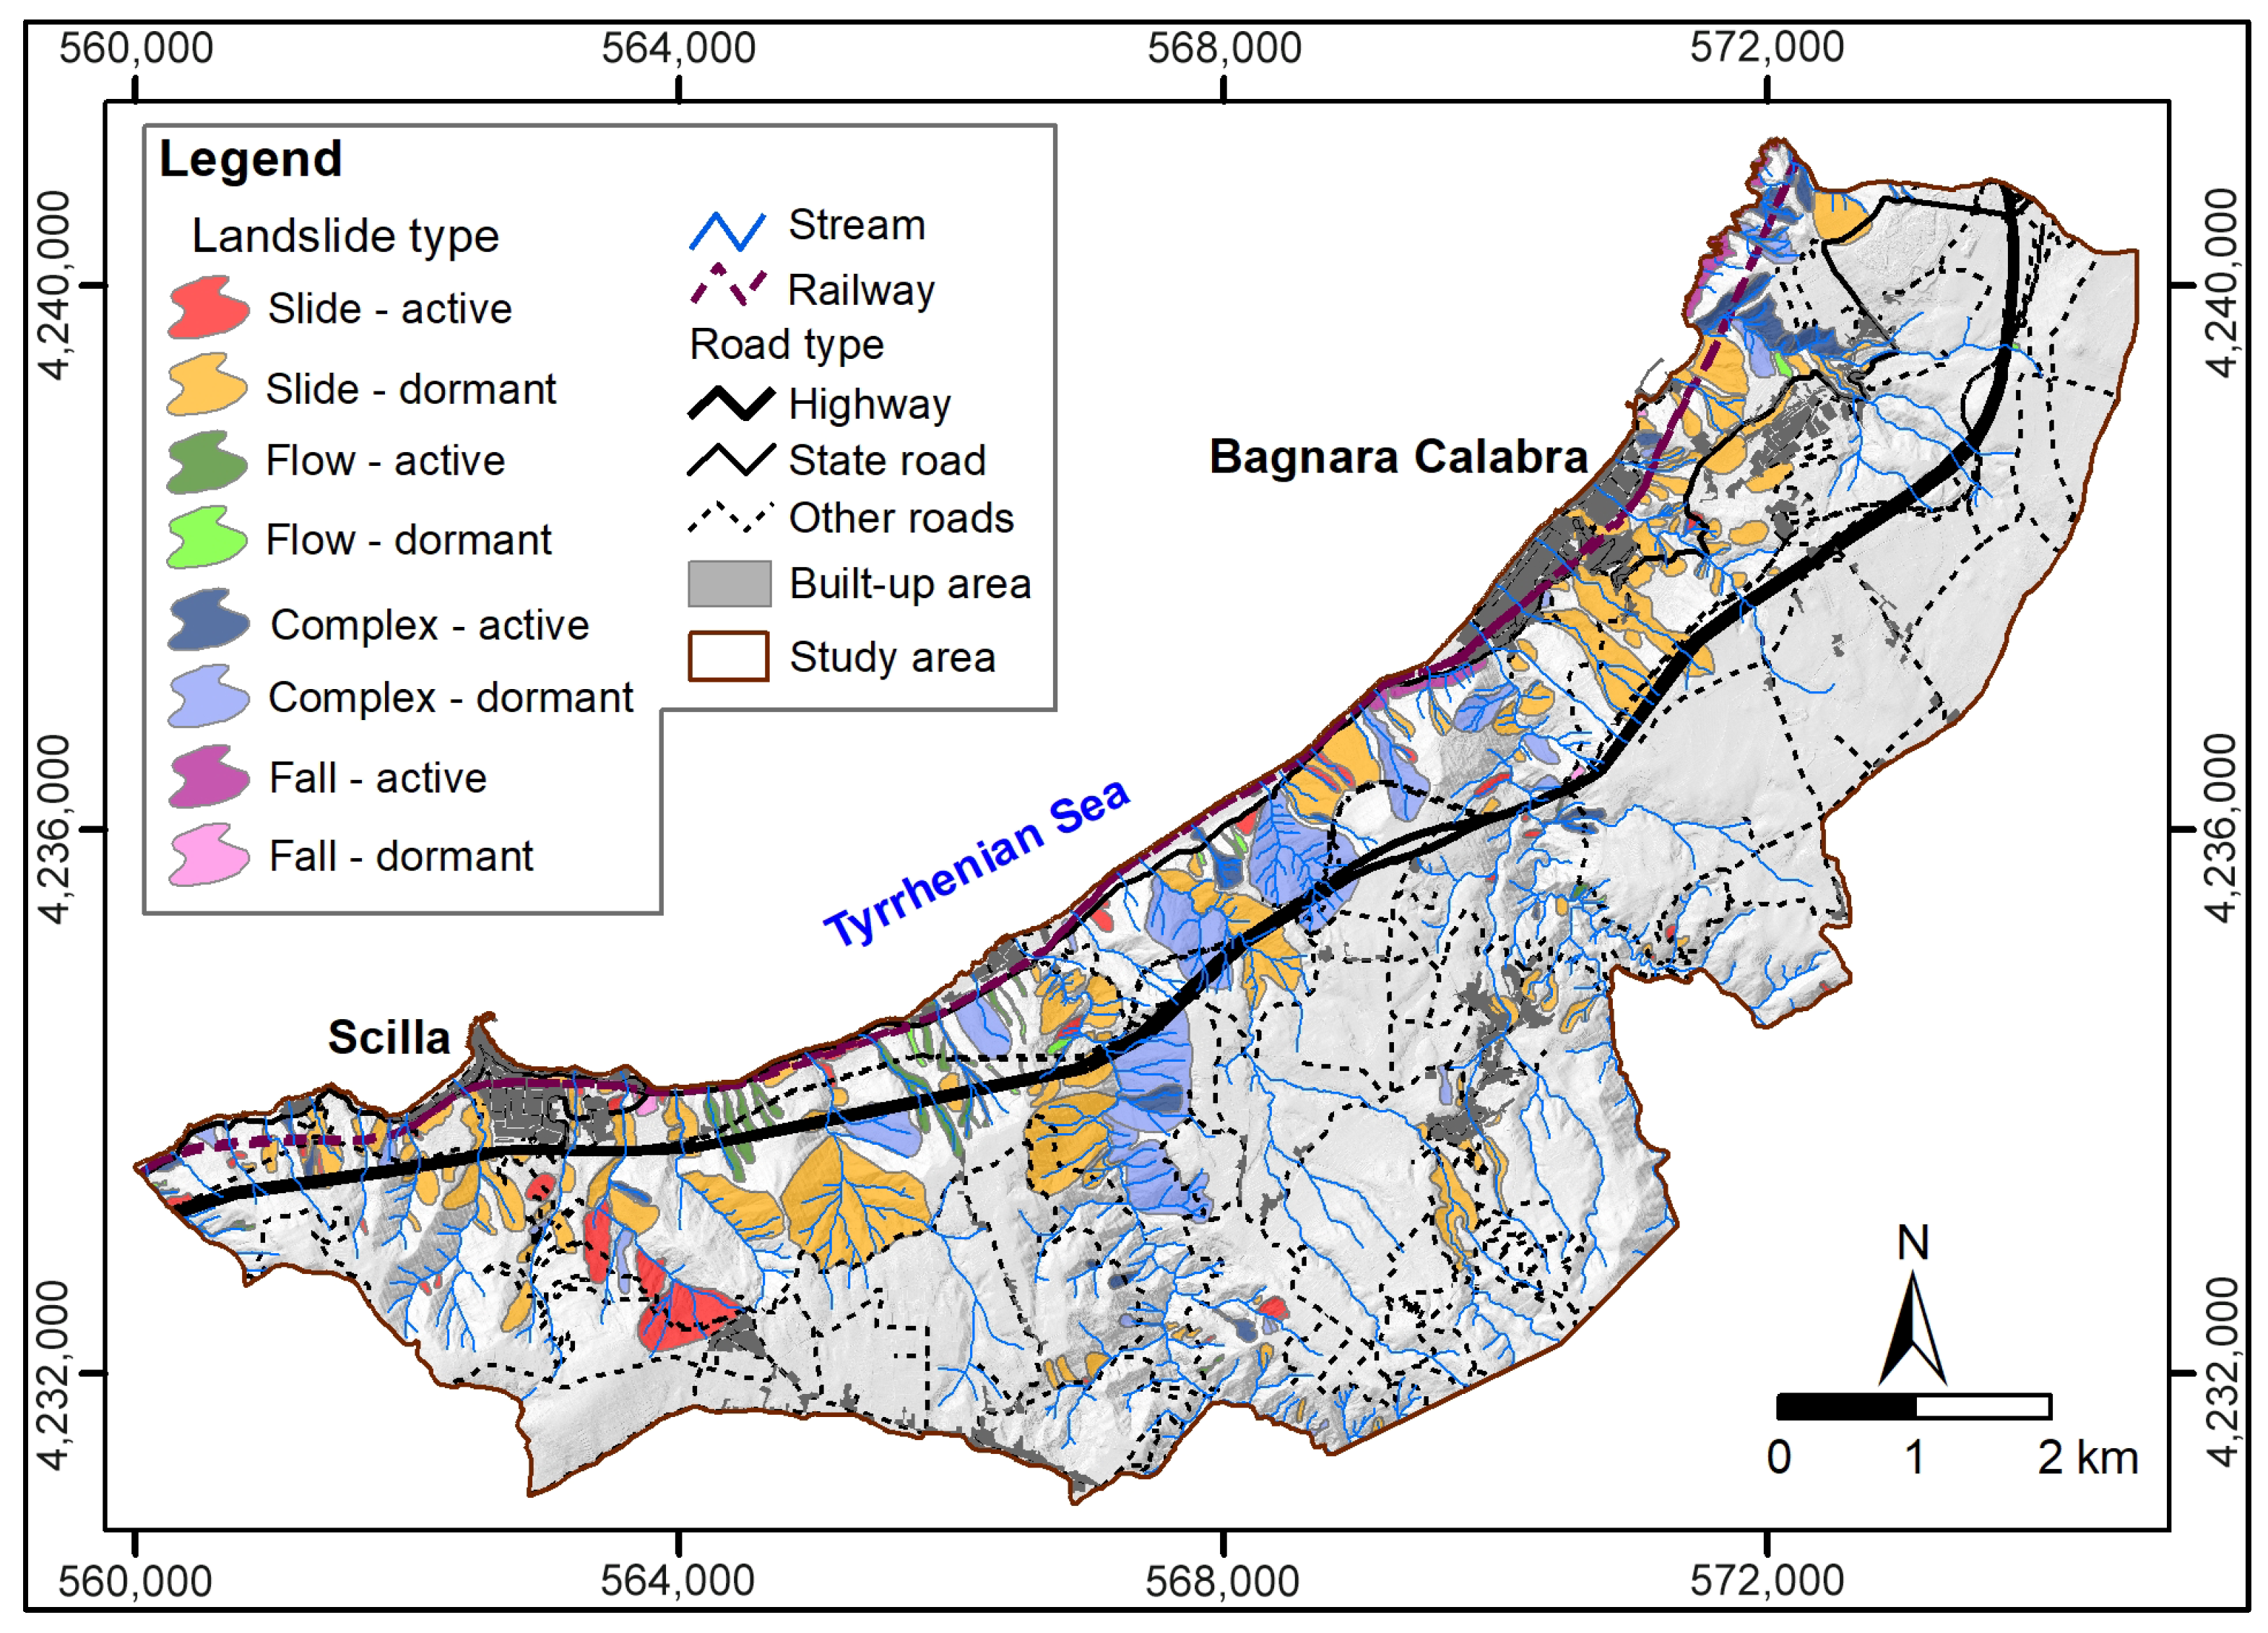
The multi-source data analysis provided detailed information about spatial occurrence, typology and state of activity of each identified landslide (Figure 4). The landslide inventory included a total of 261 landslides, covering approximately 10 km2, which corresponds to 18.8% of the whole investigated area (Table 2). This value represents the total area affected by landslides, obtained by summing the areas of all individual landslide polygons after merging overlapping features to avoid double-counting. The average value of landslide frequency is approximately 4.9 landslides per square kilometre.
Figure 4.
Landslide inventory map showing the spatial distribution of the different landslide types and their activity state.
Table 2.
Main characteristics of landslides obtained by map analysis.
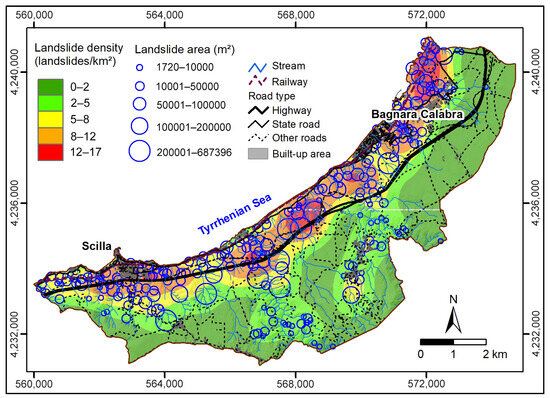
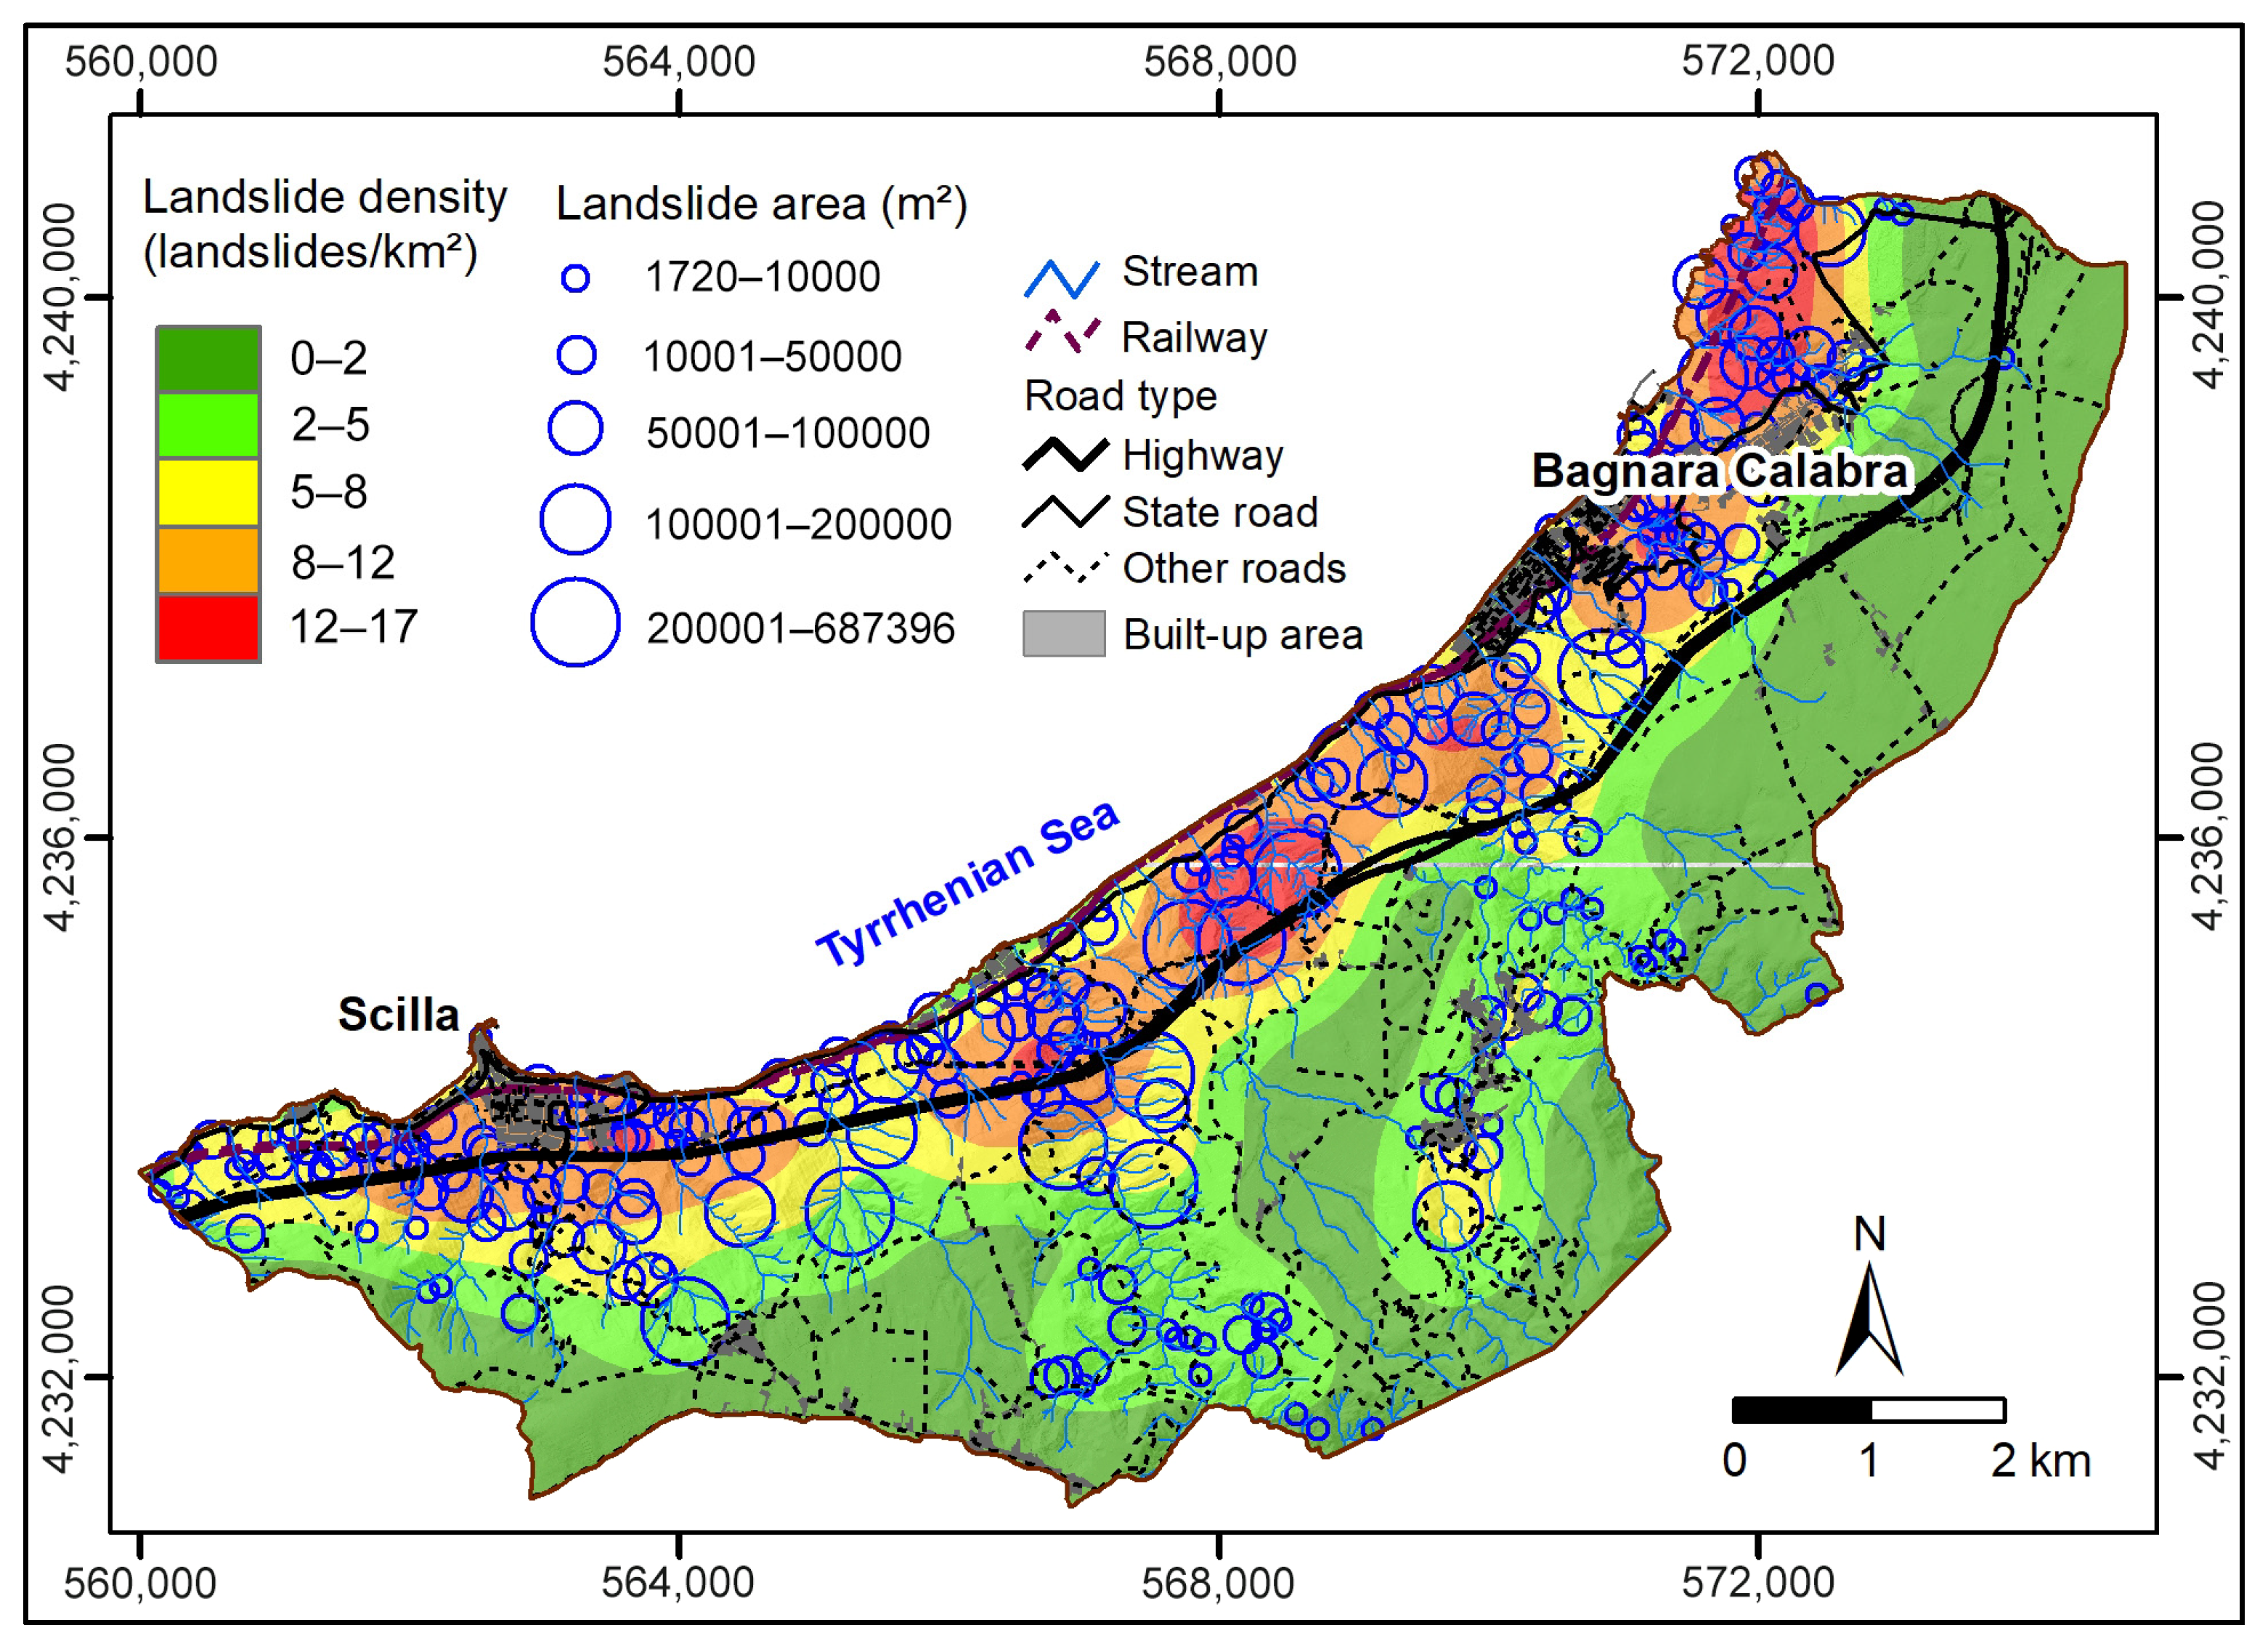
The landslides are mainly clustered in the north-western sector of the study area, which is characterized by rugged topography deeply dissected by narrow and steep valleys, where kernel density reaches peaks of 17 landslides/km2 (Figure 5). In contrast, landslide occurrence is significantly sparser (less than 5 landslides/km2) in the uppermost portion of the area, which is characterized by a flat or gently undulating landscape (Figure 3c).
Figure 5.
Landslide density and areal size distribution of mapped landslides in the study area.
The identified landslides are classified into four main movement types: slide, flow, complex, and fall (Figure 5). Slide-type landslides are the most common, accounting for 66.7% of the total, followed by complex landslides, which represent 17.6% (Table 2). Complex landslides involve a sequence of two or more movement types, with a spatial predominance of one of them [30]. In the study area, slide–debris flows are the most spatially predominating complex typology [25]. Flow-type landslides, particularly debris flows, constitute 11.9% of the mapped events, whereas falls represent the smallest proportion, accounting for less than 4% (Table 2).
The state of activity of the inventoried landslides was assessed through multi-temporal investigations, field surveys, and analysis of historical data. Of the mapped landslides, 33.3% were classified as active, whereas 66.7% were mapped as dormant (Figure 4). The integration of multi-temporal imagery analysis and historical records indicates that a large proportion of the landslides currently classified as active represent reactivations of previously dormant phenomena, as several slopes show repeated phases of movement documented in old aerial photographs and orthophotos and reported in historical sources.
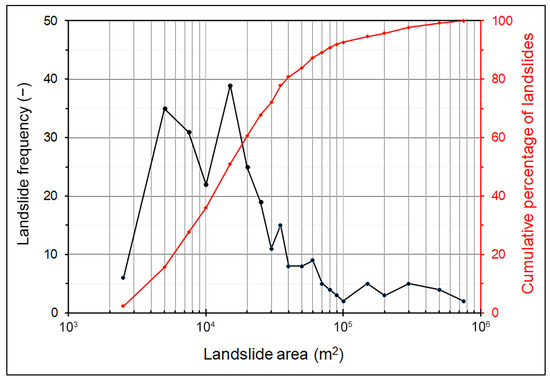
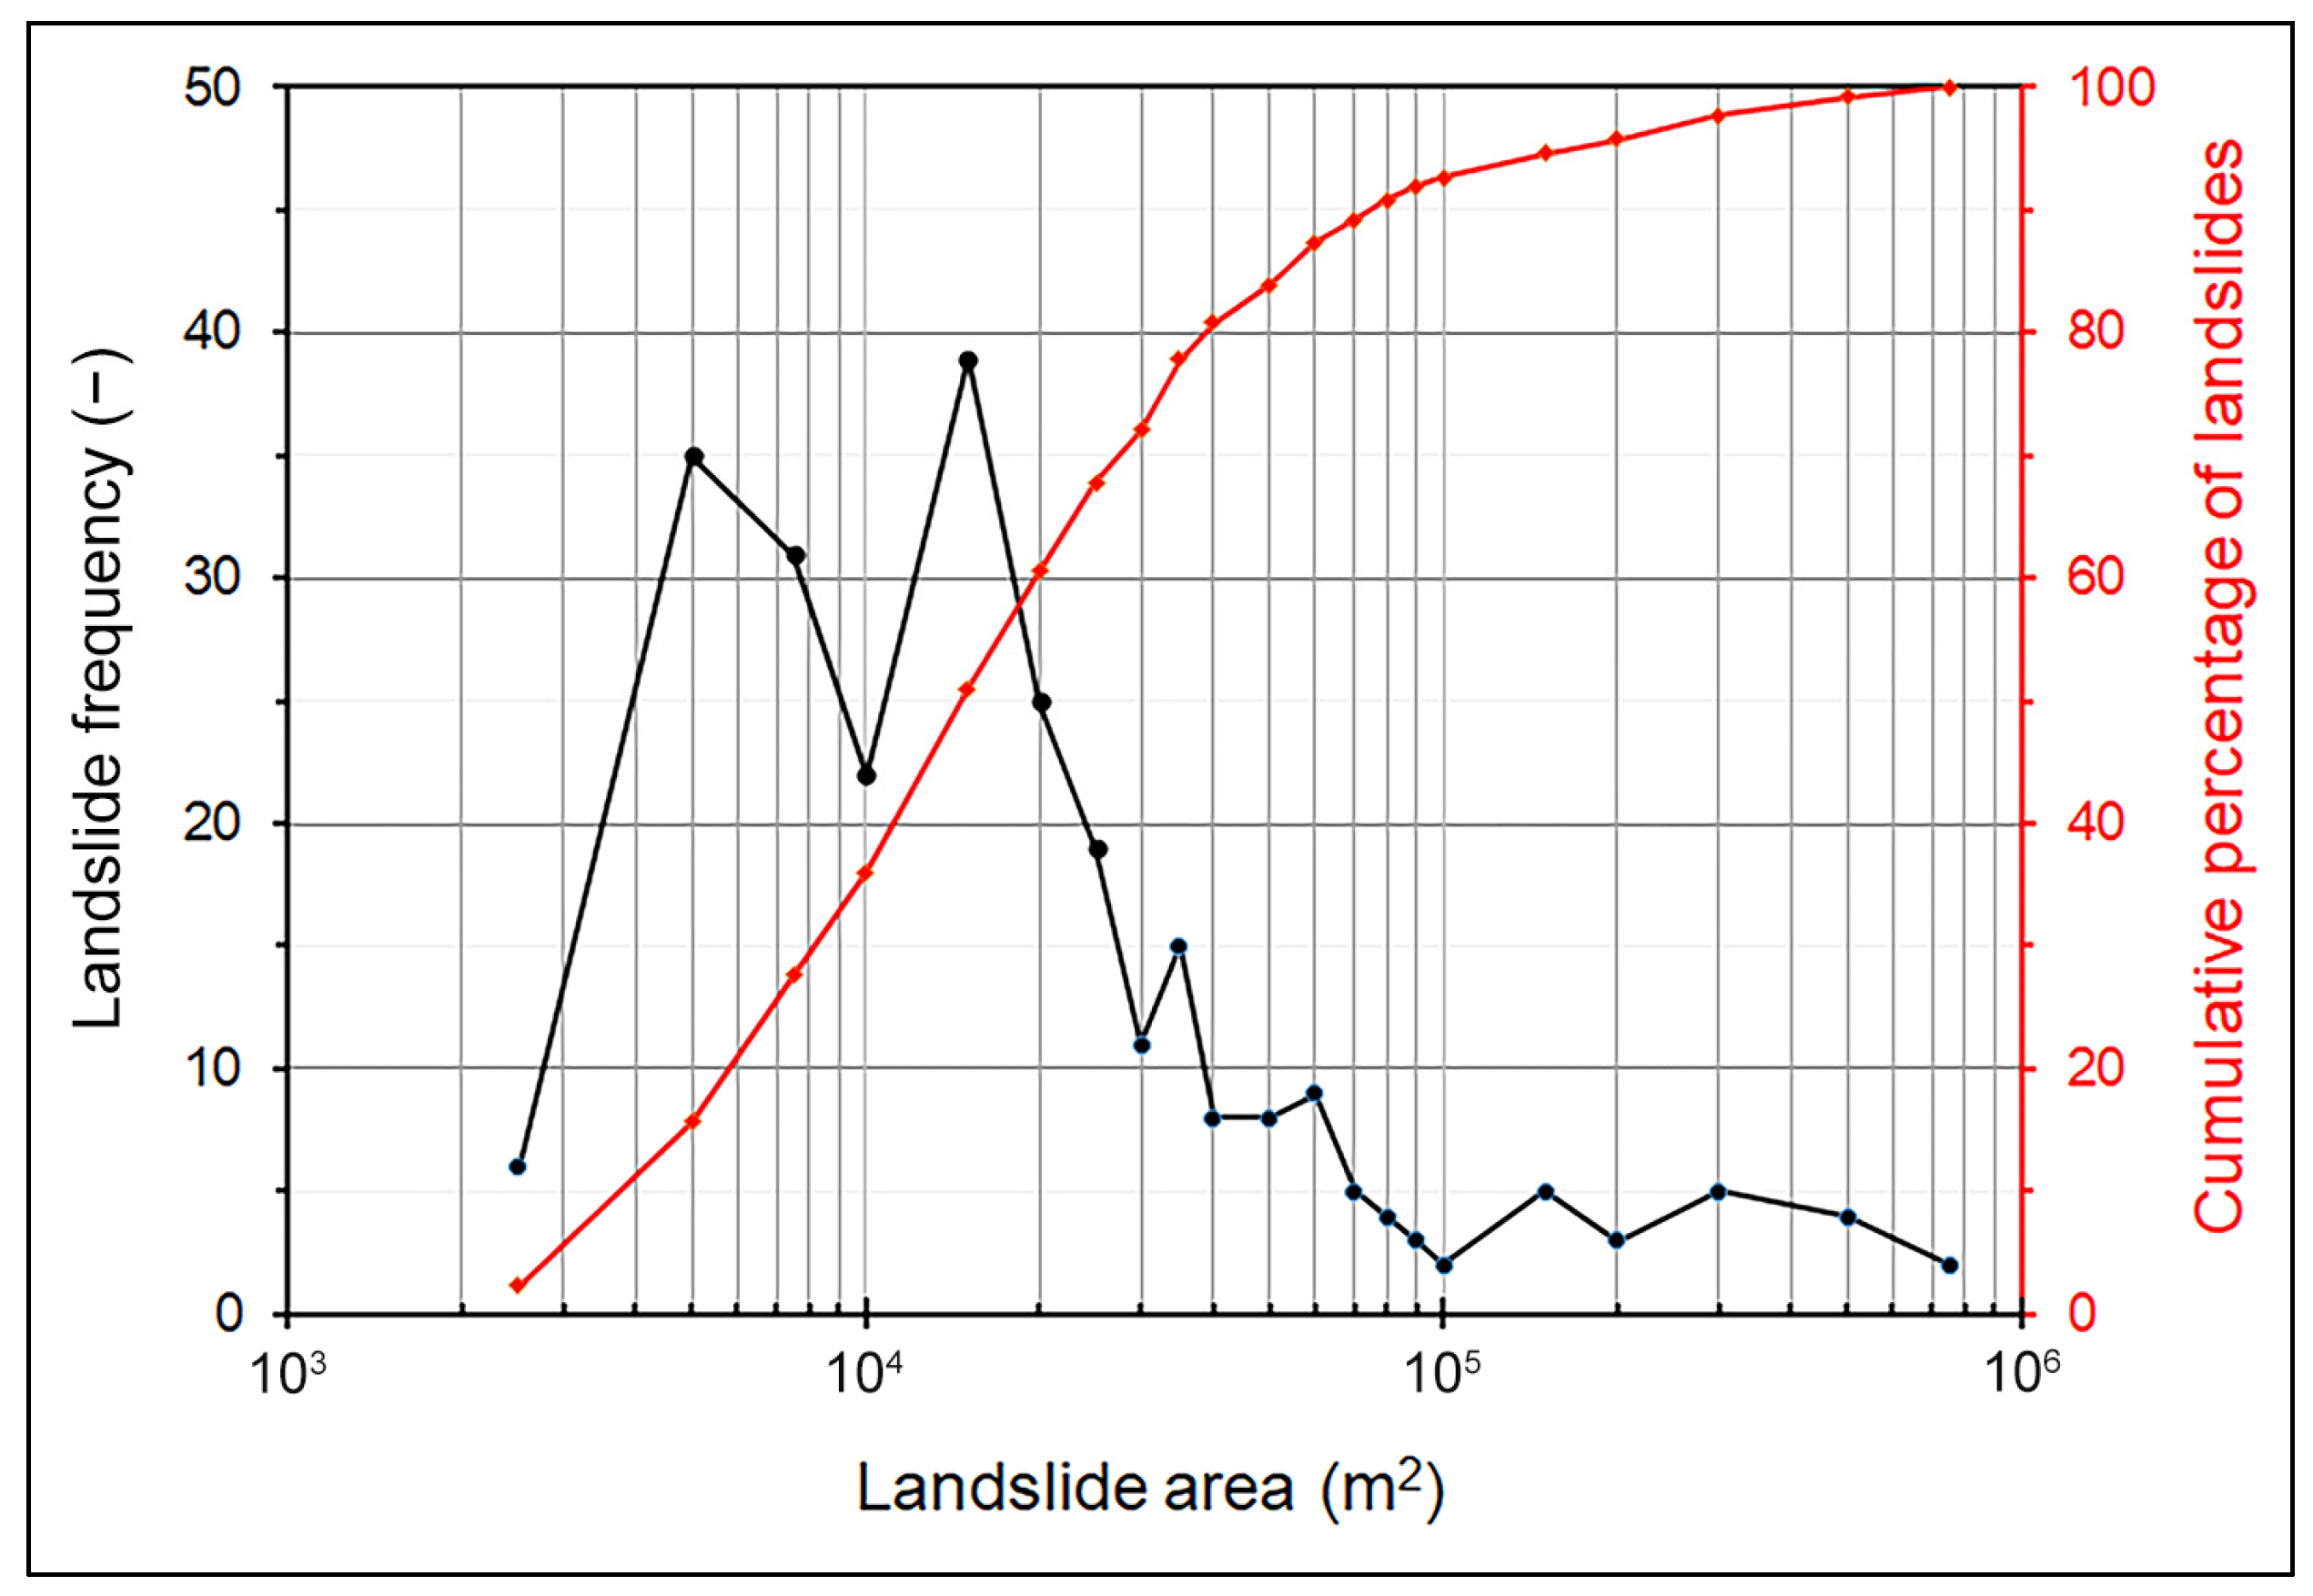
The landslide size pattern in the study area is spatially heterogeneous (Figure 5), with areas ranging from 1.72 × 10³ m2 to 6.87 × 10⁵ m2 and a mean value of 3.83 × 10⁴ m2 (Table 3). Analyzing the distribution of landslide size in more detail by means of the frequency and the cumulative number of landslides (Figure 6), it can be observed that most landslides have areas between 10 × 103 and approximately 20 × 103 m2, accounting for about 61% of the total. Landslides with areas larger than 20 × 103 m2 are distributed as follows: 61 events (23%) fall within the 20,000–50,000 m2 range, 24 (9%) within 50,000–100,000 m2, 17 (7%) within 100,000–500,000 m2, and only two landslides exceed 500,000 m2. Overall, the cumulative area–frequency distribution graph highlights a significant decrease in the occurrence of landslides with areas larger than 100,000 m2 (Figure 6).
Table 3.
Summary of landslide size distribution and estimated landslide volumes.
Figure 6.
Frequency–area distribution of the landslide inventory.
The statistical analysis indicates that landslide size varies significantly (p < 0.05) with movement type, with complex landslides exhibiting the highest mean values and flows the lowest (Table 3).
Moreover, the volume (VL) of each individual landslide was estimated using the power-law area–volume scaling relationship proposed by Guzzetti et al. [36]:
where AL represents the landslide area. The computed volume of landslides surveyed ranges from 3.64 × 10³ to 215.37 × 10⁵ m3, with an average value of 58.81 × 10⁴ m3 (Table 3). However, it is important to note that these values represent empirical estimates and may not reflect the exact in situ volumes, as the relationship inherently involves a degree of uncertainty.
VL = 0.074 × AL1.450
3.2. The Role of Geological and Morphometric Features on Landslide Occurrence
The landslide distribution in the study area seems to be controlled by a combination of geological and morphometric factors such as lithology, distance to faults, distance to streams, slope gradient, and local relief (Figure 2 and Figure 3).
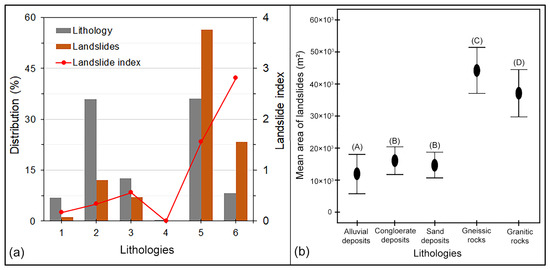
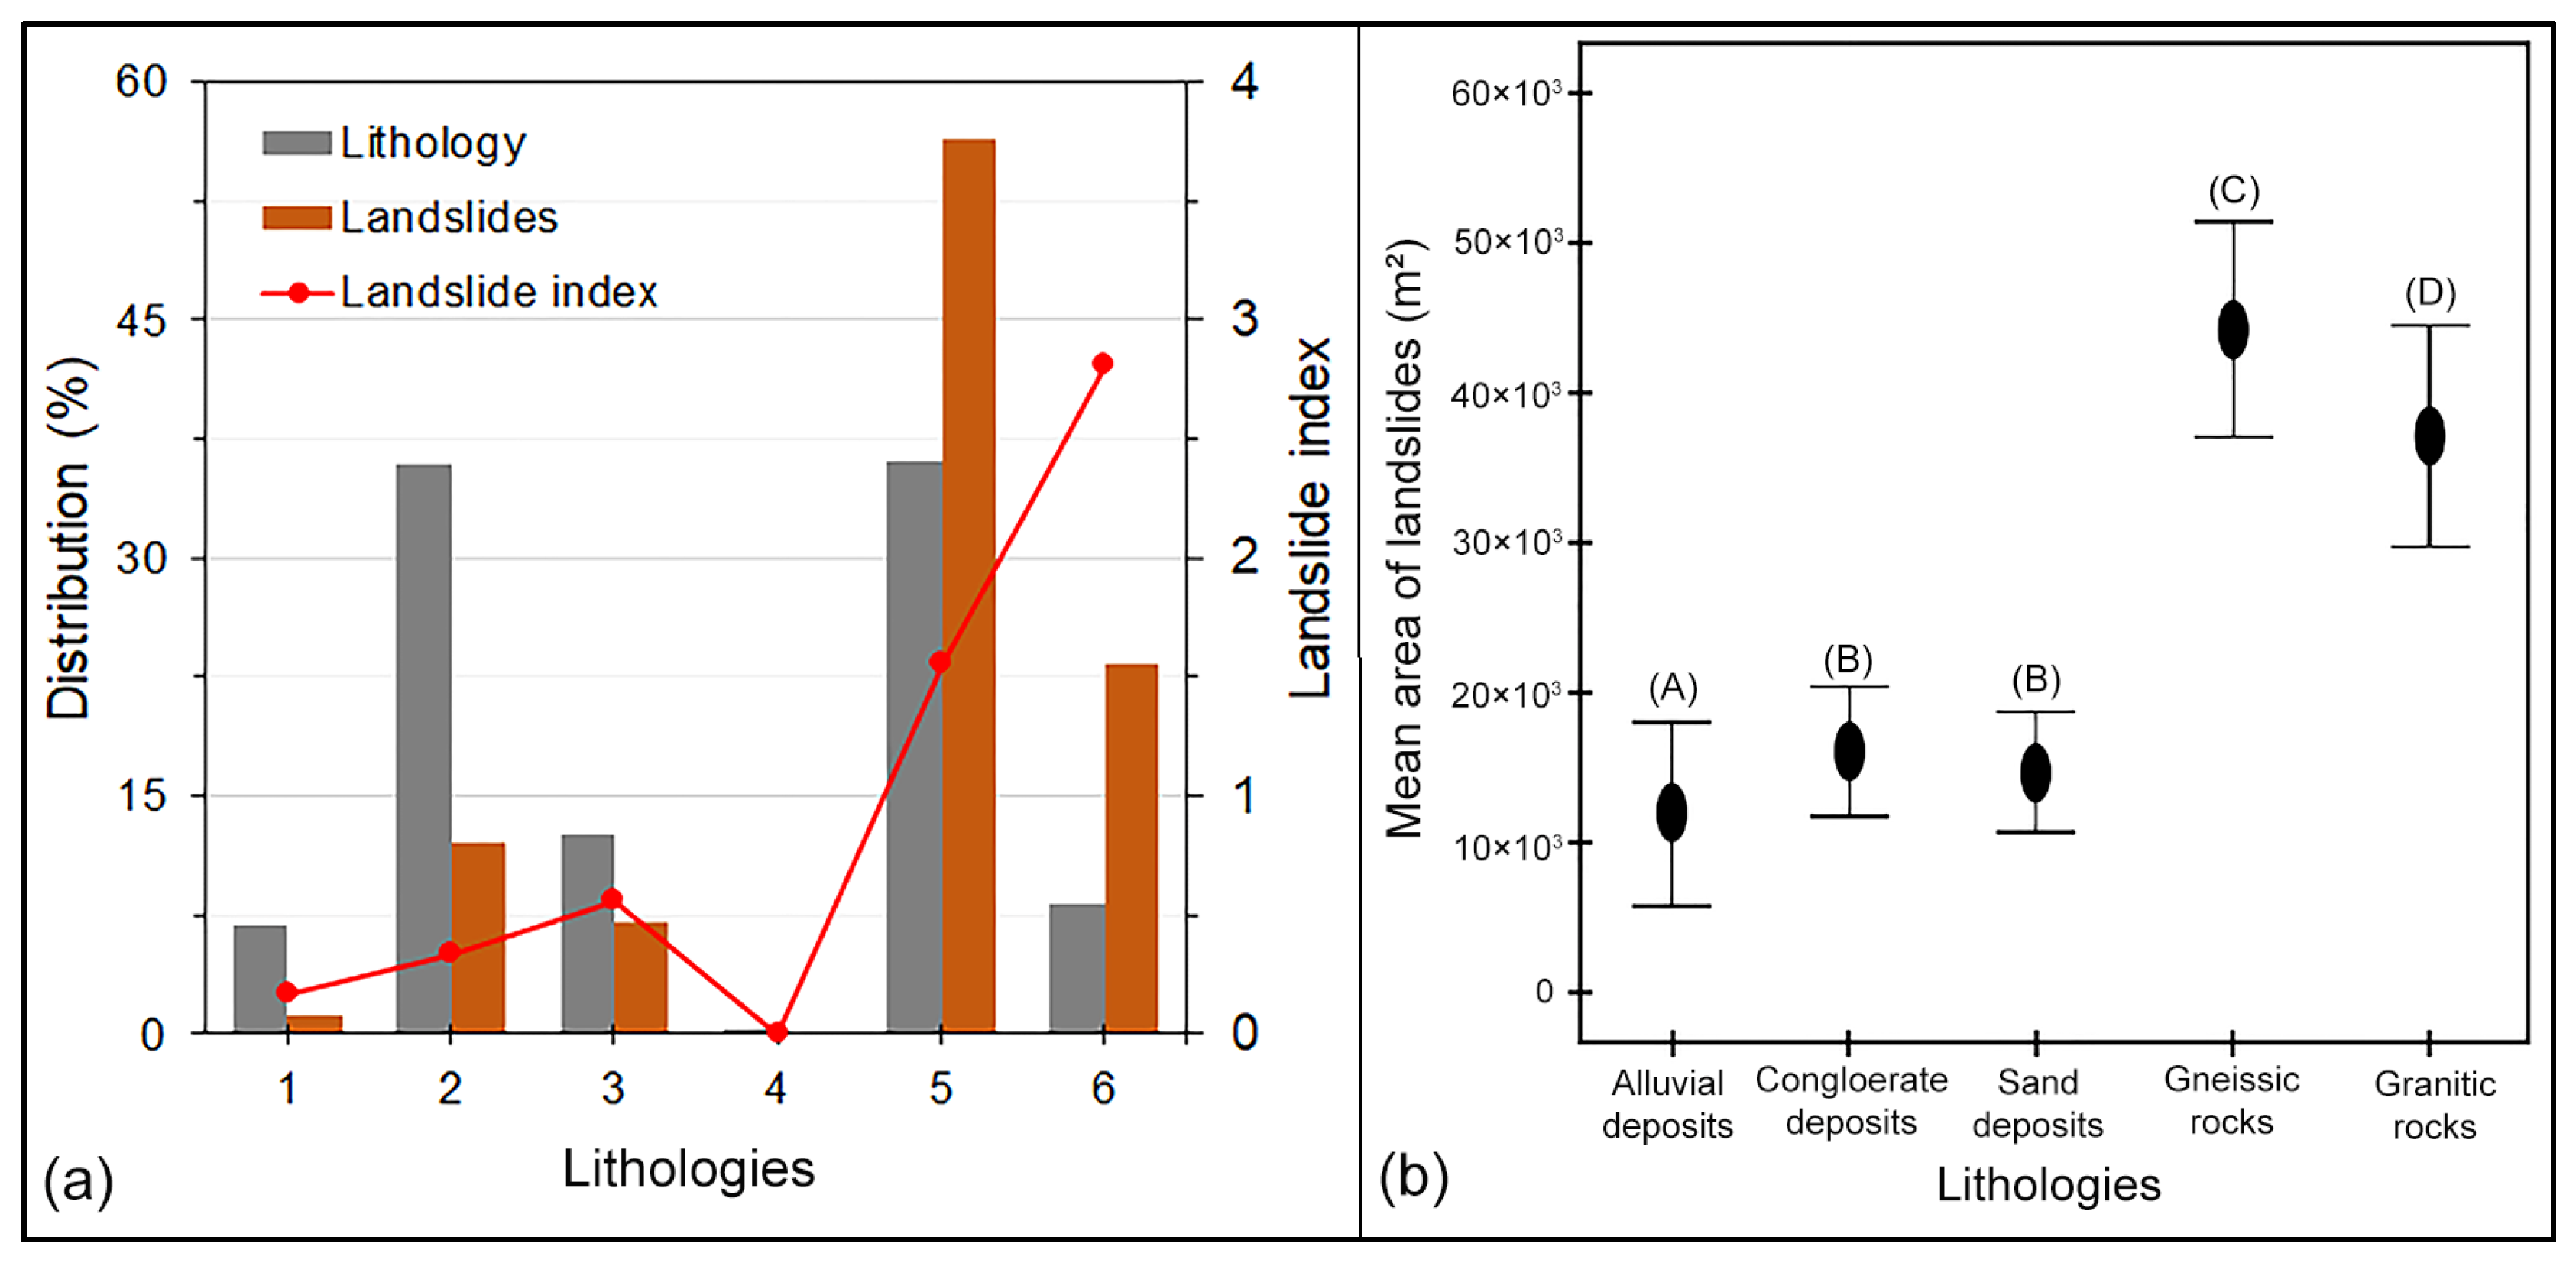
From a lithological perspective, the overlay of the landslide inventory map with the geo-lithological map (Figure 2) indicates that the granitic and gneissic rocks are the most affected by landslides, accounting for approximately 80% of the mapped phenomena (Figure 7a). This is due to the fact that these rocks are highly fractured and weathered [31]. When the landslide index is defined as the ratio (in percentage) between landslide area and the total area of each lithological class, these lithologies exhibit the highest values within the study area. Among them, granitoids showed a higher landslide index, reflecting their relatively limited areal extent. In addition, a discrete concentration of landslides, about 12%, occurred on conglomerate deposits, whereas approximately 7% occurred on sandy deposits, and only 1% involved the alluvial deposits (Figure 7a).
Figure 7.
(a) Areal distribution of landslides compared to lithology map of the study area (1. Alluvial deposit, 2. Conglomerate and sand deposits, 3. Sand deposits, 4. Carbonate rocks, 5. Gneissic rocks, 6. Granitic rocks). (b) Relationship between landslide size and lithologies. Mean values (black dots) and standard errors (vertical bars) of landslide size across the different lithologies. Lithologies sharing the same capital letters are not significantly different.
The comparison between landslide size and the different lithologies showed that significantly larger landslides occur in granitic and gneissic rocks than in the sedimentary formations. Overall, the largest landslides were observed on the gneissic rocks, whereas the lowest values were recorded in the alluvial deposits (Figure 7b).
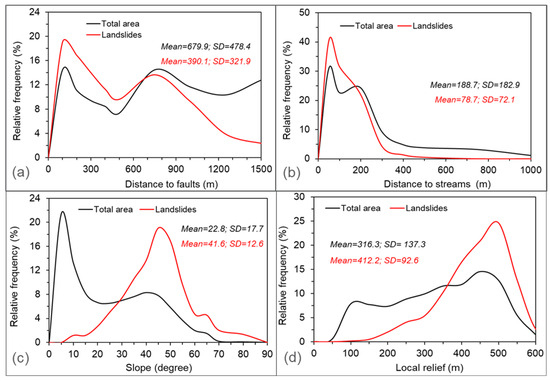
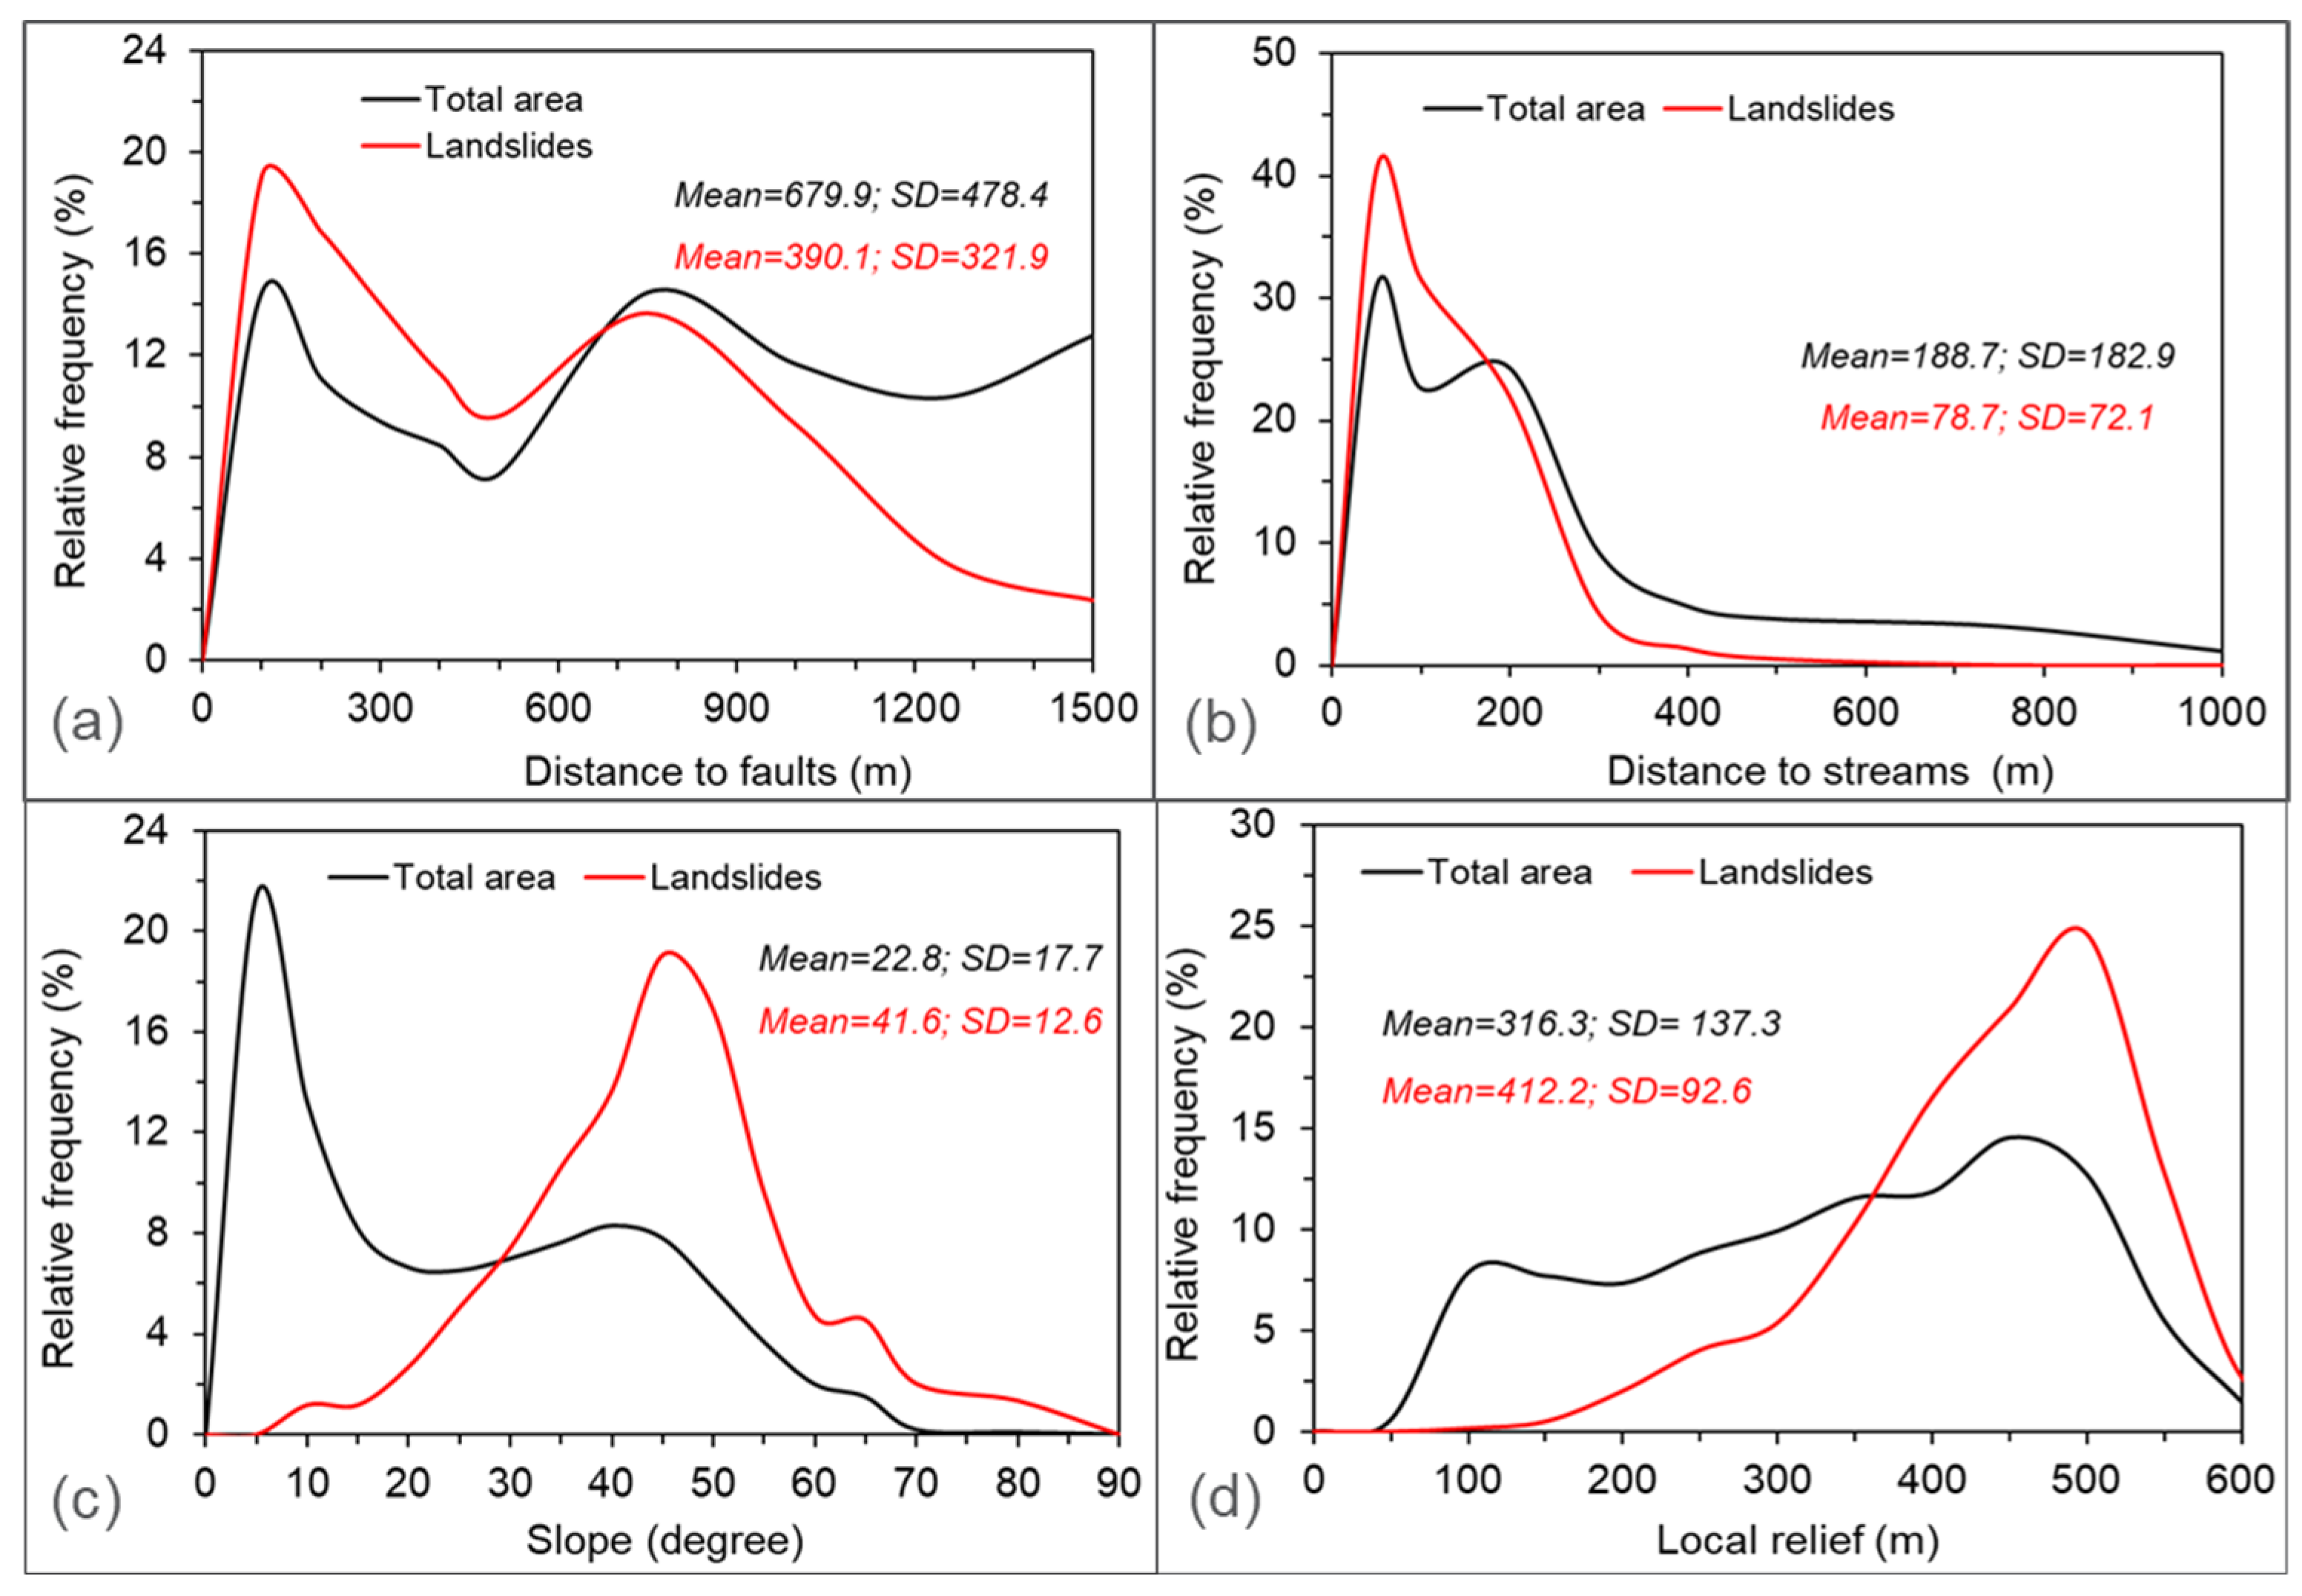
Tectonic structures directly or indirectly control several landslides, as fault presence and orientation strongly influence their distribution. Landslide frequency increases near fault zones, as shown by the comparison between the distance-to-faults map and the landslide inventory (Figure 8a). Approximately 70% of the mapped landslides are situated within a buffer zone 500 m from the faults. However, a high frequency of landslides was observed, especially between the fault distances of 0–100 and 100–300 m (Figure 3a). These results denote the significant role of the faults in landslide occurrence in the study area. Faults promote rock fracturing and deformation, create high local relief, and enhance fluvial undercutting, all of which favour slope failures. In some cases, landslides are also associated with s tectonic contacts between rock sequences of differing competence, where intense weathering further reduces material shear strength [31,37,38].
Figure 8.
Distribution of distance to faults (a), distance to streams (b), slope gradient (c), and local relief (d) for the entire study area and for the landslide areas.
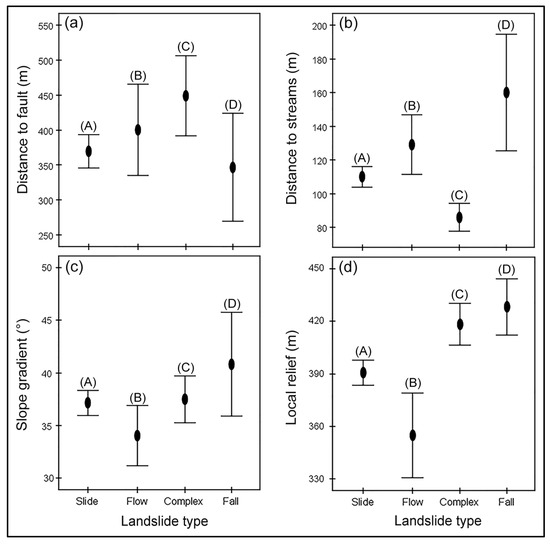
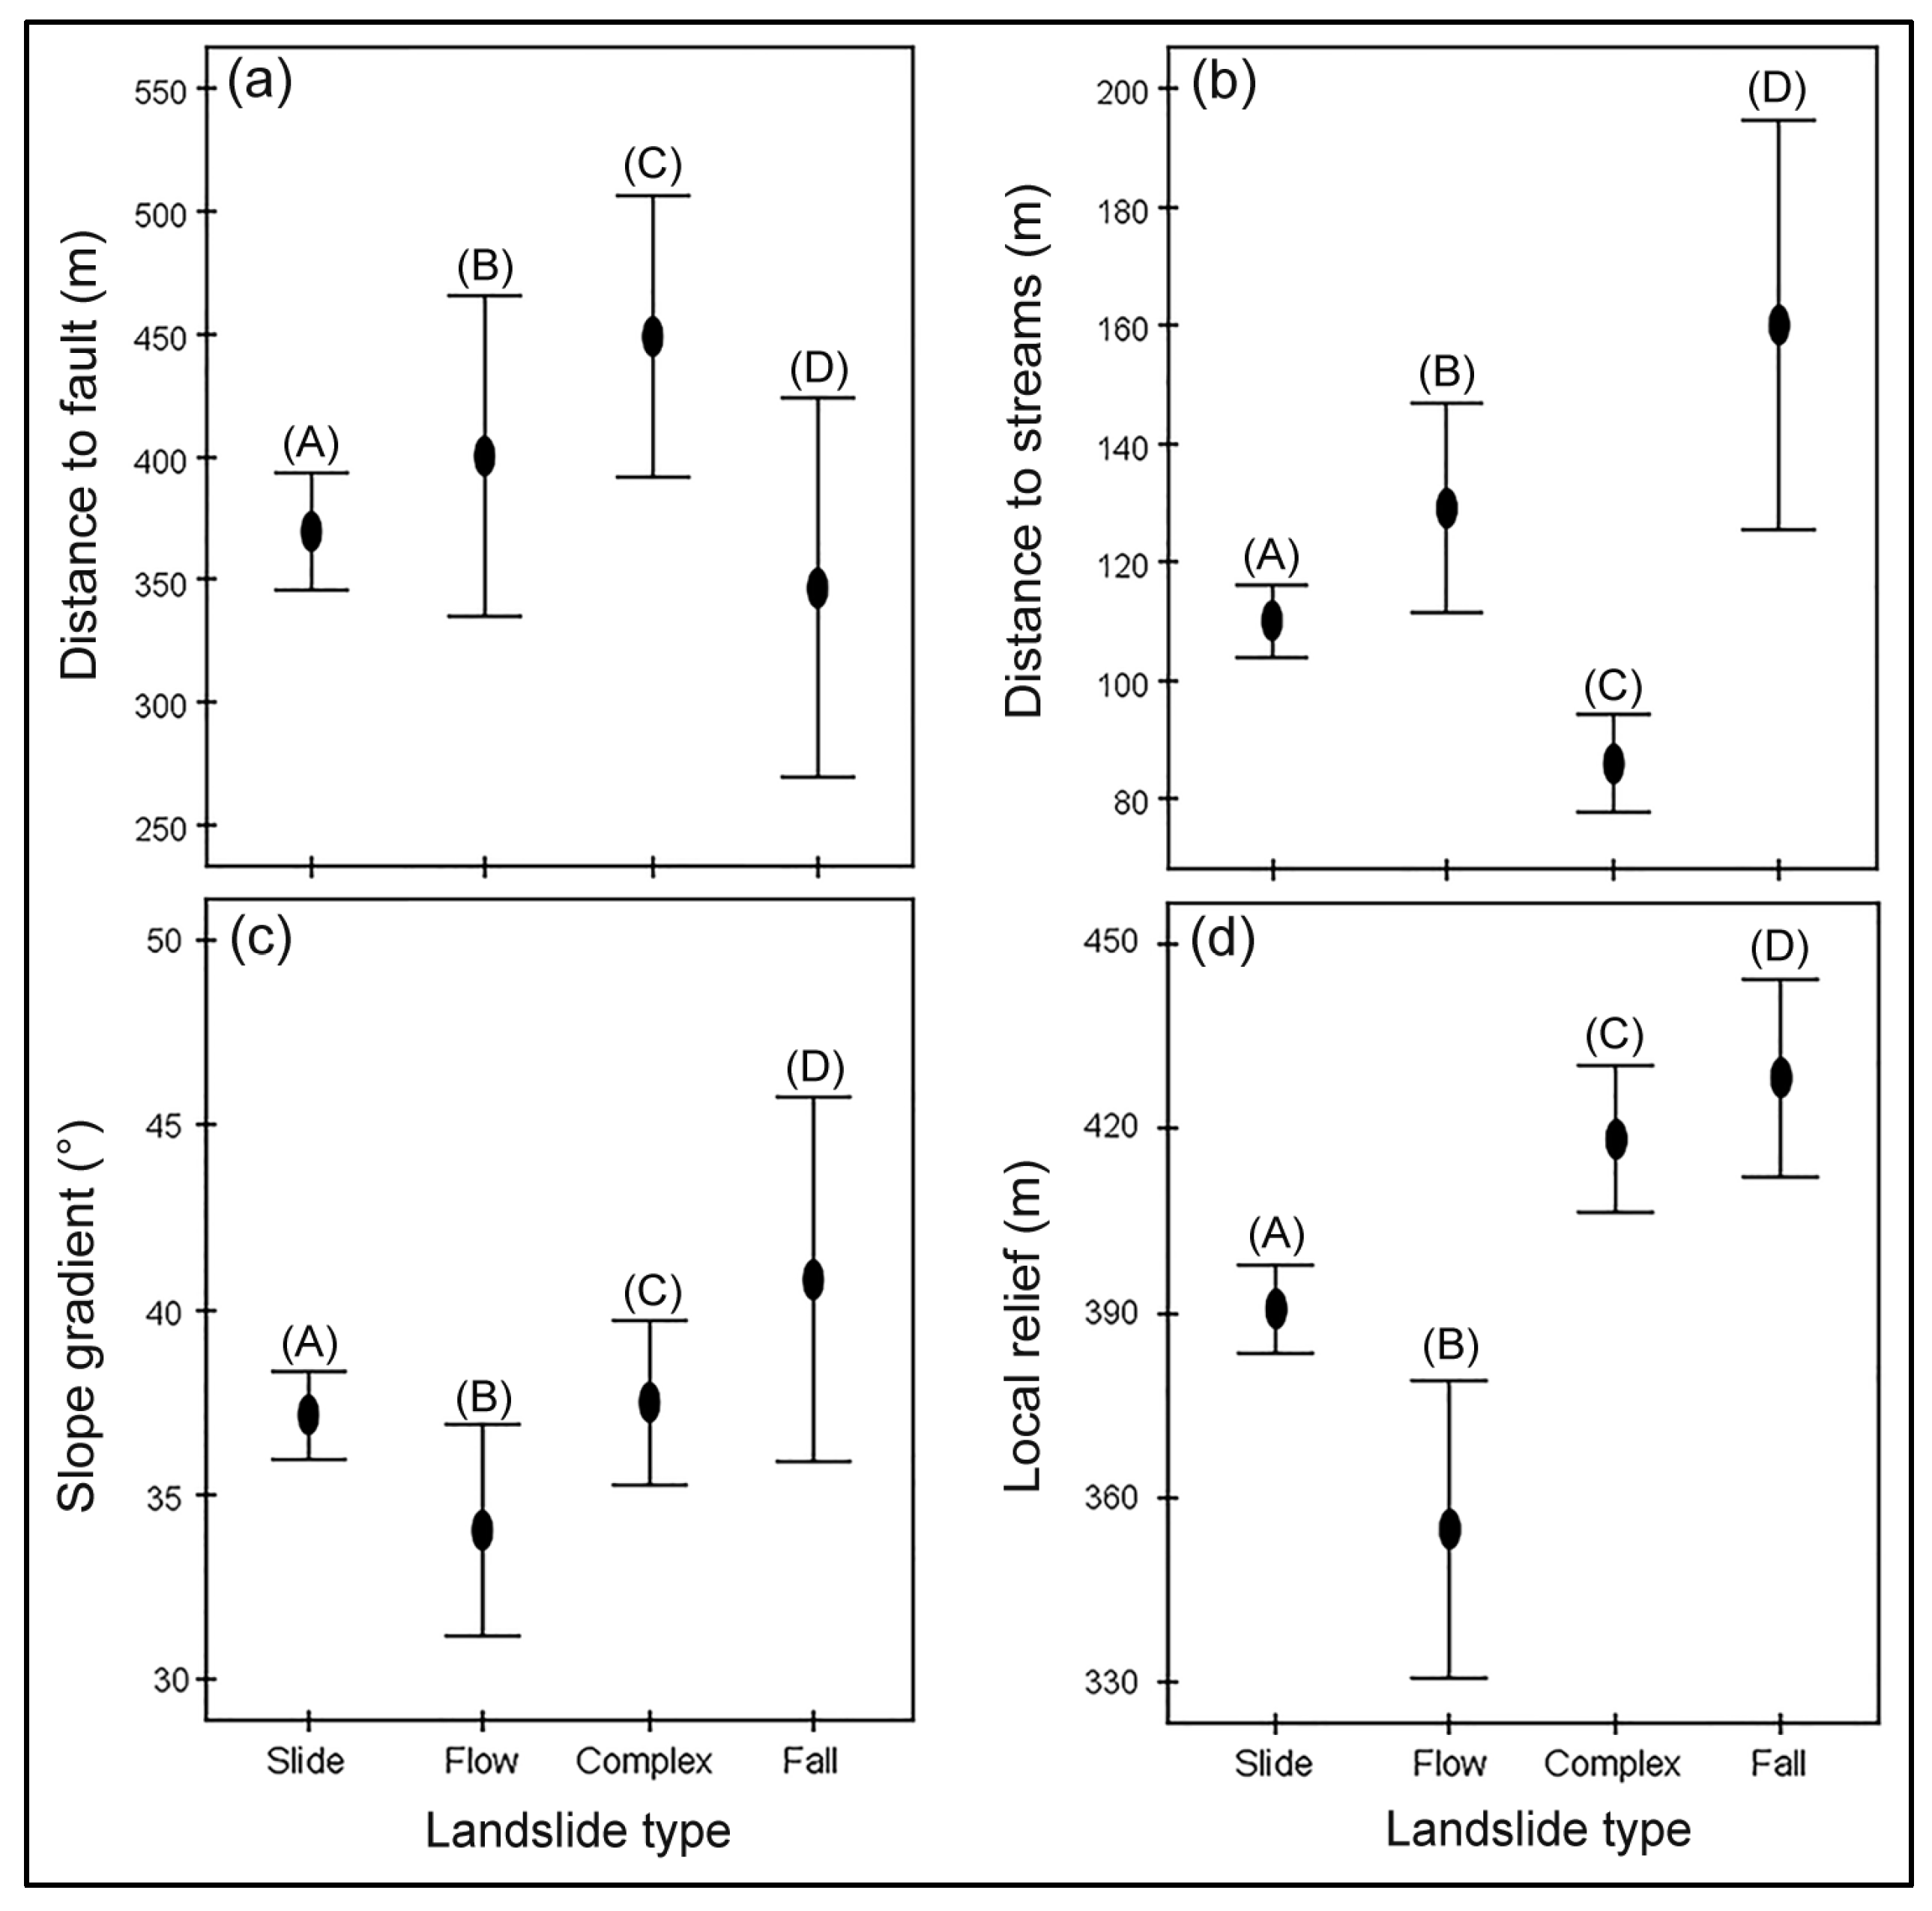
The non-parametric Mann–Whitney test revealed that the influence of distance to faults varied significantly (p < 0.05) among the different landslide typologies identified in the study area (Figure 9a). This statistical evidence indicates that faults exert a differentiated structural control on slope instability phenomena, with some landslide types occurring systematically closer to fault lines than others. In particular, the comparison of mean distances shows a clear and consistent trend (Figure 9a): complex landslides tend to occur at the greatest distances from mapped faults, followed by flow-type landslides, while slide-type failures show a closer spatial association. Falls exhibit the smallest mean distance to faults, suggesting that these rapid, gravity-driven processes are the most strongly influenced by the presence of brittle discontinuities and fault-related fracturing.
Figure 9.
Distribution of distance to faults (a), distance to streams (b), slope gradient (c), and local relief (d) across the different landslide types. Horizontal bars represent the standard error of the mean (black dots). Landslide types marked with different letters in brackets indicate statistically significant differences according to the analyzed geo-factors.
Figure 8b compares the landslide distribution with the distance-to-streams map. The analysis shows a clear spatial association between landslide occurrence and proximity to streams, with more than 90% of the mapped landslides located within the 0–300 m buffer zone. The trend of the curve (Figure 8b) indicates that landslide frequency generally decreases with increasing distance from the drainage network. This pattern suggests that landslides are predominantly concentrated along both sides of streams and within deeply incised valleys. Consequently, areas close to the drainage network are more susceptible to slope failures, as linear fluvial erosion plays a key role in destabilizing slopes and triggering landslides.
The spatial pattern also reveals that the highest landslide densities occur along lower-order channels and in sectors where streams incise into poorly consolidated or highly weathered materials. These geomorphic settings typically favour the development of steep valley flanks, which in turn promote slope instability. In contrast, flatter interfluves and areas located farther from the drainage network show significantly lower landslide occurrences.
The statistical analysis also showed that the distance to streams varied significantly among the different landslide types. This result is consistent with the spatial pattern previously illustrated in Figure 8b, where landslides were mainly concentrated within the first hundreds of metres from the drainage network. In line with this general distribution, the influence of stream proximity differed across landslide categories, decreasing according to the following sequence: fall > flow > slide > complex (Figure 9b).
Overall, the results confirm that proximity to streams is a key predisposing factor for landslide initiation in the study area, modulating both the frequency and typology of landslides.
By comparing the landslide inventory with the slope gradient map, as commonly reported in the literature [31,39,40], it emerges that landslide frequency gradually increases with slope steepness, reaching a peak at gradients of around 45°. Beyond this threshold, landslide occurrence generally decreases (Figure 8c). Notably, a higher frequency of landslides (>80%) is concentrated within the slope range of 250 to 55 degrees (Figure 8c). The mean values of slope gradient differ markedly between the whole study area and the areas affected by landslides (22.8° and 41.6°, respectively), indicating that landslides usually occur on moderately steep slopes (Figure 8c).
Moreover, the spatial distribution of the different landslide typologies with respect to slope gradient was also statistically distinct, showing a clear hierarchical relationship among the landslide types in relation to slope gradient, with the steepest slopes predominantly hosting falls, followed by complex landslides, then slides, and finally flows occurring on comparatively gentler gradients (Figure 9c). This pattern reflects the increasing lithological and structural control exerted on slopes as gradients become steeper, with falls being strongly favoured on highly inclined rock walls, whereas flow-type phenomena are more frequent on gentler, soil-mantled slopes.
Regarding local relief, hillslopes with landslides are mainly concentrated around local relief values that change between 350 m and 550 m (Figure 8d). Approximately 93% of landslides occur in areas where local relief exceeds 250 m, with the highest landslide frequency observed on slopes characterized by a local relief between 400 and 500 m. This pattern indicates that landslides preferentially develop in sectors characterized by pronounced topographic variability, where rugged and highly dissected landscapes enhance the gravitational forces acting on hillslopes. Figure 9d illustrates the mean local relief values associated with the four landslide movement types. A clear separation among the landslide typologies was again observed, with each category showing distinct mean local relief conditions. Local relief values were statistically higher for fall and complex landslides compared to the other movement types, indicating that these failures tend to occur in areas characterized by high morphological roughness and abrupt elevation changes [31,41].
3.3. Temporal Distribution of Landslide-Induced Road Damage
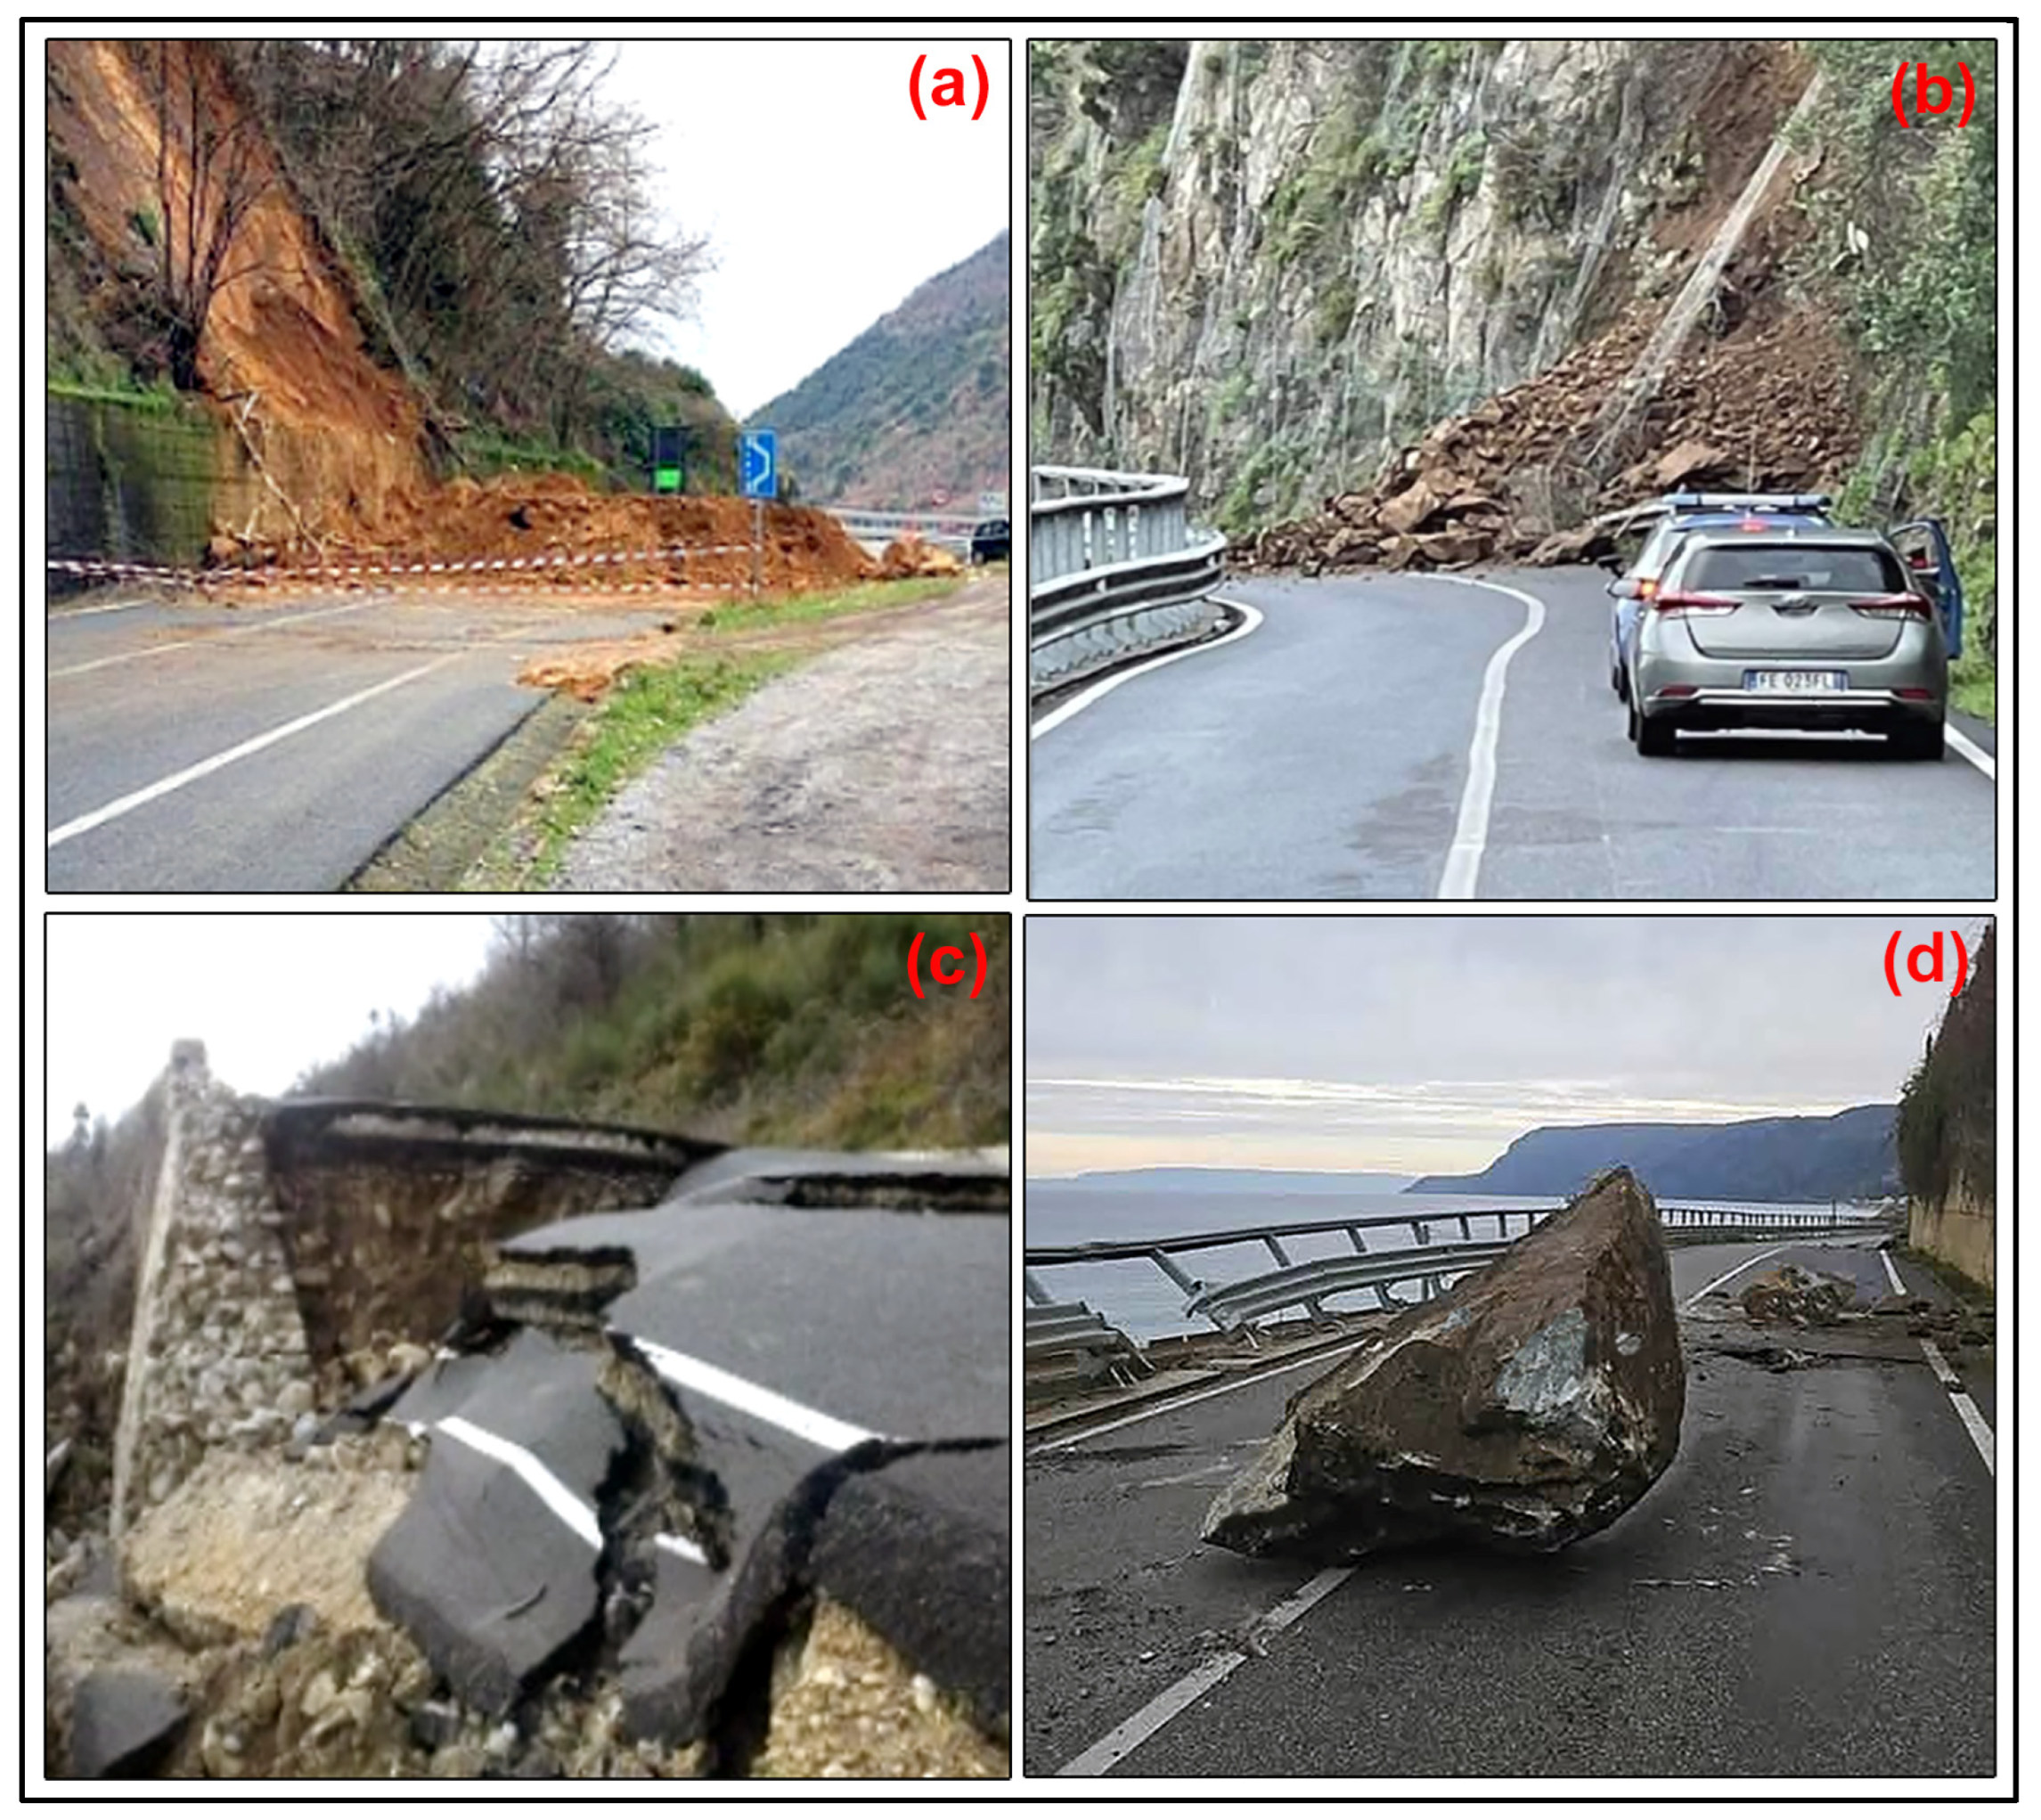
The historical database includes 237 records describing landslide events that damaged roads within the study area between 1950 and 2025, covering a period of 75 years, with an average frequency of 3.2 events per year. The majority of these affected the SS18 road and secondary the SP-SC roads (Figure 10 and Table 4).
Figure 10.
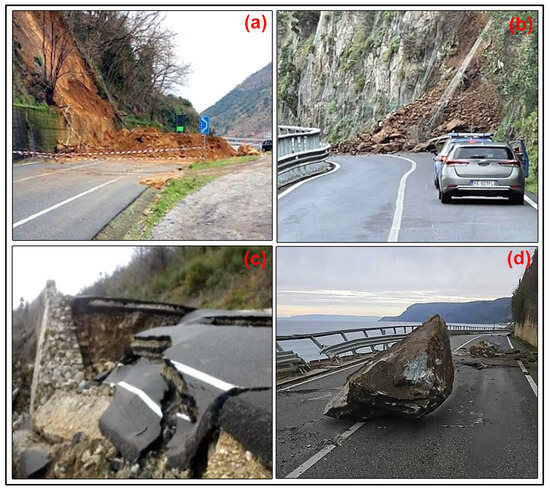
Photos of representative landslides affecting roads across the study area. (a) Earth slide blocking the entire carriageway of a section of the SP road; (b) rock-slide obstructing the SS18 road; (c) scarp of a complex landslide involving the SC road; (d) rock fall triggered on a steep slope and affecting the SS18 roadway.
Table 4.
Summary of landslides that damaged transportation network obtained by historical data analysis (1950–2024).
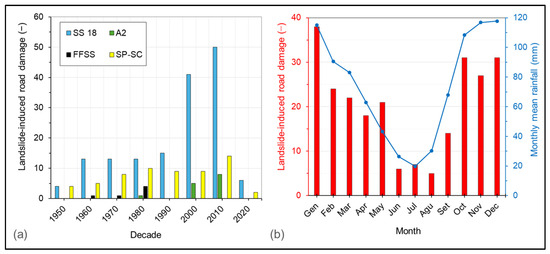
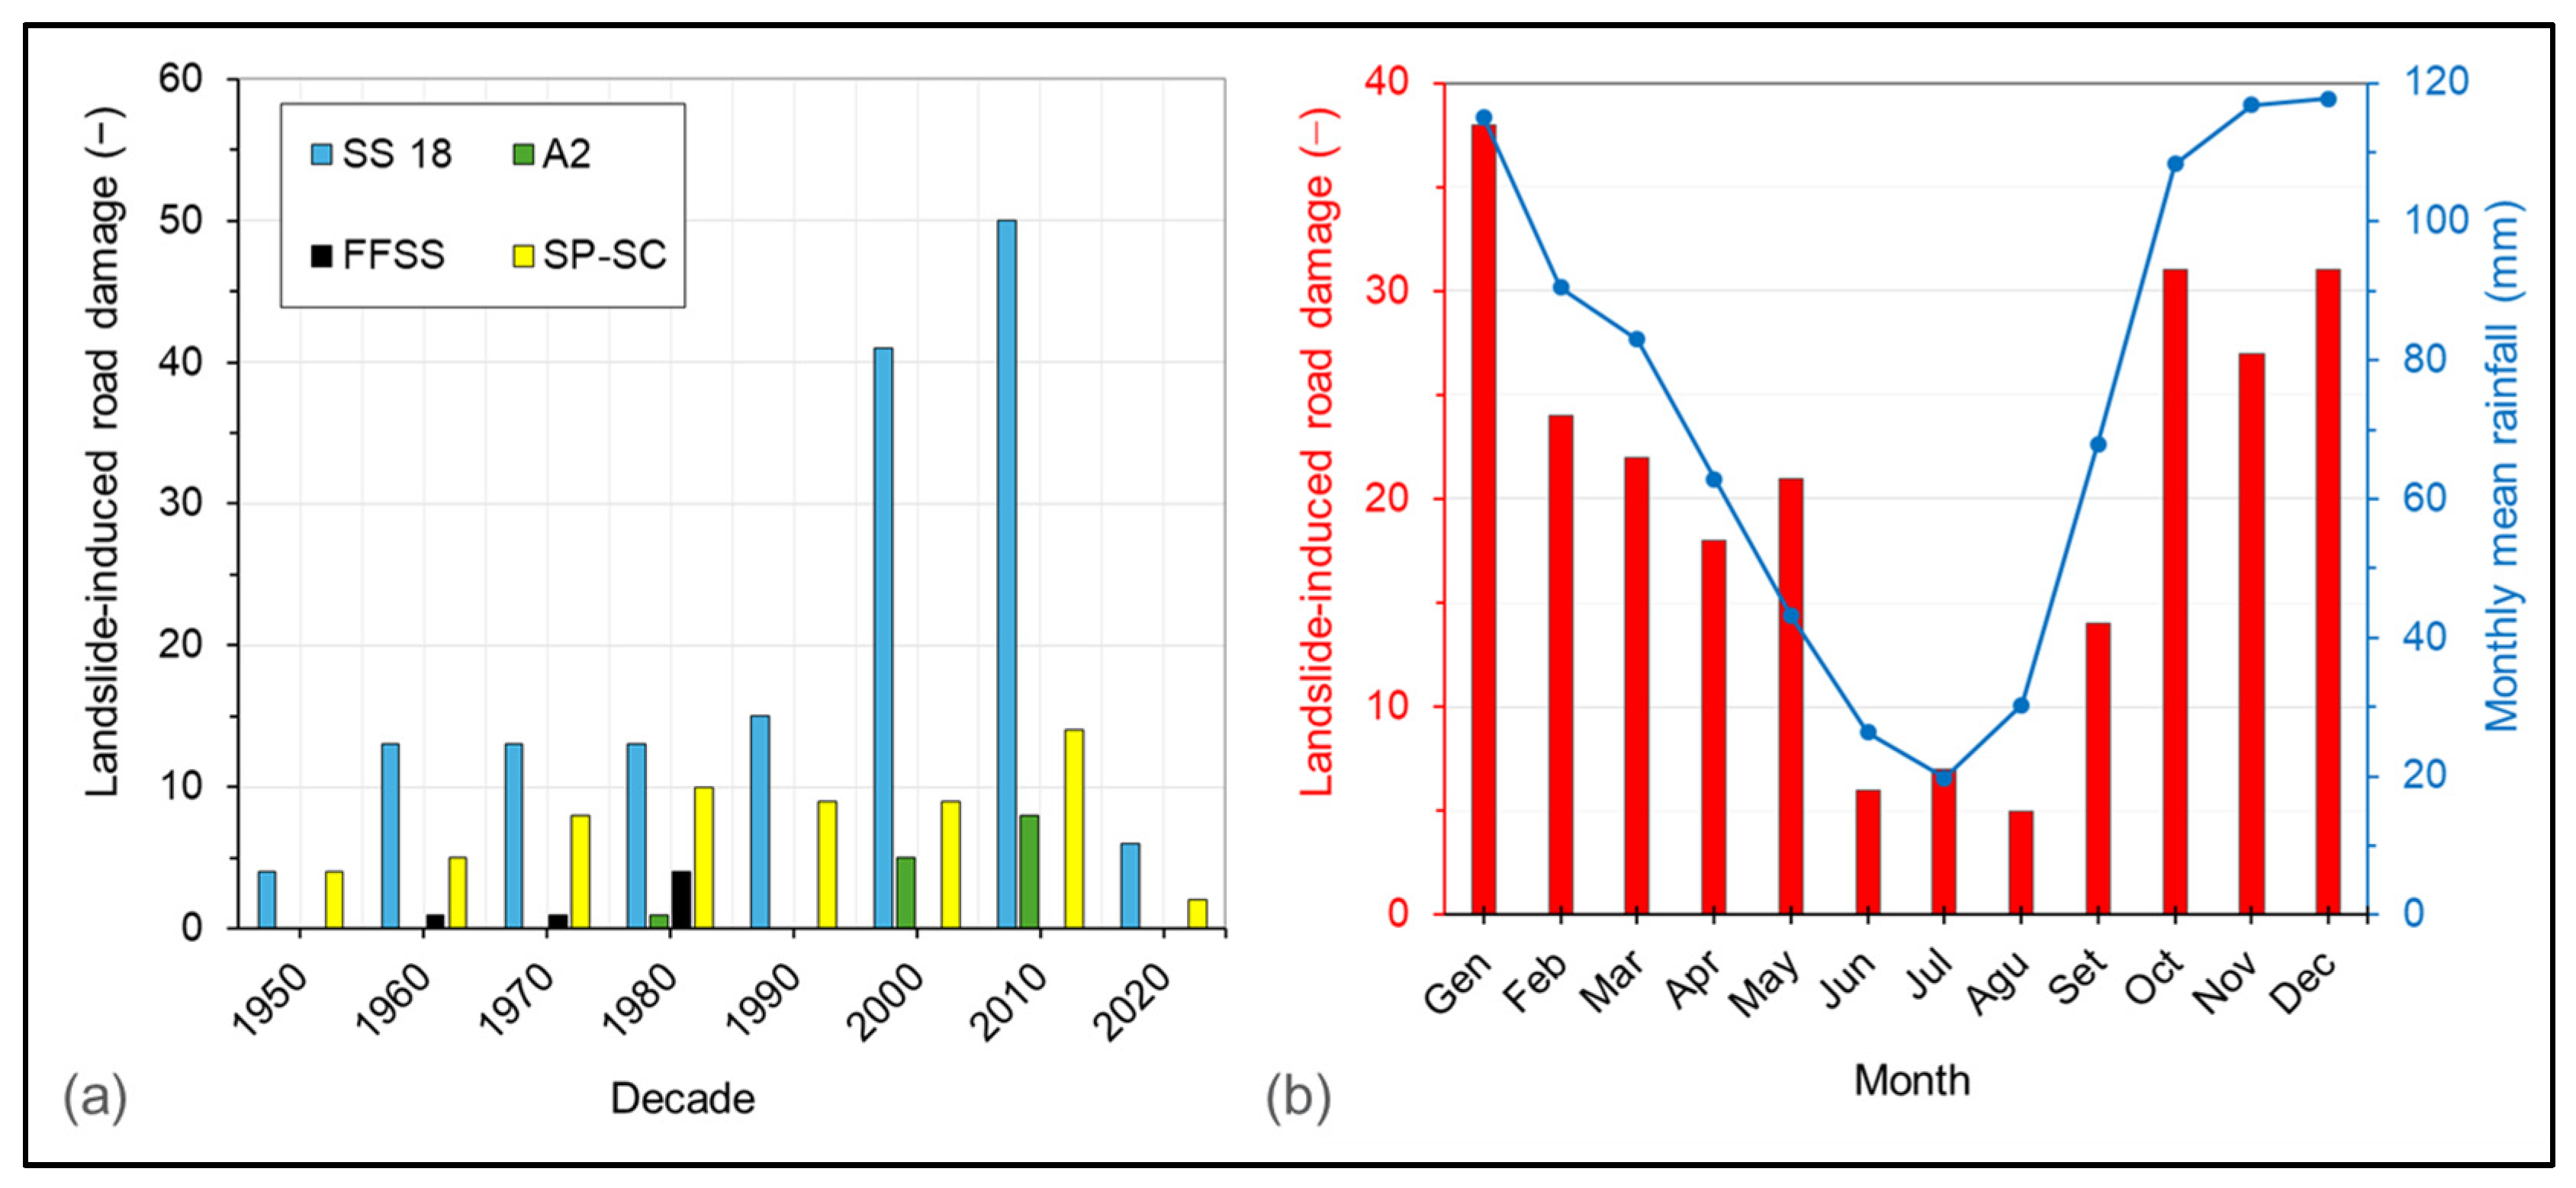
The distribution of landslide-induced road damage is not uniform over the period analyzed. The temporal distribution of records by decade and road type shows an increase in damaging events over the last three decades (Figure 11a). More specifically, between 2000 and 2025, a significant rise in the frequency of damaging landslide events can be observed, reaching up to approximately 5.4 landslide damage events per year. The increase in recent decades is likely related to the advent of the internet, which has expanded information availability and dissemination, as well as to greater awareness, increased exposure, and the effects of climate change.
Figure 11.
(a) Number of landslide-induced road damage per decade and road type; (b) monthly distribution of landslide-induced road damage and monthly mean rainfall that occurred from 1950 to 2025.
Comparison of landslide-induced road damage records with monthly rainfall data for the period 1950–2025 (Figure 11b) shows that 52.3% of landslide events occur between October and January, coinciding with the months of highest precipitation. In contrast, the driest period of the year (June–August) accounts for only 7.4% of recorded events.
Table 5 summarizes the results of the overlay between spatial intersection analysis between landslides and the transportation network. Overall, the study area includes 226.8 km of transportation infrastructure, of which 41.4 km (18.3%) are affected by landslides. Active landslides intersect 8.8 km (3.9%), whereas dormant landslides account for 32.6 km (14.4%).
Table 5.
Transportation networks affected by landslides.
Among the main infrastructures, the A2 highway exhibits the highest relative impact, with 10.5 km (4.6%) affected. The SS 18 state road is also significantly impacted, with 7.1 km (3.1%) overlapping landslides. The FFSS railway shows a lower total exposure (2.9 km, 1.3%), although landslide interference remains relevant for operational continuity. Provincial and municipal roads (SP–SC) represent the largest share of the network and account for the highest absolute affected length, with 20.9 km (9.2%) intersecting landslide areas.
Overall, the findings indicate that nearly one-fifth of the transportation infrastructure is located within landslide-prone zones, highlighting a widespread vulnerability across all network types.
The interruption of roads due to landslides can generate significant socio-economic impacts, as these infrastructures provide essential connections both within the municipal territory and between neighbouring settlements. Consequently, the interruption of traffic flows may hinder the mobility of residents, emergency services, and public transport; cause economic losses; and lead to the isolation of peripheral communities.
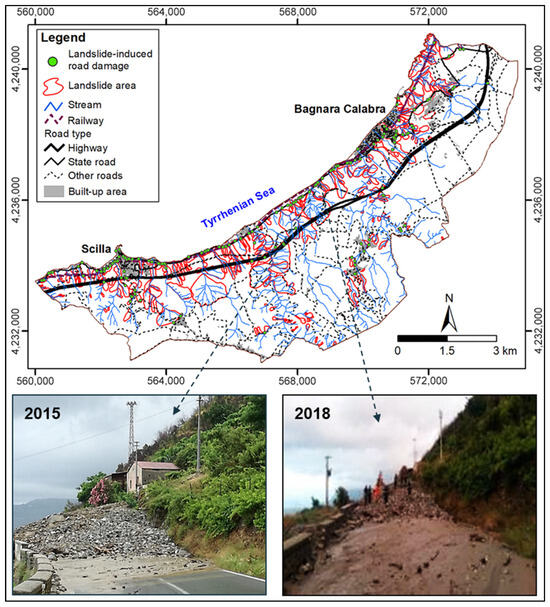
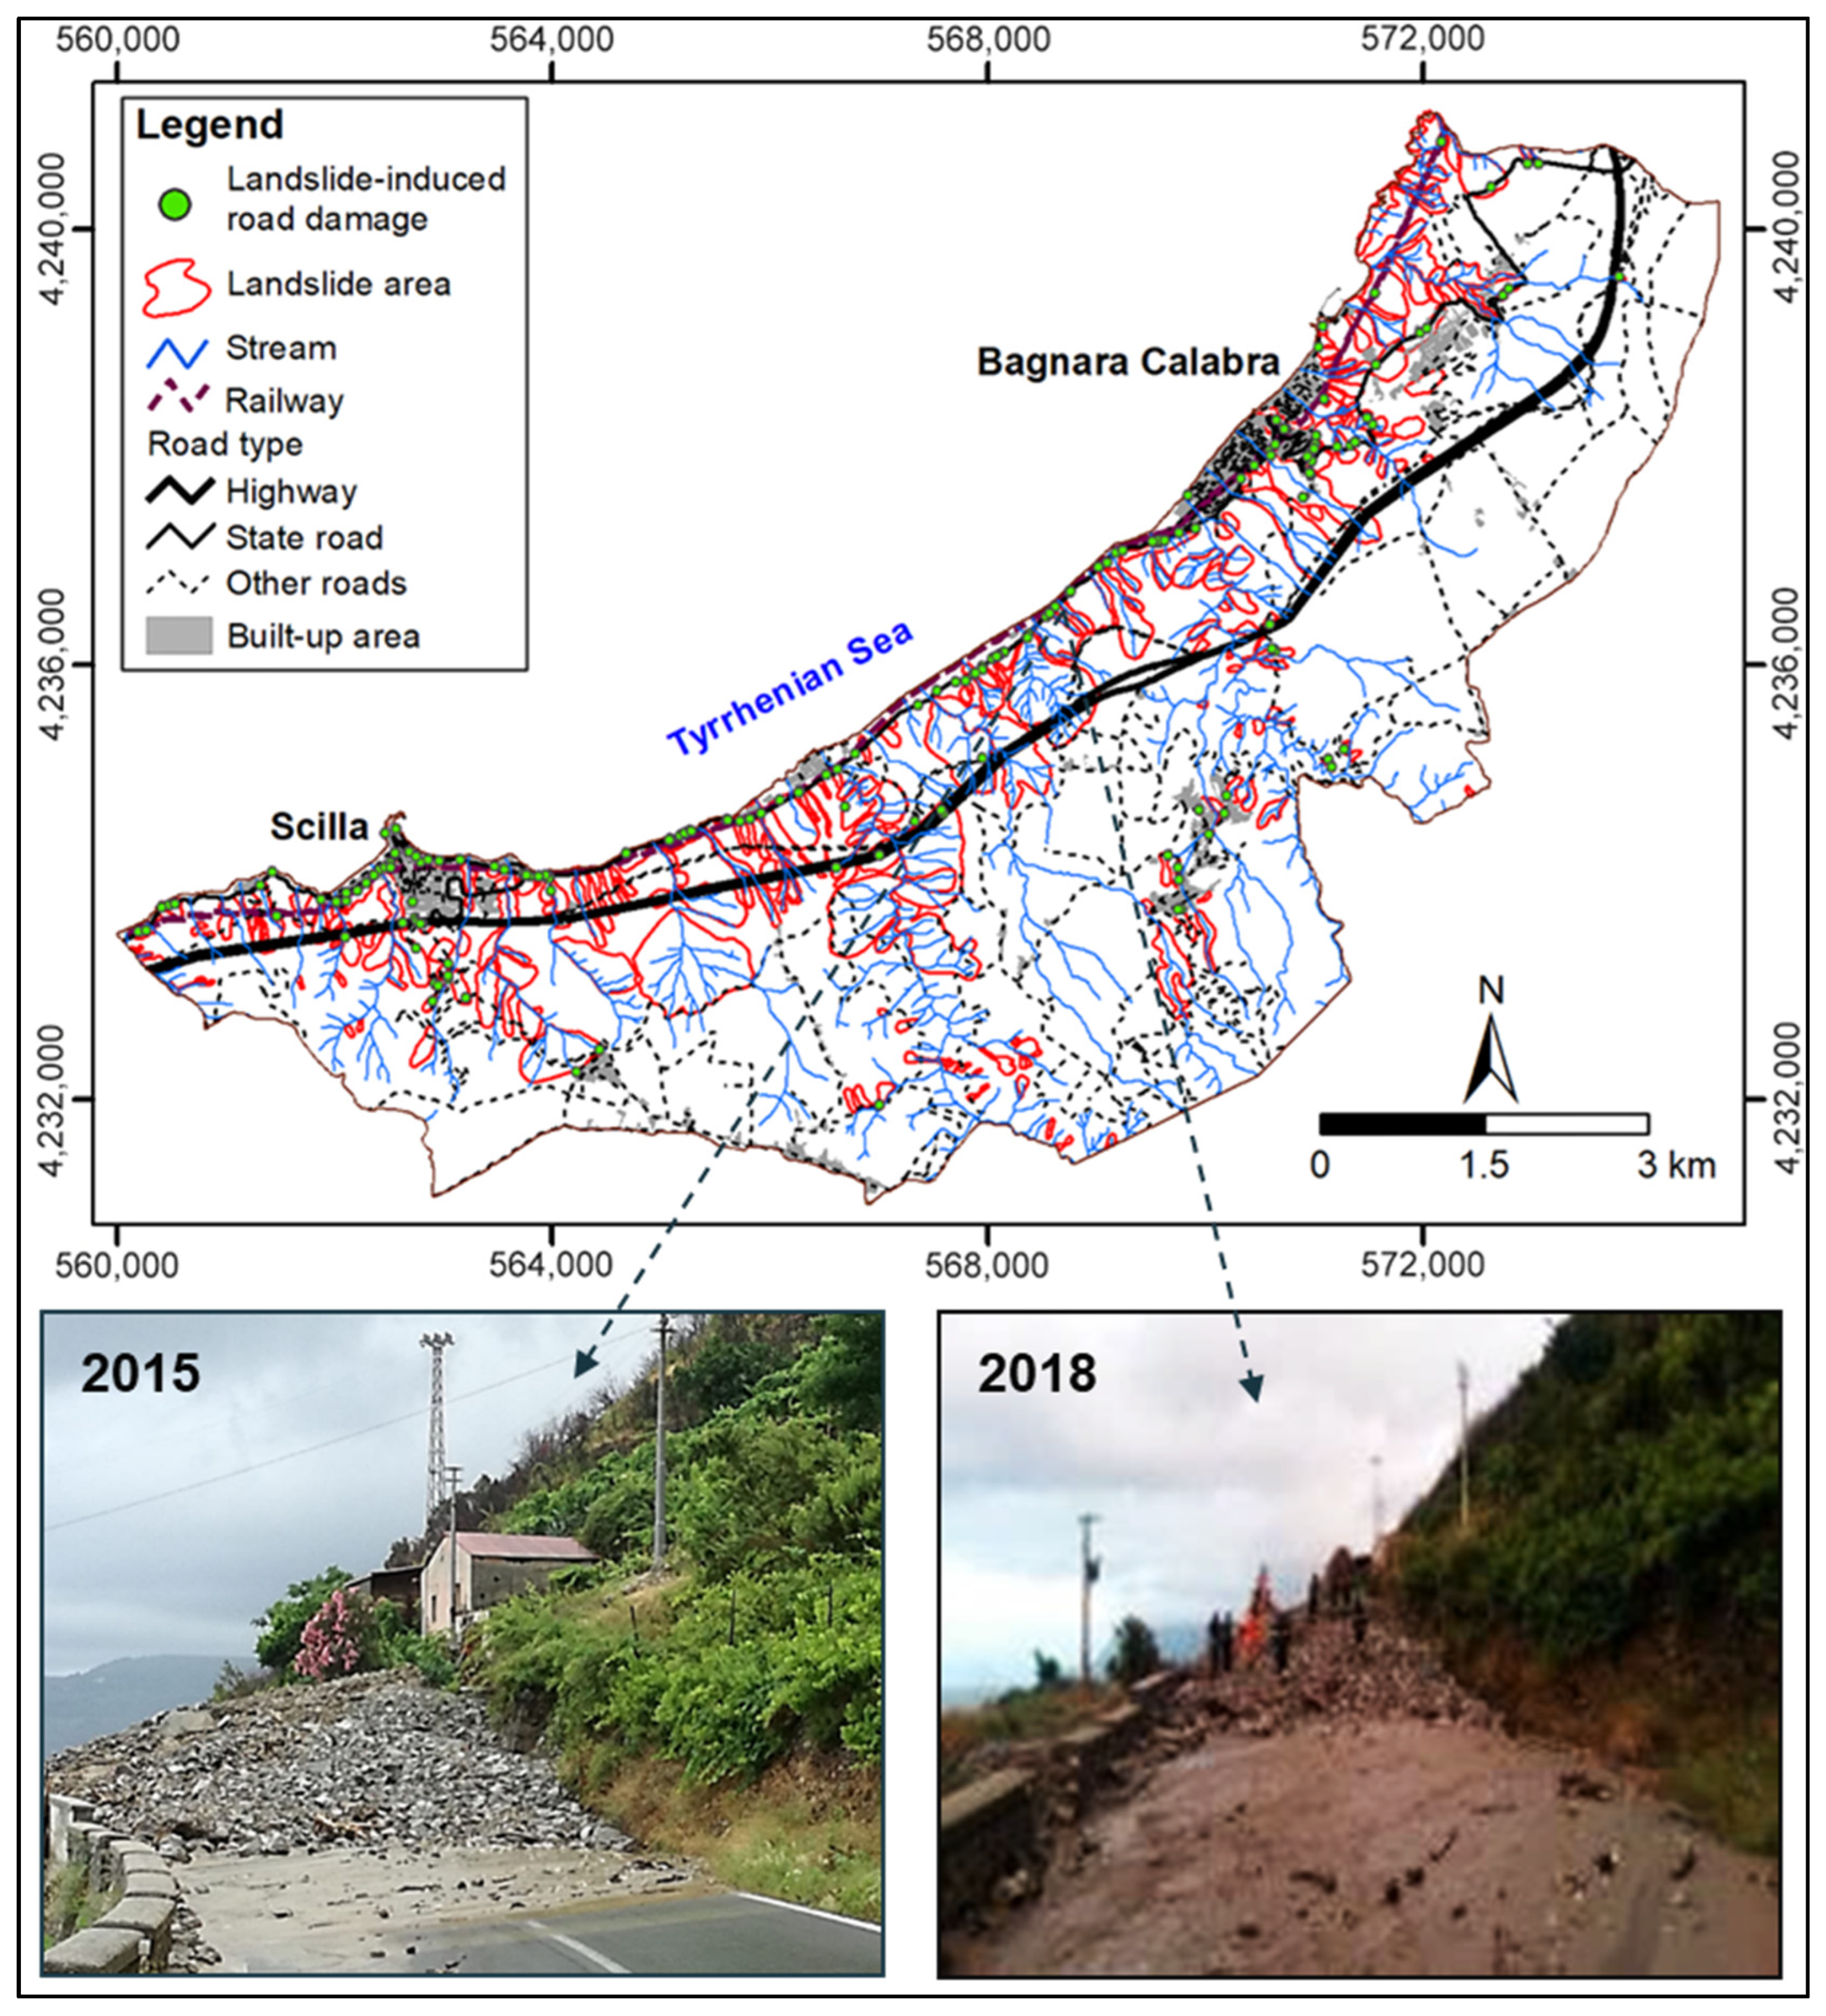
To better understand the relationship between road damage and slope instability, a spatial comparison was carried out between landslide-induced road damage events and the landslide inventory produced for the study area (Figure 12). The results highlight the strong correspondence between the recorded damage events and pre-existing mapped landslides. The analysis shows that, over the study period (1954–2025), a majority of road-related landslide damage occurred repeatedly at the same locations, indicating multiple reactivation phases of the same landslide phenomena. This recurrence pattern is typical of long-lived slope instabilities, where seasonal rainfall and local geological conditions can periodically reduce slope stability and trigger new failures.
Figure 12.
Comparison between the spatial distribution of landslide-induced road damage spanning 1955 to 2025 and the landslide inventory of the study area. The map highlights multiple damage events occurring at the same locations, indicating recurrent reactivations of pre-existing landslides. The example from the SS18 Scilla–Bagnara road sector shows two documented reactivation phases (2015 and 2018), illustrated in the photographs.
A representative example was found along the SS18 Scilla–Bagnara road sector, where a documented landslide experienced at least two distinct reactivation phases, with events recorded in 2015 and 2018. The photographs in Figure 12 clearly illustrate these reactivation episodes, showing both the spatial consistency of the affected road segment and the morphological evolution of the landslide body over time.
These observations confirm that a significant portion of the recorded road damage is associated with the repeated mobilization of pre-existing landslides rather than with new slope failures.
4. Discussion
This study aims to demonstrate the validity of an integrated methodological approach that combines geomorphological analysis, historical documentation, and GIS-based data processing to reconstruct and understand landslide occurrences along the road network of the Costa Viola, in the southwestern Calabria region.
The detailed landslide inventory map produced in the present study shows that about 19% of the study area is affected by landslides (Table 2). The results confirm that this sector of Calabria is particularly prone to landslides of various types and sizes due to its rugged relief, narrow river valleys, and complex geological setting [25]. In some cases, slope cuts for road construction have further exacerbated slope instability [10,42]. A marked clustering of landslides occurs in the north-western sector of the study area, characterized by steep slopes—such as fault scarps, sea cliffs, and stream valleys—mainly composed of highly fractured and weathered gneissic and granitic rocks. Similar spatial patterns have been observed in other studies in Calabria and Sicily [24,25,37,41,43,44,45].
Slides represent the dominant movement type (66.7%), followed by complex landslides (17.6%), flows (11.9%), and falls (3.8%). The predominance of slide-type landslides agrees with studies in fractured crystalline rocks of Calabria, where rotational and translational slides dominate due to weathered bedrock and structural discontinuities [46,47].
The integration of multi-temporal datasets demonstrated that many active landslides correspond to reactivations, highlighting the importance of antecedent conditions, structural discontinuities, and hydrological forcing [37,48,49,50]. Reactivation processes are particularly significant in anthropogenically modified slopes, such as those affected by road cuts, where mechanical disequilibrium and drainage modification may reduce slope stability [42,51,52,53].
The landslide size distribution is characterized by strong spatial heterogeneity and a clear predominance of medium-sized phenomena (10,000–20,000 m2), which account for about 61% of the total. The cumulative area–frequency distribution shows a marked decrease in the occurrence of landslides larger than 100,000 m2. This inverse relationship between frequency and size aligns with the power-law distribution typically reported in landslide inventories from various parts of the world [33,36,40,54,55,56,57].
The statistically significant variation in landslide size across different movement types further corroborates the geomorphological interpretation. Complex landslides exhibit the largest mean areas, reflecting their composite nature and progressive downslope evolution, whereas flow- and fall-type events typically involve smaller source areas but may travel considerable distances and can often be more destructive [41,58,59,60].
Moreover, the findings suggest that landslide distribution in the study area is controlled by a combination of geo-environmental factors. Lithology exerts a clear influence: about 80% of landslides occur in highly fractured granitic and gneissic rocks, confirming observations by Conforti and Ietto [31] on weathered crystalline slopes in Calabria. Proximity to faults and streams further enhances instability, as tectonic fracturing and fluvial incision reduce slope resistance—patterns widely documented in structurally controlled mountainous areas [37,39,45,46,50,51]. The concentration of landslides within 300 m of streams and near fault zones highlights the combined role of structural weakening and erosional undercutting. Slope gradient and local relief also show strong correlations with landslide occurrence, with most events concentrated on moderately steep slopes (~25–55°), like findings from studies across Italy and the Mediterranean basin [31,47,54].
The historical database indicates an increase in landslide-induced road damage since 2000, consistent with trends reported in other studies [6,12,20,21,26,34] where improved reporting, increased infrastructure exposure, and more frequent extreme rainfall events contribute to higher recorded impacts. The strong spatial correspondence between damage records and mapped landslides confirms that repeated reactivation of pre-existing landslides is the main cause of road disruption [6,37,41]. The seasonal concentration of events between October and January matches the rainfall regime of southern Italy and aligns with studies linking landslide occurrence to intense autumn–winter precipitation [26,59,60,61].
A clarification is needed regarding historical data: full validation of historical landslide records is generally not feasible, as it would require independent datasets that are rarely available. Historical sources are typically sufficient only to reconstruct the catalogue itself, making formal validation through independent records unrealistic. Although independent inventories or landslide maps may exist for recent years, these datasets are not directly comparable with documentary sources. Landslide maps provide a snapshot of slope conditions at the time of mapping, whereas documentary sources allow the reconstruction of the timing of occurrence or reactivation. Consequently, the two types of information cannot be directly used to assess catalogue completeness.
The catalogue can therefore be considered reasonably complete with regard to damaging landslides, while events that did not cause damage likely remained unreported. However, the road network represents a key anthropogenic element of the landscape, and damage affecting it is rarely overlooked. For this reason, landslides impacting infrastructure are expected to be well represented in the catalogue.
A temporal bias should be acknowledged when interpreting the increase in recorded events after 2000. This trend likely reflects not only a real rise in hazard occurrence but also a substantial improvement in data availability and accessibility. In particular, the proliferation of digital archives, online newspapers, and web-based news sources has significantly enhanced the detectability and documentation of events in recent decades compared to earlier periods, which relied mainly on incomplete or less systematically archived historical records.
Despite variations in historical data availability, the data clearly indicate that, in the study area, the landslides remain a persistent issue affecting the road network, particularly the SS18, along with provincial (SP) and municipal (SC) roads.
These findings indicate that historical research provides an essential framework for reconstructing the spatiotemporal dynamics of landslides and for delineating the magnitude and distribution of the associated damage [60]. Overall, the results obtained can support emergency planning by supplying in-depth knowledge of critical points that should be monitored during intense rainfall events. Moreover, the combination of a long-term historical landslide database with the landslide inventory map can be highly useful for developing landslide prediction models.
The detailed work of compiling chronologically and geographically referenced landslide data represents a fundamental preliminary step toward subsequent analyses aimed at identifying triggering thresholds. The dataset developed in this study, designed to be as complete and well-characterized as possible, provides a robust foundation for future research focused on the definition and validation of such thresholds.
5. Conclusions
This study provides an integrated assessment of rainfall-induced landslides affecting the transportation network of the Costa Viola (southwestern Calabria, Italy), combining geomorphological mapping, multi-temporal analyses, historical documentation, and GIS-based spatial processing. The results indicate that the area is highly prone to slope instability, with approximately 19% of its surface impacted by 261 mapped landslides of different types and sizes. Landslides preferentially cluster in sectors characterized by steep slopes, narrow valleys, and highly fractured crystalline rocks, confirming the dominant role of geological structure, lithology, and morphometric controls.
Slides represent the most widespread movement type, followed by complex landslides, flows, and falls. Statistically significant differences among movement types were identified, particularly in their size and morphometric settings. More than 70% of landslides occur within 500 m of fault zones, and over 90% lie within 300 m of streams, highlighting the coupled influence of tectonic fracturing and fluvial incision in lowering slope stability. Slope gradient and local relief further modulate landslide occurrence, with most failures concentrated on moderately steep slopes (25–55°) and areas characterized by pronounced topographic variability.
The integration of multi-temporal investigations and historical records shows that a large proportion of active landslides corresponded to the reactivation of pre-existing dormant phenomena. This finding is particularly relevant for the road network, where repeated damage occurred at the same locations over the last 75 years. The temporal distribution of damaging events reveals a marked increase since the early 2000s, likely related to improved reporting, greater infrastructure exposure, and more frequent episodes of intense rainfall. The seasonal concentration of landslides between October and January underscores the critical role of autumn–winter precipitation in triggering slope instabilities.
The intersection analysis between landslide inventory and transportation network layer shows that 41.4 km of transportation infrastructure (18.3% of the total network) overlap with mapped landslides, with the A2 highway exhibiting the highest relative impact and provincial–municipal roads accounting for the largest absolute length of affected segments.
Overall, the results confirm that the Costa Viola is structurally predisposed to landslides and that climatic forcing and anthropogenic modifications—particularly road cuts—further exacerbate instability. The combined landslide inventory and historical database represent essential tools for identifying critical sectors of the road network, supporting monitoring strategies, and guiding emergency response during severe rainfall events. These datasets also provide a robust foundation for the development of predictive models and future susceptibility and hazard assessments, contributing to more effective risk mitigation and infrastructure planning in the region.
Author Contributions
Conceptualization, M.C. and O.P.; methodology, M.C. and O.P.; investigation, M.C. and O.P.; formal analysis, M.C. and O.P.; data curation, M.C.; writing—original draft preparation, M.C. and O.P.; writing—review and editing, M.C. and O.P.; visualization, M.C. All authors have read and agreed to the published version of the manuscript.
Funding
The research has been supported by the CNR-IRPI internal projects: IPER—Increase People Resilience to Damaging Hydrogeological Events in Calabria (DTA.AD003.805.001), and the project Next Generation EU—Italian NRRP, Mission 4, Component 2, Investment 1.5, call for the creation and strengthening of ‘Innovation Ecosystems’, building ‘Territorial R&D Leaders’ (Directorial Decree n. 2021/3277)—project Tech4You—Technologies for climate change adaptation and quality of life improvement, n. ECS0000009 (CUP: B83C22003980006). This work reflects only the authors’ views and opinions; neither the Ministry for University and Research nor the European Commission can be considered responsible for them.
Data Availability Statement
The original contributions presented in this study are included in the article. Further inquiries can be directed to the corresponding author.
Conflicts of Interest
The authors declare no conflicts of interest.
References
- Wang, X.; Wang, Y.; Lin, Q.; Yang, X. Assessing Global Landslide Casualty Risk Under Moderate Climate Change Based on Multiple GCM Projections. Int. J. Disaster Risk Sci. 2023, 14, 751–767. [Google Scholar] [CrossRef] [Scilit]
- Ietto, F.; Conforti, M.; Tolomei, C.; Cianflone, G. Village relocation as solution of the landslide risk, is it always the right choice? The case study of Cavallerizzo ghost village (Calabria, southern Italy). Int. J. Disaster Risk Reduct. 2022, 81, 103267. [Google Scholar] [CrossRef] [Scilit]
- Froude, M.J.; Petley, D.N. Global fatal landslide occurrence from 2004 to 2016. Nat. Hazards Earth Syst. Sci. 2018, 18, 2161–2181. [Google Scholar] [CrossRef] [Scilit]
- Guzzetti, F.; Mondini, A.C.; Cardinali, M.; Fiorucci, F.; Santangelo, M.; Chang, K.-T. Landslide inventory maps: New tools for an old problem. Earth-Sci. Rev. 2012, 112, 42–66. [Google Scholar] [CrossRef] [Scilit]
- Gariano, S.L.; Guzzetti, F. Landslides in a changing climate. Earth-Sci. Rev. 2016, 162, 227–252. [Google Scholar] [CrossRef] [Scilit]
- Petrucci, O.; Scarcella, G.E.; Conforti, M. Multi-level data analyses for characterizing rainfall-induced landslide scenarios: The example of Catanzaro municipality (South Italy). Water 2023, 15, 2437. [Google Scholar] [CrossRef] [Scilit]
- Fidan, S.; Tanyaş, H.; Akbaş, A.; Lombardo, L.; Petley, D.N.; Görüm, T. Understanding fatal landslides at global scales: A summary of topographic, climatic, and anthropogenic perspectives. Nat. Hazards 2024, 120, 6437–6455. [Google Scholar] [CrossRef] [Scilit]
- Zhang, Y.; Wang, X.; Liu, Z. How is the occurrence of rainfall-triggered landslides related to extreme rainfall? Geomorphology 2025, 475, 109666. [Google Scholar] [CrossRef] [Scilit]
- Wood, N.; Jones, J. Variations in Road Exposure and Traffic Volumes in the United States in Areas Susceptible to Landslides. Int. J. Disaster Risk Reduct. 2025, 124, 105567. [Google Scholar] [CrossRef] [Scilit]
- Conforti, M.; Rago, V.; Muto, F.; Versace, P. GIS-based statistical analysis for assessing shallow-landslide susceptibility along the highway in Calabria (southern Italy). Rend. Online Soc. Geol. Ital. 2016, 39, 155–158. [Google Scholar] [CrossRef] [Scilit]
- Donnini, M.; Napolitano, E.; Salvati, P.; Ardizzone, F.; Bucci, F.; Fiorucci, F.; Santangelo, M.; Cardinali, M.; Guzzetti, F. Impact of event landslides on road networks: A statistical analysis of two Italian case studies. Landslides 2017, 14, 1521–1535. [Google Scholar] [CrossRef] [Scilit]
- Klose, M.; Maurischat, P.; Damm, B. Landslide impacts in Germany: A historical and socioeconomic perspective. Landslides 2016, 13, 183–199. [Google Scholar] [CrossRef] [Scilit]
- Pescaroli, G.; Alexander, D. Critical Infrastructure, Panarchies and the Vulnerability Paths of Cascading Disasters. Nat. Hazards 2016, 82, 175–192. [Google Scholar] [CrossRef] [Scilit]
- Ziccarelli, M. Interference of Shallow Landslides in Over consolidated Clays on the Functionality of an Important Internal Road Infrastructure. Geosciences 2025, 15, 209. [Google Scholar] [CrossRef] [Scilit]
- Wendim, S.; Mebrahtu, G.; Woldearegay, K. GIS-Based Landslide Susceptibility Mapping Using Analytical Hierarchy Process Method along Gedo-Dilb Asphalt Road Section, Northern Ethiopia. Bull. Eng. Geol. Environ. 2025, 84, 440. [Google Scholar] [CrossRef] [Scilit]
- Turoğlu, H.; Duran, A. The Impact of Coastal Road Construction on Kıyıcık Landslide (Artvin, Türkiye) in December 2024. Anthr. Coasts 2025, 8, 35. [Google Scholar] [CrossRef] [Scilit]
- Wu, C.; Zhang, J.; Yang, C.; Lu, D. Probabilistic Assessment of a Road Network Subjected to Rainfall-Induced Landslides. Reliab. Eng. Syst. Saf. 2025, 264, 111409. [Google Scholar] [CrossRef] [Scilit]
- Nappo, N.; Peduto, D.; Mavrouli, O.; van Westen, C.J.; Gullà, G. Slow-Moving Landslides Interacting with the Road Network: Analysis of Damage Using Ancillary Data, in Situ Surveys and Multi-Source Monitoring Data. Eng. Geol. 2019, 260, 105244. [Google Scholar] [CrossRef] [Scilit]
- Calvello, M.; Pecoraro, G. FraneItalia: A Catalog of Recent Italian Landslides. Geoenviron. Disasters 2018, 5, 13. [Google Scholar] [CrossRef] [Scilit]
- Piacentini, D.; Troiani, F.; Daniele, G.; Pizziolo, M. Historical Geospatial Database for Landslide Analysis: The Catalogue of Landslide Occurrences in the Emilia-Romagna Region (CLOCkER). Landslides 2018, 15, 811–822. [Google Scholar] [CrossRef] [Scilit]
- Esposito, G.; Matano, F. A geodatabase of historical landslide events occurring in the highly urbanized volcanic area of Campi Flegrei, Italy. Earth Syst. Sci. Data 2023, 15, 1133–1149. [Google Scholar] [CrossRef] [Scilit]
- Tortorici, L.; Monaco, C.; Tansi, C.; Cocina, O. Recent and Active Tectonics in the Calabrian Arc (Southern Italy). Tectonophysics 1995, 243, 37–55. [Google Scholar] [CrossRef] [Scilit]
- Ferranti, L.; Monaco, C.; Morelli, D.; Antonioli, F.; Maschio, L. Holocene Activity of the Scilla Fault, Southern Calabria: Insights from Coastal Morphological and Structural Investigations. Tectonophysics 2008, 453, 74–93. [Google Scholar] [CrossRef] [Scilit]
- Bonavina, M.; Bozzano, F.; Martino, S.; Pellegrino, A.; Prestininzi, A.; Scandurra, R. Le colate di fango e detrito lungo il versante costiero tra Bagnara Calabra e Scilla (Reggio Calabria): Valutazioni di suscettibilità. G. Geol. Appl. 2005, 2, 65–74. [Google Scholar]
- Iovine, G.; Greco, R.; Gariano, S.L.; Pellegrino, A.D.; Terranova, O.G. Shallow-landslide susceptibility in the Costa Viola Mountain ridge (southern Calabria, Italy) with considerations on the role of causal factors. Nat. Hazards 2014, 73, 111–136. [Google Scholar] [CrossRef] [Scilit]
- Terranova, O.G.; Gariano, S.L.; Bruno, C.; Greco, R.; Pellegrino, A.D.; Iovine, G.G.R. Landslide-risk scenario of the Costa Viola Mountain ridge (Calabria, Southern Italy). J. Maps 2016, 12, 261–270. [Google Scholar] [CrossRef] [Scilit]
- Khodayar, S.; Kushta, J.; Catto, J.L.; Dafis, S.; Davolio, S.; Ferrarin, C.; Flaounas, E.; Groenemeijer, P.; Hatzaki, M.; Hochman, A. Mediterranean Cyclones in a Changing Climate: A Review on Their Socio-economic Impacts. Rev. Geophys. 2025, 63, e2024RG000853. [Google Scholar] [CrossRef] [Scilit]
- Soeters, R.; van Westen, C.J. Slope Instability Recognition, Analysis and Zonation. In Landslides: Investigation and Mitigation; Turner, A.K., Schuster, R.L., Eds.; Special Report 247; Transportation Research Board, National Research Council: Washington, DC, USA, 1996; pp. 129–177. [Google Scholar]
- Gioffrè, D.; Moraci, N. Numerical Code Calibration for the Back Analysis of Debris Flow Runout in Southern Italy. In Landslides and Engineered Slopes. Experience, Theory and Practice; CRC Press: Boca Raton, FL, USA, 2018; pp. 991–997. [Google Scholar]
- Cruden, D.M.; Varnes, D.J. Landslide Types and Processes. Landslides Eng. Pract. 1996, 24, 20–47. [Google Scholar]
- Conforti, M.; Ietto, F. Influence of Tectonics and Morphometric Features on the Landslide Distribution: A Case Study from the Mesima Basin (Calabria, South Italy). J. Earth Sci. 2020, 31, 393–409. [Google Scholar] [CrossRef] [Scilit]
- Bucci, F.; Santangelo, M.; Cardinali, M.; Fiorucci, F.; Guzzetti, F. Landslide distribution and size in response to Quaternary fault activity: The Peloritani Range, NE Sicily, Italy. Earth Surf. Proc. Land. 2016, 41, 711–720. [Google Scholar] [CrossRef] [Scilit]
- Pánek, T.; Břežný, M.; Havenith, H.B.; Tibaldi, A. Landslides and growing folds: A lesson from the Kura fold-and-thrust belt (Azerbaijan, Georgia). Geomorphology 2024, 449, 109059. [Google Scholar] [CrossRef] [Scilit]
- Gatto, A.; Clò, S.; Martellozzo, F.; Segoni, S. Tracking a Decade of Hydrogeological Emergencies in Italian Municipalities. Data 2023, 8, 151. [Google Scholar] [CrossRef] [Scilit]
- Petrucci, O.; Mercuri, M.; Conforti, M. SCIBA: A Geo-Dataset of Damaging Rainfall Related Landslides and Floods Throughout 113 Years on a Mediterranean Study Area. Geosci. Data J. 2025, 12, e70026. [Google Scholar] [CrossRef] [Scilit]
- Guzzetti, F.; Ardizzone, F.; Cardinali, M.; Rossi, M.; Valigi, D. Landslide volumes and landslide mobilization rates in Umbria, Central Italy. Earth Planet. Sci. Lett. 2009, 279, 222–229. [Google Scholar] [CrossRef] [Scilit]
- Carlini, M.; Chelli, A.; Vescovi, P.; Artoni, A.; Clemenzi, L.; Tellini, C.; Torelli, L. Tectonic Control on the Development and Distribution of Large Landslides in the Northern Apennines (Italy). Geomorphology 2016, 253, 425–437. [Google Scholar] [CrossRef] [Scilit]
- Gullà, G.; Conforti, M.; Borrelli, L. A Refinement Analysis of the Shallow Landslides Susceptibility at Regional Scale Supported by GIS-Aided Geo-Database. Geomat. Nat. Hazards Risk 2021, 12, 2500–2543. [Google Scholar] [CrossRef] [Scilit]
- Conforti, M.; Pascale, S.; Pepe, M.; Sdao, F.; Sole, A. Denudation processes and landforms map of the Camastra River catchment (Basilicata—South Italy). J. Maps 2013, 9, 444–455. [Google Scholar] [CrossRef] [Scilit]
- Zhu, T.; Xu, X.; Zhu, A. Spatial variation in the frequency and magnitude of mass movement in a semiarid, complex-terrain agricultural watershed on the Loess Plateau of China. Land. Degrad. Dev. 2019, 30, 1095–1106. [Google Scholar] [CrossRef] [Scilit]
- Conforti, M.; Ietto, F. An Integrated Approach to Investigate Slope Instability Affecting Infrastructures. Bull. Eng. Geol. Environ. 2019, 78, 2355–2375. [Google Scholar] [CrossRef] [Scilit]
- Borrelli, L.; Ciurleo, M.; Gullà, G. Shallow landslide susceptibility assessment in granitic rocks using GIS-based statistical methods: The contribution of the weathering grade map. Landslides 2018, 15, 1127–1142. [Google Scholar] [CrossRef] [Scilit]
- Falconi, L.M.; Moretti, L.; Puglisi, C.; Righini, G. Debris and mud flows runout assessment: A comparison among empirical geometric equations in the Giampilieri and Briga basins (east Sicily, Italy) affected by the event of October 1, 2009. Nat. Hazards 2023, 117, 2347–2373. [Google Scholar] [CrossRef] [Scilit]
- Roda-Boluda, D.C.; D’Arcy, M.; McDonald, J.; Whittaker, C.A. Lithological controls on hillslope sediment supply: Insights from landslide activity and grain size distributions. Earth Surf. Process. Landf. 2018, 43, 956–977. [Google Scholar] [CrossRef] [Scilit]
- Calcaterra, D.; Parise, M. Landslide types and their relationships with weathering in a Calabrian basin, southern Italy. Bull. Int. Assoc. Eng. Geol. 2005, 64, 193–207. [Google Scholar] [CrossRef] [Scilit]
- Biondino, D.; Borrelli, L.; Critelli, S.; Muto, F.; Gullà, G. The interplay of structural pathway and weathering intensity in forming mass-wasting processes in deeply weathered gneissic rocks (Sila Massif, Calabria, Italy). J. Maps 2018, 14, 242–256. [Google Scholar] [CrossRef] [Scilit]
- Galli, M.; Ardizzone, F.; Cardinali, M.; Guzzetti, F.; Reichenbach, P. Comparing landslide inventory maps. Geomorphology 2008, 94, 268–289. [Google Scholar] [CrossRef] [Scilit]
- Conforti, M.; Pascale, S.; Sdao, F. Mass Movements Inventory Map of the Rubbio Stream Catchment (Basilicata–South Italy). J. Maps 2015, 11, 454–463. [Google Scholar] [CrossRef] [Scilit]
- Borrelli, L.; Antronico, L.; Gullà, G.; Sorriso-Valvo, G.M. Geology, geomorphology and dynamics of the 15 February 2010 Maierato landslide (Calabria, Italy). Geomorphology 2014, 208, 50–73. [Google Scholar] [CrossRef] [Scilit]
- Yang, Z.J.; Pang, B.; Dong, W.F.; Li, D.H.; Huang, Z.Y. Interaction of landslide spatial patterns and river canyon landforms: Insights into the Three Parallel Rivers Area, southeastern Tibetan Plateau. Sci. Total Environ. 2024, 914, 169935. [Google Scholar] [CrossRef] [Scilit]
- Larsen, I.J.; Montgomery, D.R. Landslide Erosion Coupled to Tectonics and River Incision. Nat. Geosci. 2012, 5, 468–473. [Google Scholar] [CrossRef] [Scilit]
- Oguchi, T. Drainage Density and Relative Relief in Humid Steep Mountains with Frequent Slope Failure. Earth Surf. Process. Landf. 1997, 22, 107–120. [Google Scholar] [CrossRef]
- Malamud, B.D.; Turcotte, D.L.; Guzzetti, F.; Reichenbach, P. Landslide Inventories and Their Statistical Properties. Earth Surf. Process. Landf. 2004, 29, 687–711. [Google Scholar] [CrossRef] [Scilit]
- Korup, O. Distribution of landslides in southwest New Zealand. Landslides 2005, 2, 43–51. [Google Scholar] [CrossRef] [Scilit]
- Borgomeo, E.; Hebditch, K.V.; Whittaker, A.C.; Lonergan, L. Characterising the spatial distribution, frequency and geomorphic controls on landslide occurrence, Molise, Italy. Geomorphology 2014, 226, 148–161. [Google Scholar] [CrossRef] [Scilit]
- Frattini, P.; Crosta, G.B. The Role of Material Properties and Landscape Morphology on Landslide Size Distributions. Earth Planet. Sci. Lett. 2013, 361, 310–319. [Google Scholar] [CrossRef] [Scilit]
- Kasai, M.; Yamada, T. Topographic Effects on Frequency–Size Distribution of Landslides Triggered by the Hokkaido Eastern Iburi Earthquake in 2018. Earth Planets Space 2019, 71, 89. [Google Scholar] [CrossRef] [Scilit]
- Qiu, H.; Wei, Y. Landslide Geomorphology: Pattern, Process and Stability. J. Earth Sci. 2025, 36, 327–332. [Google Scholar] [CrossRef] [Scilit]
- Peruccacci, S.; Brunetti, M.T.; Gariano, S.L.; Melillo, M.; Rossi, M.; Guzzetti, F. Rainfall Thresholds for Possible Landslide Occurrence in Italy. Geomorphology 2017, 290, 39–57. [Google Scholar] [CrossRef] [Scilit]
- D’Ippolito, A.; Lupiano, V.; Rago, V.; Terranova, O.G.; Iovine, G. Triggering of Rain-Induced Landslides, with Applications in Southern Italy. Water 2023, 15, 277. [Google Scholar] [CrossRef] [Scilit]
- Brunetti, M.T.; Peruccacci, S.; Gariano, S.L.; Melillo, M.; Solimano, M.; Guzzetti, F. The ITAlian Rainfall-Induced LandslIdes CAtalogue, an Extensive and Accurate Spatio-Temporal Catalogue of Rainfall-Induced Landslides in Italy. Earth Syst. Sci. Data 2023, 15, 2863–2877. [Google Scholar] [CrossRef] [Scilit]

Disclaimer/Publisher’s Note: The statements, opinions and data contained in all publications are solely those of the individual author(s) and contributor(s) and not of MDPI and/or the editor(s). MDPI and/or the editor(s) disclaim responsibility for any injury to people or property resulting from any ideas, methods, instructions or products referred to in the content. |
© 2026 by the authors. Licensee MDPI, Basel, Switzerland. This article is an open access article distributed under the terms and conditions of the Creative Commons Attribution (CC BY) license.