


Abstract
In this review, some special characteristics of the reactions in semiconductor photocatalysis are presented. At first, since a pair of the redox reactions take place at the same particle, a particle-based kinetic method was presented and applied for the Langmuir–Hinshelwood kinetics to describe the photocatalytic oxidation as a function of both the reactant concentration and the light intensity. Since the surface electron transfer (ET) reactions are the subject of electrochemistry, the difference in the characteristics from particulate semiconductor photocatalysis was pointed out by showing each electric potential near the solid surface. Different from ET in electrochemistry, the ET frequency is limited by the photon absorption in photocatalysis. In the estimation of the reaction rate, the validity of Marcus theory in photocatalysis was argued. Almost all photocatalytic reactions are irreversible, because, before the charge recombination, the oxidation and/or reduction must take place at the same particle. Then, the kinetics for irreversible reaction was discussed. As an exception, the reversible reduction reaction of methylviologen with a hole scavenger was presented. By changing pH, the energy levels of thermalized electrons in TiO2 particles were estimated, and the difference of the flat band potentials between anatase and rutile was clearly explained. Thus, various uniqueness of photocatalytic reactions in aqueous suspension of semiconductor particles were demonstrated.
1. Introduction
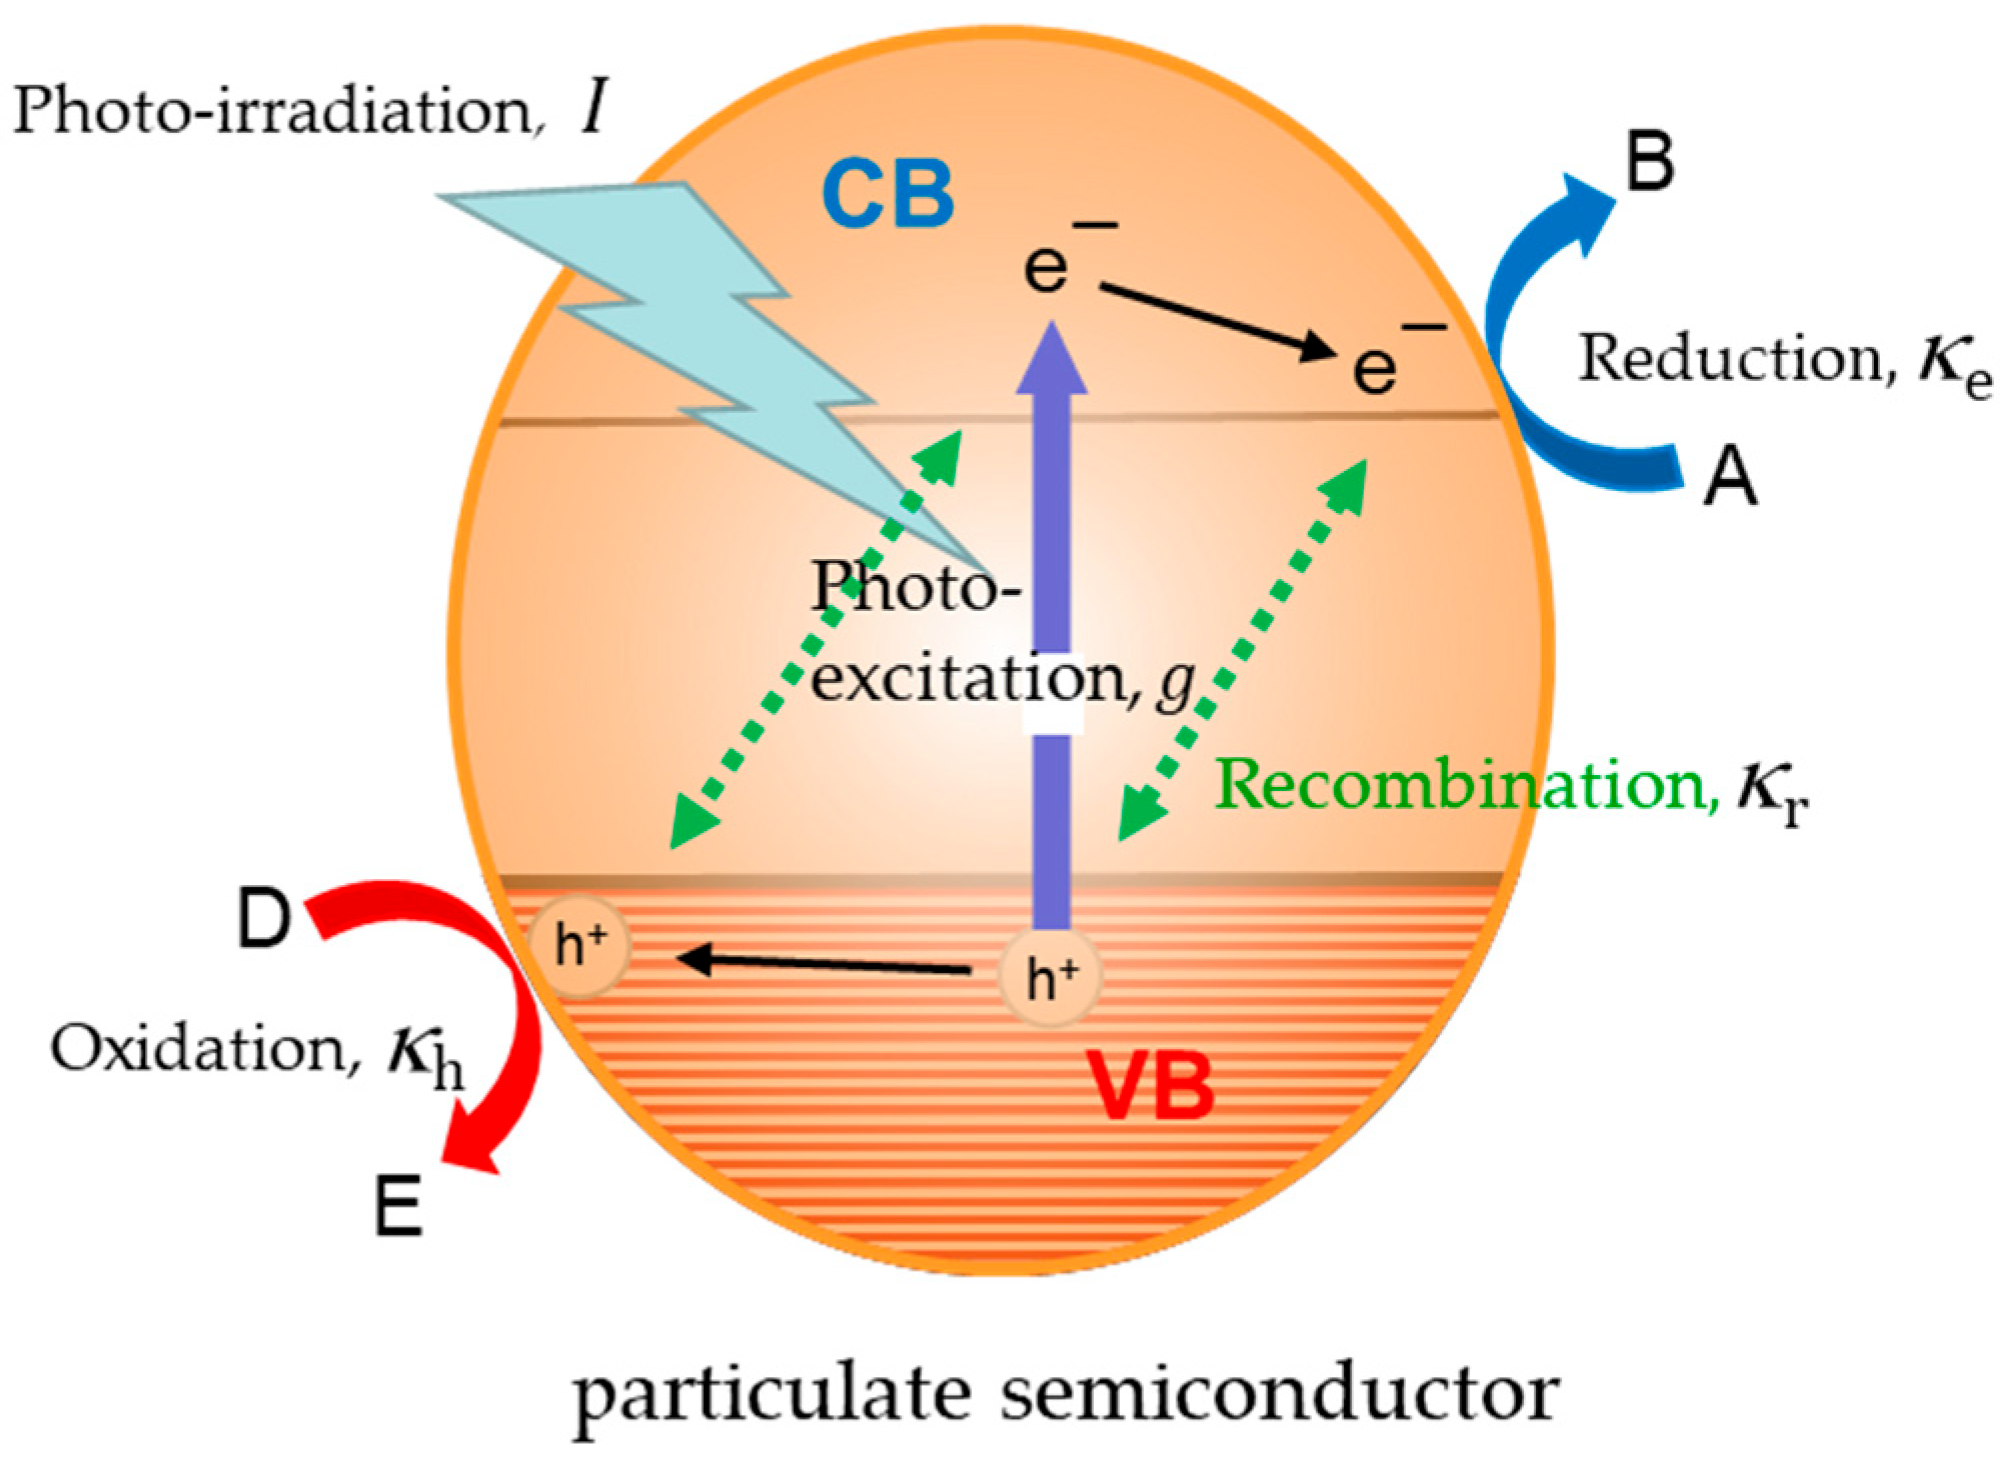
Photocatalytic reactions using semiconductor nano-particles have been gathering much attention in recent years because of the unique applications of photoenergy for environmental cleaning and solar fuel production [1,2,3,4,5,6,7]. The reactions in photocatalysis are initiated by the photoinduced electron–hole pairs in semiconductor nanocrystallites. Charge transfer reactions of both reduction and oxidation take place at the surface of particulate semiconductors by competing with the recombination reaction. Figure 1 shows the essential steps in photocatalysis, where photoinduced conduction band (CB) electron, e−, and valence band (VB) hole, h+, are both produced in a particle, and then they induce reduction and oxidation, respectively. Various kinetic analyses have been reported so far. However, in many reports, the concentration of electrons [e−] and holes [h+] have been treated as individual reactants in solution for the kinetic analyses. This hypothesis contradicts the fact that e− and h+ are located in the same particle in the suspended solution. In this review using the concept that reaction takes place at each particle in the suspended solution, particle-based kinetic analysis is introduced for reverting to the fundamentals of charge transfer reactions. By using this analysis, the rates of photocatalytic oxidation could simply be expressed as a function of both the reactant concentration and the light intensity. Since the photocatalytic reactions are controlled by the surface electron transfer (ET) reactions, the next question is the details of the surface ET reactions. The surface ET reactions are usually the subject of electrochemistry; thus, the interfacial reactions were compared between semiconductor photocatalysis and electrochemistry for the discussion of the reaction kinetics. The electric potential profile at the photocatalyst surface was calculated, and, by comparing with electrodes, the characteristic difference of photocatalysis from electrochemistry was pointed out. Various possible reactions that originated from the ET reactions at the solid–solution interface were enumerated and classified. Based on the discussion about the reversible and irreversible reactions, the characteristic feature of photocatalysis will be clarified. The Marcus–Gerischer theory for ET kinetics was described and it was suggested that the theory is not adoptable to the photocatalytic reactions. Since the almost all reactions are irreversible in photocatalysis, the reaction rate in irreversible reactions was discussed. For exceptional examples in photocatalysis, the reversible reductions of O2 and methylviologen (MV2+) were presented. By using the reduction of MV2+, the energy distribution of electrons near the conduction band minimum (CBM) in the photocatalyst powder was evaluated for rutile and anatase TiO2 particles. Lastly, the fact that the flat band potential of anatase TiO2 with Mott–Schottky experiments does not fit to the CBM will be explained by estimating the Boltzmann distribution of electron density near the CBM.
Figure 1.
Parameters to analyze the kinetics of photocatalytic reaction at a semiconductor particle. VB is valence band and CB is conduction band of semiconductor. g, κh, κe, and κr are the parameters used in the particle-based kinetics model.
2. Effects of Light Intensity and Reactant Concentration on Photocatalytic Oxidation Rates
In the analysis of the photocatalytic decomposition of organic compounds, the dependence of the reactant concentration on the reaction rates has been analyzed with Langmuir-type adsorption of reactant molecules [8,9,10], and the relationship between the reaction rate and the light intensity has been discussed separately. In the literature, the kinetic equations became complicated to combine the dependencies of the reactant concentration and the light intensity [11,12,13]. Previously, the present authors successfully analyzed the dependences of the size of semiconductor particles and the pulsed-laser intensity on the photoinduced ET efficiency by using the two-dimensional-ladder kinetic model [14], in which ladder kinetics were applied for the number of electrons and holes in a particle. This particle-based kinetic model was applied to the photocatalysis under the irradiation of continuous light [15].
As shown in Figure 1, there are four fundamental processes in photocatalysis. These are (i) charge generation, (ii) reduction, (iii) oxidation, and (iv) recombination, with the reaction rates represented by g, κe, κh, and κr, respectively. In the present particle-based kinetic model, the four processes of each particle were treated as the transitions between the states characterized by a pair of numbers {n, m} corresponding to the numbers of negative and positive charges in the semiconductor particle, respectively. Then, we describe the four initial steps as follows.
- (i)
- photo-absorption, or generation of charges in a semiconductor particle
{0, 0} ―(g)→ {1, 1}
- (ii)
- reduction of A to B
{1, 1} + A ―(κe)→ {0, 1} + B
- (iii)
- oxidation of D to E
{1, 1} + D ―(κh)→ {1, 0} + E
- (iv)
- recombination in the particle
{1, 1} ―(κr)→ {0, 0}
Since each particle is identified by the number of containing n electrons and m holes as {n, m}, the decaying steps for {n, m} can be described with the following equations.
The formation steps for {n,m} can be given by the following equations.
Then, the time dependence of the population {n, m} can be expressed by Equation (13).
By solving numerically, the simultaneous differential Equation (13), the population {n, m} at a steady state was obtained. Thus, the oxidation rate rD was calculated by summing up mκh for all {n, m} states over n and m as Equation (14):
where g = VαI, and V is the volume of the particle in the unit of cm3, α is the absorption coefficient of the semiconductor in the unit of cm−1, and I is the photon flux in the unit of cm−2s−1. The numerical calculation for rD with various sets of parameters were performed. For example, for the parameters κr = 1,10,102,103,104,105 s−1, with κh = 104 s−1 and κe = 102 s−1, the oxidation rates rD were calculated as a function of light intensities of I from 10−3 to 105 mWcm−2 with α = 104 cm−1 and V = 10−17 cm3. By changing various parameters, the oxidation rates, rD, were found to be expressed by Equation (15) [15]:
where χ is the ratio of reaction rates, and η is intrinsic quantum yield.
It is well known that the dependence of light intensity (I) on the oxidation rate is rD ∝ I1/2. This relationship is held when the excitation rate g is larger than the reduction rate κe, with κe « κr, because the right term of Equation (15) becomes (χg)1/2.
{n, m} ―(g)→ {n + 1, m + 1}
{n, m} + A ―(nκe)→ {n − 1, m} + B
{n, m} + D ―(mκh)→ {n, m − 1 } + E
{n, m} ―(nmκr)→ {n − 1, m − 1}
{n − 1, m − 1} ―(g)→ {n, m}
{n + 1, m} + A ―((n + 1)κe)→ {n, m} + B
{n, m + 1} + D ―((m + 1)κh)→ {n, m} + E
{n + 1, m + 1} ―((n + 1)(m + 1)κr)→ {n, m}
d{n, m}/dt = (n + 1)κe {n + 1, m} + (m + 1)κh {n, m + 1} + (n + 1)(m + 1)κr{n + 1, m + 1}
+ g{n − 1, m − 1} − (nκe + mκh + nmκr + g){n, m}
+ g{n − 1, m − 1} − (nκe + mκh + nmκr + g){n, m}
rD = n ≧ 0 m ≧ 1 mκh {n, m}
By assuming that the oxidation takes place for the adsorbed molecule Dad, the oxidation rate κh in the particle-based kinetics can be given by κh = kh[Dad] with a surface reaction rate constant kh and the concentration of D in solution. For usual photocatalytic decomposition of organic molecules, reduction takes place for O2 in solution. Therefore, the reduction rate in the above analysis can be given by κe = ke[O2,ad] with a surface reaction rate constant of ke.
Usually, the initial oxidation rate, r, obtained by the irradiation of a fixed light intensity at various reactant concentration [D] could be given by Langmuir–Hinshelwood (L-H) kinetics of Equation (18), where KL is the adsorption equilibrium constant and rL is the intrinsic reaction rate.
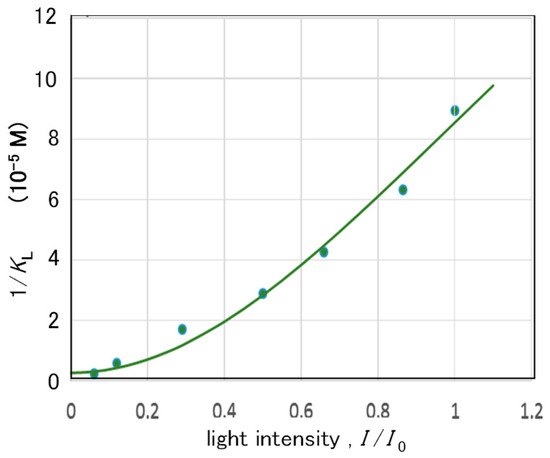
The adsorption equilibrium constant KL obtained at the various light intensities, I, could be expressed by Equation (19) as a function of I2.
where KD is the adsorption equilibrium constant in the dark, and the effects of light intensity on the adsorption and desorption are given by the two parameters, ca and cd, respectively.
In Figure 2, plotted are the data of KL for the decomposition of phenol in TiO2 (P25) aqueous suspension [16]. The curve in Figure 2 was obtained after fitting the parameters KD, ca, and cd of Equation (19). In the literature, KL was regarded to be proportional to I−1 [16]. Though simple dependence on the adsorption or desorption in the form of I was discussed in the literature [12,13], it was revealed that I2 is effective to express the values of KL. The successful fitting of Equation (19) to the experimental data in Figure 2 suggests that one photon process causes almost no effect on the surface property, but only when two photons were absorbed in the particle the property of adsorption can be affected. This interpretation indicates that phenol is adsorbed on the particle surface of the Ti-OH group, and this structure becomes the Ti-OO-Ti group by two photon oxidation to avoid the surface adsorption. In our previous study in the surface analysis with FT-IR spectra [17], the formation of Ti-OO-Ti has been evidenced.
Figure 2.
Association constant KL in the Langmuir–Hinshelwood Equation (18) obtained experimentally at various light intensities I [16]. The curve was calculated with Equation (19) by fitting the parameters KD, ca, and cd. Reproduced with permission from ref [15]. Copyright 2018 American Chemical Society.
The oxidation rate rD of Equation (15) in the particle-based kinetics model was converted into the equations in solution-based kinetics to compare with the experimental data. After some calculations [15], the intrinsic reaction rate, rL, in Equation (18) is given by Equations (20)–(22).
where [SD] is the total concentration of the adsorption site for the reactant D. Thus, the dependencies of the initial oxidation rate r on the reactant concentration [D] and light intensity I could be analyzed separately. In the conventional analysis by using the concentration for electrons and holes, the quadratic equation similar to Equation (20) has been reported [12,13]. However, the intrinsic quantum yield η in the equation was not the form of η12 but it was used in the form of η1. This difference is the key point obtained from the particle-based kinetic analysis to separate rL and KL in the I dependence [15].
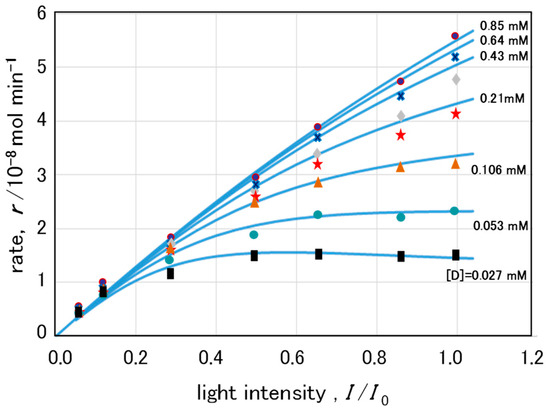
In Figure 3 plotted are the reaction rates r of phenol decomposition with TiO2 suspension, which were reported as a function of the light intensity I for several reactant concentrations [D]. These experimental data could be simulated with Equations (20)–(22) by fitting the remained three parameters in Equation (20), i.e., β, χ1, and η1 [15]. Though the particle-based kinetic model treats just the first surface oxidation, the initial decay of phenol can be described by the resultant equation, indicating that the rate of photocatalytic decomposition is limited by the first oxidation step at the semiconductor surface. In other words, the initial oxidation by photoinduced holes is the rate-determining step in the whole photocatalytic decomposition of organic molecules. It has been suggested that the relatively rapid auto-oxidation with O2 follows the first surface oxidation [17].
Figure 3.
The decomposition rates for phenol are plotted as a function of the incident light intensity for various reactant concentrations indicated by different marks and colors [16]. The curves were calculated with Equations (18)–(20) by fitting parameters β, χ1, and η1 to the experimental data. Reproduced with permission from Ref. [15]. Copyright 2018 American Chemical Society.
Since the lifetime of photoinduced electrons is usually longer than that of holes, the relationship of holds. Then, the value of ke[O2,ad] is calculated with Equations (21) and (22) to be 6 × 10⁻⁷mol min−1 from the values of β, χ1, and η1 obtained from Figure 3. The present authors measured the formation rate of •O2− by a chemiluminescence technique [17] and found it compatible to the O2 reduction rate obtained above [15].
By using the same datasets [16] above, several kinetic models have been reported. Salvador and coworkers proposed a Direct–Indirect (D–I) model [18] and applied [19] it to fit the datasets. Marin and co-workers [20] reported a model alternative to the D–I model, in which they considered all the basic steps involved in heterogeneous photocatalysis including the back reaction. Mills and co-workers [13] tested the five main mechanisms using own datasets of 4-chlorophenol [21] besides the datasets described above, and they adopted the disrupted adsorption model of Ollis [22] in terms of simplicity, usefulness, and versatility [13]. The equation for the model of Ollis is given by Equation (23) with parameters c1, c2, c3, and θ, where θ is 1 or 0.5 depending on the light intensity.
Afterwards, Mills et al. [12] reported a revised disrupted Langmuir–adsorption model as Equation (24) with four parameters: c1, c2, c3, and c4.
In order to compare the present particle-based kinetics to Equations (23) and (24), Equations (18)–(22) could be rewritten by a simple form as Equation (25),
where , , =. Therefore, in the present analytical method, the dependence of photocatalytic reaction rate r on the reactant concentration [D] and the irradiation light intensity I can be expressed by the simple equation with two independent parameters, c1 and c2, because c3 could be separately determined from the experimental results.
In the conventional analytical methods, the participation of OH radicals in the oxidation reaction has been assumed in many cases, then the kinetic equations became complex forms. However, in our research on the behavior of •OH using the fluorescence probe technique, the conclusion indicated that the surface direct oxidation is dominant and •OH contributes only for non-adsorbing reactants [17]. Another proposition of the present kinetic analysis is that the light intensity was fully introduced to express the adsorption equilibrium constant. The large variation of adsorption constant with light intensity suggests the tremendous change of the photocatalyst surface with the light excitation.
3. Essential Differences Between Photocatalysis and Electrochemistry
Reactions that involve the ET at solid surfaces are the subject of electrochemistry for a long time. Therefore, many concepts of electrochemistry definitely correlate to photocatalysis, and sometimes analytical methods in electrochemistry have been adopted to the interpretation of photocatalytic reactions. When photocatalysis and electrochemistry are globally compared, the fundamental differences could be summarized in Table 1, and the uniqueness of photocatalytic reactions can be realized [23].
Table 1.
Comparison between semiconductor photocatalysis and electrolysis (electrochemistry).
The condition of the ET reactions may be different between electrochemistry and photocatalysis because the circumstances are largely different. In electrochemistry, a counter electrode and electrolyte solution should be employed, and the electronic potential of the working electrode can be controlled by a power source through a lead wire. Using electrodes in electrochemistry means that the reaction rate of the interfacial ET can be monitored as the current. On the other hand, in semiconductor photocatalysis, ET rates can be recognized only by the change in the amounts of the reactant or the product, where the electron transfer occurs only by the one electron–hole pair generated by the absorption of one photon in a photocatalyst particle. The interval of photon absorption per particle (g−1) is calculated to be about a half milli-second, by using the usual photocatalysts of 27-nm diameter (V = 10−17 cm3) with α = 104 cm−1, under the normal light intensity of 10 mWcm−2. Therefore, the kinetics of the interfacial reaction may largely differ from the electrochemical reactions.
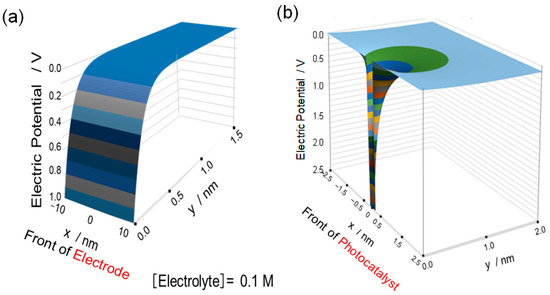
In electrochemistry, the electrolyte solution is indispensable to apply the electric potential to a molecule at the surface of working electrode. On the other hand, in photocatalysis, neither the counter electrode nor the electrolyte solution is employed. To understand the details of the difference of the reaction circumstances, the electric potential near the solid surface was considered. In electrochemistry, the feature of the electric potential near the solid surface could be given by the extension of the Debye–Hückel mode of the point charge to the charge on a plane [24]. Thus, the electric potential from the double layer at distance y in electrolyte of concentration C is represented by the following Equation (26) [25]:
where C is the ion concentration of electrolyte, and γ involves the fundamental physical constants and the relative permittivity of the solution [23]. In Figure 4a, the potential ϕ for electrolyte concentrations C of 0.1 M is plotted as a function of the distance y from the surface and the coordination x along the surface. The potential gradient is expected to cover the whole electrode surface, and the electric potential could be applied for molecules near the electrode (<0.1 nm).
Figure 4.
Electric potential ϕ produced at (a) the front of the electrode surface and (b) n-type semiconductor photocatalyst, calculated with Equations (26) and (27), respectively. The field from a single, localized surface charge (a trapped hole) in (b) is a key distinction from the uniform field of an electrode (a). Reproduced from PCCP 2020 [23] with permission from CCC.
For photocatalyst surfaces, the feature of the electric potential is completely different. In order to know the potential profile, the two-dimensional Poisson Equation (27) can be used:
where x is the distance from the positive hole along the surface, and y is the distance from the surface in the perpendicular direction. Since the solution contains no electrolyte, the right-hand side of this equation should be zero. Since the potential gradient spreads in a small area of less than 1 nm, the surface curvature of the photocatalyst particle does not largely affect the potential profile. Thus, the positive hole at the surface causes a potential gradient of a bent-funnel shape as shown in Figure 4b. Since the reactant molecules could not so frequently diffuse to the potential gradient of particulate photocatalysts, then, the photo-induced VB holes may move to the surface where the reactant has been adsorbed. In other words, the surface site where a reactant molecule was adsorbed may become a hole trapping site. Another important distinction is that the potential appearance is not changed by the environment. That is, the potential gradient can be formed even in gas phase in case of photocatalysis. Therefore, the practical TiO2 photocatalysts are widely used under the air, where the TiO2 surface adsorbs a few layers of water molecules as the reactant in the ambient environment [17].
4. Various Charge-Transfer Reactions at Solid Surface in Solution
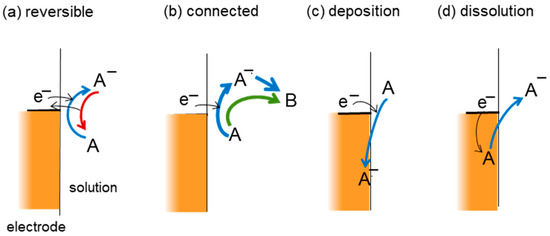
For understanding the difference of reactions between electrochemistry and photocatalysis, the consideration of various charge-transfer reactions at the solid surface may be helpful. The plausible chemical events associated with ET reactions could be classified to four types of reactions as shown in Figure 5; (a) reversible ET reactions without chemical reactions; (b) the connected reactions which change the species A to B by the modification of chemical bond; (c) the deposition of the ET product being incorporated into the solid surface; and (d) the dissolution of ions from the surface as the reverse reaction of the deposition. In the case of (b), the ET-connected process can be divided to the two cases separated by whether the ET-produced species A− are involved as an intermediate to produce B. Though the four types of ET reactions in Figure 5 are for reduction by electrons at electrodes, similar figures can be provided for the reverse ET (hole transfer) for the surface oxidation reaction. In the case of the oxidation, e−, A, A−, and B in Figure 5 should be replaced by h+, D, D+, and E, respectively.
Figure 5.
Possible changes of reactant A by the ET at the solid-solution interfaces. The similar figure can be obtained for reactant D by reverse ET or hole transfer.
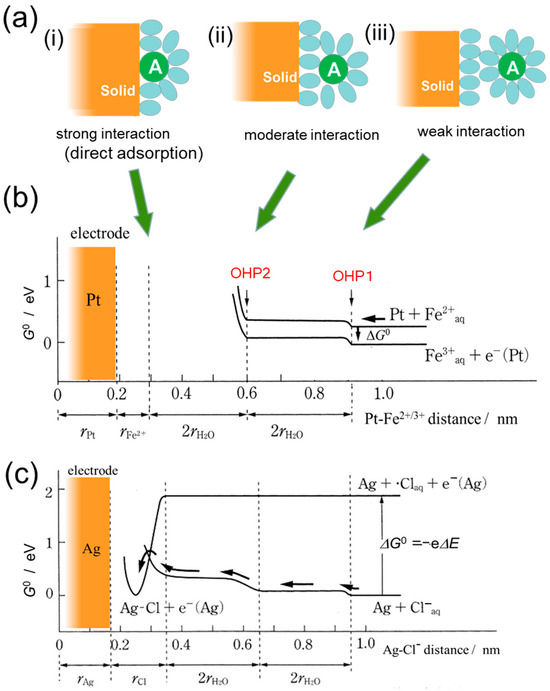
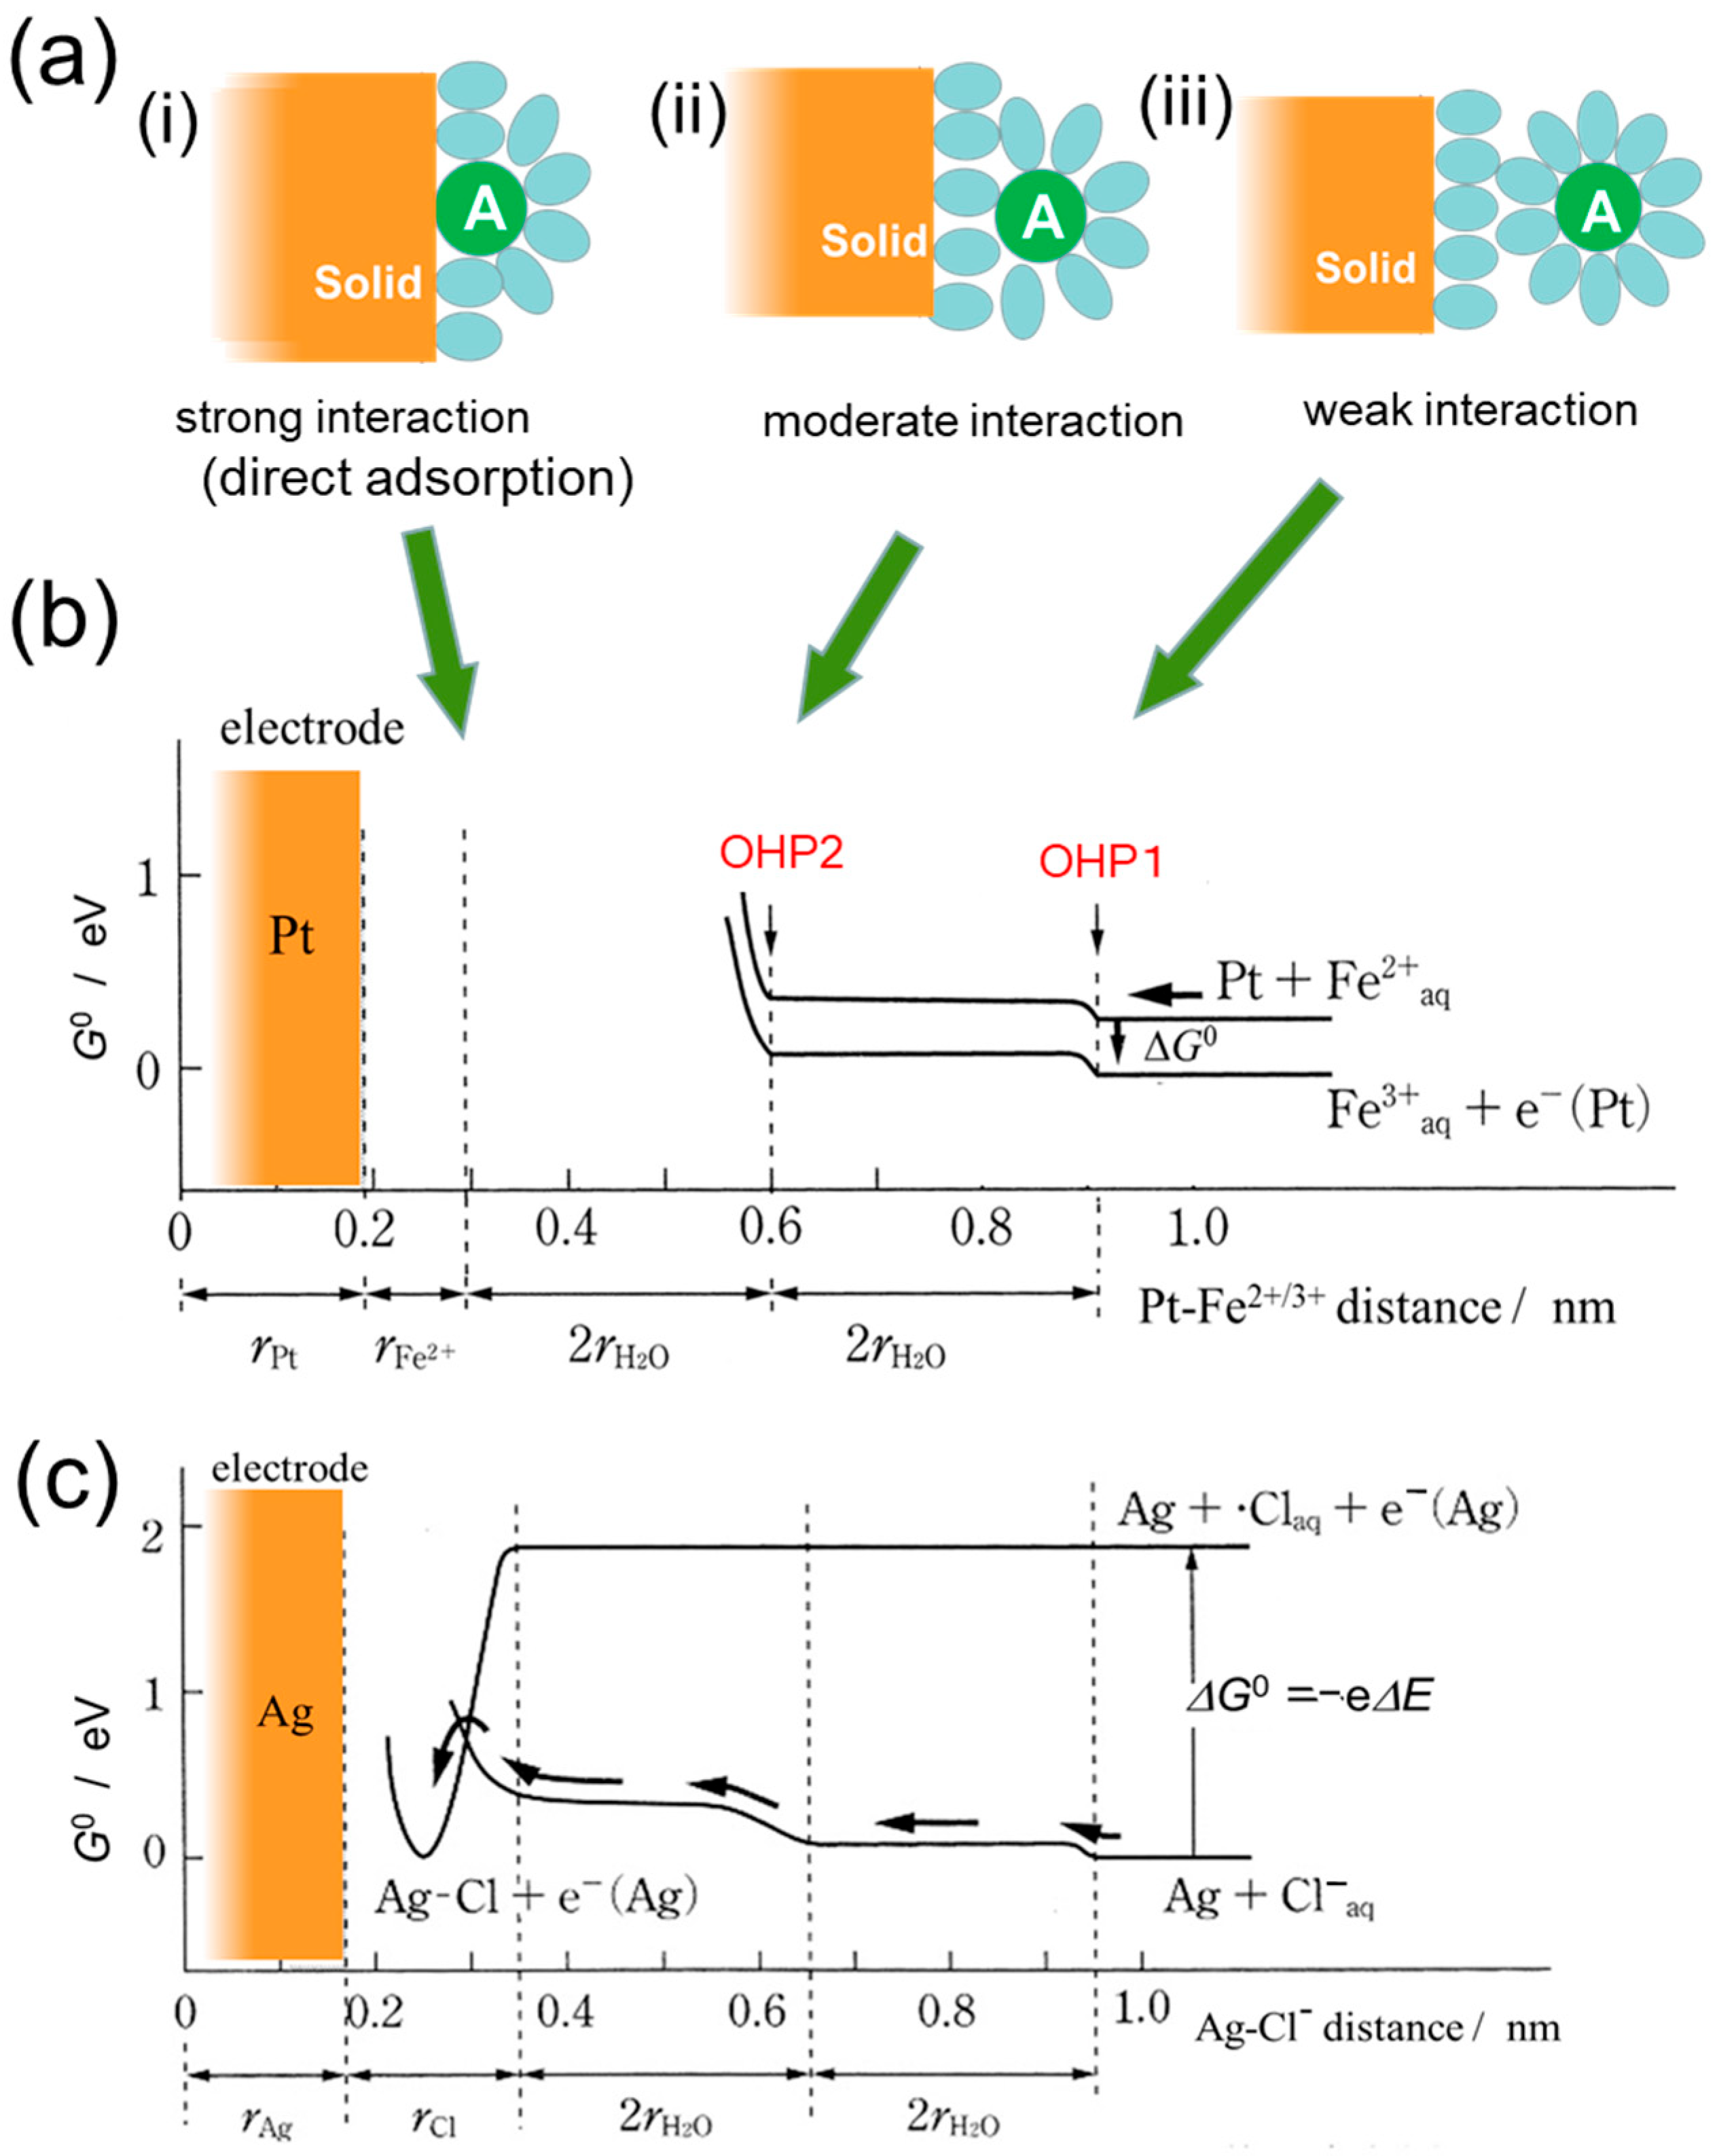
To distinguish the four ET reactions in Figure 5, the most important factor is the interaction between the reactant molecules and the solid surface. The extent of the interaction could be classified into three cases as shown in Figure 6a. When the interaction is very weak, the reactant A is separated from the surface with solvent molecules at the nearest contact as shown in Figure 6a(iii). On the other hand, when the interaction between the reactant A and the surface is very strong, the reactant A makes contact directly with the solid surface as illustrated in Figure 6a(i). In the moderate strength of the interaction, the reactant A may be separated by one solvent molecule as shown in Figure 6a(ii).
Figure 6.
(a) Schematic illustration for the various strengths of interactions between the solute molecule A and the solid surface with solvent molecules shown by ovals. The strength of the interaction increases from (iii) to (i). (b,c) Schematic illustration for the standard Gibbs energy G0 as examples of the reactions in Figure 5a,c, respectively, after Nakato [26]. (b) Oxidation reaction of hydrated Fe2+ ions at a Pt electrode, where the line with e−(Pt) shifts with the electrode potential. (c) The ET deposition of hydrated Cl− ions on an Ag electrode. Reproduced from PCCP 2020 [23] with permission from CCC.
When the interaction is weak as is the case (iii) in Figure 6a, the ET takes place as reversible reaction at the outer solvation sphere. In other words, reaction occurs at the outer Helmholtz plane (OHP). In this case, the products A− in OHP may be stable, and when A− does not diffuse to the bulk solution the transferred electron could be released to the solid as the reverse reaction. A typical example of this reversible ET reaction is the electrochemical oxidation of ferrous ions (Fe2+) to ferric ions (Fe3+) as depicted in Figure 6b. The reversible reaction, that is the oxidation of Fe2+and reduction of Fe3+, could freely occur, and the fraction of two ions [Fe3+]/[Fe2+] is basically determined by the difference of the free energies ΔG0 depending on the Nernst equation. The reaction energy ΔG0 corresponds to the potential difference ΔE between the standard reduction potential E0 and the electrode potential ϕ (or the Fermi level of the electrode) as given by Equation (28).
The reaction rate may correlate with the reaction energy ΔG0. However, due to the change in the number of charges, the solvation energy may vary with the ET. This issue will be discussed in the following section with the reorganization energy, λ.
ΔG0 = e ΔE = e (ϕ − E0)
When the product of the ET reaction interacts very strongly with the solid surface, atoms or ions may be incorporated or deposited at the solid surface as illustrated in Figure 5c. An example is the oxidative deposition of Cl− ions exhibited in Figure 6c, where Cl atoms are deposited on Ag electrode to form AgCl [26]. In photocatalysis, a typical example is the deposition of metal by the reduction of metal ions. The reverse reaction of the deposition is dissolution as illustrated in Figure 5d. The dissolution of ions from the solid surface is one of the plausible chemical changes with charge transfer, which is sometimes observed in photocatalytic reactions.
5. Estimation of ET Rates for Reversible Reaction
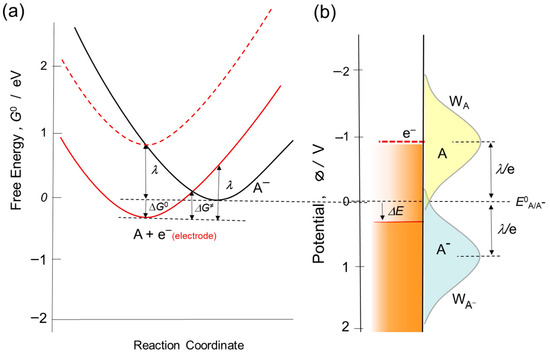
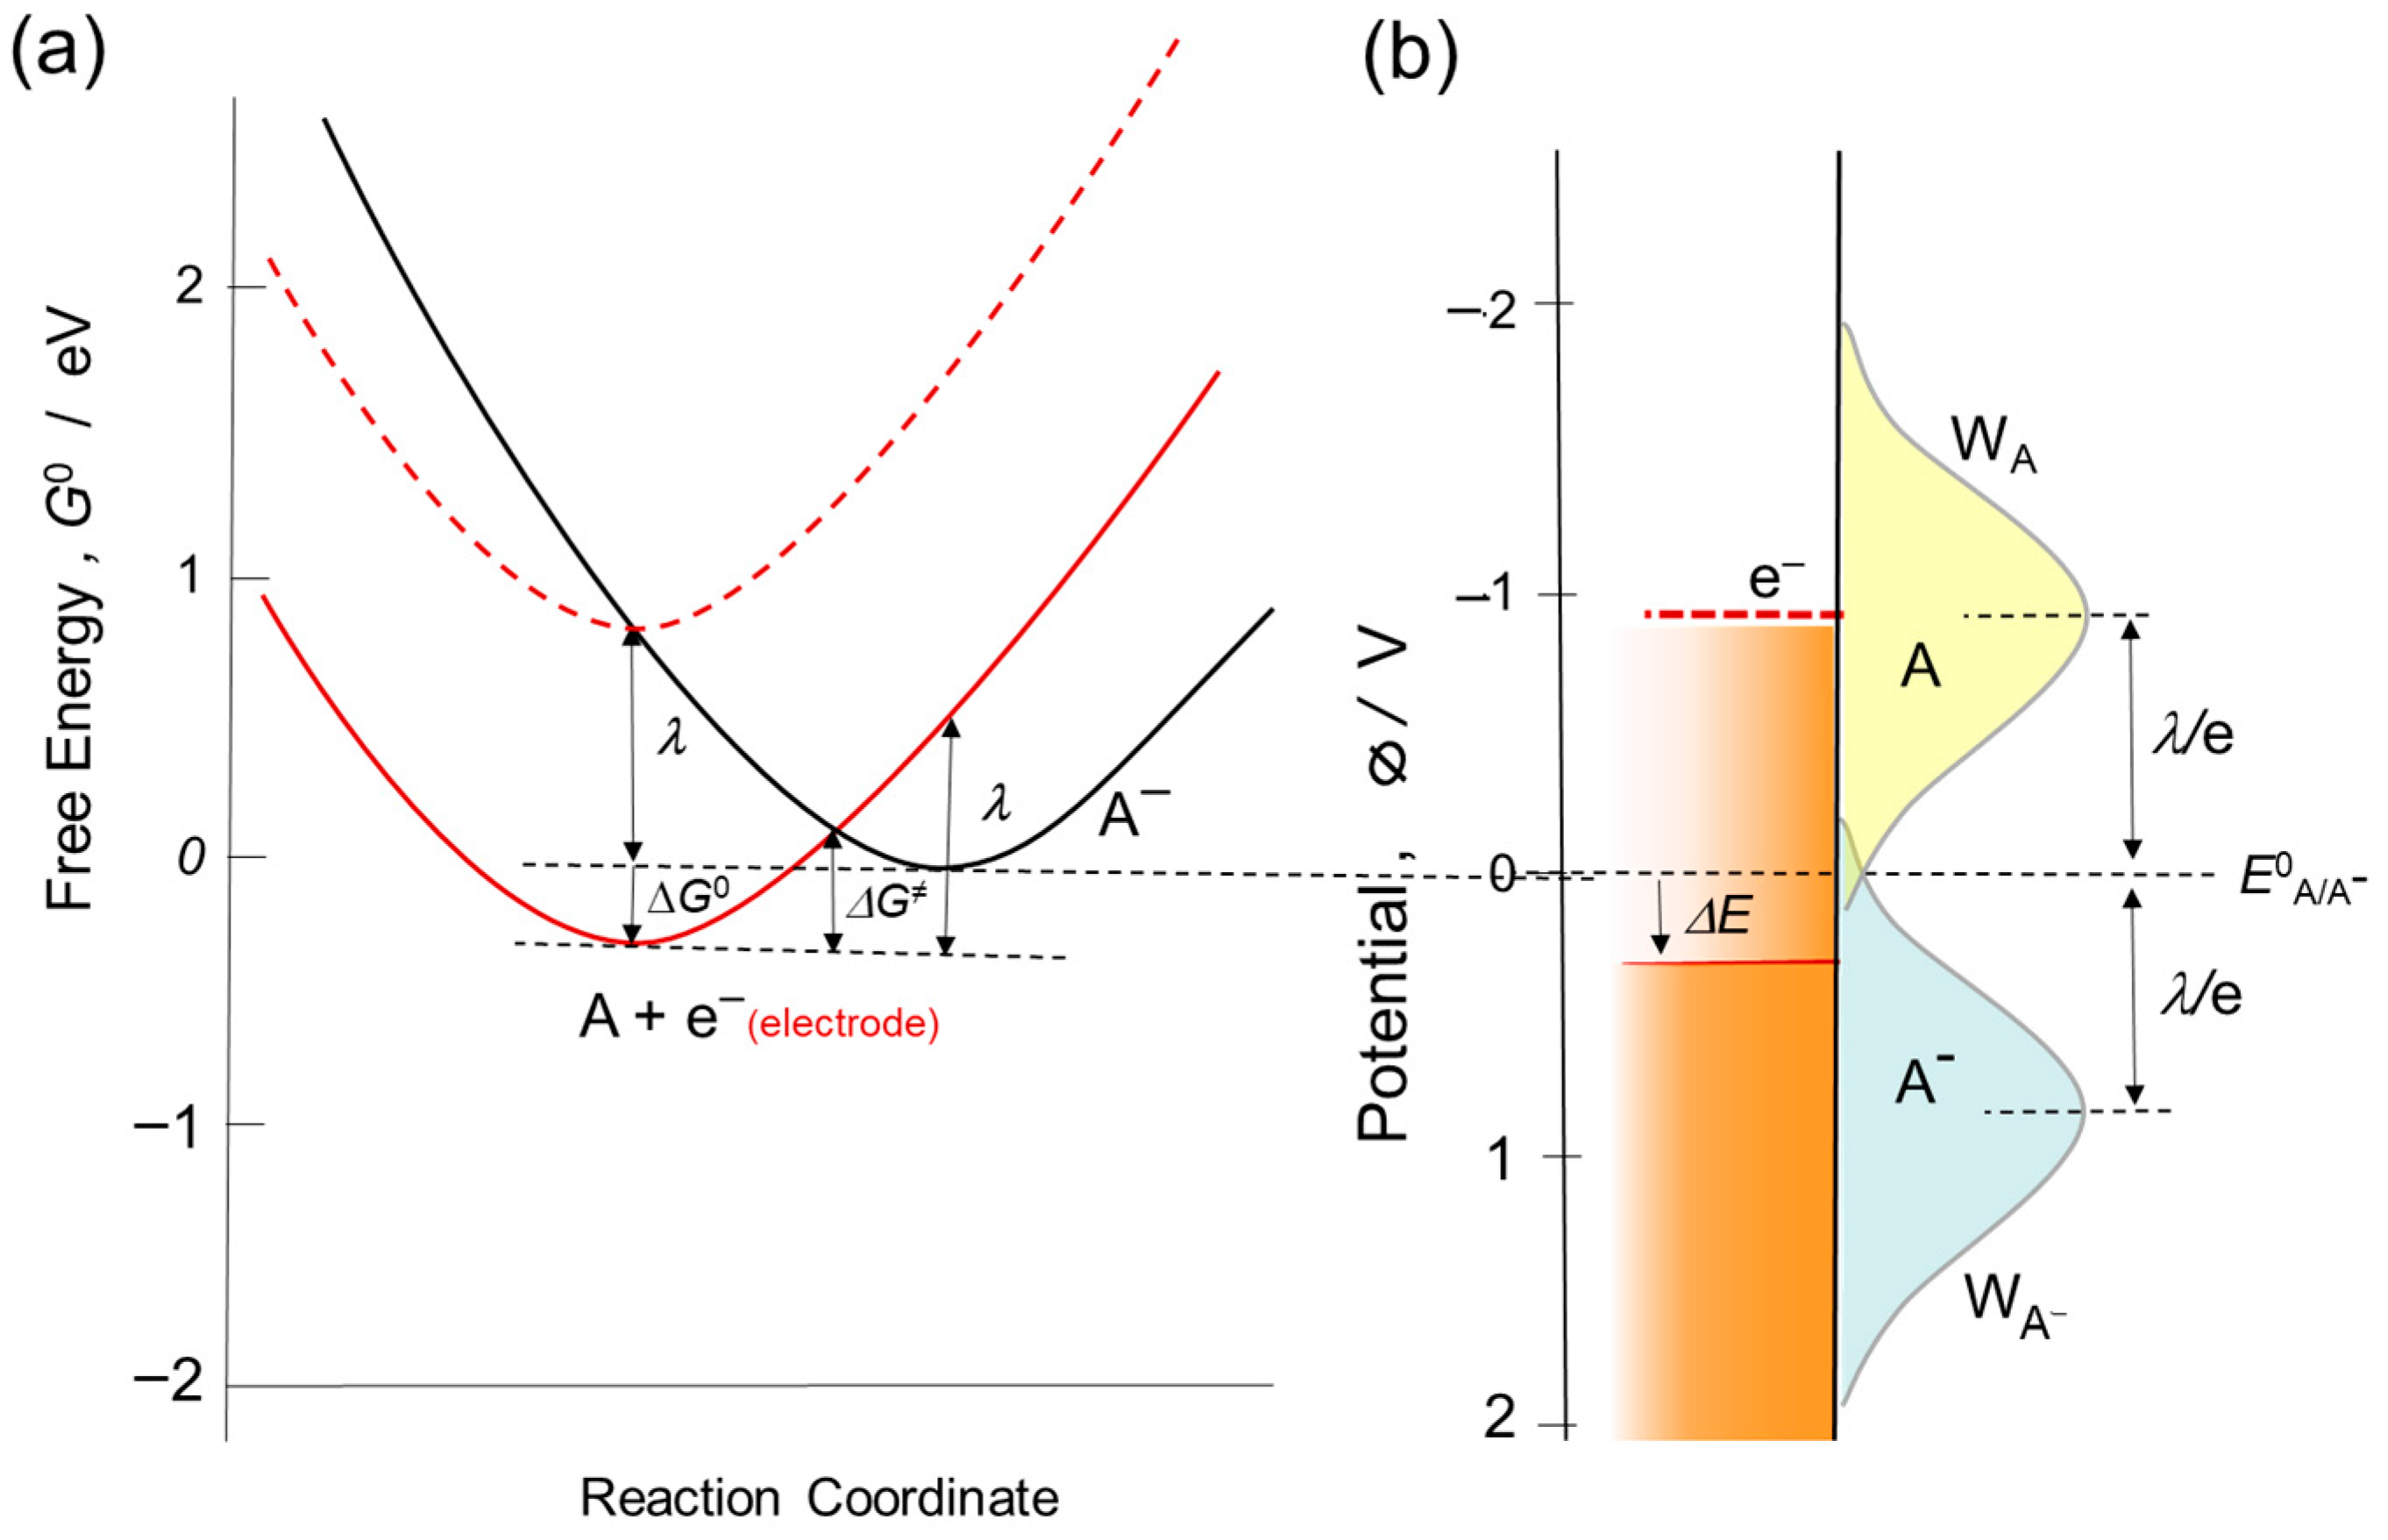
The ET reaction rate ket has been discussed as a function of the reaction energy ΔG0, that is, the free energy change by the reaction. Marcus analyzed the ET rate of metal ion complexes in a homogeneous solution [27]. After the successful evaluation of experimental data with the reorganization energy λ, the ET reactions at electrodes were analyzed by Marcus [28] and Gerischer [29]. In these theories of the ET kinetics, the free energy of the transition state, ΔG≠, is calculated with the reorganization energy λ based on the harmonic oscillator model as shown in Figure 7a. After a mathematical procedure, Equation (29) is obtained.
Since the reaction rate is proportional to the term of exp(−ΔG≠/kBT) with Boltzmann constant kB and temperature T, the rate of ET, ket, can be expressed by Equation (30) from Equations (28) and (29) with a pre-exponential factor A.
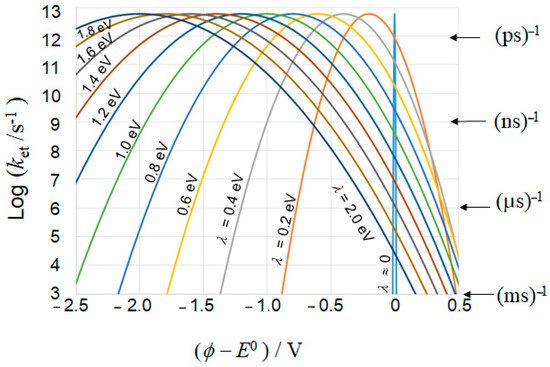
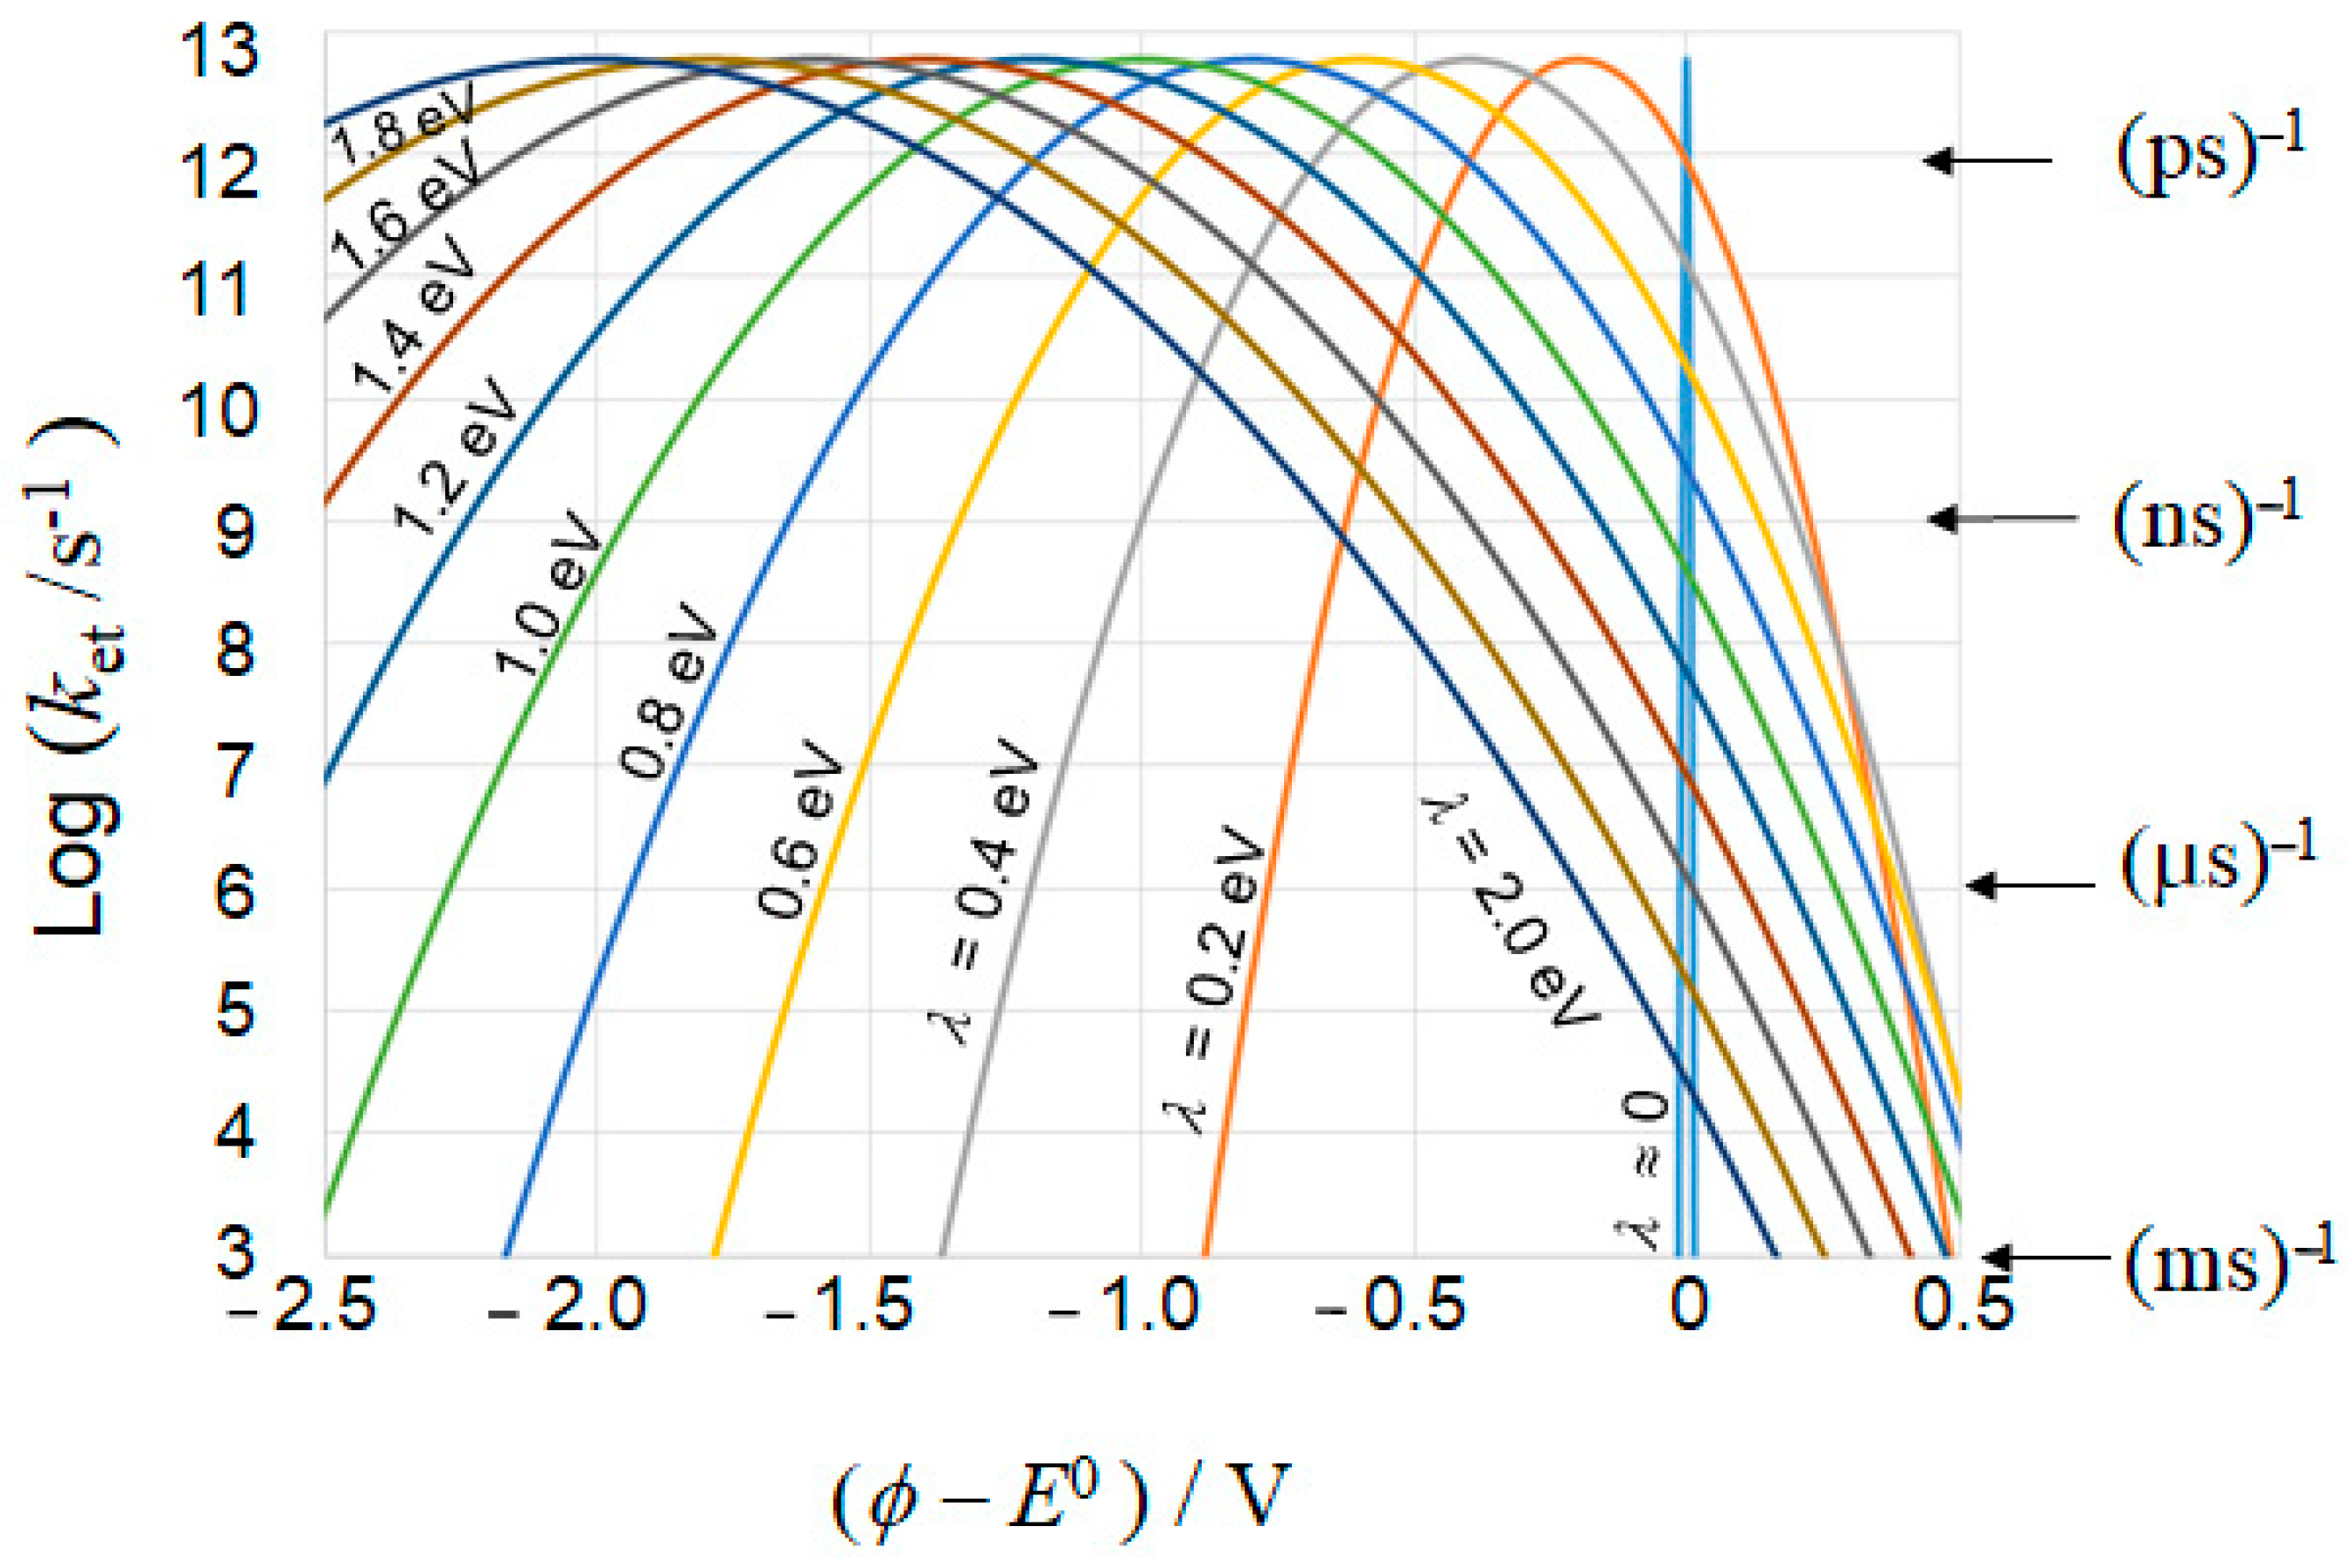
For the pre-exponential factor, a very simple estimation is A ≈ kBT/h with Plank constant h. By using the estimated value of A = 6 × 10¹² s−1, Equation (30) gives us the ket as a function of the reaction energy ΔG0, or ϕ − E0, for various reorganization energies λ as shown in Figure 8. The probability of ET, WA, as a function of electrode potential ΔE in Figure 7b, corresponds to the ϕ dependence of the ket in Figure 8. When ϕ = E0 − λ/e, or ΔG0 = −λ, as shown by the broken parabola in Figure 7a the Equation (30) and Figure 8 suggest that the ket becomes maximum owing to the barrier free condition of ΔG≠ = 0.
ΔG≠ = (ΔG0 + λ)2/4λ
Figure 7.
(a) Calculation method for transition energy ΔG≠ in the Marcus–Gerischer theory with Equation (29), where the reorganization energy λ of 0.9 eV and the standard potential E0 of 0 V for example. When electrode potential goes up to E0 − λ/e, as shown by the broken red curve, the maximum ET reaction rate is expected. (b) Distribution of the ET probability WA in the reduction reaction (yellow area) and the probability WA- for the oxidation of A− (blue area), i.e., the ET from A− to the electrode.
Figure 8.
Electron transfer rate calculated based on the Marcus–Gerischer theory with Equation (30), which corresponds to WA in Figure 7b.
Since the ET rate in electrode reactions is usually measured by the current of the electrode, Figure 7b may gain full meaning in electrochemistry. However, in the case of photocatalysis, the reaction rate is usually measured by the decrease of the reactant, and the maximum ET frequency is controlled by the photo excitation rate that is the order of (1 ms)−1 as stated above. Therefore, the reaction may take place at the thermodynamical limitation. As calculated from Equation (30), when ΔG0 = 0 (or ϕ = E0) ΔG≠ becomes λ/4, and then ket has a certain value. For example, when λ ≦ 0.6 eV the electron transfer rate ket at ΔG0 = 0 is larger than (53 ps)−1. Since the electron–hole recombination takes place at around 10–100 ps [1], the ET reaction at OHP in photocatalysis may take place without over potential, i.e., at ϕ = E0.
Since the reorganization energy λ is a parameter for the ET reaction rate, it is not the factor that directly affects the energy level for the actual electron transfer. However, there are many reports [11,30,31,32,33,34] in which reorganization energy was adopted for the kinetic analysis of reaction rates in photocatalysis using the energy diagram of Figure 7b. Kisch described that the interfacial ET in photocatalysis is thermodynamically allowed when the quasi-Fermi level of reactive electrons, which locates between the flatband potential and the CBM, is equal or more negative than the potential (E0 − λ/e) [34]. Montoya et al. adopted the Marcus–Gerischer theory to the photocatalytic ET reaction and described that the rate depends on the degree of overlapping between the semiconductor energy band and the redox transition distribution with λ of the substrate [11]. Since λ is a kinetic parameter which concerns to the reaction rate as described above, it should not affect the thermodynamic parameter and then the thermodynamic allowance cannot be changed by λ. In other word, reorganization energy λ determines the kinetic barrier, while the thermodynamic driving force is determined by the difference between the semiconductor’s Fermi level (or CBM) and the redox potential E0. In photocatalysis, thermodynamic allowance is that the CBM should be higher than E0 of the ET reaction. Since the ET reaction of photocatalysis is basically irreversible, the kinetic analyses using the Marcus–Gerischer theory, which are adopted in many reports, will likely need careful considerations.
Gerischer described WA as the density for the oxidized state in his early reports. After many citations, the terminology of density of states (DOSs) for the oxidation and reduction has been used [35]. Therefore, the WA in Figure 7b could be easily mixed up to the states as if there exit some energy levels. The energy state of A/A− redox couple is not distributed itself, but it is just the energy for distribution of reaction rates when the adiabatic ET takes place [26]. In other words, the WA in Figure 7b is the energy distribution of the ET reaction rates with the kinetic parameter λ and it is entirely different from the electron DOSs of the solution [26].
In electrochemistry, the kinetics are commonly analyzed as the reversible ET reactions. Then, the Marcus–Gerischer theory could be basically adoptable only for the reactants of weak interaction as indicated in Figure 6a(ii,iii) [36]. Actually, the values for λ experimentally obtained in the literature are limited in reversible ET reactions. On the other hand, in photocatalysis, since the ET reaction must be terminated to overcome the rapid electron–hole recombination, almost all the reactions reported are irreversible as categorized to processes in Figure 5b,c. However, if the photoinduced holes disappear by a fast oxidation reaction, the electrons become free from the recombination and may have a long lifetime. In this case, the electrons remained in the particle, which allows reversible ET reactions as described later.
6. Irreversible ET Process in Photocatalysis
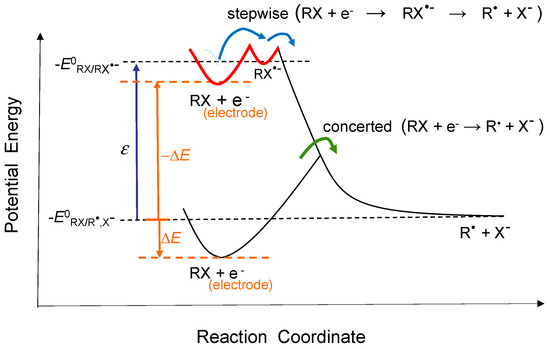
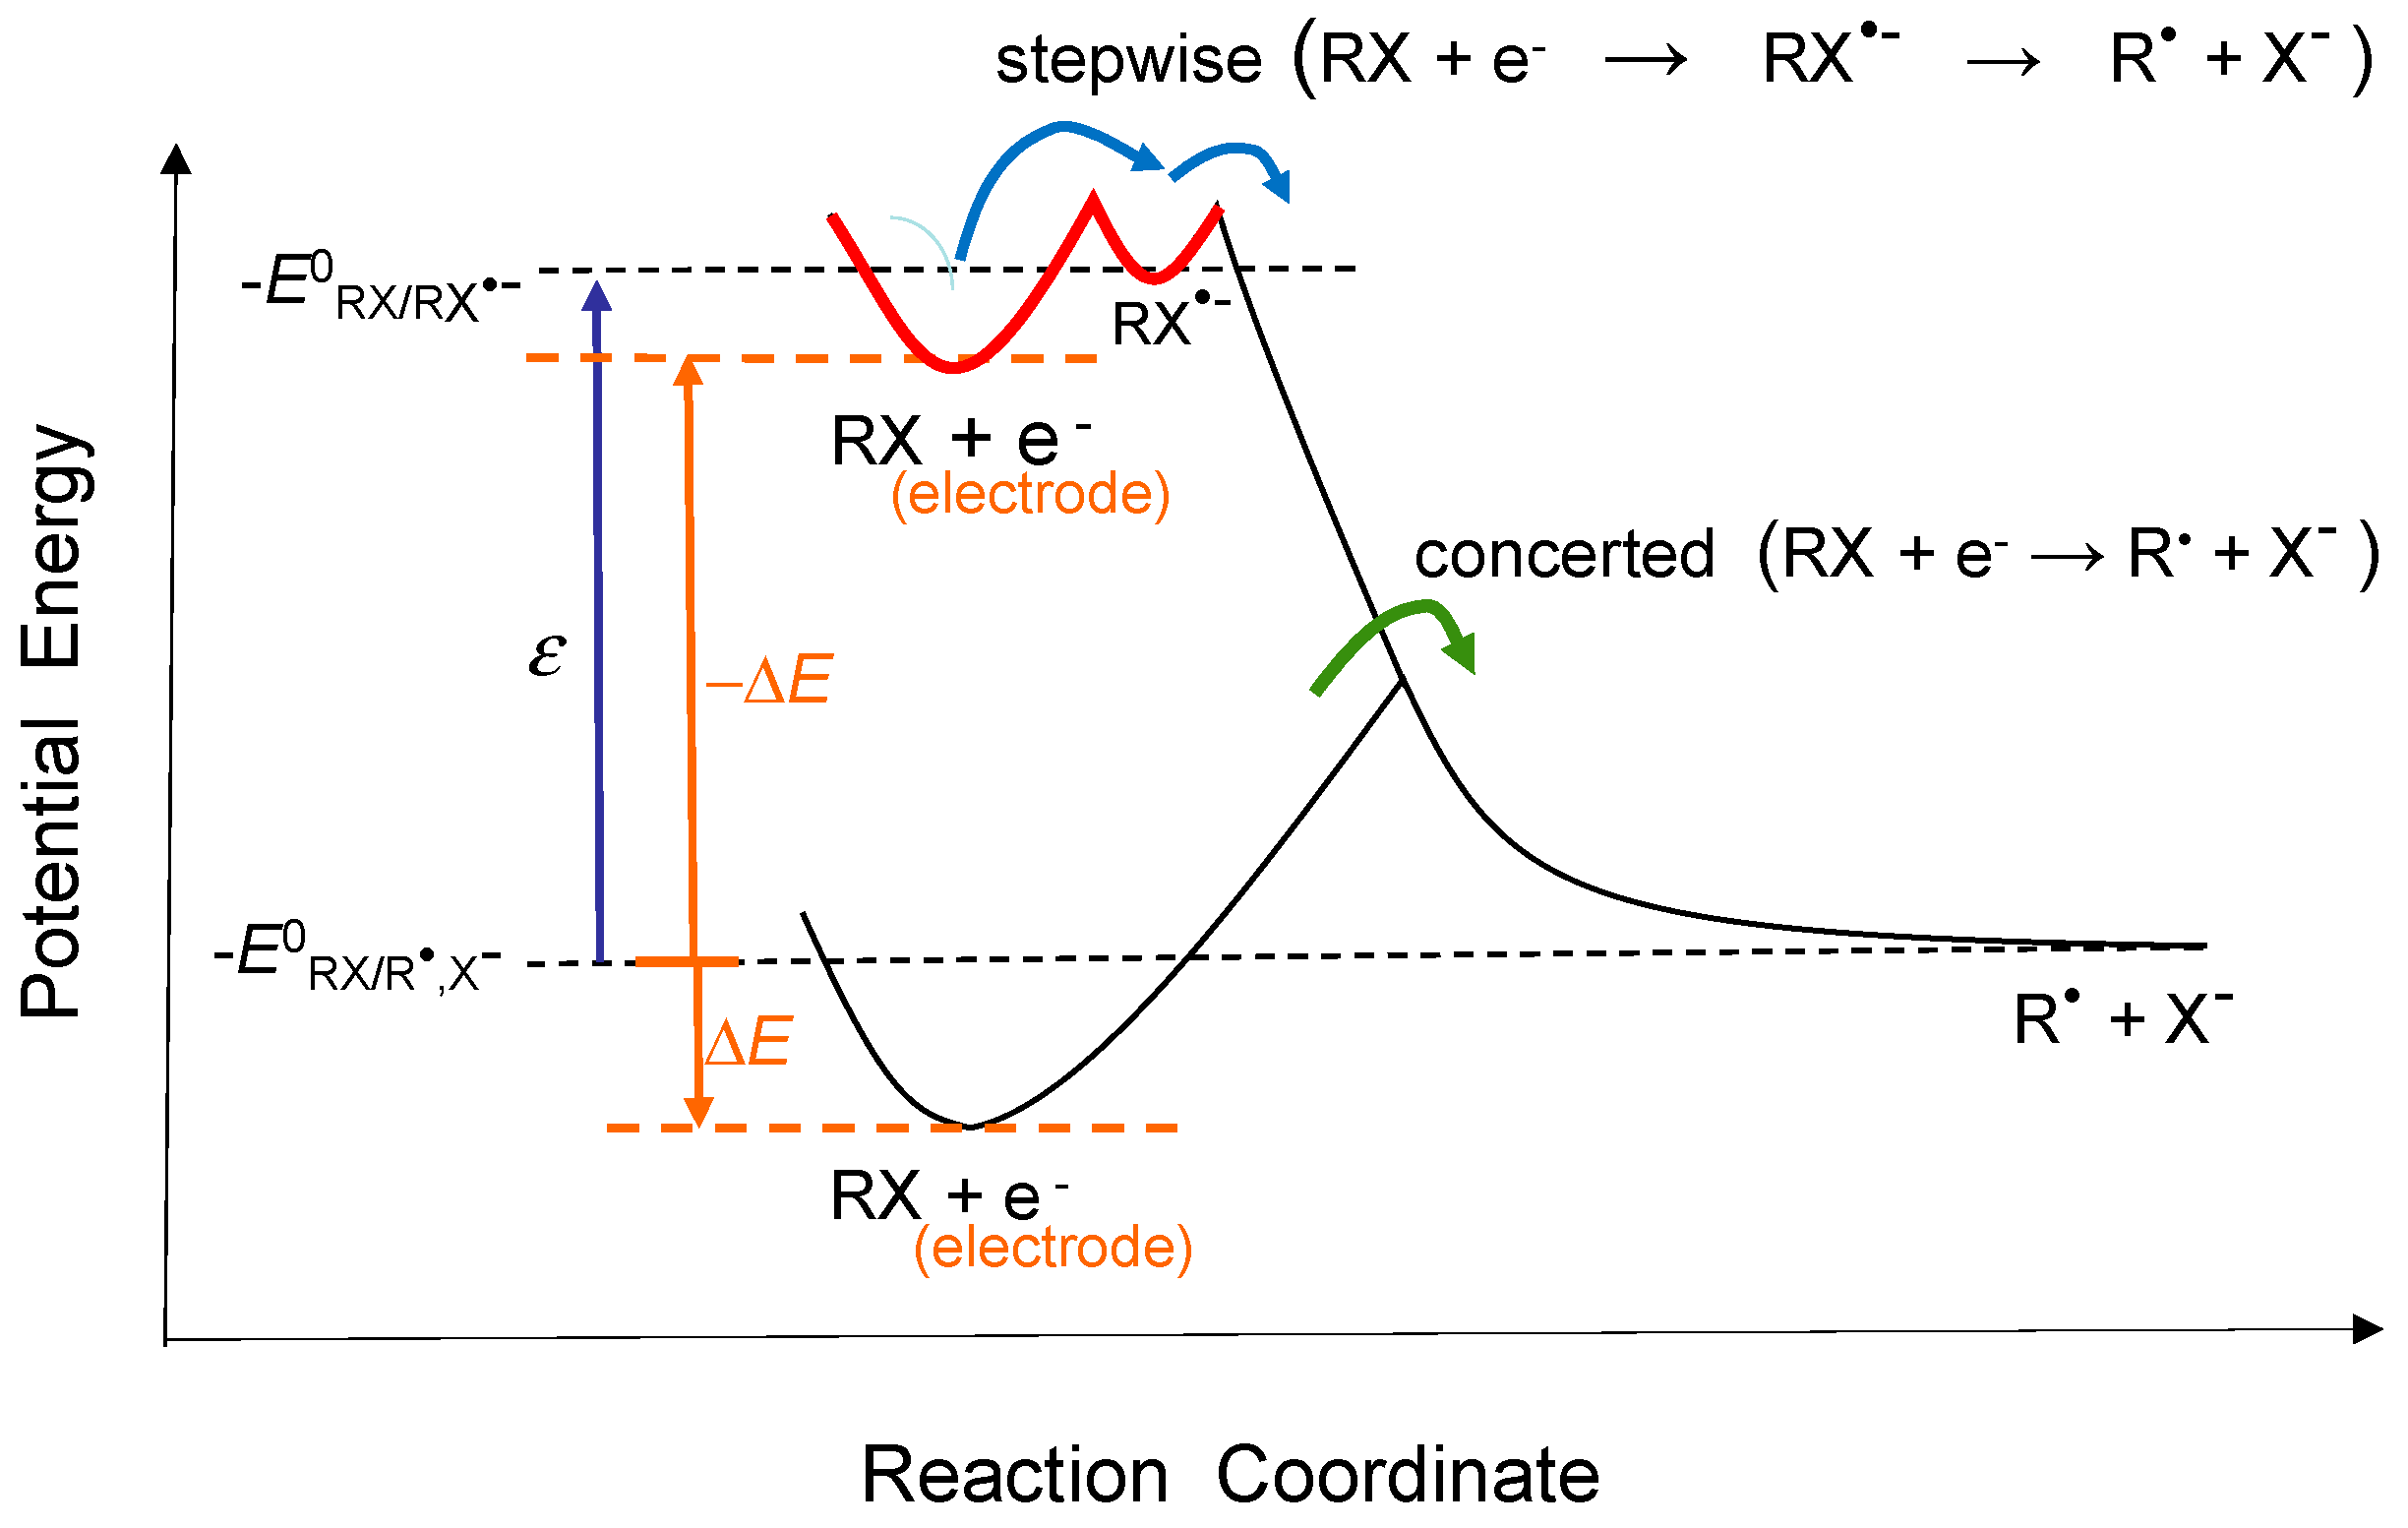
In contrast to the reversible process described above, irreversible ET connected chemical transformation in Figure 5b is important in photocatalysis, because photocatalysis is usually applied for chemical transformations. As described above, there are two cases in the ET connected reactions, which are the concerted pathway of directly producing B and the stepwise pathway of producing the intermediate A−. As an example of the ET connected reactions, the electrochemical dissociation of organic halides (RX) has been investigated [37]. Figure 9 shows schematically the energy diagram of the connected reactions, where RX and R• + X− correspond to A and B in Figure 5b, respectively. In the case of stepwise process, RX•− radical cation corresponding to A− should be expected, while, in the case of concerted ET reaction, this radical cation cannot be detected. As shown in Figure 9, when the energy level of the electrons in the electrode is raised to near the standard potential of the (RX/RX•−) redox, the stepwise reaction via RX•− takes place. The above-described Marcus–Gerischer model can be adopted for only the first step (marked with red curve) in the stepwise process. The difference, ε, between the two standard potentials, i.e., ε = E0(RX/R•,X−) − E0(RX/RX•−), is the controlling factor to select the pathways from the stepwise and the concerted mechanisms. When the value of ε is small, the stepwise process is dominant at the electrode potential of |ΔE| > ε and when ε is large the concerted process is dominant at |ΔE| < ε [38]. Thus, the pathway in the dissociative ET reactions is changed from the concerted mechanism to the stepwise mechanism along with the increase of the electrode potential.
Figure 9.
Potential energy of the two pathways of connected reaction, the stepwise and concerted paths, for the dissociation of organic halides RX as an example of ET connected reaction in Figure 5b. Broken orange lines indicate the two cases of electrode potential. Reproduced with permission from Houmam et al. [37]. Copyright 2008 American Chemical Society.
In the case of the electrochemical-connected ET reaction of Figure 5b, Savéant suggested that λ may be replaced by the dissociation energy [39,40], and the Marcus–Gerischer theory may be basically applicable when the reaction is not coupled with chemical changes involving the disruption of the chemical bond [37]. In usual photocatalytic oxidation reactions of organic molecules (RH), the ET intermediate (RH•+) radical cation has usually a high standard potential, and a large ε is suggested. Therefore, the stepwise mechanism of producing RH•+ may not take place in many cases of oxidative photocatalytic degradation. When the rate determining step in the photocatalytic oxidation is the concerted oxidation with directly producing R• + H+, the reorganization energy must include the large bond dissociation energy. Therefore, in this case, Equation (30) of the Marcus–Gerischer theory could not be used, and the reaction rate may be almost simply proportional to the exponential of energy difference, i.e., ket ∝ exp(−ΔG0/kBT) [37,38].
In the above discussions, the standard potential E0 in a homogeneous solution was employed as the free energy. However, the free energy of the reactant A may vary depending on the interaction with the solid surface. When the interaction, or adsorption, is strong as illustrated in Figure 6a(i), the solid surface serves a catalytic function, then the product B may be formed more easily without the formation of A− in the connected reaction. Therefore, the concerted mechanism in Figure 5b becomes more favourable in photocatalysis. Thus, when the adsorbed molecules become the transition state, the transition state energy could not be calculated by the Marcus–Gerischer theory.
For example, in the photocatalytic oxidation of methanol, the paramagnetic species were analyzed by means of the EPR technique [41]. The •CH2OH radical appeared at 1.9 K, implicating charge transfer from the oxygen lattice holes to methanol molecules, that is, the concerted ET oxidation occurs by releasing H+. At room temperature, the radical becomes rapidly adsorbed formaldehyde, then decomposes to CO2 and H2O where the adsorbed intermediates was revealed from the study with a FTIR spectroscopy [42]. Thus, the oxidation of methanol takes place at the surface of photocatalysts by the direct oxidation. As stated above, in our experiment of detecting OH radicals, indirect oxidation with •OH could occur only when the reactants cannot be adsorbed at the surface [17]. Thus, the Marcus–Gerischer model could not be adoptable in photocatalysis.
In the above discussions, only reactions caused by one-electron transfer at the solid surface were shown. However, there are many reactions caused by the multi-electron transfer. In the case of electrochemistry, since the electrons are supplied continuously from the power source, the ET reaction at OHP may sequentially proceed to generate the multi-ET products. On the other hand, in photocatalysis, since the electron and hole cannot be generated continuously and they should compete before the recombination, the multi-ET reaction cannot take place at OHP. On the other hand, when the single ET products are strongly adsorbed on the photocatalyst surface, it may become the relatively stable intermediate species. In this case, the adsorbed product corresponds to a first step of the multi-step reactions. Thus, the multi-electron photocatalytic reactions take place with the ET adsorption (c) followed by the ET dissolution (d) of Figure 5. For example, the oxidation of H2O2 to O2 can be expressed as the oxidative deposition as •O2− ions and succeeded oxidative dissolution as O2 was suggested [17]. In the water oxidation to produce O2, or oxygen evolution reaction (OER), the intermediate of OH radical has a higher free energy. Then, the adsorption of OH radical, or the formation of the transition metal oxyhydroxides, is required as the stable intermediate [43].
7. Reversible Reactions at Suspended Photocatalytic Particles
As described above, almost all reported photocatalytic reactions are irreversible; however, as exceptional examples, there are some reversible photocatalytic ET reactions. One example may be the reduction of O2, where the reduction product •O2− is relatively stable [17,36], and E0 is very near to the CBM of TiO2. Since the reorganization energy λ for the reversible reduction of O2 is theoretically calculated to be 2.2 eV [44], the transition energy ΔG≠ of •O2− formation is calculated to be 0.43 eV by the Marcus Equation (29). The calculated transition energy is too large to proceed the reaction in OHP, but the reaction barrier may be lowered by the adsorption. Actually, the reduction product •O2− can be stabilized by the adsorption as discussed in our previous report [17]. Since the reversible ET reaction of O2 in photocatalysis takes place in the adsorbed state, the revert process, that is the oxidation of •O2− in solution, may not be observed in the reduction of O2.
Another example of reversible ET reactions in photocatalysis is methylviologen (MV2+), which has been known to provide a stable redox couple (MV2+/MV+•) under an O2-free condition. The MV2+ reagent has been used in many reports, because the extent of the ET reaction can be easily measured by the optical absorption of MV+• in the visible-light region. The reorganization energy of the MV2+ reduction over suspended TiO2 particles was experimentally obtained with kinetic analysis to be λ = 0.3 eV [45]. Since the reorganization energy measured by the electrochemical method was λ = 0.6 eV [46], the smaller λ for particulate photocatalysts is attributable to the limited potential gradient at solid surface as illustrated in Figure 4b.
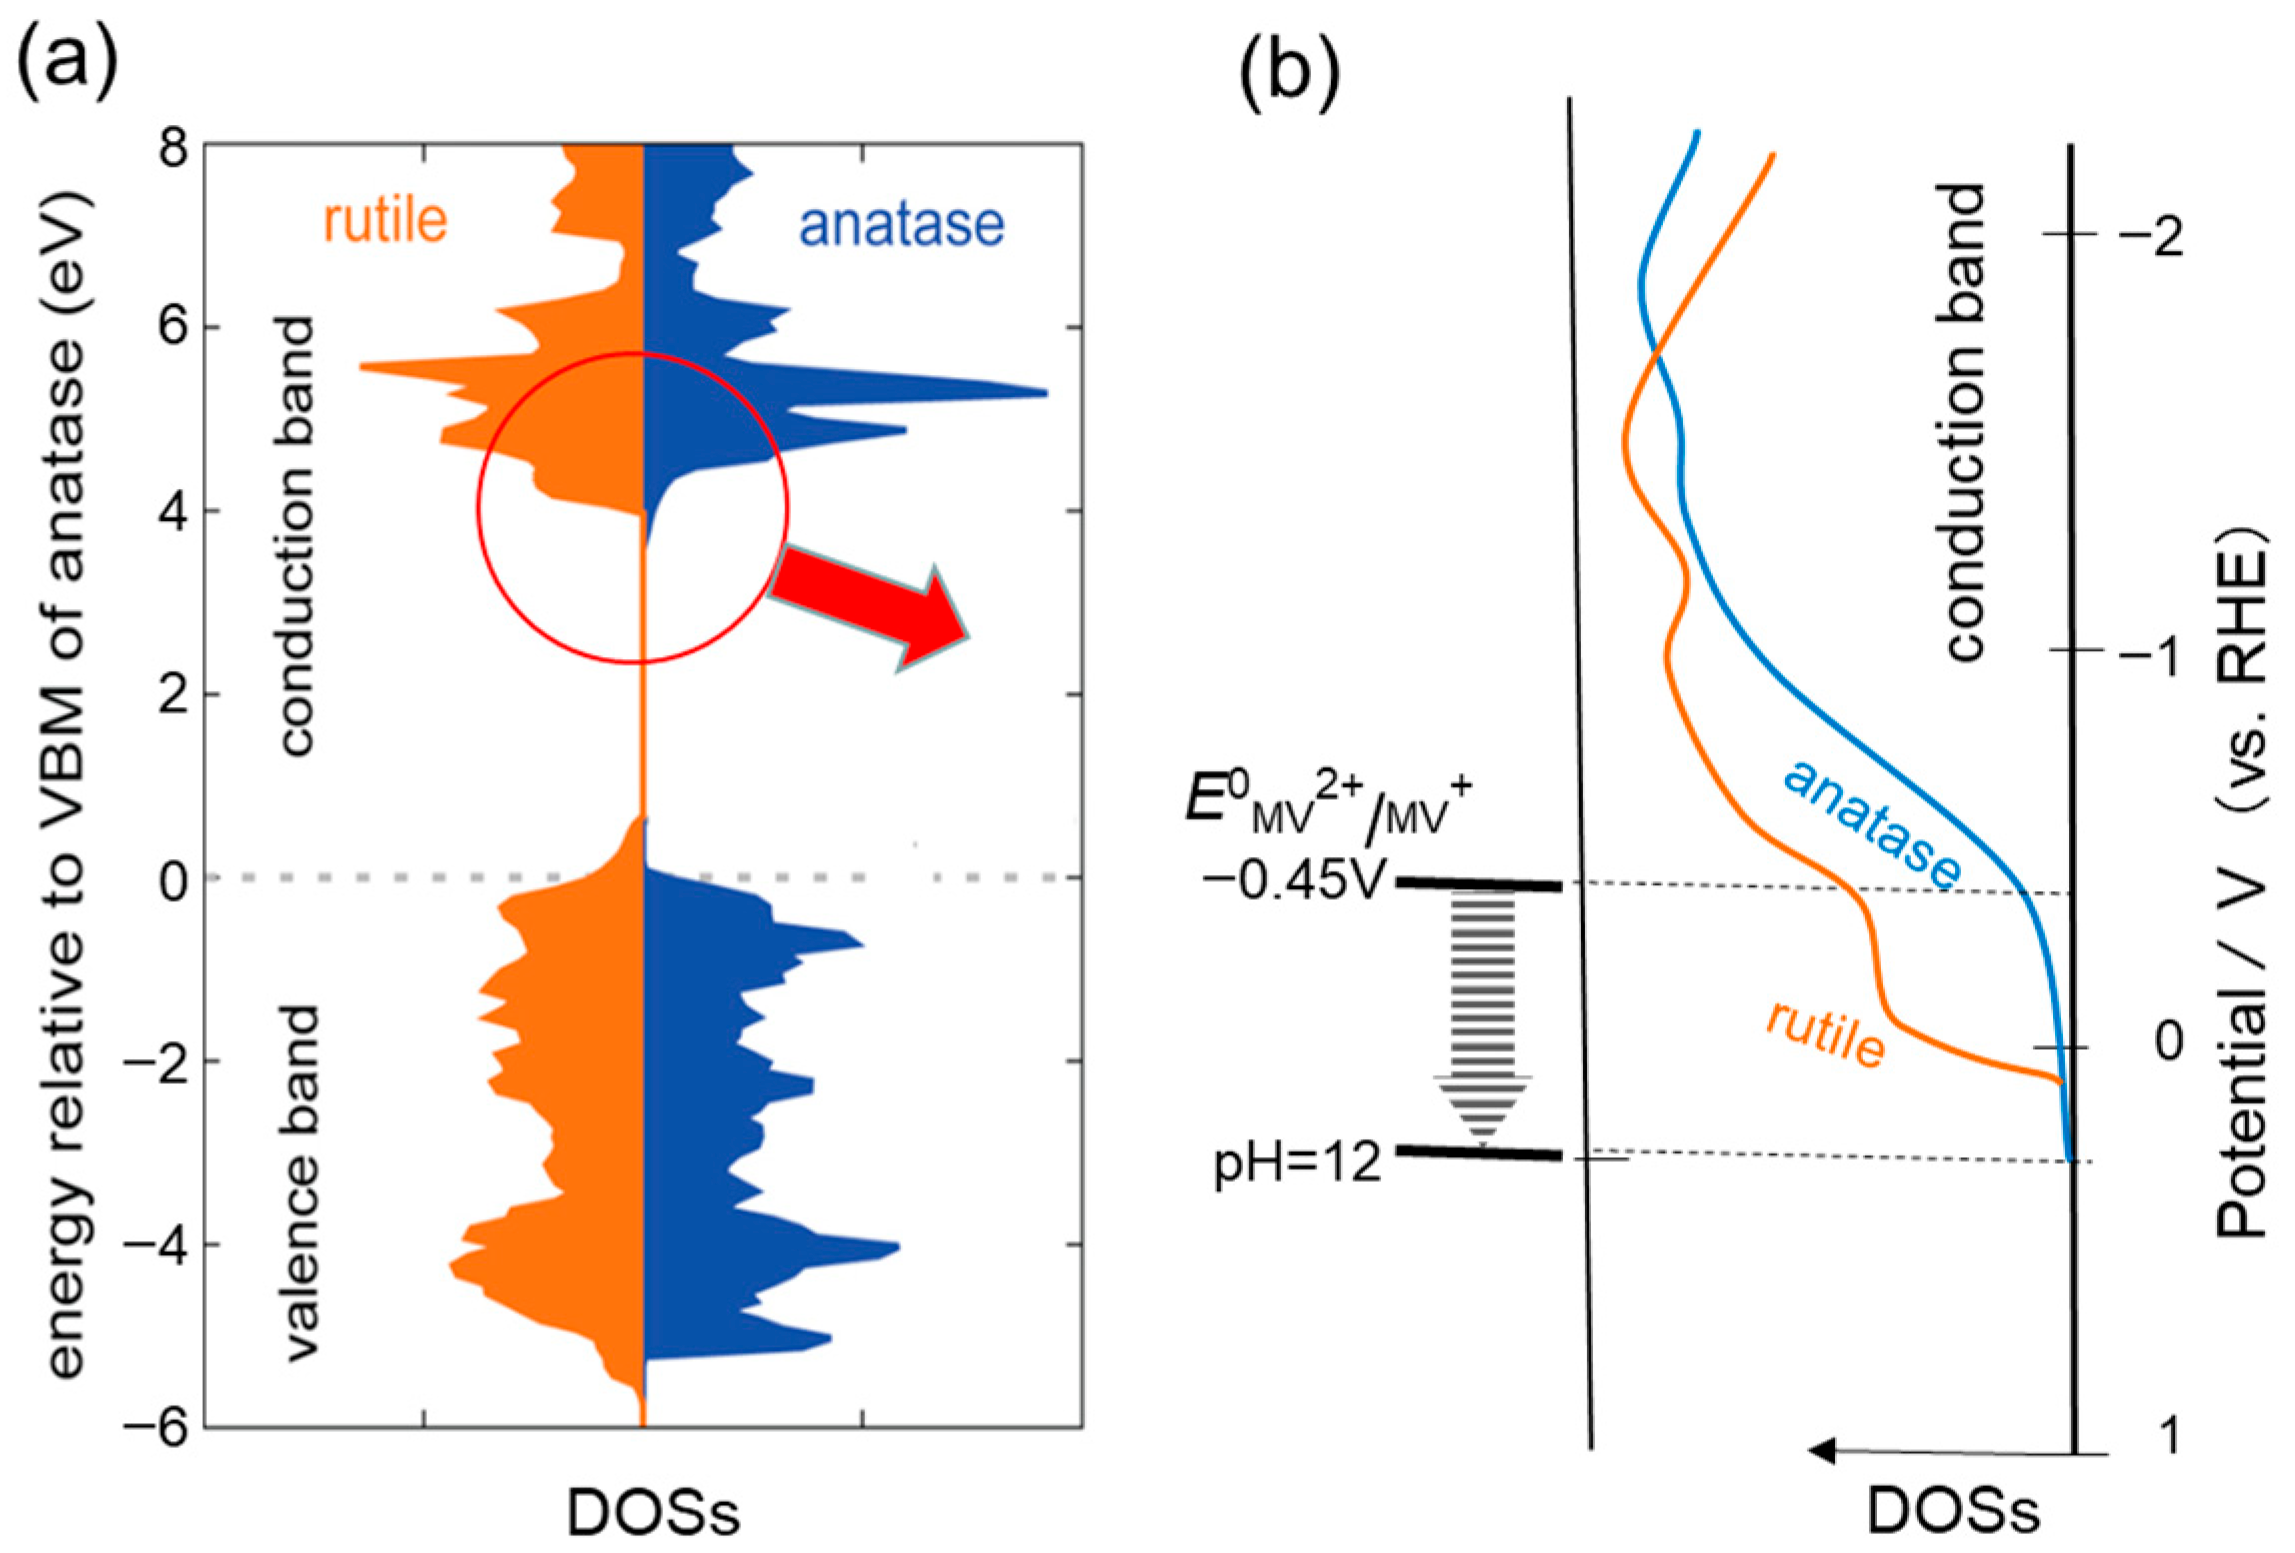
The redox potential of the MV2+/MV+• couple does not depend on the solution pH, while the electronic potential of metal oxides moves up with the solution pH. Therefore, the potential of MV2+/MV+• relative to metal oxides goes down with pH as shown in Figure 10b, where the DOSs of TiO2 are schematically depicted based on the reported DOSs in Figure 10a [47]. Thus, the observation of the pH effect on the reversible MV2+ reduction could be used to investigate the energy levels of metal oxide particles. For colloidal TiO2 particles, the ET of the CB electron to MV2+ was measured by monitoring the increase of MV+• on the pulsed laser excitation. As the result, the flat band potential was reported to be −0.14 V vs. SHE at pH = 0 (or vs. RHE) [45]. By using electrochemical analysis of the produced MV+•, the Fermi levels of TiO2 particles of anatase and rutile particles have been estimated to be −0.04 and +0.04 V (vs. RHE), respectively [48].
Figure 10.
(a) DOSs (density of states) calculated for rutile (brown) and anatase (blue) TiO2. Reproduced from Pfeifer et al. [47]. Copyright 2013 American Chemical Society. (b) Schematic illustration for the DOSs of CB bottom of rutile (brown) and anatase (blue) TiO2 and the redox potential of methyl viologen.
Ikeda et al. measured the number of electrons stored in the suspended TiO2 particle with the sacrificial electron donor, triethanolamine or methanol [49]. The experimental results obtained by the reduction of MV2+ at various pH were reproduced in Figure 11, where the amount of MV+• is shown as the function of pH for (a) rutile and (b) anatase TiO2 particles. The scale of the potential shown in the right side was calculated from the standard potential E0(MV2+/MV+•) = −0.45 V (vs. RHE) with the shift of pH×0.059 V. For the rutile TiO2 particles in Figure 11a, the dashed curve for the amount of MV+• is steep, suggesting that the electrons stored in rutile TiO2 were located at the CBM. On the other hand, for the anatase TiO2 particles in Figure 11b, a half of the stored electrons transfer to MV2+ at pH = 5, and amount of MV+• increases gradually at the higher pH. This means that the energy levels of electrons stored in the CB of anatase extent to the higher potentials from the bottom.
Figure 11.
Amounts of produced MV+• are plotted as a function of the pH of the ET reaction (broken curves), in which electrons were stored in two kinds of TiO2 powders by photocatalytic reactions at pH 11 (□) and pH 2 (■) with a sacrificial electron donor [49]. p(E) is suggested energy distribution of the electrons thermalized at the CBM in (a) rutile (brown curve) and (b) anatase (blue curve), and the blue arrow in (b) corresponds to that E/eV = 3.24 to 3.33 in Table 2. The wide arrows in (a,b) show the flat band potential of each single crystal [50].
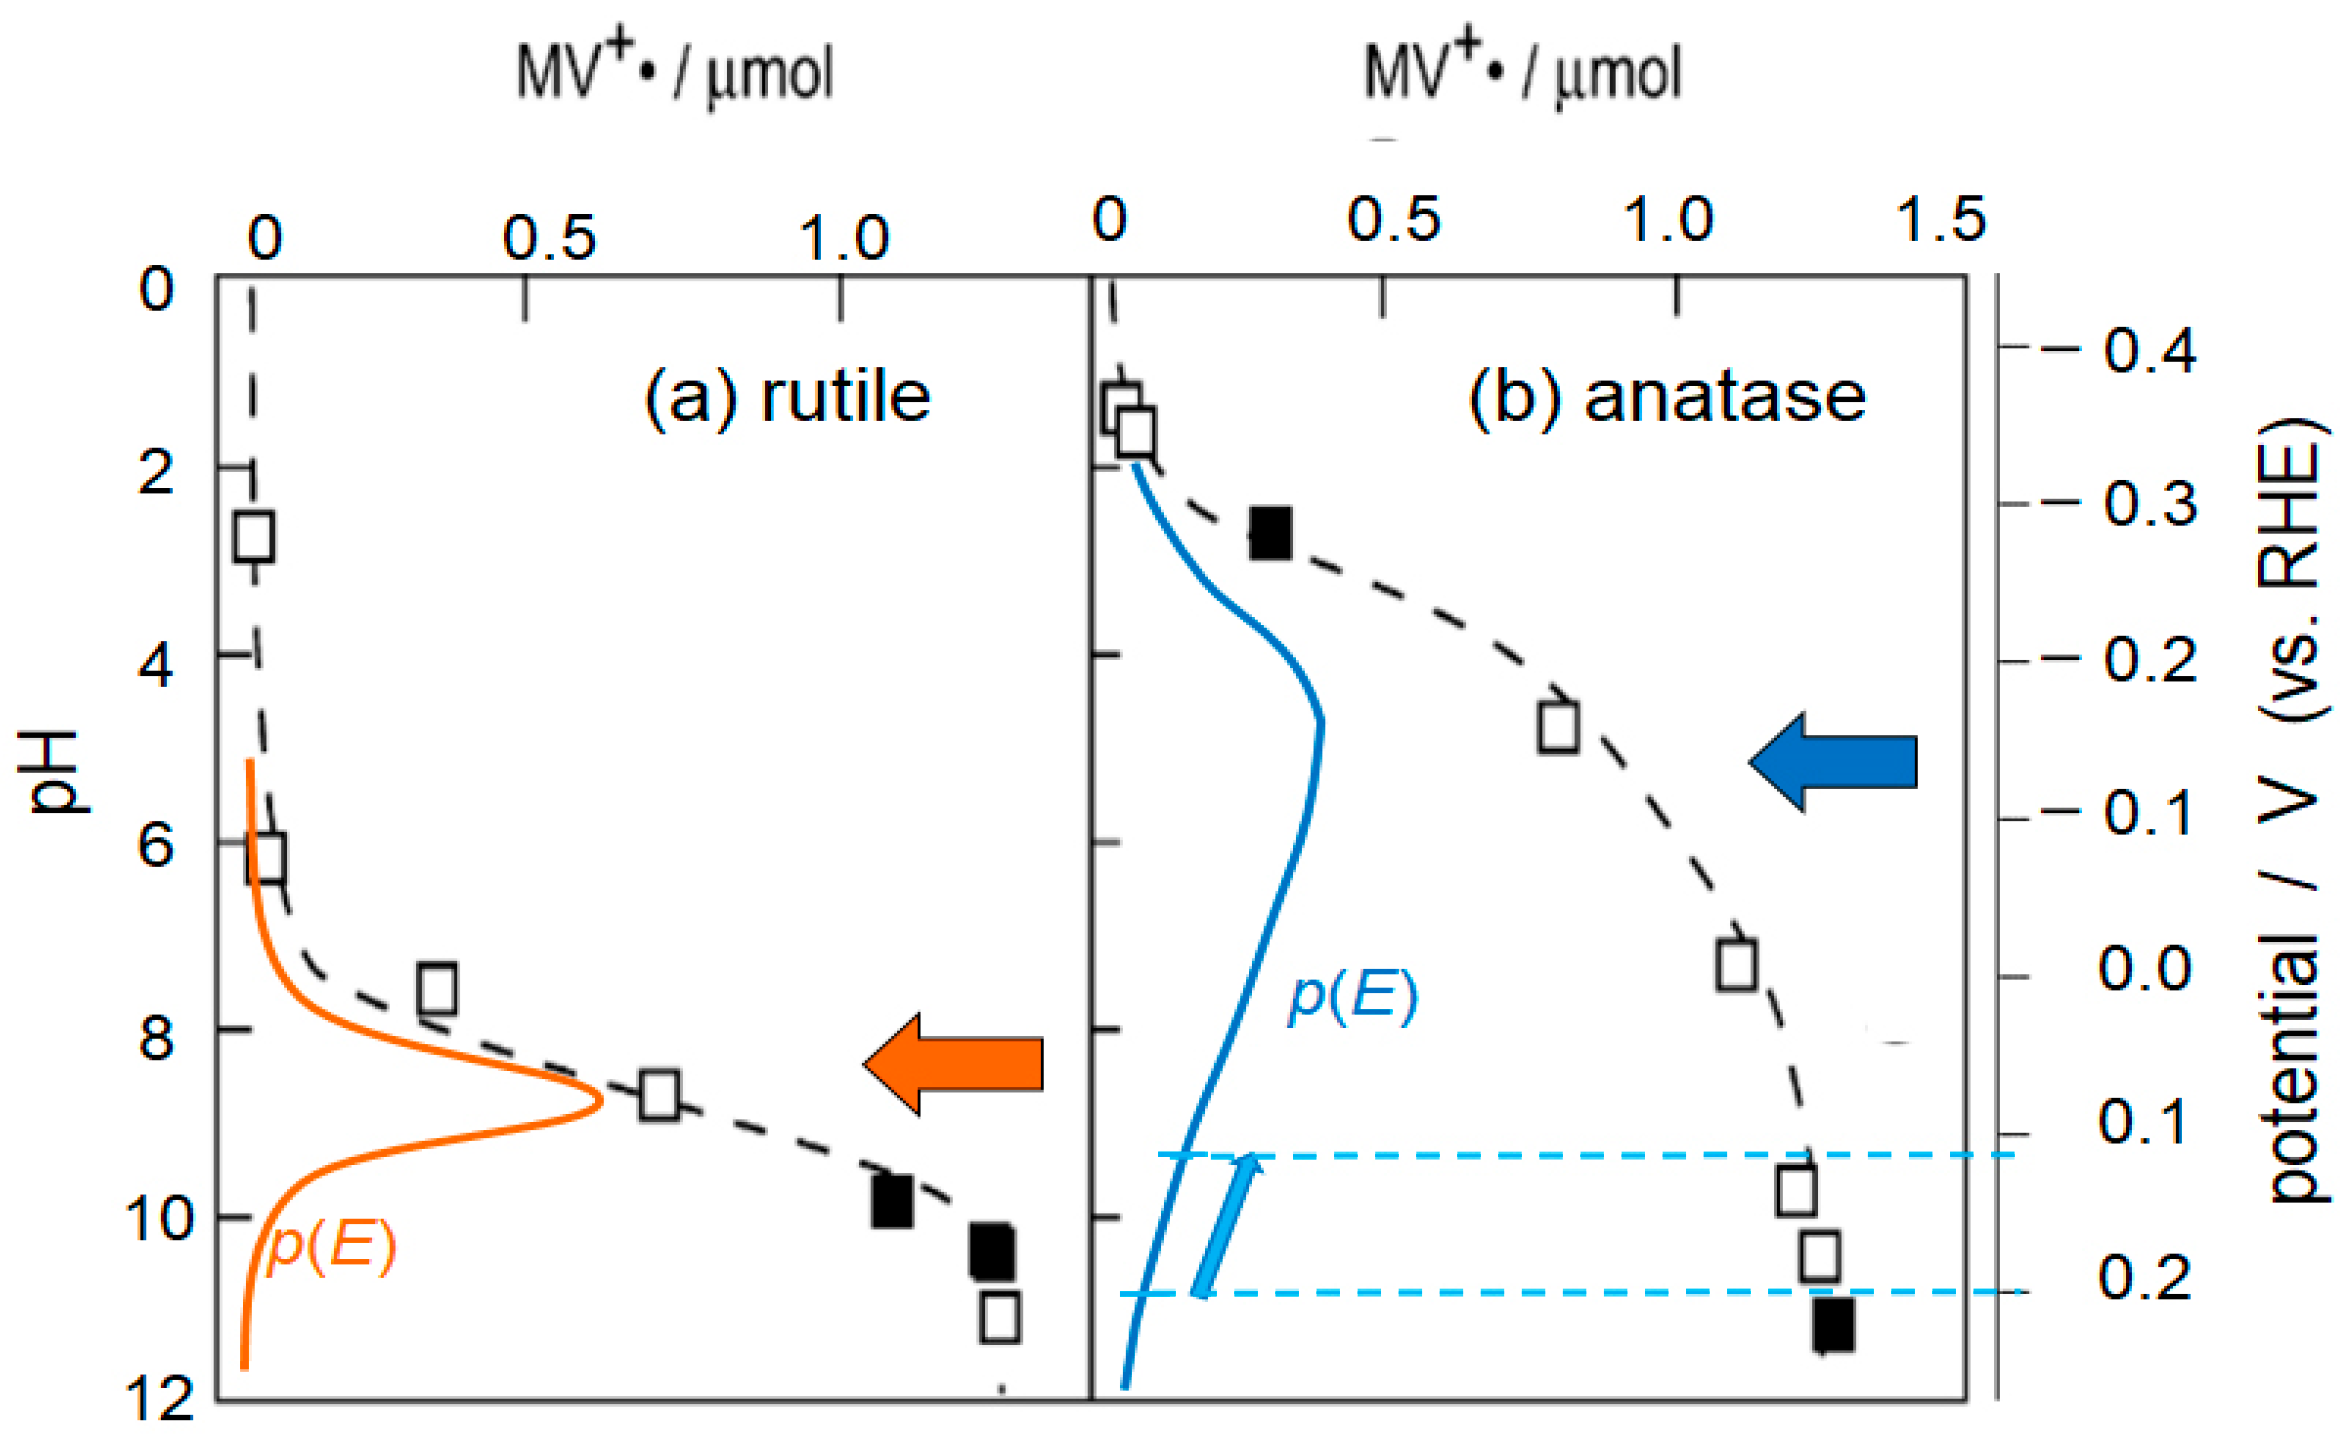
In this experiment, the MV+• was produced by the ET reaction from the electrons having higher energy than the MV2+/MV+• couple at each pH [49]. The colored curves marked p(E) in Figure 11 are the estimated differential of the dashed curves, which correspond to the energy distribution of the electron population. Although this figure was reported as the electrons stored at the defective site of TiO2 crystallites, under thermal equilibrium the electron population near the CBM may reflect the energy distribution obtained experimentally. Actually, the CBM of anatase locates lower than that of rutile as measured by many methods in a vacuum [51]. However, in aqueous solution, the observed flat band potential locates at higher potential as shown by wide arrow in Figure 11b [50]. The slow increase in the amount of MV+• in Figure 11b may concern with the fact that anatase TiO2 is an indirect-transition semiconductor, and the DOSs in Figure 10b show the small extension from the CBM to the higher potential [51,52].
Though the energy dependence of DOSs in Figure 10a was not digitally reported, it may be estimated from the light absorption coefficient. Since anatase TiO2 is an indirect-transition semiconductor, the absorption coefficient α is determined by the DOSs of both CB and VB [53], and the DOSs near the VBM for anatase is steeply increased as shown in Figure 10a. Then, the DOSs near the CBM reflects the absorption spectrum at around the band gap energy. The absorption spectra of anatase single crystal reported are the anisotropic two spectra of log(α) scale showing liner increase with energy [54]. The averaged value for the two anisotropic spectra is shown in Table 2. Thus, the energy distribution of electrons, p(E), under thermal equilibrium can be estimated by Equation (31) with α.
Table 2 indicates that the population p(E) increases to about three times by the increase of the energy by 0.09 eV, indicating that the maximum distribution of electrons locates at the energy higher than at least 3.33 eV.
Table 2.
Absorption coefficient α of anatase TiO2 crystal at energy level E [54] and estimation of DOS.
In order to compare the values in Table 2 with the p(E) curve in Figure 11, the energy level of the anatase VBM should be scaled by electrochemical potential, V vs. RHE. Since the bandgap energy and the averaged flat-band potential of rutile are 3.0 eV and 0.049 V (vs. RHE), respectively [50], the VBM of rutile is 3.049 V (vs. RHE). The VBM of anatase is lower than that of rutile by 0.39 eV [52]; therefore, the VBM of anatase is calculated to be 3.44 (=3.049 + 0.39) V (vs. RHE). This value of VBM is compatible to the recent experimental value of about 3.40 V (vs. RHE) [55]. Thus, using VBM of 3.44 V for anatase, 3.24 and 3.33 eV of energy from VBM in Table 2 are calculated to the potentials of 0.20, and 0.11 V (vs. RHE), respectively, and they are shown with an arrow at the side of p(E) curve in Figure 11b. Thus, at the potential near the flat band of rutile, the thermal distribution of electrons in anatase crystals increases by the rapid increase of DOSs, and the differential of the experimental curve in Figure 11 could be attributable to the energy distribution of electrons.
Flat band potential is usually measured by Mott–Schottky analysis [51], which is based on the electrochemical impedance measurement of potential-dependent capacitance at a semiconductor–electrolyte solution interface and usually it is nearly equal to CBM. The CBM of anatase is lower than that of rutile by 0.19 eV, because the VBM of anatase is lower than that of rutile by 0.39 eV as described above. However, the flat band potential of anatase crystals in aqueous solution is higher than that of rutile crystals [50]. Since the position of work functions of rutile and anatase varied on the environment, the opposite band alignment in aqueous media was explained by the difference in the environment at a semiconductor–electrolyte solution interface [50,51].
The present authors have inspected the band alignment of anatase and rutile TiO2 [56]. In photocatalysis, the rate of O2 reduction of rutile TiO2 powder is higher than that of anatase [17], suggesting that the higher CBM of rutile than that of anatase TiO2 even in aqueous suspension. In the Mott–Schottky analysis in solution, the TiO2 electrode is wired with the power source to measure the small alternating current. In the electrochemical impedance method, the surface ET takes place probably at the potential having max population of electrons as shown in Figure 11b. Therefore, the flat band potentials measured on electrochemical methods become higher than the CBM measured in vacuum where the electrons located at the minimum energy in CB could be directly measured. When electrochemical impedance measurements are performed at very small AC currents, the electrons located at the lower energy could be detected first, and the measured flat band potential may indicate a lower energy. Thus, when the interface resistance was large in the impedance measurements, the electrons located at lower potential may be effectively observed, which may explain the shift of flatband potential in acetonitrile solution [50].
Thus, by using suspended photocatalysts, the precise number of electrons near the CBM can be measured by using the pH-dependence of reversible MV2+ reduction, and the population density p(E) in the thermal equilibrium could be estimated. Furthermore, the differences in the flat band for anatase measured by the Mott–Schottky method in solution is probably explained by the broad distribution of electrons at a higher energy near CBM as illustrated in Figure 11b.
8. Conclusions
Some special characteristics of the reactions in semiconductor photocatalysis are presented in this review. At first, a particle-based kinetic method was presented and applied for the Langmuir–Hinshelwood kinetics to describe the photocatalytic oxidation as a function of both the reactant concentration and the light intensity. Though the analysis was conducted for the first oxidation step, the analytical method could be used for the decomposition of reactant molecules, indicating that the first oxidation at the photocatalyst surface is the rate-determining step in the whole decomposition of the reactant. Importance of photo-intensity dependence on the adsorption equilibrium constant of reactant was emphasized, where the absorption of two photons in one particle was suggested to affect largely the adsorption. Next, the essential difference between photocatalysis and electrochemistry were discussed. In photocatalysis, the first ET reaction should be irreversible to overcome the rapid carrier recombination. The further discussion clarified that the Marcus–Gerischer model, which treats ET kinetics at solid surface, cannot be adoptable in photocatalytic reactions because the ET frequency is so small that one charge transfer takes place with the absorption of one photon in each particle. With these discussions, pointed out was the frequent misuse of Marcus theory as a thermodynamic state density rather than a kinetic rate theory. In the last part of this review, by using the pH-dependence of reversible MV2+ reduction with sacrificial electron donors, it was demonstrated that the thermal distribution in the electron energies located near the CBM could be measured. Further discussion based on the thermal electron distribution indicated that the flat band potential measured by the Mott–Schottky plot with the AC impedance method may indicate a higher energy than CBM for indirect-band semiconductors such as anatase TiO2.
Funding
This research received no external funding.
Data Availability Statement
No new data were created or analyzed in this study. Data sharing is not applicable to this article.
Acknowledgments
The author thanks Atsuko Y. Nosaka for a long term cooperation and the Library of Kyoto University for accessing the literature.
Conflicts of Interest
The authors declare no conflicts of interest.
Abbreviations
The following abbreviations are used in this manuscript:
| ET | Electron transfer |
| L-H | Langmuir–Hinshelwood |
| OHP | Outer Helmholtz plane |
| MV | Methyl viologen |
| DOSs | Density of states |
| RHE | Reversible hydrogen electrode |
| SHE | Standard hydrogen electrode |
| Eg | Band gap energy |
| CB | Conduction band |
| VB | Valence band |
| CBM | Conduction band minimum |
| VBM | Valence band maximum |
References
- Nosaka, Y.; Nosaka, A. Introduction to Photocatalysis—From Basic Science to Applications; Royal Society of Chemistry: Cambridge, UK, 2016. [Google Scholar]
- Schneider, J.; Bahnemann, D.; Ye, J.; Gianluca, L.P.; Dionysiou, D.D. (Eds.) Photocatalysis: Complete Set (Energy and Environment Series); Royal Society of Chemistry: Cambridge, UK, 2016. [Google Scholar]
- Pichat, P. (Ed.) Photocatalysis and Water Purification; Wiley-VCH Verlag GmbH: Weinheim, Germany, 2013. [Google Scholar]
- Palmas, S. New Trends in Photo(electro)catalysis: From Wastewater Treatment to Energy Production. Catalysts 2021, 11, 586. [Google Scholar] [CrossRef] [Scilit]
- Gassan, H.; Rafael, B. (Eds.) Photocatalysis in the Wastewater Treatment; Mdpi AG: Basel, Switzerland, 2025. [Google Scholar]
- Jiménez-López, M.A.; Rubio-Gonzaga, M.C.; Beltrán, F.J. Removal from water of some pharmaceuticals by photolysis and photocatalysis: Kinetic models. Catalysts 2025, 15, 471. [Google Scholar] [CrossRef] [Scilit]
- Wang, Q.; Domen, K. Particulate photocatalysts for light-driven water splitting: Mechanisms, challenges, and design strategies. Chem. Rev. 2020, 120, 919–985. [Google Scholar] [CrossRef] [Scilit]
- Muñoz-Batista, M.J.; Ballari, M.M.; Kubacka, A.; Alfano, O.M.; Fernández-García, M. Braiding kinetics and spectroscopy in photo-catalysis: The spectro-kinetic approach. Chem. Soc. Rev. 2019, 48, 637–682. [Google Scholar] [CrossRef] [Scilit]
- Deng, Y. Developing a Langmuir-type excitation equilibrium equation to describe the effect of light intensity on the kinetics of the photocatalytic oxidation. Chem. Eng. J. 2018, 337, 220–227. [Google Scholar] [CrossRef] [Scilit]
- Minero, C. A critical analysis of kinetic models in photocatalysis and some necessary improvements. Photocatal. Res. Potential 2025, 2, 10020. [Google Scholar] [CrossRef] [Scilit]
- Montoya, J.F.; Velásquez, J.A.; Salvador, P. The direct–indirect kinetic model in photocatalysis: A reanalysis of phenol and formic acid degradation rate dependence on photon flow and concentration in TiO2 aqueous dispersions. Appl. Catal. B Environ. 2009, 88, 50–58. [Google Scholar] [CrossRef] [Scilit]
- Mills, A.; O’Rourke, C. Revised disrupted Langmuir−adsorption model of photocatalysis. J. Phys. Chem. C 2015, 119, 19941–19946. [Google Scholar] [CrossRef] [Scilit]
- Mills, A.; O’Rourke, C.; Moore, K. Powder semiconductor photocatalysis in aqueous solution: An overview of kinetics-based reaction mechanisms. J. Photochem. Photobiol. A Chem. 2015, 310, 66–105. [Google Scholar] [CrossRef] [Scilit]
- Nosaka, Y.; Ohta, N.; Miyama, H. Photochemical kinetics of ultrasmall semiconductor particles in solution: Effect of size on the quantum yield of electron transfer. J. Phys. Chem. 1990, 94, 3752–3755. [Google Scholar] [CrossRef] [Scilit]
- Nosaka, Y.; Nosaka, A.Y. Langmuir-Hinshelwood and light-intensity dependence analyses of photocatalytic oxidation rates by two-dimensional-ladder kinetic simulation. J. Phys. Chem. C 2018, 122, 28748–28756. [Google Scholar] [CrossRef] [Scilit]
- Emeline, A.V.; Ryabchuk, V.; Serpone, N. Factors affecting the efficiency of a photocatalyzed process in aqueous metal-oxide dispersions: Prospect of distinguishing between two kinetic models. J. Photochem. Photobiol. A Chem. 2000, 133, 89–97. [Google Scholar] [CrossRef] [Scilit]
- Nosaka, Y.; Nosaka, A.Y. Generation and detection of reactive oxygen species in photocatalysis. Chem. Rev. 2017, 117, 11302–11336. [Google Scholar] [CrossRef] [Scilit] [PubMed]
- Monllor-Satoca, D.; Gomez, R.; Gonzalez-Hidalgo, M.; Salvador, P. The ‘‘Direct–Indirect’’ model: An alternative kinetic approach in heterogeneous photocatalysis based on the degree of interaction of dissolved pollutant species with the semiconductor surface. Catal. Today 2007, 129, 247–255. [Google Scholar] [CrossRef] [Scilit]
- Montoya, J.F.; Atitar, M.F.; Bahnemann, D.W.; Peral, J.; Salvador, P. Comprehensive kinetic and mechanistic analysis of TiO2 photocatalytic reactions according to the Direct−Indirect model: (II) Experimental validation. J. Phys. Chem. C 2014, 118, 14276–14290. [Google Scholar] [CrossRef] [Scilit]
- Valencia, S.; Catano, F.; Rios, L.; Restrepo, G.; Marin, J. A new kinetic model for heterogeneous photocatalysis with titanium dioxide: Case of non-specific adsorption considering back reaction. Appl. Catal. B Environ. 2011, 104, 300–304. [Google Scholar] [CrossRef] [Scilit]
- Mills, A.; Wang, J.S. The kinetics of semiconductor photocatalysis: Light intensity effects. Z. Phys. Chem. 1999, 213, 49–59. [Google Scholar] [CrossRef] [Scilit]
- Ollis, D.F. Kinetics of liquid phase photocatalyzed reactions: An illuminating approach. J. Phys. Chem. B 2005, 109, 2439–2444. [Google Scholar] [CrossRef] [Scilit] [PubMed]
- Nosaka, Y.; Nosaka, A.Y. Intrinsic nature of photocatalysis by comparing with electrochemistry. Phys. Chem. Chem. Phys. 2020, 22, 7146–7154. [Google Scholar] [CrossRef] [Scilit]
- Bourikas, K.; Kordulis, C.; Lycourghiotisern, A. Titanium dioxide (anatase and rutile): Surface chemistry, liquid−solid interface chemistry, and scientific synthesis of supported catalysts. Chem. Rev. 2014, 114, 9754–9823. [Google Scholar] [CrossRef] [Scilit]
- Bockris, J.O.; Reddy, A.K.N. Modern Electrochemistry; Plenum Press: New York, NY, USA, 1970; pp. 729–730. [Google Scholar]
- Nakato, Y. Electrochemistry. Basic Science for Solar Energy Conversion, 1st ed.; Tokyo Kagaku Dojin: Tokyo, Japan, 2016. [Google Scholar]
- Marcus, R.A. On the theory of electron-transfer reactions. VI. Unified treatment for homogeneous and electrode reactions. J. Chem. Phys. 1965, 43, 679–701. [Google Scholar] [CrossRef] [Scilit]
- Marcus, R.A. Reorganization free energy for electron transfers at liquid-liquid and dielectric simiconductor-liquid interfaces. J. Phys. Chem. 1990, 94, 1050–1055. [Google Scholar] [CrossRef] [Scilit]
- Gerischer, H. Charge transfer processes at semiconductor-electrolyte interface in connection with problems of catalysis. Surf. Sci. 1969, 18, 97–122. [Google Scholar] [CrossRef] [Scilit]
- Villarreal, T.L.; Gómez, R.; González, M.; Salvador, P. A kinetic model for distinguishing between direct and indirect interfacial hole transfer in the heterogeneous photooxidation of dissolved organics on TiO2 nanoparticle suspensions. J. Phys. Chem. B 2004, 108, 20278–20290. [Google Scholar] [CrossRef] [Scilit]
- Tada, H.; Jin, Q.; Kobayashi, H. Prediction of the main route in the TiO2-photocatalyzed degradation of organic compounds in water by density functional calculations. ChemPhysChem 2012, 13, 3457–3461. [Google Scholar] [CrossRef] [Scilit]
- Montoya, J.F.; Peral, J.; Salvador, P. Comprehensive kinetic and mechanistic analysis of TiO2 photocatalytic reactions according to the direct-indirect model: (I) Theoretical approach. J. Phys. Chem. C 2014, 118, 14266–14275. [Google Scholar] [CrossRef] [Scilit]
- Liu, B.; Zhao, X.; Terashima, C.; Fujishima, A.; Nakata, K. Thermodynamic and kinetic analysis of heterogeneous photocatalysis for semicondctor systems. Phys. Chem. Chem. Phys. 2014, 16, 8751–8760. [Google Scholar] [CrossRef] [Scilit]
- Kisch, H. Semiconductor photocatalysis—Mechanistic and synthetic aspect. Angew. Chem. Int. Ed. 2013, 52, 812–847. [Google Scholar] [CrossRef] [Scilit]
- Memming, R. Semiconductor Electrochemistry, 2nd ed.; Wiley-VCH Verlag GmbH: Weinheim, Germany, 2015. [Google Scholar]
- Gerischer, H.; Heller, A. The role of oxygen in photooxidation of organic molecules on semiconductor particles. J. Phys. Chem. 1991, 95, 5261–5267. [Google Scholar] [CrossRef] [Scilit]
- Houmam, A. Electron transfer initiated reactions: Bond formation and bond dissociation. Chem. Rev. 2008, 108, 2180–2237. [Google Scholar] [CrossRef] [Scilit]
- Antonello, S.; Maran, F. The role and relevance of the transfer coefficient α in the study of dissociative electron transfers: Concepts and examples from the electroreduction of perbenzoates. J. Am. Chem. Soc. 1999, 121, 9668–9676. [Google Scholar] [CrossRef] [Scilit]
- Savéant, J.-M. Electron transfer, bond breaking, and bond formation. Adv. Phys. Org. Chem. 2000, 35, 117–192. [Google Scholar] [CrossRef] [Scilit]
- Costentin, C.; Robert, M.; Savéant, J.-M. Stepwise and concerted pathways in thermal and photoinduced electron-transfer/bond-breaking reactions. J. Phys. Chem. A 2000, 104, 7492–7501. [Google Scholar] [CrossRef] [Scilit]
- Micic, O.I.; Zhang, Y.; Cromack, K.R.; Trifunac, A.D.; Thurnauer, M.C. Photoinduced hole transfer from TiO2 to methanol molecules in aqueous solution studied by electron paramagnetic resonance. J. Phys. Chem. 1993, 97, 13284–13288. [Google Scholar] [CrossRef] [Scilit]
- Brownson, J.R.S.; Tejedor-Tejedor, M.I.; Anderson, M.A. FTIR Spectroscopy of alcohol and formate interactions with mesoporous TiO2 surfaces. J. Phys. Chem. B 2006, 110, 12494–12499. [Google Scholar] [CrossRef] [Scilit]
- Nosaka, Y. Molecular mechanisms of oxygen evolution reactions for artificial photosynthesis. Oxygen 2023, 3, 407–451. [Google Scholar] [CrossRef] [Scilit]
- Buda, M. On calculating reorganization energies for electrochemical reactions using density functional theory and continuum solvation models. Electrochim. Acta 2013, 113, 536–549. [Google Scholar] [CrossRef] [Scilit]
- Duonghong, D.; Ramsden, J.; Grätzel, M. Dynamics of interfacial electron-transfer processes in colloidal semiconductor systems. J. Am. Chem. Soc. 1982, 104, 2977–2985. [Google Scholar] [CrossRef] [Scilit]
- Royea, W.J.; Hamann, T.W.; Brunschwig, B.S.; Lewis, N.S. A comparison between interfacial electron-transfer rate constants at metallic and graphite electrodes. J. Phys. Chem. B 2006, 110, 19433–19442. [Google Scholar] [CrossRef] [Scilit]
- Pfeifer, V.; Erhart, P.; Li, S.; Rachut, K.; Morasch, J.; Brotz, J.; Reckers, P.; Mayer, T.; Ruhle, S.; Zaban, A.; et al. Energy band alignment between anatase and rutile TiO2. J. Phys. Chem. Lett. 2013, 4, 4182–4187. [Google Scholar] [CrossRef] [Scilit]
- Di Paola, A.; Bellardita, M.; Ceccato, R.; Palmisano, L.; Parrino, F. Highly active photocatalytic TiO2 powders obtained by thermohydrolysis of TiCl4 in water. J. Phys. Chem. C 2009, 113, 15166–15174. [Google Scholar] [CrossRef] [Scilit]
- Ikeda, S.; Sugiyama, N.; Murakami, S.; Kominami, H.; Kera, Y.; Noguchi, H.; Uosaki, K.; Torimoto, T.; Ohtani, B. Quantitative analysis of defective sites in titanium(IV) oxide photocatalyst powders. Phys. Chem. Chem. Phys. 2003, 5, 778–783. [Google Scholar] [CrossRef] [Scilit]
- Kavan, L. Electrochemistry and band structure of semiconductors (TiO2, SnO2, ZnO): Avoiding pitfalls and textbook errors. J. Solid State Electrochem. 2024, 28, 829–845. [Google Scholar] [CrossRef] [Scilit]
- Mansfeldova, V.; Zlamalova, M.; Tarabkova, H.; Janda, P.; Vorokhta, M.; Piliai, L.; Kavan, L. Work function of TiO2 (anatase, rutile, and brookite) single crystals: Effects of the environment. J. Phys. Chem. C 2021, 125, 1902–1912. [Google Scholar] [CrossRef] [Scilit]
- Scanlon, D.O.; Dunnill, C.W.; Buckeridge, J.; Shevlin, S.A.; Logsdail, A.J.; Woodley, S.M.; Catlow, C.R.A.; Powell, M.J.; Palgrave, R.G.; Parkin, I.P.; et al. Band alignment of rutile and anatase TiO2. Nat. Mater. 2013, 12, 798–801. [Google Scholar] [CrossRef] [Scilit]
- Kudo, K. Optical Properties of Materials; Ohm-sha: Tokyo, Japan, 1977; pp. 181–184. [Google Scholar]
- Tang, H.; Berger, H.; Schmid, P.E.; Lévy, F. Optical properties of anatase (TiO2). Solid State Commun. 1994, 92, 267–271. [Google Scholar] [CrossRef] [Scilit]
- Lee, S.F.; Jimenez-Relinque, E.; Martinez, I.; Castellote, M. Effects of Mott–Schottky frequency selection and other controlling factors on flat-band potential and band-edge position determination of TiO2. Catalysts 2023, 13, 1000. [Google Scholar] [CrossRef] [Scilit]
- Nosaka, Y.; Nosaka, A.Y. Reconsideration of intrinsic band alignments within anatase and rutile TiO2. J. Phys. Chem. Lett. 2016, 7, 431–434. [Google Scholar] [CrossRef] [Scilit]

Disclaimer/Publisher’s Note: The statements, opinions and data contained in all publications are solely those of the individual author(s) and contributor(s) and not of MDPI and/or the editor(s). MDPI and/or the editor(s) disclaim responsibility for any injury to people or property resulting from any ideas, methods, instructions or products referred to in the content. |
© 2026 by the author. Licensee MDPI, Basel, Switzerland. This article is an open access article distributed under the terms and conditions of the Creative Commons Attribution (CC BY) license.