


Abstract
Cerium oxide (CeO2) is a key rare-earth material for catalysis and energy applications, yet quantitative links between synthesis parameters, morphology, and defect chemistry remain scarce. Using three selected conditions from a broader synthesis matrix with octadecylamine (ODA) concentration (0.01–0.2 M) and ethanol/water ratio (α = 0.3–3.0), we obtained three distinct morphologies: spherulites (CeO2-AA), short nanorods (CeO2-BB), and long rods (CeO2-MM). CeO2-BB nanorods exhibit the highest BET surface area (79.9 m2/g), Ce3+ content (30.2%), and Odef/Olat ratio (0.99), while CeO2-MM shows an Odef/Olat ratio of 0.80. A controlled comparison with commercial 25 nm CeO2 (similar crystallite size, 21.3 nm, but 60× lower microstrain) reveals that, within the investigated sample set, microstrain and defect-related disorder are the dominant contributors to Raman F2g broadening, rather than phonon confinement. The ID/IF2g ratio correlates strongly with Ce3+ content (R2 = 0.94), supporting Raman as a sensitive indicator of defect-related disorder or oxygen-vacancy-associated defects. Qualitative inspection of the data suggests that ODA concentration has a more pronounced influence on aspect ratio, Ce3+ content, and bandgap than the ethanol/water ratio, although the limited number of synthesis conditions precludes definitive statistical ranking. This integrated framework enables rational design of CeO2 nanostructures with tailored defect chemistry for catalysis and rare-earth-based applications.
1. Introduction
Cerium oxide (CeO2, ceria) is a versatile functional material central to heterogeneous catalysis [1,2], energy storage/conversion [3,4], biomedicine [5,6], and environmental remediation [7,8]. Its technological importance stems from the reversible Ce3+/Ce4+ redox couple, high oxygen storage capacity, ability to form/annihilate oxygen vacancies without structural collapse, and tunable electronic structure [9,10]. The oxygen vacancies in CeO2 play a crucial role in its catalytic performance. For instance, ceria-supported Ru0-Ru+ clusters have been shown to be efficient catalysts for arene hydrogenation [11], and CeO2 nanostructure/carbon composites have demonstrated enhanced performance in wastewater treatment [12]. The concentration and distribution of oxygen vacancies directly influence the redox properties of ceria, which are central to its activity in oxidation reactions, oxygen storage, and photocatalysis. Consequently, CeO2 is indispensable in three-way catalysts [13], fuel cell electrolytes [14], oxygen sensors [15], and noble metal supports [16,17].
At the nanoscale, CeO2 properties diverge significantly from the bulk [18,19]. Beyond size effects, morphology governs surface energies and reactivities because different crystal facets are exposed [20,21,22,23]. Anisotropic shapes expose specific facets preferentially, leading to facet-dependent catalytic activity [24,25]. For instance, CeO2 nanocubes (100-rich) show superior oxygen storage capacity over nanorods (110/100-rich) and octahedra (111-rich) [26,27,28], whereas nanorods exhibit enhanced CO oxidation due to higher surface Ce3+ [25].
Despite extensive research, systematic studies linking synthesis parameters to morphology and properties are scarce. Most reports rely on qualitative trends or single-parameter variations [29,30]. Factorial designs that identify dominant parameters and enable quantitative property prediction are rare in the context of CeO2 morphology control [31,32,33], although more recent studies have applied similar statistical approaches to optimize other ceria-based materials [34]. Moreover, Raman interpretation remains contentious: phonon confinement is widely invoked to explain F2g broadening [35,36], but recent evidence suggests that microstrain and defect-induced effects dominate in defective samples [37,38,39]. Disentangling size from strain requires controlled comparisons of similar-sized particles with different microstructural quality–such comparisons are rarely reported.
Here, we selected three conditions from a 32 synthesis matrix varying ODA concentration and ethanol/water ratio to produce three distinct CeO2 morphologies: spherulites, short nanorods, and long rods. A suite of complementary characterization and data analysis techniques is integrated to establish quantitative synthesis–property relationships: X-ray diffraction (XRD) with Rietveld/FullProf refinement, Raman spectroscopy, X-ray photoelectron spectroscopy (XPS), transmission electron microscopy (TEM), Brunauer–Emmett–Teller (BET) surface area analysis, UV–visible diffuse reflectance spectroscopy (UV-Vis DRS), Fourier-transform infrared spectroscopy (FT-IR), principal component analysis (PCA), and statistical modeling. Two commercial references (25 nm and 5 μm) serve as benchmarks. While ODA-mediated synthesis of CeO2 nanorods and the effect of ethanol/water ratio on morphology have been previously reported [30,31], the quantitative link between synthesis parameters, microstrain, and oxygen-vacancy-related defect chemistry has not been systematically established. This work addresses this gap by: (i) using a controlled comparison of similar-sized particles with vastly different microstructural quality to disentangle the effects of crystallite size and microstrain on Raman F2g broadening; (ii) establishing quantitative correlations between synthesis parameters (ODA concentration and ethanol/water ratio) and defect-related properties (Ce3+ content, Odef/Olat ratio, and bandgap); and (iii) proposing the Urbach energy as a more robust descriptor of structural disorder than simple linear models based on Ce3+ and microstrain alone. A key finding is that, within the investigated sample set, microstrain and defect-related disorder are the dominant contributors to Raman F2g broadening, rather than phonon confinement. These findings provide a quantitative framework for designing CeO2 nanostructures with tailored defect chemistry for catalysis and energy applications.
2. Materials and Methods
All reagents were purchased from commercial suppliers (Sigma-Aldrich, St. Louis, MO, USA; J.T. Baker, Phillipsburg, NJ, USA) and used as received. Cerium (III) nitrate hexahydrate (Ce(NO3)3·6H2O, 99.0%, Sigma-Aldrich), octadecylamine (ODA, 97%, Sigma-Aldrich), sodium hydroxide (NaOH, 98%, J.T. Baker), absolute ethanol (99.9%, J.T. Baker), and deionized water (18.2 MΩ·cm) were used without further purification. Commercial CeO2 references (25 nm and 5 μm, Sigma-Aldrich) were used for comparison.
2.1. Synthesis of CeO2 Nanostructures
CeO2 nanostructures were synthesized via a surfactant-mediated solvothermal method adapted from previously reported procedures [30,31]. A 32 synthesis matrix was designed with octadecylamine (ODA) concentration (0.01, 0.05, and 0.2 M) and ethanol/water volume ratio (α = 0.3, 1.0, and 3.0) as the two factors. The nine experimental conditions are summarized in Table S1 (Supporting Information). From this matrix, three representative conditions were selected for detailed characterization because they bracket the extreme morphologies: CeO2-AA (spherulites, high ODA/high EtOH), CeO2-BB (short nanorods, intermediate ODA/intermediate EtOH), and CeO2-MM (long nanorods, low ODA/low EtOH).
The selection of ODA concentration and ethanol/water ratio as the two factors was based on their well-documented influence on CeO2 morphology [30,31]. ODA acts as a structure-directing agent by preferentially adsorbing on specific crystal facets, while the ethanol/water ratio controls the dielectric constant of the solvent, which in turn affects the hydrolysis and condensation kinetics of cerium precursors. Other parameters (temperature, time, pH) were fixed based on preliminary optimization experiments and previous reports [30,31] to isolate the effects of the two main factors.
In a typical synthesis, Ce(NO3)3·6H2O (2.17 g, 5 mmol) was dissolved in a mixture of ethanol and water (total volume 50 mL) at the specified α ratio. ODA was added at the desired concentration, and the mixture was stirred at 60 °C for 30 min to ensure complete dissolution. NaOH solution (1 M, 15 mL, corresponding to a Ce:OH molar ratio of 1:3) was added dropwise under vigorous stirring (500 rpm) over 10 min. The Ce:ODA molar ratio of 1:3 was selected based on preliminary optimization experiments and previous reports [30,31], which demonstrated that this ratio ensures complete cerium complexation and precipitation while avoiding excessive surfactant that would hinder hydrothermal crystallization. At Ce:ODA ratios below 1:2, incomplete precipitation led to isolated product yields below 60%, while ratios above 1:4 did not further improve morphological control and introduced unnecessary organic waste that required more extensive washing and calcination. The pH of the precursor suspension was measured before and after the addition of NaOH using a calibrated pH meter. The final pH varied systematically with the synthesis conditions: pH values ranged from 11.8 ± 0.1 (high EtOH, low ODA) to 13.2 ± 0.1 (low EtOH, high ODA), as detailed in Table S1. This variation arises from the combined effects of ODA hydrolysis (which raises pH through amine protonation) and the ethanol/water ratio (which affects the dielectric constant and thus the dissociation of Ce(OH)3). Higher ODA concentrations and lower EtOH fractions yielded systematically higher pH values.
The resulting suspension was transferred to a Teflon-lined stainless-steel autoclave (100 mL capacity) and heated at 180 °C for 24 h without stirring. After cooling to room temperature, the suspension was aged for 30 min, then the precipitate was collected by centrifugation (8000 rpm, 10 min), washed three times with 30 mL of ethanol/water (1:1 v/v), and dried at 80 °C for 12 h in air. The dried powder was calcined at 500 °C for 2 h (heating rate 5 °C/min) in air using a muffle furnace with a sample loading of approximately 0.5 g in an alumina crucible, to remove residual organics and crystallize the CeO2 phase. The typical cerium-based yield was approximately 85%.
Three representative conditions were selected for detailed characterization: CeO2-AA (spherulites): 0.2 M ODA, α = 3.0; CeO2-BB (short nanorods): 0.05 M ODA, α = 1.0; and CeO2-MM (long rods): 0.01 M ODA, α = 0.3. Each synthesis was performed in triplicate to assess reproducibility. The intermediate synthesis conditions yielded mixed or transitional morphologies that fall between these three archetypes. By focusing on these morphological extremes, we establish a clear synthesis–property map that brackets the range of achievable structures. The synthesis parameters and the correspondence between expected and observed morphologies are summarized in Table S1.
2.2. Characterization
Powder samples were loaded onto a flat zero-background silicon holder. XRD patterns were collected on a Panalytical X’Pert PRO diffractometer (Malvern Panalytical, Almelo, The Netherlands) with Cu Kα radiation (λ = 1.5406 Å) in the 2θ range of 20–80°, step size 0.02°, counting time 2 s per step. The instrumental resolution function was determined using a well-crystallized CeO2 reference (5 μm, Sigma-Aldrich, St. Louis, MO, USA) with negligible microstrain, measured under identical conditions and fitted with a pseudo-Voigt function. Rietveld refinement was performed using the FullProf Suite software (version 2019, Institut Laue-Langevin, Grenoble, France) [40] with the fluorite structure (space group Fmm, ICSD #28,753) as the starting model. The crystallite size (D) and microstrain (ε) were extracted from the refined profile parameters using the integral breadth method (double-Voigt approach). The dislocation density (ρ) was calculated using the formula: ρ = (2√3·ε)/(b·D), where b is the magnitude of the Burgers vector. For CeO2 with a fluorite structure, the dominant dislocation type is a/2⟨110⟩ on {100} planes, yielding b = a√2/2 ≈ 3.83 Å (where a = 5.411 Å is the lattice parameter) [41,42]. This expression assumes a homogeneous isotropic distribution of dislocations and is commonly used in Williamson–Smallman-type analyses [41,43].
Raman spectra were acquired using a Thermo Scientific DXR3 SmartRaman spectrometer (Thermo Fisher Scientific, Waltham, MA, USA) equipped with a 532 nm laser (5 mW), 2 cm−1 resolution, 30 s acquisition time, and 10 accumulations. Spectra were collected in the range of 200–800 cm−1. Spectral deconvolution was performed using pseudo-Voigt functions (weighted sums of Lorentzian and Gaussian profiles) in the OriginPro 2021 software (OriginLab, Northampton, MA, USA). The F2g mode (~465 cm−1) and defect-induced D band (~590 cm−1) were fitted with constraints on the peak positions (±5 cm−1) and full width at half maximum (FWHM, 5–50 cm−1). The D band is attributed to oxygen vacancies [44,45].
XPS analysis was performed using a SPECS system (SPECS GmbH, Berlin, Germany) equipped with a PHOIBOS 150 hemispherical analyzer (SPECS Surface Nano Analysis GmbH, Berlin, Germany) and a monochromatic Al Kα X-ray source (1486.6 eV, 300 W). Survey spectra (0–1350 eV) and high-resolution Ce 3d, O 1s, and C 1s spectra were acquired with pass energies of 200 eV and 50 eV, respectively. Spectra were calibrated to the adventitious C 1s peak at 284.8 eV. Ce3+ quantification was performed using the method described by Burroughs et al. [46], which deconvolutes the Ce 3d spectrum into 10 peaks (6 for Ce4+: u, u″, u‴, v, v″, v‴; 4 for Ce3+: u, u′, v, v′). The Ce3+ fraction was calculated as Ce3+/(Ce3+ + Ce4+) = [A(u) + A(u′) + A(v) + A(v′)]/[total area of all Ce 3d peaks], after Shirley background subtraction and Gaussian-Lorentzian (70:30) fitting. The O 1s spectra were deconvoluted into three components corresponding to lattice oxygen (Olat, ~529.3 eV), oxygen vacancies/defective oxygen (Odef, ~531.5 eV), and adsorbed oxygen species (Oads, ~532.8 eV), following established assignments [47].
Bright-field TEM images were acquired using a JEOL JEM-2200FS microscope (JEOL Ltd., Tokyo, Japan) operated at 200 kV, with a Cs corrector, in STEM mode. Samples were dispersed in ethanol by ultrasonication and drop-cast onto lacy carbon-coated copper grids (Ted Pella, Redding, CA, USA). Particle size distributions were determined by measuring 200–300 particles per sample using the ImageJ software (version 1.52k, National Institutes of Health, Bethesda, MD, USA). The width (W) and length (L) of individual particles were recorded; for spherulites (CeO2-AA) the “diameter” was taken as the average of two perpendicular Feret diameters. The aspect ratio (AR) was calculated as L/W.
N2 adsorption–desorption isotherms were measured at 77 K using an Autosorb® iQ analyzer (Quantachrome Instruments, Boynton Beach, FL, USA). Prior to measurement, samples were degassed at 200 °C for 4 h under vacuum (<10 μm Hg). Isotherms were collected over a relative pressure range P/P0 = 0.01–0.99 using high-purity N2 (99.99%). The BET surface area was calculated from the linear region of the BET plot (0.05 < P/P0 < 0.30). The total pore volume was determined at P/P0 = 0.99. Pore size distributions were calculated using the Barrett–Joyner–Halenda (BJH) method applied to the desorption branch [48,49]. Micropore analysis was performed using the t-plot method with the Harkins–Jura thickness equation [50] and the Dubinin–Radushkevich (DR) equation [51].
Diffuse reflectance spectra were recorded on a Cary 100 spectrophotometer (Agilent Technologies, Santa Clara, CA, USA) equipped with a Labsphere DRA-CA-30 integrating sphere (Labsphere, North Sutton, NH, USA) over the range of 200–800 nm. Spectralon® (Labsphere, North Sutton, NH, USA) was used as the reflectance standard. Reflectance data were converted to absorption using the Kubelka–Munk function: F(R) = (1 − R)2/(2R), where R is the reflectance. Optical bandgaps (Eg) were determined from Tauc plots for both direct and indirect allowed transitions: [F(R)·hν]1/2 for direct and F(R)·hν]2 for indirect transitions, as a function of photon energy hν [52]. Linear regression was performed using weighted least squares with sliding window R2-maximization. Urbach energies (Eu) were extracted from the exponential absorption tail below the bandgap by fitting ln[F(R)] vs. hν to the Urbach relation, F(R) = F0 exp[(hν − E0)/Eu], where E0 is the reference energy [53].
FT-IR spectra were recorded using a PerkinElmer Spectrum 100 spectrometer (PerkinElmer, Waltham, MA, USA) equipped with an attenuated total reflectance (ATR) module featuring a diamond crystal. Spectra were collected in the range of 650–4000 cm−1 at a resolution of 4 cm−1, with 32 scans. A linear baseline correction was applied to each spectrum. All spectra were then normalized to the total integrated area between 650 and 4000 cm−1. This normalization corrects for variations in sample thickness and crystal contact, which are the dominant sources of non-chemical variability in ATR measurements of loose powders, and provides a consistent basis for comparing relative spectral profiles among samples. Because no invariant internal reference band is available in this system, the normalized values are interpreted as relative rather than absolute surface concentrations. Five spectral regions were analyzed: O–H stretching (3000–3700 cm−1), H–O–H bending (1600–1650 cm−1), C–H stretching (2800–3000 cm−1), high-wavenumber carbonates (1500–1550 cm−1, ν3 asymmetric), and low-wavenumber carbonates (1350–1450 cm−1, ν3 symmetric). Integrated areas for each region were calculated using the trapezoidal rule for each of the three replicates per morphology.
Statistical analysis: For each of the five samples (CeO2-AA, CeO2-BB, CeO2-MM, and the two commercial references), data from the three synthesis replicates were analyzed using Python 3.9 (pandas, NumPy, SciPy, statsmodels, and scikit-learn; Python Software Foundation, Wilmington, DE, USA). No outliers were removed—all measured particles were retained to preserve the natural variability of the solvothermal synthesis. Descriptive statistics (mean, standard deviation SD, and coefficient of variation CV) were calculated. Using normality and homoscedasticity were assessed using the Shapiro–Wilk and Levene’s tests, respectively. Non-normally distributed data were compared using the Kruskal–Wallis test with Dunn’s post hoc test (Bonferroni correction). Effect sizes were estimated using Cohen’s d. Spearman correlation (ρ) evaluated bivariate relationships. Multiple linear regression (with residual and variance inflation factor VIF checks) modeled the effects of ODA concentration and ethanol/water ratio α on aspect ratio, Ce3+ content, and bandgap using replicate averages. One-way ANOVA followed by Tukey’s honestly significant difference (HSD) test identified significant differences among morphologies (significance level α = 0.05). PCA was performed on the normalized 12-variable dataset. All tests were two-tailed, with p < 0.05 considered statistically significant.
Given the limited number of synthesis conditions (n = 3), the statistical analyses presented here are exploratory. Regression models with n = 3 are illustrative and should not be interpreted as quantitative predictive models. The three selected conditions bracket the extreme morphologies; intermediate conditions yielded mixed morphologies that were not suitable for establishing clear structure–property relationships.
3. Results
3.1. X-Ray Diffraction
3.1.1. Phase Identification and Crystallite Size
All synthesized samples exhibited the characteristic fluorite structure of CeO2 (space group Fmm) with no detectable impurity phases. Figure 1a shows the diffraction peaks corresponding to the (111), (200), (220), (311), (222), (400), (331), and (420) reflections, consistent with ICSD #28,753. A representative Rietveld refinement (CeO2-BB) is presented in Figure 1b, and the quality of the fits for all samples is documented in Figure S1. The refinement quality was excellent for all samples (χ2 = 1.27–1.42, Rwp = 7.5–9.1%), indicating reliable microstructural parameters (see Table 1). Crystallite sizes ranged from 18.6 nm (CeO2-AA) to 26.4 nm (CeO2-MM). The commercial 25 nm reference had a crystallite size of 21.3 nm, nearly identical to that of CeO2-BB (21.4 nm). This size similarity is crucial for isolating the effects of microstrain on Raman broadening (Section 4.2). As shown in Figure 1c, the (111) and (200) peaks exhibit evident broadening and a slight shift to lower angles, indicating the presence of microstrain.
Figure 1.
(a) XRD patterns of all samples (vertically shifted). Bottom ticks mark reference peak positions (hkl). (b) Rietveld refinement of CeO2-BB sample. (c) Enlarged view of the (111) and (200) peaks showing broadening and shift due to microstrain. Intensities normalized.
Table 1.
Rietveld refinement parameters and microstructural properties from XRD patterns.
3.1.2. Microstrain and Dislocation Density
The microstrain varied considerably: CeO2-BB exhibited the highest value (ε = 79.7 × 10⁻⁴), followed by CeO2-MM (59.4 × 10⁻⁴) and CeO2-AA (20.3 × 10⁻⁴)—trends that correlate directly with the peak broadening observed in Figure 1c. Despite the similar crystallite size, the commercial 25 nm reference showed a much lower microstrain (ε = 1.4 × 10⁻⁴), nearly 60 times smaller than that of CeO2-BB. The dislocation density followed the same trend: CeO2-BB (ρ = 23.5 × 10¹⁴ m−2) was more than 300 times higher than the commercial reference (0.07 × 10¹⁴ m−2). The lattice parameters (a = 5.4106–5.4118 Å) were slightly expanded relative to bulk CeO2 (5.4113 Å, ICSD #28,753), consistent with the presence of oxygen vacancies and Ce3+ ions (larger ionic radius: Ce3+ = 1.14 Å vs. Ce4+ = 0.97 Å in 8-fold coordination) [54,55]. The lattice expansion was most pronounced for CeO2-BB (5.4118 Å), correlating with its highest Ce3+ content (Section 3.3).
3.2. Raman Spectroscopy
3.2.1. F2g Mode Position and FWHM
Figure 2a displays the Raman spectra of all samples. The characteristic F2g mode of fluorite CeO2 appeared at ~465 cm−1, confirming phase purity. All synthesized samples exhibited a defect-induced band (550–650 cm−1) attributed to oxygen vacancies. A representative Lorentzian deconvolution for CeO2-BB is shown in Figure 2b, revealing the F2g and D band components. The fitted parameters for all samples are listed in Table 2. The F2g position ranged from 461.6 cm−1 (CeO2-BB) to 465.4 cm−1 (CeO2-25 nm). Relative to bulk CeO2 (465.3 cm−1), CeO2-AA showed a slight redshift (465.2 cm−1), whereas CeO2-BB exhibited a more pronounced redshift (461.6 cm−1), suggesting a significant lattice expansion (tensile strain). The FWHM of the F2g mode varied from 10.2 cm−1 (bulk) to 23.3 cm−1 (CeO2-MM); the commercial 25 nm nanoparticles had an intermediate value of 11.3 cm−1 (Figure S2).
Figure 2.
(a) Raman spectra of all samples (peak form ~465 cm−1) and (b) Lorentzian fit of the F2g mode for the CeO2-BB sample (red line) overlaid on experimental data (blue circles). (c) Normalized bar chart comparing microstructural parameters: D, ε, ρ, FWHMF2g, and ID/IF2g. Values are normalized to the range [0, 1] for visualization; absolute values are given in Table 1, Table 2, Table 3, Table 4, Table 5, Table 6 and Table 7. (d) Correlation between ID/IF2g (scaled by ×10−2) vs. ε (left) and ρ (right).
Table 2.
Quantitative Raman parameters obtained from Lorentzian–Voigt deconvolution.
3.2.2. Defect Band
A broad defect-induced D-band appeared at ~590 cm−1 in all synthesized samples (Figure 2a). Table 2 lists the ID/IF2g intensity ratios. The ratio was highest for CeO2-MM (0.067), followed by CeO2-BB (0.048) and CeO2-AA (0.028), whereas the commercial references showed negligible D band intensity (<0.008).
3.2.3. Correlation with Crystallite Size
To understand the origin of the FWHM broadening, these data were compared with microstructural parameters obtained from Rietveld refinement (see Figure S1 and Table 1). Figure 2c presents a normalized bar chart comparing ε and ρ across the samples. A clear correlation between Raman parameters and microstrain/dislocation density is evident: samples with higher ε and ρ exhibited larger FWHM values. For instance, CeO2-BB, which possessed the highest dislocation density (23.5 × 10¹⁴ m−2), displayed a FWHM of 22.3 cm−1, whereas CeO2-AA (lower dislocation density) showed a narrower FWHM of 15.7 cm−1. In contrast, the commercial 25 nm sample, despite having a similar crystallite size (Table 1), exhibited a FWHM close to the bulk value (11.3 cm−1) due to its much lower microstrain (ε = 1.4 × 10⁻⁴). This suggests that, within this sample set, phonon confinement plays a minor role and that the observed broadening is dominated by lattice defects and microstrain. Figure 2d shows the correlation between the defect concentration (ID/IF2g) and both microstrain (left panel) and dislocation density (right panel). A linear relationship is observed, yielding R2 = 0.96 (p < 0.001) for both plots, confirming that the D band intensity scales directly with the density of structural defects.
3.3. X-Ray Photoelectron Spectroscopy
3.3.1. Ce 3d Spectra and Ce3+ Content
XPS analysis was performed to correlate surface oxidation states with morphology. Figure 3a presents the stacked Ce 3d spectra for all samples, displaying the characteristic multiplet structure of mixed Ce3+/Ce4+ oxidation states [46]. Deconvolution (Table 3) revealed a morphology-dependent Ce3+ content: CeO2-BB (30.2%) > CeO2-MM (22.5%) > CeO2-25 nm (18.5%) > CeO2-AA (14.8%) > CeO2-5 μm (8.3%). Survey XPS spectra (Figure S3) confirmed the absence of nitrogen, indicating complete removal of the octadecylamine surfactant.
Figure 3.
(a) Ce 3d XPS spectra of all samples. Main peaks for Ce 3d5/2 (v, v″, v‴) and Ce 3d3/2 (u, u″, u‴) are labeled. (b) O 1s deconvolution for CeO2-BB. (c) Ce3+ content (left axis) and Odef/Olat ratio (right axis). (d) Linear correlation between Ce3+ and Odef content (%).
Table 3.
Quantitative Ce3+ analysis from Ce 3d spectra.
3.3.2. O 1s Spectra and Oxygen Vacancies
The O 1s core-level spectra were deconvoluted into three components. Figure 3b shows a representative fitting (CeO2-BB). The components corresponded to lattice oxygen (Olat, ~529.5 eV), oxygen vacancies/defective oxygen (Odef, ~531.0 eV), and adsorbed oxygen species (Oads, ~532.2 eV) [47]. Table 4 summarizes the quantitative distribution. CeO2-BB had the highest Odef (39.8%) and the lowest Olat (40.2%), yielding the largest Odef/Olat ratio (0.99), while CeO2-MM showed Odef ≈ 35.4%, Olat = 44.5%, and Odef/Olat = 0.80. It should be noted that the Odef component at ~531.0 eV can also contain contributions from hydroxyl and carbonate species, which are commonly present on ceria surfaces. Therefore, the Odef/Olat ratio should be regarded as a semi-quantitative indicator of defect-associated surface oxygen rather than a direct measurement of oxygen-vacancy concentration. Figure 3c compares the Ce3+ percentage and the Odef/Olat ratio across all samples; a clear parallel increase was observed (linear correlation R2 = 0.94; see Section 4.4). Figure 3d shows the linear correlation between Ce3+ content and Odef content.
Table 4.
Oxygen species distribution.
3.4. Transmission Electron Microscopy
Representative bright field STEM images of the three synthesized morphologies are shown in Figure 4a–c. CeO2-AA (0.2 M ODA, α = 3.0) consists of near-spherical aggregates (spherulites) with an average diameter of 45.2 ± 27.3 nm (CV = 60.4%). CeO2-BB (0.05 M ODA, α = 1.0) forms short nanorods (L = 79.1 ± 47.7 nm, W = 17.2 ± 6.0 nm, and AR = 5.39 ± 4.1. CeO2-MM (0.01 M ODA, α = 0.3) yields long nanorods (L = 307.7 ± 91.3 nm, W = 32.6 ± 7.0 nm, AR = 9.98 ± 4.07). The length distribution of CeO2-BB is the most polydisperse (CVL = 60.3%), while CeO2-MM shows better uniformity (CVL = 29.7%). Detailed morphological statistics (particle count, coefficients of variation, and size distributions) are provided in Table S2.
Figure 4.
Morphological characterization of CeO2 nanostructures. (a–c) Representative STEM images of (a) CeO2-AA (spherulites), (b) CeO2-BB (short nanorods) and (c) CeO2-MM (long nanorods). Scale bars = 10 nm. (d) Scatter plot of width vs. length for all measured particles (AA: red circles, BB: green squares, MM: blue triangles). Dashed lines correspond to linear regressions for each morphology.
The scatter plot of width vs. length (Figure 4d) clearly separates the three populations; the dashed lines represent linear regressions for each morphology, confirming the different anisotropic growth regimes. It is important to note that the high polydispersity observed for CeO2-BB and CeO2-MM (CVL = 60.3% and 29.7%, respectively) is inherent to the solvothermal synthesis of anisotropic nanostructures, where nucleation and growth kinetics are not uniform. All measured particles were retained in the analysis to preserve the natural variability of the synthesis, and no outliers were removed. Consequently, the linear regressions shown in Figure 4d should be interpreted as qualitative guidelines for morphology control rather than as precise quantitative predictions. To assess the robustness of the observed trends, we also calculated the median and interquartile range (IQR) of the aspect ratio for each morphology (Table S2). Median aspect ratios (CeO2-AA: 0.94, CeO2-BB: 4.54, CeO2-MM: 9.37) follow the same trend as the mean values. The IQRs (0.24, 4.49, and 4.76, respectively) indicate a narrow distribution for CeO2-AA and broader distributions for CeO2-BB and CeO2-MM (Q1–Q3: 2.62–7.11 and 7.16–11.93), reflecting particle-to-particle variability.
The PCA biplot (Figure S4c) further distinguishes the three morphologies: PC1 (54.2% variance) is dominated by defect-related properties (not measured here), while PC2 (24.1% variance) is dominated by textural parameters (AR, L). The 95% confidence ellipses do not overlap, indicating statistically distinct morphological spaces.
Additionally, the observed trends in aspect ratio as a function of [ODA] and α are based on qualitative inspection of the data, as the synthesis matrix was explored at only three distinct conditions per factor. While the linear fits on log-transformed data yield high R2 values (0.94 for [ODA] and 0.89 for α), the wide confidence intervals and limited number of factor levels preclude a definitive statistical ranking of factor importance. A more comprehensive exploration of the synthesis matrix with more levels and independent replicates would be required to establish robust statistical significance and interaction effects. Nevertheless, the present data provide a clear qualitative guideline for morphology control.
The aspect ratio correlates strongly with the synthesis parameters (Figure S4a,b). A linear fit on log-transformed data gives R2 = 0.94 for [ODA] (β = −620.37, p < 0.001) and R2 = 0.89 for α (β = −5.2, p < 0.05). Because only three distinct synthesis conditions were studied, these fits illustrate the trend; the wide 95% confidence bands (gray areas) reflect the inherent particle-to-particle variability (including outliers). The boxplots (Figure S4d–f) show the distribution of width, length, and aspect ratio; the histograms (Figure S4g–i) with kernel density estimates (black lines) and vertical lines for mean (red) and median (green) highlight the positive skewness of the length distributions, especially for CeO2-BB.
Although the TEM images were acquired at a scale bar of 100 nm—which does not permit direct atomic-resolution identification of the exposed facets—the preferential exposure of {110}/{100} facets for ceria nanorods and {111} facets for spherulitic aggregates has been exhaustively documented in the literature [24,25,56,57]. This assignment is fully consistent with the measured properties: nanorods (BB and MM) exhibit much higher microstrain, Ce3+ content, and oxygen vacancy concentration compared to the spherulites (CeO2-AA).
3.5. Textural Properties
The N2 adsorption–desorption isotherms (Figure 5a) were type IV with H3 hysteresis, characteristic of mesoporous materials with slit-shaped pores [48,49]. CeO2-BB showed the highest N2 uptake (~240 cm3/g), followed by CeO2-MM (~234 cm3/g) and CeO2-AA (~118 cm3/g). The BJH pore size distributions (Figure 5a inset) revealed a bimodal distribution for CeO2-BB (2.3 and 30.6 nm), a narrow distribution for CeO2-AA (10.0 nm), and an intermediate distribution for Ce O2-MM (3.4 nm with a shoulder).
Figure 5.
(a) N2 adsorption–desorption isotherms (type IV with H3 hysteresis); inset BJH pore size distributions. (b) BET transformation. (c) t-plot analysis (log scale).
Quantitative t-plot analysis (Figure 5c, log scale) provided the external surface area (Sext) and micropore volume (Vmicro) that correlated with morphology (Table 5). CeO2-BB nanorods exhibited the highest external area (69.7 m2/g) and a micropore volume of 0.0050 cm3/g, consistent with their high aspect ratio and defective surface. CeO2-MM rods showed intermediate values (Sext = 51.0 m2/g, Vmicro = 0.0054 cm3/g), whereas CeO2-AA spherulites had no detectable microporosity (Vmicro = 0) and an external area equal to their BET area (57.1 m2/g), indicating a non-porous structure.
Table 5.
Detailed textural properties of CeO2 nanostructures.
The Dubinin–Radushkevich (DR) method (Table 5) yielded larger micropore volumes, as it probes a wider range of ultramicropores. A comparison with the literature showed that our values were within reported ranges: CeO2-BB was comparable to nanorods (70–90 m2/g) [58], and CeO2-AA was consistent with nanooctahedra (40–70 m2/g) [21].
3.6. Optical Properties
The diffuse reflectance spectra (Figure 6a) exhibit morphology-dependent absorption. CeO2-AA spherulites show the lowest reflectance (28.5% at 800 nm), while CeO2-BB nanorods display the highest among the synthesized samples (43.2%), consistent with Mie scattering effects [59]. Tauc plots for direct allowed transitions (F(R)⋅hν)½ (Figure 6b) yield the bandgap energies listed in Table 6. Among the synthesized nanostructures, CeO2-MM (long rods) exhibits the smallest Eg (2.69 ± 0.08 eV), followed by CeO2-AA (2.71 ± 0.03 eV) and CeO2-BB (2.78 ± 0.02 eV). The commercial 25 nm reference, despite having a similar crystallite size (21.3 nm) to CeO2-BB (21.4 nm), shows a larger Eg (2.87 ± 0.03 eV), whereas the bulk reference (5 μm) gives the highest value (3.15 ± 0.04 eV). The progressive reduction from spherical to rod-like morphologies aligned with DFT predictions [24,56] and the literature [60]. For completeness, Tauc plots for indirect allowed transitions are provided in Figure S5a.
Figure 6.
Optical properties of CeO2 nanostructures. (a) Diffuse reflectance spectra. (b) Tauc plots for direct allowed transitions (F(R)⋅hν)1/2; solid lines are linear fits used to determine Eg. (c) Logarithmic absorption coefficient (Urbach plots); red dashed lines indicate the linear regions used to extract Eu. (d) Correlation between Eg and Eu.
Table 6.
Optical properties of CeO2 nanostructures.
The Urbach energies (Eu, Table 6), extracted from the exponential absorption tails (Figure 6c), follow the order: CeO2-5 μm (85.8 ± 0.3 meV) < CeO2-BB (132.9 ± 0.3 meV) < CeO2-MM (142.8 ± 0.3 meV) < CeO2-AA (150.1 ± 0.4 meV) < CeO2-25 nm (188.7 ± 0.4 meV). The high Eu of the commercial 25 nm sample contrasts with its low microstrain (ε = 1.4 × 10⁻⁴), indicating that its optical disorder originates mainly from surface adsorbates [61] (hydroxyls, carbonates; see FT IR, Table 7) rather than from lattice distortions.
Table 7.
Descriptive statistics of FT-IR transmittance in key spectral regions.
A moderate negative correlation between Eg and Eu is observed when all five samples are considered (R2 = 0.63, Figure S5b), confirming defect-mediated bandgap narrowing [44]. Interestingly, the commercial 25 nm reference deviates from this trend: it exhibits the highest Eu but only an intermediate Eg. Excluding this chemically dominated outlier, the correlation improves significantly (R2 = 0.97, see Figure 6d), demonstrating that in the absence of surface contaminants, Eu directly tracks the density of structural defects that narrow the bandgap. Furthermore, a comparison between direct (this work) and indirect (see Table S3) bandgaps shows that the indirect values are systematically higher by 0.35–0.45 eV, but the same morphological order is preserved, indicating that the indirect nature of the gap is maintained even in defective nanorods.
3.7. FT-IR Spectroscopy (Surface Chemistry)
FT-IR spectra were recorded to evaluate surface chemistry differences among the morphologies. Figure 7a shows the spectra after normalization by the total integrated area (650–4000 cm−1). Five spectral regions were quantified (Table 7): O–H stretching (3000–3700 cm−1), H–O–H bending (1600–1650 cm−1), C–H stretching (2800–3000 cm−1), high-wavenumber carbonates (1500–1550 cm−1, ν3 asym.), and low-wavenumber carbonates (1350–1450 cm−1, ν3 sym.), as shown in Figure 7b.
Figure 7.
(a) Normalized FT-IR spectra of the four samples (CeO2-AA, CeO2-BB, CeO2-MM and CeO2-25 nm). (b) Integrated areas of the analyzed regions.
CeO2-AA spherulites consistently exhibited the lowest integrated areas across all regions, indicating the highest degree of hydroxylation, water adsorption, organic residue retention, and carbonate formation. One-way ANOVA (see Table S4) confirmed statistically significant differences among the four morphologies for every spectral region (p < 0.001).
3.8. Statistical Analysis and PCA
PCA was performed on the normalized 12-variable dataset to identify property groupings and morphology separation. Figure 8 presents the PCA biplot. PC1 explained 72.7% of the variance and was dominated by defect-related properties (Ce3+ content, Odef/Olat ratio, ID/IF2g ratio, ε, ρ, and FWHM). PC2 explained 27.3% of the variance and was dominated by textural properties (BET surface area, Vtotal, and AR). The biplot clearly separated the three morphologies, confirming distinct property spaces. Qualitative inspection of the data (Table 1, Table 2, Table 3, Table 4, Table 5, Table 6 and Table 7) suggests that higher ODA concentration is associated with lower aspect ratio, higher Ce3+ content, and larger bandgap, whereas the ethanol/water ratio α shows a weaker effect.
Figure 8.
Principal component analysis (PCA) biplot for the 12-variable dataset (n = 3 synthesized morphologies). PC1 (72.7% variance) is dominated by defect-related properties Ce3+, Odef/Olat, ID/IF2G, ε, ρ, FWHM). PC2 (27.3% variance) is dominated by textural properties (BET, Vtotal, AR). The three morphologies are clearly separated. PCA results are exploratory due to the limited sample size (n = 3), and should be interpreted as a qualitative visualization of property groupings rather than a statistically robust classification.
4. Discussion
4.1. Physical Origin of High Microstrain in Nanorods
The high microstrain in CeO2-BB and CeO2-MM nanorods (ε = 59.4–79.7 × 10⁻⁴) compared to spherulites (20.3 × 10⁻⁴) and commercial references (≤1.4 × 10⁻⁴) warrants a mechanistic discussion. Several factors contribute to the microstrain in nanostructured CeO2:
- Surface stress and anisotropic morphology: Nanorods with high aspect ratios (AR = 3.8–7.2, Section 3.4) expose {110} and {100} facets, which have higher surface energies (1.36 J/m2 and 1.41 J/m2, respectively) than {111} facets (0.69 J/m2) [24,57]. Differential surface stresses induce lattice distortions, and the high surface-to-volume ratio amplifies this effect.
- Oxygen vacancy-induced lattice distortion: High oxygen-vacancy-associated defects (Odef/Olat = 0.99 for CeO2-BB and 0.80 for CeO2-MM, Section 3.3) cause local lattice distortions, including (a) relaxation of neighboring Ce ions toward the vacancy site, (b) charge compensation through Ce4+→Ce3+ reduction with concomitant ionic radius increase (1.14 Å vs. 0.97 Å), and (c) Coulombic repulsion between adjacent vacancies [10,62]. DFT calculations show lattice relaxations up to 5% in the first coordination shell around vacancies on {110} and {100} surfaces [56,63,64].
- Anisotropic growth and kinetic trapping: The surfactant-mediated growth mechanism involves preferential ODA adsorption on the {100} facets, resulting in anisotropic growth along the ⟨110⟩ directions [58,65]. Rapid growth under solvothermal conditions (180 °C, 24 h) can kinetically trap non-equilibrium defect configurations and grain boundaries, contributing to the microstrain. Subsequent calcination (500 °C, 2 h) partially relieved the strain but was insufficient for complete defect annealing, as evidenced by the persistently high ε values.
- Grain boundaries and interfaces: STEM image analysis (Section 3.4) revealed that the nanorods are polycrystalline with grain boundaries and twin defects. These interfaces introduce strain fields that extend several nanometers into adjacent grains [59,66].
The correlation between the aspect ratio and microstrain (R2 = 0.87, p < 0.01) supports the hypothesis that anisotropic morphology is a primary driver of high microstrain. This finding is consistent with recent reports showing that CeO2 nanorods exhibit higher microstrain than nanocubes or octahedra of similar size [60,61].
4.2. Raman Broadening: Microstrain vs. Phonon Confinement
A controlled comparison between CeO2-BB (D = 21.4 nm, ε = 79.7 × 10⁻⁴, FWHM = 22.3 cm−1) and the commercial 25 nm reference (D = 21.3 nm, ε = 1.4 × 10⁻⁴, FWHM = 11.3 cm−1) suggests that phonon confinement plays a minor role in these defective nanorods [35,36]. The Richter–Wang–Ley model [67] predicts a FWHM of ~11–12 cm−1 for 21 nm particles, which matches the commercial reference but not CeO2-BB. Instead, a strong linear correlation exists between the FWHM and microstrain (R2 = 0.96, p < 0.001). The physical mechanisms include inhomogeneous lattice distortions creating a distribution of local phonon frequencies and strain fields from dislocations and vacancies that disrupt long-range periodicity [68,69]. Recent studies support this interpretation [37,60,70].
As shown in Figure S6a, the FWHM of the F2g mode correlates linearly with the microstrain (ε) for the three synthesized morphologies (R2 = 0.96). The commercial 25 nm sample falls far below this trend, despite having the same crystallite size as CeO2-BB. This supports the interpretation that, within this sample set, microstrain rather than crystallite size dominates the Raman linewidth in highly defective nanostructures. Furthermore, the defect-induced D band (~590 cm−1) scales linearly with both microstrain and the ID/IF2g ratio (Figure S6b), confirming that this band is a reliable marker of structural disorder [44,71].
The linear correlation between the ID/IF2G ratio and the Ce3+ content derived from XPS (R2 = 0.94, Figure S6b) further supports Raman spectroscopy as a sensitive indicator of defect-related disorder or oxygen-vacancy-associated defects. This result aligns with the work of Wu et al. (2010) [71], who assigned the ~590 cm−1 band to oxygen vacancies on specific facets, and with Kosacki et al. (2002) [72], who demonstrated a direct relationship between defect density and Raman scattering intensity in nanocrystalline ceria. Therefore, we conclude that in highly defective CeO2 nanostructures, within the investigated sample set, microstrain and defect-related disorder are the dominant contributors to Raman F2g broadening, rather than phonon confinement, whereas the ID/IF2G ratio provides a sensitive indicator of defect-related disorder associated with oxygen vacancies.
While the comparison between CeO2-BB and the commercial 25 nm reference strongly suggests that microstrain dominates broadening for particles of ∼21 nm, the smallest synthesized sample (CeO2-AA, D = 18.6 nm) exhibits a FWHM of 15.7 cm−1, which is slightly higher than expected from its microstrain (20.3 × 10⁻⁴) alone. This suggests that for crystallite sizes below 20 nm, phonon confinement may contribute marginally to the Raman linewidth, as predicted by the Richter–Wang–Ley model. Nevertheless, within this sample set, the overall broadening is still dominated by microstrain and dislocation density, as evidenced by the strong linear correlation (R2 = 0.96) between FWHM and ε for the three synthesized samples.
To further support this interpretation, we performed a quantitative calculation of the phonon-confinement contribution using the Richter–Wang–Ley model [67]. The model predicts a FWHM of ~7 cm−1 for crystallite sizes in the range of 18–26 nm, using the dispersion parameters reported for CeO2 (ω0 = 465.3 cm−1, Δω = 35 cm−1, Γ0 = 7 cm−1) [35,36]. The comparison between the experimental FWHM and the RWL prediction is shown in Figure S7a, and the correlation between ΔFWHM and microstrain is shown in Figure S7b. The predicted values are in good agreement with the experimental FWHM of the bulk reference (10.2 cm−1) but are significantly lower than the FWHM of CeO2-BB (22.3 cm−1) and CeO2-MM (23.3 cm−1). The difference between the experimental FWHM and the RWL prediction (ΔFWHM) correlates strongly with the microstrain (R2 = 0.92, p = 0.010), confirming that phonon confinement cannot account for the observed broadening in the defective nanorods, and that microstrain and defect-related disorder are the dominant contributors to the F2g broadening within the investigated sample set.
4.3. Defect Band as Oxygen Vacancy Marker
The ID/IF2g ratio correlated linearly with the Ce3+ content derived from XPS (R2 = 0.94, p < 0.001). This supports the use of Raman spectroscopy as a sensitive, non-destructive indicator of defect-related disorder associated with oxygen vacancies in CeO2. The D band originates from local symmetry breaking due to vacancies, which normally activate Raman-inactive modes [71,72,73]. This linear relationship suggests that the D band intensity scales with the concentration of defect-related disorder, which is associated with oxygen vacancies, although other symmetry-breaking defects may also contribute [74,75].
4.4. Relation Between Ce3+ and Oxygen Vacancies
The strong linear relationship between Ce3+ content and Odef content (R2 = 0.94) is consistent with the defect chemistry equilibrium (in Kroger–Vink notation): [10]. This reversible equation describes the redox equilibrium between Ce4+ to Ce3+, in which the reduction of Ce4+ to Ce3+ is accompanied by oxygen-vacancy formation and lattice oxygen release [10]. The positive correlation confirms that higher Ce3+ concentrations are associated with increased oxygen vacancy populations, as expected from charge compensation requirements. It should be noted that this is a simplified representation; in practice, surface and bulk vacancies may exhibit different formation energies and mobilities, and vacancy clustering can occur at high defect concentrations [61,62]. Furthermore, the Odef component in the O 1s spectra may contain contributions from hydroxyl and carbonate species, in addition to defect-associated oxygen. The FT-IR results (Section 3.7) confirm the presence of these species in all samples, with CeO2-AA exhibiting the highest degree of hydroxylation and carbonation. Therefore, the Odef/Olat ratio should be regarded as a semi-quantitative indicator of defect-associated surface oxygen rather than a direct measurement of oxygen-vacancy concentration. The strong correlation between the Odef/Olat ratio and the Ce3+ content (R2 = 0.94) is consistent with the expected relationship between Ce3+ and surface-defect chemistry, but it does not constitute definitive quantitative evidence for oxygen vacancies. Direct experimental evidence for vacancy formation and migration on ceria surfaces has been provided by in situ environmental TEM studies [58]. The high Ce3+ content in nanorods correlates with their high surface area and anisotropic morphology. Surface Ce ions are more easily reduced than bulk Ce due to lower coordination numbers and higher surface energies [76,77]. The {110} and {100} facets, which are dominant in nanorods, are more reducible than the {111} facets, resulting in higher surface Ce3+ concentrations [78,79].
4.5. Bandgap Trend: Quantum Confinement vs. Defect Effects
The bandgap evolution across the five samples reveals the interplay of quantum confinement, lattice strain, and defect chemistry. Bulk CeO2-5 μm sets the intrinsic Eg = 3.15 eV. The commercial 25 nm nanoparticles show a modest blue shift (ΔEg = +0.28 eV relative to bulk) due to quantum confinement, but this shift is smaller than the theoretical prediction for strain-free particles of this size (≈0.4–0.5 eV) [19]. The discrepancy is attributed to the presence of surface hydroxyls and carbonates (Table 7), which create mid-gap states and partially offset the confinement widening—a phenomenon often overlooked in simple quantum size models.
A controlled comparison between the commercial 25 nm sample and CeO2-BB (both with identical crystallite size, 21.4 nm) isolates the effect of lattice defects. CeO2-BB, which possesses high microstrain (79.7 × 10⁻⁴) and Ce3+ content (30.2%), exhibits an Eg of 2.78 eV, i.e., 0.09 eV lower than its commercial counterpart. This narrowing is directly caused by defect-induced band tailing, as evidenced by the lower Eu (132.9 meV) associated with structural disorder, in contrast to the chemical disorder of the commercial sample (high Eu but less effective narrowing).
A striking observation is that the commercial 25 nm sample exhibits the highest Eu (188.7 meV) but only an intermediate Eg (2.87 eV), while CeO2-BB shows a lower Eu (132.9 meV) yet a substantially narrower Eg (2.78 eV). This apparent contradiction is resolved by recognizing the different physical origins of Urbach energy: in the commercial sample, the exponential tail arises from surface adsorbed species (hydroxyls, carbonates) that do not perturb the band edges significantly, whereas in CeO2-BB, the Urbach tail is dominated by lattice microstrain and oxygen vacancies, which effectively narrow the gap. This distinction—chemical vs. structural disorder—is rarely demonstrated experimentally and provides a new criterion for evaluating the quality of nanostructured oxides [61].
Focusing on the three synthesized morphologies (CeO2-AA, CeO2-BB, CeO2-MM), a moderate linear correlation is found between Eg and Eu (R2 = 0.63), Figure S5b), confirming that within the same chemical family, the Urbach energy is a reliable proxy for structural defects. When the bulk reference (5 μm) is also included (excluding the commercial 25 nm outlier), the correlation becomes nearly perfect (R2 = 0.97), Figure 6d). This indicates that the bulk sample follows the same defect-induced narrowing trend as the nanorods, in contrast to the chemically contaminated commercial nanoparticles. The slight deviation of CeO2-AA (spherulites) is attributed to its lower microstrain and predominant {111} facets, which are less prone to vacancy formation [24,56]. The multiple linear regression model with n = 3 is overfit and the coefficients are not physically meaningful. A more robust descriptor is the Urbach energy.
Further insight is gained by comparing direct and indirect bandgaps. Direct transition analysis gives values 0.35–0.45 eV lower than the indirect ones, but the morphological order remains unchanged (Table S3). The constant offset suggests that the indirect nature of the bandgap is preserved, although the high defect density in nanorods might slightly relax the momentum selection rule. This observation aligns with recent theoretical predictions that oxygen vacancies can induce mid-gap states, thereby enhancing the probability of direct electronic transitions [80]. These mid-gap states, associated with Ce3+ ions neighbouring the vacancies, explain the enhanced sub-bandgap absorption and the reduced direct–indirect splitting in our highly defective nanorods.
A multiple linear regression model using Ce3+ content and microstrain as predictors explains only 42.6% of the variance in Eg when all five samples are considered (Eg = 3.086 − 0.0116⋅Ce3+(%) − 7.80⋅ε, ε in 10−4, R2 = 0.426, Figure S5c). The low coefficient of determination arises because the model cannot capture the different origins of Urbach energy (structural vs. chemical). However, when restricted to the three synthesized nanostructures, the regression yields an excellent fit (Eg = 2.429 + 0.0273⋅Ce3+ − 59.31⋅ε, R2 = 0.99, Figure S5d), but this is an overfit due to the limited number of data points (n = 3) and the coefficients are not physically meaningful (e.g., positive Ce3+ coefficient). Therefore, simple linear models based solely on Ce3+ and microstrain should be used with caution; a more robust descriptor is the Urbach energy, which inherently integrates both structural disorder and defect density [44,81].
4.6. Comparison with Literature
Our surface areas (57–80 m2/g) are typical for solvothermal synthesis with calcination at 500 °C [26,27,28]. The bandgaps (2.69–2.78 eV) are significantly red-shifted from bulk, consistent with defect-mediated narrowing [44,81]. Urbach energies (133–150 meV) correlate with microstrain (R2 = 0.91), indicating that lattice distortions broaden the density of states near the band edges [82,83]. Methodological caveats include the isotropic approximation for dislocation density, the Kubelka–Munk assumption for Urbach energies, and the influence of polydispersity on volume-averaged properties; these do not affect the main conclusions.
4.7. Implications for Applications
The synthesis–property guidelines presented below are based on qualitative trends observed across the three representative morphologies. While these trends are internally consistent and supported by multiple characterization techniques, the limited number of synthesis conditions precludes a fully quantitative predictive model. The following recommendations should therefore be interpreted as heuristic guidelines rather than statistically validated design rules. The quantitative synthesis–property relationships enable rational design: Catalysis (CO oxidation, VOC degradation): CeO2-BB (79.9 m2/g, 30.2% Ce3+) is optimal [84,85]. Photocatalysis: CeO2-MM (Eg = 2.69 eV, 60.3 m2/g) balances visible light absorption and surface area [86,87]. Solid oxide fuel cells: CeO2-BB (Odef/Olat = 0.99) is promising, while CeO2-MM (Odef/Olat = 0.80) also shows promising defect chemistry, although high microstrain may require annealing [88,89]. Biomedical applications: CeO2-BB has high antioxidant potential; however, its broad size distribution requires size selection [90,91]. Oxygen sensors: CeO2-BB (high surface area and high Odef) is ideal for fast response [15,92,93].
5. Conclusions
This work establishes a quantitative synthesis–property framework for CeO2 nanostructures. The key findings are:
- Within the investigated sample set, Raman broadening is dominated by microstrain and defect-related disorder, rather than by phonon confinement. A controlled comparison of similar-sized particles shows that dislocation density and microstrain, not crystallite size, determine the F2g FWHM in defective nanorods.
- Qualitative inspection of the data indicates that ODA concentration has a more pronounced influence than the ethanol/water ratio on aspect ratio, Ce3+ content, and bandgap. However, the limited number of synthesis conditions (three levels per factor) prevents a definitive statistical ranking of factor importance; a more comprehensive exploration of the synthesis matrix would be required for robust quantitative prediction.
- The ID/IF2g ratio is a sensitive indicator of defect-related disorder associated with oxygen vacancies. Its linear correlation with XPS-derived Ce3+ (R2 = 0.94) supports the use of Raman spectroscopy as a non-destructive probe of defect chemistry.
- Morphology selects properties. Short nanorods (CeO2-BB) maximize surface area, Ce3+ content, and oxygen vacancies–ideal for catalysis. Long rods (CeO2-MM) offer a narrower bandgap—suitable for photocatalysis.
- Bandgap engineering requires simultaneous control of size and defects. Quantum confinement and defect-induced narrowing compete, so neither parameter alone predicts Eg. The Urbach energy emerges as a more robust descriptor, as it inherently integrates both structural disorder and defect density.
This integrated approach provides a roadmap for the rational design of rare-earth oxide nanostructures. Future work will evaluate the catalytic activity (e.g., CO oxidation, water–gas shift), ionic conductivity, and gas sensing performance of these morphologies to validate the structure–property–function relationships and guide application-specific design.
Supplementary Materials
The following supporting information can be downloaded at: https://www.mdpi.com/article/10.3390/reactions7040060/s1, Figure S1. Rietveld refinement plots for the CeO2 samples. Figure S2. Deconvoluted Raman spectra. Figure S3. XPS survey spectra. Figure S4. Statistical analysis of particle dimensions. Figure S5. Supplementary optical analysis. Figure S6. Mechanistic correlations. Figure S7. Comparison between experimental FWHM and Richter–Wang–Ley (RWL) predictions, and correlation between ΔFWHM and microstrain. Table S1. Synthesis parameters and characterization of the CeO2 nanostructures. Table S2. Descriptive statistics of the morphological parameters of the CeO2 nanoparticles. Table S3. Comparison of direct and indirect bandgaps. Table S4. One-way ANOVA results for the integrated areas.
Author Contributions
Conceptualization, B.T.-N.; methodology, B.T.-N. and F.P.-D.; formal analysis, B.T.-N., F.P.-D. and K.F.A.-R.; investigation, B.T.-N. and K.F.A.-R.; resources, F.P.-D.; data curation, B.T.-N.; writing—original draft preparation, B.T.-N.; writing—review and editing, B.T.-N. and F.P.-D.; visualization, B.T.-N. and K.F.A.-R.; supervision, B.T.-N.; project administration, B.T.-N.; funding acquisition, B.T.-N., and F.P.-D. All authors have read and agreed to the published version of the manuscript.
Funding
This research was funded by the Tecnológico Nacional de México (grant number 6824.18.P.).
Data Availability Statement
The raw data supporting the conclusions of this article will be made available by the authors upon reasonable request.
Acknowledgments
The authors wish to thank Tijuana Technological Institute for Scientific Research, Investigations Center of Advanced Materials (CIMAV) for providing the facility. Ernesto Lestargette is acknowledged for providing an X-ray diffractometer, Carlos Ornelas for HRTEM, and Luis de la Torre for DRS.
Conflicts of Interest
The authors declare no conflicts of interest.
Abbreviations
The following abbreviations are used in this manuscript:
| AA | High ODA concentration, high α (CeO2-AA) |
| AR | Aspect Ratio |
| ATR | Attenuated Total Reflectance |
| BB | Low ODA concentration, low α (CeO2-BB) |
| BET | Brunauer–Emmett–Teller |
| BJH | Barrett–Joyner–Halenda |
| C | BET constant |
| Ce3+ | Trivalent cerium |
| Ce4+ | Tetravalent cerium |
| CeO2 | Cerium oxide (ceria) |
| CS | Crystallite Size |
| CV | Coefficient of Variation |
| D | Defect band (Raman) |
| DFT | Density Functional Theory |
| DR | Dubinin–Radushkevich |
| DRS | Diffuse Reflectance Spectroscopy |
| Eg | Bandgap energy |
| Eu | Urbach energy |
| EtOH | Ethanol |
| F(R) | Kubelka–Munk function |
| FT-IR | Fourier-Transform Infrared Spectroscopy |
| FWHM | Full Width at Half Maximum |
| H | Kruskal–Wallis statistic |
| ID/IF2g | Intensity ratio of defect band to F2g mode |
| IUPAC | International Union of Pure and Applied Chemistry |
| M | Intermediate ODA concentration, intermediate α (CeO2-MM) |
| MM | Intermediate (CeO2-MM) |
| N2 | Nitrogen |
| ODA | Octadecylamine |
| Oads | Adsorbed oxygen species |
| Odef | Oxygen vacancies/defect oxygen |
| Olat | Lattice oxygen |
| p | Statistical significance level |
| P/P0 | Relative pressure |
| PC | Principal Component |
| PCA | Principal Component Analysis |
| R | Reflectance |
| R2 | Coefficient of determination |
| SA | Surface Area |
| SD | Standard Deviation |
| TEM | Transmission Electron Microscopy |
| UV-Vis | Ultraviolet-Visible |
| VP | Total pore volume |
| XPS | X-ray Photoelectron Spectroscopy |
| α | Ethanol-to-water volume ratio (EtOH/H2O) |
References
- Trovarelli, A. Catalytic Properties of Ceria and CeO2-Containing Materials. Catal. Rev. 1996, 38, 439–520. [Google Scholar] [CrossRef] [Scilit]
- Montini, T.; Melchionna, M.; Monai, M.; Fornasiero, P. Fundamentals and Catalytic Applications of CeO2 -Based Materials. Chem. Rev. 2016, 116, 5987–6041. [Google Scholar] [CrossRef] [Scilit] [PubMed]
- Sun, C.; Li, H.; Chen, L. Nanostructured Ceria-Based Materials: Synthesis, Properties, and Applications. Energy Environ. Sci. 2012, 5, 8475. [Google Scholar] [CrossRef] [Scilit]
- Das, H.T.; T, E.B.; Dutta, S.; Das, N.; Das, P.; Mondal, A.; Imran, M. Recent Trend of CeO2-Based Nanocomposites Electrode in Supercapacitor: A Review on Energy Storage Applications. J. Energy Storage 2022, 50, 104643. [Google Scholar] [CrossRef] [Scilit]
- Das, S.; Dowding, J.M.; Klump, K.E.; McGinnis, J.F.; Self, W.; Seal, S. Cerium Oxide Nanoparticles: Applications and Prospects in Nanomedicine. Nanomedicine 2013, 8, 1483–1508. [Google Scholar] [CrossRef] [Scilit] [PubMed]
- Rajeshkumar, S.; Naik, P. Synthesis and Biomedical Applications of Cerium Oxide Nanoparticles—A Review. Biotechnol. Rep. 2018, 17, 1–5. [Google Scholar] [CrossRef] [Scilit] [PubMed]
- Xu, C.; Qu, X. Cerium Oxide Nanoparticle: A Remarkably Versatile Rare Earth Nanomaterial for Biological Applications. NPG Asia Mater. 2014, 6, e90. [Google Scholar] [CrossRef] [Scilit]
- Hoque, K.A.; Sathi, S.A.; Akter, F.; Akter, T.; Ahmed, T.; Ullah, W.; Arafin, K.; Rahaman, M.S.; Shahadat, H.M.; Imran, A.B.; et al. Recent Advances on Photocatalytic CO2 Reduction Using CeO2-Based Photocatalysts: A Review. J. Environ. Chem. Eng. 2024, 12, 113487. [Google Scholar] [CrossRef] [Scilit]
- Paun, C.; Safonova, O.V.; Szlachetko, J.; Abdala, P.M.; Nachtegaal, M.; Sa, J.; Kleymenov, E.; Cervellino, A.; Krumeich, F.; van Bokhoven, J.A. Polyhedral CeO2 Nanoparticles: Size-Dependent Geometrical and Electronic Structure. J. Phys. Chem. C 2012, 116, 7312–7317. [Google Scholar] [CrossRef] [Scilit]
- Ganduglia-Pirovano, M.V.; Hofmann, A.; Sauer, J. Oxygen Vacancies in Transition Metal and Rare Earth Oxides: Current State of Understanding and Remaining Challenges. Surf. Sci. Rep. 2007, 62, 219–270. [Google Scholar] [CrossRef] [Scilit]
- Cao, Y.; Zheng, H.; Zhu, G.; Wu, H.; He, L. Ceria Supported Ru0-Ru+ Clusters as Efficient Catalyst for Arenes Hydrogenation. Chin. Chem. Lett. 2021, 32, 770–774. [Google Scholar] [CrossRef] [Scilit]
- Zhang, W.; Wang, P.; Zhao, K.; Wen, G.; Zhang, X.; Wang, Y. Review of CeO2 Nanostructure/Carbon Composite Catalysts for Wastewater Treatment. ACS Appl. Nano Mater. 2025, 8, 10210–10241. [Google Scholar] [CrossRef] [Scilit]
- Diwell, A.F.; Rajaram, R.R.; Shaw, H.A.; Truex, T.J. The Role of Ceria in Three-Way Catalysts. In Studies in Surface Science and Catalysis; Elsevier: Amsterdam, The Netherlands, 1991; Volume 71, pp. 139–152. [Google Scholar]
- Steele, B.C.H.; Heinzel, A. Materials for Fuel-Cell Technologies. Nature 2001, 414, 345–352. [Google Scholar] [CrossRef] [Scilit] [PubMed]
- Izu, N.; Shin, W.; Matsubara, I.; Murayama, N. Development of Resistive Oxygen Sensors Based on Cerium Oxide Thick Film. J. Electroceram. 2004, 13, 703–706. [Google Scholar] [CrossRef] [Scilit]
- Nagai, Y.; Hirabayashi, T.; Dohmae, K.; Takagi, N.; Minami, T.; Shinjoh, H.; Matsumoto, S. Sintering Inhibition Mechanism of Platinum Supported on Ceria-Based Oxide and Pt-Oxide–Support Interaction. J. Catal. 2006, 242, 103–109. [Google Scholar] [CrossRef] [Scilit]
- Cargnello, M.; Jaén, J.J.D.; Garrido, J.C.H.; Bakhmutsky, K.; Montini, T.; Gámez, J.J.C.; Gorte, R.J.; Fornasiero, P. Exceptional Activity for Methane Combustion over Modular Pd@CeO2 Subunits on Functionalized Al2O3. Science 2012, 337, 713–717. [Google Scholar] [CrossRef] [Scilit] [PubMed]
- Deshpande, S.; Patil, S.; Kuchibhatla, S.V.; Seal, S. Size Dependency Variation in Lattice Parameter and Valency States in Nanocrystalline Cerium Oxide. Appl. Phys. Lett. 2005, 87, 133113. [Google Scholar] [CrossRef] [Scilit]
- Tsunekawa, S.; Ito, S.; Kawazoe, Y. Surface Structures of Cerium Oxide Nanocrystalline Particles from the Size Dependence of the Lattice Parameters. Appl. Phys. Lett. 2004, 85, 3845–3847. [Google Scholar] [CrossRef] [Scilit]
- Zhang, F.; Jin, Q.; Chan, S.-W. Ceria Nanoparticles: Size, Size Distribution, and Shape. J. Appl. Phys. 2004, 95, 4319–4326. [Google Scholar] [CrossRef] [Scilit]
- Mai, H.-X.; Sun, L.-D.; Zhang, Y.-W.; Si, R.; Feng, W.; Zhang, H.-P.; Liu, H.-C.; Yan, C.-H. Shape-Selective Synthesis and Oxygen Storage Behavior of Ceria Nanopolyhedra, Nanorods, and Nanocubes. J. Phys. Chem. B 2005, 109, 24380–24385. [Google Scholar] [CrossRef] [Scilit] [PubMed]
- Zhou, K.; Wang, X.; Sun, X.; Peng, Q.; Li, Y. Enhanced Catalytic Activity of Ceria Nanorods from Well-Defined Reactive Crystal Planes. J. Catal. 2005, 229, 206–212. [Google Scholar] [CrossRef] [Scilit]
- Sayle, D.C.; Maicaneanu, S.A.; Watson, G.W. Atomistic Models for CeO2 (111), (110), and (100) Nanoparticles, Supported on Yttrium-Stabilized Zirconia. J. Am. Chem. Soc. 2002, 124, 11429–11439. [Google Scholar] [CrossRef] [Scilit] [PubMed]
- Nolan, M.; Parker, S.C.; Watson, G.W. The Electronic Structure of Oxygen Vacancy Defects at the Low Index Surfaces of Ceria. Surf. Sci. 2005, 595, 223–232. [Google Scholar] [CrossRef] [Scilit]
- Wu, Z.; Li, M.; Overbury, S.H. On the Structure Dependence of CO Oxidation over CeO2 Nanocrystals with Well-Defined Surface Planes. J. Catal. 2012, 285, 61–73. [Google Scholar] [CrossRef] [Scilit]
- Liu, M.; Li, X.; Ren, S.; Wang, L.; Li, F.; He, C.; Chai, S.; Zheng, C.; Li, X.; Xu, C.C. Facet-Dependent Reactivity of CeO2 by Tuning Oxygen Vacancies to Simultaneously Promote NH3-SCR and CO Oxidation. Chem. Eng. J. 2025, 524, 169007. [Google Scholar] [CrossRef] [Scilit]
- Fang, Y.; Chen, X.; Liu, K.; He, Y.; Li, X.; Li, Y.; Yuan, Z.; Ye, J.; Liu, H.; Zhang, Y.; et al. Facet-Engineered Pt Redispersion on CeO2: Unraveling Morphology and Pt Density Effects for Tailored CO and C3H8 Oxidation Catalysis. ACS ES T Eng. 2026, 6, 510–523. [Google Scholar] [CrossRef] [Scilit]
- Li, W.; Zhang, K.; Yao, R.; Li, W.; Li, J.; Liu, G. Synergistic Oxygen-Defect/Carrier Engineering in IrO2-x/CeO2 Catalyst for High Performance Acidic Oxygen Evolution. Fuel 2026, 406, 137074. [Google Scholar] [CrossRef] [Scilit]
- Phoka, S.; Laokul, P.; Swatsitang, E.; Promarak, V.; Seraphin, S.; Maensiri, S. Synthesis, Structural and Optical Properties of CeO2 Nanoparticles Synthesized by a Simple Polyvinyl Pyrrolidone (PVP) Solution Route. Mater. Chem. Phys. 2009, 115, 423–428. [Google Scholar] [CrossRef] [Scilit]
- Sun, C.; Li, H.; Zhang, H.; Wang, Z.; Chen, L. Controlled Synthesis of CeO2 Nanorods by a Solvothermal Method. Nanotechnology 2005, 16, 1454–1463. [Google Scholar] [CrossRef] [Scilit]
- Yang, S.; Gao, L. Controlled Synthesis and Self-Assembly of CeO2 Nanocubes. J. Am. Chem. Soc. 2006, 128, 9330–9331. [Google Scholar] [CrossRef] [Scilit] [PubMed]
- Ahniyaz, A.; Sakamoto, Y.; Bergström, L. Tuning the Aspect Ratio of Ceria Nanorods and Nanodumbbells by a Face-Specific Growth and Dissolution Process. Cryst. Growth Des. 2008, 8, 1798–1800. [Google Scholar] [CrossRef] [Scilit]
- Ebrahimi, P.; Kumar, A.; Khraisheh, M. Analysis of Combustion Synthesis Method for Cu/CeO2 Synthesis by Integrating Thermodynamics and Design of Experiments Approach. Results Eng. 2022, 15, 100574. [Google Scholar] [CrossRef] [Scilit]
- Xu, Y.; Mofarah, S.S.; Mehmood, R.; Cazorla, C.; Koshy, P.; Sorrell, C.C. Design Strategies for Ceria Nanomaterials: Untangling Key Mechanistic Concepts. Mater. Horiz. 2021, 8, 102–123. [Google Scholar] [CrossRef] [Scilit] [PubMed]
- Weber, W.H.; Hass, K.C.; McBride, J.R. Raman Study of CeO2: Second-order Scattering, Lattice Dynamics, and Particle-size Effects. Phys. Rev. B 1993, 48, 178–185. [Google Scholar] [CrossRef] [Scilit] [PubMed]
- Spanier, J.E.; Robinson, R.D.; Zhang, F.; Chan, S.-W.; Herman, I.P. Size-Dependent Properties of CeO2−y Nanoparticles as Studied by Raman Scattering. Phys. Rev. B 2001, 64, 245407. [Google Scholar] [CrossRef] [Scilit]
- Gupta, M.; Kumar, A.; Sagdeo, A.; Sagdeo, P.R. Doping-Induced Combined Fano and Phonon Confinement Effect in La-Doped CeO2: Raman Spectroscopy Analysis. J. Phys. Chem. C 2021, 125, 2648–2658. [Google Scholar] [CrossRef] [Scilit]
- Taniguchi, T.; Watanabe, T.; Sugiyama, N.; Subramani, A.K.; Wagata, H.; Matsushita, N.; Yoshimura, M. Identifying Defects in Ceria-Based Nanocrystals by UV Resonance Raman Spectroscopy. J. Phys. Chem. C 2009, 113, 19789–19793. [Google Scholar] [CrossRef] [Scilit]
- Graham, G.W.; Weber, W.H.; Peters, C.R.; Usmen, R. Empirical Method for Determining CeO2-Particle Size in Catalysts by Raman Spectroscopy. J. Catal. 1991, 130, 310–313. [Google Scholar] [CrossRef] [Scilit]
- Rodríguez-Carvajal, J. Recent Advances in Magnetic Structure Determination by Neutron Powder Diffraction. Phys. B Condens. Matter 1993, 192, 55–69. [Google Scholar] [CrossRef] [Scilit]
- Ungár, T. Microstructural Parameters from X-Ray Diffraction Peak Broadening. Scr. Mater. 2004, 51, 777–781. [Google Scholar] [CrossRef] [Scilit]
- Krivoglaz, M.A. X-Ray and Neutron Diffraction in Nonideal Crystals. In X-Ray and Neutron Diffraction in Nonideal Crystals; Springer: Berlin/Heidelberg, Germany, 1996. [Google Scholar] [CrossRef] [Scilit]
- Williamson, G.K.; Smallman, R.E. III. Dislocation Densities in Some Annealed and Cold-Worked Metals from Measurements on the X-Ray Debye-Scherrer Spectrum. Philos. Mag. 1956, 1, 34–46. [Google Scholar] [CrossRef] [Scilit]
- Pushkarev, V.V.; Kovalchuk, V.I.; D’Itri, J.L. Probing Defect Sites on the CeO2 Surface with Dioxygen. J. Phys. Chem. B 2004, 108, 5341–5348. [Google Scholar] [CrossRef] [Scilit]
- Guo, M.; Lu, J.; Wu, Y.; Wang, Y.; Luo, M. UV and Visible Raman Studies of Oxygen Vacancies in Rare-Earth-Doped Ceria. Langmuir 2011, 27, 3872–3877. [Google Scholar] [CrossRef] [Scilit] [PubMed]
- Burroughs, P.; Hamnett, A.; Orchard, A.F.; Thornton, G. Satellite Structure in the X-Ray Photoelectron Spectra of Some Binary and Mixed Oxides of Lanthanum and Cerium. J. Chem. Soc. Dalton Trans. 1976, 5, 1686–1698. [Google Scholar] [CrossRef] [Scilit]
- Wang, J.; Mueller, D.N.; Crumlin, E.J. Recommended Strategies for Quantifying Oxygen Vacancies with X-Ray Photoelectron Spectroscopy. J. Eur. Ceram. Soc. 2024, 44, 116709. [Google Scholar] [CrossRef] [Scilit]
- Sing, K.S.W.; Everett, D.H.; Haul, R.A.W.; Moscou, L.; Pierotti, R.A.; Rouquerol, J.; Siemieniewska, T. Reporting Physisorption Data for Gas/Solid Systems with Special Reference to the Determination of Surface Area and Porosity. Pure Appl. Chem. 1985, 57, 603–619. [Google Scholar] [CrossRef] [Scilit]
- Barrett, E.P.; Joyner, L.G.; Halenda, P.P. The Determination of Pore Volume and Area Distributions in Porous Substances. I. Computations from Nitrogen Isotherms. J. Am. Chem. Soc. 1951, 73, 373–380. [Google Scholar] [CrossRef] [Scilit]
- Harkins, W.D.; Jura, G. Surfaces of Solids. XIII. A Vapor Adsorption Method for the Determination of the Area of a Solid without the Assumption of a Molecular Area, and the Areas Occupied by Nitrogen and Other Molecules on the Surface of a Solid. J. Am. Chem. Soc. 1944, 66, 1366–1373. [Google Scholar] [CrossRef] [Scilit]
- Dubinin, M.M.; Radushkevich, L.V. Equation of the Characteristic Curve of Activated Charcoal. Proc. Acad. Sci. USSR Phys. Chem. Sect. 1947, 55, 331–337. [Google Scholar]
- Tauc, J.; Grigorovici, R.; Vancu, A. Optical Properties and Electronic Structure of Amorphous Germanium. Phys. Status Solidi (B) 1966, 15, 627–637. [Google Scholar] [CrossRef] [Scilit]
- Urbach, F. The Long-Wavelength Edge of Photographic Sensitivity and of the Electronic Absorption of Solids. Phys. Rev. 1953, 92, 1324. [Google Scholar] [CrossRef] [Scilit]
- Shannon, R.D. Revised Effective Ionic Radii and Systematic Studies of Interatomic Distances in Halides and Chalcogenides. Acta Crystallogr. Sect. A 1976, 32, 751–767. [Google Scholar] [CrossRef] [Scilit]
- Tsunekawa, S.; Fukuda, T.; Kasuya, A. Blue Shift in Ultraviolet Absorption Spectra of Monodisperse CeO2−x Nanoparticles. J. Appl. Phys. 2000, 87, 1318–1321. [Google Scholar] [CrossRef] [Scilit]
- Asefa Eressa, L.; Gerbaba Edossa, T. First-Principles Calculations to Investigate Structural, Electronic, Optical, and Elastic Properties of Ceria. Adv. Condens. Matter Phys. 2022, 2022, 1–11. [Google Scholar] [CrossRef] [Scilit]
- Nolan, M.; Grigoleit, S.; Sayle, D.C.; Parker, S.C.; Watson, G.W. Density Functional Theory Studies of the Structure and Electronic Structure of Pure and Defective Low Index Surfaces of Ceria. Surf. Sci. 2005, 576, 217–229. [Google Scholar] [CrossRef] [Scilit]
- Wu, Q.; Zhang, F.; Xiao, P.; Tao, H.; Wang, X.; Hu, Z.; Lü, Y. Great Influence of Anions for Controllable Synthesis of CeO2 Nanostructures: From Nanorods to Nanocubes. J. Phys. Chem. C 2008, 112, 17076–17080. [Google Scholar] [CrossRef] [Scilit]
- Tschöpe, A. Grain Size-Dependent Electrical Conductivity of Polycrystalline Cerium Oxide II: Space Charge Model. Solid. State Ion. 2001, 139, 267–280. [Google Scholar] [CrossRef] [Scilit]
- Canchanya-Huaman, Y.; Mayta-Armas, A.F.; Pomalaya-Velasco, J.; Bendezú-Roca, Y.; Guerra, J.A.; Ramos-Guivar, J.A. Strain and Grain Size Determination of CeO2 and TiO2 Nanoparticles: Comparing Integral Breadth Methods versus Rietveld, μ-Raman, and TEM. Nanomaterials 2021, 11, 2311. [Google Scholar] [CrossRef] [Scilit] [PubMed]
- Ascencio, F.; Rangel-Gamboa, L.; Maqueda-Cabrera, B.; Zorrilla, C.; Herrera, R.; Mendoza-Cruz, R. Structural and Vibrational Study of Porous CeO2 Nanoparticles. Mater. Chem. Phys. 2024, 311, 128492. [Google Scholar] [CrossRef] [Scilit]
- Pang, D.; Li, W.; Zhang, N.; He, H.; Mao, S.; Chen, Y.; Cao, L.; Li, C.; Li, A.; Han, X. Direct Observation of Oxygen Vacancy Formation and Migration over Ceria Surface by in Situ Environmental Transmission Electron Microscopy. J. Rare Earths 2024, 42, 676–682. [Google Scholar] [CrossRef] [Scilit]
- Hu, Y.; Jin, N.; Song, S.; Liu, Y. Wettability, Electronic Structure and Optical Properties of Intrinsic, Doped, and Oxygen-Deficient CeO2: A Study Using DFT+U and DFT+U-D3. Phys. B Condens. Matter 2024, 690, 416228. [Google Scholar] [CrossRef] [Scilit]
- Li, H.-Y.; Wang, H.-F.; Gong, X.-Q.; Guo, Y.-L.; Guo, Y.; Lu, G.; Hu, P. Multiple Configurations of the Two Excess 4f Electrons on Defective CeO2(111): Origin and Implications. Phys. Rev. B 2009, 79, 193401. [Google Scholar] [CrossRef] [Scilit]
- Ji, Z.; Wang, X.; Zhang, H.; Lin, S.; Meng, H.; Sun, B.; George, S.; Xia, T.; Nel, A.E.; Zink, J.I. Designed Synthesis of CeO2 Nanorods and Nanowires for Studying Toxicological Effects of High Aspect Ratio Nanomaterials. ACS Nano 2012, 6, 5366–5380. [Google Scholar] [CrossRef] [Scilit] [PubMed]
- Guo, X.; Waser, R. Electrical Properties of the Grain Boundaries of Oxygen Ion Conductors: Acceptor-Doped Zirconia and Ceria. Prog. Mater. Sci. 2006, 51, 151–210. [Google Scholar] [CrossRef] [Scilit]
- Richter, H.; Wang, Z.P.; Ley, L. The One Phonon Raman Spectrum in Microcrystalline Silicon. Solid. State Commun. 1981, 39, 625–629. [Google Scholar] [CrossRef] [Scilit]
- Parayanthal, P.; Pollak, F.H. Raman Scattering in Alloy Semiconductors: “Spatial Correlation” Model. Phys. Rev. Lett. 1984, 52, 1822–1825. [Google Scholar] [CrossRef] [Scilit]
- Campbell, I.H.; Fauchet, P.M. The Effects of Microcrystal Size and Shape on the One Phonon Raman Spectra of Crystalline Semiconductors. Solid. State Commun. 1986, 58, 739–741. [Google Scholar] [CrossRef] [Scilit]
- Chauhan, V.S.; Ferrigno, J.; Adnan, S.; Pakarinen, J.; He, L.; Hurley, D.H.; Khafizov, M. Comprehensive Characterization of Irradiation Induced Defects in Ceria: Impact of Point Defects on Vibrational and Optical Properties. J. Appl. Phys. 2022, 132, 085105. [Google Scholar] [CrossRef] [Scilit]
- Wu, Z.; Li, M.; Howe, J.; Meyer, H.M.; Overbury, S.H. Probing Defect Sites on CeO2 Nanocrystals with Well-Defined Surface Planes by Raman Spectroscopy and O2 Adsorption. Langmuir 2010, 26, 16595–16606. [Google Scholar] [CrossRef] [Scilit] [PubMed]
- Kosacki, I.; Suzuki, T.; Anderson, H.U.; Colomban, P. Raman Scattering and Lattice Defects in Nanocrystalline CeO2 Thin Films. Solid. State Ion. 2002, 149, 99–105. [Google Scholar] [CrossRef] [Scilit]
- M B, S.; Kompa, A.; Kekuda, D.; Rao K, M. A Comprehensive Investigation on Thickness Dependent Intrinsic Properties of Spin Coated CeO2 Thin Films. Opt. Mater. 2026, 169, 117617. [Google Scholar] [CrossRef] [Scilit]
- Popović, Z.V.; Dohčević-Mitrović, Z.; Cros, A.; Cantarero, A. Raman Scattering Study of the Anharmonic Effects in CeO2−y Nanocrystals. J. Phys. Condens. Matter 2007, 19, 496209. [Google Scholar] [CrossRef] [Scilit]
- Kostić, R.; Aškrabić, S.; Dohčević-Mitrović, Z.; Popović, Z.V. Low-Frequency Raman Scattering from CeO2 Nanoparticles. Appl. Phys. A 2008, 90, 679–683. [Google Scholar] [CrossRef] [Scilit]
- Chen, H.; Choi, Y.M.; Liu, M.; Lin, M.C. A Theoretical Study of Surface Reduction Mechanisms of CeO2 (111) and (110) by H2. ChemPhysChem 2007, 8, 849–855. [Google Scholar] [CrossRef] [Scilit] [PubMed]
- Senanayake, S.D.; Stacchiola, D.; Evans, J.; Estrella, M.; Barrio, L.; Pérez, M.; Hrbek, J.; Rodriguez, J.A. Probing the Reaction Intermediates for the Water–Gas Shift over Inverse CeOx/Au(111) Catalysts. J. Catal. 2010, 271, 392–400. [Google Scholar] [CrossRef] [Scilit]
- Pan, Y.; Nilius, N.; Freund, H.-J.; Paier, J.; Penschke, C.; Sauer, J. Titration of Ce3+ Ions in the CeO2 (111) Surface by Au Adatoms. Phys. Rev. Lett. 2013, 111, 206101. [Google Scholar] [CrossRef] [Scilit] [PubMed]
- Phokha, S.; Pinitsoontorn, S.; Chirawatkul, P.; Poo-arporn, Y.; Maensiri, S. Synthesis, Characterization, and Magnetic Properties of Monodisperse CeO2 Nanospheres Prepared by PVP-Assisted Hydrothermal Method. Nanoscale Res. Lett. 2012, 7, 425. [Google Scholar] [CrossRef] [Scilit] [PubMed]
- Liu, Z.; Ma, H.; Sorrell, C.C.; Koshy, P.; Wang, B.; Hart, J.N. Enhancement of Light Absorption and Oxygen Vacancy Formation in CeO2 by Transition Metal Doping: A DFT Study. Appl. Catal. A Gen. 2024, 670, 119544. [Google Scholar] [CrossRef] [Scilit]
- Corma, A.; Atienzar, P.; García, H.; Chane-Ching, J.-Y. Hierarchically Mesostructured Doped CeO2 with Potential for Solar-Cell Use. Nat. Mater. 2004, 3, 394–397. [Google Scholar] [CrossRef] [Scilit] [PubMed]
- Dow, J.D.; Redfield, D. Toward a Unified Theory of Urbach’s Rule and Exponential Absorption Edges. Phys. Rev. B 1972, 5, 594–610. [Google Scholar] [CrossRef] [Scilit]
- Cody, G.D.; Tiedje, T.; Abeles, B.; Brooks, B.; Goldstein, Y. Disorder and the Optical-Absorption Edge of Hydrogenated Amorphous Silicon. Phys. Rev. Lett. 1981, 47, 1480–1483. [Google Scholar] [CrossRef] [Scilit]
- Piumetti, M.; Fino, D.; Russo, N. Mesoporous Manganese Oxides Prepared by Solution Combustion Synthesis as Catalysts for the Total Oxidation of VOCs. Appl. Catal. B 2015, 163, 277–287. [Google Scholar] [CrossRef] [Scilit]
- Agarwal, S.; Lefferts, L.; Mojet, B.L. Ceria Nanocatalysts: Shape Dependent Reactivity and Formation of OH. ChemCatChem 2013, 5, 479–489. [Google Scholar] [CrossRef] [Scilit]
- Carrettin, S.; Concepción, P.; Corma, A.; López Nieto, J.M.; Puntes, V.F. Nanocrystalline CeO2 Increases the Activity of Au for CO Oxidation by Two Orders of Magnitude. Angew. Chem. Int. Ed. 2004, 43, 2538–2540. [Google Scholar] [CrossRef] [Scilit] [PubMed]
- Flytzani-Stephanopoulos, M.; Sakbodin, M.; Wang, Z. Regenerative Adsorption and Removal of H2S from Hot Fuel Gas Streams by Rare Earth Oxides. Science 2006, 312, 1508–1510. [Google Scholar] [CrossRef] [Scilit] [PubMed]
- Kilner, J. Fast Oxygen Transport in Acceptor Doped Oxides. Solid. State Ion. 2000, 129, 13–23. [Google Scholar] [CrossRef] [Scilit]
- Omar, S.; Wachsman, E.D.; Nino, J.C. Higher Conductivity Sm3+ and Nd3+ Co-Doped Ceria-Based Electrolyte Materials. Solid. State Ion. 2008, 178, 1890–1897. [Google Scholar] [CrossRef] [Scilit]
- Perez, J.; Asati, A.; Nath, S.; Kaitlantis, C. Synthesis of Biocompatible Dextran-coated Nanoceria with PH-dependent Antioxidant Properties. Small 2008, 4, 552–556. [Google Scholar] [CrossRef] [Scilit] [PubMed]
- Korsvik, C.; Patil, S.; Seal, S.; Self, W.T. Superoxide Dismutase Mimetic Properties Exhibited by Vacancy Engineered Ceria Nanoparticles. Chem. Commun. 2007, 43, 1056–1058. [Google Scholar] [CrossRef] [Scilit] [PubMed]
- Torkamani Cheriani, M.; Mirzaei, A.; Kim, J.-H. Resistive-Based Nanostructured CeO2 Gas Sensors: A Review. Chemosensors 2025, 13, 298. [Google Scholar] [CrossRef] [Scilit]
- Xu, M.; Liu, L.-M.; Lan, Y.; Han, H.-X.; Zheng, Y.-H.; Yang, J.-W.; Wang, W.-P.; Liu, P.; Chen, D. Enhancement of Gas Sensing Performance of Cerium Oxide by Nickel Doping. Chin. Rare Earths 2026, 47, 13–20. [Google Scholar] [CrossRef] [Scilit]
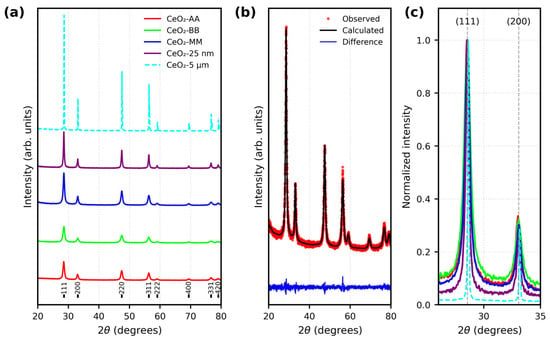
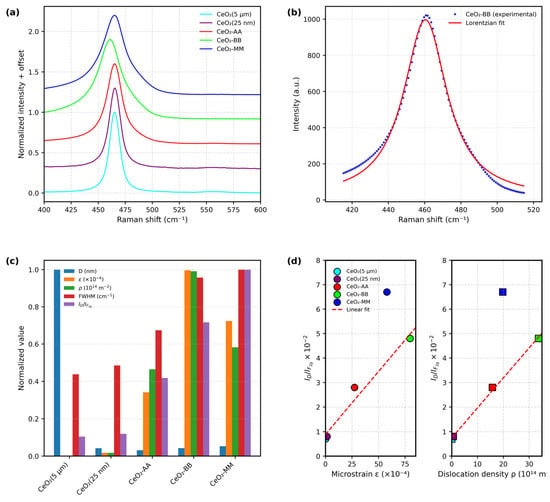
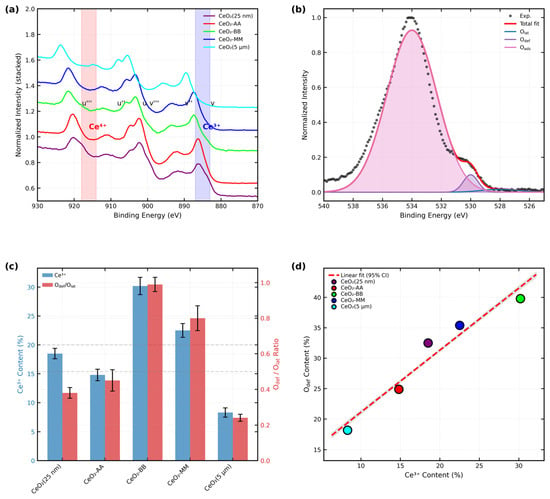
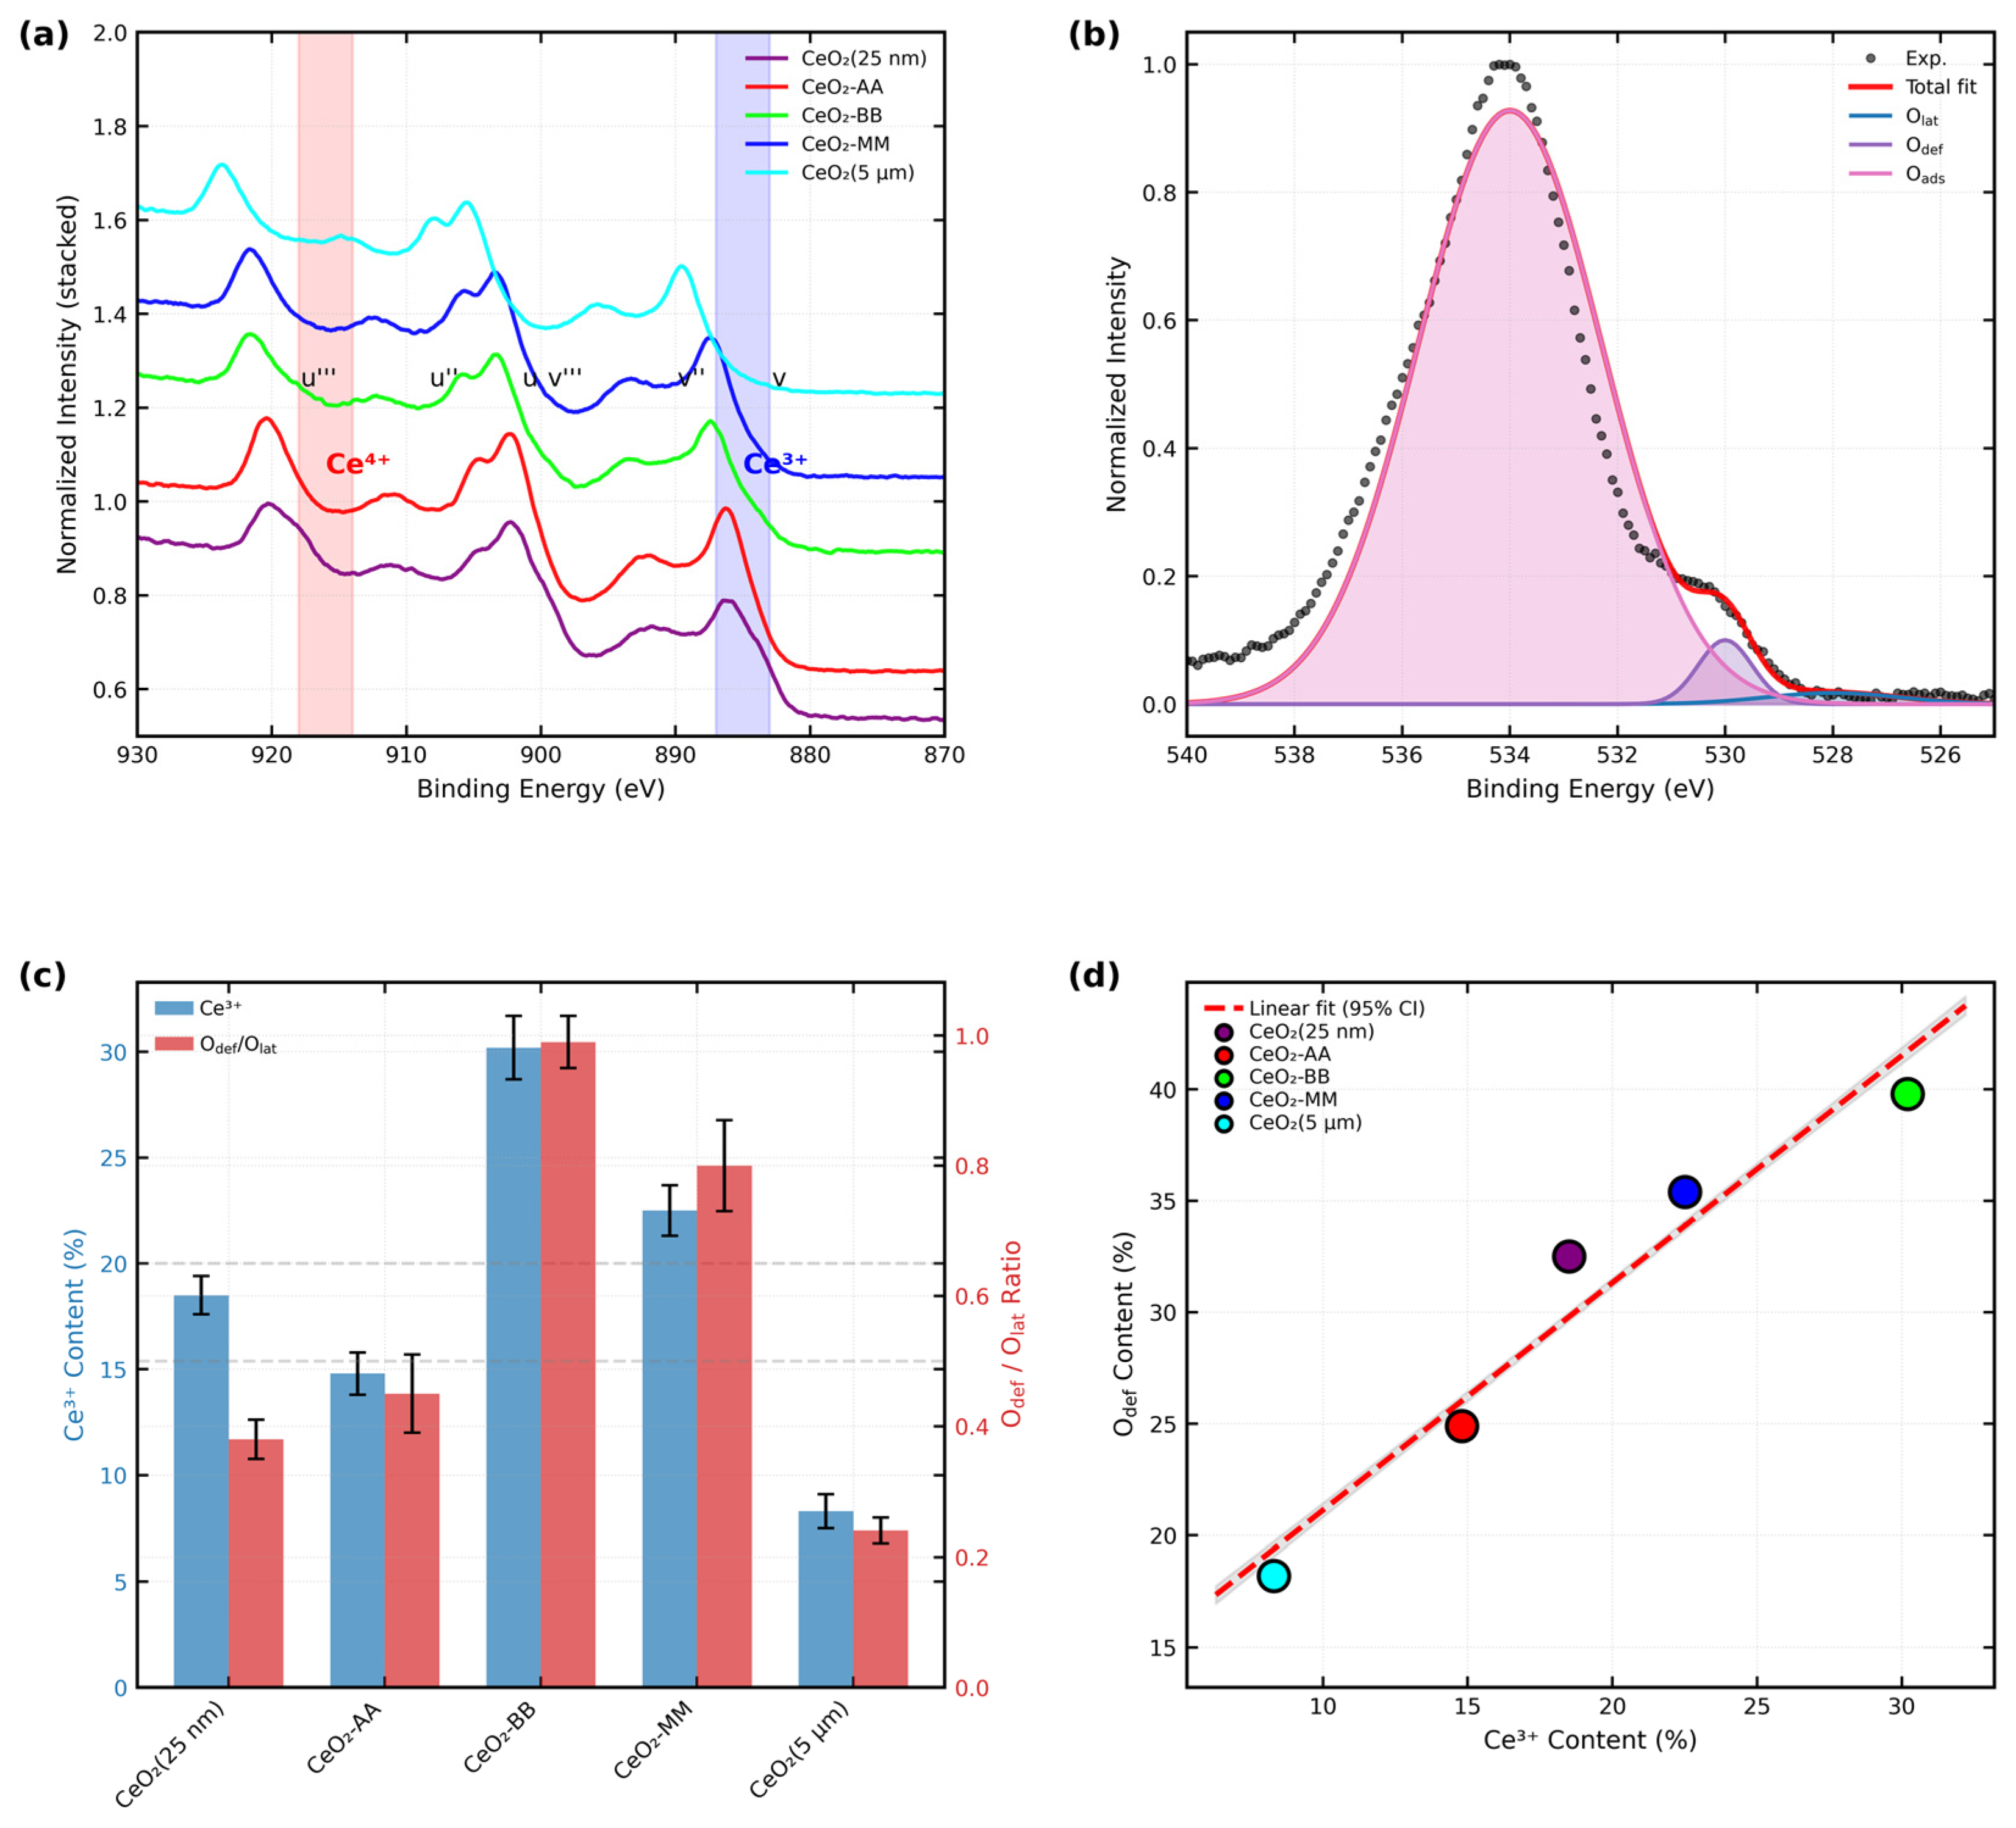
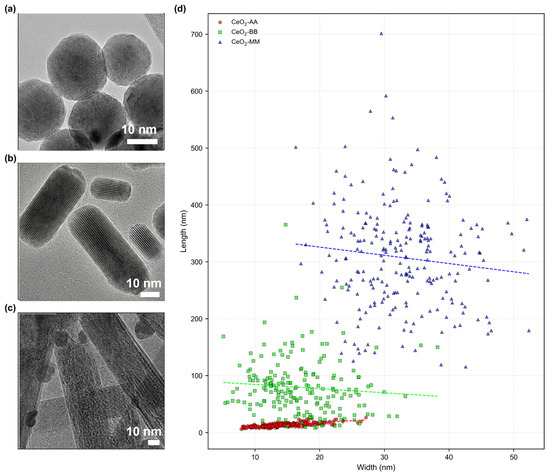
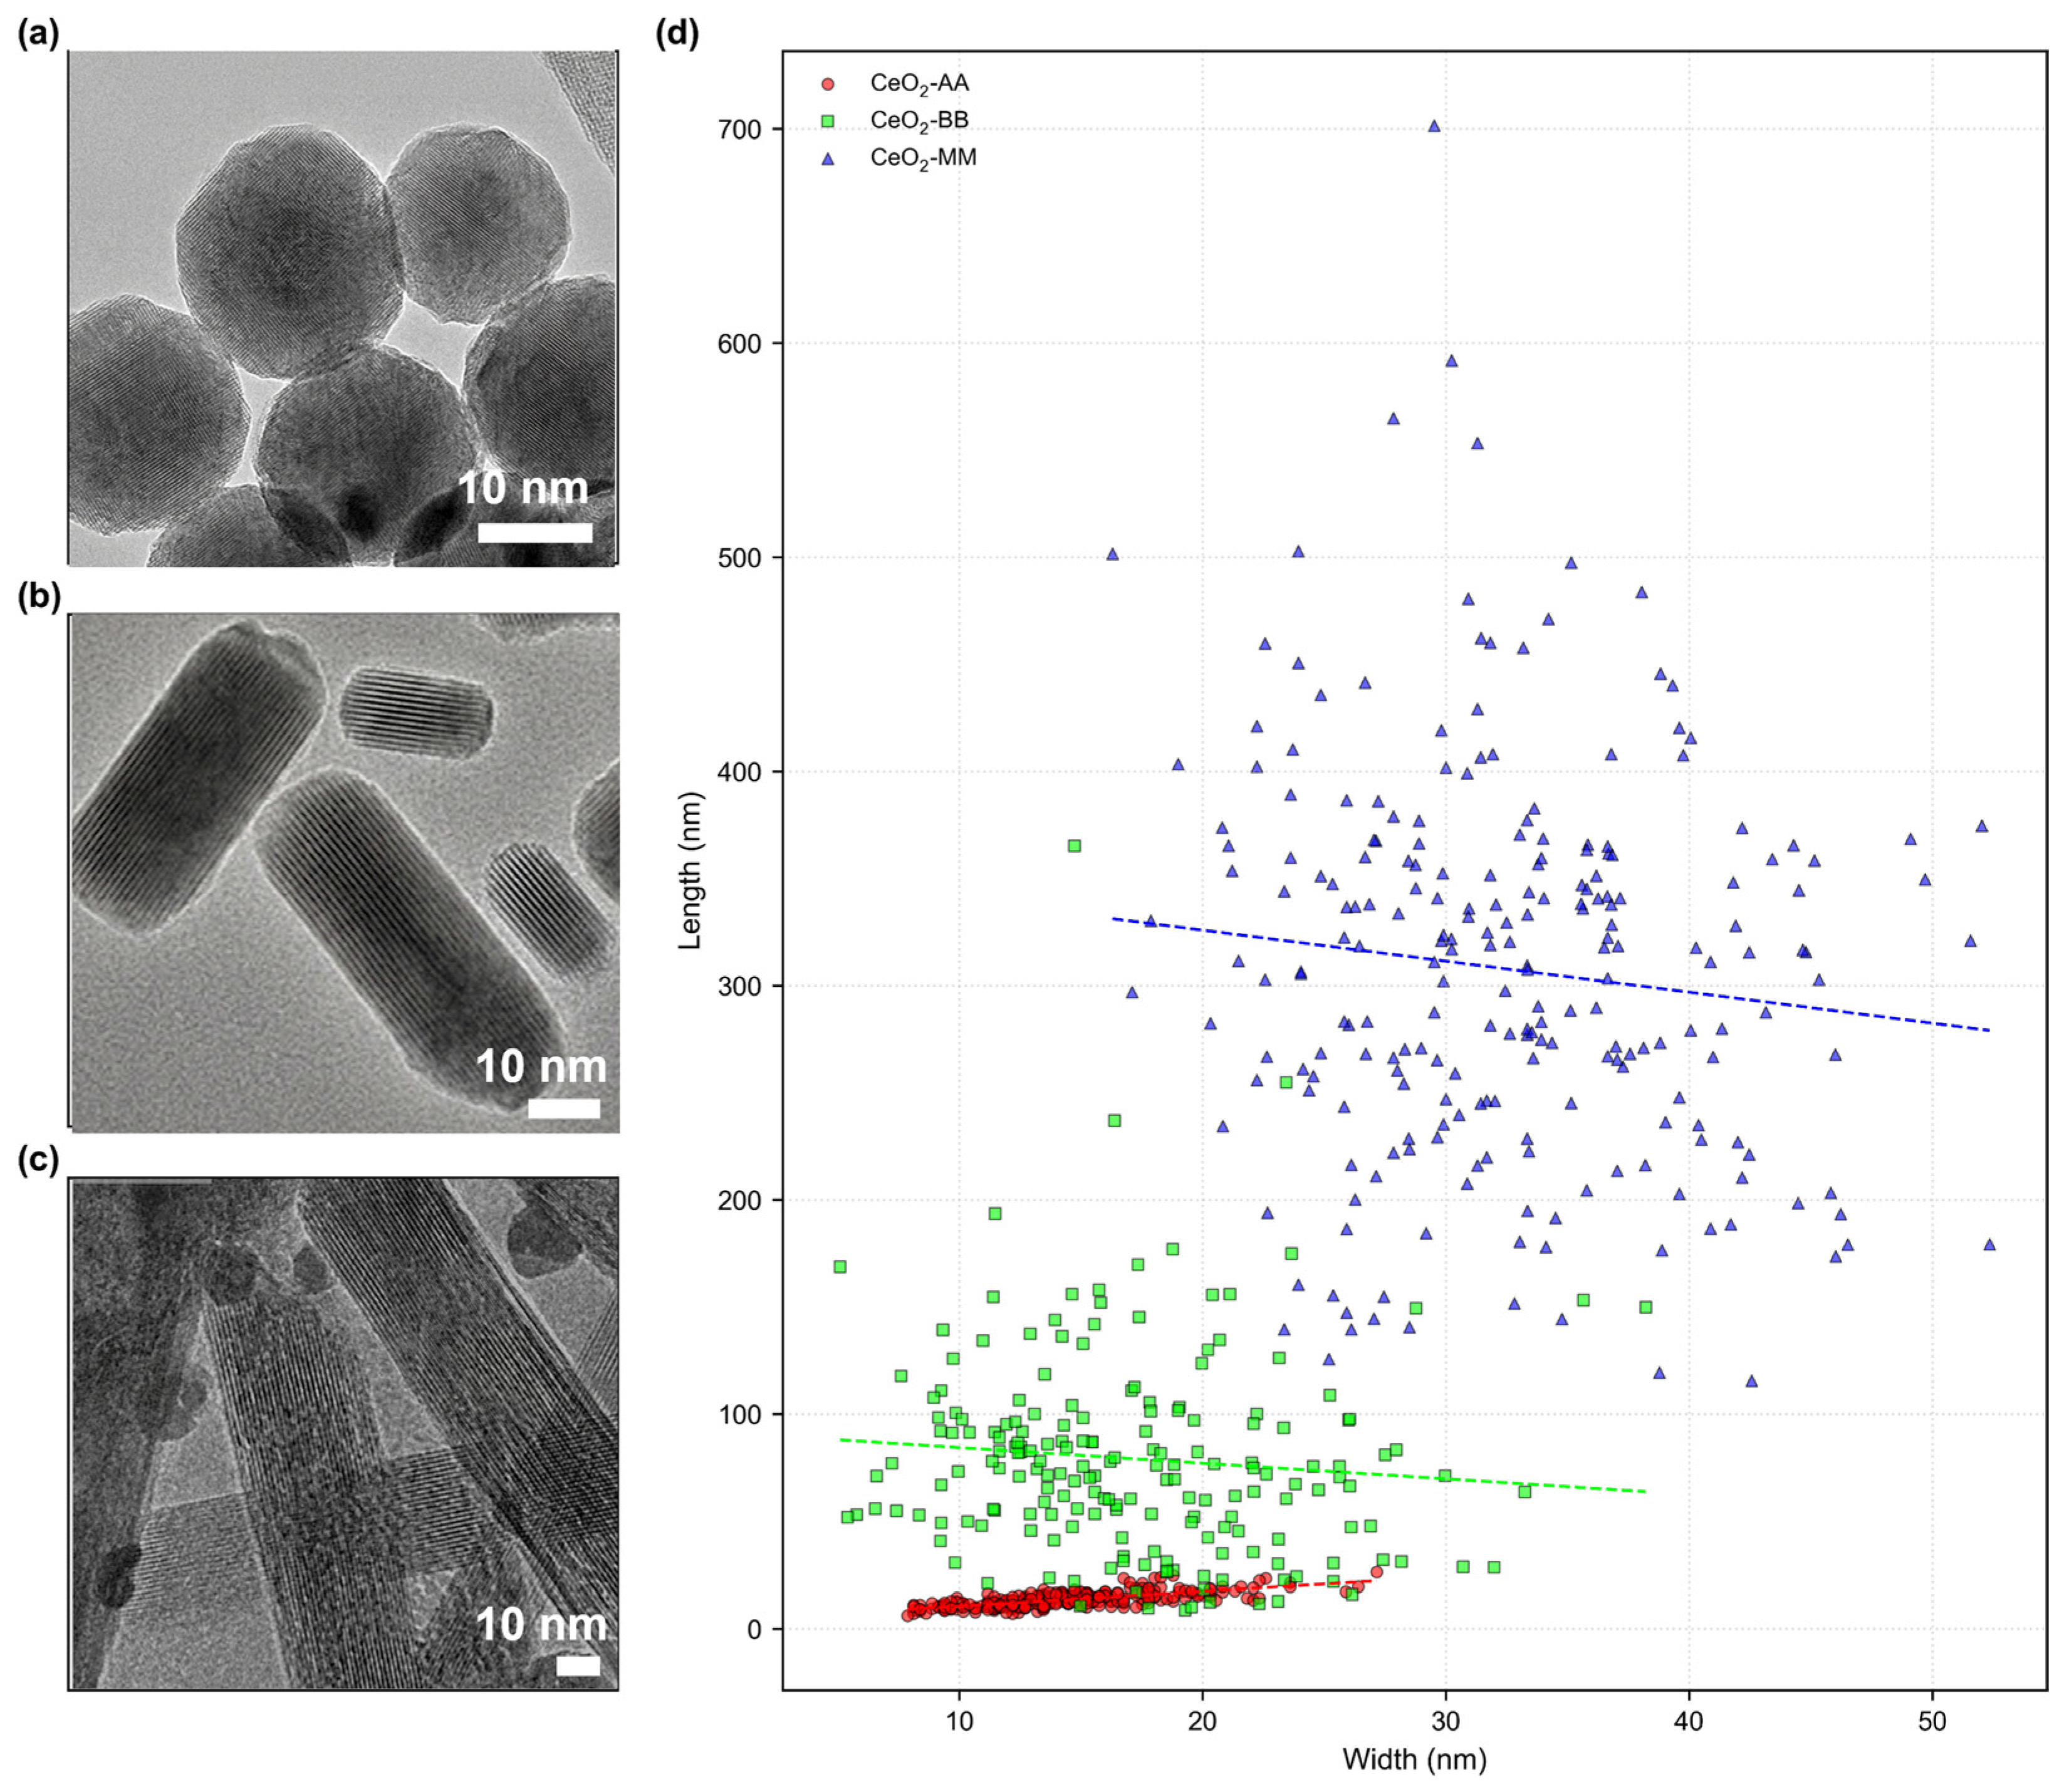
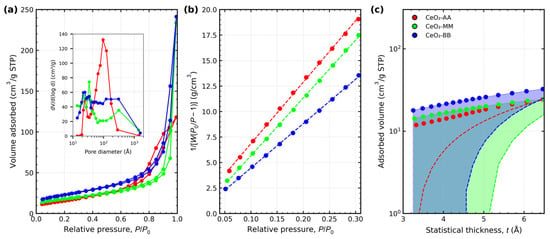
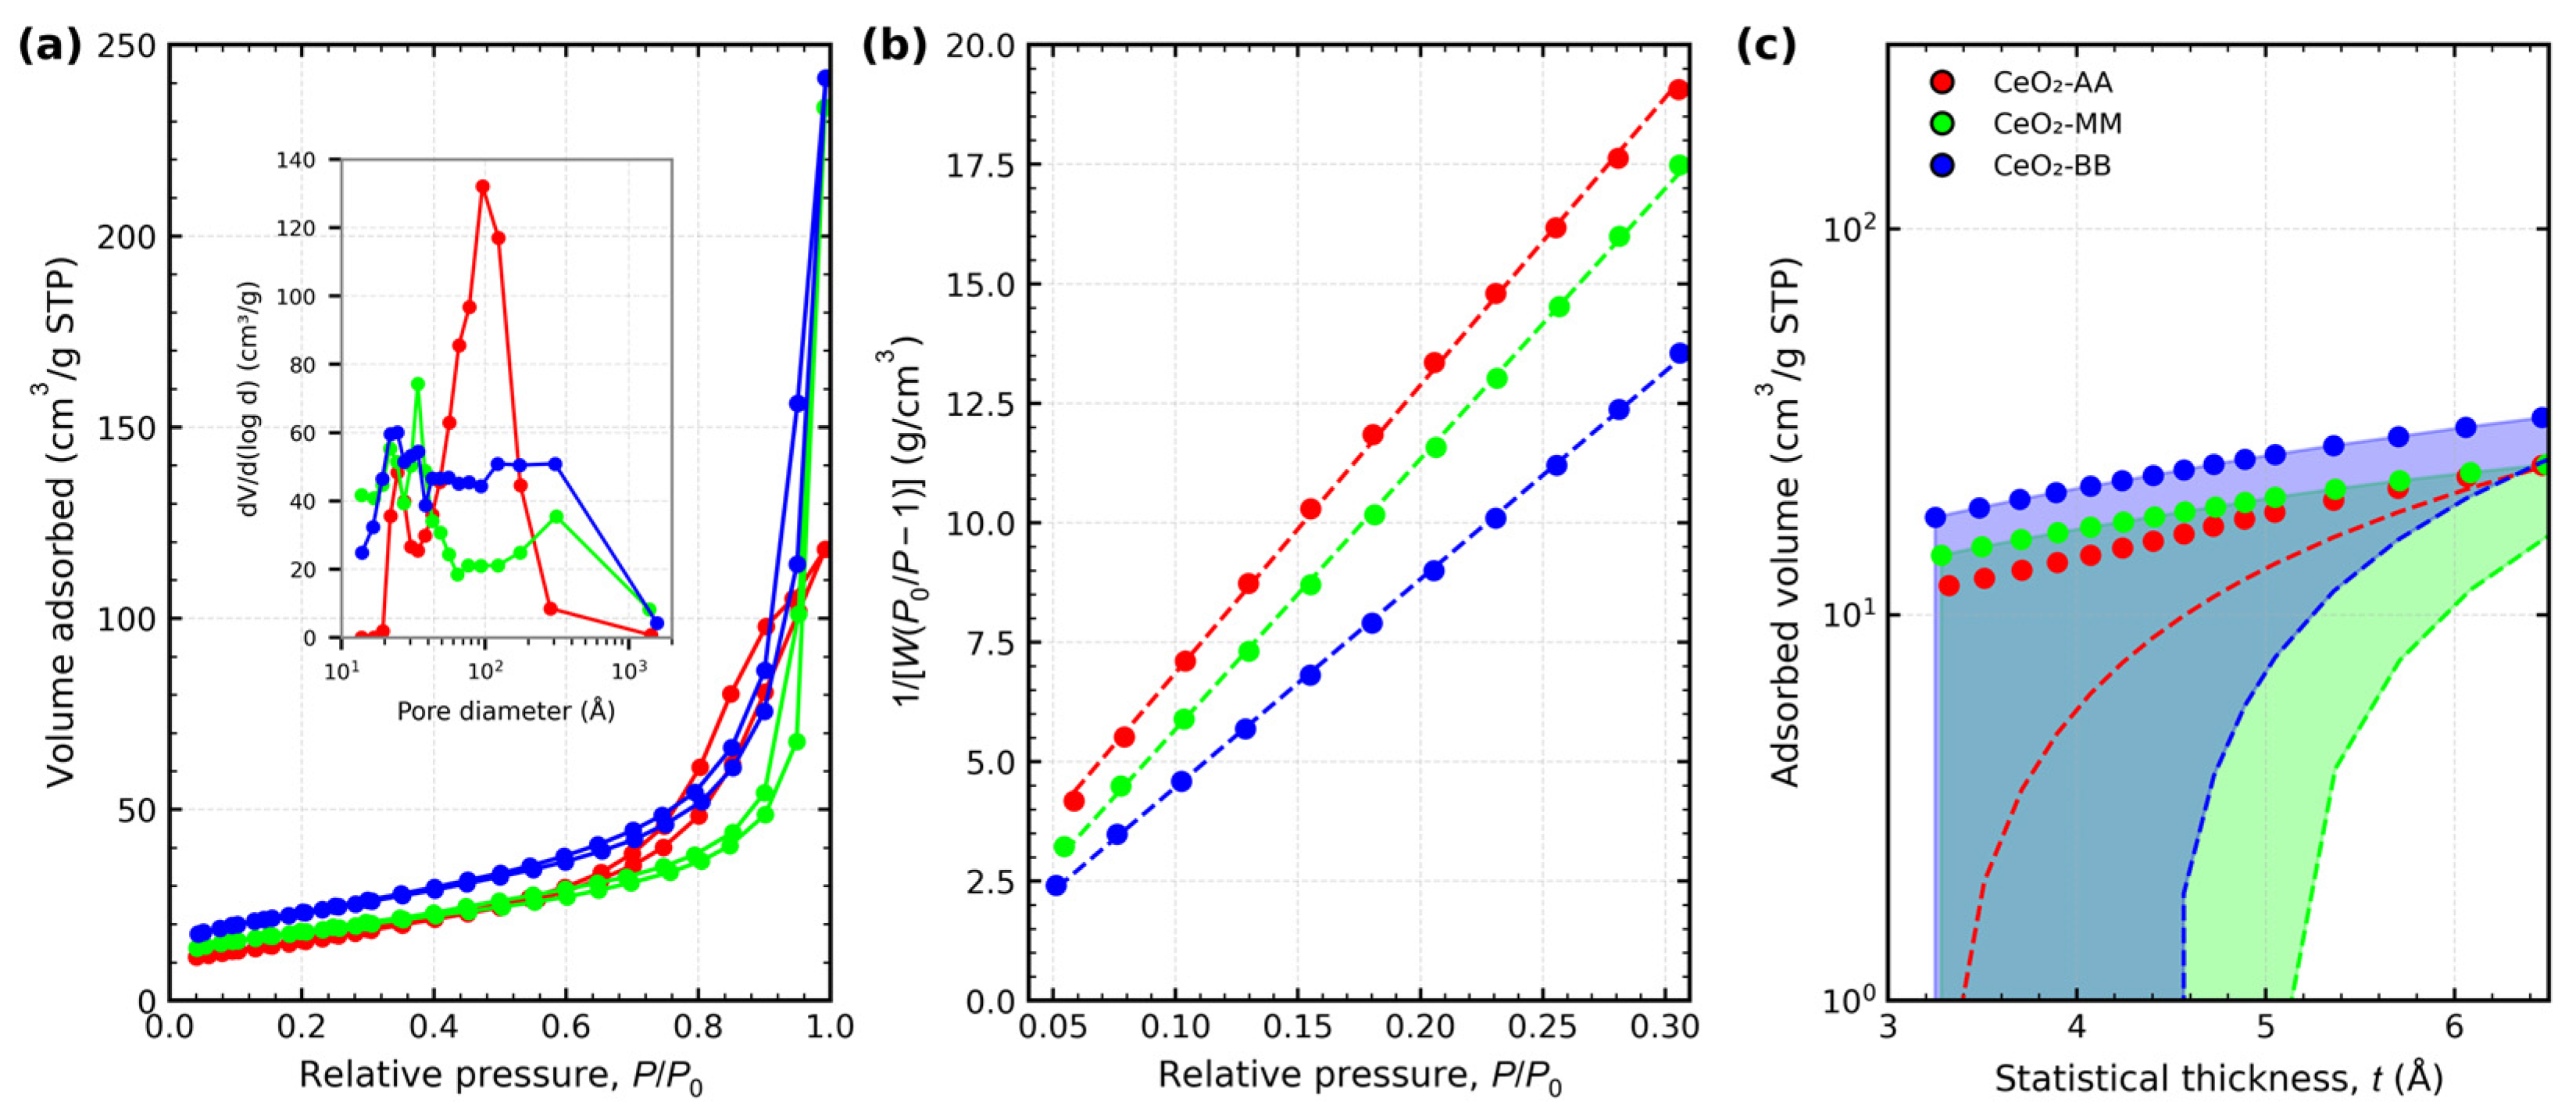
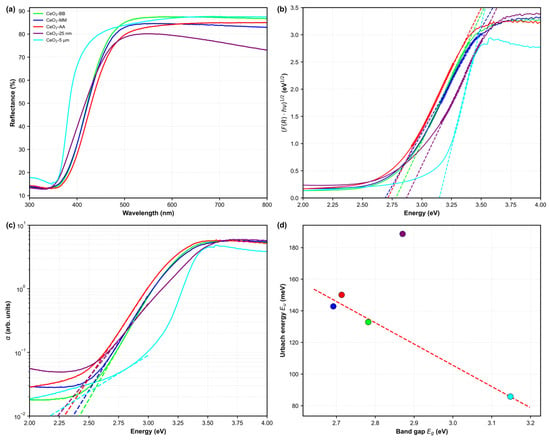
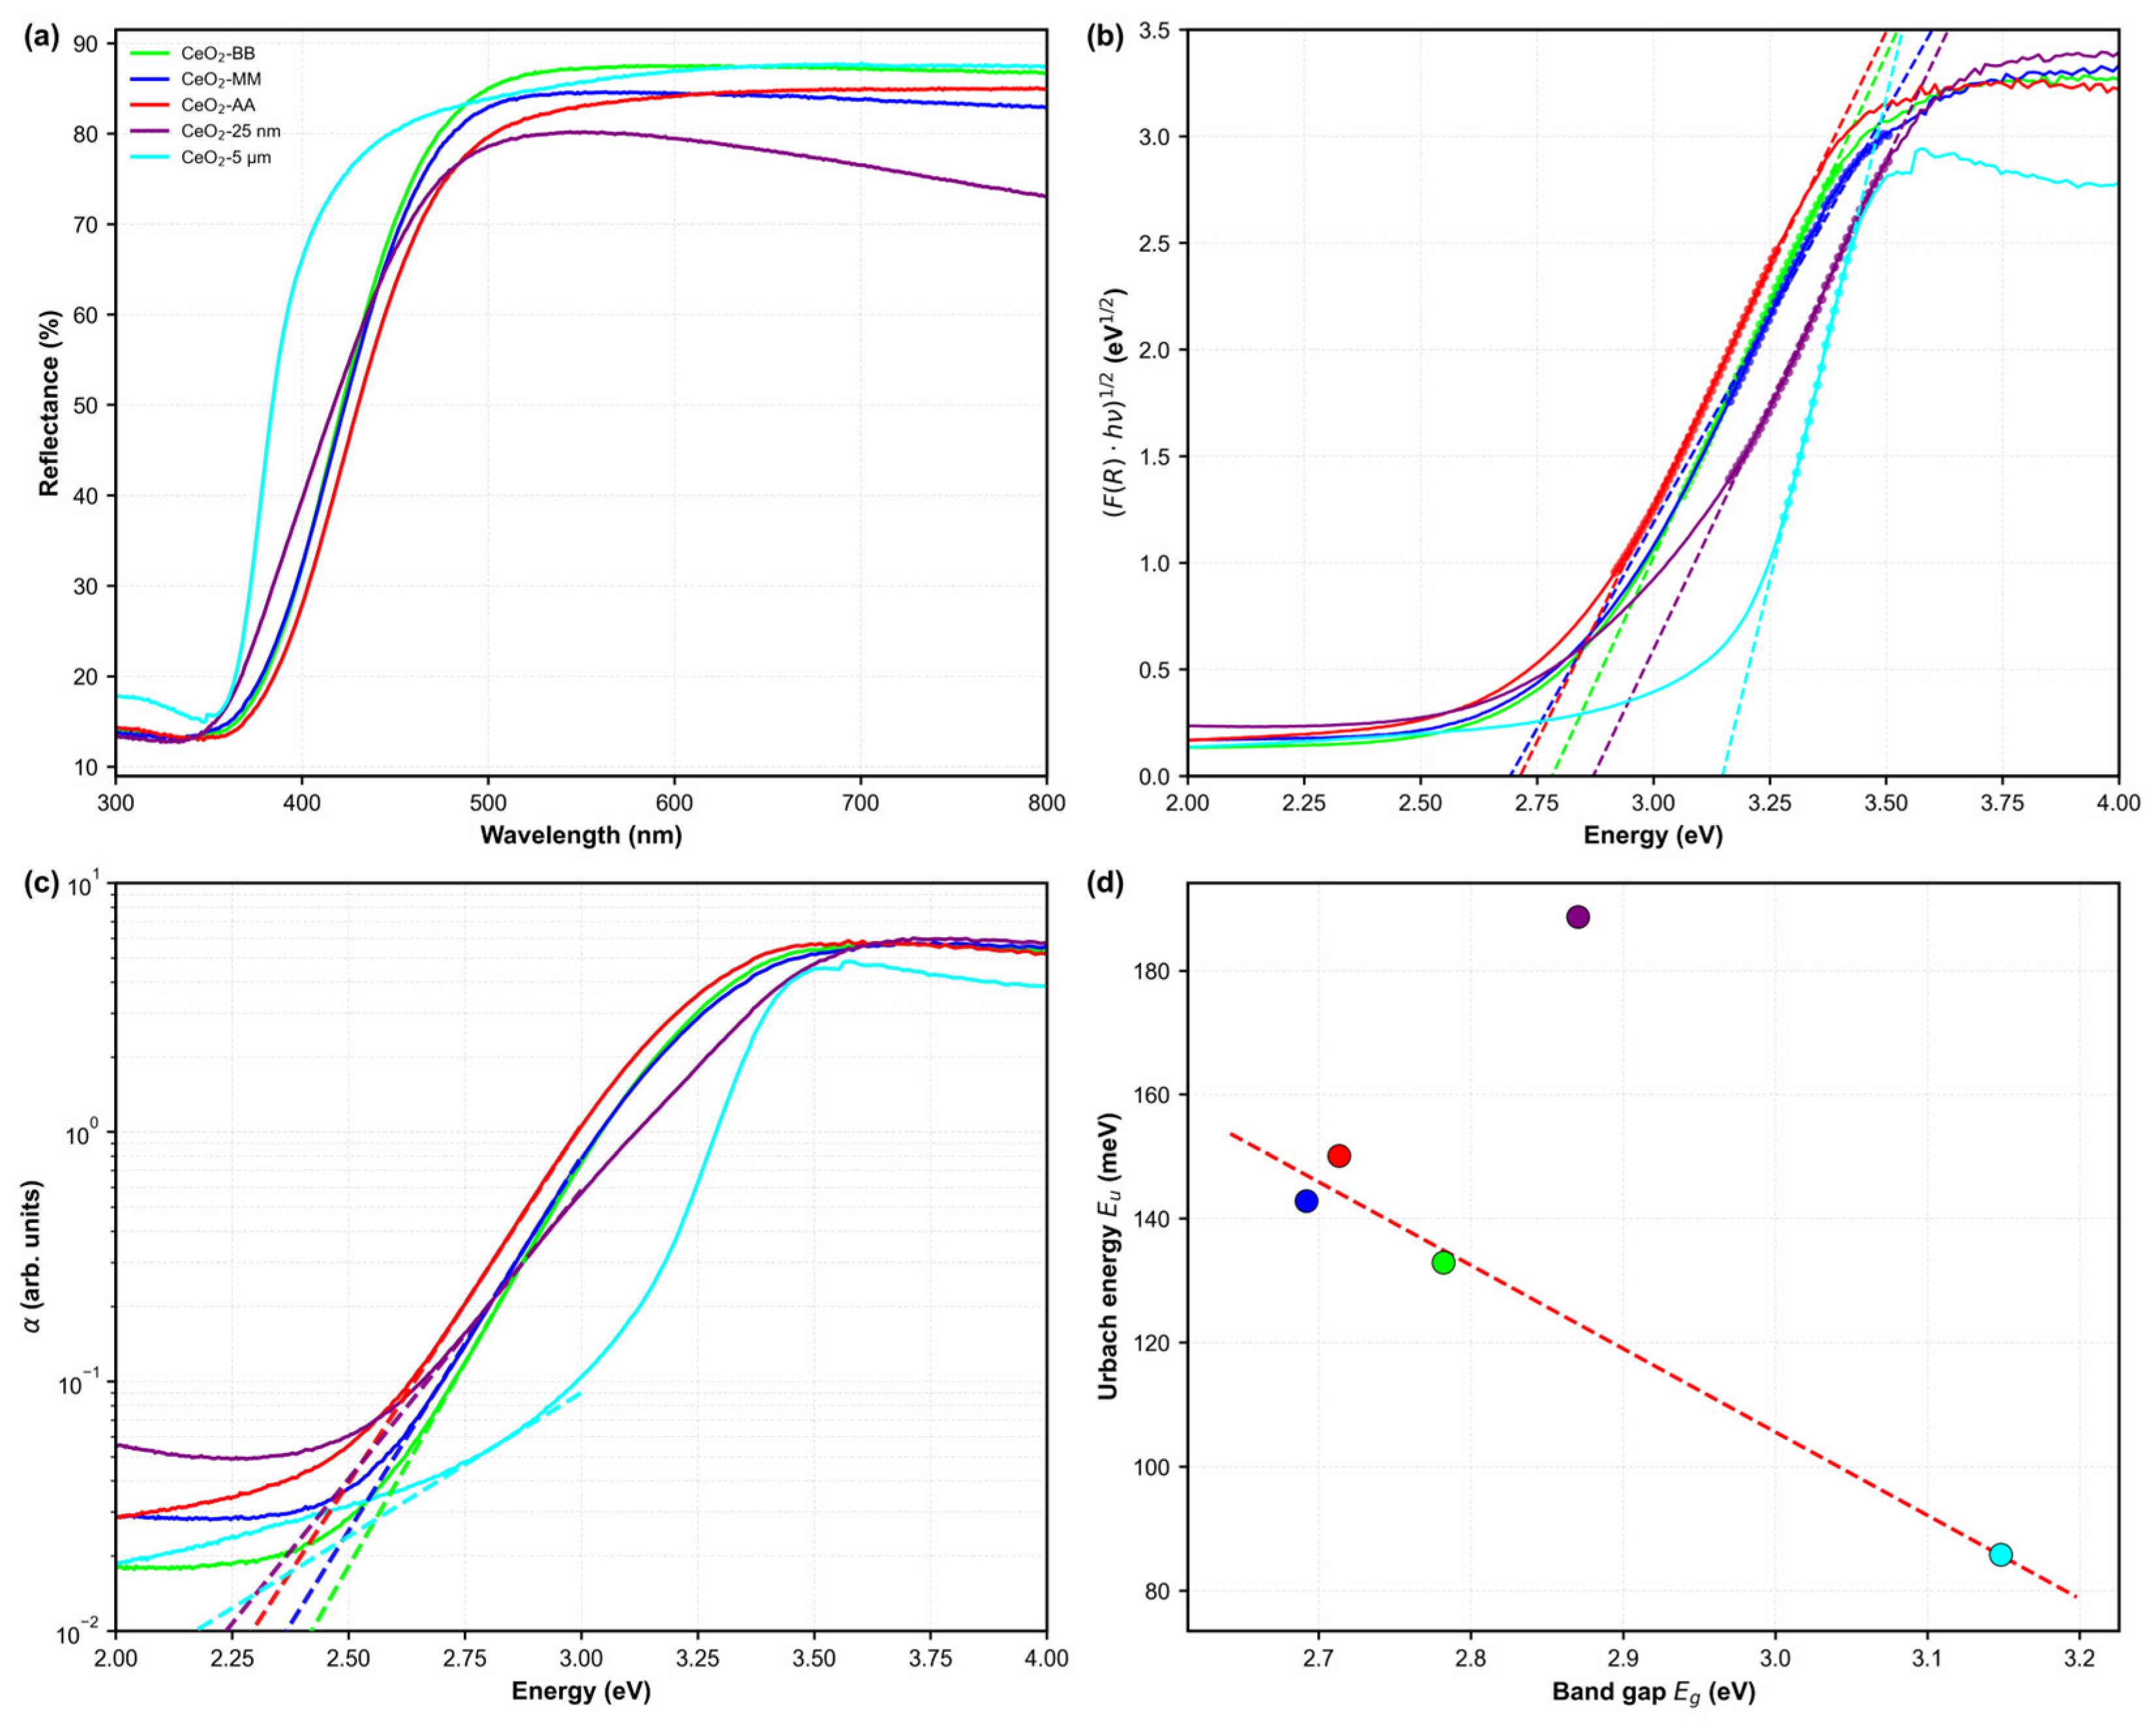
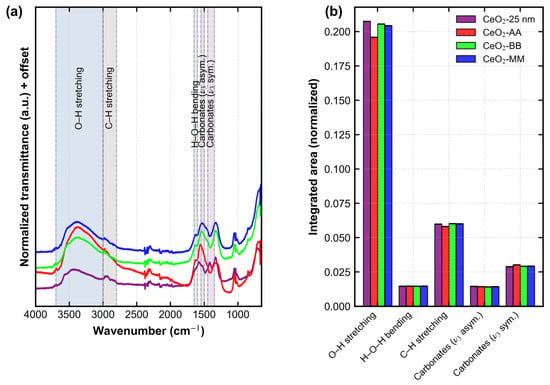
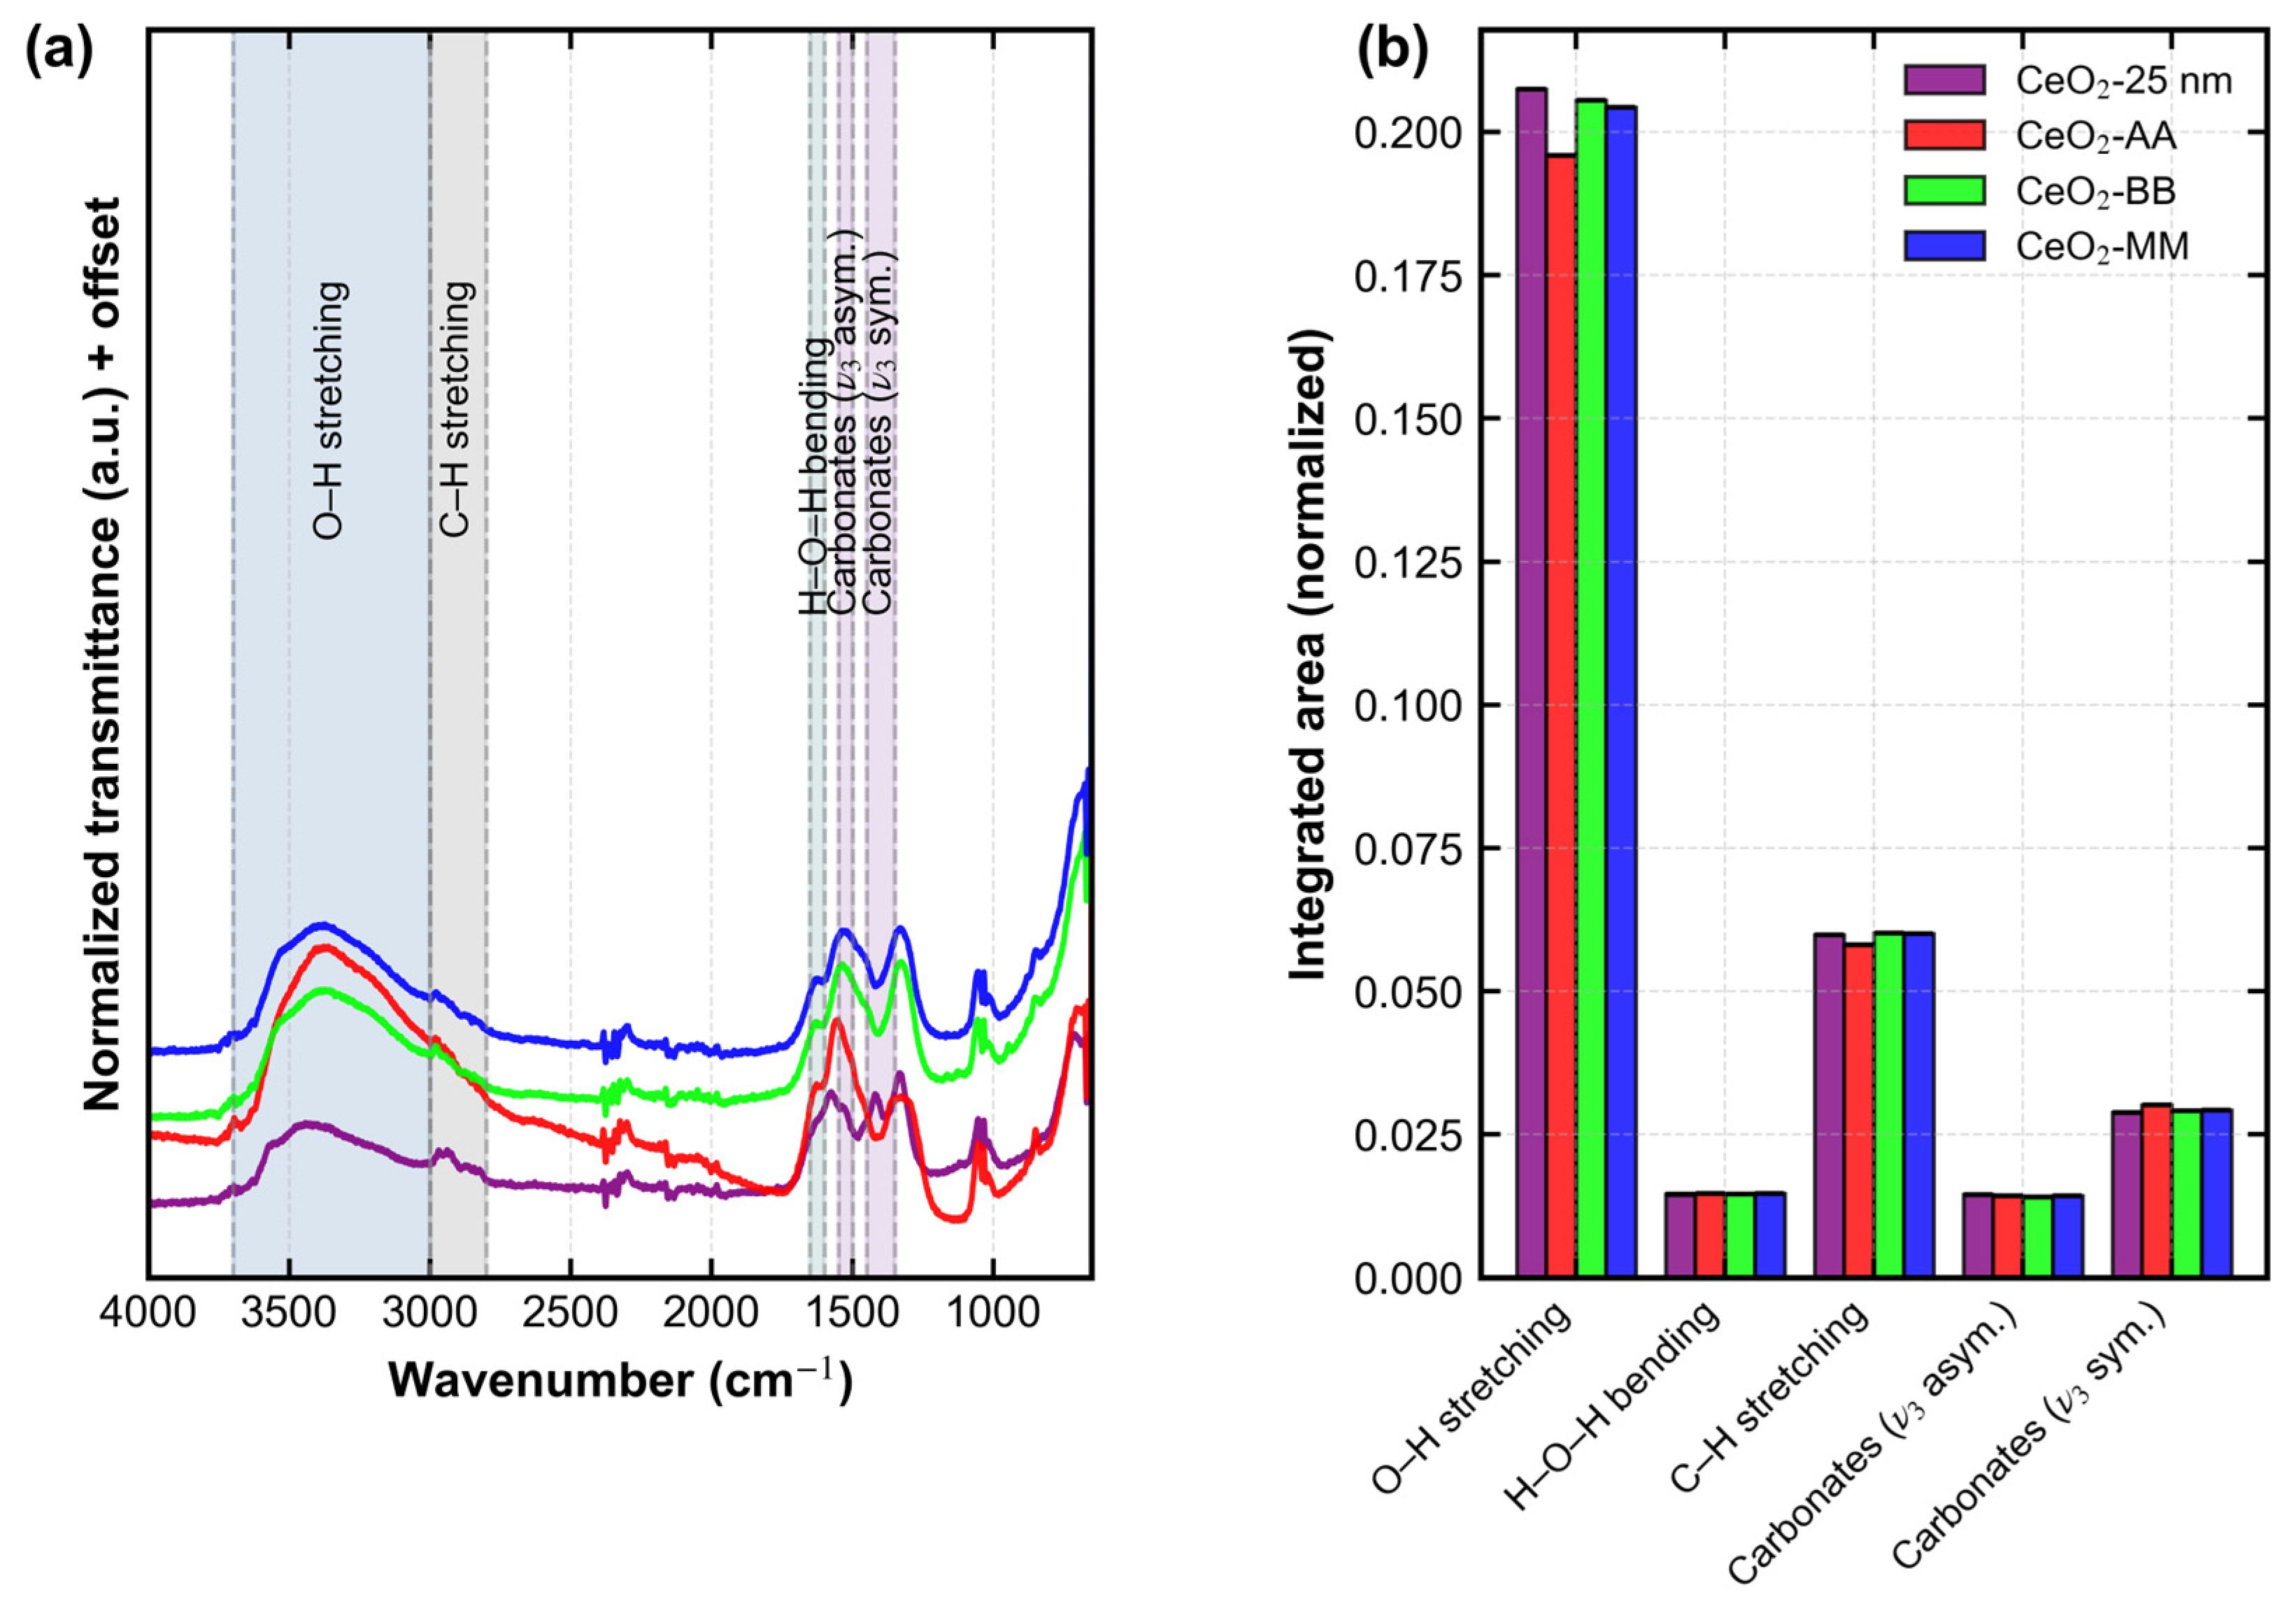
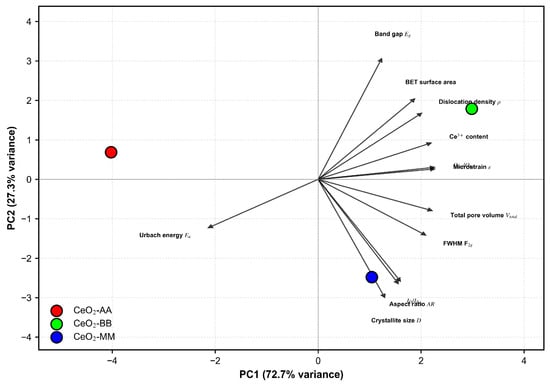
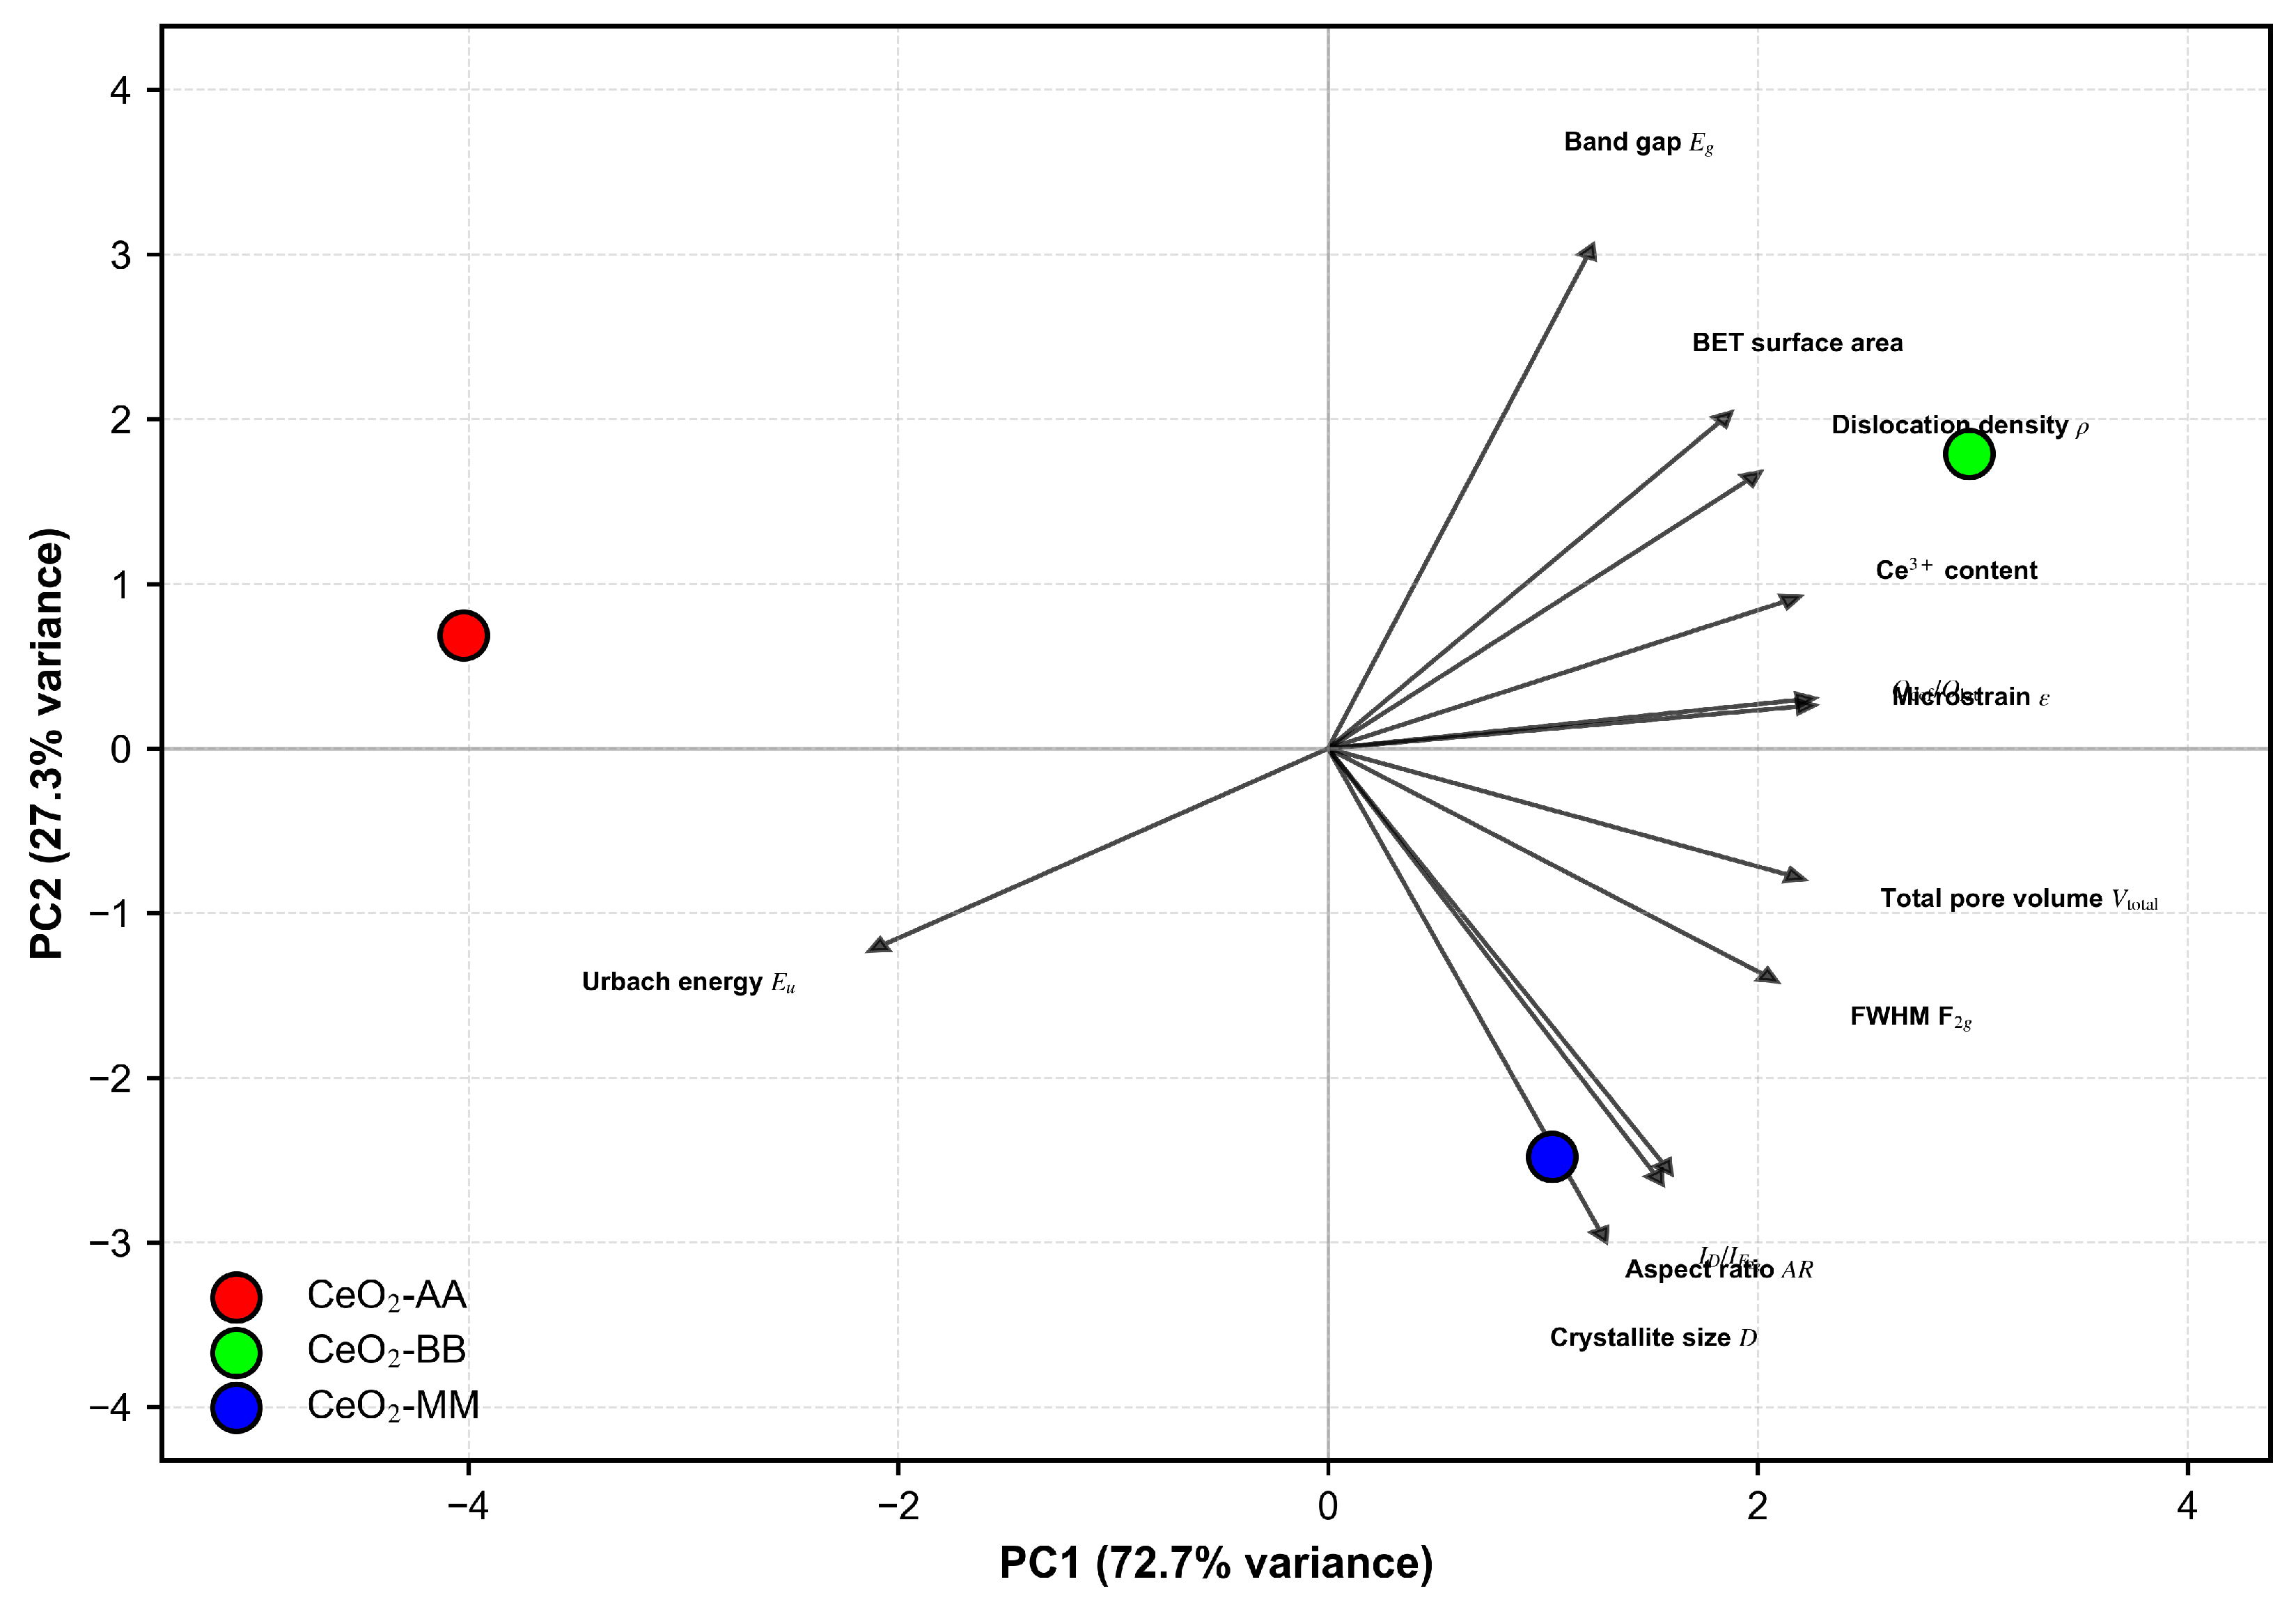

Disclaimer/Publisher’s Note: The statements, opinions and data contained in all publications are solely those of the individual author(s) and contributor(s) and not of MDPI and/or the editor(s). MDPI and/or the editor(s) disclaim responsibility for any injury to people or property resulting from any ideas, methods, instructions or products referred to in the content. |
© 2026 by the authors. Licensee MDPI, Basel, Switzerland. This article is an open access article distributed under the terms and conditions of the Creative Commons Attribution (CC BY) license.