


Abstract
To clarify the effects of rotor-induced downwash and crosswind on liquid sheet breakup and spray atomization characteristics of agricultural UAVs, an experimental platform integrating particle image velocimetry (PIV), a UAV spray system, and a wind tunnel was established. The droplet size and velocity characteristics of a flat-fan nozzle were investigated under different rotor speeds, crosswind conditions and spray pressures. The results showed that rotor-induced airflow significantly altered the post-breakup droplet characteristics. As the rotor speed increased from 0 to 2200 rpm, the volume median diameter (DV0.5) increased from 206.45 to 245.06 μm (18.7%), while the volume fraction of droplets smaller than 150 μm (V<150 (%vol)) decreased from 12.86% to 10.26%, indicating a shift toward coarser droplets under stronger downwash. Crosswind exhibited a limited influence on the primary breakup process but substantially modified droplet transport. Without rotor operation, increasing crosswind velocity from 0 to 6 m/s reduced the mean horizontal droplet velocity by 77.0%, promoting lateral droplet displacement. Under rotor operation at 2000 rpm, the downwash effectively enhanced spray plume stability and mitigated crosswind-induced distortion. Furthermore, increasing spray pressure from 0.10 to 0.50 MPa reduced DV0.5 from 274.29 to 222.24 μm and increased the proportion of fine droplets, demonstrating that spray pressure was the dominant factor controlling primary atomization. Overall, rotor-induced airflow primarily regulated droplet redistribution after atomization, whereas crosswind mainly affected droplet transport behavior. These findings provide theoretical guidance for optimizing UAV spray parameters and improving precision pesticide application efficiency.
1. Introduction
“Low-altitude Economic Integration with Agriculture” is an important direction for the integration of rural revitalization and agricultural modernization in China. As a key component of the low-altitude economy, agricultural drones occupy a significant share in agricultural management and the agricultural economic system. By 2024, the national agricultural drone operation area in China has exceeded 2.6 billion acres [1], corresponding to a crop protection service market of approximately 13 billion RMB. The global agricultural drone fleet has surpassed 500,000 units, contributing to water savings of about 330 million tons and a reduction of 42.58 million tons in carbon emissions. Plant protection drones, which perform tasks such as spraying chemical pesticides to control crop pests, diseases, and weeds, have developed rapidly in China due to their high operational efficiency, reduced pesticide usage, and their ability to overcome terrain and crop growth limitations.
Accurate pesticide application and drift reduction require control of the entire spraying process, including nozzle atomization, droplet transport, and deposition analysis, prediction, and control [2,3,4]. Nozzle atomization is fundamental to understanding droplet trajectories, drift, and deposition, as droplet size and initial velocity determine the subsequent motion and deposition of droplets on target crops. These processes form the basis of precision spraying [5]. Previous experimental studies [6,7,8,9] have confirmed that the initial atomization distribution of droplets was influenced by multiple factors, including the physical properties of the pesticide, the geometric structure of the nozzle, and external airflow conditions. Yang et al. [10] investigated the different morphological characteristics during the atomization process of emulsions and water under different pressures, and explained the structural differences between the two fragmentation mechanisms. Liu et al. [11] analyzed the atomization and drift characteristics of four surfactant solutions sprayed through three types of hydraulic nozzles, and conducted a correlation analysis, finding a strong correlation between the volume percentage of droplets smaller than 150 μm and drift potential. Gary et al. [6] conducted experiments on different types of hydraulic nozzles at various spraying pressures, testing parameters such as droplet size, velocity, droplet density, and spray angle during initial atomization. The experimental results showed that droplets produced by air-injection nozzles had larger sizes, lower speeds, and lower densities. Additionally, many researchers have explored the mechanisms of liquid sheet breakup through theoretical studies. Thijs et al. [12] studied the effects of high-speed wind on the formation and breakup of liquid sheet, and found that under the influence of high-speed wind, two breakup mechanisms exist. Small droplets are formed by “bags” within the liquid sheet, while large droplets are formed by perforations, leading to the construction of a probability density function. Broumand et al. [13] based on linear stability analysis, proposed a conjugate model considering the role of different shear forces and surface tension-driven instabilities in defining the liquid sheet’s intact radius and primary droplet size. These studies typically employ still-air conditions, uniform airflow, or controlled unidirectional airflow, which differ from the spatially non-uniform downwash airflow generated by UAV rotors.
In addition to nozzle geometry, operating pressure, and liquid properties, rotor-induced downwash is a key aerodynamic factor affecting UAV spraying performance. Previous experimental and numerical studies have characterized its velocity distribution, spatial non-uniformity, and vortical structures, as well as its dependence on rotor operating conditions, configuration, flight altitude, payload, and canopy interaction. Downwash can alter droplet transport, canopy penetration, deposition uniformity, and off-target drift [14,15,16,17]. However, most studies have assumed that droplets are already atomized and have focused on their subsequent transport and deposition. When a nozzle is located within or near the rotor wake, the continuous fan-shaped liquid sheet and newly formed ligaments are exposed to the non-uniform downwash before breakup is complete. The resulting gas–liquid relative velocity may therefore affect sheet deformation, instability development, breakup location, and the initial size and velocity of the droplets. Nevertheless, the primary breakup of liquid sheets under rotor-induced downwash remains insufficiently investigated.
Crosswind is another important aerodynamic factor in UAV spraying. Although previous studies have shown that it can deflect spray plumes, increase the displacement of fine droplets, and modify deposition distribution and uniformity [18,19,20], they have likewise focused mainly on post-atomization transport and deposition. By introducing a lateral airflow component, crosswind changes the magnitude and direction of the local gas–liquid relative velocity. Its interaction with the spatially non-uniform rotor wake may consequently modify the aerodynamic loading, deformation, instability, and primary breakup of the liquid sheet. Thus, breakup behavior under combined downwash and crosswind cannot be reliably inferred from studies considering either airflow component alone.
The present study investigates the primary breakup and initial atomization of a fan-shaped liquid sheet under the combined action of rotor-induced downwash and crosswind. An experimental platform integrating particle image velocimetry (PIV), a two-phase-flow measurement system, and a wind tunnel was developed to reproduce the aerodynamic conditions encountered during agricultural UAV spraying. The findings provide an experimental basis for predicting initial droplet characteristics, optimizing spray parameters, and reducing pesticide drift during agricultural UAV operation.
2. Materials and Methods
2.1. Arrangement of the Experimental Setup
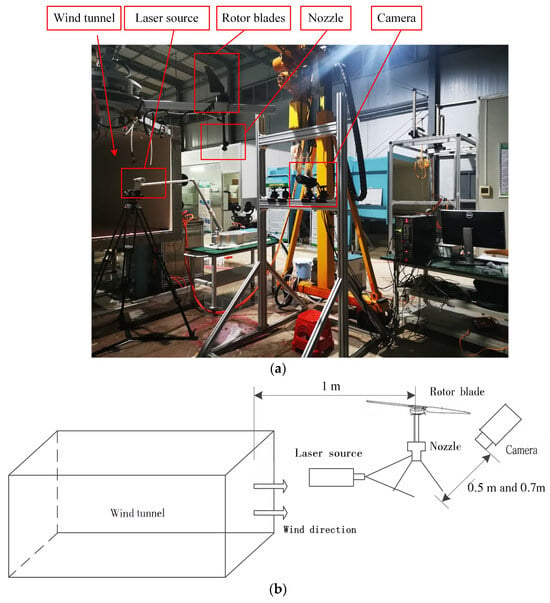
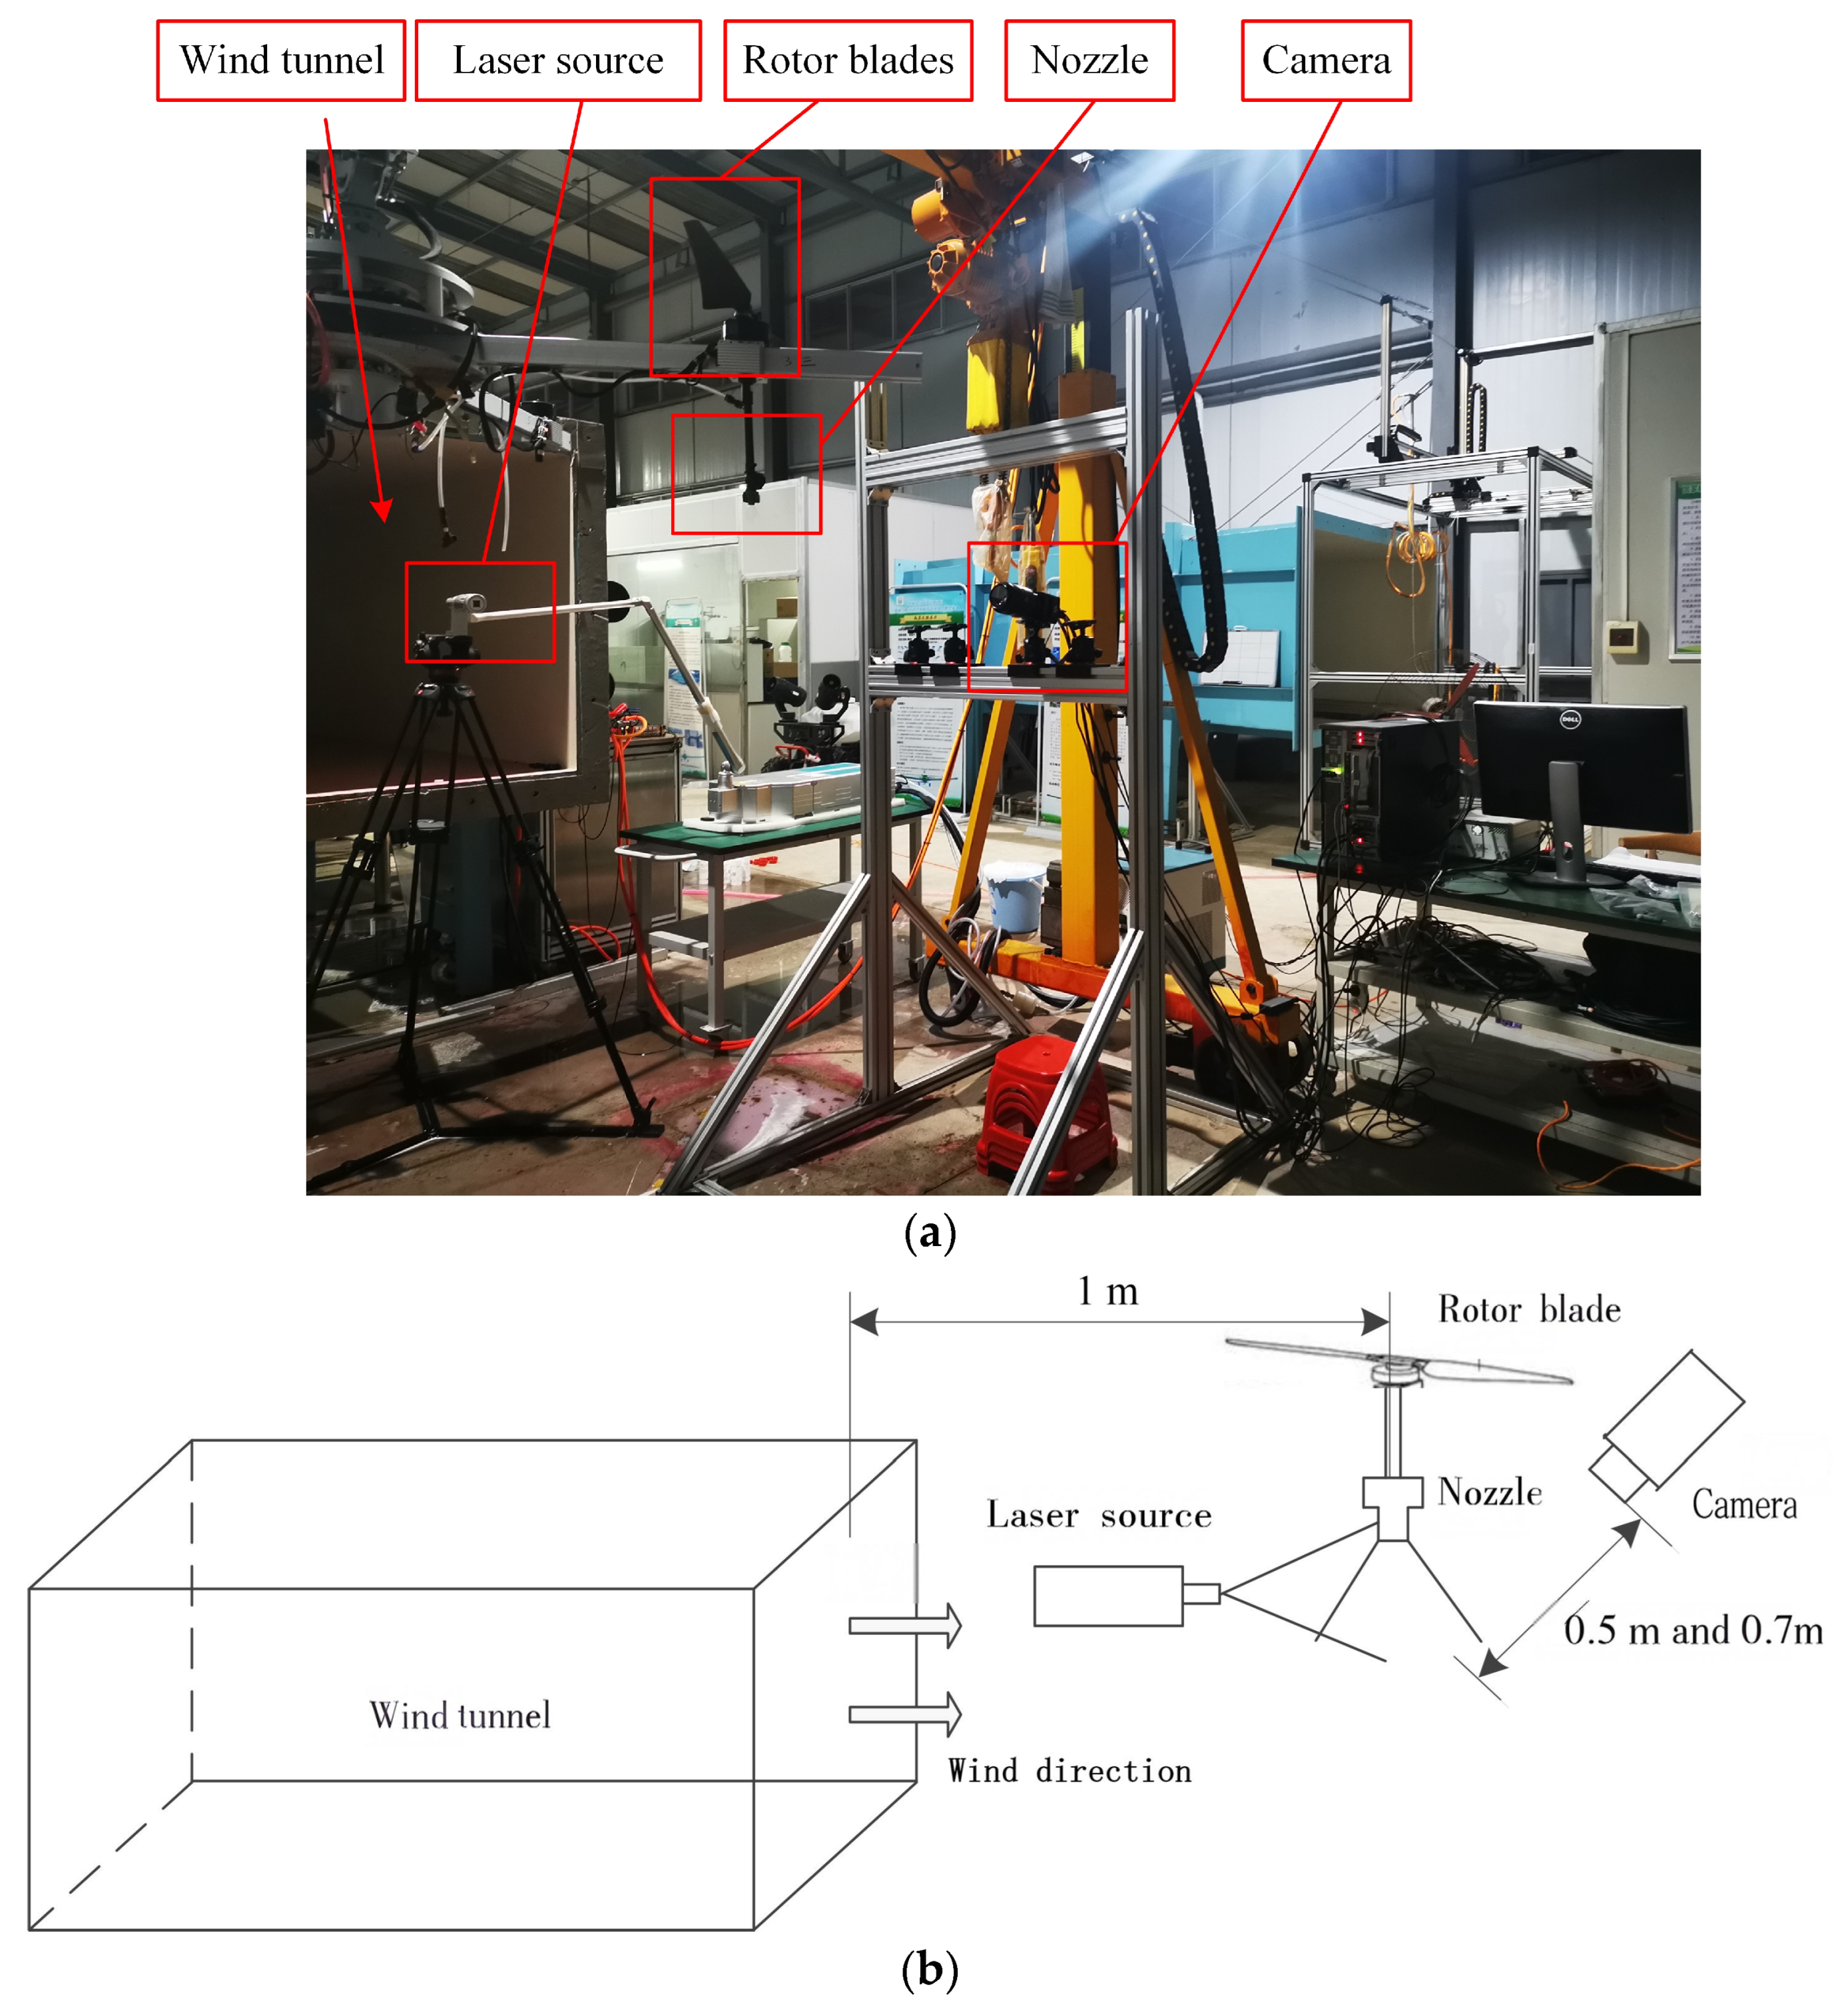
The experimental setup consisted of a PIV (Particle Image Velocimetry) system, a UAV two-phase flow test platform, and a combined high–/low–speed wind tunnel, as shown in Figure 1a. To prevent the PIV laser light source from being contaminated by droplets and thereby damaging the laser optics, the laser source was positioned between the upwind side of the nozzle and the exit of the wind tunnel. To ensure that the UAV two-phase flow platform was located within the uniform and steady airflow generated by the wind tunnel, and to guarantee safe rotor operation, the relative position between the UAV two-phase flow test platform and the wind tunnel was adjusted such that the nozzle mounted on the platform was placed 1 m downstream of the wind tunnel outlet. To investigate the influence of lateral wind speed on the liquid sheet breakup and atomization characteristics, the experimental configuration was designed to reproduce the in-field condition under which the liquid sheet plane is aligned with the lateral wind direction during plant-protection UAV operations. Accordingly, the liquid sheet plane of the fan-shaped nozzle was adjusted to coincide with the mid-plane of the wind tunnel, and the imaging plane of the PIV system was set parallel to the liquid sheet plane. The distance between the PIV camera plane and the liquid sheet plane, as well as the camera focal length, was adjusted so that the field of view encompassed both the spray sheet issuing from the nozzle and the primary atomization region. Based on the atomization images displayed on the workstation, the focal position of the laser-sheet optics and the laser intensity were further tuned to obtain clearer atomization images within the field of view. After calibration, to improve the accuracy of droplet size measurements and to comprehensively capture the velocity distribution in the spray flow field, the camera was positioned 0.5 m from the liquid sheet plane during droplet size measurements and 0.7 m during velocity distribution measurements. A schematic diagram of the entire experimental setup is shown in Figure 1b.
Figure 1.
(a) The experimental setup [21]. (b) A schematic diagram of the entire experimental setup.
2.2. UAV Two-Phase Flow Test Platform
The UAV Two-Phase Flow Test Platform was constructed as a modular gantry-mounted experimental facility rather than as a complete UAV. Its rotor and spray modules could be independently installed and adjusted according to the experimental requirements, allowing the rotor speed, nozzle position, and spraying parameters to be controlled separately. Agricultural UAV platforms relevant to this study commonly employ six or eight rotor units, with each rotor unit typically equipped with a two-bladed propeller. In the present experiment, only one rotor unit was installed to isolate the local influence of an individual rotor wake on the velocity and transport of spray droplets and to avoid the additional complexity introduced by overlapping wakes from adjacent rotors. The installed propeller was a full-scale commercial component originally designed for use on an agricultural UAV, rather than a geometrically scaled model. It consisted of two blades and had a specification of 33 × 9 inches, corresponding to a rotor diameter of 33 inches (0.838 m) and a nominal pitch of 9 inches (0.229 m).
A commercial extended-range flat-fan hydraulic nozzle (TeeJet XR110015, nominal spray angle: 110°; Spraying Systems Co., Ltd.,Wheaton, IL, USA) was mounted coaxially beneath the rotor motor, with its outlet located 0.38 m below the rotor plane and 1.5 m above the ground. The upstream gauge pressure was fixed at 0.30 MPa in the rotor-speed and crosswind experiments, whereas pressures of 0.10, 0.20, 0.30, 0.40, and 0.50 MPa were used to investigate the effect of spray pressure. The corresponding measured flow rates were 372.61 ± 3.5, 486.9 ± 2.8, 606.9 ± 6.8, 696.8 ± 4.4, and 822.6 ± 11.4 mL/min, respectively (mean ± SD, n = 3). The pressure-based ideal Bernoulli velocity was calculated as
where ΔP is the pressure difference between the nozzle inlet and the ambient atmosphere, and ρl is the liquid density. Using the measured solution density of 1.006 × 10³ kg/m3, the ideal Bernoulli velocities at 0.10, 0.20, 0.30, 0.40, and 0.50 MPa were 14.1, 19.9, 24.4, 28.2, and 31.5 m/s, respectively.
2.3. Wind Tunnel Apparatus
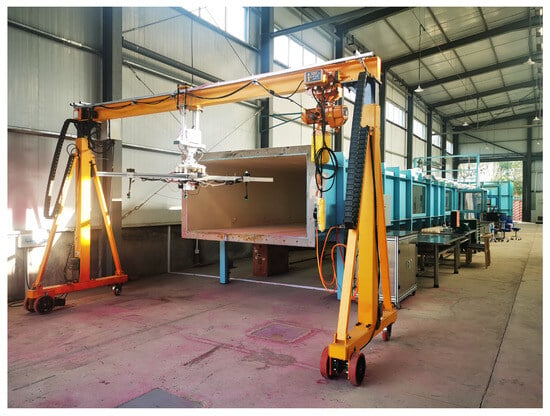
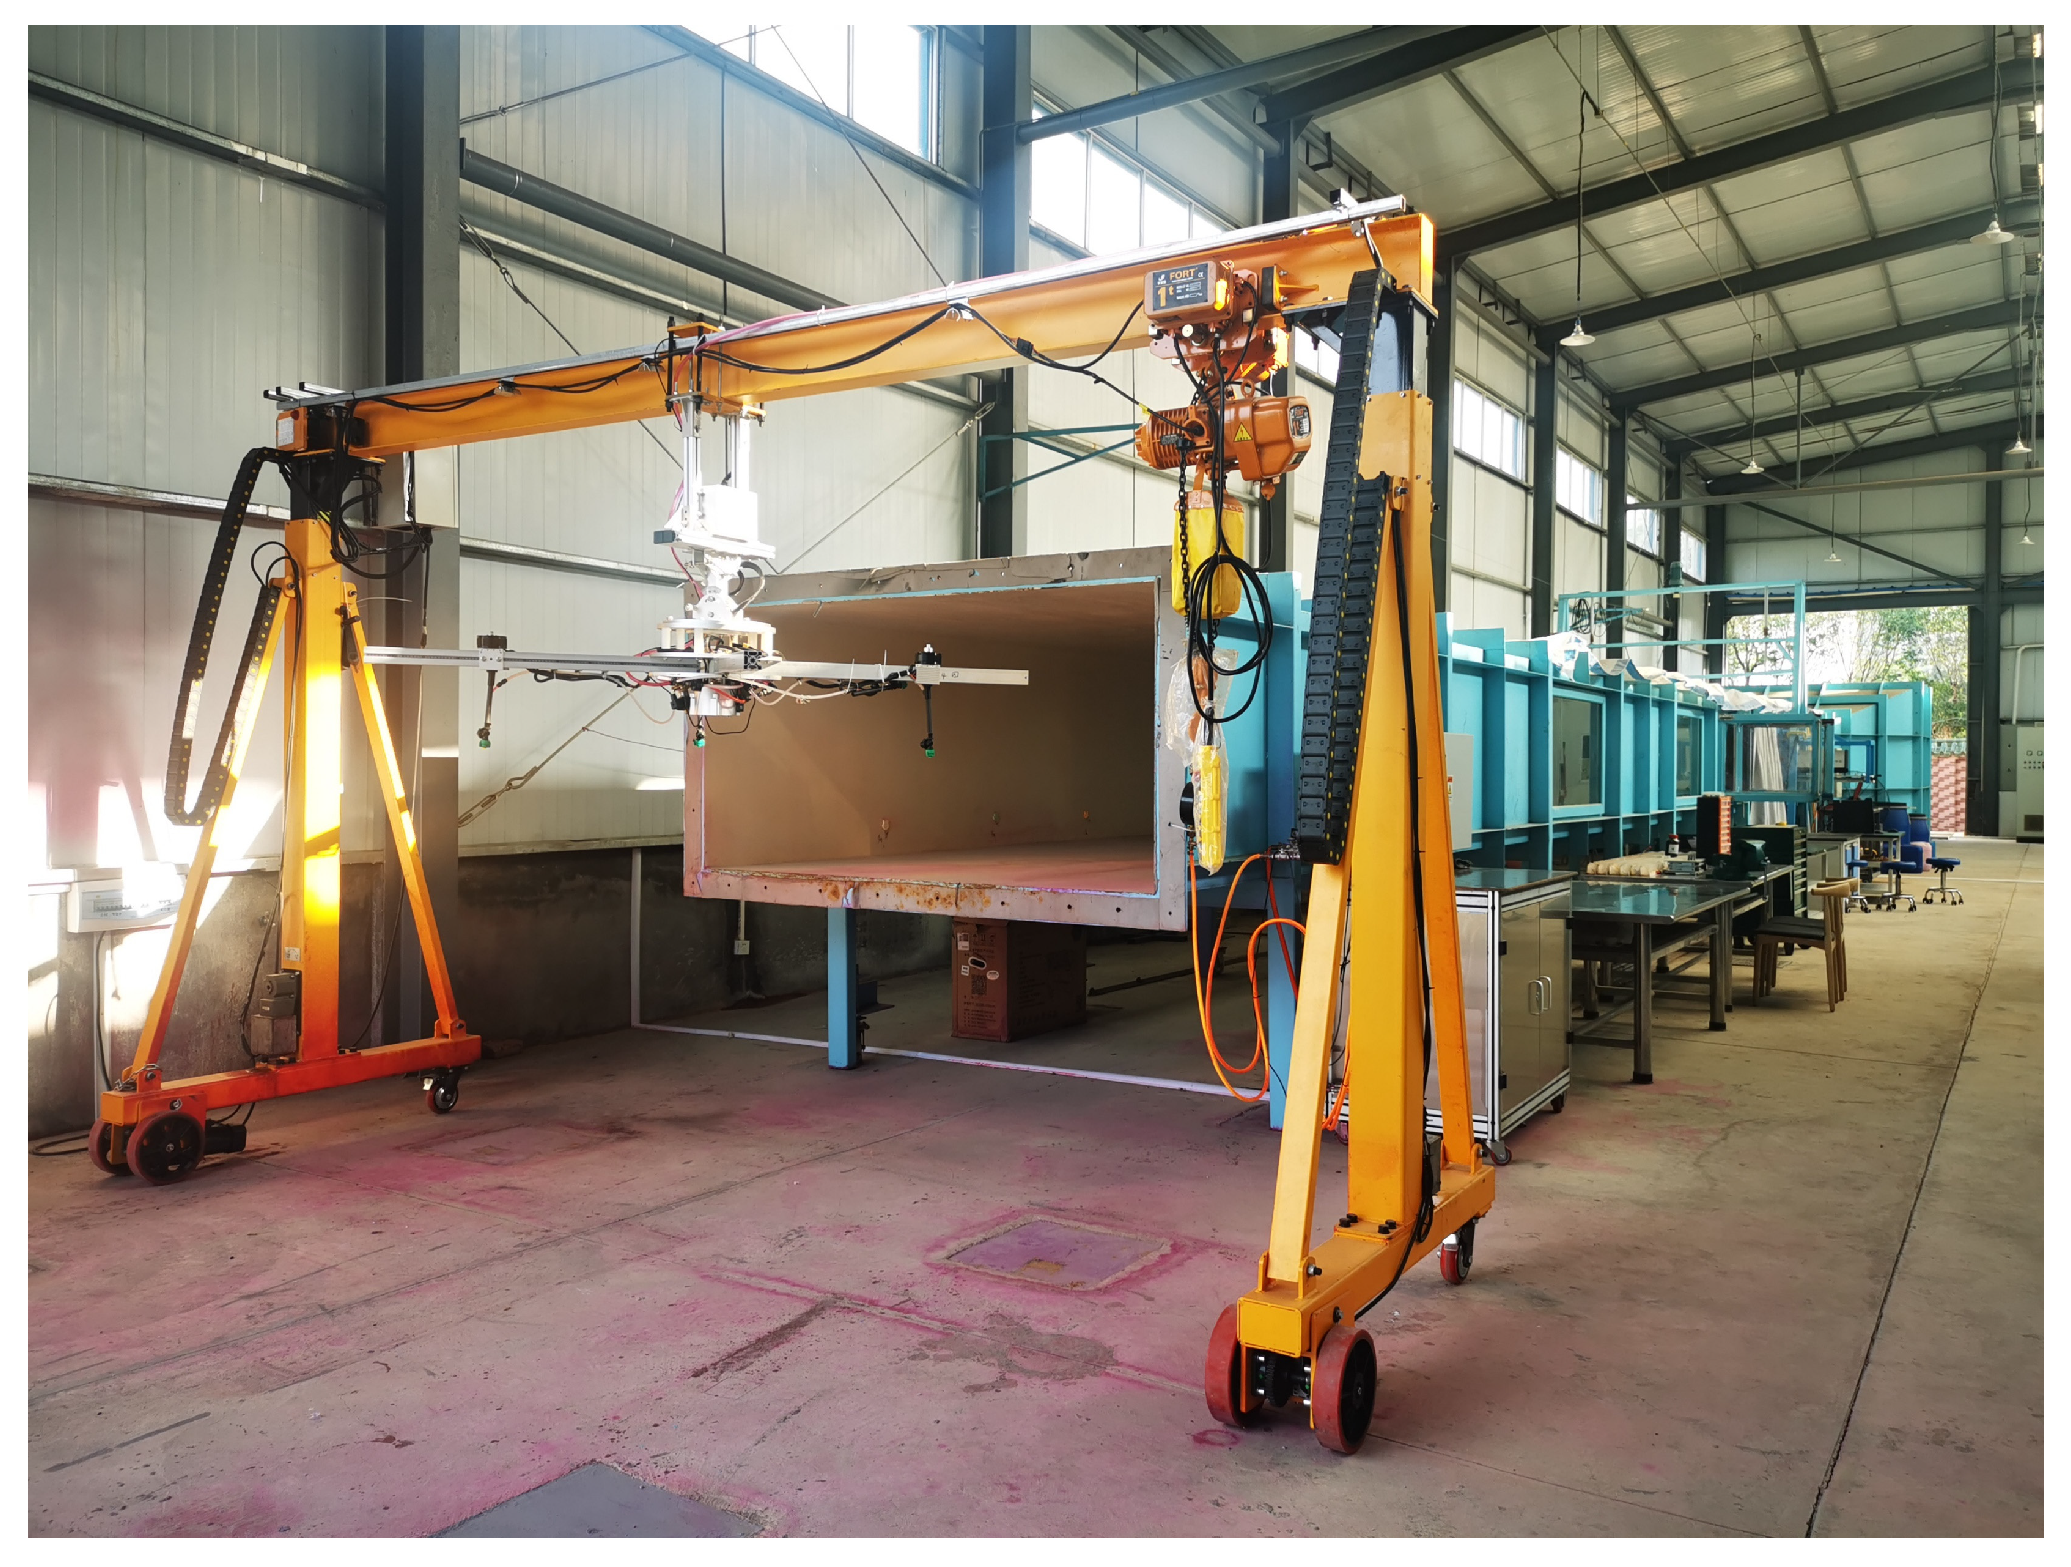
The wind tunnel used in this study was a high/low-speed composite wind tunnel specifically designed for agricultural aviation applications. The tunnel complies with the construction requirements of the ISO 22856 international standard [22]. The test section has a cross-sectional dimension of 2.0 m × 1.1 m (width × height). The wind tunnel is capable of generating a continuous, parallel airflow ranging from 0 to 52 m/s, as shown in Figure 2. Designed as a DC closed-circuit system, it primarily consists of six sections: the power section, transition section, diffuser section, settling chamber, contraction section, and test section. Detailed technical specifications are provided in Table 1.
Figure 2.
Wind tunnel.
Table 1.
Main technical indexes of wind tunnel.
2.4. PIV Measurement System
In this experiment, a PIV system (TSI Incorporated., Shoreview, MN, USA) was employed to characterize the droplet flow field within the atomization region. The PIV system mainly consists of four components: a laser unit, an image acquisition optical system, image processing and analysis software, and a synchronization device. The laser unit (Nd:YAG, Litron Lasers Ltd., Warwickshire, United Kingdom) consists of a dual-cavity laser, a light arm, and a laser lightsheet optics. The dual-cavity laser is capable of producing two laser pulses with an energy range of 65–500 mJ, and a maximum pulse emission frequency of 15 Hz. In this experiment, the laser pulse energy was adjusted according to the real-time imaging feedback provided by the image acquisition software. The pulse energy is divided into ten levels, with level 10 representing the maximum energy output. For this experiment, level 8 was selected, and the emission frequency was set to 7.5 Hz. The laser arm is used to transmit the laser, and it can transmit two independent laser beams at once. The time interval between the emission of the two laser beams depends on the speed of the liquid sheet. For this experiment, the chosen interval time is 30 µs. The laser lightsheet optics is used to shape the high-energy pulse laser into a stable, uniform thin sheet, which illuminated the particles in the atomization flow field, enabling precise measurement of the flow field velocity and droplet size. After adjustments, the laser lightsheet optics was coplanar with the liquid sheet. When the horizontal distance was set to 1 m, the particles in the target region of the flow field were illuminated to the maximum extent, resulting in the highest image quality for the flow field captured in the experiment. The image acquisition optical system consisted of a CCD camera and two lens. The CCD camera (model 630091 PowerView 4MP-HS, TSI Incorporated, Shoreview, MN, USA) with a resolution of 2048 × 2048 pixels was used to capture images in the laser-illuminated flow field. The camera offers two operating modes. The free-running mode is used for system calibration and diagnostics, while the frame-straddling mode is employed for actual flow field measurements. The experiment employed an AF-S VR macro lens (Nikon Corporation, Tokyo, Japan) and a Nikon® 50 mm lens. The Nikon® 50 mm lens was used to capture large-scale atomization flow fields for the calculation of velocity distributions, while the AF-S VR macro lens was used to capture the initial atomization flow field during liquid sheet breakup at smaller scales for droplet size distribution analysis. The experiment utilized Insight 4G image acquisition and analysis software, which allows capture of a long sequence of images and performs analysis of the images to give the time series data. Subsequently the velocity fields and the associated fluid statistics are calculated to provide details of the flow. The synchronizer (model 610036) serves as the timing control module of the imaging system. It is connected to the computer, frame grabber, camera, laser, image shifter, external trigger, and external devices, and the synchronizer connects to all these devices and synchronizes their operation. The key technical parameters of the PIV system are summarized in Table 2.
Table 2.
Main technical parameters of PIV system.
2.5. Experimental Scheme Design
Since the typical concentration of pesticide additives during daily spraying operations is 1% [23,24], the experimental spraying solution was prepared as a 1% surfactant solution consisting of water and sodium dodecylbenzenesulfonate (neoFroxx GmbH, Einhausen, Germany) to simulate the physical properties of pesticides. A grouped one-factor-at-a-time experimental design was used to investigate the effects of rotor speed, crosswind speed, and spray pressure. During the investigation of the effects of rotor rotational speed and wind tunnel airflow velocity on liquid sheet breakup and atomization, the UAV two-phase flow test platform provided a spraying pressure of 0.30 MPa. Based on the typical operating rotor speed range of plant protection UAV and the safety limits of the test platform, the rotor rotational speeds were set to 0, 700, 1000, 1500, 2000, and 2200 rpm. Since the nominal operating rotational speed provided by the rotor manufacturer is 2000 rpm, the atomization process and results of the nozzle were also investigated at a rotor speed of 2000 rpm under different wind tunnel airflow velocities of 0, 2, 4, and 6 m/s. The 0-rpm condition was not intended to represent a normal UAV operating state. It was included as a reference condition to distinguish the effects of the ambient wind-tunnel airflow and nozzle-generated spray from the additional airflow induced by rotor rotation. Meanwhile, based on the pressure regulation range of the liquid pump during plant protection UAV spraying operations (0~0.40 MPa), five spray pressures were selected for testing, namely 0.10, 0.20, 0.30, 0.40, and 0.50 MPa. At the same rotor speed of 2000 rpm, the effects of spray pressure on the liquid sheet and the distribution of initially atomized droplets were investigated. The specific experimental scheme is presented in Table 3.
Table 3.
The liquid sheet breakup and atomization characteristics under the condition of different rotor speeds and different crosswind speeds.
2.6. Data Processing
For each experimental condition, a total of 100 pairs of particle images, corresponding to 200 individual frames, were acquired across three independent replicate experiments. The instantaneous velocity fields and droplet characteristics were obtained by processing the image pairs using the cross-correlation algorithm. The time-averaged velocity distributions were calculated based on the results obtained from all image pairs to reduce the influence of instantaneous fluctuations and improve measurement reliability.
Before image processing, geometric calibration was performed to establish the relationship between pixel coordinates and physical dimensions. A steel ruler was placed in the same plane as the liquid sheet and aligned with the spray direction. Based on the calibration results, the spatial resolutions of the captured images were determined as 55.00 μm/pixel and 28.25 μm/pixel when the camera distances were 0.7 m and 0.5 m, respectively.
To improve image quality and accurately identify droplets, the captured images were converted into grayscale images, and an appropriate grayscale threshold was applied to distinguish droplet signals from background noise. In this study, a threshold value of 40 was selected after repeated adjustments to remove image noise while preserving the effective droplet information.
For velocity field calculation, the interrogation window size was optimized according to the displacement characteristics of particles between two consecutive images. The grid size was adjusted to ensure that most particle displacements were within one-fourth of the interrogation area, thereby improving the accuracy of cross-correlation calculations. Spurious velocity vectors caused by poor particle matching or image noise were identified and corrected using the local average velocity method. Specifically, erroneous vectors were replaced by the averaged velocity of neighboring particles within a 5 × 5 region.
To quantitatively evaluate the atomization characteristics, the droplet size distribution was statistically analyzed at a location 60 mm downstream from the nozzle, where the liquid sheet was considered to have completed the primary breakup process. The median volumetric diameter (DV0.5) was selected as the representative parameter of the overall droplet size distribution, representing the diameter at which 50% of the spray volume consists of droplets smaller than this value. In addition, the volumetric percentage of droplets smaller than 150 μm (V<150 (%vol)) was calculated to evaluate the potential drift risk of fine droplets.
The effects of rotor rotational speed, crosswind velocity, and spray pressure on droplet atomization were analyzed by comparing variations in droplet size distribution and velocity field characteristics. The velocity components along the horizontal and vertical directions were defined as U and V, respectively.
2.7. Data Processing Statistical Analysis
Statistical analyses were performed separately for the single-factor experiments described in Section 2.5. For the flow-rate measurements, data are presented as the mean ± standard error based on three independent experimental replicates per condition (n = 3). For the velocity-field and droplet-size measurements, 100 consecutive image pairs were acquired in total across the three independent replicate experiments for each experimental condition. The velocity and droplet-size parameters were calculated for each image pair. For each replicate experiment, the measurements obtained from all image pairs were averaged to obtain one replicate-level mean. The overall mean and SEM were then calculated from the three replicate-level means. Differences in mean velocity and mean droplet diameter among experimental conditions were evaluated using one-way analysis of variance (ANOVA), followed by Tukey’s honestly significant difference (HSD) test. The normality of the residuals and homogeneity of variance were assessed using the Shapiro–Wilk and Levene tests, respectively. Statistical analyses were performed using SPSS version 16.0 (SPSS Inc., Chicago, IL, USA).
3. Results and Analysis
3.1. Influence of Rotor Speed on Atomization Characteristics
3.1.1. Spray Droplet Velocity Field
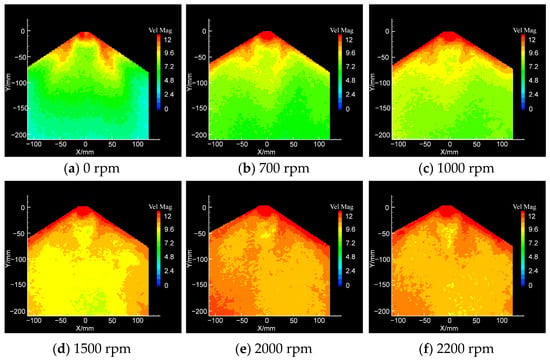
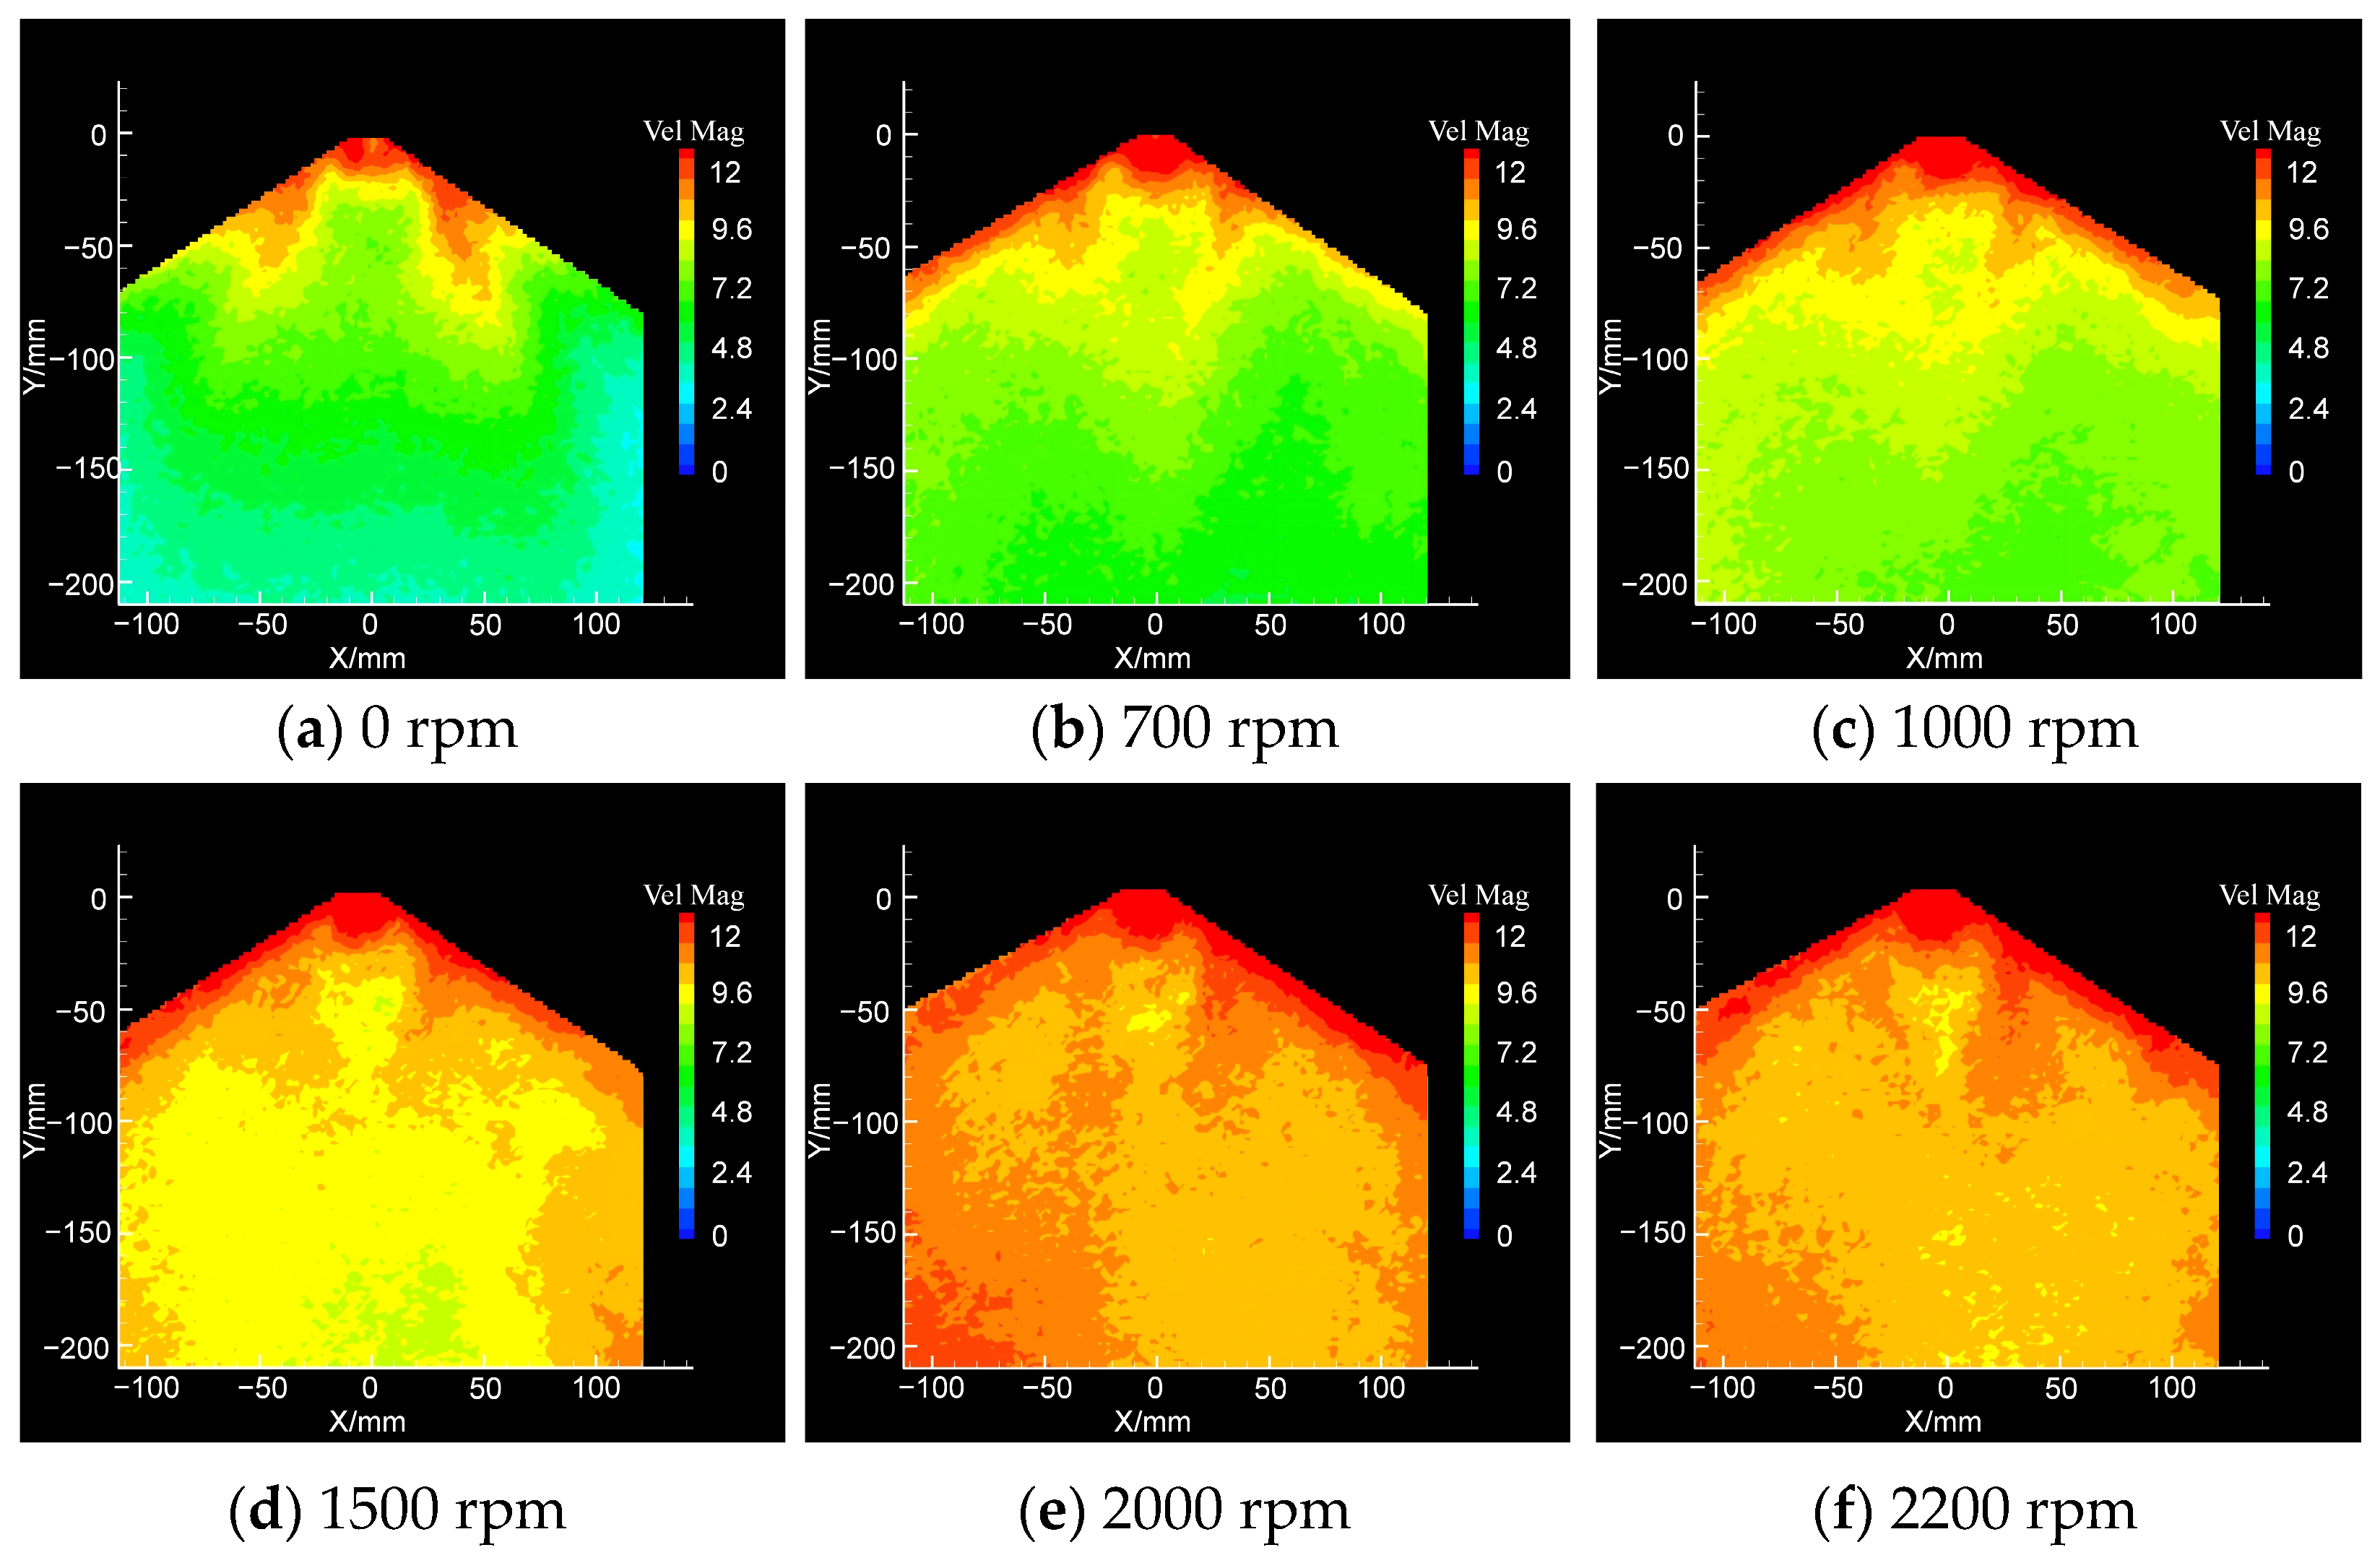
Figure 3 shows the contour maps of the spray droplet velocity field at rotor speeds of 0, 700, 1000, 1500, 2000, and 2200 rpm, with a spray pressure of 0.30 MPa. It can be seen from Figure 3 that the maximum velocity in the spray droplet velocity field occurred in the region near the liquid sheet. Within 1000 rpm, as the rotor speed increased, the droplet velocity increased slightly. When the rotor speed reached 1500 rpm and above, the droplet velocity increased significantly. This indicates that the downwash airflow generated by the rotor can greatly promote the velocity of the droplets, which shortens the time the droplets are exposed to the air during spray application by plant protection UAVs and significantly reduces the probability of droplet drift.
Figure 3.
Spray droplet velocity distributions at different rotor speeds.
3.1.2. Droplet Velocity Distribution
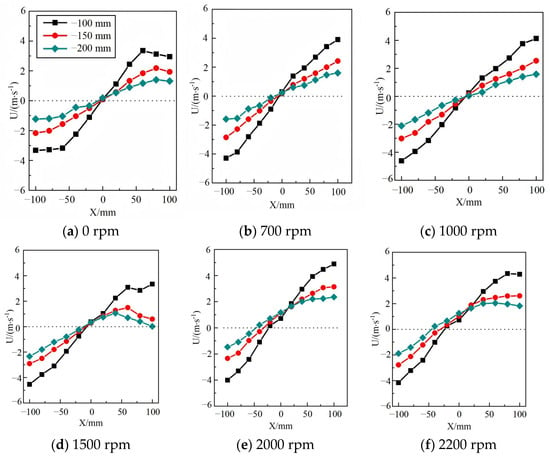
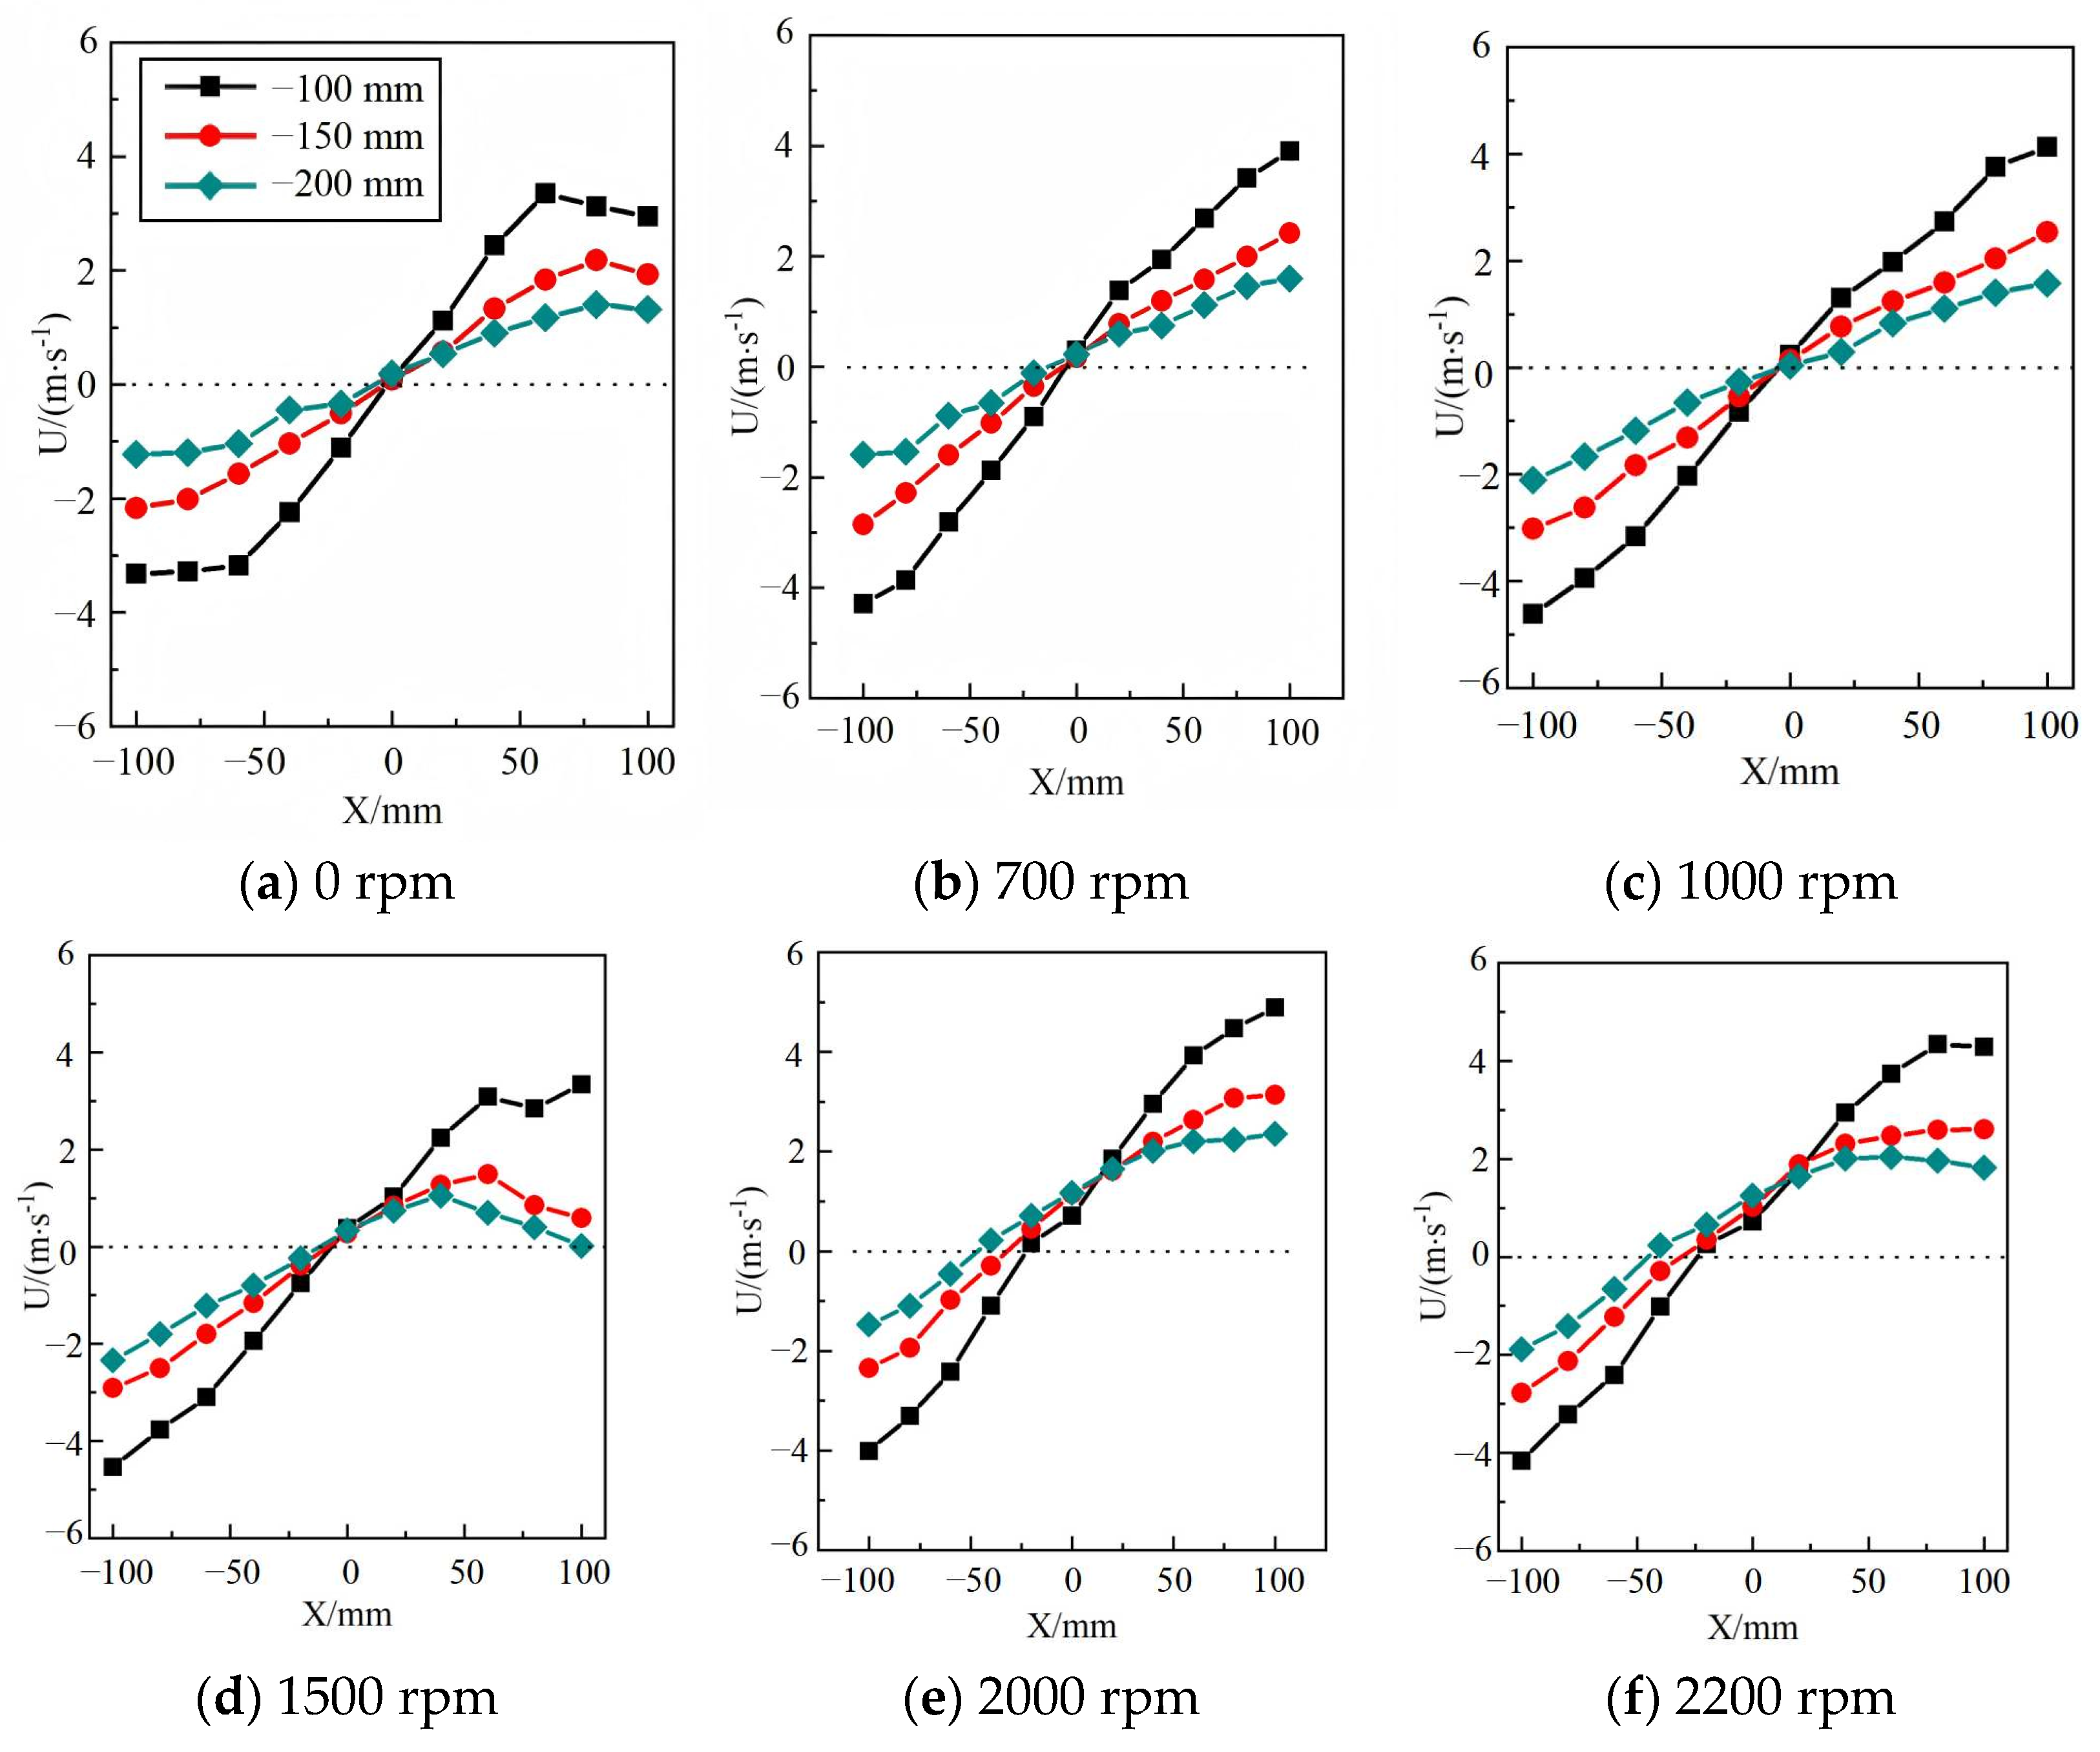
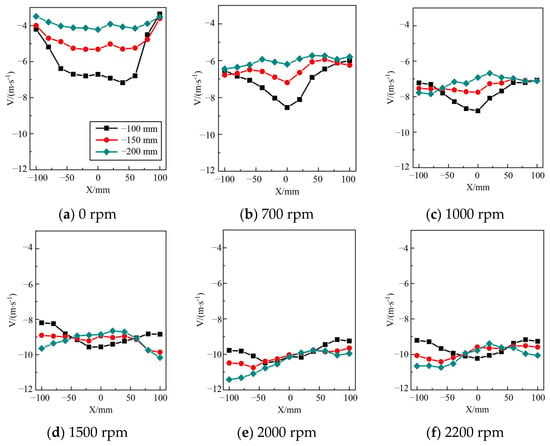
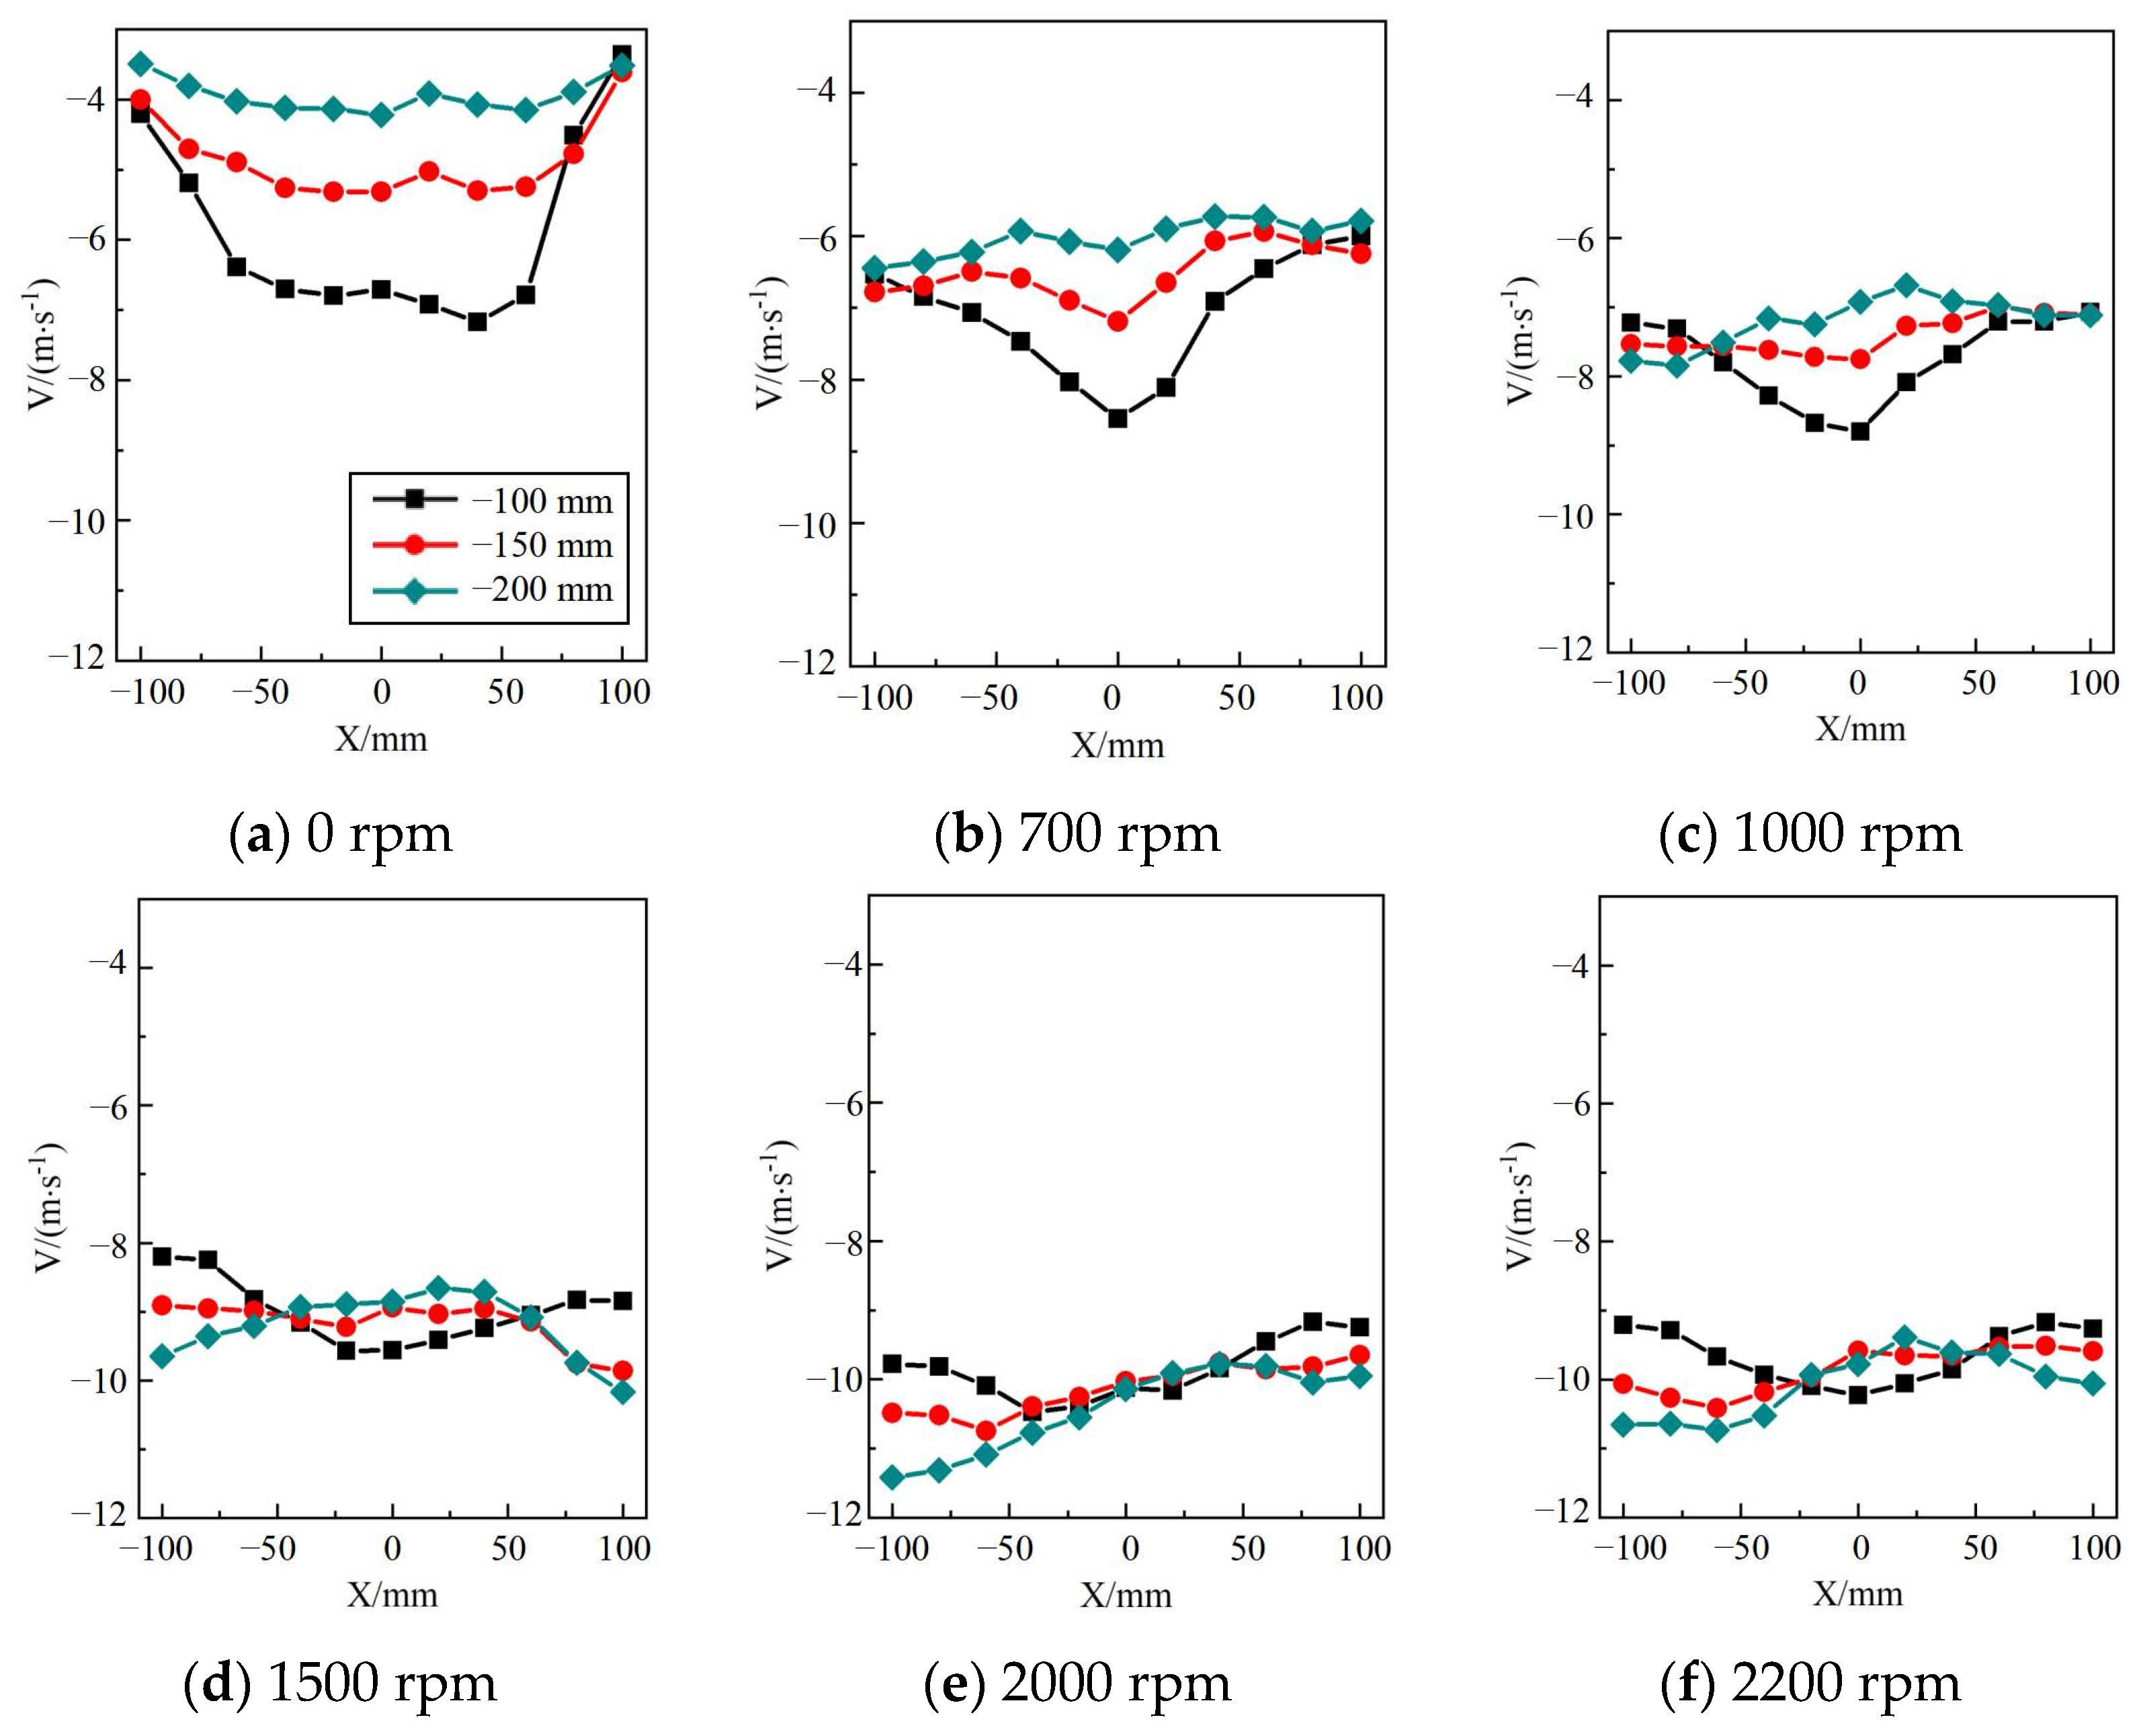
As shown in Figure 4 and Figure 5, the spatial distributions of the velocity components of the droplets along the X-axis (U) and the Y-axis (V) are presented at distances of 100, 150, and 200 mm below the nozzle for different rotor speeds. From Figure 4, by comparing the spatial distribution of droplet velocity U at different rotor speeds, it can be observed that there was no significant difference in droplet velocity U under varying rotor speeds, indicating that rotor speed has a relatively small effect on droplet velocity U.
Figure 4.
Spatial distributions of the horizontal velocity component (U) of spray droplets beneath the UAV rotor at different rotor rotational speeds. Panels (a–f) correspond to rotor speeds of 0, 700, 1000, 1500, 2000 and 2200 rpm. The color scale represents U in m/s, with positive and negative values indicating motion along and opposite to the positive horizontal direction, respectively. All measurements were conducted under no-crosswind conditions, with the remaining operating parameters held constant.
Figure 5.
Spatial distributions of the vertical velocity component (V) of spray droplets beneath the UAV rotor at different rotor rotational speeds. Panels (a–f) correspond to rotor speeds of 0, 700, 1000, 1500, 2000 and 2200 rpm. The color scale represents V in m/s, with positive and negative values indicating upward and downward motion, respectively. All measurements were conducted under no-crosswind conditions, with the remaining operating parameters held constant.
Similarly, the analysis of the Y-axis component (velocity V) of droplet velocity at three distances below the nozzle was conducted. At x = 0, the differences in the V velocity component between heights of −100 mm and −150 mm, as well as between −150 mm and −200 mm, were measured under different rotor speeds as −1.40 and −1.09 m/s, −1.37 and −1.00 m/s, −1.05 and −0.83 m/s, −0.62 and −0.09 m/s, −0.09 and 0.11 m/s, and −0.65 and 0.20 m/s, respectively. It can be observed that the absolute values of the V velocity differences at different heights gradually decreased with increasing rotor speed. When the rotor speed reached or exceeded 2000 rpm, the differences changed from negative to positive, indicating that at this rotor speed, the absolute V velocity of droplets located farther from the nozzle was higher than that of droplets closer to the nozzle. This experimental phenomenon can also be confirmed in Figure 3, thus indicating that the downwash airflow generated by the rotor rotation promotes the movement of droplets towards the ground.
3.1.3. Droplet Size Distribution
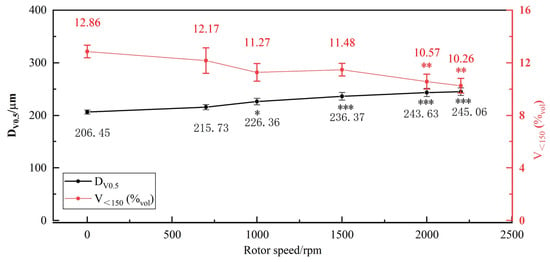
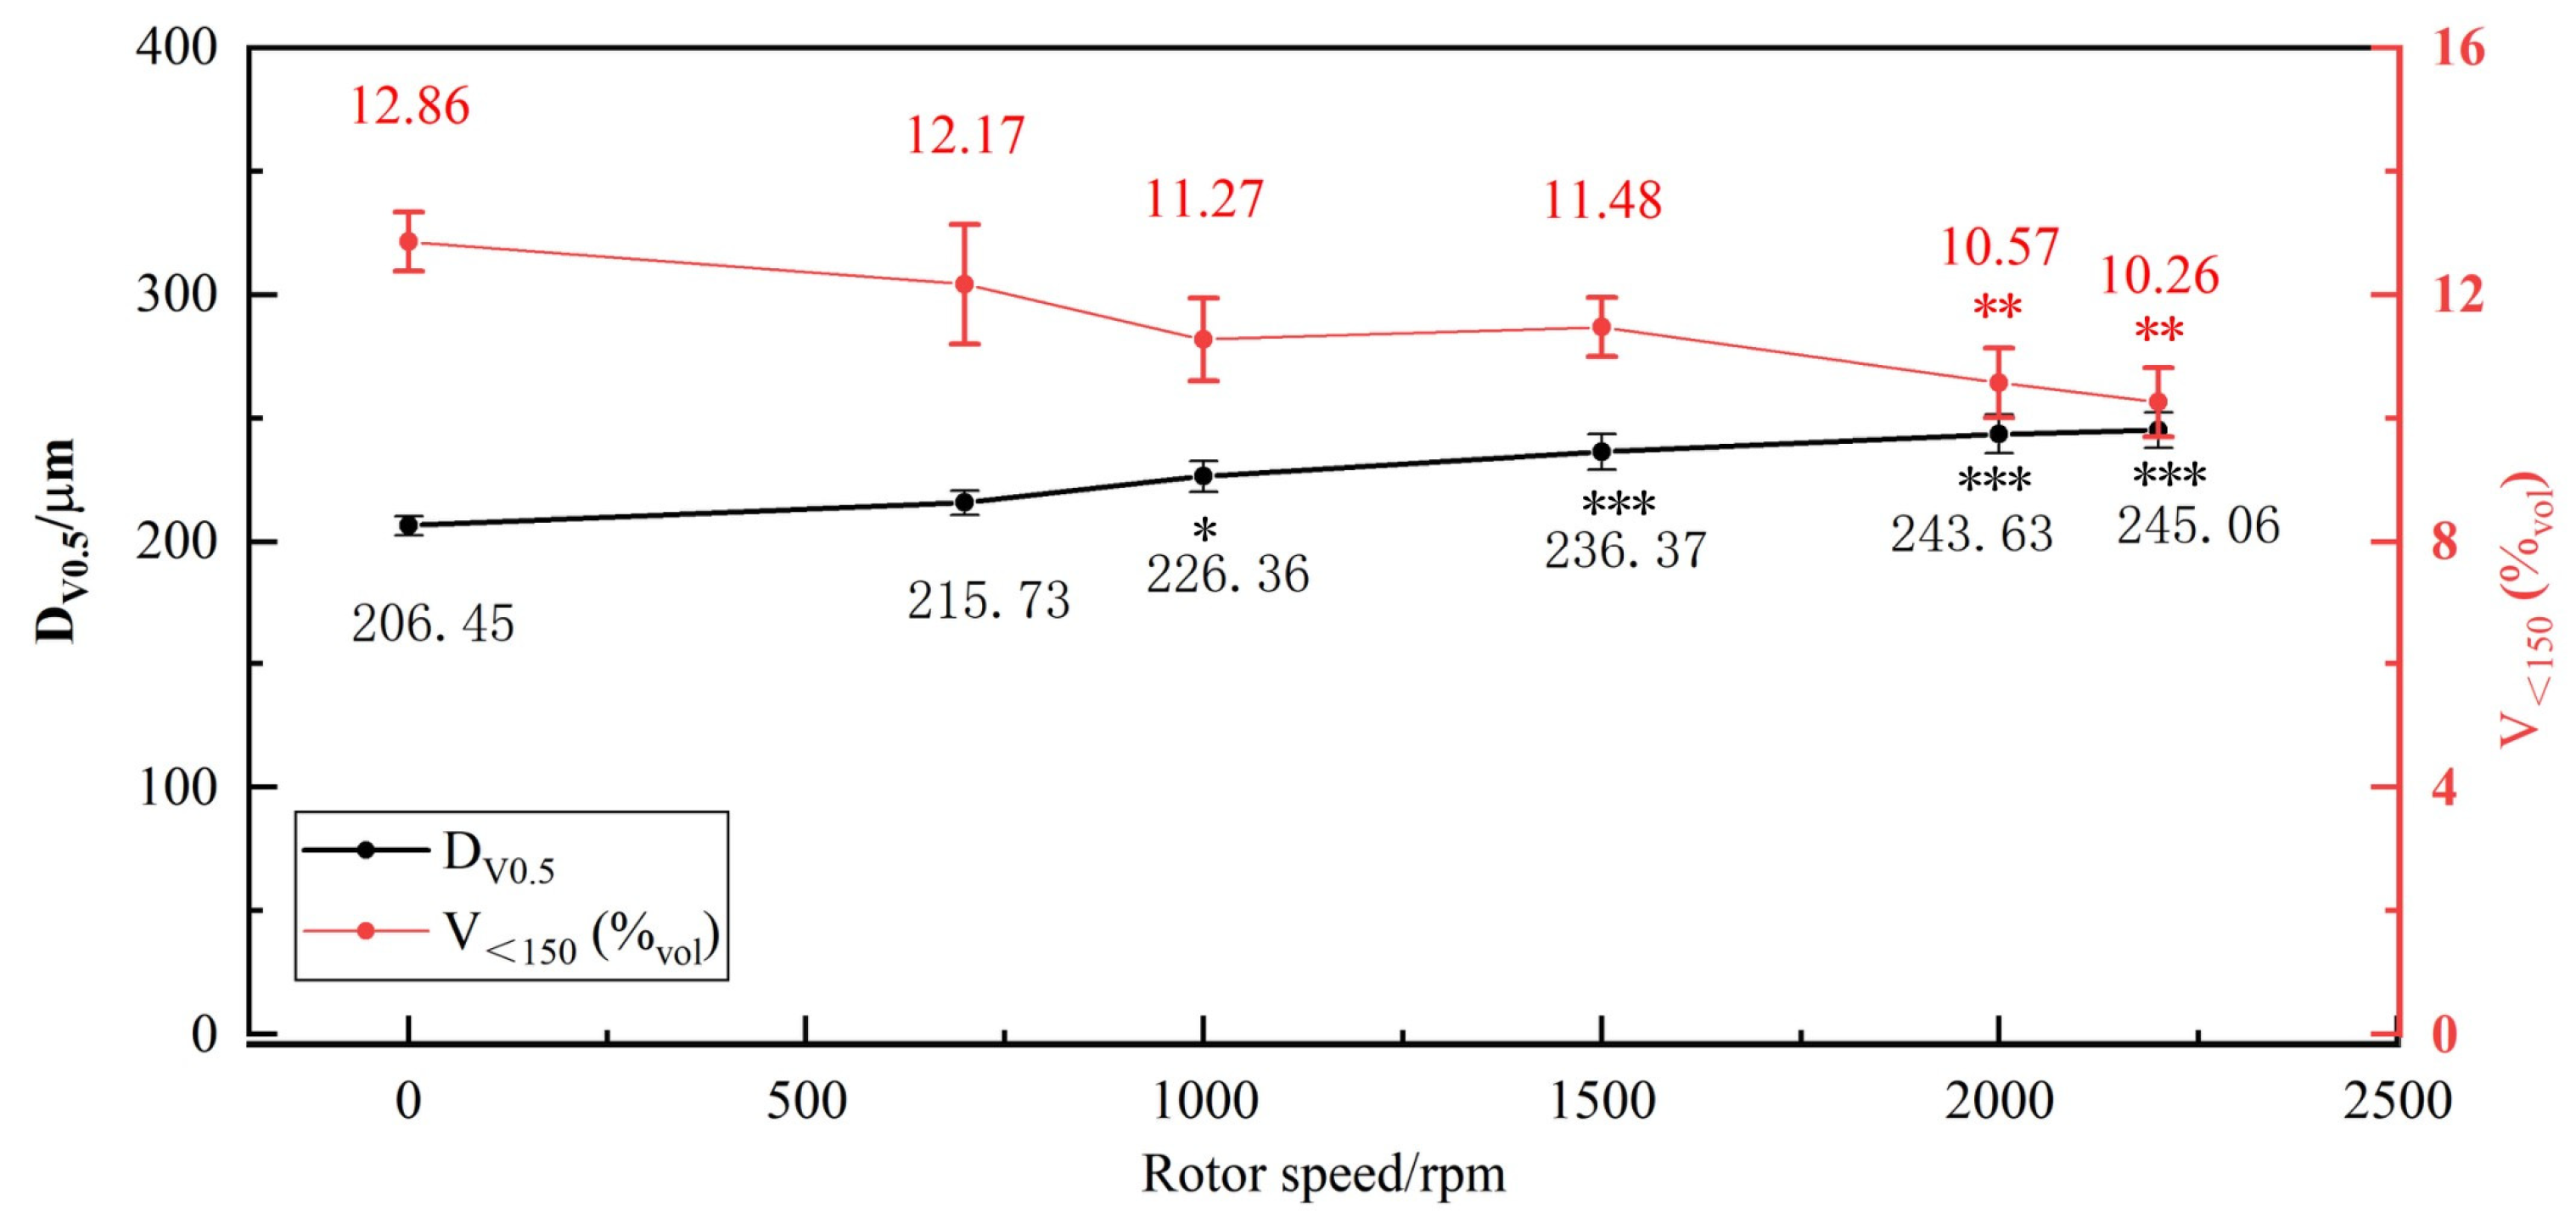
To further investigate the influence of rotor speed on the initial droplet size, experimental observations and data screening were conducted. The DV0.5 and V<150 (%vol) were calculated, as shown in Figure 6. By comparison, the DV0.5 value showed an overall increasing trend with increasing rotor speed. Except for 700 rpm, which did not cause a significant change relative to the stationary condition, all other rotor speeds had a statistically significant effect on DV0.5. The DV0.5 value at the maximum rotor speed of 2200 rpm was 18.70% larger than that without rotor rotation, indicating that the rotor airflow field can significantly increase the initial droplet size. This phenomenon is mainly because the downward airflow generated by the rotor rotation not only exerts a pulling force on the liquid sheet, increasing the breakup length, but also causes significant disturbance on the liquid sheet. The loss of force balance on the liquid sheet leads to perforations, which are then torn by the strong airflow to form liquid ligaments. This disrupts the droplet formation process and may increase the droplet size. Additionally, observing the experimental results for the V<150 (%vol) parameter reveals that the V<150 (%vol) parameter showed a negative correlation with the rotor speed. The V<150 (%vol) value gradually decreased from 12.86% at 0 rpm to 10.26% at the highest rotor speed. This indicates that increasing the rotor speed reduces the volume percentage of droplets smaller than 150 µm after initial atomization. Compared with the stationary condition, the effects at 2000 and 2200 rpm were statistically significant.
Figure 6.
Initial droplet size distribution at different rotor speed. Data are presented as mean ± standard deviation. The symbols *, **, and *** denote statistically significant differences relative to the control at p < 0.05, p < 0.01, and p < 0.001, respectively.
3.2. Influence of Crosswind Speed on Atomization Characteristics
3.2.1. Spray Droplet Velocity Field
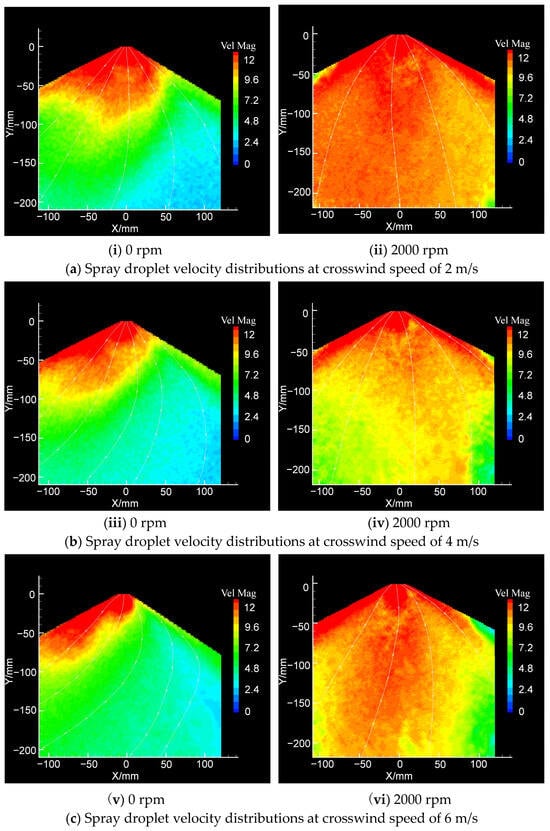
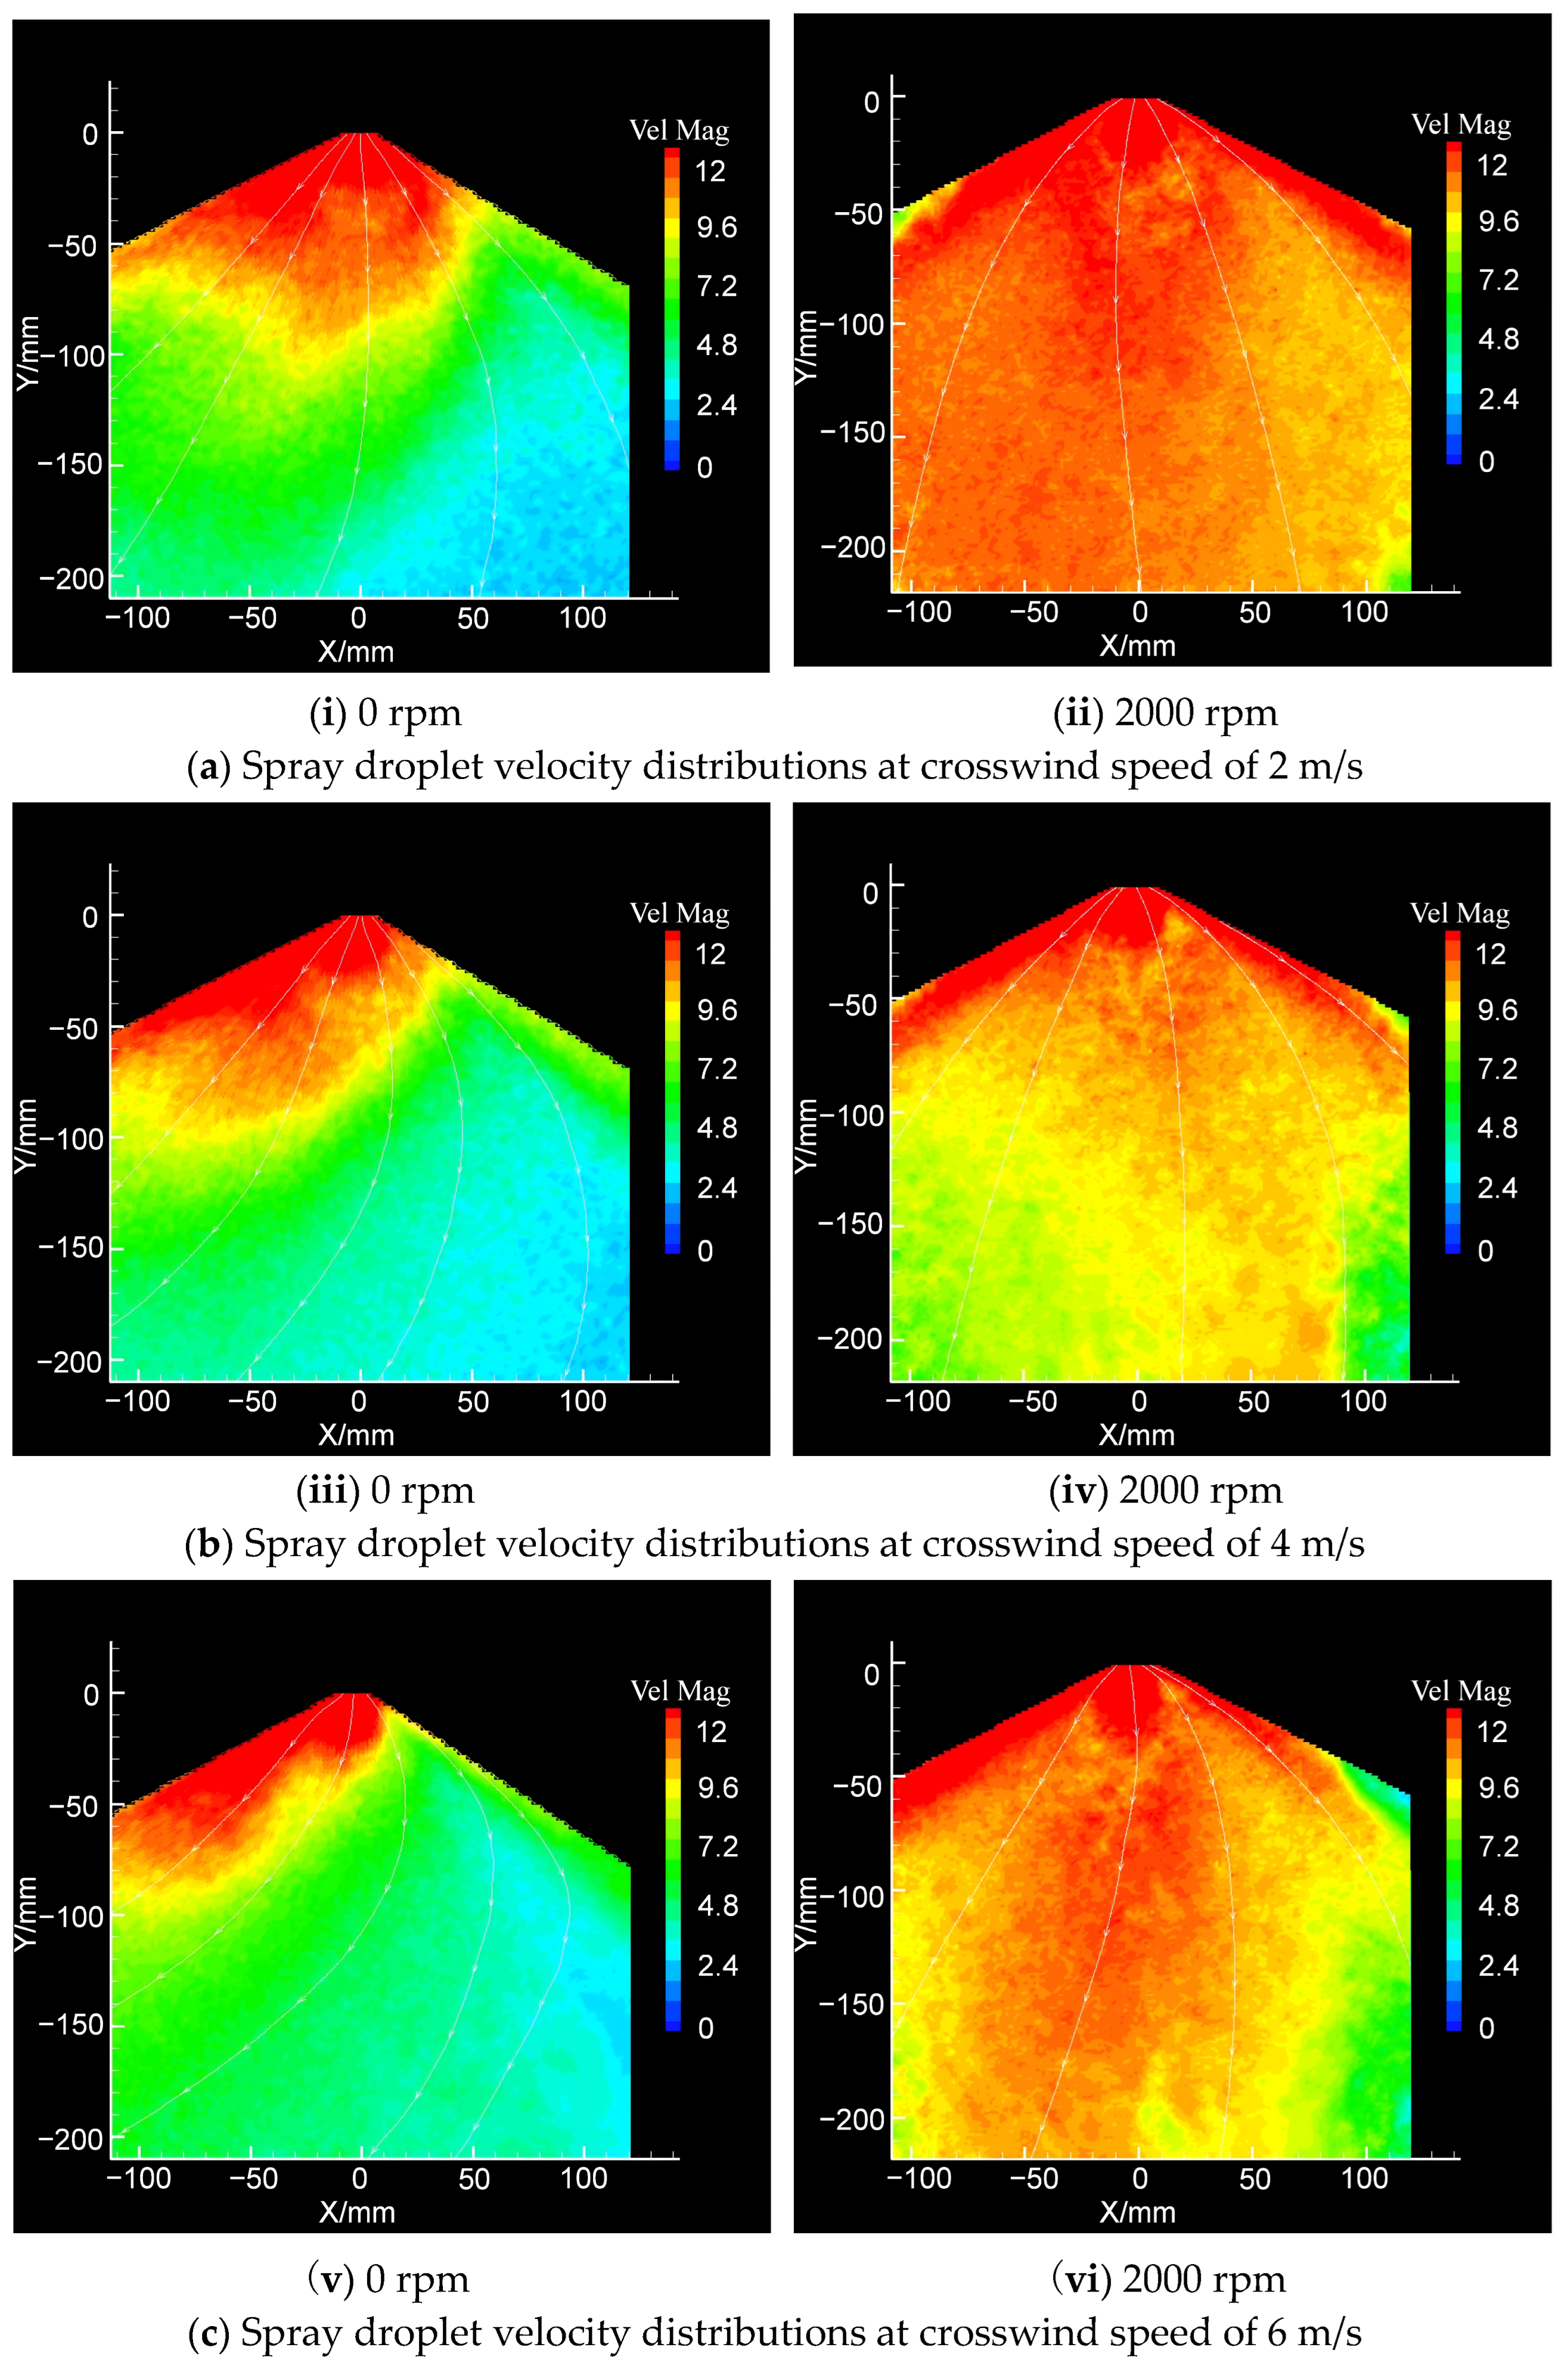
Figure 7a–c show comparative the contour maps of the spray droplet velocity field at crosswind speeds of 2, 4, and 6 m/s, respectively, under rotor speeds of 0 and 2000 rpm. In addition to the velocity scalar distribution represented by the color bar, the yellow lines with arrows in the figures represent the streamlines, indicating the velocity directions of the detected particles. As shown in Figure 7a–c, the velocity distribution of the spray droplet velocity field without rotor rotation exhibited distinct regional characteristics. In addition to the general trend that the velocity gradually decreased from the liquid sheet toward the downstream spray direction, the velocity on the right side of the X-axis origin was lower than that on the left side within the spray droplet velocity field. Furthermore, the streamlines on the right side of the velocity contour maps gradually bent toward the negative X-axis direction (i.e., from the upwind side toward the downwind side) as they developed along the spray direction. This phenomenon became increasingly pronounced with the increase in crosswind speed, indicating that the crosswind speed has a significant influence on the spray droplet velocity field without rotor rotation.
Figure 7.
Spray droplet velocity distributions at different crosswind speeds.
For the spray droplet velocity field at a rotor speed of 2000 rpm, the velocity contour distributions under crosswind speeds of 2 m/s and 4 m/s were relatively symmetric along the spray direction. However, at a crosswind speed of 6 m/s, the velocity contour map exhibited higher velocity distributions toward the downwind direction, and the streamlines showed slight bending toward the downwind side, indicating that the droplets moved slightly downwind under this lateral airflow condition. By comparing the spray droplet velocity field distributions under all crosswind speeds for both the non-rotating rotor condition and the 2000 rpm rotor condition, it can be concluded that the airflow generated by the rotor at 2000 rpm not only enhanced the vertical velocity of the droplets, but also effectively suppressed the drift of droplets after the initial atomization process.
3.2.2. Droplet Velocity Distribution
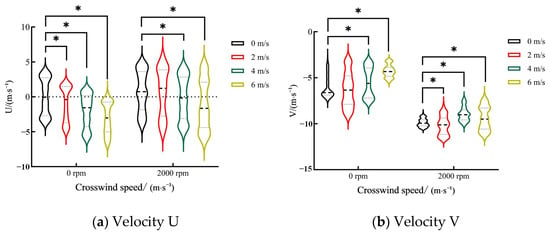
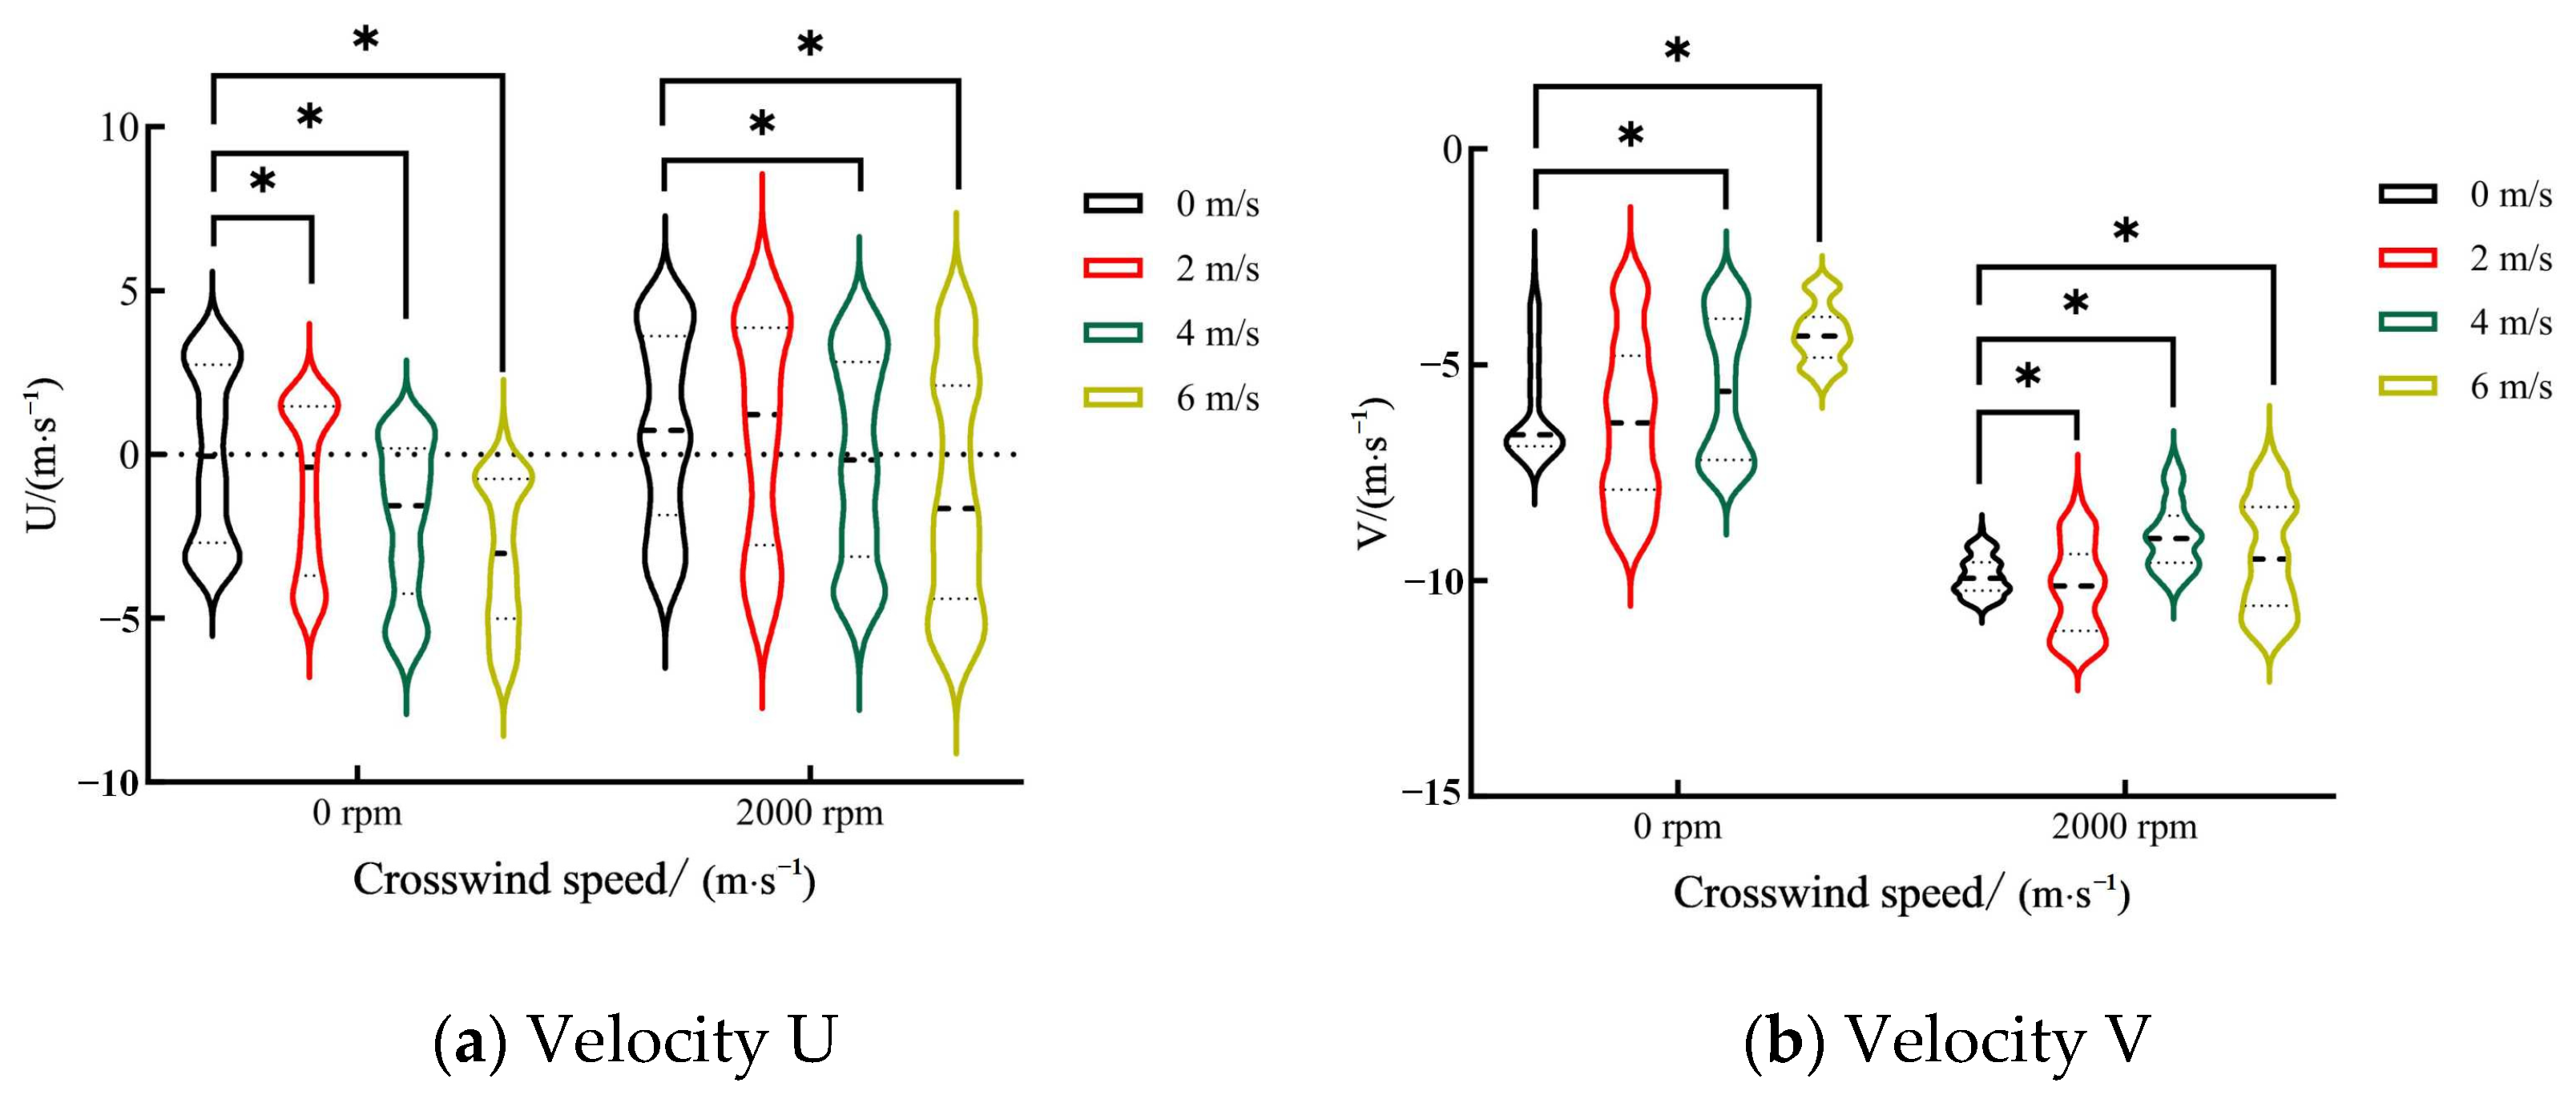
The droplet velocity distribution at 60 mm below the nozzle was statistically calculated, and the distribution diagrams of droplet velocity U and velocity V at this height were obtained, as shown in Figure 8.
Figure 8.
Initial droplet velocity distribution under four crosswind wind speeds. The data are presented as violin plots. Within each violin, the three horizontal lines, from top to bottom, represent the upper quartile (Q3, 75th percentile), the median (Q2, 50th percentile), and the lower quartile (Q1, 25th percentile), respectively. The number of ‘*’ indicates significance at the 95% level (p < 0.05).
For the velocity U distribution without rotor rotation, crosswind speeds of 2, 4, and 6 m/s all had a significant influence on droplet velocity U. The average velocity U values under crosswind speeds of 2, 4, and 6 m/s are −1.01, −2.04, and −3.04 m/s, respectively, which are 26.25%, 52%, and 77% smaller than that without crosswind, respectively, indicating that the droplets moved toward the downwind direction under the influence of the lateral airflow. Moreover, a higher cross wind speed resulted in a greater number of droplets drifting downwind. For the velocity U distribution at 2000 rpm rotor speed, crosswind speeds of 4 and 6 m/s had a significant influence on droplet velocity U. With increasing crosswind speed, velocity U progressively shifted toward the negative X-axis direction, and the degree of deviation increased as the crosswind speed increased. Under crosswind speeds of 4 m/s and 6 m/s, the mean velocity U was 0.19 m/s and −1.11 m/s, respectively, corresponding to reductions of 75.95% and 240.51%, respectively, relative to the no-crosswind condition.
As shown in Figure 8b, under the condition without rotor rotation, cross wind speeds of 4 and 6 m/s had a significant influence on the initial droplet velocity V. With increasing cross wind speed, velocity V exhibited a gradual increasing trend. The mean values of velocity V under the three crosswind conditions were −6.31, −5.49, and −4.30 m/s, respectively, indicating that the lateral airflow reduced the droplet motion velocity along the spray direction. For the velocity V distribution at a rotor speed of 2000 rpm, cross wind speeds of 2, 4, and 6 m/s all had significant effects on velocity V. However, the influences of these three cross wind speeds on the mean value of velocity V did not exhibit a consistent trend, but rather changed the overall distribution characteristics of velocity V.
3.2.3. Droplet Size Distribution
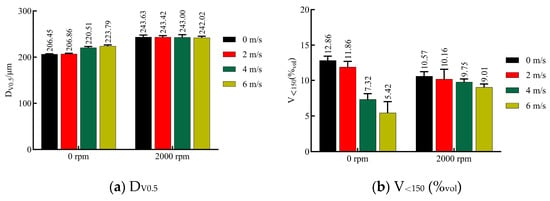
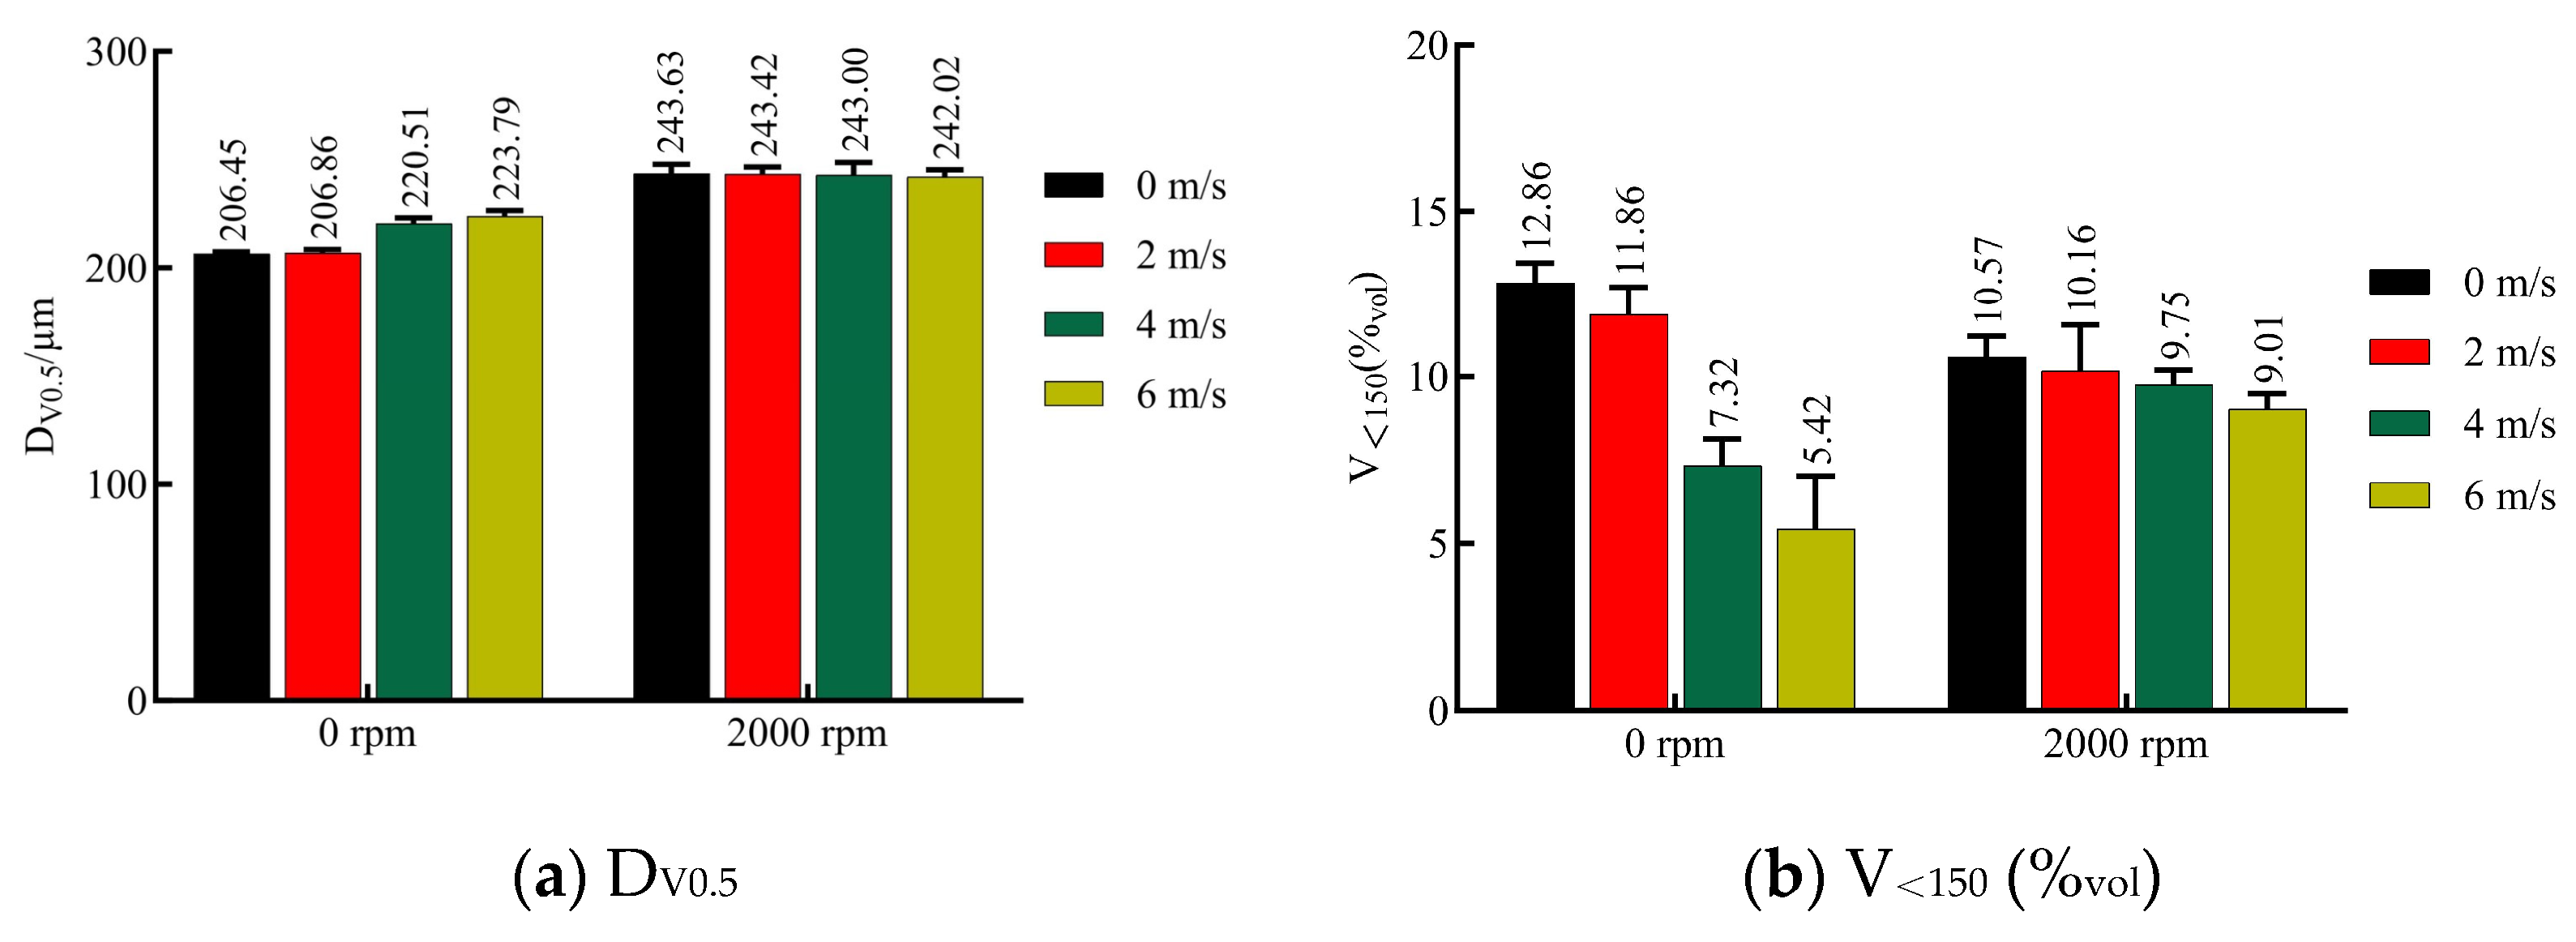
Figure 9 shows the distribution of initial droplet size parameters (DV0.5 and V<150 (%vol) at rotor speeds of 0 and 2000 rpm under crosswind speeds of 0, 2, 4, and 6 m/s, respectively.
Figure 9.
Initial droplet size distribution under four crosswind wind speeds.
The DV0.5 values at 2000 rpm rotor speed were all higher than the corresponding DV0.5 values without rotor rotation, showing increases of 18.01%, 17.67%, 10.20%, and 8.15% under wind speeds of 0, 2, 4, and 6 m/s, respectively. Compared with the no-crosswind condition, the DV0.5 value increased by 8.40% at a crosswind speed of 6 m/s. However, when the rotor speed was 2000 rpm, the effect of crosswind speed on DV0.5 was negligible. In addition, the experimental results revealed that the V<150 (%vol) value decreased progressively with increasing crosswind speed in the absence of rotor rotation, declining from 12.86% to 5.42%. However, at a rotor speed of 2000 rpm, the V<150 (%vol) value showed only slight fluctuations with changes in crosswind speed, decreasing from 10.57% to 9.01%. This suggests that crosswind speed exerted a substantial influence on the V<150 (%vol) of droplets generated without rotor rotation, whereas its effect on the V<150 (%vol) of droplets generated at a rotor speed of 2000 rpm was comparatively limited. Based on observations during the experiments, in the absence of rotor rotation, stronger crosswinds altered the trajectories of freshly atomized droplets, displacing them downwind. Owing to their low inertia, small droplets were easily carried by the airflow, causing some to drift outside the camera’s field of view and leading to an underestimation of the proportion of droplets smaller than 150 µm.
3.3. Influence of Spray Pressure on Atomization Characteristics
3.3.1. Spray Droplet Velocity Field
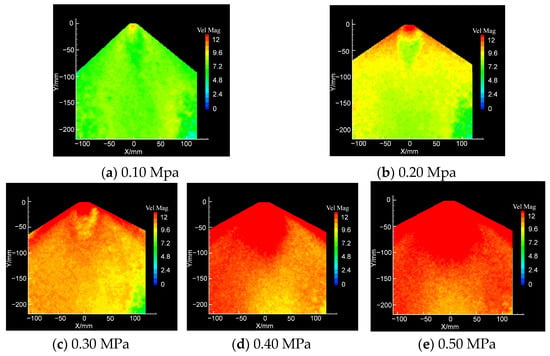
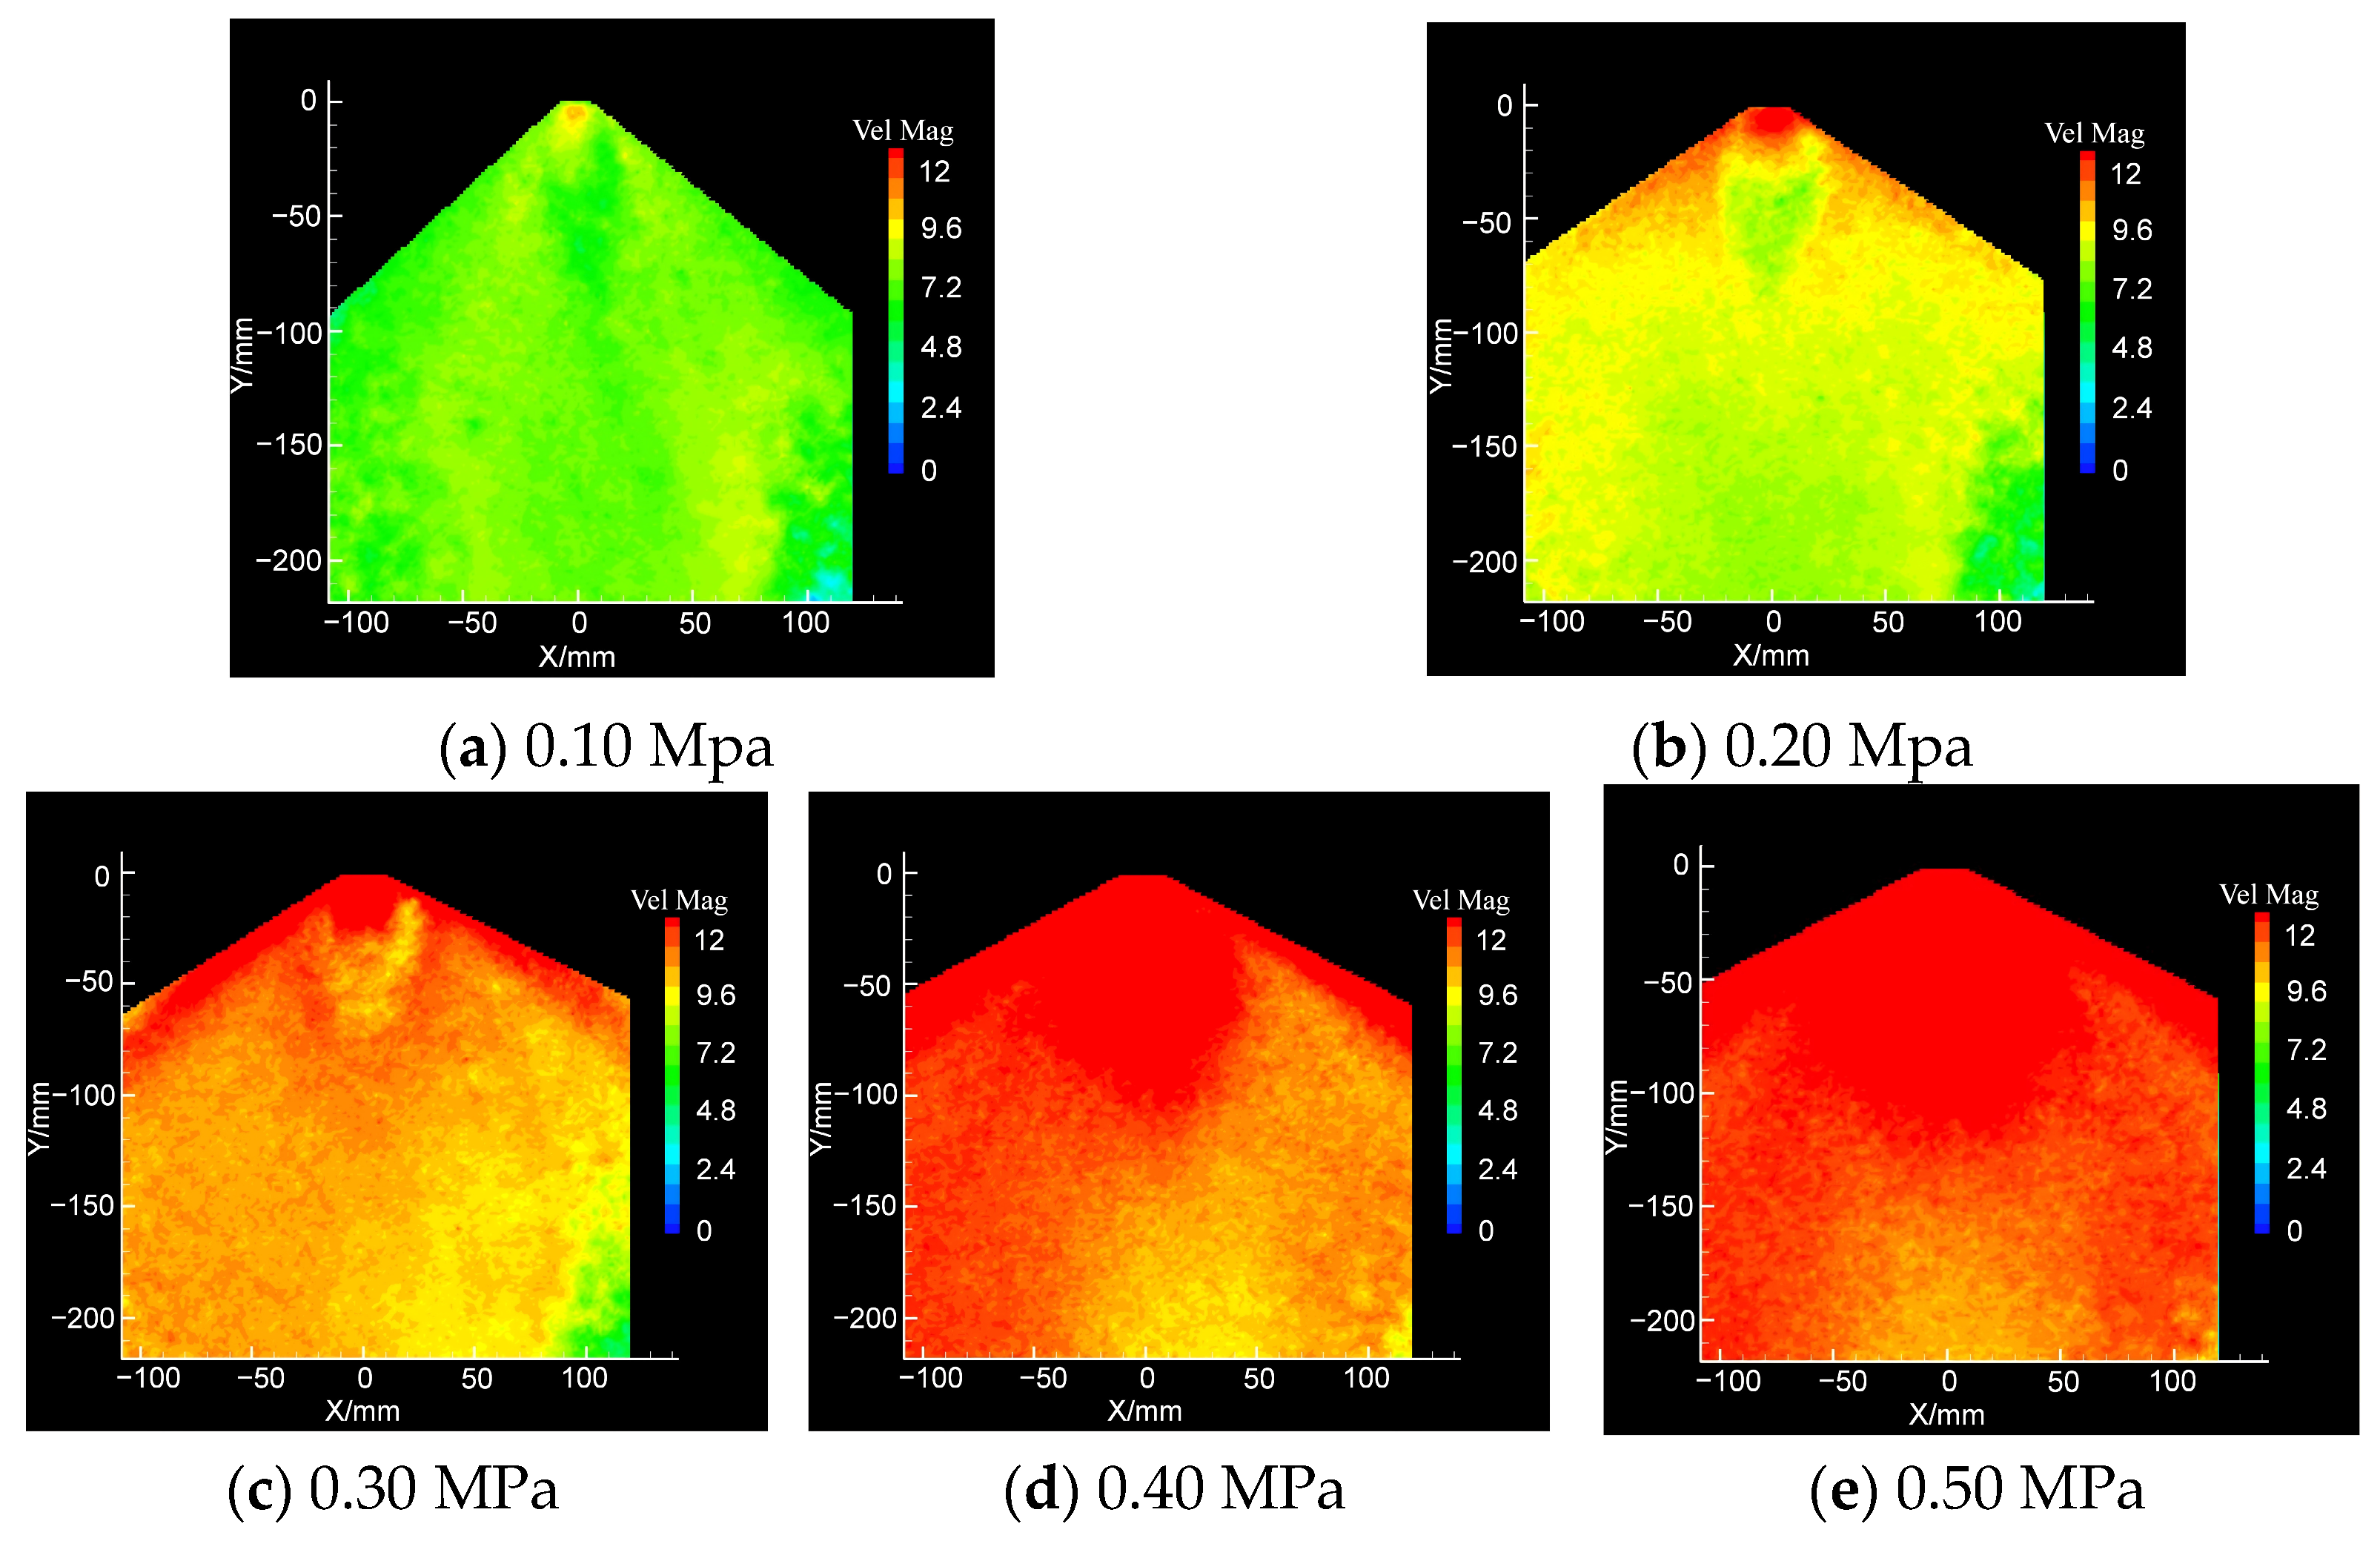
As shown in Figure 10, the velocity distributions of the spray droplet velocity field at a rotor speed of 2000 rpm under spray pressures of 0.10, 0.20, 0.30, 0.40, and 0.50 MPa are presented. As illustrated in Figure 10, spray pressure had a pronounced influence on the velocity distribution of the entire spray droplet velocity field under normal rotor operation. Relatively low droplet velocities were observed at spray pressures of 0.10 and 0.20 MPa. As the spray pressure increased beyond 0.30 MPa, the velocity distribution increased markedly, with velocities in most regions of the spray droplet velocity field exceeding 12 m/s at 0.50 MPa.
Figure 10.
Spray droplet velocity distributions under different hydraulic pressures.
3.3.2. Droplet Velocity Distribution
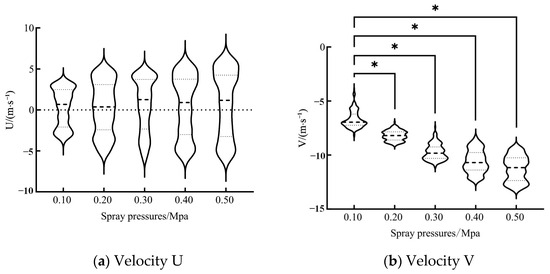
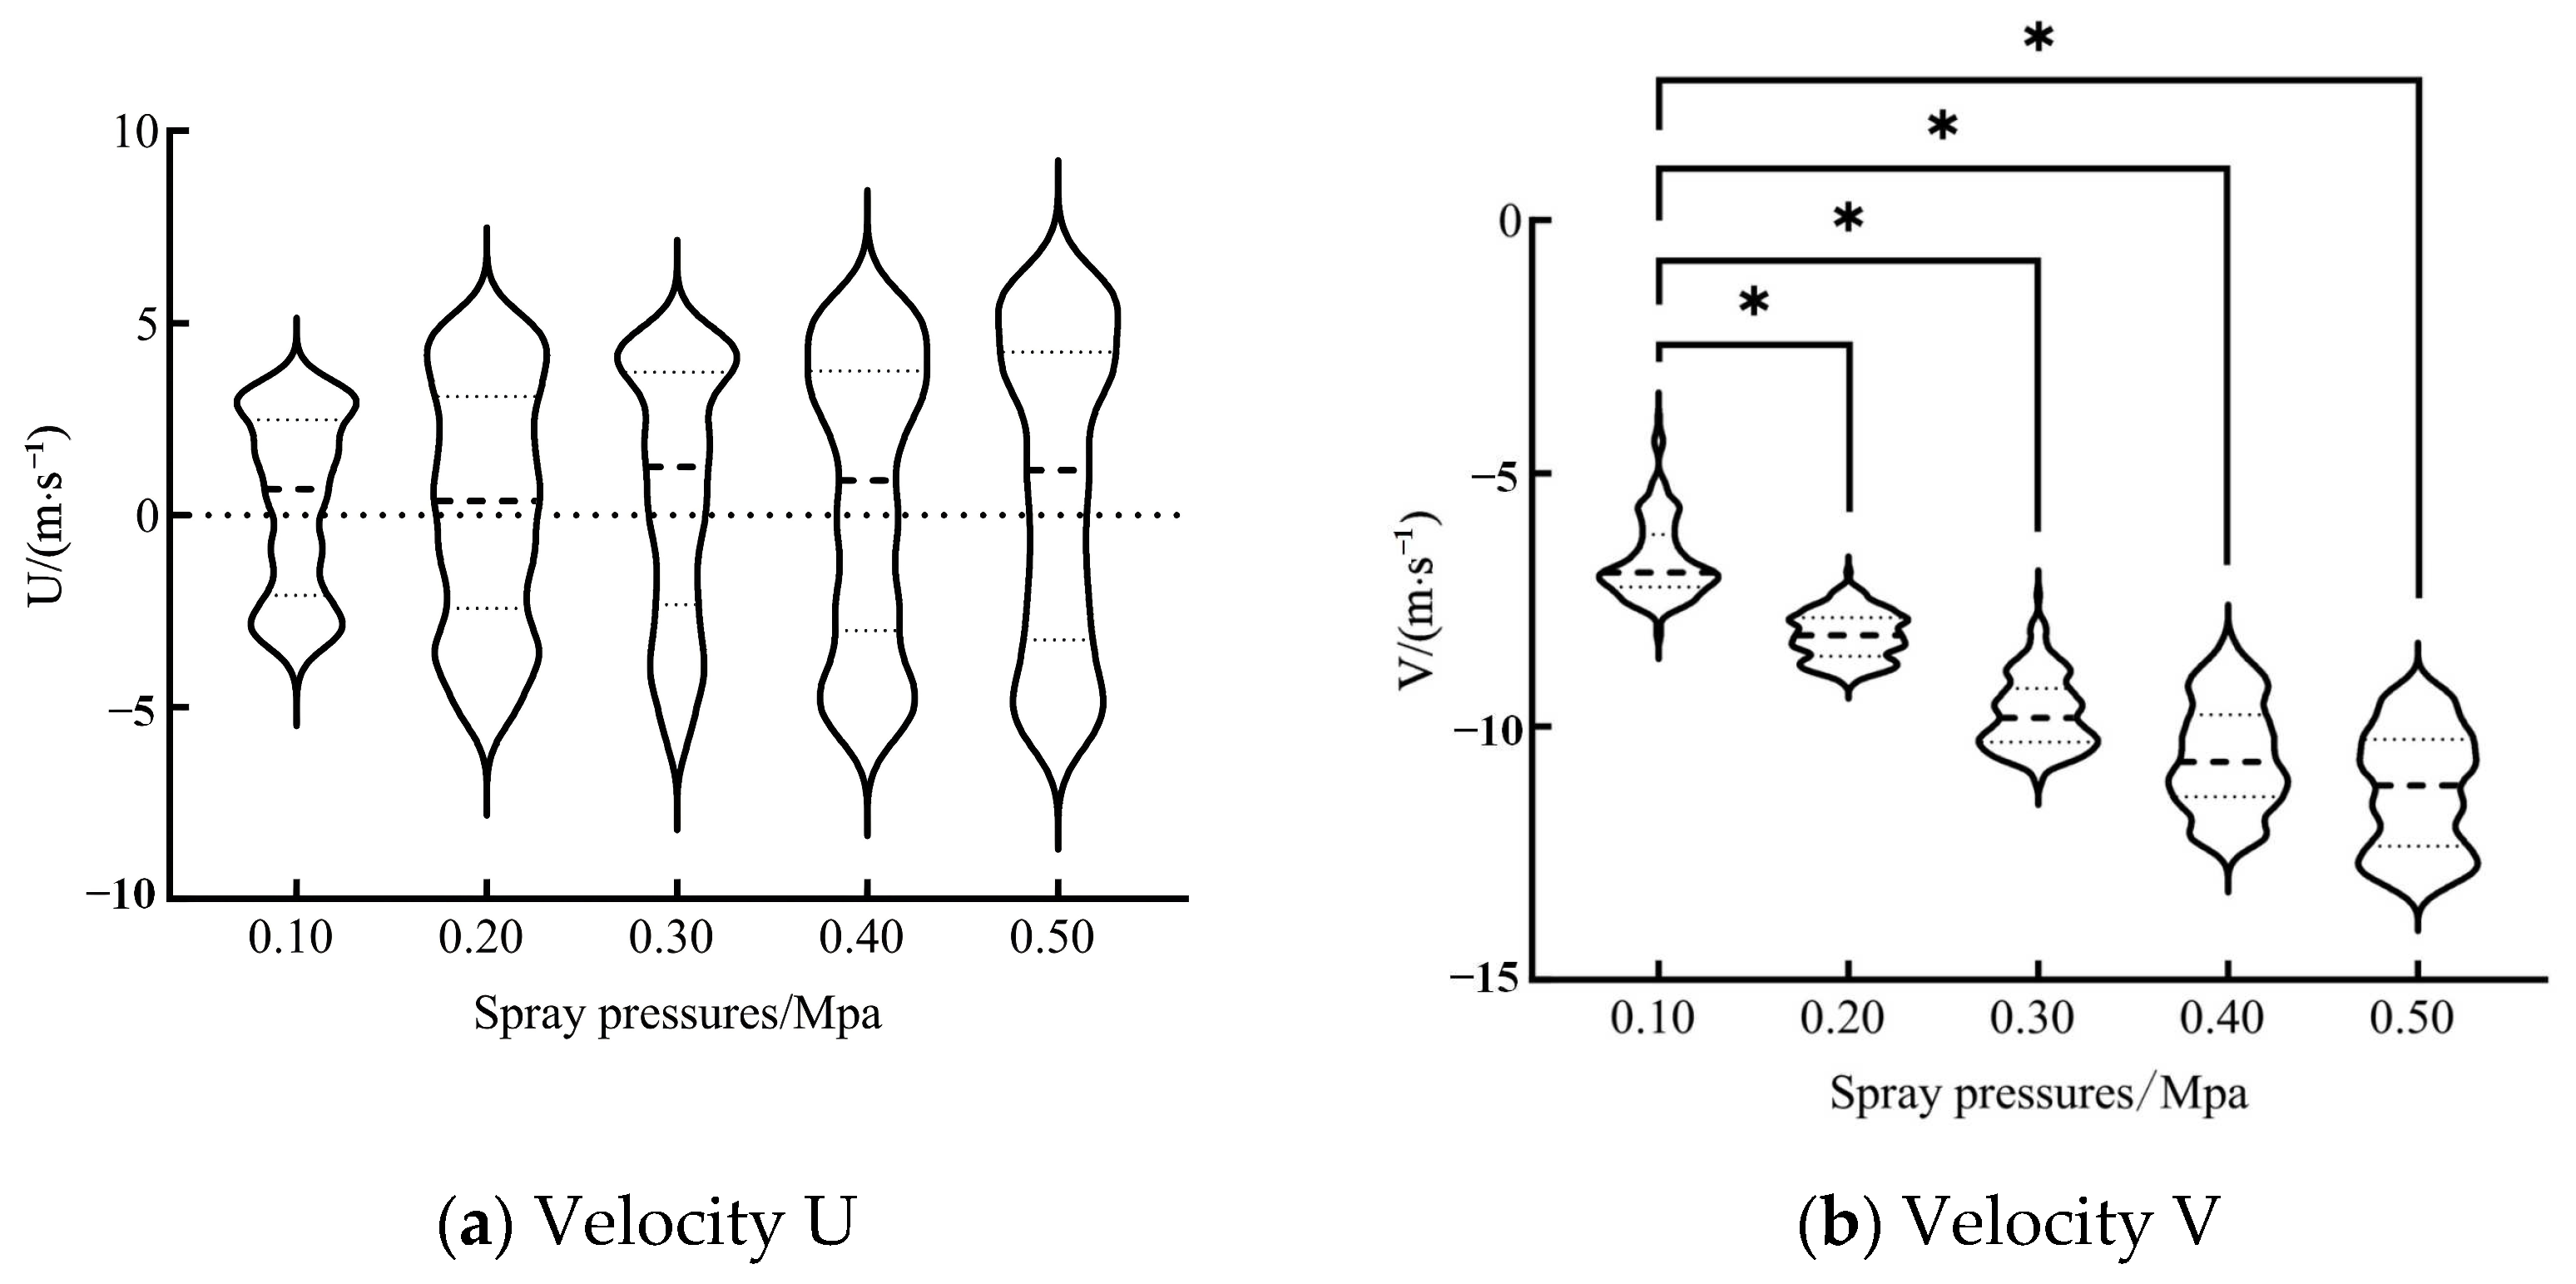
Figure 11 shows the effects of different spray pressures on the distributions of droplet velocity U and velocity V at a location 60 mm below the nozzle under a rotor speed of 2000 rpm. For the velocity U distribution, the quartile lines in the violin plots indicate that droplet velocities were more concentrated at lower spray pressures and became more dispersed as the spray pressure increased. Moreover, the mean value of velocity U showed a slight increasing trend with increasing spray pressure, with mean values of 0.33, 0.25, 0.56, 0.42, and 0.71 m/s at spray pressures of 0.10, 0.20, 0.30, 0.40, and 0.50 MPa, respectively. For the velocity V distribution, spray pressures of 0.20, 0.30, 0.40, and 0.50 MPa significantly altered the distribution of droplet velocity V compared with that at 0.10 MPa. As spray pressure increased, the mean value of velocity V exhibited a stepwise decrease, reaching −6.34, −7.89, −9.15, −10.55, and −11.43 m/s at spray pressures of 0.10, 0.20, 0.30, 0.40, and 0.50 MPa, respectively. In addition, increasing spray pressure led to a broader spread of droplet velocities, resulting in a progressively more dispersed distribution around the mean value.
Figure 11.
Initial droplet velocity distribution under different hydraulic pressures. The data are presented as violin plots. Within each violin, the three horizontal lines, from top to bottom, represent the upper quartile (Q3, 75th percentile), the median (Q2, 50th percentile), and the lower quartile (Q1, 25th percentile), respectively. The number of ‘*’ indicates significance at the 95% level (p < 0.05).
3.3.3. Droplet Size Distribution
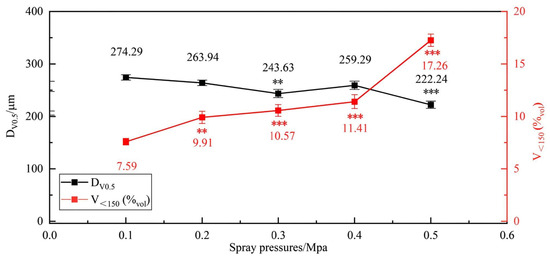
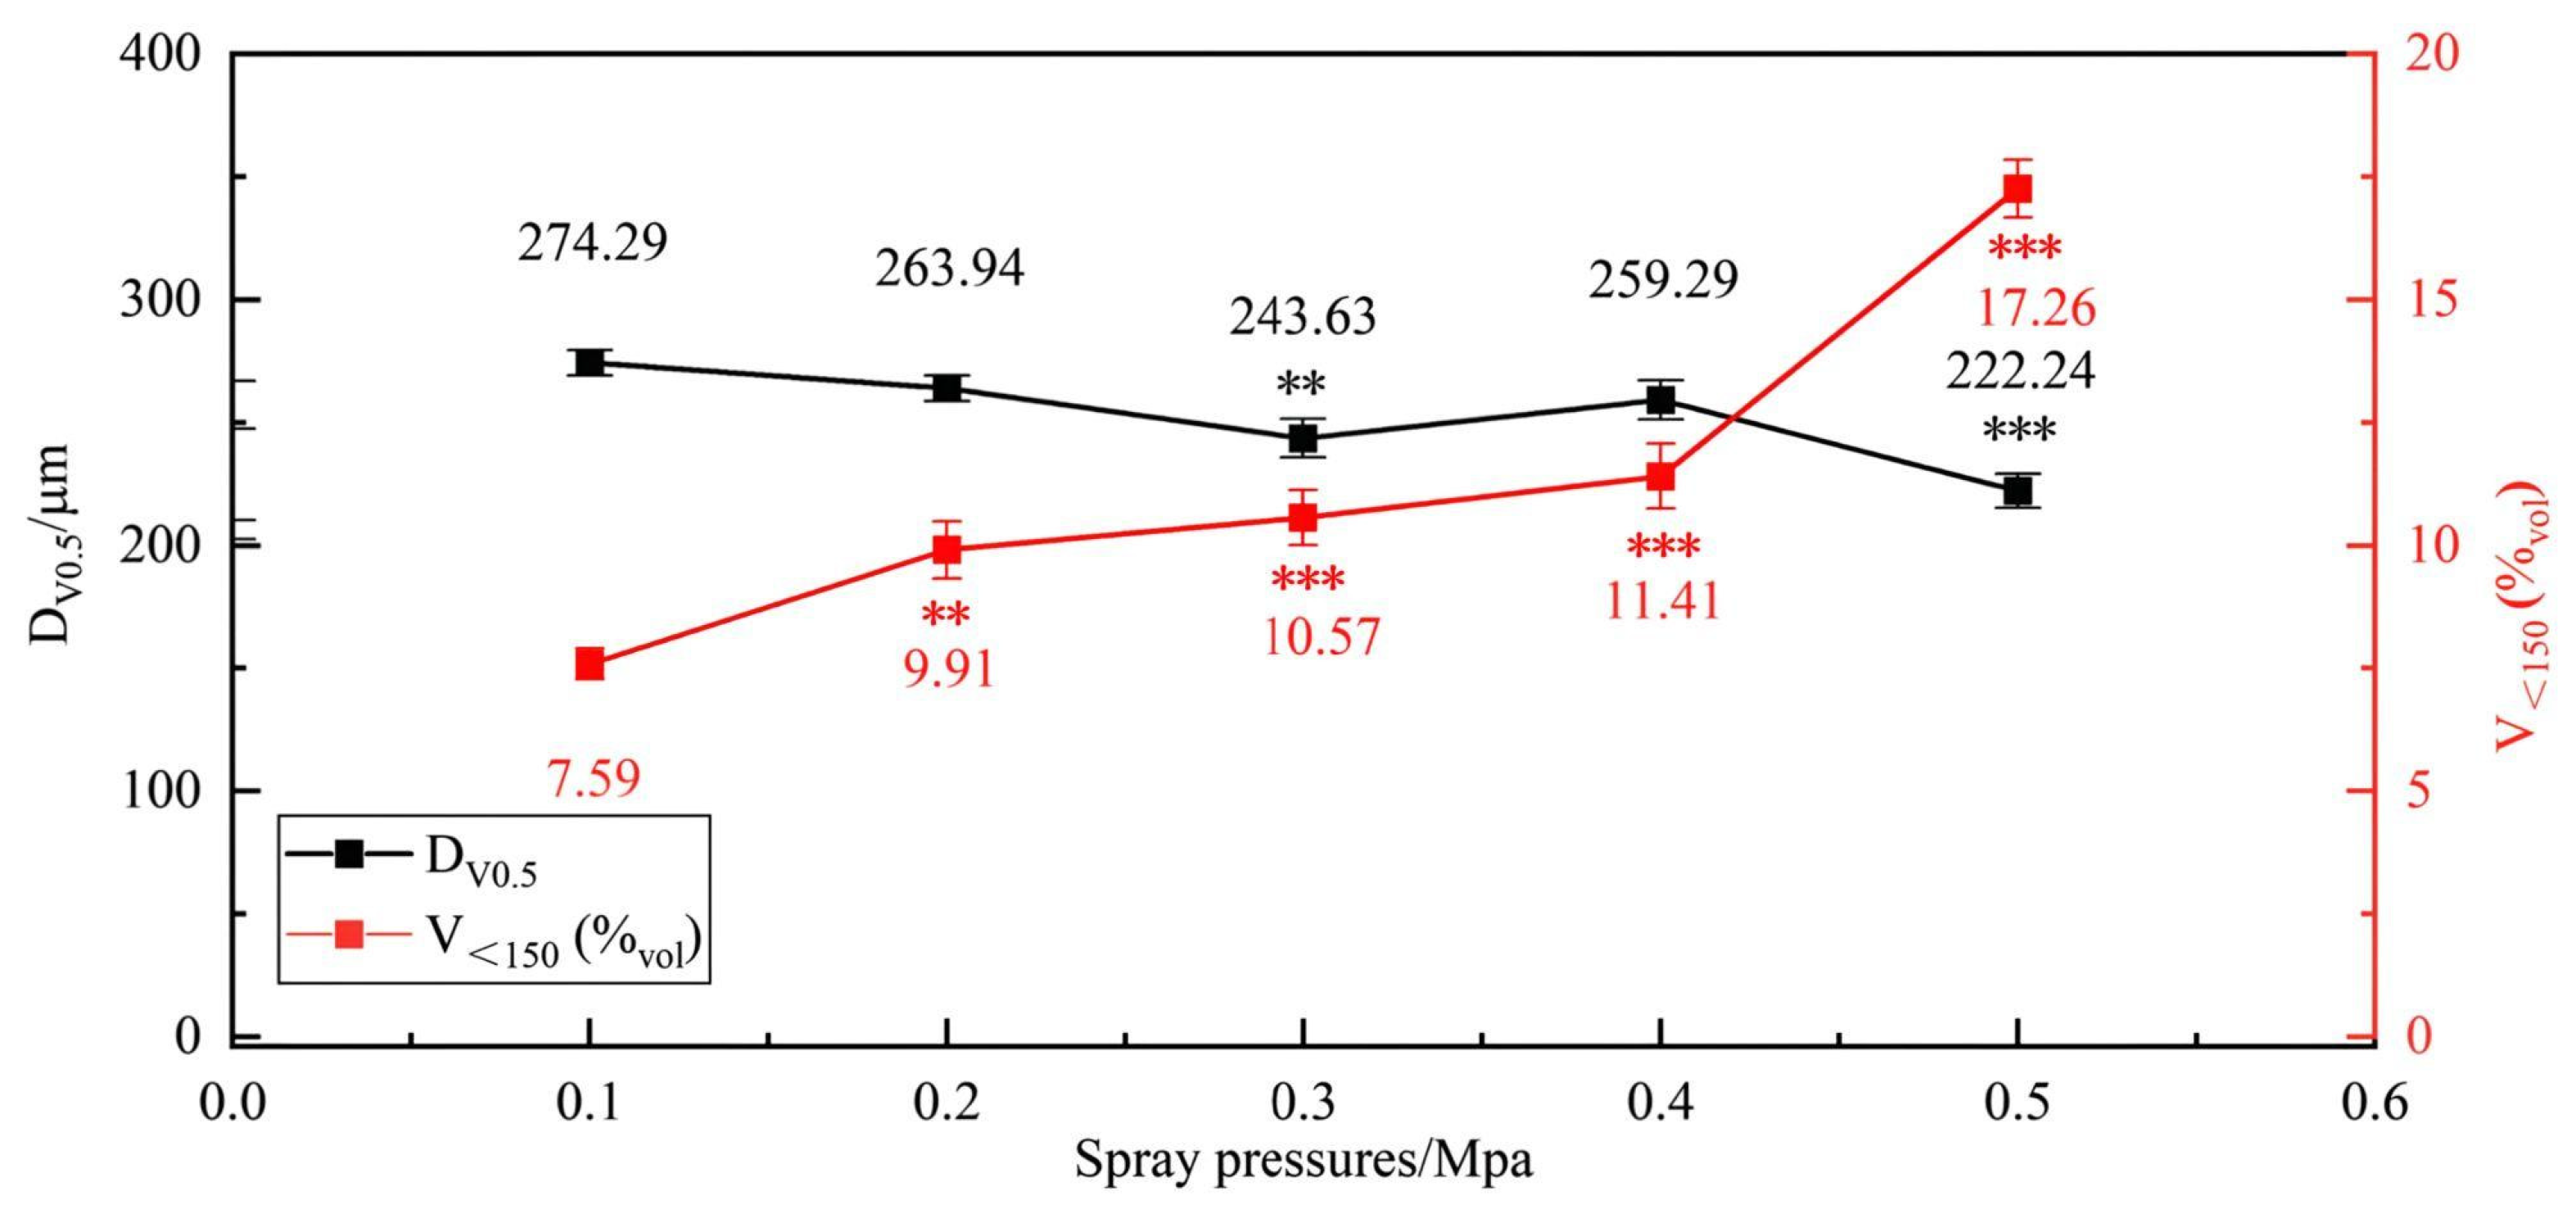
Figure 12 presents the distributions of the initial droplet size (DV0.5) and V<150 (%vol) at a rotor speed of 2000 rpm under different spray pressures. In general, DV0.5 decreased with increasing spray pressure. The corresponding DV0.5 values at spray pressures of 0.10, 0.20, 0.30, 0.40, and 0.50 MPa were 274.29, 263.94, 243.63, 259.29, and 222.24 µm, respectively. Compared with 0.10 MPa, statistically significant differences in DV0.5 were observed at 0.30 and 0.50 MPa. Consistent with the previous findings, V<150 (%vol) exhibited a trend generally opposite to that of DV0.5, increasing progressively with increasing spray pressure. Consistent with the previous findings, V<150 (%vol) exhibited a trend generally opposite to that of DV0.5, increasing progressively as spray pressure increased. At a spray pressure of 0.50 MPa, the V<150 (%vol) reached 17.26%, representing an increase of 127.40% compared with that at 0.10 MPa. This finding suggests that increasing spray pressure promotes the generation of fine droplets, thereby increasing the volumetric fraction of droplets smaller than 150 µm under rotor operating conditions.
Figure 12.
Initial particle size distribution of droplet under different hydraulic pressures. Data are presented as mean ± standard deviation. The symbols *, **, and *** denote statistically significant differences relative to the control at p < 0.05, p < 0.01, and p < 0.001, respectively.
4. Discussion
Rotor speed significantly affected the measured droplet-size distribution beneath the UAV. As the rotor speed increased from 0 to 2200 rpm, the volume median diameter (DV0.5) increased from 206.45 to 245.06 μm, corresponding to an increase of 18.7%, whereas the volume fraction of droplets smaller than 150 μm (V<150 (%vol)) decreased from 12.86% to 10.26% (Figure 6). Thus, increasing rotor speed shifted the measured droplet spectrum toward larger apparent sizes rather than finer droplets. This result differs from the conventional assumption that stronger rotor-induced airflow necessarily promotes finer atomization [25,26,27,28].
This seemingly counterintuitive trend may be attributed to the combined effects of liquid-sheet deformation near the nozzle and the subsequent transport of the breakup products through the rotor-induced flow field. As the rotor speed increases, the intensified downwash increases the relative gas–liquid velocity and the aerodynamic shear acting on the liquid sheet. The liquid sheet may therefore undergo stronger stretching, deformation, and fragmentation into liquid sheets, ligaments, and irregular liquid structures. However, because the laser measurement plane was located relatively close to the nozzle, some of these structures may not have had sufficient time to contract and evolve into approximately spherical droplets under the action of surface tension. In laser-based measurements, such transient nonspherical structures may be converted into equivalent spherical diameters based on their optical response, thereby contributing to an apparently larger measured droplet size. In addition, the intensified rotor wake may alter the spatial distribution of the spray through size-dependent droplet transport. Smaller droplets, which have lower inertia and shorter aerodynamic response times, are more readily entrained by turbulent and cross-flow motions and may be displaced away from the laser-sheet measurement region. In contrast, larger droplets and liquid fragments are more likely to maintain their downward momentum and pass through the measurement plane. Therefore, the measured droplet population beneath the rotor may be enriched in larger droplets or incompletely relaxed liquid structures. The increase in DV0.5 should consequently not be interpreted solely as a reduction in the intrinsic atomization efficiency of the nozzle. Rather, it may reflect the coupled effects of liquid-sheet deformation, transient breakup, incomplete relaxation, and size-selective transport within the rotor wake.
The results for the effect of crosswind speed indicate that crosswind primarily affected post-atomization transport rather than initial atomization (Figure 7 and Figure 8). Without rotor rotation, increasing crosswind progressively deflected the spray plume and weakened downward droplet transport, whereas at 2000 rpm, rotor-induced downwash maintained plume stability at 2–4 m/s, with pronounced deflection occurring only at 6 m/s. This interaction represents momentum redistribution rather than simple airflow superposition. Unlike previous studies focusing mainly on crosswind-induced drift [29,30], the present findings suggest that crosswind also selectively displaces fine droplets, causing measured droplet-size variations that may not reflect changes in atomization. Therefore, rotor speed, spray pressure, and operating wind speed should be jointly optimized because the stabilizing effect of downwash is limited.
This study demonstrates that atomization and transport are strongly coupled in UAV spraying. Droplet characteristics measured beneath the rotor reflect the combined effects of hydraulic breakup, rotor-wake redistribution, and ambient airflow. Unlike conventional ground-based spraying, in which droplet size is primarily determined by nozzle configuration and operating pressure [31,32,33], UAV rotor wakes selectively transport droplets, making the measured spectrum dependent on rotor operation, airflow conditions, and sampling position. This mechanism may explain the variability among previous studies and highlights the need to consider the aerodynamic history of droplets when interpreting measurements. Therefore, UAV spray optimization should balance atomization, rotor-assisted transport, deposition performance, and environmental adaptability rather than maximizing atomization efficiency or rotor speed alone.
The use of a single surfactant solution and one nozzle type limits the generalizability of the present results, while practical UAV spraying involves considerable uncertainties, including variable wind conditions, atmospheric turbulence, UAV motion, evaporation, and crop-canopy effects. Therefore, the laboratory findings cannot be directly and quantitatively extrapolated to all field-operating conditions. Nevertheless, the controlled and well-defined laboratory experiments enable a fundamental investigation of the basic mechanisms governing spray atomization, droplet transport, and rotor–spray interaction. Although the present experiments do not fully reproduce outdoor spraying conditions, they provide an essential basis for understanding droplet atomization, deposition, and drift in UAV-based plant protection. Further studies involving different spray formulations, nozzle types, and realistic field conditions are needed to validate and extend these findings.
5. Conclusions
This study systematically investigated the effects of spray pressure, rotor rotational speed, and crosswind on the atomization characteristics of UAV spraying by combining laser diffraction and particle image velocimetry (PIV). The variations in droplet size distribution and the flow field under different operating conditions were quantitatively analyzed to clarify the aerodynamic mechanisms governing spray atomization. The main conclusions are as follows.
Spray pressure was the dominant factor affecting the initial droplet atomization characteristics. Increasing spray pressure significantly reduced the median volumetric diameter (DV0.5) while increasing the volumetric fraction of droplets smaller than 150 μm (V<150 (%vol)), indicating enhanced primary atomization at the nozzle outlet. This effect resulted from the higher liquid discharge velocity and stronger instability of the liquid sheet under elevated operating pressure.
Rotor rotational speed significantly influenced the droplet size distribution beneath the UAV by regulating the rotor-induced airflow. As the rotor speed increased from 0 rpm to 2200 rpm, DV0.5 increased from 206.45 μm to 245.06 μm (18.7%), whereas V<150 (%vol) decreased from 12.86% to 10.26%. These results indicate that rotor-induced downwash promoted the aerodynamic redistribution of droplets after nozzle discharge, shifting the measured droplet spectrum toward coarser droplets and reducing the proportion of drift-prone fine droplets.
Crosswind mainly affected droplet transport characteristics through modification of the airflow velocity field. Increasing crosswind progressively distorted the spray flow field, enhanced lateral momentum transport, and altered the distribution of both horizontal and vertical velocity components. Although rotor-induced downwash effectively maintained spray plume stability under moderate crosswind conditions, its stabilizing effect gradually weakened as crosswind intensity increased, leading to greater droplet displacement and increased instability of the spray flow field.
The atomization characteristics of UAV spraying were jointly governed by spray pressure, rotor-induced airflow, and crosswind. Spray pressure determined the initial droplet size distribution, rotor-induced airflow regulated the spatial redistribution of droplets after atomization, and crosswind modified the subsequent transport process by changing the surrounding aerodynamic environment. Therefore, the droplet size distribution and velocity field measured beneath the rotor should be interpreted as the combined result of hydraulic atomization and aerodynamic regulation rather than the effect of a single operating parameter.
Overall, this study improves the understanding of the mechanisms governing droplet atomization characteristics under UAV spraying conditions and provides experimental evidence for optimizing spray operating parameters. The findings provide a theoretical basis for improving atomization quality, reducing spray drift risk, and supporting the development of precision UAV spraying technologies. Future studies should further investigate the coupled effects of crop canopy structure, atmospheric turbulence, and different UAV platforms under field conditions to extend the applicability of the proposed conclusions.
Author Contributions
Conceptualization, Q.L. and Y.L.; methodology, H.Z. and L.Y.; software, D.M. and L.L.; validation, Q.L. and Y.L.; formal analysis, H.Z. and Q.Z.; investigation, Q.Z., L.L. and L.Y.; resources, Q.L. and Y.L.; data curation, Q.Z. and D.M.; writing—original draft preparation, Q.L.; writing—review and editing, Q.L. and Y.L.; visualization, D.M. and L.L.; supervision, Y.L. and Q.L.; project administration, Y.L.; funding acquisition, Y.L. All authors have read and agreed to the published version of the manuscript.
Funding
This research was funded by Key Research Project of Higher Education Institutions in Anhui Provincial Department of Education, grant number 2024AH051737 and 2025AHGXZK40183; The Open Fund of Anhui Undergrowth Crop Intelligent Equipment Engineering Research Center, grant number AUCIEERC -2024-03; Huainan Municipal Guiding Science and Technology Program Project, grant number 2025098.
Data Availability Statement
The data presented in this study are available upon request from the corresponding author.
Conflicts of Interest
The authors declare no conflicts of interest.
References
- The Farmers’ Daily; DJI Agriculture. Agricultural UAV Industry White Paper (2024/2025). Beijing, China: 2025. pp. 48–49. Available online: https://www.chinanews.com.cn/cj/2025/08-23/10470039.shtml (accessed on 25 May 2026).
- Ferguson, J.C.; Chechetto, R.G.; O’donnell, C.C.; Dorr, G.J.; Moore, J.H.; Baker, G.J.; Powis, K.J.; Hewitt, A.J. Determining the drift potential of Venturi nozzles compared with standard nozzles across three insecticide spray solutions in a wind tunnel. Pest Manag. Sci. 2016, 72, 1460–1466. [Google Scholar] [CrossRef] [Scilit] [PubMed]
- Chen, Q.; Zhang, J.; Zhang, C.; Zhou, H.; Jiang, X.; Yang, F.; Wang, Y. CFD analysis and RBFNN-based optimization of spraying system for a six-rotor unmanned aerial vehicle (UAV) sprayer. Crop Prot. 2023, 174, 106433. [Google Scholar] [CrossRef] [Scilit]
- Tang, Q.; Zhang, R.; Chen, L.; Zhang, P.; Li, L.; Xu, G.; Yi, T.; Hewitt, A. Improving UASS pesticide application: Optimizing and validating drift and deposition simulations. Pest Manag. Sci. 2025, 81, 127–140. [Google Scholar] [CrossRef] [Scilit] [PubMed]
- Giahi, M.; Bergstrom, D.J.; Singh, B. Computational fluid dynamics analysis of an agricultural spray in a crossflow. Biosyst. Eng. 2023, 230, 329–343. [Google Scholar] [CrossRef] [Scilit]
- Dorr, G.J.; Hewitt, A.J.; Adkins, S.W.; Hanan, J.; Zhang, H.; Noller, B. A comparison of initial spray characteristics produced by agricultural nozzles. Crop Prot. 2013, 53, 109–117. [Google Scholar] [CrossRef] [Scilit]
- Hassen, N.S.; Sidik, N.a.C. Assessment of atomization parameters for flat fan nozzles based on wind tunnel measurements. J. Adv. Res. Fluid Mech. Therm. Sci. 2017, 38, 1–9. [Google Scholar]
- Gong, C.; Chen, F.; Cui, B.; Wang, A.; Zhang, Z.; Zhou, Z.; Liu, Y. Droplet spatial distribution of oil-based emulsion spray. Front. Plant Sci. 2023, 14, 1183387. [Google Scholar] [CrossRef] [Scilit] [PubMed]
- Yang, W.; Zhong, W.; Jia, W.; Wang, B.; Yang, Y.; Wan, H.; Wu, G. Atomization mechanisms and high-speed imaging of liquid sheet breakup in emulsion-based agricultural sprays: A review. Cogent Food Agric. 2025, 11, 2581332. [Google Scholar] [CrossRef] [Scilit]
- Yang, W.; Jia, W.; Ou, M.; Zhong, W.; Jiang, L.; Wang, X. Effect of Physical Properties of an Emulsion Pesticide on the Atomisation Process and the Spatial Distribution of Droplet Size. Agriculture 2022, 12, 949. [Google Scholar] [CrossRef] [Scilit]
- Liu, Q.; Shan, C.; Zhang, H.; Song, C.; Lan, Y. Evaluation of liquid atomization and spray drift reduction of hydraulic nozzles with four spray Adjuvant Solutions. Agriculture 2023, 13, 236. [Google Scholar] [CrossRef] [Scilit]
- Varkevisser, T.; Kooij, S.; Villermaux, E.; Bonn, D. Effect of high wind speeds on droplet formation in sprays. J. Fluid Mech. 2024, 1000, A86. [Google Scholar] [CrossRef] [Scilit]
- Broumand, M.; Asgarian, A.; Bussmann, M.; Chattopadhyay, K.; Thomson, M.J. Spatio-temporal dynamics and disintegration of a fan liquid sheet. Phys. Fluids 2021, 33, 112109. [Google Scholar] [CrossRef] [Scilit]
- Li, J.; Shi, Y.; Lan, Y.; Guo, S. Vertical distribution and vortex structure of rotor wind field under the influence of rice canopy. Comput. Electron. Agric. 2019, 159, 140–146. [Google Scholar] [CrossRef] [Scilit]
- Zhang, H.; Qi, L.; Wan, J.; Musiu, E.M.; Zhou, J.; Lu, Z.A.; Wang, P. Numerical simulation of downwash airflow distribution inside tree canopies of an apple orchard from a multirotor unmanned aerial vehicle (UAV) sprayer. Comput. Electron. Agric. 2022, 195, 106817. [Google Scholar] [CrossRef] [Scilit]
- Guo, Q.; Zhu, Y.; Tang, Y.; Hou, C.; Fang, M.; Chen, X. Numerical simulation of the effects of downwash airflow and crosswinds on the spray performance of quad-rotor agricultural UAVs. Smart Agric. Technol. 2025, 11, 100940. [Google Scholar] [CrossRef] [Scilit]
- Tang, Q.; Zhang, R.; Yi, T.; Xu, G.; Li, L.; Chen, L. Numerical simulation of agricultural unmanned helicopter corn canopy spraying. Comput. Electron. Agric. 2024, 224, 109178. [Google Scholar] [CrossRef] [Scilit]
- Ferguson, J.C.; O’donnell, C.C.; Chauhan, B.S.; Adkins, S.W.; Kruger, G.R.; Wang, R.; Ferreira, P.H.U.; Hewitt, A.J. Determining the uniformity and consistency of droplet size across spray drift reducing nozzles in a wind tunnel. Crop Prot. 2015, 76, 1–6. [Google Scholar] [CrossRef] [Scilit]
- Wang, J.; Lan, Y.; Wen, S.; Hewitt, A.J.; Yao, W.; Chen, P. Meteorological and flight altitude effects on deposition, penetration, and drift in pineapple aerial spraying. Asia Pac. J. Chem. Eng. 2020, 15, e2382. [Google Scholar] [CrossRef] [Scilit]
- Hassen, N.S.; Sidik, N.a.C. Wind tunnel measurements on the effect of sprayer speed on the droplet size spectra. J. Adv. Res. Fluid Mech. Therm. Sci. 2018, 43, 104–111. [Google Scholar]
- Liu, Q.; Ma, D.; Zhang, H.; Liang, L.; Zhang, L.; Wang, Y.; Lan, Y. Effects of Formulation on Spray Nozzle Performance for Applications from Unmanned Aerial Spraying Systems (UASSs). Agronomy 2026, 16, 76. [Google Scholar] [CrossRef] [Scilit]
- BS EN ISO 22856:2008; Equipment for Crop Protection—Methods for the Laboratory Measurement of Spray Drift—Wind Tunnels. BSI: London, UK, 2008.
- Baek, J.W.; Eun, H.R.; Kim, S.H.; Lee, Y.H.; Jeong, M.J.; Han, X.; Min, Y.G.; Noh, H.H.; Shin, Y. Reduction of pesticide dosage and off-target drift with enhanced control efficacy in unmanned aerial vehicle-based application using lecithin adjuvants. Pest Manag. Sci. 2024, 82, 7204–7217. [Google Scholar] [CrossRef] [Scilit] [PubMed]
- Lin, Y. Effect of Vegetable Oil Adjuvant on Wetting, Drift, and Deposition of Pesticide Droplets from UAV Sprayers on Litchi Leaves. Agronomy 2025, 15, 293. [Google Scholar] [CrossRef] [Scilit]
- Fritz, B.K.; Butts, T. Influence of UAV Rotor Wash on Spray Droplet Atomization: Implications for Pesticide Application and Environmental Risk. In Pesticide Formulation and Delivery Systems: 43rd Volume, Creating Certainty in an Uncertain World; Turpin, K., Ed.; ASTM International: West Conshohocken, PA, USA, 2025; pp. 65–78. [Google Scholar]
- Xu, Z.; Wang, T.; Che, Z. Droplet breakup in airflow with strong shear effect. J. Fluid Mech. 2022, 941, A54. [Google Scholar] [CrossRef] [Scilit]
- Shouji, C.; Dafsari, R.A.; Yu, S.H.; Choi, Y.; Lee, J. Mean and turbulent flow characteristics of downwash air flow generated by a single rotor blade in agricultural drones. Comput. Electron. Agric. 2021, 190, 106471. [Google Scholar] [CrossRef] [Scilit]
- Chang, K.; Chen, S.; Wang, M.; Liu, J.; Zeng, Z.; Lan, Y. Simulation and verification of coupling characteristics of downwash airflow field and droplet field of agricultural unmanned aerial vehicle. Smart Agric. Technol. 2026, 13, 101737. [Google Scholar] [CrossRef] [Scilit]
- Chen, S.; Zhan, Y.; Lan, Y.; Yan, Y.; Qian, S.; Chen, W.; Chen, L. Influence of crosswind on droplet drift of flat-fan nozzle in aviation plant protection UAV. J. South China Agric. Univ. 2021, 42, 89–98. [Google Scholar]
- Wang, G.; Han, Y.; Li, X.; Andaloro, J.; Lan, Y. Field evaluation of spray drift and environmental impact using an agricultural unmanned aerial vehicle (UAV) sprayer. Sci. Total Environ. 2020, 737, 139793. [Google Scholar] [CrossRef] [Scilit] [PubMed]
- Matthews, D.R.; Bateman, G.; Miller, R. Pesticide Application Methods; Wiley-Blackwell: Chichester, UK, 2014. [Google Scholar]
- Miller, P.C.H.; Ellis, M.C.B. Effects of formulation on spray nozzle performance for applications from ground-based boom sprayers. Crop Prot. 2000, 19, 609–615. [Google Scholar] [CrossRef] [Scilit]
- Nuyttens, D.; Baetens, K.; Schampheleire, M.D.; Sonck, B. Effect of nozzle type, size and pressure on spray droplet characteristics. Biosyst. Eng. 2007, 97, 333–345. [Google Scholar] [CrossRef] [Scilit]

Disclaimer/Publisher’s Note: The statements, opinions and data contained in all publications are solely those of the individual author(s) and contributor(s) and not of MDPI and/or the editor(s). MDPI and/or the editor(s) disclaim responsibility for any injury to people or property resulting from any ideas, methods, instructions or products referred to in the content. |
© 2026 by the authors. Licensee MDPI, Basel, Switzerland. This article is an open access article distributed under the terms and conditions of the Creative Commons Attribution (CC BY) license.