1. Introduction
Reliable post-harvest assessment is essential for maintaining product quality, reducing losses, and supporting efficient grading, storage, transportation, and processing. Among the attributes evaluated after harvest, maturity is particularly important because it influences physicochemical properties, sensory quality, shelf life, processing suitability, and market destination. Conventional maturity assessment frequently relies on visual inspection, tactile examination, or judgments performed by trained operators. Although these procedures are accessible and inexpensive, their dependence on human perception can introduce subjectivity and inter-operator variability, thereby limiting reproducibility and throughput in automated processing environments [
1,
2].
Coconut (
Cocos nucifera L.) is a commercially and socially important perennial crop throughout humid tropical regions. Its fruit and by-products support food, beverage, oil, fiber, animal-feed, cosmetic, and industrial value chains, while coconut-derived components have also been investigated for nutraceutical and health-related applications [
3,
4]. Coconut cultivation is particularly relevant in northeastern Brazil, where favorable coastal conditions support extensive agricultural production and associated agro-industrial activities [
5]. The commercial destination of the fruit depends partly on its maturity stage: young coconuts are primarily valued for their water and tender endosperm, whereas mature coconuts are used for solid endosperm, milk, oil, and other processed products [
6]. Reliable maturity assessment is therefore important for directing individual fruits toward suitable markets and processing operations.
Non-destructive coconut maturity assessment remains challenging because externally visible characteristics do not necessarily reflect the internal condition of the fruit. Traditional evaluation may therefore include tapping the coconut with a fingernail, knuckle, or rigid implement and interpreting the resulting sound [
7,
8]. The acoustic response varies with maturity-dependent characteristics, including the amount and distribution of liquid endosperm, the development of solid endosperm, and the mechanical properties of the shell and fibrous husk [
6,
7]. Nevertheless, manual interpretation requires experience and may be affected by differences in auditory perception, impact force, tapping position, and environmental conditions. These sources of variability hinder the standardization and scalability of manual tapping for automated grading applications.
Acoustic sensing offers a non-destructive and information-rich alternative for evaluating the internal properties of fruit. When a fruit is mechanically excited, the measured response contains transient and resonant components determined by its geometry, mass distribution, firmness, internal composition, and boundary conditions. Acoustic and vibration-based techniques have consequently been investigated for assessing fruit-quality attributes such as firmness, internal defects, and maturity [
2]. Digital signal processing (DSP) can detect relevant impact events and characterize their temporal, spectral, and time–frequency properties, while machine-learning algorithms can use these representations to distinguish quality or physiological conditions.
In the specific context of coconut maturity assessment, Caladcad et al. developed a synchronized mechanical tapping and recording system and evaluated frequency-domain representations using artificial neural networks, random forests, and support vector machines [
8]. The recordings produced using that system were subsequently released as a public dataset containing coconuts from three maturity stages measured at three side ridges [
9]. More recent studies have investigated deep-learning architectures using acoustic coconut data [
10,
11]. Collectively, these investigations demonstrate that tapping sounds contain discriminative maturity-related information. However, the evaluated representations have predominantly been designed or learned specifically for the target classification task, potentially making their performance dependent on crop-specific feature engineering, preprocessing choices, and the availability of labeled examples.
Audio foundation models offer a different representation-learning paradigm. Large-scale Contrastive Language–Audio Pretraining (CLAP) learns a shared embedding space from audio recordings, producing general-purpose representations that can be transferred to downstream audio retrieval and classification tasks [
12]. Such pretrained representations may reduce reliance on manually designed, crop-specific acoustic descriptors and may be particularly valuable for agricultural applications in which labeled datasets are limited. Coconut-tapping signals, however, differ substantially from the general audio used during CLAP pretraining. They consist of short impulsive events with subtle maturity-dependent differences and are influenced by impact position, excitation variability, and fruit-specific physical structure. It therefore remains uncertain whether CLAP embeddings preserve sufficient information to distinguish coconut maturity stages and whether they can achieve performance comparable to that of task-specific acoustic representations.
Beyond evaluating the discriminative capacity of CLAP representations for individual tapping events, a related methodological question concerns the relationship between event-level predictions and the maturity classification of the fruit as a whole. Given the event-level variability discussed above, combining evidence across multiple tapping events and ridge positions may provide a more robust fruit-level decision than relying on an isolated impact. The assessment of an acoustic-grading methodology should therefore distinguish event-level discrimination from fruit-level classification and determine whether multi-event aggregation provides a measurable improvement.
Accordingly, the objective of this study is to investigate the transferability of representations extracted from a general-purpose CLAP audio–language model to non-destructive coconut maturity assessment and to compare their classification performance with Mel-spectral representations. The analysis considers three maturity classes: immature, mature, and overmature. Using a previously published acoustic dataset, the proposed framework combines DSP-based selection of candidate tapping-event segments, event-level classification using CLAP embeddings and conventional Mel-spectral representations, and decision-level aggregation across events and ridge positions to obtain fruit-level classifications. All approaches are evaluated using fruit-disjoint data partitions.
The principal contributions of this study are threefold: (i) an evaluation of the transferability of CLAP embeddings to a specialized agricultural acoustic domain; (ii) a comparative assessment of general-purpose pretrained representations and Mel-spectral representations; and (iii) an analysis of multi-event aggregation for fruit-level maturity classification. By integrating DSP-based event selection, audio foundation-model representations, and decision-level aggregation, this work examines the potential of pretrained audio representations for non-destructive post-harvest assessment without assuming deployment on a specific sensing or embedded-computing platform.
2. Materials and Methods
2.1. Methodological Overview
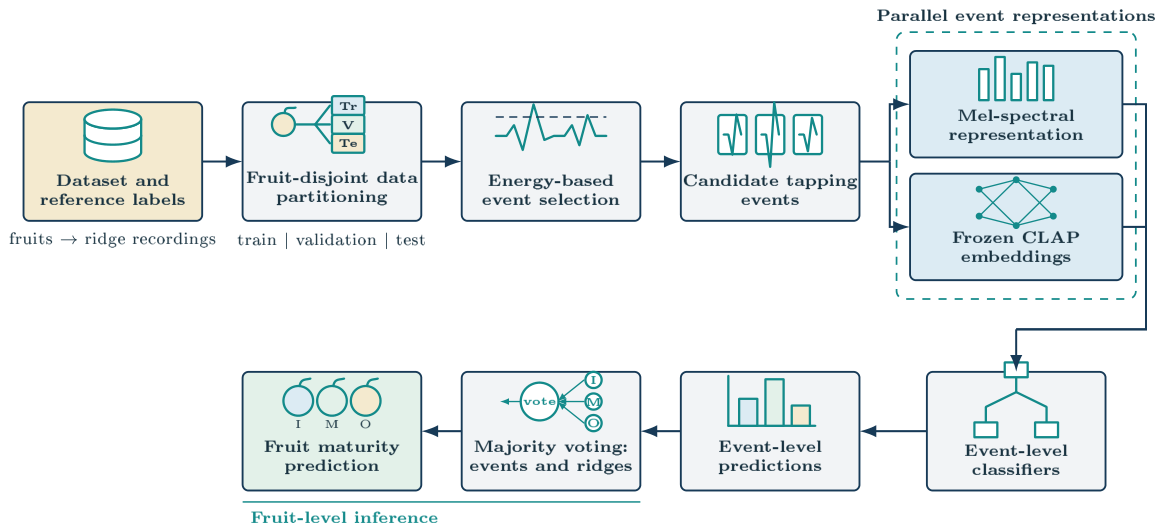
The proposed methodology infers coconut maturity from acoustic responses produced by controlled tapping. Following dataset curation, fruits were assigned to disjoint training, validation, and test subsets while keeping all ridge recordings from the same fruit together. Each ridge recording was analyzed in 100 ms frames, and a band-limited energy criterion was applied to select candidate tapping-event segments. The retained segments were represented using either conventional Mel-spectral representations or frozen embeddings extracted from a pretrained CLAP model. Separate downstream classifiers produced one maturity prediction per candidate segment, and the event-level predictions associated with each fruit were combined by majority voting to obtain a fruit-level decision.
The two representation branches used the same fruit-disjoint data partitions. All data-dependent preprocessing, imbalance handling, model fitting, and model selection were restricted to the development data. Performance was assessed separately at the event and fruit levels, with the fruit considered the independent observational unit for final evaluation.
Figure 1 summarizes the processing stages.
The software packages and model resources used to implement the signal-processing, model-development, and evaluation stages of this work, together with their respective versions or identifiers, are summarized in
Table 1.
2.2. Dataset Description and Cohort Definition
This study used the publicly available acoustic dataset published by Caladcad and Piedad [
9]. The dataset and acquisition system are described in the dataset article and in the associated methodological study by Caladcad et al. [
8]. Although the dataset article states that 129 post-harvest Philippine coconuts of the tall variety were collected, the class counts reported in the article and the data available in the distributed file comprise 127 fruits: 8 immature, 36 mature, and 83 overmature. The distributed data were therefore used to define the initial cohort. The maturity labels had been assigned by local farmers and experts during construction of the original dataset and were adopted as the reference classes in this study. The term “immature” is used throughout this manuscript for the class designated as “premature” in the source dataset.
The acquisition system reproduced the traditional practice of assessing coconut maturity from the sound generated by tapping. A mechanically actuated arm with a hard-rubber contact end struck the fruit, which was secured in a rigid holder inside an acoustically treated chamber, and the response was recorded using an ATR2500 USB condenser microphone. The source study describes the servomotor-driven arm as producing a consistent motion and force, but it does not report the force in physical units. Each fruit was recorded separately at three central side ridges, denoted Ridge A, Ridge B, and Ridge C. Each single-channel recording lasted 3 s and was sampled at 44.1 kHz with 16-bit amplitude resolution, yielding 132,300 samples per waveform. The 44.1 kHz rate was fixed by the original acquisition system rather than selected in the present study; it provides a Nyquist frequency of 22.05 kHz, above the 15 kHz upper limit used for event selection. The native rate was retained for segmentation, whereas only the CLAP branch was resampled to the 48 kHz input rate expected by the pretrained processor. The distributed cohort consequently comprised 381 ridge-level recordings (
Table 2).
Individual measurements of fruit dimensions, shape, mass, internal liquid and solid-endosperm composition, and the numerical tapping force were not included with the public data. Their separate effects on the acoustic response therefore cannot be quantified from this cohort.
2.3. Fruit-Level Data Partitioning
The 127-fruit cohort was partitioned using the fruit as the grouping unit. A stratified holdout procedure assigned approximately 60%, 10%, and 30% of the fruits to the training, validation, and test subsets, respectively, using a random seed of 42 (
Table 3). All ridge recordings and all candidate segments derived from a given fruit remained in the same subset. This grouping prevented observations from the same coconut from occurring in both model-development and test data. A fruit was eligible for the subsequent event- and fruit-level analyses only if the energy-based procedure retained at least one candidate segment across its three ridge recordings. This eligibility criterion was applied using the procedure described in
Section 2.4, and the resulting exclusions and final subset composition are reported in
Section 3.2.
The same fruit assignments were used across representation and classification strategies. Scaling parameters, class weights, and sampling weights were estimated from the training subset only and then applied without refitting to the validation and test subsets. The test subset was not used for feature configuration, hyperparameter selection, early stopping, or selection of the aggregation rule.
2.4. Energy-Based Selection of Candidate Tapping-Event Segments
The ridge recordings contain multiple acoustic responses generated by the mechanical tapping procedure. Each recording was analyzed in 100 ms frames, corresponding to 4410 samples at 44.1 kHz. A spectrogram was computed, and the band-limited energy of temporal frame
n was obtained by summing the spectral values between 5 and 15 kHz. This fixed band was used as an event-selection heuristic because it emphasizes the broadband, high-frequency components of the tapping impacts while reducing the influence of the stronger low-frequency background visible in the recordings. Its upper limit also remains below the 22.05 kHz Nyquist frequency of the source data. The band was used only to select candidate events and was not interpreted as a complete physical description of maturity-related spectral content:
where
denotes the spectrogram value at frequency bin
and frame
n. To accommodate differences in amplitude among recordings, the decision thresholds were calculated separately from the energy distribution of each recording. Frames satisfying
were retained as candidate tapping-event segments, whereas frames satisfying
were considered background. Here,
and
denote the 90th and 50th percentiles, respectively, of the frame-energy distribution for the corresponding recording. The three outcomes were mutually exclusive: frames above the 90th percentile were retained as candidate tapping events, frames below the 50th percentile were designated as background, and frames from the 50th through the 90th percentile were treated as an intermediate region and excluded from both sets. The frequency band and percentile levels were fixed across recordings, whereas the resulting energy thresholds adapted to the energy distribution of each waveform.
Each retained segment inherited the maturity label, fruit identifier, and ridge position of its source recording. The reference maturity class was therefore assigned at the fruit level rather than independently annotated for every physical impact. Accordingly, the selected observations are referred to as candidate tapping-event segments: they are high-energy 100 ms frames associated with tapping activity, not independently delimited and annotated impacts.
2.5. Event-Level Acoustic Representations
Each candidate tapping-event segment was independently transformed into an acoustic representation. Two representation families were examined: conventional Mel-spectral representations and embeddings extracted from a pretrained CLAP audio encoder. The representations were used as alternative inputs to the downstream classifiers and were not concatenated.
2.5.1. Mel-Spectral Representations
The conventional branch comprised two compact representations derived from a Mel-spaced spectral analysis: Mel-band summary features and Mel-frequency cepstral coefficients (MFCCs). The Mel-band representation contained 12 features summarizing the spectral content of each candidate segment within Mel-spaced frequency bands. The MFCC representation comprised 12 coefficients computed by applying logarithmic compression and a discrete cosine transform to the Mel-filter-bank energies [
13,
14]. Both representations analyzed acoustic content between 1 and 15 kHz.
Before classifier fitting, each feature dimension was mapped to using min–max scaling. The minimum and maximum values were estimated exclusively from the training subset and applied unchanged to the validation and test subsets.
2.5.2. CLAP Embeddings
The second representation branch used the audio encoder of a pretrained LAION-CLAP model [
12]. Specifically, embeddings were extracted using the publicly released general-purpose checkpoint trained on general audio, music, and speech (Hugging Face model identifier: laion/larger_clap_general) [
15]. CLAP learns transferable audio and text representations in a shared embedding space from large-scale paired data. Only its audio branch was used in this study; no text prompts or zero-shot audio–text classification were employed.
Each 100 ms candidate tapping-event segment, originally containing 4410 samples at 44.1 kHz, was resampled to 48 kHz, producing 4800 samples. Short inputs were adapted through the
padding setting of
ClapFeatureExtractor, invoked through
ClapProcessor, which provides alternative modes including
pad and
repeatpad. The primary analysis used
pad: each resampled waveform was right-padded with zero-valued samples to obtain the 480,000-sample input corresponding to the processor’s configured 10 s duration. The candidate segment consequently occupied 1% of the resulting input, and this adaptation was applied identically to all candidate segments. The complementary analysis using
repeatpad is described in
Section 2.8. The processor generated a 64-band Mel time–frequency representation for the pretrained audio encoder. The selected CLAP checkpoint uses a Hierarchical Token-Semantic Audio Transformer (HTS-AT), which processes audio through a hierarchical Transformer structure and a token-semantic module [
16]. The pooled encoder output was transformed by the pretrained audio-projection layer and L2-normalized, yielding one 512-dimensional embedding per candidate segment.
All parameters of the CLAP audio encoder and projection layer remained frozen. The downstream classifiers described in
Section 2.6 were separate models trained on the extracted embeddings and did not form part of the CLAP architecture. Embeddings were extracted in batches of 32 and cached before classifier development. Their dimensions were standardized using means and standard deviations estimated from the training subset and applied unchanged to validation and test embeddings.
2.6. Event-Level Classifiers and Training
Event-level classification comprised conventional machine-learning models, a deep spectral model, and classifiers trained on frozen CLAP embeddings. For the conventional model-selection stage, the 12-dimensional Mel-band feature vector was used to train five candidate classifiers: class-weighted LightGBM [
17], Random Forest, Bagging, Extra Trees, and
k-nearest neighbors (
k-NN). The models were fitted using the training subset and ranked according to their balanced accuracy on the validation subset. The classifier attaining the highest validation balanced accuracy was retained as the conventional reference configuration for final test evaluation.
The additional evaluated configurations included an EfficientNet-B0 classifier [
18] applied to Mel-spectrogram representations and two downstream classifiers applied to the frozen 512-dimensional CLAP embeddings: an RBF-SVM [
19] and a regularized multilayer perceptron (MLP). To provide a more controlled comparison among acoustic representations, the regularized MLP was also trained using the 12 Mel-band features and the 12 MFCCs. In these representation-control configurations, the input dimension was adjusted while the hidden-layer architecture and training procedure were maintained.
The regularized MLP contained three fully connected hidden layers. Each hidden layer combined a linear transformation, batch normalization, and rectified linear unit activation. Dropout was applied with decreasing rates across the hidden layers, and the final linear layer produced three output scores corresponding to the immature, mature, and overmature classes. The architecture is summarized in
Table 4.
Class imbalance during MLP training was addressed using a weighted random sampler and a class-weighted focal loss [
20]. If
denotes the number of training segments belonging to class
c, the sampling weight assigned to observation
i, with class label
, was proportional to
where
is a small positive constant used for numerical stability. The sampler operated with replacement. Focal loss was used with a focusing parameter of
, inverse-frequency class weights, and label smoothing of 0.05. No waveform- or feature-space data augmentation was applied.
The MLP was optimized using AdamW [
21] with a learning rate of
, a weight decay of
, a cosine-annealing learning-rate schedule, and a mini-batch size of 128. Balanced accuracy on the validation subset was used for model selection. Training was stopped after 30 consecutive epochs without improvement, and the parameters from the epoch with the highest validation balanced accuracy were retained.
For representation and classifier configuration
b, the event-level prediction for candidate segment
i, extracted from ridge
r of fruit
f, was defined as
where
denotes the output score assigned to class
c by configuration
b, and
contains the immature, mature, and overmature classes.
2.7. Multi-Event Aggregation and Fruit-Level Classification
Each fruit contributed multiple candidate tapping-event segments across its three ridge recordings. The hard event-level predictions obtained for a given fruit were pooled across the available ridges and combined by unweighted majority voting. For configuration
b, the number of votes assigned to class
c for fruit
f was
where
denotes the set of candidate segments retained from ridge
r of fruit
f, and
is the indicator function. The final fruit-level prediction was
Each retained candidate segment therefore contributed one vote. A ridge with no retained segment contributed no vote, whereas ridges yielding more candidate segments contributed proportionally more votes. The aggregation procedure used only the event-level predictions associated with the fruit being classified. Because the aggregation involved three classes, a tied maximum could theoretically occur even with an odd number of candidate-segment votes. However, no tied maximum occurred for any fruit under any evaluated configuration in the present dataset. The multi-event aggregation presented here therefore produced a unique fruit-level prediction in every case, and no tie-breaking rule was required. The formulation also permits a straightforward extension to weighted voting, for example by assigning each candidate segment a weight derived from its band-limited energy.
2.8. Evaluation Protocol
All configurations were evaluated using the same fruit-disjoint training, validation, and test subsets. Model parameters and data-dependent preprocessing operations were estimated using the training subset. The validation subset was used to select among candidate classifiers and, for the neural models, to perform early stopping and select the retained checkpoint. For each neural configuration, the parameters from the epoch with the highest validation-balanced accuracy were retained.
For the primary analysis, after model selection was completed, the retained configurations were evaluated once on the fruit-disjoint test subset. Test observations were not used for classifier selection, preprocessing estimation, early stopping, or any other model-development decision.
A complementary sensitivity analysis examined whether the short-input adaptation affected the CLAP–MLP results. The original zero-padding procedure was compared with the CLAP feature extractor’s repeatpad option, which fills a short input by repeating its waveform before applying residual padding when necessary. At the present segment length, waveform repetition filled the 480,000-sample input exactly, and no residual zero-padding was required. Embeddings were extracted from the same 4747 candidate segments, and both input-adaptation conditions used the same fruit-disjoint partitions and MLP training protocol. The same ten random seeds were used for MLP training under both input-adaptation conditions, yielding ten matched-seed comparisons. This complementary analysis did not alter the original preprocessing strategy, model-selection procedure, or primary results.
Balanced accuracy was selected as the primary performance metric because the maturity classes were markedly imbalanced. Accuracy and macro-averaged F1-score were also calculated. Metrics were reported separately at the candidate-event and fruit levels. At the event level, predictions were compared with the maturity labels inherited from the corresponding fruits. At the fruit level, the predictions obtained through majority voting were compared with the expert reference labels assigned to the fruits. The comparisons were descriptive, and no inferential hypothesis tests were performed. Differences between event- and fruit-level metrics were also interpreted descriptively because the two levels involved different observational units and numbers of predictions.
3. Results and Discussion
3.1. Illustrative Spectrograms of Tapping Recordings
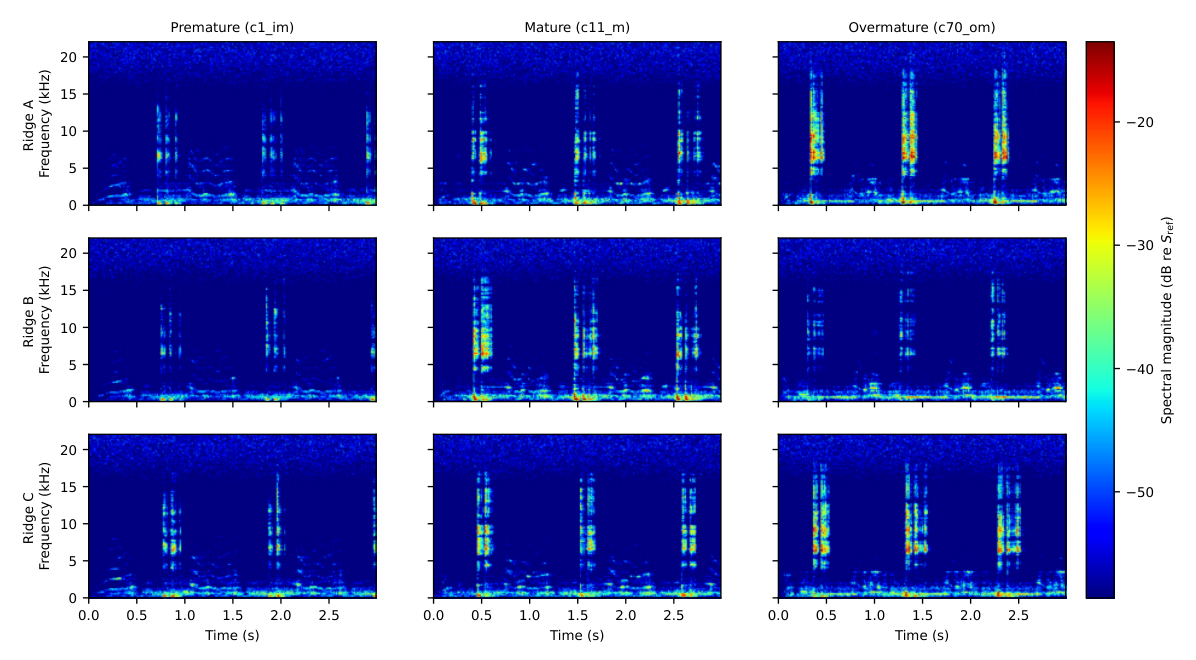
Figure 2 illustrates the time–frequency structure of complete tapping recordings obtained from three fruits, one from each maturity class. For each fruit, recordings from Ridge A, Ridge B, and Ridge C are shown to illustrate the variability associated with the tapping position. Each recording contains a sequence of impacts produced during the mechanically controlled tapping procedure. All nine panels share the common relative decibel scale defined in the caption, so that magnitudes can be compared directly across maturity classes and ridge positions.
The individual tapping responses appear as short-duration broadband structures at successive time instants. The strongest visible components generally extend through the mid- and high-frequency bands used by the energy detector, whereas persistent lower-level components occur mainly below approximately 5 kHz and between impacts. Response magnitude, bandwidth, and the relative prominence of successive impacts vary not only among the three illustrated fruits but also across the ridges of the same fruit. These patterns indicate that an individual acoustic observation may reflect variation in the impact and recording conditions in addition to variation associated with the fruit.
The spectrograms therefore provide qualitative context for the energy-based selection and illustrate within-fruit variability across ridge positions, which motivates aggregating multiple event-level predictions into a single fruit-level decision. These examples are not intended to establish maturity-class separability; that question is evaluated quantitatively through the subsequent event- and fruit-level classification analyses.
3.2. Distribution of Candidate Tapping-Event Segments
The energy-based procedure retained 4747 candidate tapping-event segments. Because partitioning was performed at the fruit level, all segments derived from the same coconut remained in one subset. The resulting dataset contained 3772 training, 237 validation, and 738 test segments (
Table 5). Of the 39 fruits initially assigned to the test subset, one yielded no candidate segment after the energy-based selection procedure and was excluded from the subsequent evaluation. Four training fruits were excluded for the same reason; no validation fruit was excluded. Thus, 5 of the initial 127 fruits were excluded and 122 remained: 72 for training, 12 for validation, and 38 for testing. The reduction from 127 to 38 therefore does not represent an elimination of 89 fruits; 38 was the predefined test allocation after one test fruit was excluded, while the other 84 retained fruits were used for model development. The exclusion was based solely on the event-selection output and did not depend on classifier predictions or test-set performance.
At the candidate-segment level, the training subset comprised 23.3% immature, 40.1% mature, and 36.6% overmature segments; the validation subset comprised 19.0%, 30.4%, and 50.6%, respectively; and the test subset comprised 12.2%, 39.0%, and 48.8%, respectively.
Table 6 reports the corresponding composition at the fruit level after event selection.
These counts represent repeated acoustic observations rather than independent experimental units. Multiple candidate segments originate from each fruit and inherit the same fruit-level reference label. The fruit therefore remained the independent unit for final performance assessment. The overmature class was most frequent because of availability in the source cohort, not because it was assigned greater analytical or commercial importance. Stratification preserved this distribution across subsets, and balanced accuracy was used so that each class-specific recall contributed equally to the primary metric.
3.3. Validation-Based Selection of the Conventional Reference Model
Five conventional classifiers were evaluated using the 12-feature Mel-band representation.
Table 7 presents their event-level performance on the validation subset. Because balanced accuracy was the predefined selection metric, the comparison was based primarily on this measure.
LightGBM achieved the highest validation-balanced accuracy, 0.6778, and was therefore selected as the conventional reference configuration. Its validation accuracy was 0.6203. The validation results were used exclusively for model selection and were not interpreted as estimates of final generalization performance.
3.4. Final Test Performance at the Event and Fruit Levels
The evaluated configurations were assessed on the fruit-disjoint test subset, which contained 738 candidate tapping-event segments from 38 fruits. Fruit-level predictions were obtained by majority voting across the candidate segments and ridge positions associated with each fruit.
Table 8 presents balanced accuracy at both evaluation levels.
On the test subset, the selected Mel-band–LightGBM reference configuration achieved an event-level balanced accuracy of 0.5111, an accuracy of 0.6341, and a macro-F1 of 0.5094. After majority-vote aggregation, its fruit-level balanced accuracy increased to 0.5417, while its accuracy and macro-F1 were 0.7632 and 0.5178, respectively. The difference between its validation- and test-balanced accuracies illustrates the uncertainty associated with model selection using a limited and imbalanced validation subset.
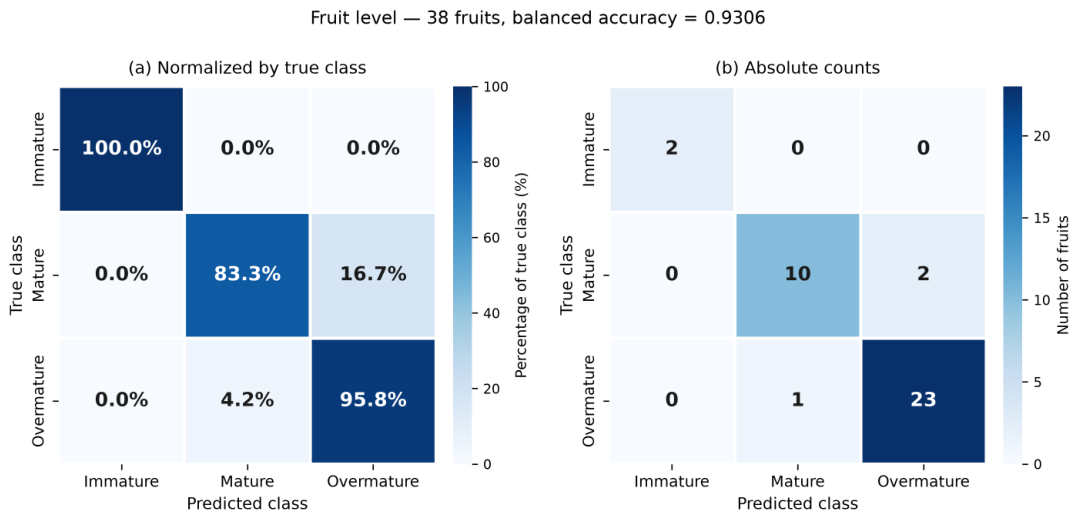
The frozen CLAP embeddings combined with the regularized MLP produced the highest performance at both evaluation levels. This configuration achieved an event-level balanced accuracy of 0.6472, an accuracy of 0.6978, and a macro-F1 of 0.6510. Following multi-event aggregation, its fruit-level balanced accuracy reached 0.9306, with an accuracy of 0.9211 and a macro-F1 of 0.9361.
Figure 3 shows the fruit-level confusion matrix for this best-performing configuration, normalized within each true class. Both immature fruits were classified correctly. Of the 12 mature fruits, 10 were classified correctly and 2 were classified as overmature, giving a mature-class recall of 0.83. Of the 24 overmature fruits, 23 were classified correctly and 1 was classified as mature, giving an overmature-class recall of 0.96. Errors were therefore confined to the mature–overmature boundary in this test subset. The perfect immature-class recall must be interpreted cautiously because it is based on only two fruits.
Relative to the selected Mel-band–LightGBM reference configuration, the CLAP–MLP configuration increased balanced accuracy by 13.61 percentage points at the event level and 38.89 percentage points at the fruit level. Because these two configurations differed in both acoustic representation and downstream classifier, this comparison characterizes the performance of the complete configurations rather than the isolated effect of CLAP embeddings.
3.5. Effect of Acoustic Representation and Multi-Event Aggregation
The representation-control configurations provide a more direct assessment of the information retained by the alternative acoustic representations because the same regularized MLP architecture was used as the downstream classifier. At the event level, the CLAP–MLP configuration exceeded the Mel-band–MLP and MFCC–MLP configurations by 8.89 and 10.18 percentage points, respectively. At the fruit level, the corresponding differences were 34.73 and 38.89 percentage points. These results suggest that the frozen CLAP embeddings provided a more informative representation for the downstream MLP than the two compact Mel-spectral representations under the evaluated training conditions.
The performance difference between the two CLAP-based classifiers also indicates that the pretrained representation alone did not determine the final classification response. Although the CLAP–RBF-SVM configuration achieved an event-level balanced accuracy of 0.6102, its fruit-level balanced accuracy was 0.5833, substantially below that of the CLAP–MLP configuration. The interaction between the representation and the downstream classifier therefore influenced both event-level discrimination and the effectiveness of fruit-level aggregation.
The effect of majority voting varied across configurations. For the CLAP–MLP configuration, aggregation increased balanced accuracy from 0.6472 to 0.9306, corresponding to 28.34 percentage points. The EfficientNet-B0 configuration increased by 16.02 percentage points, whereas the Mel-band–LightGBM and Mel-band–MLP configurations increased by 3.06 and 2.50 percentage points, respectively. In contrast, fruit-level balanced accuracy was 2.69 percentage points lower for the CLAP–RBF-SVM configuration and 0.37 percentage points lower for the MFCC–MLP configuration. Multi-event aggregation was therefore not intrinsically beneficial; its effectiveness depended on the informativeness and within-fruit error structure of the event-level predictions.
A complementary sensitivity analysis examined the effect of short-input adaptation on CLAP–MLP classification. To control for stochastic variation in MLP training, the zero-padding and repeatpad conditions were evaluated using the same set of ten random seeds. For each seed, the data partitions and training settings were identical, and only the input-adaptation strategy differed, resulting in ten matched-seed comparisons. Relative to zero-padding, repeatpad reduced mean balanced accuracy across these comparisons by 9.1 percentage points at the candidate-event level and by 27.0 percentage points at the fruit level. The repeatpad condition produced lower balanced accuracy in every matched-seed comparison at both evaluation levels. Thus, replacing the zero-valued portion with waveform repetition did not improve classification.
3.6. Relation to Previous Studies and Study Limitations
Previous coconut-tapping studies evaluated frequency-domain descriptors with conventional classifiers and task-specific deep-learning architectures [
8,
10,
11]. The present study extends this line of work by evaluating a frozen general-purpose audio representation, enforcing fruit-disjoint development and test subsets, and explicitly distinguishing candidate-event performance from fruit-level performance after aggregation. Direct numerical comparison with the results of the earlier studies is not warranted, however, because their data partitions, evaluation units, and model-development procedures differ from those used here.
The configuration-dependent effect of majority voting also has a practical implication. Combining candidate events from three ridge positions may reduce reliance on an individual tapping observation, but aggregation is useful only when the underlying event predictions contain sufficiently consistent class-related information. In the present unweighted procedure, ridges contributed in proportion to the number of retained candidate segments. Future work could compare this approach with ridge-balanced or score-based aggregation rules while preserving fruit-disjoint evaluation.
Computational requirements differ substantially between the two representation branches. In indicative profiling of the present implementation, the Mel-spectral branch reduced a 100 ms segment to a 12-dimensional descriptor in approximately 0.5 ms on a general-purpose CPU; the resulting class-weighted LightGBM model occupied approximately 1.0 MB, and the Mel-band MLP contained trainable parameters. By comparison, the frozen CLAP audio encoder and projection layer contained approximately parameters, corresponding to approximately 274 MB in 32-bit or 137 MB in 16-bit precision. In the primary CLAP pipeline, each resampled 100 ms segment was right-padded with zeros to the 10 s, 48 kHz input length used for feature extraction; extraction required approximately 0.3 s per segment on a laptop-class CPU and approximately 17 ms per segment with batched GPU inference. These timing values are hardware- and implementation-dependent. The downstream CLAP–MLP classifier itself contained parameters (approximately 0.68 MB). Freezing the encoder eliminated its training cost and allowed embeddings to be cached once in the present offline experiments, but it does not remove encoder inference from a system that receives new waveforms. Embedded deployment would therefore require compression, such as quantization or distillation, or off-device embedding computation.
The observed difference in balanced accuracy between zero-padding (pad) and waveform repetition (repeatpad) indicates that CLAP–MLP performance is sensitive to how the 100 ms waveform is adapted to the 10 s CLAP input. In the primary zero-padding condition, every candidate segment had the same duration and received the same number of zero-valued samples; therefore, no class-dependent difference in padding duration was introduced. Conversely, repeatpad removed the zero-valued portion but created an artificial periodic sequence of identical impacts rather than providing additional natural acoustic context. Its lower performance demonstrates that replacing zero-padding with waveform repetition did not improve classification, but it does not establish zero-padding as the optimal short-input strategy. The primary findings should therefore be interpreted as conditional on the documented zero-padding procedure. Future studies should compare alternative input adaptations using longer excerpts centered on detected events and preserving their surrounding context from the original ridge recordings.
The high fruit-level balanced accuracy obtained by the CLAP–MLP configuration provides proof-of-concept evidence that frozen CLAP embeddings retain information useful for coconut maturity classification within the evaluated acquisition, preprocessing, and aggregation framework. Because the study used a public cohort of tall-variety coconuts recorded with one acquisition system, this evidence remains specific to the represented cohort and experimental conditions.
Only two of the 38 test fruits belonged to the immature class; consequently, the classification outcome of a single immature fruit can substantially affect class-specific recall and balanced accuracy. External evaluation using larger and more balanced cohorts, additional varieties, and independent acquisition conditions is needed to determine the robustness and generalizability of the observed fruit-level performance. Although the source apparatus used a fixed holder, an acoustically treated chamber, and a servomotor-driven tapper intended to produce consistent impacts, the distributed dataset does not provide numerical tapping-force measurements or fruit-level geometry, mass, shape, and internal composition measurements. These factors can influence the acoustic response, but their individual contributions cannot be separated retrospectively from the available recordings. Future data collection should pair controlled force measurements and external geometry with destructive or imaging-based reference measurements of liquid and solid endosperm so that structure–acoustics relationships and model robustness can be evaluated directly.
4. Conclusions
This study investigated the transferability of frozen embeddings extracted from a pretrained audio foundation model to non-destructive fruit-maturity classification using acoustic recordings generated by tapping coconuts. Candidate tapping-event segments were represented using conventional Mel-spectral representations or frozen CLAP embeddings and classified at the event level. The resulting predictions were subsequently aggregated across tapping events and ridge positions to obtain one maturity decision per fruit.
Among the evaluated configurations, the combination of frozen CLAP embeddings and a downstream regularized MLP produced the highest event- and fruit-level balanced accuracies. For this configuration, the higher fruit-level balanced accuracy observed after majority voting suggests that repeated tapping observations may provide complementary evidence for fruit-level classification. These results suggest that CLAP embeddings, although learned from heterogeneous general-audio data, preserve acoustic information that can be transferred to short impulsive signals from a substantially different application domain.
The limited size and marked class imbalance of the available dataset, particularly the small number of immature fruits, constrain the generalizability and precision of the reported estimates. Further studies should therefore evaluate the approach using larger and more balanced datasets encompassing additional coconut varieties and independent acquisition conditions, and compare alternative strategies for adapting short tapping-event segments to the CLAP input duration, including longer excerpts that preserve their natural acoustic context. Overall, the findings support continued investigation of audio foundation models as transferable representations for non-destructive acoustic assessment of agricultural products.
Because the CLAP encoder is substantially larger and more computationally demanding than the Mel-spectral alternatives, embedded deployment would require model compression or off-device computation; future work should also record fruit geometry, mass, tapping force, and internal composition.