


Abstract
Heat stress poses a challenge to dairy production under increasing climate variability, highlighting the need for long-term assessments of thermal risk. This study assessed heat stress risk across major dairy-producing regions of Minas Gerais, Brazil, using ERA5-Land reanalysis data and the Temperature–Humidity Index (THI). Daily air temperature and dew point temperature data from 2004 to 2024 were used to calculate THI. ERA5-Land-derived THI was validated against observations from 63 INMET automatic weather stations using the modified Kling–Gupta Efficiency (KGE′). At the regional scale, heat stress risk was characterized based on the frequency, spatial distribution, seasonality, and temporal trends of THI-defined climatic heat-stress categories. Temporal trends were assessed using Pearson’s correlation between year and annual frequency for each THI category, with significance evaluated using a t-test at the 5% significance level. KGE′ values were predominantly between 0.80 and 0.90, indicating high agreement between observed and ERA5-Land-derived data. Heat stress conditions (THI ≥ 68) accounted for 69.72% of the observations, with the highest seasonal frequencies occurring in summer (24.23%) and spring (22.25%). Temporal analysis indicated an average increase of 2.23 days year−1 in heat-stress conditions, mainly due to moderate heat stress, while thermoneutral days showed predominantly decreasing trends. These findings demonstrate that integrating climate reanalysis data with bioclimatic indicators provides a robust framework for assessing heat stress risk and supporting regional planning of livestock facilities, cooling strategies, and climate change adaptation.
1. Introduction
Milk production is one of the most important agricultural activities for global food security, providing foods of high nutritional value while supporting the economic sustainability of millions of rural producers [1,2]. At the same time, increasing climate variability has intensified the challenges of maintaining productive efficiency, animal welfare, and the sustainability of dairy production systems, highlighting the need for strategies that strengthen their capacity to adapt to climate change [3,4].
Brazil is one of the world’s leading milk producers, encompassing a wide range of dairy production systems distributed across contrasting climatic conditions [5,6,7]. In this context, Minas Gerais remains the country’s leading milk-producing state, concentrating major dairy-producing regions and a substantial share of the national milk production [7,8,9]. Beyond its production relevance, the state’s climatic diversity makes it particularly suitable for studies aimed at characterizing the thermal environment and assessing heat stress risk in intensive dairy production systems [10,11].
Heat stress is one of the main factors limiting productive efficiency and animal welfare in dairy production systems, particularly in tropical and subtropical regions characterized by high air temperature and relative humidity [12,13,14]. High-producing dairy cows are especially susceptible to these conditions because of their high metabolic heat production and limited capacity for heat dissipation, both associated with the substantial genetic progress achieved in dairy production [15,16,17]. In Brazilian dairy systems, Holstein, Jersey, and Holstein × Gyr genetic groups, including Girolando cattle, are commonly represented, particularly across specialized and confined production systems. These systems encompass taurine, indicine, and composite genetic backgrounds, with herd composition varying among farms and regions [18,19]. Consequently, prolonged exposure to thermally challenging environments compromises physiological responses, productive and reproductive performance, and the economic viability of dairy production systems, with these effects tending to be more pronounced under intensive production systems [20,21].
Climate change has increased the frequency, duration, and severity of extreme heat events, posing growing challenges to dairy production, particularly in tropical and subtropical regions [16,22,23]. Recent projections indicate that these conditions are likely to increase production losses and risks to animal welfare, reinforcing the need for adaptation strategies based on an understanding of regional climate variability [16,24,25]. In this context, assessing the spatial and temporal variability of thermal conditions is important for anticipating periods and regions of greater heat-stress exposure and informing the planning and prioritization of environmental management and adaptation measures [11,26].
Several strategies have been adopted to mitigate the effects of heat stress in dairy production systems, including passive building design solutions and active cooling systems, with the aim of preserving animal welfare and productive efficiency [27,28,29]. However, the effectiveness of these strategies depends directly on the climatic conditions to which animals are exposed, making prior characterization of the thermal environment essential to support their appropriate implementation and maximize their effectiveness [30,31,32].
The intensity of heat stress and the effectiveness of adaptation strategies vary across regions and seasons, reflecting the high variability of environmental thermal and psychrometric conditions [31,32,33,34]. Consequently, mitigation measures may perform differently depending on the climatic conditions under which they are implemented, reinforcing the need to account for environmental variability when planning dairy production systems [35,36]. Therefore, regional and seasonal differences in thermal conditions should be explicitly considered when identifying areas of greater heat-stress risk and defining region-specific environmental management and adaptation strategies [26,37].
The spatiotemporal characterization of heat stress risk depends on climate datasets capable of continuously representing environmental variability at the regional scale. However, the limited spatial coverage of meteorological stations, discontinuous historical records, and the point-based nature of observations constrain long-term analyses and the identification of spatial patterns in the thermal environment [38,39]. In this context, climate reanalysis products have emerged as robust tools by combining meteorological observations with numerical modeling to generate spatially continuous and temporally consistent historical datasets [39,40]. Among these products, ERA5-Land stands out for its high spatial resolution and its widespread application in retrospective bioclimatic assessments, spatiotemporal modeling, and evaluations of climate change impacts on agricultural systems [26,40,41]. Consequently, its use enhances the characterization of the spatiotemporal distribution of the thermal environment and supports regional assessments of heat stress risk in dairy production systems [39,41,42].
Among the bioclimatic indicators used to assess the thermal environment of dairy cattle, the Temperature–Humidity Index (THI) is the most widely adopted tool for characterizing heat stress risk in retrospective studies, climate projections, and bioclimatic zoning [43,44,45]. Despite these advances, existing regional assessments of livestock heat stress have commonly focused on the spatial and temporal characterization of climatic exposure, with limited integration of the spatial distribution of livestock production into the identification of areas of greater production relevance. Consequently, an integrated assessment that links the long-term spatial and temporal variability of heat-stress conditions to the geographic concentration of dairy production remains insufficiently explored in major tropical dairy-producing regions [39,42,43]. In this study, we hypothesized that integrating validated ERA5-Land data with THI and the spatial distribution of dairy production would provide a production-oriented characterization of the spatiotemporal variability of heat-stress risk, enabling the identification of regional and seasonal patterns relevant to dairy production.
In this context, the present study aimed to assess the spatiotemporal distribution of heat stress risk across major dairy-producing regions in the state of Minas Gerais by integrating ERA5-Land reanalysis data, the Temperature–Humidity Index (THI), and spatial information on dairy production. The proposed framework combined climate reanalysis validation, seasonal and spatial characterization of the thermal environment, and analysis of temporal trends in the frequency of THI-based heat-stress categories, providing a basis for identifying production-relevant regions and periods for heat-stress adaptation planning in dairy production systems.
2. Materials and Methods
This study developed an integrated framework for the spatiotemporal assessment of heat stress risk across the major dairy-producing regions of Minas Gerais by combining ERA5-Land climate reanalysis data with meteorological observations from automatic surface weather stations. Considering the heterogeneous spatial distribution of dairy production across the state, the analyses focused on the major dairy-producing regions, where more intensive production systems and, consequently, higher concentrations of dairy herds are found [5,46]. This framework integrated climatic, spatial, and production-related information to characterize the spatial and temporal variability of environmental conditions relevant to intensive dairy production. To achieve this, the methodology was organized into the following steps: identification of the major dairy-producing regions in Minas Gerais (Section 2.1); extraction of climate reanalysis data and calculation of the Temperature–Humidity Index (THI) (Section 2.2); validation of the reanalysis data against meteorological observations (Section 2.3); and processing of the climate database for the spatiotemporal analyses (Section 2.4). The overall methodological workflow is illustrated in Figure 1. The climate data processing stage included procedures to evaluate the spatial reliability of the reanalysis product, characterize the spatiotemporal variability of the thermal environment, and identify temporal trends in heat stress risk.
Figure 1.
Schematic representation of the methodological framework adopted in this study. RH—relative humidity (%); Tdb—dry-bulb air temperature at 2.00 m above ground level (°C); Tdp—dew point temperature at 2.00 m above ground level (°C); THI—Temperature–Humidity Index; IBGE—Brazilian Institute of Geography and Statistics; INMET—Brazilian National Institute of Meteorology.
The datasets used in this study were obtained from different institutional sources and were primarily available in NetCDF (Network Common Data Form), CSV (Comma-Separated Values), and TXT (Plain Text File) formats. All data processing, integration, and management were performed within a unified computational workflow using the R programming language in the RStudio integrated development environment (IDE), version 4.5.1 [47]. The analyses were supported by the abind (version 1.4-8), dplyr (version 1.2.1), ggplot2 (version 4.0.3), ncdf4 (version 1.24), readr (version 2.2.0), sf (version 1.1-3), stringr (version 1.6.0), and terra (version 1.9-50) packages, selected according to the requirements for data manipulation, spatial processing, data organization, and visualization [48,49,50].
2.1. Identification of the Major Dairy-Producing Regions in Minas Gerais
To ensure that the climatic characterization focused on the areas of greatest relevance to contemporary dairy production, municipal milk production data for 2024, corresponding to the most recent official dataset released by the Brazilian Institute of Geography and Statistics (IBGE), were used. Adopting this reference year allowed the analyses to represent the current production profile of dairy farming in the state of Minas Gerais, increasing the relevance of the results to present-day production conditions and their potential to support the planning of future heat stress adaptation strategies. Annual milk production data were obtained in CSV format from the SIDRA (IBGE Automatic Retrieval System) platform [51]. These production data do not include information on cattle breed or herd genetic composition and therefore do not allow the spatial characterization of breed distribution across the dairy-producing regions analyzed. The Intermediate Geographic Regions defined by the IBGE were adopted as the territorial unit of analysis [52], as they constitute official territorial divisions that reflect the functional relationships among municipalities and adequately represent the spatial distribution of dairy production. Accordingly, Minas Gerais was subdivided into its Intermediate Geographic Regions, and the subsequent analyses were conducted for the regions of Varginha, Belo Horizonte, Barbacena, Divinópolis, Governador Valadares, Ipatinga, Juiz de Fora, Montes Claros, Passos, Patos de Minas, Pouso Alegre, Teófilo Otoni, Uberaba, and Uberlândia. Based on this territorial framework, the criteria for identifying the state’s major dairy-producing regions were established.
The identification of the major dairy-producing regions was based on quantitative and spatially consistent criteria to minimize the influence of absolute differences in municipal milk production and enable relative comparisons among regions with distinct territorial and production characteristics. To this end, a statistical approach based on the distribution of annual municipal milk production was adopted, following criteria previously applied in studies on the spatial characterization of agricultural production systems and consistent with the identification of territorial patterns of production concentration [53,54]. Initially, municipalities were classified according to the 75th (P75) and 90th (P90) percentiles of the statewide milk production distribution. Percentile/quantile approaches are established statistical tools for relative characterization and benchmarking in livestock populations [55,56,57]. In this study, P75 and P90 were deliberately used as complementary levels of relative production concentration, with P75 representing the upper quartile of the statewide production distribution and P90 representing the upper decile, thereby providing broader and more selective levels of production concentration, respectively. This combination allowed different levels of production concentration to be considered while maintaining a relative classification independent of absolute production scales. Subsequently, the representativeness of the Intermediate Geographic Regions was evaluated using three complementary indicators: R75, defined as the ratio between the number of municipalities above the P75 percentile and the total number of municipalities in the region; R90, defined as the ratio between the number of municipalities above the P90 percentile and the total number of municipalities in the region; and RReg, corresponding to the relative contribution of each region to the state’s total annual milk production. Together, these indicators integrated information on spatial concentration, relative production intensity, and territorial representativeness. To define the major dairy-producing regions, the Intermediate Geographic Regions were ranked separately according to R75, R90, and RReg, with rank 1 assigned to the highest value for each indicator. A combined rank was then calculated as the sum of the three individual ranks, and the five regions with the lowest combined ranks were selected as the major dairy-producing regions for the subsequent climatic analyses.
2.2. Extraction of Climate Reanalysis Data and Calculation of the Temperature–Humidity Index (THI)
To provide a continuous and spatially consistent representation of the climatic variability across the major dairy-producing regions of Minas Gerais, climate reanalysis data from the ERA5-Land dataset were used [58]. Developed by the European Center for Medium-Range Weather Forecasts (ECMWF), ERA5-Land combines meteorological observations with numerical modeling to generate physically coherent and spatially continuous historical datasets, making it one of the most widely used resources for retrospective climate characterization and environmental modeling studies [58]. In addition to its high temporal consistency, ERA5-Land provides meteorological variables in NetCDF format on a regular 0.10° × 0.10° spatial grid, a feature that facilitates regional spatiotemporal analyses and integration with geospatial processing workflows [59].
The selected meteorological variables were 2.00 m dry-bulb air temperature (Tdb, °C) and 2.00 m dew point temperature (Tdp, °C), extracted for the entire state of Minas Gerais from January 2004 to December 2024, comprising a 21-year dataset. This time span provided a sufficiently long historical record to capture interannual climate variability and investigate spatiotemporal patterns associated with heat stress risk in intensive dairy production systems.
Following the extraction of hourly data from the NetCDF files, an initial quality control procedure was performed to identify and remove inconsistencies. Daily mean Tdb and Tdp values were then calculated because the analytical unit of the study was the day, providing a standardized representation of thermal exposure across grid cells and throughout the 2004–2024 period. This daily aggregation was adopted to characterize regional patterns, seasonality, and long-term temporal trends, while recognizing that it does not capture short-term intraday thermal peaks. All derived variables were subsequently calculated from these daily mean values, ensuring temporal consistency among the parameters used throughout the climate data processing workflow. Relative humidity (RH, %) was then calculated from these processed variables, followed by the calculation of the Temperature–Humidity Index (THI). Because RH is a nonlinear function of Tdb and Tdp, calculating RH from daily mean Tdb and Tdp is not mathematically equivalent to averaging hourly RH values. In this study, RH was treated as a derived variable at the daily scale, calculated from the daily mean Tdb and Tdp, consistent with the daily analytical unit adopted throughout the study.
Because the ERA5-Land dataset included only Tdb and Tdp, RH, required for calculating the THI, was first estimated. RH was calculated from the ratio between actual vapor pressure and saturation vapor pressure, both derived using the Tetens equation, which is widely applied in meteorological and agrometeorological studies because of its high accuracy over the temperature range commonly observed under natural environmental conditions [60,61]. Saturation vapor pressure (es) and actual vapor pressure (ea) were initially calculated using Equations (2) and (3), respectively. Relative humidity was then determined as the ratio between these variables, as described in Equation (1). Finally, THI was calculated using the formulation proposed by Yousef [62] and later adopted by Mader et al. [63] (Equation (4)). This formulation is widely recognized as one of the principal bioclimatic indices for assessing heat stress in dairy cattle and has been extensively applied in retrospective climate variability and bioclimatic zoning studies [11,26,39,40].
where RH is the relative humidity (%); Tdb is the dry-bulb air temperature at 2.00 m (°C); Tdp is the dew point temperature at 2.00 m (°C); ea is the actual vapor pressure (hPa); and es is the saturation vapor pressure (hPa).
Although THI has traditionally been interpreted using threshold values originally proposed for dairy cattle, recent evidence indicates that these thresholds may underestimate heat stress risk in modern high-producing dairy herds, whose greater metabolic heat production and genetic improvement have increased their susceptibility to thermal environmental conditions. Therefore, to provide a more realistic representation of the conditions currently experienced by intensive dairy production systems, the THI classification thresholds currently recommended for modern high-producing dairy cows were adopted, as proposed by Collier et al. [64] and subsequently supported by studies involving herds with high genetic merit [44,45,65,66,67,68]. Recent evidence also indicates that the thermal thresholds associated with physiological responses may vary according to the physiological status of the animals, including differences between lactating and dry cows [69].
Daily mean THI values calculated for each grid cell were classified into four heat-stress categories: no heat stress (THI < 68), corresponding to thermoneutral conditions; mild heat stress (68 ≤ THI < 72), characterized by the onset of physiological and behavioral thermoregulatory responses; moderate heat stress (72 ≤ THI < 78), associated with reduced productive and reproductive performance; and severe heat stress (THI ≥ 78), characterized by pronounced thermal load, physiological impairment, and an increased risk to animal welfare [64,70]. The same thresholds were applied across all grid cells and years to ensure a consistent and directly comparable classification of climatic heat-stress exposure across regions and over time. This classification was applied throughout all subsequent analyses to quantify the frequency, spatial distribution, seasonality, and temporal evolution of the different heat-stress categories across the major dairy-producing regions of Minas Gerais.
2.3. Validation of Climate Reanalysis Data Using Meteorological Observations
Although climate reanalysis products such as ERA5-Land are widely used in climate studies because of their high temporal consistency and continuous spatial coverage, their application to studies characterizing the thermal environment of livestock production systems requires prior evaluation of their ability to accurately represent the observed meteorological conditions within the study area [26,41,58]. Therefore, before conducting the THI spatiotemporal analyses, the ability of ERA5-Land to represent the thermal conditions expressed by the Temperature–Humidity Index (THI) was evaluated against observations from the automatic weather station network operated by the Brazilian National Institute of Meteorology (INMET), the country’s official meteorological monitoring network [71]. Hourly Tdb and Tdp data were obtained from the 63 automatic weather stations operating in the state of Minas Gerais during the study period. The spatial distribution of these stations, together with their identification, geographic coordinates, and operational start dates, is listed in Table 1 and served as the observational reference for validating the climate reanalysis dataset.
Table 1.
Characteristics of the automatic weather stations operated by the Brazilian National Institute of Meteorology (INMET) used to validate the ERA5-Land climate reanalysis data, including station code, municipality, geographic coordinates, and operational start date.
To ensure the comparability of the observational and reanalysis datasets, the hourly Tdb and Tdp series obtained from the INMET automatic weather stations were subjected to the same processing workflow applied to the ERA5-Land data. First, a quality control procedure was performed to identify and remove inconsistent or incomplete records. Daily mean Tdb and Tdp values were then calculated, followed by the calculation of RH and THI using the same equations described in Section 2.2. This procedure ensured that differences observed between the two datasets were attributable to the reanalysis product rather than to differences in data processing.
Subsequently, for each meteorological station, the ERA5-Land time series corresponding to the nearest grid cell was extracted based on the station’s geographic coordinates while preserving the original spatial resolution of the reanalysis product [58]. This procedure enabled a direct comparison between the daily THI values calculated from the meteorological observations and those derived from ERA5-Land at each monitoring location. The paired time series constituted the basis for the quantitative evaluation of the reanalysis product performance. Because THI was the integrated bioclimatic variable used in the subsequent analyses, the validation focused on the agreement between the observed and ERA5-Land-derived THI series.
The agreement between the daily THI values derived from the meteorological observations and those estimated by ERA5-Land was evaluated using the modified Kling–Gupta Efficiency (KGE′), a performance metric widely applied in environmental model evaluation because it jointly accounts for correlation, bias, and relative variability [72]. KGE′ was selected as the primary validation metric because the purpose of this step was to assess the overall suitability of ERA5-Land for representing the thermal conditions used in the subsequent spatiotemporal analyses, rather than to provide a detailed decomposition of individual error sources. The KGE′ formulation explicitly incorporates the Pearson correlation coefficient (r), the bias ratio (β), and the variability ratio (γ), thereby providing an integrated assessment of agreement between the observed and estimated THI series [72]. Accordingly, KGE′ was calculated for each of the 63 automatic weather stations using the daily THI time series covering the study period. Equations (5) to (8) describe, respectively, r, β, γ, and the KGE′.
where is the Pearson correlation coefficient between the observed and estimated time series; is the ratio between the mean of the estimated series and the mean of the observed series; is the ratio between the coefficients of variation in the estimated and observed series; P represents the values estimated by ERA5-Land; represents the observed values; and denote the means of the estimated and observed series, respectively; and are the coefficients of variation in the estimated and observed series, respectively; and is the number of observations.
The theoretical values of KGE′ range from −∞ to 1.00, with a value of 1.00 indicating perfect agreement between the observed and estimated time series. Values closer to 1.00 indicate a greater ability of the reanalysis product to simultaneously reproduce the temporal correlation, mean magnitude, and variability of the observed data, whereas progressively lower values indicate reduced performance in one or more of these components [73]. Because the objective of this step was to evaluate the suitability of ERA5-Land for representing the thermal environment across the major dairy-producing regions of Minas Gerais, the KGE′ values obtained for each automatic weather station were used to assess the reliability of the climate reanalysis dataset employed in the subsequent spatiotemporal analyses.
2.4. Climate Data Processing for Spatiotemporal Analyses
Following the validation of the climate reanalysis data against the meteorological observations (Section 2.3), the validated ERA5-Land dataset was processed to support the spatiotemporal analyses of heat stress risk across the major dairy-producing regions of Minas Gerais. Spatial data processing, time-series analysis, and statistical methods were applied to characterize the spatial, seasonal, and temporal variability of THI using the validated climate reanalysis dataset [58,73]. The spatial distribution of the reanalysis product reliability was first evaluated based on the KGE′ values. The validated climate dataset was then used to characterize the spatiotemporal variability of the thermal environment and heat stress risk.
The KGE′ values obtained for the 63 automatic weather stations were used to characterize the spatial distribution of the ERA5-Land reliability across the state of Minas Gerais. For this purpose, the KGE′ values calculated at each monitoring location were interpolated using the Inverse Distance Weighting (IDW) method, which is widely applied to the spatial interpolation of irregularly distributed environmental variables because of its simplicity, numerical stability, and ability to preserve the local influence of observations [74,75,76]. The interpolation was performed using a power parameter of 2.00 and a spatial resolution of 3.00 km, selected to generate a continuous reliability surface compatible with the regional scale of the analyses. Given the irregular spatial distribution of the 63 monitoring stations, IDW was adopted to preserve the local influence of nearby observations without requiring specification of a spatial covariance model. Alternative interpolation approaches, such as ordinary kriging, could yield different spatial representations. However, they were not formally compared because the interpolated KGE′ surface was intended as a complementary descriptive representation of station-based validation results rather than as an independently optimized predictive product. The resulting surface was used to visualize the spatial variability of the station-based KGE′ values and to provide a continuous descriptive representation of reanalysis reliability across the state.
Using the validated climate dataset, the spatiotemporal characterization of the thermal environment was performed for the five major dairy-producing regions identified in Section 2.1. For each region, daily mean THI values were extracted for all ERA5-Land grid cells located within the respective regional boundaries while preserving the original spatial resolution of the dataset. This approach simultaneously accounted for the spatial variability within each region and the temporal variability throughout the historical record, providing the basis for the analyses of interannual variability, seasonality, spatial distribution, and temporal trends in heat stress risk presented in the Results section [58].
To characterize the interannual variability of the thermal environment across the major dairy-producing regions, daily mean THI values were organized into time series covering the entire study period (2004–2024). For each day in the historical record, the regional mean THI and the corresponding spatial standard deviation were calculated using all ERA5-Land grid cells within the respective region. This approach enabled the simultaneous assessment of temporal changes in mean thermal conditions and the spatial heterogeneity of the thermal environment within each region, providing an integrated representation of its spatiotemporal variability over the 21-year study period [58,77].
To investigate temporal trends in heat stress risk across the major dairy-producing regions, the annual number of days within each THI category (THI < 68; 68 ≤ THI < 72; 72 ≤ THI < 78; THI ≥ 78) was evaluated for each ERA5-Land grid cell over the 21-year study period, generating annual time series consisting of 21 observations for each category [58,78]. The direction and strength of the linear temporal relationship were evaluated using the Pearson correlation coefficient (), with year as the independent variable and the annual number of days within the corresponding THI category as the dependent variable [78,79]. Statistical significance was assessed using the t-test at a 5% significance level. For a complementary quantitative interpretation, the linear trend slope was estimated for each grid cell and THI category from the annual number of days as a function of year and expressed as days year−1. For each THI category, the mean slope across the ERA5-Land grid cells was then calculated to quantify the average annual change in category frequency over the 2004–2024 period, complementing the spatial assessment based on Pearson’s correlation coefficient. This approach enabled the identification of areas exhibiting statistically significant increasing or decreasing trends in the annual frequency of each heat stress category, providing a spatial representation of changes in climatic risk throughout the historical period analyzed [78,79,80]. The resulting datasets provided the analytical basis for the subsequent spatiotemporal analyses.
3. Results and Discussion
3.1. Major Dairy-Producing Regions in Minas Gerais
Figure 2 illustrated the spatial distribution of municipalities classified above the P75 and P90 milk production percentiles in Minas Gerais. While municipalities above P75 were distributed across all Intermediate Geographic Regions, the P90 threshold revealed a more concentrated pattern, particularly in Patos de Minas, Uberaba, and Uberlândia (Figure 2). The spatial concentration of high-producing municipalities provided the basis for the subsequent quantitative assessment of regional representativeness using the indicators listed in Table 2.
Figure 2.
Spatial distribution of municipalities in the state of Minas Gerais classified above the municipal milk production percentiles used to delineate the state’s major dairy-producing regions, based on SIDRA/IBGE data for 2024: (a) municipalities with annual milk production ≥ P75; and (b) municipalities with annual milk production ≥ P90. The P75 and P90 percentiles were calculated from the statewide distribution of annual municipal milk production in Minas Gerais. The outer boundary represents the state boundary, whereas the red lines delimit the Intermediate Geographic Regions. The numbered labels identify the Intermediate Geographic Regions as follows: 1—Patos de Minas; 2—Uberlândia; 3—Uberaba; 4—Divinópolis; 5—Varginha; 6— Pouso Alegre; 7—Barbacena; 8—Juiz de Fora; 9—Belo Horizonte; 10—Ipatinga; 11—Teófilo Otoni; 12—Montes Claros; 13—Governador Valadares.
Table 2.
Quantitative indicators used to identify the major dairy-producing regions among the Intermediate Geographic Regions of Minas Gerais, based on municipal milk production data for 2024.
The quantitative assessment in Table 2 confirmed the regional representativeness indicated by Figure 2. Patos de Minas exhibited the highest values for all three indicators (R75 = 67.65%, R90 = 55.88%, and RReg = 18.41%), combining the highest concentration of high-producing municipalities with the largest contribution to statewide milk production. Divinópolis (R75 = 57.38%, R90 = 29.51%, and RReg = 13.40%) and Varginha (R75 = 35.37%, R90 = 14.63%, and RReg = 12.64%) also showed substantial regional representation. Uberaba and Uberlândia were distinguished by high R75 and R90 values (48.28% and 34.48%, and 50.00% and 33.33%, respectively), indicating a high concentration of municipalities above the upper statewide production percentiles. Based on the combined ranking of R75, R90, and RReg, these five regions achieved the lowest combined ranks and were therefore selected for the subsequent climatic analyses.
Overall, the combined use of R75, R90, and RReg provided an objective basis for identifying the major dairy-producing regions by integrating the concentration of high-producing municipalities with their contribution to statewide milk production. This criterion ensured that regional selection reflected both production concentration and regional representativeness rather than absolute production alone.
3.2. ERA5-Land Performance Based on THI Validation
Before characterizing the spatiotemporal variability of the thermal environment across the major dairy-producing regions identified in the previous section, it was necessary to evaluate the ability of ERA5-Land to reproduce the observed thermal conditions expressed by THI in the state of Minas Gerais, thereby ensuring the reliability of the climatic dataset used in the subsequent spatiotemporal analyses. To this end, Figure 3 shows the spatial distribution of the modified Kling–Gupta Efficiency (KGE′), obtained by comparing THI values derived from the climate reanalysis data with those calculated from observations recorded at 63 automatic weather stations operated by the Brazilian National Institute of Meteorology (INMET). The spatial surface was generated using Inverse Distance Weighting (IDW) interpolation, enabling the assessment of the spatial variability in reanalysis performance and its ability to consistently reproduce the observed THI-based thermal conditions across the state, following a procedure widely applied for the spatial interpolation of irregularly distributed environmental variables [74,81].
Figure 3.
Spatial distribution of modified Kling–Gupta Efficiency (KGE′) values obtained from the validation of THI calculated using ERA5-Land reanalysis data against observations from 63 automatic weather stations operated by the Brazilian National Institute of Meteorology (INMET). The continuous surface was generated using Inverse Distance Weighting (IDW) interpolation to provide a descriptive representation of the spatial variability of station-based KGE′ values across the state of Minas Gerais. Red points indicate the locations of the 63 automatic weather stations used for validation. The numbered labels identify the Intermediate Geographic Regions as follows: 1—Patos de Minas; 2—Uberlândia; 3—Uberaba; 4—Divinópolis; 5—Varginha; 6—Pouso Alegre; 7—Barbacena; 8—Juiz de Fora; 9—Belo Horizonte; 10—Ipatinga; 11—Teófilo Otoni; 12—Montes Claros; 13—Governador Valadares.
The spatial distribution of KGE′ values (Figure 3) demonstrated consistently high agreement between the THI series derived from ERA5-Land and those calculated from INMET observations across Minas Gerais, with no locations presenting KGE′ values below 0.50. This pattern indicates that the reanalysis product adequately reproduced the integrated thermal conditions represented by THI throughout the study area. Although minor spatial variations in KGE′ were identified, they did not indicate areas of low reliability for the subsequent THI-based analyses. These findings support the use of ERA5-Land for the spatiotemporal characterization of heat stress risk across the major dairy-producing regions of Minas Gerais [58,72,73].
The quantitative analysis of the KGE′ coefficients confirmed the high agreement between ERA5-Land-derived and observation-derived THI across Minas Gerais (Figure 3). Among the 63 automatic weather stations evaluated, 55 exhibited KGE′ values ranging from 0.80 to 0.90, whereas the remaining stations all presented values above 0.50. No cases of unsatisfactory agreement or perfect agreement (KGE′ = 1.00) were identified. This distribution indicates that the reanalysis product consistently reproduced the temporal variability, mean magnitude, and dispersion of the observed THI values, which constitute the three components of the modified Kling–Gupta Efficiency metric. By simultaneously integrating correlation, bias, and variability, KGE′ provides an integrated assessment of agreement between the observed and estimated THI series [72,73,77]. Accordingly, the predominance of high KGE′ values supports the use of ERA5-Land for the subsequent THI-based spatiotemporal characterization of heat stress risk.
The performance observed in this study is consistent with recent evidence identifying ERA5-Land as a reliable source of meteorological data for agro-environmental and bioclimatic applications [38,40]. Its high temporal consistency and continuous spatial coverage enable a robust representation of climatic variability in long-term retrospective analyses while reducing limitations associated with the spatial distribution and availability of observational records [39,77]. Consequently, ERA5-Land has been widely applied to the estimation of bioclimatic indices, the characterization of thermal environments, and the assessment of climate change impacts on livestock production systems [26,41,58]. Therefore, the results obtained in this study further support its suitability as the climatic basis for the spatiotemporal assessment of heat stress risk across the major dairy-producing regions of Minas Gerais, providing methodological support for the analyses presented in the following subsection.
3.3. Spatiotemporal Characterization of the Thermal Environment Across the Major Dairy-Producing Regions
Following the identification of the major dairy-producing regions of Minas Gerais (Section 3.1) and the validation of ERA5-Land performance in reproducing the observed meteorological conditions (Section 3.2), the spatiotemporal characterization of the thermal environment was conducted for the five selected regions: Patos de Minas, Divinópolis, Varginha, Uberaba, and Uberlândia. The analyses encompassed the interannual variability of the Temperature–Humidity Index (THI), its spatial and seasonal distribution, and the temporal evolution of the different heat-stress categories to identify climatic patterns relevant to intensive dairy production.
3.3.1. Interannual and Spatial Variability of the Temperature–Humidity Index (THI)
The interannual variability of THI exhibited a persistent cyclical pattern throughout the 2004–2024 period, characterized by the recurrent occurrence of annual maxima and minima associated with the climatic seasonality of the study area (Figure 4). Despite the fluctuations observed between consecutive years, no structural changes were identified in the temporal THI pattern, indicating that the thermal regime remained consistent throughout the historical record. At the same time, changes in the spatial standard deviation indicate that this temporal regularity was accompanied by variations in the spatial heterogeneity of the thermal environment, demonstrating that the magnitude of climatic differences among the analyzed regions also changed over time. Collectively, these findings indicate that the characterization of heat stress risk should simultaneously account for the recurrence of seasonal climatic cycles and the spatial variability of environmental conditions, providing the basis for the regional analyses presented in the following sections.
Figure 4.
Interannual variability of the Temperature–Humidity Index (THI) across the state of Minas Gerais from 2004 to 2024, based on ERA5-Land data: (a) daily mean THI and (b) spatial standard deviation (SD) of daily mean THI across the ERA5-Land grid cells within the study area, calculated separately for each day to represent the spatial heterogeneity of thermal conditions throughout the historical period.
The recurrence of the annual cycles shown in Figure 4 indicates that the temporal variability of THI was predominantly governed by the climatic seasonality characteristic of the state of Minas Gerais, reflecting the combined influence of dry-bulb air temperature (Tdb) and relative humidity (RH) in response to the annual cycles of energy availability and precipitation [39,68]. Although the amplitude of these oscillations varied between consecutive years, the persistence of a consistent temporal pattern throughout the 21-year study period indicates the absence of abrupt changes in the regional thermal regime. At the same time, variations in the spatial standard deviation demonstrate that the intensity of thermal heterogeneity among different areas of the state did not remain constant throughout the historical record, reaching approximately 5.00–6.00 THI units during the dry season, when climatic differentiation among the analyzed regions was most pronounced. This behavior indicates that the spatial variability of the thermal environment also responds to interannual climatic fluctuations [39]. Collectively, these findings further support the suitability of the ERA5-Land historical dataset for representing long-term climatic variability and provide a robust basis for the regional heat stress risk analyses presented in the following subsections [26,40,41].
The combined interpretation of the patterns shown in Figure 4 reveals a contrasting relationship between THI magnitude and its spatial variability. During periods when mean THI reached its annual maxima, the spatial standard deviation tended to decrease, indicating greater homogeneity of thermal conditions among the regions evaluated. In contrast, periods characterized by lower THI values exhibited greater spatial heterogeneity, reflecting the stronger influence of local geographic factors, such as altitude, topography, and regional climatic characteristics, on the distribution of the thermal environment [11,16,39]. These findings indicate that heat stress intensity varies not only over time but also in its spatial distribution, reinforcing the need for region-specific approaches to climate risk assessment in intensive dairy production systems.
Overall, the thermal environment across the major dairy-producing regions of Minas Gerais is shaped by the interaction between recurrent temporal patterns and persistent spatial variability, demonstrating that heat stress intensity cannot be adequately characterized using mean THI values alone. These findings reinforce the need to simultaneously incorporate both temporal and spatial dimensions into climate risk assessments, providing a more comprehensive representation of the thermal environment experienced by intensive dairy production systems.
3.3.2. Seasonal Patterns and Spatial Distribution of Heat Stress Conditions
Although the interannual analysis demonstrated the recurrence of thermal cycles throughout the 21-year study period, a comprehensive characterization of heat stress risk also requires evaluating the seasonal distribution of THI, as the frequency of occurrence of its different categories determines the duration of animal exposure to potentially stressful environmental conditions. Accordingly, the frequency distributions illustrated in Figure 5 and Figure 6 provide the basis for identifying the periods of the year during which heat stress is most likely to occur, thereby supporting the timing and prioritization of region-specific environmental management and mitigation strategies [63,64,68].
Figure 5.
Frequency distribution of daily mean Temperature–Humidity Index (THI) values derived from ERA5-Land data for the five major dairy-producing regions of Minas Gerais during the 2004–2024 period. Frequencies were calculated from all daily mean THI observations across the ERA5-Land grid cells located within the Intermediate Geographic Regions of Patos de Minas, Divinópolis, Uberaba, Uberlândia, and Varginha during the 2004–2024 period, with 100% representing the total number of observations in the complete historical record. The bar colors represent the THI classification categories, while the red dashed line indicates the fitted distribution curve.
Figure 6.
Seasonal frequency distribution of daily mean Temperature–Humidity Index (THI) values derived from ERA5-Land data for the five major dairy-producing regions of Minas Gerais during the 2004–2024 period, using the same denominator for all seasonal panels, with 100% representing the total number of daily mean THI observations across all four seasons and all ERA5-Land grid cells within the five regions: (a) summer (December–February), (b) autumn (March–May), (c) winter (June–August), and (d) spring (September–November). The bar colors represent the THI classification categories, while the red dashed line indicates the fitted distribution curve.
The frequency distribution illustrated in Figure 5 indicates that heat stress conditions constitute a recurrent component of the thermal environment across the major dairy-producing regions of Minas Gerais. Although daily THI values ranged from approximately 52 to 81, 69.72% of all observations exceeded the threshold of 68, which was adopted as the onset of heat stress for high-producing dairy cows [64,70]. Among all observations, approximately 38.32% fell within the mild heat stress category (68 ≤ THI < 72), 30.96% within the moderate heat stress (72 ≤ THI < 78), and 0.44% within the severe heat stress category (THI ≥ 78) [64,70]. Thus, the three heat-stress categories collectively accounted for 69.72% of the observations. Furthermore, the approximately unimodal distribution with limited skewness observed in Figure 5 indicates that heat stress conditions were not associated exclusively with isolated extreme events but represented a persistent climatic pattern across the major dairy-producing regions evaluated, reinforcing the need to incorporate heat-mitigation measures into routine livestock environmental management rather than treating them solely as responses to episodic extreme events.
The seasonal frequency distribution demonstrates that heat stress risk is strongly influenced by seasonal climatic conditions (Figure 6). The highest frequencies of THI ≥ 68 occurred during spring (22.25%) and summer (24.23%), accounting for approximately 46.48% of the entire historical record, whereas the corresponding frequencies were 13.89% in autumn and 9.35% in winter (Figure 6). Although all seasons included THI values associated with heat stress, occurrences of THI ≥ 78 were concentrated in spring and summer (Figure 6), indicating a greater likelihood of critical thermal conditions for high-producing dairy cows during the warmest months of the year. These findings demonstrate that seasonality influences not only the frequency but also the severity of heat stress, providing a temporal basis for prioritizing cooling interventions and adjusting heat-mitigation management during the periods of greatest thermal risk.
Across the analyzed regions and seasons, mean THI values generally ranged from below 68.00 to approximately 77.00 (Figure 7). The highest values, locally approaching 77.00, consistently occurred in Patos de Minas, Uberaba, and Uberlândia, particularly during the warmer seasons, whereas Varginha exhibited the mildest thermal conditions, with THI values below 68.00 especially during autumn and winter. This pattern is consistent with the altitudinal and climatic gradients across the state, whereby regions at lower elevations and with higher mean air temperatures tend to experience greater thermal loads, whereas higher-elevation areas provide more favorable thermal conditions for dairy cattle [82,83]. The persistence of this spatial pattern indicates that certain major dairy-producing regions remain systematically more susceptible to heat stress, reinforcing the need for region-specific environmental management, including the prioritization of cooling systems and other mitigation measures in intensive production systems located in areas of greatest climatic risk.
Figure 7.
Spatial distribution of seasonal mean of Temperature–Humidity Index (THIMean) values and their corresponding spatial standard deviation (THISD), derived from ERA5-Land data for the five major dairy-producing regions of Minas Gerais during the 2004–2024 period: average THI in (a) summer, (b) autumn, (c) winter and (d) spring; and standard deviation of THI in (e) summer, (f) autumn, (g) winter and (h) spring. The numbered labels identify the Intermediate Geographic Regions as follows: 1—Patos de Minas; 2—Uberlândia; 3—Uberaba; 4—Divinópolis; 5—Varginha.
Collectively, the results presented in Figure 7 indicate that the spatial pattern of THI remained highly consistent across seasons, demonstrating that the regions with greater climatic heat-stress exposure changed little throughout the historical period [83]. These findings further reinforce that livestock environmental management and thermal mitigation strategies should simultaneously account for both geographic location and climatic seasonality, thereby supporting the prioritization of livestock facilities, cooling systems, and other climate adaptation measures according to the prevailing thermal risk [35,68]. Building upon this spatiotemporal characterization, the following subsection examines the spatial distribution of the different heat-stress categories across the major dairy-producing regions of Minas Gerais.
3.3.3. Frequency and Spatiotemporal Trends of Heat-Stress Categories
Although the analysis of seasonal mean THI values identified the periods and regions with greater climatic heat-stress exposure, it does not fully capture the annual frequency of occurrence of the different heat-stress categories. To address this, Figure 8 presents the interannual distribution of the number of days associated with each heat stress category across the major dairy-producing regions of Minas Gerais over the 2004–2024 period, enabling the assessment of their temporal persistence and interannual variability.
Figure 8.
Interannual distribution of the annual number of days within each heat stress category, defined from daily mean Temperature–Humidity Index (THI) values, for the five major dairy-producing regions of Minas Gerais during the 2004–2024 period: (a) THI ≥ 68, (b) 68 ≤ THI < 72, (c) 72 ≤ THI < 78, and (d) THI ≥ 78. For each ERA5-Land grid cell, the annual series comprised 21 observations corresponding to 2004–2024. Boxes represent the interquartile range (Q1–Q3), the central line indicates the median, whiskers represent data dispersion, and points denote outliers. The red dashed line indicates the annual mean number of days for each heat stress category.
The interannual distribution of the number of days with THI ≥ 68 (Figure 8a) indicates that heat-stress conditions occurred frequently throughout the 2004–2024 period. On average, 254.48 (~255) days, corresponding to approximately 69.72% of the observations, were classified as heat-stress conditions. The spatial patterns observed in Figure 7 indicate that the warmer major dairy-producing regions, particularly Patos de Minas, Uberaba, and Uberlândia, consistently exhibited higher mean THI values, whereas Varginha showed comparatively milder thermal conditions. This spatial contrast is also reflected in the availability of thermoneutral conditions, as warmer regions provide a narrower climatic window with THI < 68. These patterns indicate persistent regional differences in climatic heat-stress exposure [82,83] and provide the basis for interpreting the frequency of the different heat-stress categories shown in Figure 8 [45,70].
Following the decline in the frequency of thermoneutral days, the THI category 68 ≤ THI < 72 (Figure 8b) represents the transition from thermoneutral conditions to the onset of heat stress. Overall, this category occurred frequently across all regions evaluated, accounting for approximately 38.32% of all observations, corresponding to 139.88 (~140) days per year. These conditions are capable of eliciting the initial physiological and behavioral thermoregulatory responses of high-producing dairy cows [84,85]. Although this category represents a lower level of heat stress than the subsequent categories, its high frequency increases the annual occurrence of potentially limiting thermal conditions, particularly in intensive production systems, where even modest increases in thermal load may impair feed intake, milk production, and physiological efficiency [68,86,87]. These findings reinforce that climate risk assessments should not be limited to severe heat stress conditions alone but should also account for the persistence of mild heat stress, whose recurrent occurrence may represent a significant source of thermal challenge for modern dairy herds [44,70].
Days classified within the 72 ≤ THI < 78 category showed a comparatively broad distribution of annual frequencies across the study period (Figure 8c), indicating substantial interannual variability in the number of days falling within this moderate heat-stress range. Overall, this category accounted for approximately 30.96% of all observations, corresponding to 113.02 (~113) days per year on average. The recurrent occurrence of this category throughout the 2004–2024 period indicates that moderate heat-stress conditions constituted a substantial component of the annual thermal exposure across the major dairy-producing regions. Given the greater thermal challenge associated with this category, which has been linked to adverse effects on the productive and reproductive performance of high-producing dairy cows [64,68,84], its recurrent occurrence represents an important component of regional climatic heat-stress risk.
In contrast to the preceding categories, days classified as THI ≥ 78 (Figure 8d) occurred at a markedly lower annual frequency and showed greater interannual variability, with several years presenting isolated higher values. Across the study period, this category accounted for approximately 0.44% of all observations, corresponding to 1.62 (~2) days per year on average. Although less frequent, these events represent the highest level of bioclimatic risk considered in this study for high-producing dairy cows and may therefore warrant particular attention in regional heat-stress adaptation planning [11,88].
The temporal trends provide an additional quantitative perspective on these changes. Across the study period, the annual number of heat-stress days (THI ≥ 68) increased at an average rate of 2.23 days year−1. However, this increase was not uniform across the heat-stress categories. The mild heat-stress category (68 ≤ THI < 72) showed a mean decrease of 0.66 days year−1, whereas the moderate category (72 ≤ THI < 78) increased by 2.71 days year−1 and the severe category (THI ≥ 78) increased by 0.18 days year−1. Because these categories are mutually exclusive and collectively comprise THI ≥ 68, the category-specific trends are internally consistent with the overall increase of 2.23 days year−1. The decrease in the mild category therefore does not indicate a reduction in overall heat-stress exposure, but rather a redistribution of heat-stress days toward the moderate and, to a lesser extent, severe categories.
Collectively, the patterns shown in Figure 8 indicate that the thermal environment across the major dairy-producing regions of Minas Gerais is characterized by a progressive reduction in thermoneutral conditions and an increase in heat-stress exposure, although the magnitude of these changes varies among regions. The quantitative trends further show that this increase was driven predominantly by the expansion of the moderate heat-stress category, rather than by a uniform increase across all severity levels. These findings indicate that the climatic vulnerability is associated not only with the occurrence of severe heat stress events but also with the increasing persistence of moderate thermal stress, which may prolong animal exposure to challenging environmental conditions [16,23]. From this perspective, the integrated characterization of heat-stress frequency, severity, and temporal evolution provides a more comprehensive basis for livestock environmental management, including regional planning of livestock facilities, the selection and prioritization of cooling technologies, and the development of adaptation strategies aimed at enhancing the resilience of dairy production systems under a changing climate [30,89].
The spatial distribution of temporal trends for the THI ≥ 68 category (Figure 9a) illustrates changes in the annual frequency of heat-stress days across the major dairy-producing regions of Minas Gerais [7,90]. Predominantly positive trends were observed across much of the study area, indicating an increase in the annual frequency of heat-stress days over the historical period. The spatial patterns observed for the individual heat-stress categories are presented in Figure 9b–d [30,91].
Figure 9.
Spatial distribution of the Pearson correlation coefficient (r) between year and the annual number of days within each Temperature–Humidity Index (THI) category across the five major dairy-producing regions of Minas Gerais: (a) THI ≥ 68, (b) 68 ≤ THI < 72, (c) 72 ≤ THI < 78, and (d) THI ≥ 78. Positive values indicate increasing annual frequency of the respective THI category, whereas negative values indicate decreasing annual frequency. Light-gray cells indicate non-significant temporal associations (p ≥ 0.05), whereas colored cells represent statistically significant associations (p < 0.05). The numbered labels identify the Intermediate Geographic Regions as follows: 1—Patos de Minas; 2—Uberlândia; 3—Uberaba; 4—Divinópolis; 5—Varginha.
The spatial distribution of the temporal trends further shows that the moderate (72 ≤ THI < 78) and severe (THI ≥ 78) heat-stress categories exhibited predominantly increasing trends across much of the major dairy-producing regions (Figure 9c,d), whereas the mild category (68 ≤ THI < 72) showed more spatially heterogeneous behavior (Figure 9b). This spatial pattern indicates a redistribution of heat-stress exposure toward higher-severity conditions, particularly in the western and northern portions of the state, where climatic conditions are more conducive to persistent thermal stress [16,25,92].
Overall, the temporal analysis indicates that the increase in heat-stress exposure was accompanied by a shift in the distribution of days toward more thermally challenging conditions. The predominance of the moderate category in this increase is particularly relevant for intensive dairy systems, as persistent exposure to moderate thermal loads may extend the duration of conditions that challenge animal thermoregulation and potentially affect productive and reproductive efficiency [16,67,93]. Nevertheless, the annual frequencies and temporal trends identified here characterize climatic heat-stress exposure and should not be interpreted as direct measures of animal responses, which depend on herd characteristics, production level, physiological stage, housing, and management conditions.
Collectively, these findings demonstrate that integrating the annual frequency of THI categories with their spatiotemporal trends enables the identification not only of the regions currently characterized by greater climatic heat-stress exposure but also of those where climate risk is most likely to intensify over time. This integrated approach further highlights the value of climate reanalysis data as a decision-support tool for livestock environmental management and regional planning of intensive dairy production, providing an objective basis for prioritizing adaptation and mitigation strategies according to the climatic characteristics of each major dairy-producing region [39,41,77].
3.4. Study Limitations and Future Research Directions
Although the meteorological reanalysis data demonstrated a strong ability to represent regional and temporal climatic patterns, they cannot fully capture the microclimatic conditions to which animals are exposed to inside livestock facilities. Production system characteristics, including building design, ventilation, stocking density, and shade availability, can substantially modify the local thermal environment [30,94]. Therefore, the results should be interpreted as a characterization of regional climatic heat-stress exposure rather than a direct representation of the indoor thermal environment. Farm-scale applications should consequently be supported by in situ measurements.
A further limitation concerns the temporal trend analysis, which was based on 21 annual observations per grid cell. Although this temporal aggregation provides a standardized basis for assessing interannual changes in the frequency of THI categories, Pearson correlation evaluates linear associations and may not adequately capture nonlinear temporal patterns. In addition, potential residual serial dependence among annual observations was not explicitly modeled and should therefore be considered when interpreting the statistical significance of the identified associations.
Another limitation is that the fixed THI thresholds used in this study represent standardized classes of environmental heat stress and may not fully capture variation in thermal responses associated with physiological status, production level, or other animal-specific conditions. The magnitude of animal responses to a given THI condition may vary according to herd characteristics, genetic background, production level, physiological stage, housing conditions, and management practices, which were not available in the dataset used here. Therefore, the annual frequencies and temporal trends identified in this study characterize changes in climatic heat-stress exposure rather than quantify the corresponding biological or productive responses of dairy cows. Future studies integrating regional climate information with in situ microclimatic measurements and animal-based, physiological, and productive indicators are needed to establish more specific relationships between THI exposure and dairy cattle responses.
Another limitation concerns the use of daily mean THI, which may not fully capture short-term thermal peaks or the intensity and duration of heat exposure. In particular, afternoon conditions may involve substantially higher thermal loads than those represented by the daily means. Metrics based on hourly THI, such as maximum daily THI, the number of hours above a given threshold, or indicators of consecutive heat-stress days, could therefore provide complementary information on the intensity and persistence of thermal exposure. These metrics were not included because the present study was designed to characterize regional spatial patterns, seasonal variability, and long-term temporal trends using a standardized daily scale. Future studies could extend the proposed framework by retaining the original hourly resolution to characterize short-term thermal extremes and heat-stress events.
Additional limitations concern the spatial and observational scales of the analysis. The spatial resolution of ERA5-Land may not fully represent local thermal variability at individual farms, particularly where farm-specific environmental conditions differ from the grid-cell representation. In addition, the INMET stations had different operational start dates, resulting in unequal potential temporal coverage among stations and potentially affecting the comparability of station-based validation results. The IDW interpolation used to represent the spatial distribution of station-based KGE′ values also introduces spatial estimation uncertainty, and alternative interpolation methods could yield different spatial patterns. Finally, statistical significance was assessed independently for the grid cells without correction for multiple spatial comparisons. Therefore, the identified significant areas should be interpreted as local statistical associations rather than as evidence of field-wide significance.
Despite these limitations, the integration of ERA5-Land reanalysis data, bioclimatic indicators, and spatial information proved to be a robust framework for identifying spatial patterns, temporal trends, and priority regions for heat stress adaptation across the major dairy-producing regions of Minas Gerais. Beyond supporting the regional planning of building design strategies and cooling systems tailored to prevailing climatic conditions, the proposed framework also has the potential to be applied to other dairy-producing regions, provided that local validation is performed.
4. Conclusions
The proposed framework enabled a robust spatiotemporal characterization of heat stress risk across the major dairy-producing regions of Minas Gerais by integrating ERA5-Land reanalysis data, validation against meteorological observations, bioclimatic indicators, and spatial information on dairy production. The strong agreement between the reanalysis of data and meteorological station observations confirms the suitability of ERA5-Land for long-term climatic applications in dairy production systems. Collectively, the methodological framework developed in this study provides a robust tool for characterizing the thermal environment, assessing the spatiotemporal variability of climate risk, and identifying priority areas for climate adaptation strategies in intensive dairy production systems. The temporal analysis further showed an average increase of 2.23 days year−1 in heat-stress conditions (THI ≥ 68), driven mainly by the increase in moderate heat stress, indicating a progressive shift toward more thermally challenging conditions over the study period.
These findings provide a robust basis for livestock environmental management and the regional planning of heat stress mitigation strategies in intensive dairy production systems, supporting the prioritization of interventions and the development of adaptation measures tailored to different climatic conditions. Furthermore, the integration of climate reanalysis products, bioclimatic indicators, and spatial information extends the applicability of this framework as a decision-support tool for climate adaptation planning in dairy-producing regions, with potential for adaptation and replication in other regions following appropriate local validation.
Author Contributions
Conceptualization. T.S.M., C.E.A.O., L.B.-M. and M.B.; methodology. T.S.M., C.E.A.O., F.C.d.S., L.B.-M. and M.B.; validation. T.S.M., C.E.A.O. and J.V.F.d.S.; formal analysis. T.S.M. and C.E.A.O.; investigation. T.S.M., C.E.A.O., J.V.F.d.S., L.B.-M. and M.B.; resources. C.E.A.O. and I.d.F.F.T.; data curation. T.S.M. and C.E.A.O.; writing—original draft preparation. T.S.M., C.E.A.O., J.V.F.d.S.; writing—review and editing. I.d.F.F.T., F.C.d.S., L.B.-M. and M.B.; visualization. T.S.M. and C.E.A.O.; supervision. C.E.A.O., I.d.F.F.T., F.C.d.S., L.B.-M. and M.B.; project administration. C.E.A.O., I.d.F.F.T. and M.B.; funding acquisition. C.E.A.O. and I.d.F.F.T. All authors have read and agreed to the published version of the manuscript.
Funding
This research was funded by the Coordination of Superior Level Staff Improvement, Brazil (CAPES)—Finance Code 001; the National Council for Scientific and Technological Development, Brazil (CNPq)—Process 151546/2024-0; and the Minas Gerais Research Support Foundation, Brazil (FAPEMIG)—Finance Code 001.
Institutional Review Board Statement
Not applicable.
Informed Consent Statement
Not applicable.
Data Availability Statement
The raw data supporting the conclusions of this article will be made available by the authors on request.
Acknowledgments
The authors would like to thank the Federal University of Viçosa (UFV), whose support is appreciated. This work was conducted with the support of the National Council for Scientific and Technological Development, Brazil (CNPq); the Coordination of Superior Level Staff Improvement, Brazil (CAPES); and the Research Supporting Foundation of Minas Gerais State, Brazil (FAPEMIG).
Conflicts of Interest
The authors declare no conflicts of interest.
References
- Food and Agriculture Organization—FAO. Milk Production: Gateway to Dairy Production and Products. Available online: https://www.fao.org/dairy-production-products/production/milk-production/en (accessed on 29 June 2026).
- Algarni, S.M. The Impact of Climate Change on Economic Losses and the Performance of Global Dairy Production for Food Supply. Res. World Agric. Econ. 2026, 7, 759–779. [Google Scholar] [CrossRef] [Scilit]
- Guzmán-Luna, P.; Mauricio-Iglesias, M.; Flysjö, A.; Hospido, A. Analysing the Interaction between the Dairy Sector and Climate Change from a Life Cycle Perspective: A Review. Trends Food Sci. Technol. 2022, 126, 168–179. [Google Scholar] [CrossRef] [Scilit]
- Otálora, X.D.; Del Prado, A.; Dragoni, F.; Estellés, F.; Amon, B. Evaluating Three-Pillar Sustainability Modelling Approaches for Dairy Cattle Production Systems. Sustainability 2021, 13, 6332. [Google Scholar] [CrossRef] [Scilit]
- Silva, L.H.R.; Silva, A.L.; Marcondes, M.I.; Bittencourt, C.S.; Rodrigues, J.V.C.; Amorim, W.P.F.; Lima Netto, E.P.; Silva, T.E.; Costa, J.H.C.; Rotta, P.P. A Comparative Analysis of Dairy Production Systems: Milk Production Tiers and Their Impact on Dairy Calf and Heifer Cost of Production in Brazil. J. Dairy Sci. 2025, 108, 13439–13454. [Google Scholar] [CrossRef] [Scilit] [PubMed]
- Food and Agriculture Organization—FAO. World Food and Agriculture—Statistical Yearbook 2023; FAO: Rome, Italy, 2023. [Google Scholar]
- Sant’ana, A.B.; Machado, F.S.; Diniz, F.H.; Pires, M.F.A.; Rotta, P.P.; Ribeiro, E.F.; Silva, A.L. How Can Production Levels Influence Decision Making on Organic Dairy Farms in Brazil? J. Dairy Sci. 2026, 109, 482–494. [Google Scholar] [CrossRef] [Scilit] [PubMed]
- Bacchi, M.D.; Almeida, A.N.; Telles, T.S. Spatio-Temporal Dynamics of Milk Production in Brazil. Semin. Cienc. Agrar. 2022, 43, 241–262. [Google Scholar] [CrossRef] [Scilit]
- Ministério da Agricultura e Pecuária—MAPA. Mapa do Leite: Políticas Públicas e Privadas Para o Leite. Available online: https://www.gov.br/agricultura/pt-br/assuntos/producao-animal/mapa-do-leite (accessed on 3 June 2026).
- Instituto Brasileiro de Geografia e Estatística—IBGE. Sistema IBGE de Recuperação Automática (SIDRA). Available online: https://sidra.ibge.gov.br/home/leite (accessed on 29 June 2026).
- Mariano, T.S.; Oliveira, C.E.A.; Justino, F.; Sousa, F.C.; Oliveira, C.P.; Tinôco, I.F.F.; Barreto-Mendes, L.; Mariano, G.; Cavalcante, I.O.; Barbari, M. Modeling the Evaporative Cooling Potential in Dairy Farming: A Thermal Index-Based Approach Under Distinct Brazilian Climatic Conditions. AgriEngineering 2026, 8, 124. [Google Scholar] [CrossRef] [Scilit]
- Oliveira, C.E.A.; Tinôco, I.F.F.; Damasceno, F.A.; Oliveira, V.C.; Rodrigues, P.H.M.; Ferraz, G.A.S.; Sousa, F.C.; Andrade, R.R.; Nascimento, J.A.C.; Silva, L.F. Air Velocity Spatial Variability in Open Compost-Bedded Pack Barn System with Positive Pressure Ventilation. An. Acad. Bras. Cienc. 2023, 95, e20220415. [Google Scholar] [CrossRef] [Scilit] [PubMed]
- Thornton, P.; Nelson, G.; Mayberry, D.; Herrero, M. Impacts of Heat Stress on Global Cattle Production during the 21st Century: A Modelling Study. Lancet Planet. Health 2022, 6, e192–e201. [Google Scholar] [CrossRef] [Scilit] [PubMed]
- Oliveira, C.P.; Sousa, F.C.; Silva, A.L.; Schultz, É.B.; Londoño, R.I.V.; Souza, P.A.R. Heat Stress in Dairy Cows: Impacts, Identification, and Mitigation Strategies—A Review. Animals 2025, 15, 249. [Google Scholar] [CrossRef] [Scilit] [PubMed]
- Singaravadivelan, A.; Prasad, A.; Balusami, C.; Harikumar, S.; Beena, V.; Gleeja, V.L.; Sejian, V.; Vijayakumar, P.; Sachin, P.B.; Praveen Kumar, I.; et al. Navigating the Labyrinth of Heat Stress Assessment in Dairy Cattle: A Comprehensive Review of Methods and Emerging Technologies. Comput. Electron. Agric. 2025, 237, 110517. [Google Scholar] [CrossRef] [Scilit]
- Silveira, R.M.F.; Façanha, D.A.E.; Vasconcelos, A.M.; Leite, S.C.B.; Leite, J.H.G.M.; Saraiva, E.P.; Fávero, L.P.; Tedeschi, L.O.; Silva, I.J.O. Physiological Adaptability of Livestock to Climate Change: A Global Model-Based Assessment for the 21st Century. Environ. Impact Assess. Rev. 2026, 116, 108061. [Google Scholar] [CrossRef] [Scilit]
- Chen, L.; Thorup, V.M.; Kudahl, A.B.; Østergaard, S. Effects of Heat Stress on Feed Intake, Milk Yield, Milk Composition, and Feed Efficiency in Dairy Cows: A Meta-Analysis. J. Dairy Sci. 2024, 107, 3207–3218. [Google Scholar] [CrossRef] [Scilit] [PubMed]
- Abreu, M.B.; Pereira, J.M.V.; Brandão, V.L.N.; Marcondes, M.I. Feed Management Practices Used for Dairy Cows in Confined Dairies in Brazil. PLoS ONE 2026, 21, e0344588. [Google Scholar] [CrossRef] [Scilit] [PubMed]
- Brettas, P.K.M.; Nascimento, F.G.O.; Guimarães, E.C.; Faria, P.N.; Ferreira, A.V.; Nascimento, M.R.B.M. Knowledge and Perception of Milk Producers about Thermal Stress in Brazilian Dairy Farms. Heliyon 2024, 10, e26115. [Google Scholar] [CrossRef] [Scilit] [PubMed]
- Afzal, A. Biological Responses to Heat Stress in Livestock: From Thermoregulation to Cellular and Epigenetic Adaptation. J. Therm. Biol. 2026, 139, 104473. [Google Scholar] [CrossRef] [Scilit] [PubMed]
- Hasan, F.M.; Chlingaryan, A.; Thomson, P.C.; Clark, C.E.F.; Islam, M.R.; Lomax, S. Impact of Heat Stress on Cattle Systems: Responses of Production Metrics to Thermal Stress. Comput. Electron. Agric. 2026, 240, 111143. [Google Scholar] [CrossRef] [Scilit]
- Manica, E.; Coltri, P.P.; Pacheco, V.M.; Martello, L.S. Changes in the Pattern of Heat Waves and the Impacts on Holstein Cows in a Subtropical Region. Int. J. Biometeorol. 2022, 66, 2477–2488. [Google Scholar] [CrossRef] [Scilit] [PubMed]
- Rosa, D.R.; Ferreira, N.C.R.; Oliveira, C.E.A.; Moreira, A.N.H.; Battisti, R.; Casaroli, D.; Barbari, M.; Bambi, G.; Andrade, R.R. Climate Change and State of the Art of the Sustainable Dairy Farming: A Systematic Review. Animals 2025, 15, 2997. [Google Scholar] [CrossRef] [Scilit] [PubMed]
- Masson-Delmotte, V.; Zhai, P.; Pirani, A.; Connors, S.L.; Péan, C.; Berger, S.; Caud, N.; Chen, Y.; Goldfarb, L.; Gomis, M.I.; et al. IPCC Climate Change 2021: The Physical Science Basis. Contribution of Working Group I to the Sixth Assessment Report of the Intergovernmental Panel on Climate Change; Cambridge University Press: Cambridge, UK, 2023. [Google Scholar]
- Gauly, M.; Ammer, S. Review: Challenges for Dairy Cow Production Systems Arising from Climate Changes. Animal 2020, 14, s196–s203. [Google Scholar] [CrossRef] [Scilit] [PubMed]
- Sousa, A.C.; Sousa, A.M.; Corrêa, W.C.; Marques, J.I.; de Meneses, K.C.; Pandorfi, H.; Silva, T.G.F.; Silva, J.L.B.; Silva, M.V.; Machado, N.A.F. Bioclimatic Zoning and Climate Change Impacts on Dairy Cattle in Maranhão, Brazil. Animals 2025, 15, 1646. [Google Scholar] [CrossRef] [Scilit] [PubMed]
- Roth, Z. Cooling Is the Predominant Strategy to Alleviate the Effects of Heat Stress on Dairy Cows. Reprod. Domest. Anim. 2022, 57, 16–22. [Google Scholar] [CrossRef] [Scilit] [PubMed]
- De Masi, R.F.; Ruggiero, S.; Tariello, F.; Vanoli, G.P. Passive Envelope Solutions to Aid Design of Sustainable Livestock Buildings in Mediterranean Climate. J. Clean. Prod. 2021, 311, 127444. [Google Scholar] [CrossRef] [Scilit]
- Colombari, D.; Masoero, F.; Della Torre, A. A CFD Methodology for the Modelling of Animal Thermal Welfare in Hybrid Ventilated Livestock Buildings. AgriEngineering 2024, 6, 1525–1548. [Google Scholar] [CrossRef] [Scilit]
- Mrema, G.C.; Gumbe, L.O.; Chapete, H.J.; Agullo, J.O. Rural Structures in the Tropics: Design and Development, 1st ed.; FAO: Roma, Italy, 2011. [Google Scholar]
- Zhou, M.; Groot Koerkamp, P.W.G.; Huynh, T.T.T.; Aarnink, A.J.A. Development and Evaluation of a Thermoregulatory Model for Predicting Thermal Responses of Dairy Cows. Biosyst. Eng. 2022, 223, 295–308. [Google Scholar] [CrossRef] [Scilit]
- Zhou, B.; Wang, X.; Mondaca, M.R.; Rong, L.; Choi, C.Y. Assessment of Optimal Airflow Baffle Locations and Angles in Mechanically-Ventilated Dairy Houses Using Computational Fluid Dynamics. Comput. Electron. Agric. 2019, 165, 104930. [Google Scholar] [CrossRef] [Scilit]
- Garcia, P.R.; Silveira, R.M.F.; Lensink, J.; da Silva, I.J.O. Thermal Performance of a Low-Profile Cross-Ventilated Freestall Dairy Barn with Evaporative Cooling Pads in a Hot and Humid Climate. Int. J. Biometeorol. 2023, 67, 1651–1658. [Google Scholar] [CrossRef] [Scilit] [PubMed]
- Zeoli, A.; Pacak, A.; Gendebien, S.; Chorowski, M.; Xie, X.; Lemort, V. Feasibility Analysis of Desiccant Evaporative Cooling Technologies in Various Climate Conditions: Present and Future Potential. Energy 2025, 327, 136257. [Google Scholar] [CrossRef] [Scilit]
- Zhou, M.; Tang, X.; Xiong, B.; Koerkamp, P.W.G.G.; Aarnink, A.J.A. Effectiveness of Cooling Interventions on Heat-Stressed Dairy Cows Based on a Mechanistic Thermoregulatory Model. Biosyst. Eng. 2024, 244, 114–121. [Google Scholar] [CrossRef] [Scilit]
- Andrade, R.R.; Tinôco, I.F.F.; Damasceno, F.A.; Ferraz, G.A.S.; Freitas, L.C.S.R.; Ferreira, C.F.S.; Barbari, M.; Teles-Junior, C.G.S. Spatial Analysis of Microclimatic Variables in Compost-Bedded Pack Barn with Evaporative Tunnel Cooling. An. Acad. Bras. Cienc. 2022, 94, e20210226. [Google Scholar] [CrossRef] [Scilit] [PubMed]
- Oliveira, C.E.A.; Tinôco, I.F.F.; Damasceno, F.A.; Oliveira, V.C.; Ferraz, G.A.S.; Sousa, F.C.; Andrade, R.R.; Barbari, M. Mapping of the Thermal Microenvironment for Dairy Cows in an Open Compost-Bedded Pack Barn System with Positive-Pressure Ventilation. Animals 2022, 12, 2055. [Google Scholar] [CrossRef] [Scilit] [PubMed]
- Briegel, F.; Pinto, J.G.; Christen, A. Is Satellite Land Surface Temperature an Appropriate Proxy for Intra-Urban Variability of Daytime Heat Stress? Remote Sens. Environ. 2025, 331, 115045. [Google Scholar] [CrossRef] [Scilit]
- Muñoz-Sabater, J.; Dutra, E.; Agustí-Panareda, A.; Albergel, C.; Arduini, G.; Balsamo, G.; Boussetta, S.; Choulga, M.; Harrigan, S.; Hersbach, H.; et al. ERA5-Land: A State-of-the-Art Global Reanalysis Dataset for Land Applications. Earth Syst. Sci. Data 2021, 13, 4349–4383. [Google Scholar] [CrossRef] [Scilit]
- Tsiamadis, V.; Valergakis, G.E.; Soufleri, A.; Arsenos, G.; Banos, G.; Karamanlis, X. Identification of Temporal Patterns of Environmental Heat Stress of Holstein Dairy Heifers Raised in Mediterranean Climate during Their In-Utero and Post-Natal Life Periods and Modelling Their Effects on Age at First Calving. J. Therm. Biol. 2023, 117, 103717. [Google Scholar] [CrossRef] [Scilit] [PubMed]
- Di Napoli, C.; Barnard, C.; Prudhomme, C.; Cloke, H.L.; Pappenberger, F. ERA5-HEAT: A Global Gridded Historical Dataset of Human Thermal Comfort Indices from Climate Reanalysis. Geosci. Data J. 2021, 8, 2–10. [Google Scholar] [CrossRef] [Scilit]
- Herrera-González, J.L.; Legarreta-González, M.A.; Véliz-Deras, F.G.; Rodríguez-Venegas, R.; Calderón-Leyva, G.; Robles-Trillo, P.A.; Rodríguez-Martínez, R. Identifying the Best Indicator for Forecasting the Temperature-Humidity Index for Dairy Cattle and Its Historical Pattern (1940–2024) in North-Central Mexico. Smart Agric. Technol. 2025, 12, 101368. [Google Scholar] [CrossRef] [Scilit]
- Liu, C.; Cao, Y.; Luo, Z.; Liu, Y.; Reynolds, C.K.; Humphries, D.; Zhang, C.; Coding, E.; Chopra, K.; Amory, J.; et al. Heat Stress Monitoring, Modelling, and Mitigation in a Dairy Cattle Building in Reading, UK: Impacts of Current and Projected Heatwaves. Build. Environ. 2025, 279, 113046. [Google Scholar] [CrossRef] [Scilit]
- Herbut, P.; Angrecka, S.; Walczak, J. Environmental Parameters to Assessing of Heat Stress in Dairy Cattle—A Review. Int. J. Biometeorol. 2018, 62, 2089–2097. [Google Scholar] [CrossRef] [Scilit] [PubMed]
- Polsky, L.; Von-Keyserlingk, M.A.G. Invited Review: Effects of Heat Stress on Dairy Cattle Welfare. J. Dairy Sci. 2017, 100, 8645–8657. [Google Scholar] [CrossRef] [Scilit] [PubMed]
- Ranzato, G.; Lora, I.; Aernouts, B.; Adriaens, I.; Gottardo, F.; Cozzi, G. Sensor-Based Behavioral Patterns Can Identify Heat-Sensitive Lactating Dairy Cows. Int. J. Biometeorol. 2023, 67, 2047–2054. [Google Scholar] [CrossRef] [Scilit] [PubMed]
- R Core Team. R: A Language and Environment for Statistical Computing; R Foundation for Statistical Computing: Vienna, Austria, 2025. [Google Scholar]
- Wickham, H. Stringr: Modern, Consistent String Processing. R J. 2010, 2, 38–40. [Google Scholar] [CrossRef] [Scilit]
- Pebesma, E. Simple Features for R: Standardized Support for Spatial Vector Data. R J. 2018, 10, 439–446. [Google Scholar] [CrossRef] [Scilit]
- Hijmans, R.J.; Brown, A.; Barbosa, M.; Cordano, E.; Dyba, K. Terra: Spatial Data Analysis. In CRAN: Contributed Packages; R Foundation for Statistical Computing: Vienna, Austria, 2026. [Google Scholar] [CrossRef] [Scilit]
- SIDRA. Pesquisa da Pecuária Municipal. Available online: https://sidra.ibge.gov.br/Tabela/74 (accessed on 22 May 2025).
- IBGE. Divisão Regional do Brasil em Regiões Geográficas Imediatas e Regiões Geográficas Intermediárias; IBGE: Rio de Janeiro, Brazil, 2017.
- European Commission. Study of the Best Ways for Producer Organisations to Be Formed, Carry Out Their Activities and Be Supported; European Commission: Luxembourg, 2019. [Google Scholar] [CrossRef] [PubMed]
- Kopczewska, K. Cluster-Based Measures of Regional Concentration. Critical Overview. Spat. Stat. 2018, 27, 31–57. [Google Scholar] [CrossRef] [Scilit]
- Kofler, J.; Berger, P.; Egger-Danner, C.; Fuerst-Waltl, B. Benchmarking Claw Health across Three Dairy Cow Breeds in 508 Dairy Farms Using Numerical Claw Health Indicators. Vet. J. 2024, 308, 106242. [Google Scholar] [CrossRef] [Scilit] [PubMed]
- Soumri, N.; Carabaño, M.J.; González-Recio, O.; Bedhiaf-Romdhani, S. Modelling Heat Stress Effects on Milk Production Traits in Tunisian Holsteins Using a Random Regression Approach. J. Anim. Breed. Genet. 2025, 142, 155–169. [Google Scholar] [CrossRef] [Scilit] [PubMed]
- Mardhati, M.; González, L.A.; Thomson, P.C.; Clark, C.E.F.; García, S.C. Short-Term Liveweight Changes of Dairy Cows Measured by Stationary and Walk-over Weighing Scales. J. Dairy Sci. 2021, 104, 8202–8213. [Google Scholar] [CrossRef] [Scilit] [PubMed]
- Muñoz-Sabater, J. ERA5-Land Hourly Data from 1950 to Present. Available online: https://cds.climate.copernicus.eu/datasets/reanalysis-era5-land?tab=overview (accessed on 22 May 2026).
- ECMWF. Estatísticas Diárias Pós-Processadas do ERA5-Land de 1950 Até o Presente. Available online: https://cds.climate.copernicus.eu/datasets/derived-era5-land-daily-statistics?tab=overview (accessed on 23 May 2025).
- Vianello, R.L.; Alves, A.R. Meteorologia Básica e Aplicações, 2nd ed.; Editora UFV: Viçosa, Brazil, 2012. [Google Scholar]
- Tetens, O. Über Einige Meteorologische Begriffe. Z. Geophys. 1930, 6, 297–309. [Google Scholar]
- Yousef, M.K. Thermoneutral Zone. In Stress Physiology in Livestock. Volume I. Basic Principles; CRC Press Inc.: Boca Raton, FL, USA, 1985; pp. 67–73. [Google Scholar]
- Mader, T.L.; Davis, M.S.; Brown-Brandl, T. Environmental Factors Influencing Heat Stress in Feedlot Cattle. J. Anim. Sci. 2006, 84, 712–719. [Google Scholar] [CrossRef] [Scilit] [PubMed]
- Collier, R.J.; Zimbelman, R.B.; Rhoads, R.P.; Rhoads, M.L.; Baumgard, L.H. A Re-Evaluation of the Impact of Temperature Humidity Index (THI) and Black Globe Humidity Index (BGHI) on Milk Production in High Producing Dairy Cows. In Proceedings of the Western Dairy Management Conference, Reno, NV, USA, 9–11 March 2011; pp. 113–125. [Google Scholar]
- Carabaño, M.J.; Bachagha, K.; Ramón, M.; Díaz, C. Modeling Heat Stress Effect on Holstein Cows under Hot and Dry Conditions: Selection Tools. J. Dairy Sci. 2014, 97, 7889–7904. [Google Scholar] [CrossRef] [Scilit] [PubMed]
- Moore, S.S.; Costa, A.; Penasa, M.; Callegaro, S.; De Marchi, M. How Heat Stress Conditions Affect Milk Yield, Composition, and Price in Italian Holstein Herds. J. Dairy Sci. 2023, 106, 4042–4058. [Google Scholar] [CrossRef] [Scilit] [PubMed]
- Dauria, B.D.; Sigdel, A.; Petrini, J.; Bóscollo, P.P.; Pilonetto, F.; Salvian, M.; Rezende, F.M.; Pedrosa, V.B.; Bittar, C.M.M.; Machado, P.F.; et al. Genetic Effects of Heat Stress on Milk Fatty Acids in Brazilian Holstein Cattle. J. Dairy Sci. 2022, 105, 3296–3305. [Google Scholar] [CrossRef] [Scilit] [PubMed]
- Becker, C.A.; Collier, R.J.; Stone, A.E. Invited Review: Physiological and Behavioral Effects of Heat Stress in Dairy Cows. J. Dairy Sci. 2020, 103, 6751–6770. [Google Scholar] [CrossRef] [Scilit] [PubMed]
- Tu, P.A.; Yeh, Y.H.; Chen, Y.H.; Shiau, J.W.; Lin, T.Y.; Banhazi, T.; Yang, M.K. Stage-Specific Milk Yield Losses and Associated Sweating, Respiration, and Rectal Temperature Responses under Varying Temperature-Humidity Index Thresholds in Lactating and Dry Cows. J. Dairy Sci. 2025, 108, 2023–2035. [Google Scholar] [CrossRef] [Scilit] [PubMed]
- Collier, R.J.; Baumgard, L.H.; Zimbelman, R.B.; Xiao, Y. Heat Stress: Physiology of Acclimation and Adaptation. Anim. Front. 2019, 9, 12–19. [Google Scholar] [CrossRef] [Scilit] [PubMed]
- Instituto Nacional de Meteorologia—INMET. Banco de Dados Meteorológicos Para Ensino e Pesquisa (BDMEP). Available online: https://bdmep.inmet.gov.br/ (accessed on 2 June 2026).
- Kling, H.; Fuchs, M.; Paulin, M. Runoff Conditions in the Upper Danube Basin under an Ensemble of Climate Change Scenarios. J. Hydrol. 2012, 424–425, 264–277. [Google Scholar] [CrossRef] [Scilit]
- Gupta, H.V.; Kling, H.; Yilmaz, K.K.; Martinez, G.F.; Kling, H. Decomposition of the Mean Squared Error and NSE Performance Criteria: Implications for Improving Hydrological Modelling. J. Hydrol. 2009, 377, 80–91. [Google Scholar] [CrossRef] [Scilit]
- Li, Z. An Enhanced Dual IDW Method for High-Quality Geospatial Interpolation. Sci. Rep. 2021, 11, 9903. [Google Scholar] [CrossRef] [Scilit] [PubMed]
- Hajoub, M.W.; Touil, H.; Arouijal, A.; Achkari Begdouri, M. Integration of IoT Sensing and Spatial Interpolation for Optimized Agricultural Monitoring: A Case Study in Larache, Morocco. Syst. Sci. Control Eng. 2026, 14, 2657113. [Google Scholar] [CrossRef] [Scilit]
- Burrough, P.A.; McDonnell, R.A. Principles of Geographical Information Systems, 2nd ed.; Oxford University Press: Oxford, UK, 1998. [Google Scholar]
- Hersbach, H.; Bell, B.; Berrisford, P.; Hirahara, S.; Horányi, A.; Muñoz-Sabater, J.; Nicolas, J.; Peubey, C.; Radu, R.; Schepers, D.; et al. The ERA5 Global Reanalysis. Q. J. R. Meteorol. Soc. 2020, 146, 1999–2049. [Google Scholar] [CrossRef] [Scilit]
- Wilks, D.S. Statistical Methods in the Atmospheric Sciences, 4th ed.; Elsevier: Amsterdam, The Netherlands, 2020. [Google Scholar]
- Montgomery, D.C.; Peck, E.A.; Vining, G.G. Introduction to Linear Regression Analysis, 6th ed.; John Wiley & Sons, Inc.: Hoboken, NJ, USA, 2021. [Google Scholar]
- Helsel, D.R.; Hirsch, R.M.; Ryberg, K.R.; Archfield, S.A.; Gilroy, E.J. Statistical Methods in Water Resources; Techniques and Methods; U.S. Geological Survey: Reston, VA, USA, 2020; Book 4, Chapter A3. [CrossRef] [Scilit]
- Li, J.; Heap, A.D. A Review of Comparative Studies of Spatial Interpolation Methods in Environmental Sciences: Performance and Impact Factors. Ecol. Inform. 2011, 6, 228–241. [Google Scholar] [CrossRef] [Scilit]
- Alves, M.C.; Sanches, L.; Carvalho, L.G. Geostatistical Surfaces of Climatological Normals of Mean Air Temperature in Minas Gerais. Environ. Monit. Assess. 2022, 194, 513. [Google Scholar] [CrossRef] [Scilit] [PubMed]
- Reboita, M.S.; Rodrigues, M.; Silva, L.F.; Alves, M.A. Aspectos Climáticos Do Estado de Minas Gerais. Rev. Bras. Climatol. 2015, 17, 206–226. [Google Scholar] [CrossRef] [Scilit]
- Džermeikaitė, K.; Krištolaitytė, J.; Malašauskienė, D.; Arlauskaitė, S.; Girdauskaitė, A.; Antanaitis, R. The Impact of Heat Stress on Dairy Cattle: Effects on Milk Quality, Rumination Behaviour, and Reticulorumen PH Response Using Machine Learning Models. Biosensors 2025, 15, 608. [Google Scholar] [CrossRef] [Scilit] [PubMed]
- Toledo, I.M.; Dahl, G.E.; De Vries, A. Dairy Cattle Management and Housing for Warm Environments. Livest. Sci. 2022, 255, 104802. [Google Scholar] [CrossRef] [Scilit]
- Sammad, A.; Umer, S.; Shi, R.; Zhu, H.; Zhao, X.; Wang, Y. Dairy Cow Reproduction under the Influence of Heat Stress. J. Anim. Physiol. Anim. Nutr. 2020, 104, 978–986. [Google Scholar] [CrossRef] [Scilit] [PubMed]
- Abbas, A.K.; Alani, Z.K.; Subhi, S.L.; Mohammed, T.D.; Abdulamer, R.S.; Khaddour, R.H.; Abdullah, H. Advancements in Heat Stress Mitigation Strategies for Dairy Cattle. J. Anim. Health Prod. 2025, 13, 105–112. [Google Scholar] [CrossRef] [Scilit]
- Tejero-González, A.; Franco-Salas, A. Optimal Operation of Evaporative Cooling Pads: A Review. Renew. Sustain. Energy Rev. 2021, 151, 111632. [Google Scholar] [CrossRef] [Scilit]
- Arias, A.; González-Pintos, M.; Moreira, M.T.; Feijoo, G. Towards Sustainable Livestock: Evaluating Farm Practices within a Planetary Boundaries Perspective. J. Agric. Food Res. 2026, 27, 102844. [Google Scholar] [CrossRef] [Scilit]
- De Mori, C.; Vinholis, M.M.B.; Hisatugu, M.T.; Barioni, W.; Camargo, A.C.; Luiz, A.; Novo, M. Factors Affecting the Technologies Adoption Intensity and Effect in Milk Production in Minas Gerais, Brazil. Rev. Ciênc. Agron. 2026, 57, e202392032. [Google Scholar] [CrossRef] [Scilit]
- Andrade, R.R.; Tinôco, I.F.F.; Damasceno, F.A.; Oliveira, C.E.A.; Concha, M.S.; Zacaroni, O.F.; Bambi, G.; Barbari, M. Understanding Compost-Bedded Pack Barn Systems in Regions with a Tropical Climate: A Review of the Current State of the Art. Animals 2024, 14, 1755. [Google Scholar] [CrossRef] [Scilit] [PubMed]
- Ferreira, N.C.R.; Andrade, R.R.; Ferreira, L.N. Climate Change Impacts on Livestock in Brazil. Int. J. Biometeorol. 2024, 68, 2693–2704. [Google Scholar] [CrossRef] [Scilit] [PubMed]
- Zhang, Q.; Yang, L.; Li, Y.; Gu, P.; Si, R.; Zhu, L.; Zhang, W. Heat Stress Affects Dairy Cow Performance via Oxidative Stress, Hypothalamic–Pituitary–Adrenal Axis, Gut Microbiota, and Multi-Dimensional Mitigation. Front. Vet. Sci. 2025, 12, 1686241. [Google Scholar] [CrossRef] [Scilit] [PubMed]
- Arcidiacono, C. Engineered Solutions for Animal Heat Stress Abatement in Livestock Buildings. Agric. Eng. Int. CIGR J. 2018, 20, 1–22. [Google Scholar]
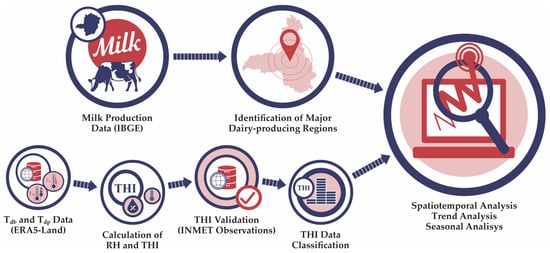
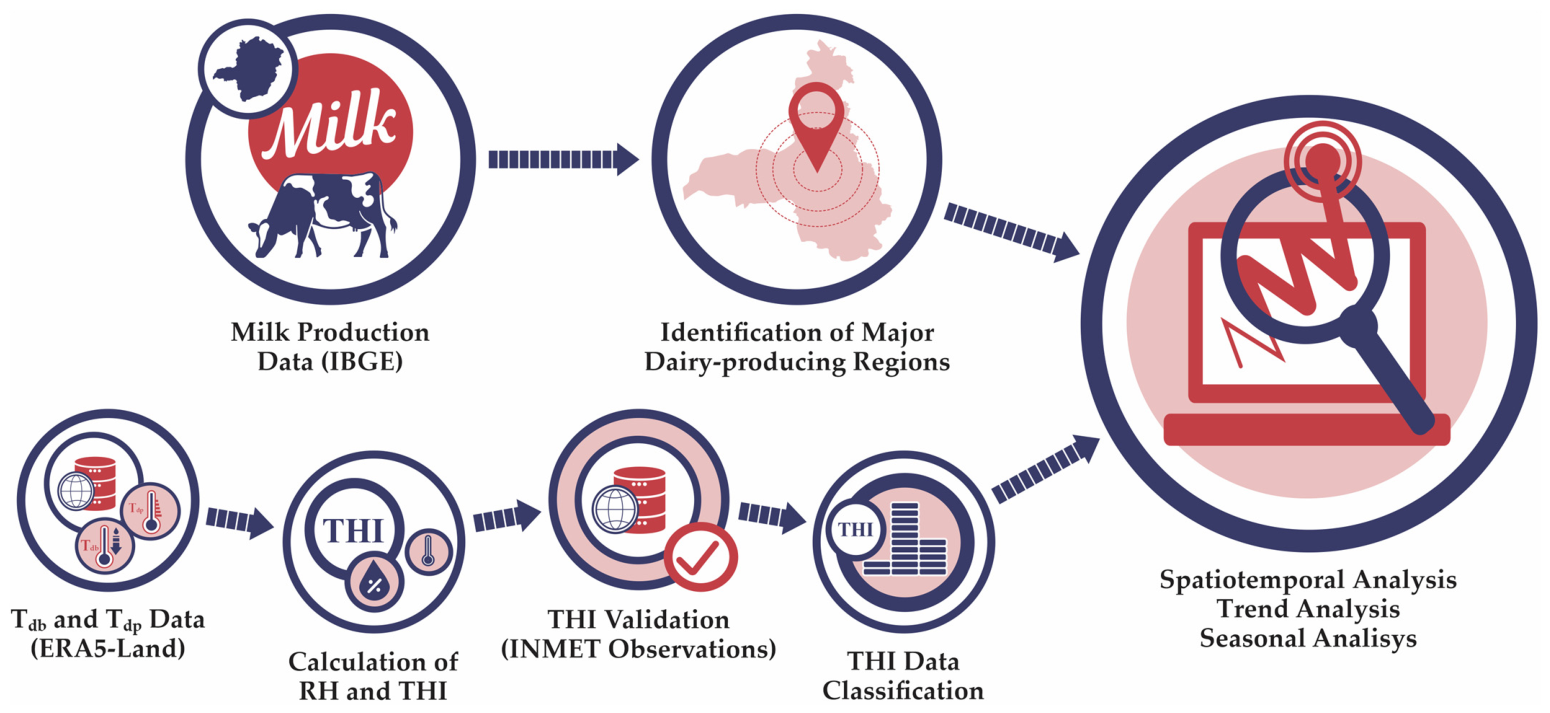
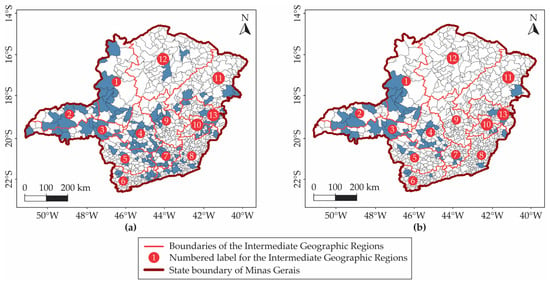
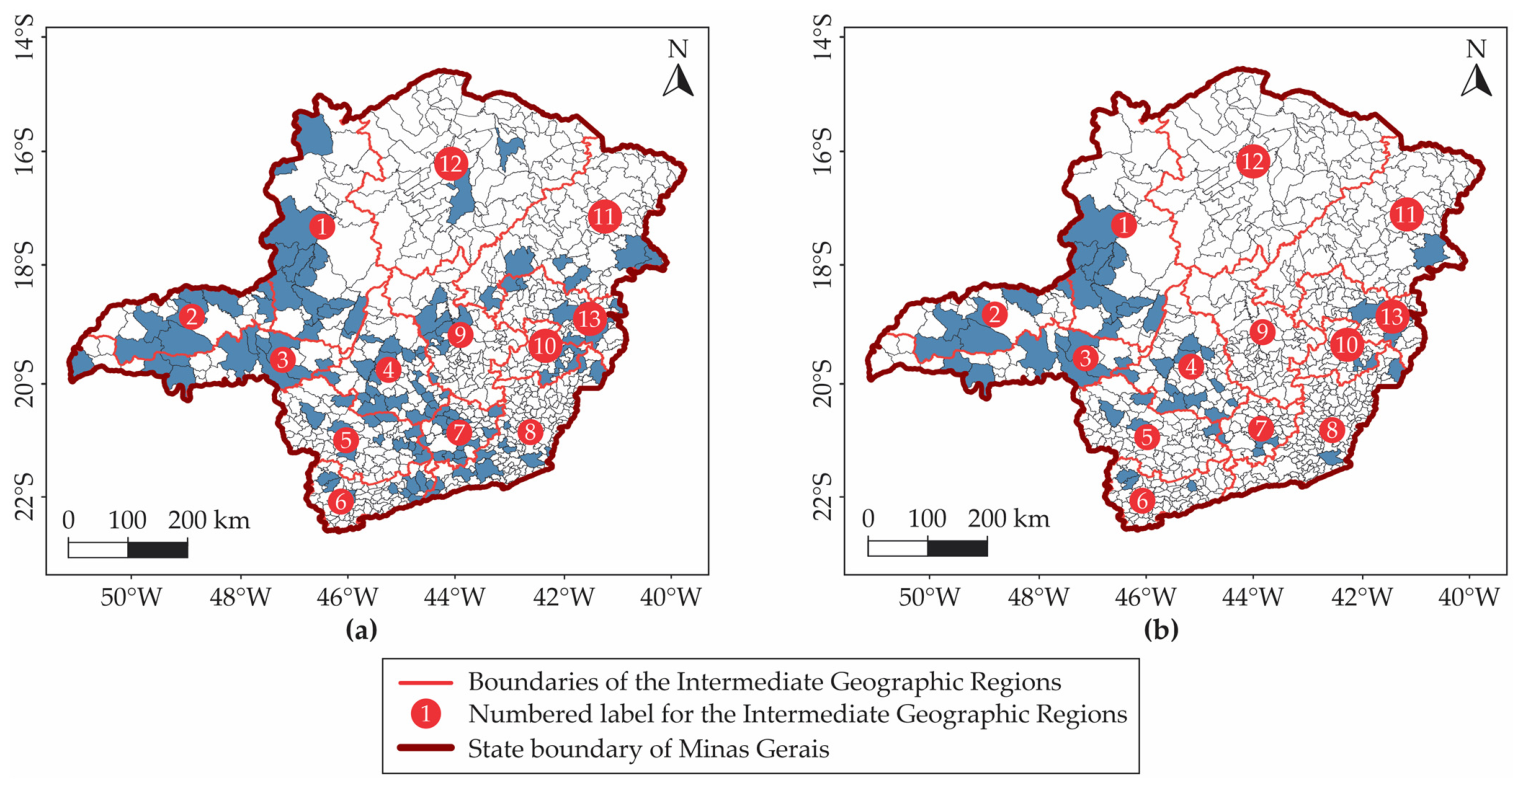
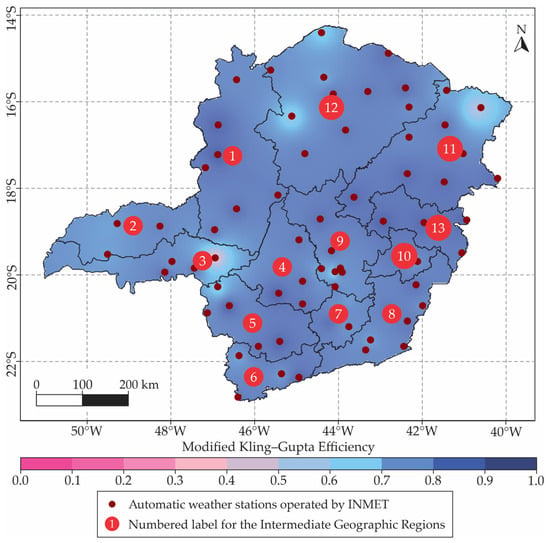
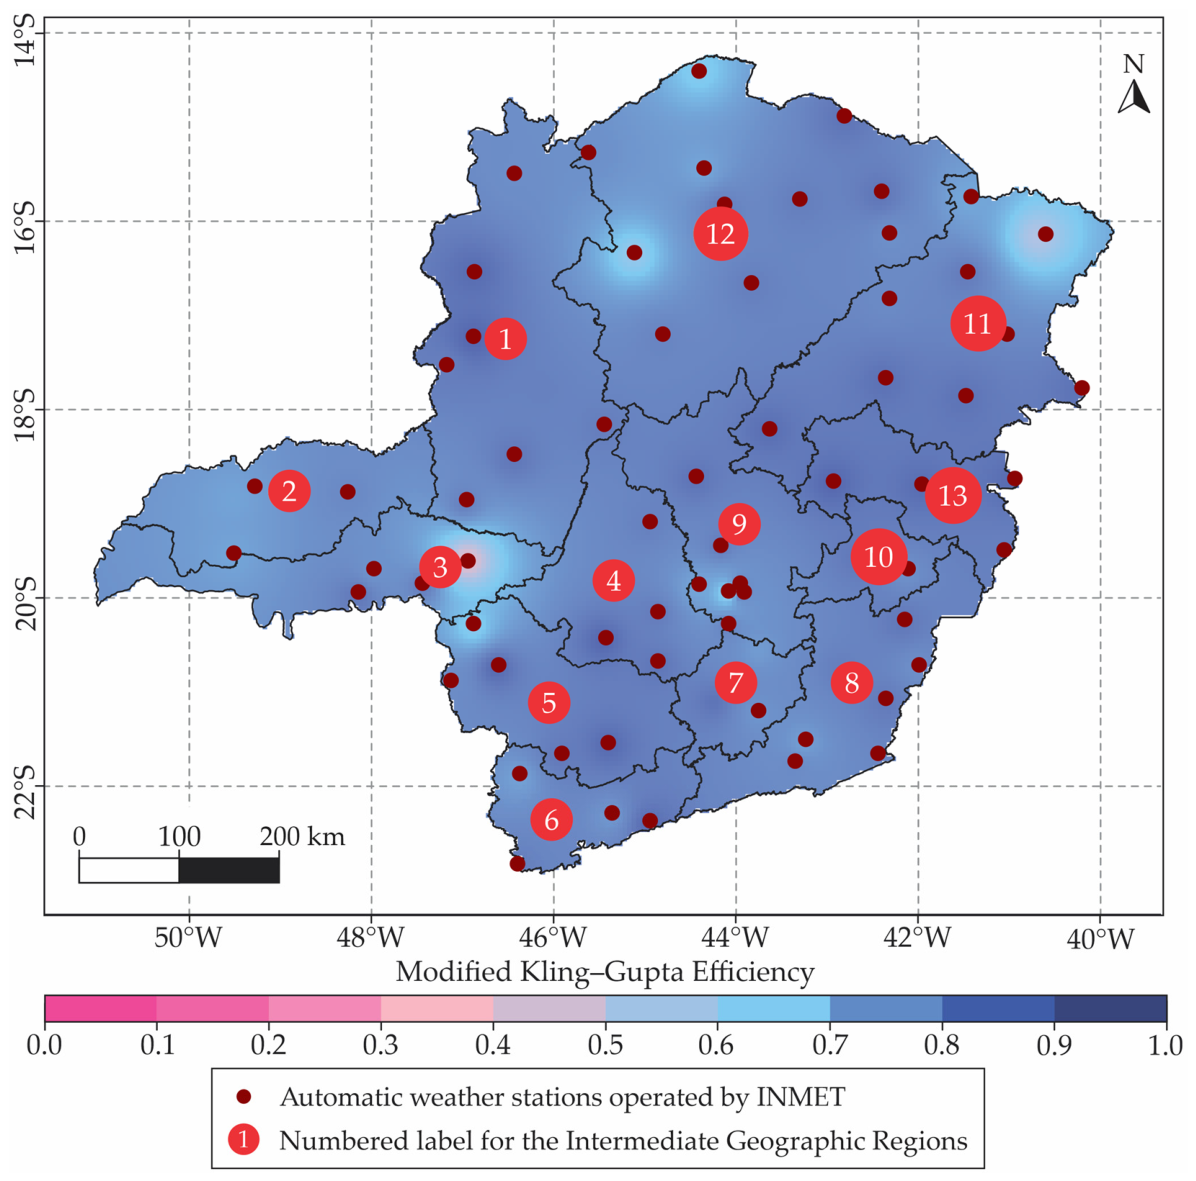
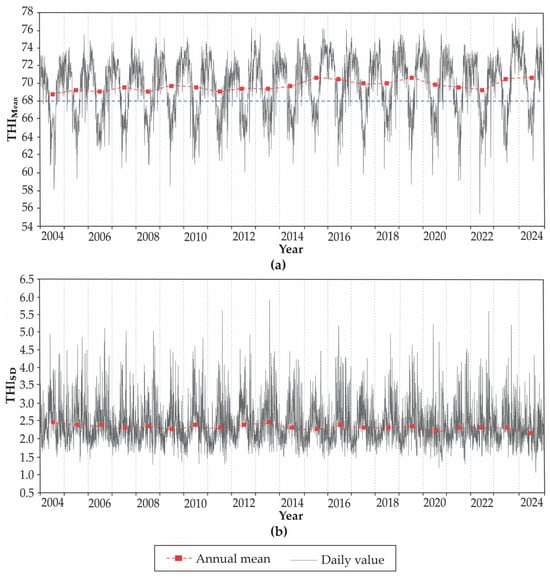
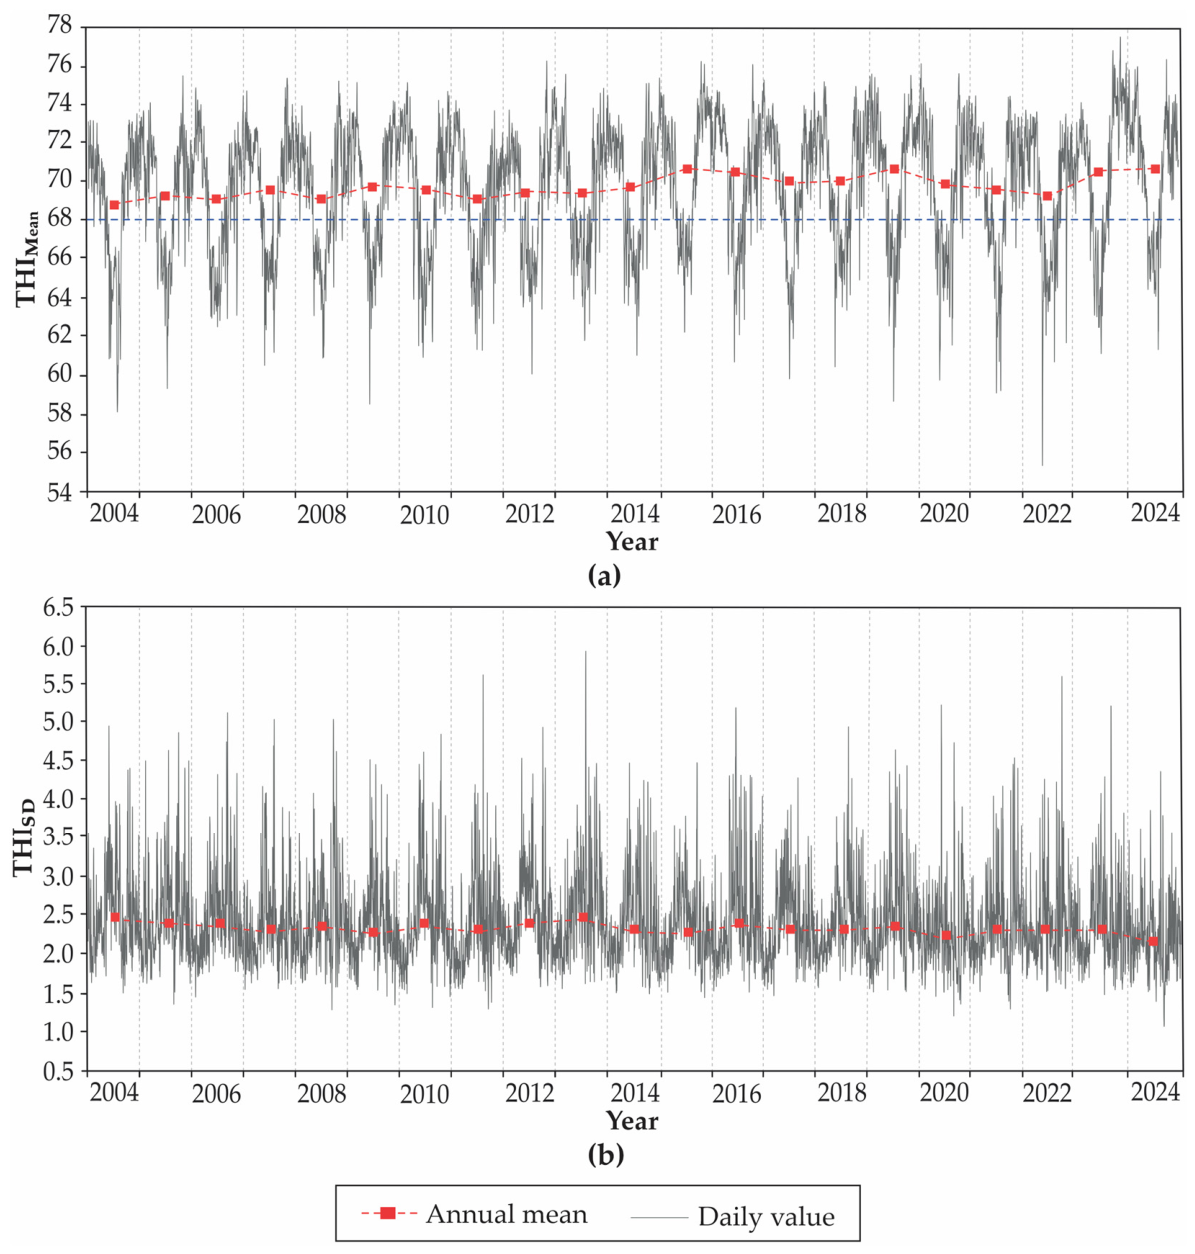
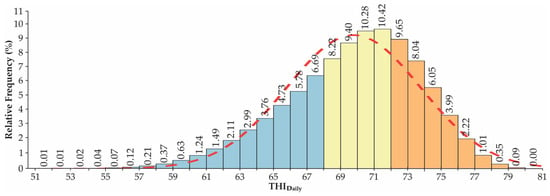
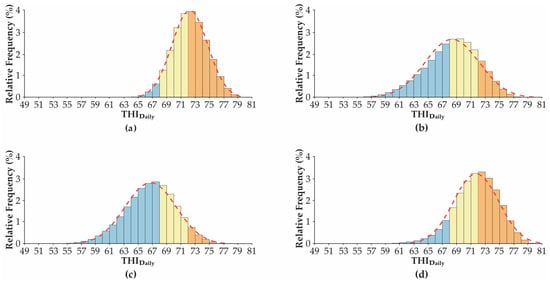
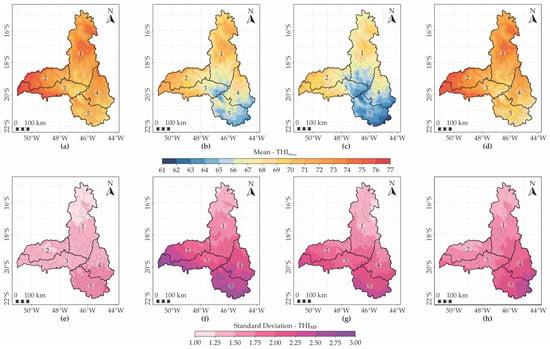
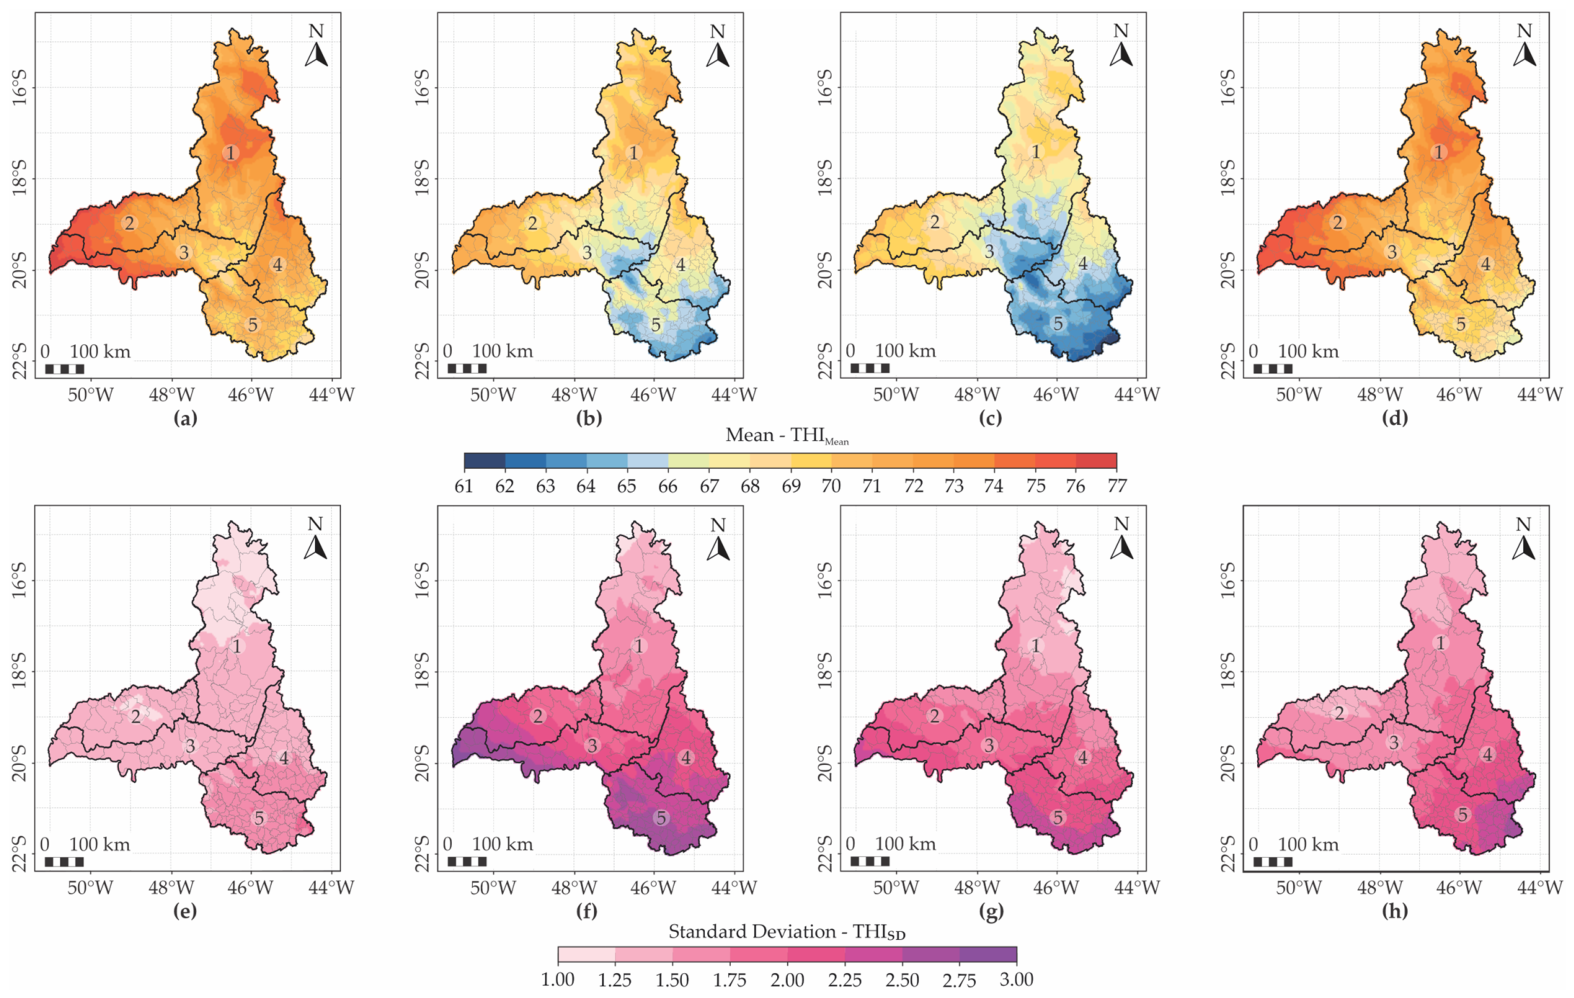
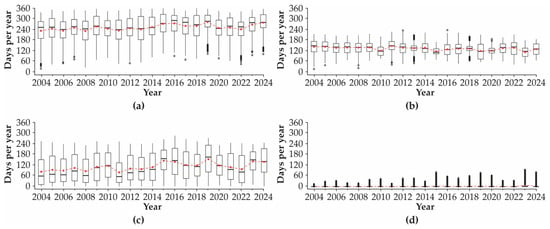
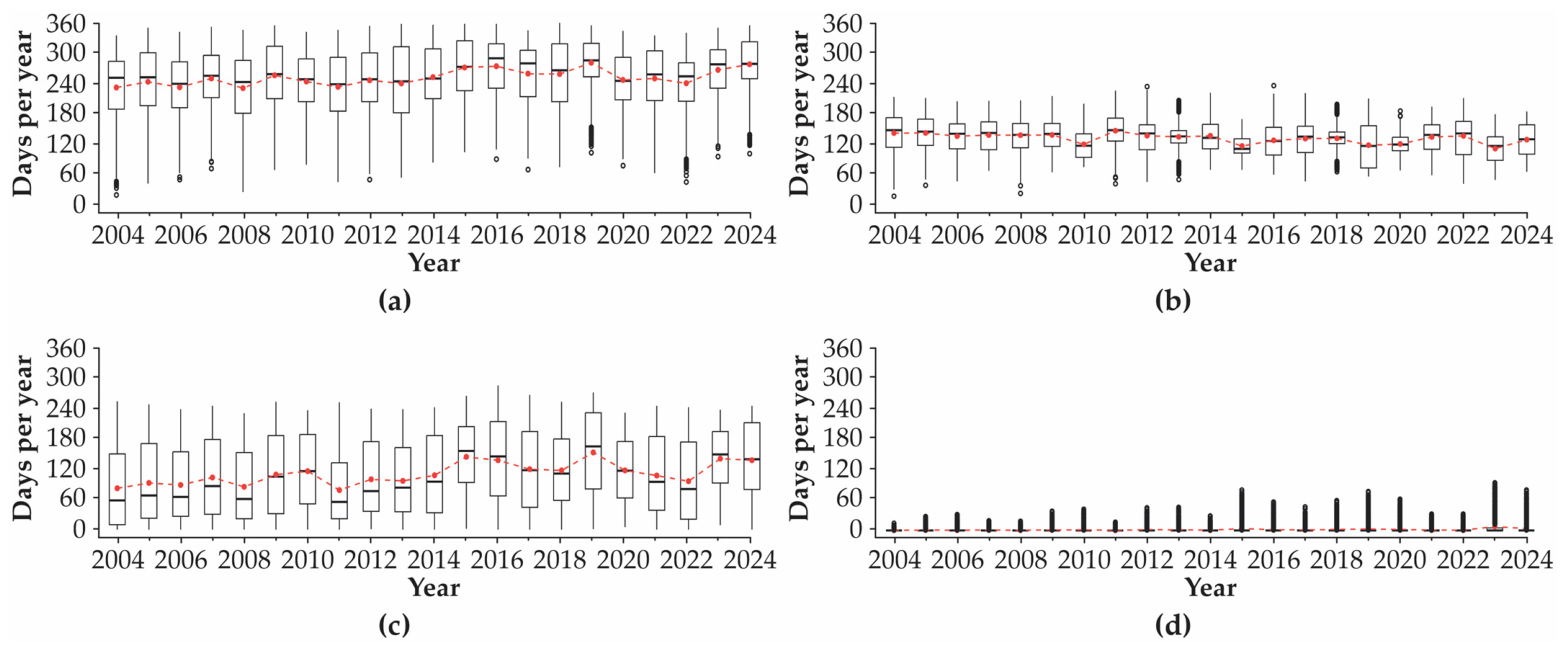
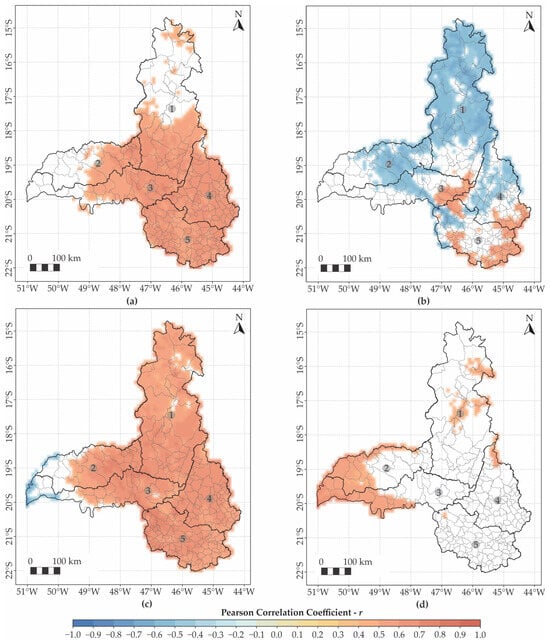
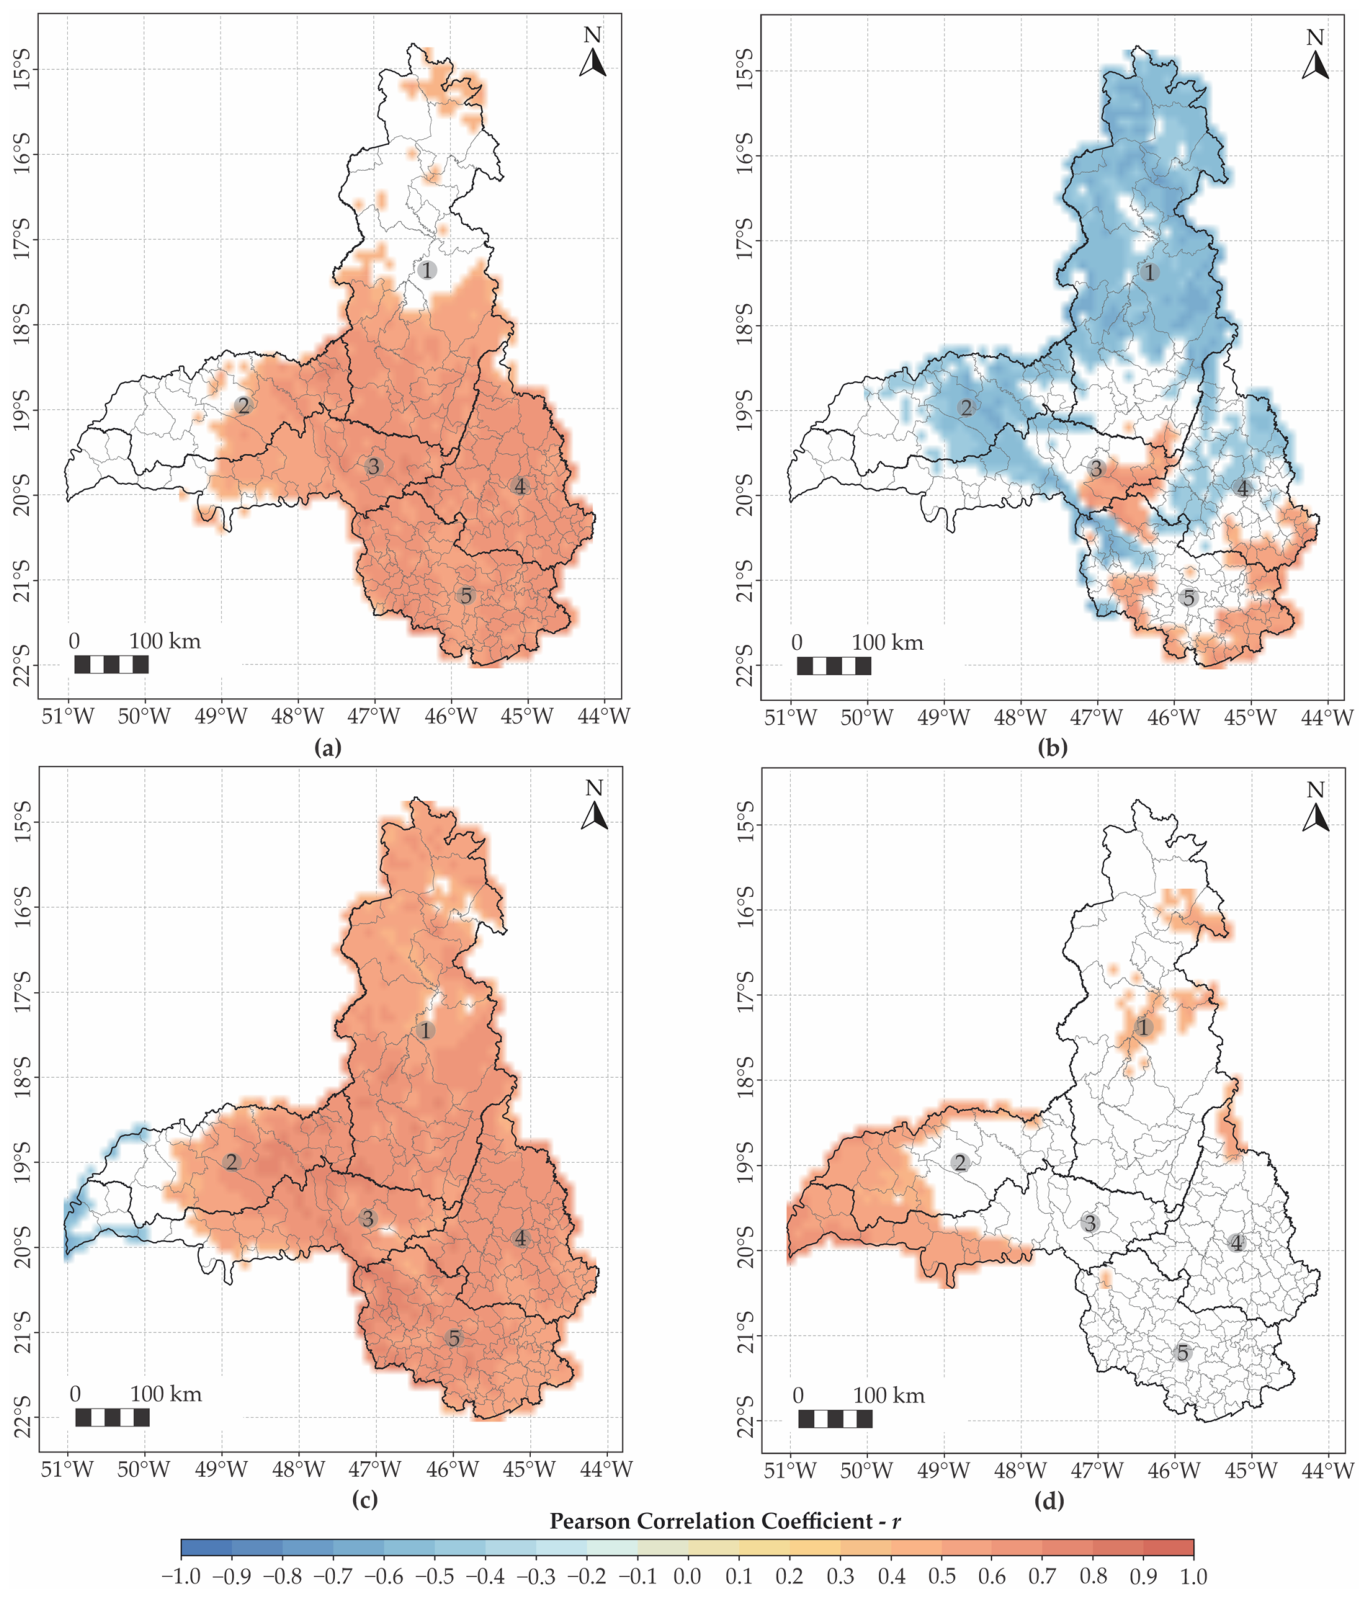

Disclaimer/Publisher’s Note: The statements, opinions and data contained in all publications are solely those of the individual author(s) and contributor(s) and not of MDPI and/or the editor(s). MDPI and/or the editor(s) disclaim responsibility for any injury to people or property resulting from any ideas, methods, instructions or products referred to in the content. |
© 2026 by the authors. Licensee MDPI, Basel, Switzerland. This article is an open access article distributed under the terms and conditions of the Creative Commons Attribution (CC BY) license.