Article

YieldNet: A Lightweight YOLOv8n Enhancement for Immature Green Tomato Detection in UAV Images: Real-Time Edge Demonstration Toward Pre-Harvest Yield Estimation


Department of Artificial Intelligence, School of Automation, Beijing Information Science and Technology University, No. 12 Qinghe Xiaoying East Road, Haidian District, Beijing 100192, China
*
Author to whom correspondence should be addressed.
AgriEngineering 2026, 8(8), 311; https://doi.org/10.3390/agriengineering8080311
Submission received: 9 May 2026 / Revised: 18 July 2026 / Accepted: 22 July 2026 / Published: 28 July 2026

Abstract

Accurate early-stage monitoring of greenhouse tomatoes is essential for reducing post-harvest losses, with reliable detection of immature green tomatoes being the core challenge. However, these fruits are small, heavily occluded, and chromatically highly similar to foliage, making detection from low-altitude UAV imagery extremely difficult, while onboard edge processors impose stringent power and weight constraints. To address this, we propose YieldNet, a lightweight framework that introduces targeted enhancements to vanilla YOLOv8n: the backbone is replaced with ShuffleNetV2 to reduce computation; Efficient Channel Attention (ECA) modules are embedded after the P3–P5 layers in the neck for channel recalibration; and PIoU v2 loss is adopted for bounding-box regression. This study focuses on immature green tomatoes in low-altitude UAV imagery and evaluates the detector on an RK3588 edge device. The model is evaluated on both a self-collected real-world UAV dataset comprising 600 low-altitude green-tomato images and a public multi-ripeness benchmark. Compared with the YOLOv8n baseline, YieldNet achieves relative improvements in mAP@50-95, Recall, and F1-score by 18.9%, 6.1%, and 5.8%, respectively, on the Tomato-Recog public validation set, and enhances Recall, F1-score, and Precision by relative gains of 4.3%, 4.0%, and 3.8%, respectively, on the GreenTomato-UAV validation set, while increasing parameters only from 3.0 M to 3.3 M and reducing FLOPs from 8.1 G to 8.0 G. A representative live camera-to-display reading on the Orange Pi 5 Max was 37.6 FPS with 86 ms end-to-end latency. YieldNet supplies countable detections for future pre-harvest yield-estimation studies; UAV flight deployment, fruit-size estimation, and harvest-weight validation were not evaluated.

1. Introduction

Tomatoes are widely cultivated worldwide and possess significant economic potential. According to the analysis by Data Bridge Market Research, the global tomato market is expected to achieve a compound annual growth rate (CAGR) of 3.2% during the period from 2023 to 2030 (Data Bridge Market Research, Global Tomatoes Market–Industry Trends and Forecast to 2030, Market Report, 2022. Available online: https://www.databridgemarketresearch.com/reports/global-tomatoes-market (accessed on 15 August 2025)). However, numerous studies have pointed out that there are substantial post-harvest losses in the tomato vegetable value chain [1]. As a fruit with high water content, tomatoes are prone to rot; farmers often cannot accurately anticipate market fluctuations before planting. In order to reduce post-harvest losses, it is crucial to align production with market demand before crop picking and to market harvested tomatoes promptly after picking [2]. The key here lies in reliable and timely yield prediction. However, traditional prediction methods rely heavily on manual work, requiring experienced farmers to enter the planting area frequently for data collection; this process is time-consuming and laborious [3]. UAV technology and machine vision offer a way to automate this task [4].
UAVs, also known as drones, have been increasingly used in precision agriculture [5]. The combination of imaging and UAV technology has extended agricultural UAV applications from crop protection and sowing to crop monitoring [6]. Drones can process captured images in real time through their onboard camera units and computing units, thereby obtaining the number and coordinates of crop targets in the camera field of view [7]. Combined with flight planning, systematic imaging and identification of crops in the planting field can be carried out [8]. The application of this technology can reduce the labor costs of agricultural management. Through automated crop monitoring and data collection by drones, farmers no longer need to frequently enter the field for manual inspection and recording [9].
YOLO (You Only Look Once) is a single-stage detector. Its working principle is that it first divides the image into grids, performs a single convolutional neural network forward pass, and directly outputs the class confidence and position coordinates of the target [10]. Different from traditional detectors, it merges the two separately processed steps of proposing candidate boxes and extracting features into one step; this improves inference speed while maintaining detection accuracy. YOLO has continued to evolve since it was proposed: from the original v1 version to subsequent versions [11], it has successively added improvements such as residual connections and feature pyramids; these changes improved performance on small or occluded objects. Moreover, considering the differences in deployment devices, it also provides five model sizes of n/s/m/l/x, so users can choose a suitable version according to the different performance of different devices; the lightest n (nano) variant was selected here as the baseline for automatic green-tomato detection in UAV images [12].
In related research, Egi et al. used YOLOv5 combined with drones for greenhouse tomato detection and counting, and emphasized dataset construction and application validation [13]. Wang et al. reported improved reliability in yield estimation by improving YOLO11n and combining it with an optimized regional tracking and counting method, emphasizing the importance of combining detection and counting [14]. The DCFA-YOLO proposed by Chai et al. achieved high-precision detection of cherry tomato clusters through a dual-channel cross-feature fusion attention module, illustrating the use of attention for dense small-target detection [15]. ShuffleNetV2-based detectors have also been explored for lightweight apple and tomato detection [16,17]. Together, these studies cover UAV acquisition, counting, dense-target attention, and lightweight fruit detection; evaluation focused specifically on immature green tomatoes remains limited [18]. Green tomatoes, as the initial stage of tomato fruit growth, can be detected and counted to provide inputs for later yield estimation; this study does not implement count-to-yield conversion. However, green-tomato detection presents three main difficulties: similarity to foliage in color and texture can cause false positives and missed detections; occlusion, fruit overlap, and illumination changes can affect model stability; and UAV edge processing constrains model size and computational complexity [19]. YieldNet addresses this setting by combining a ShuffleNetV2 backbone, ECA attention, and PIoU v2 within YOLOv8n.
To address these challenges, this paper proposes a lightweight model for green tomato detection in UAV images—YieldNet. YieldNet is based on YOLOv8n and is evaluated on the self-built GreenTomato-UAV and public Tomato-Recog datasets. The main contributions are as follows:
  • We construct a dedicated greenhouse immature green tomato dataset captured by low-altitude UAVs, providing a realistic and challenging benchmark for early-stage fruit detection.
  • We modify YOLOv8n by replacing its backbone with ShuffleNetV2, integrating ECA modules in the neck, and adopting PIoU v2 loss. Under the present protocol, the final model reports higher validation metrics than YOLOv8n, with 0.3 M more parameters and 0.1 G fewer FLOPs.
  • We demonstrate YieldNet on an RK3588-based Orange Pi 5 Max, where the live UVC pipeline provides countable detections for future pre-harvest yield-estimation studies.

2. Materials and Methods

2.1. Dataset and Data Collection

To evaluate the proposed model on the in-domain data and an additional public benchmark, two datasets were used:
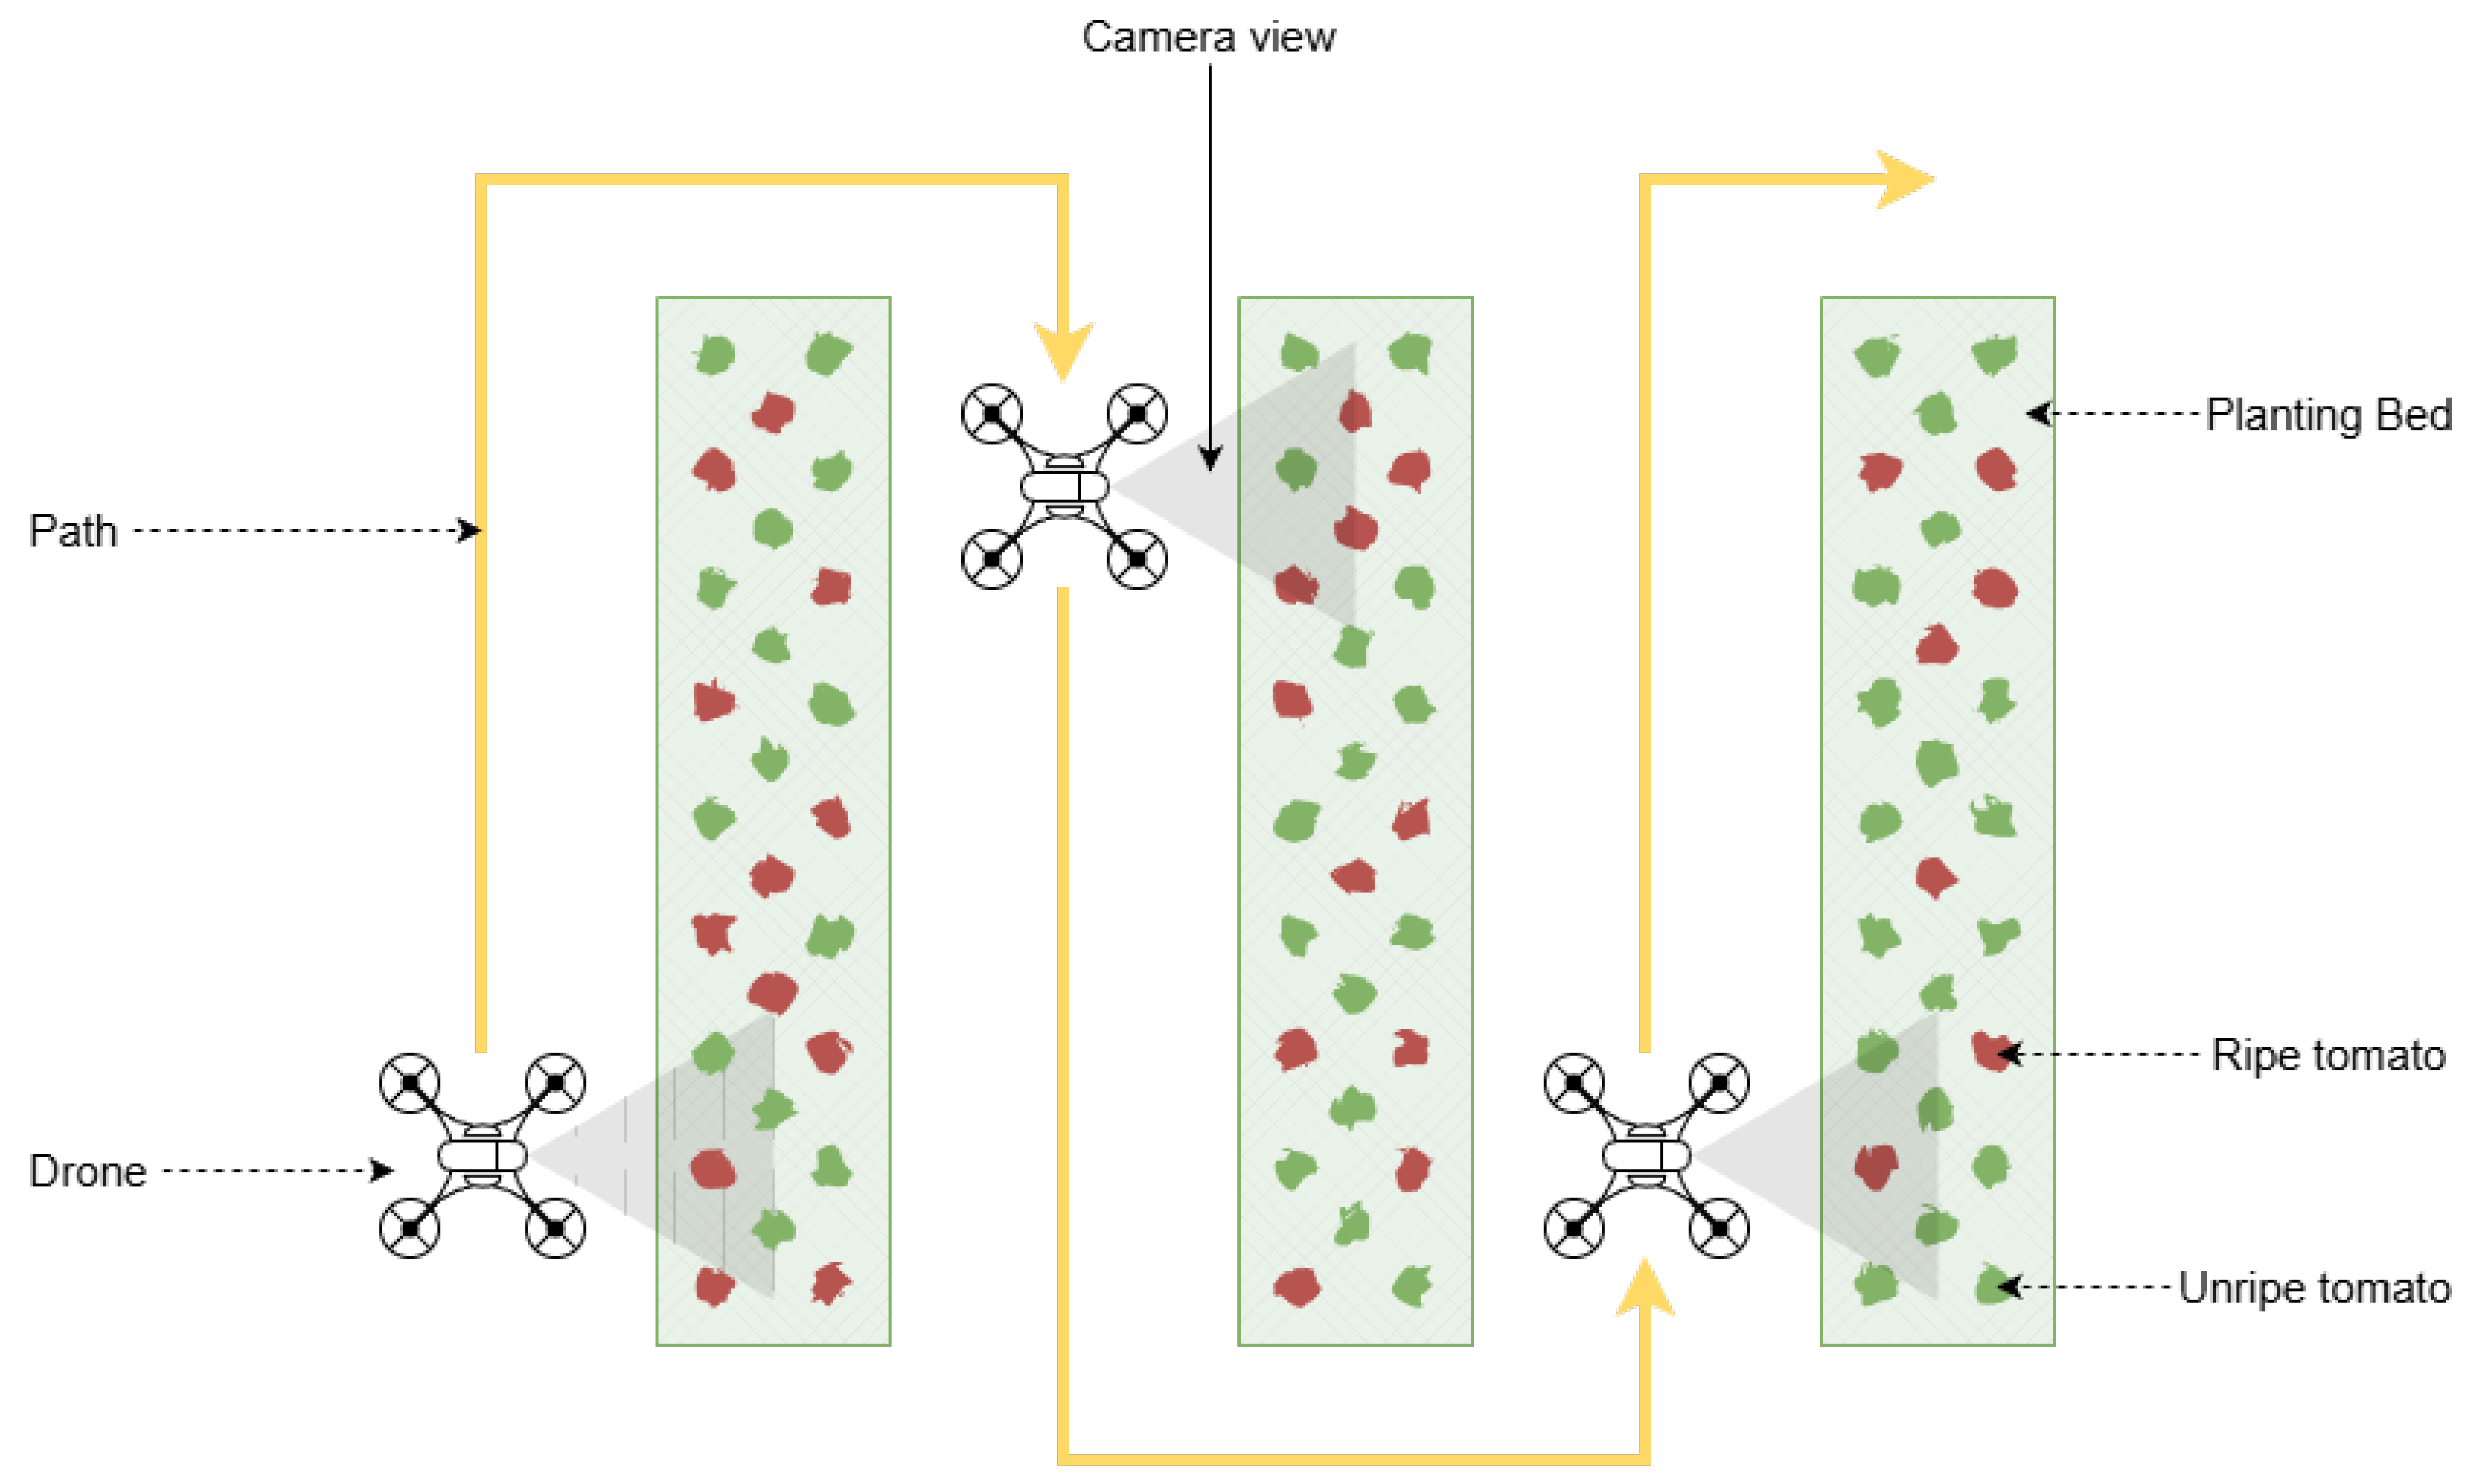
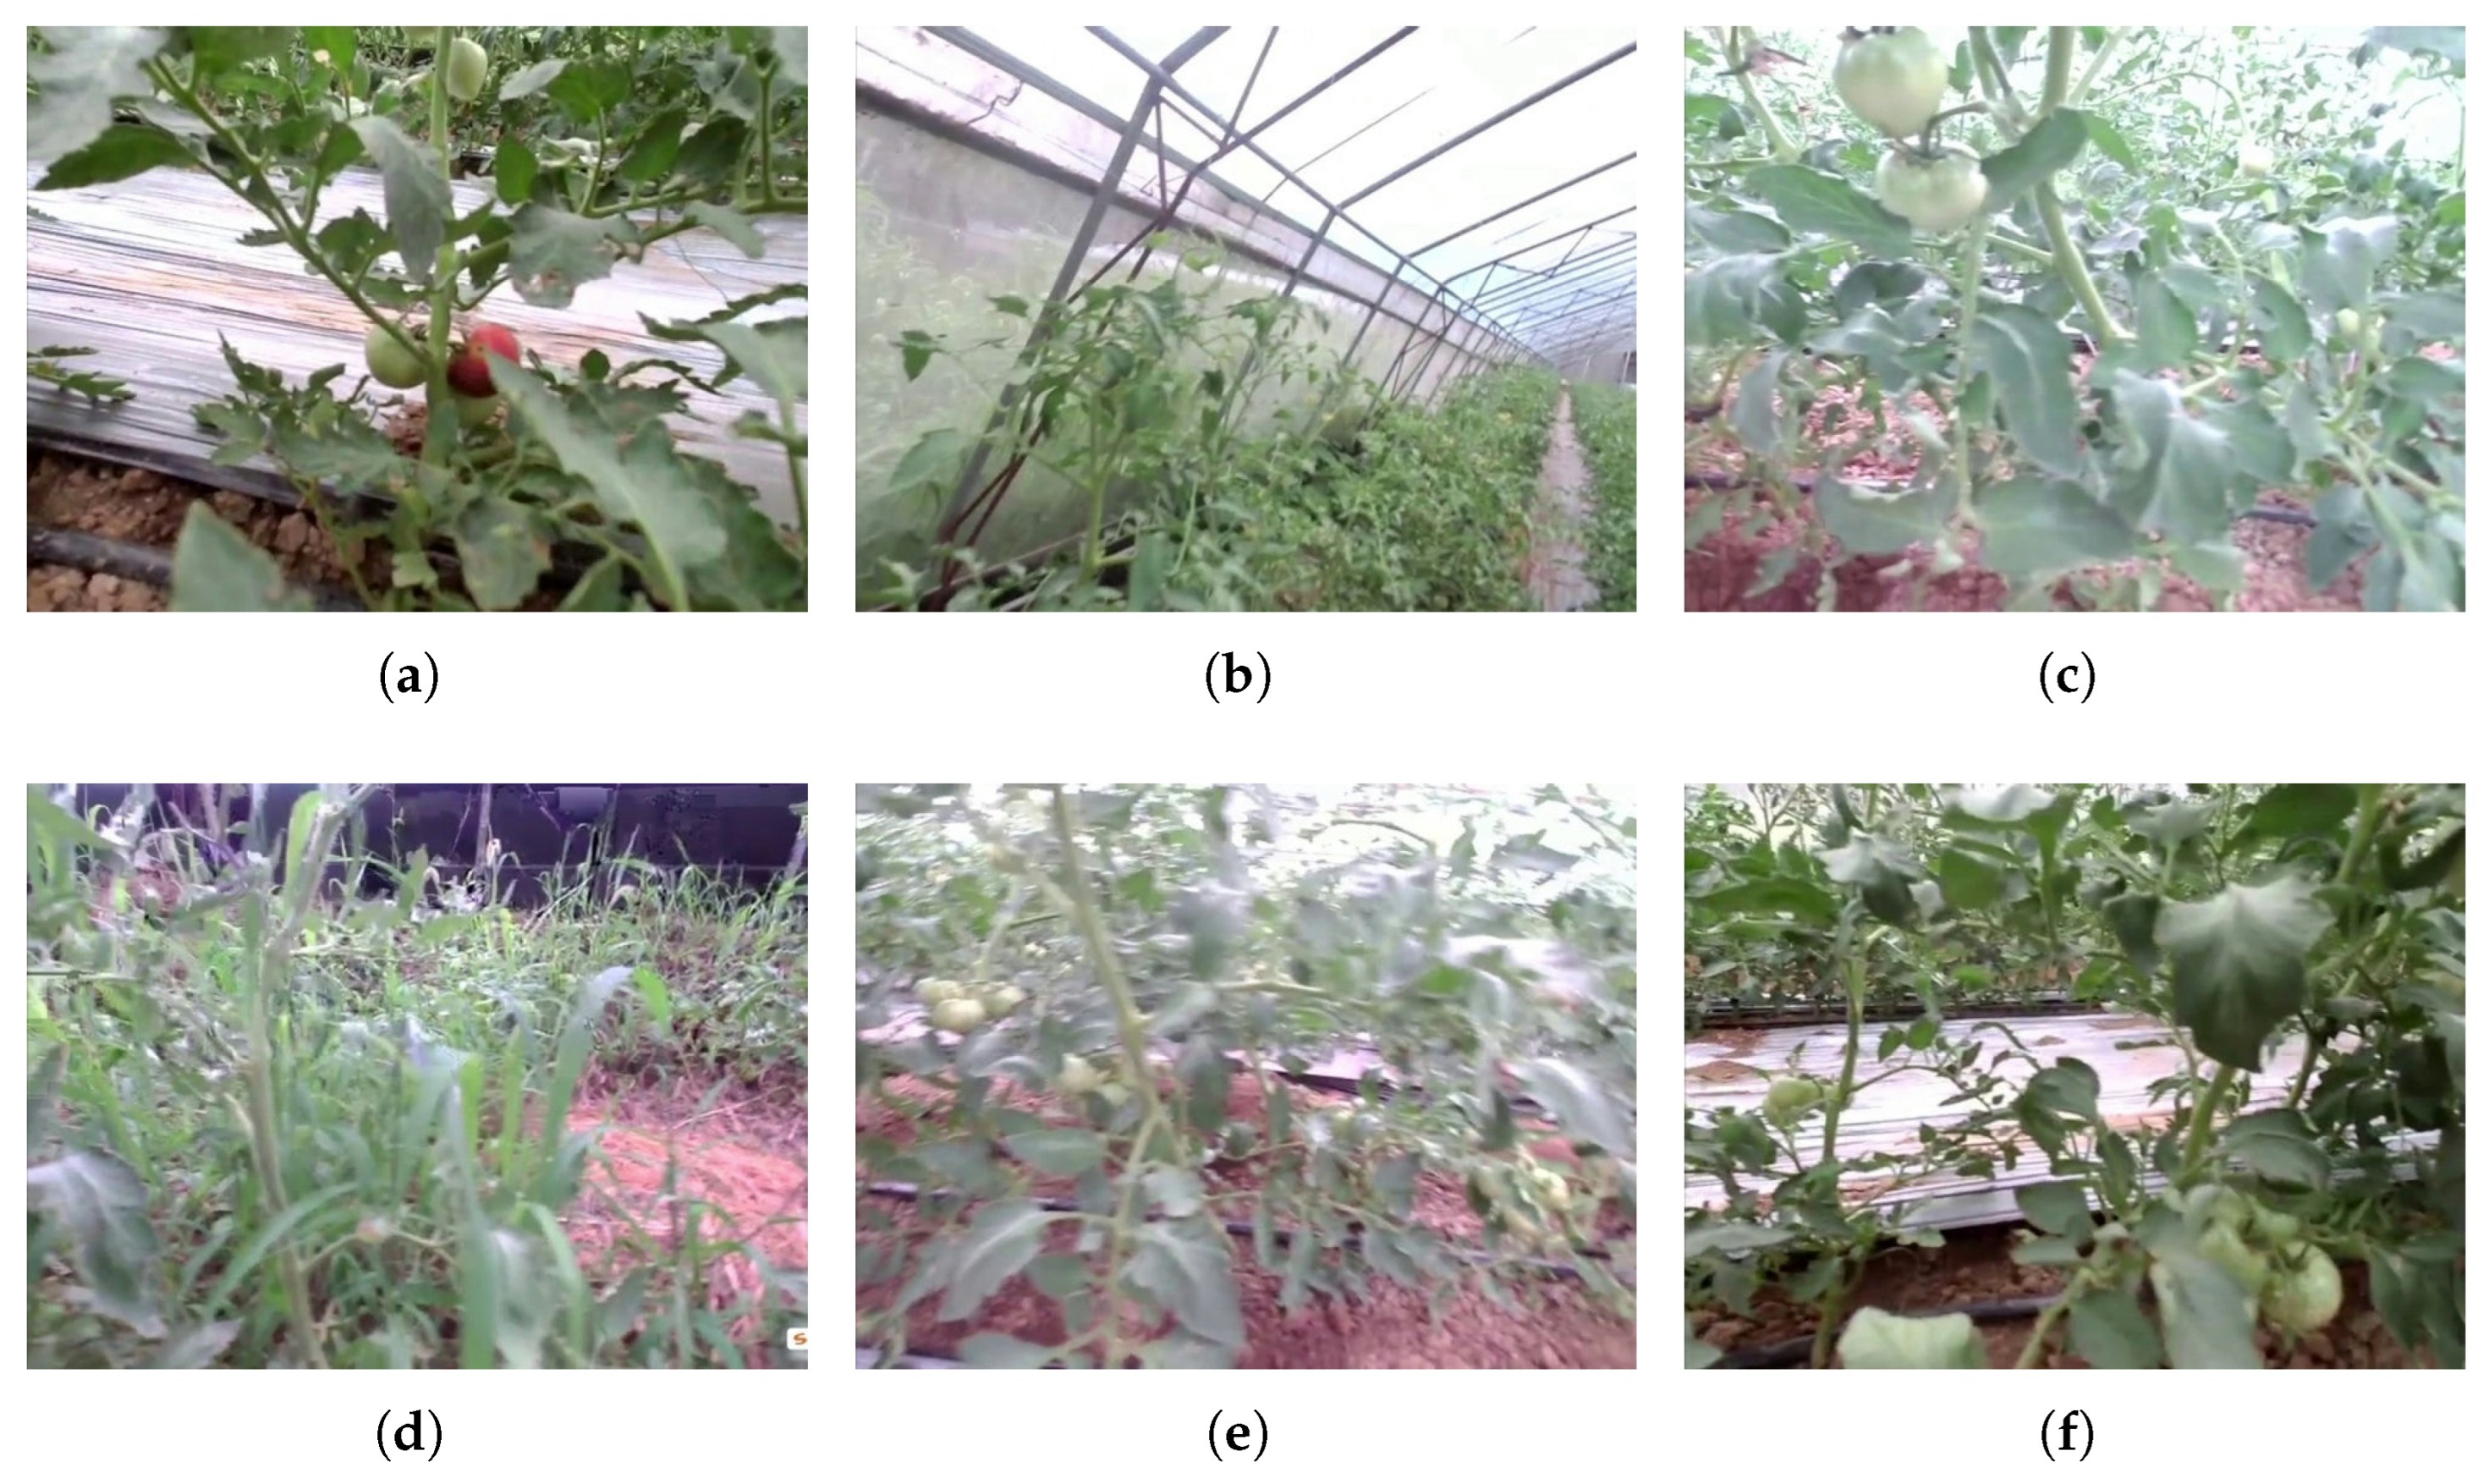
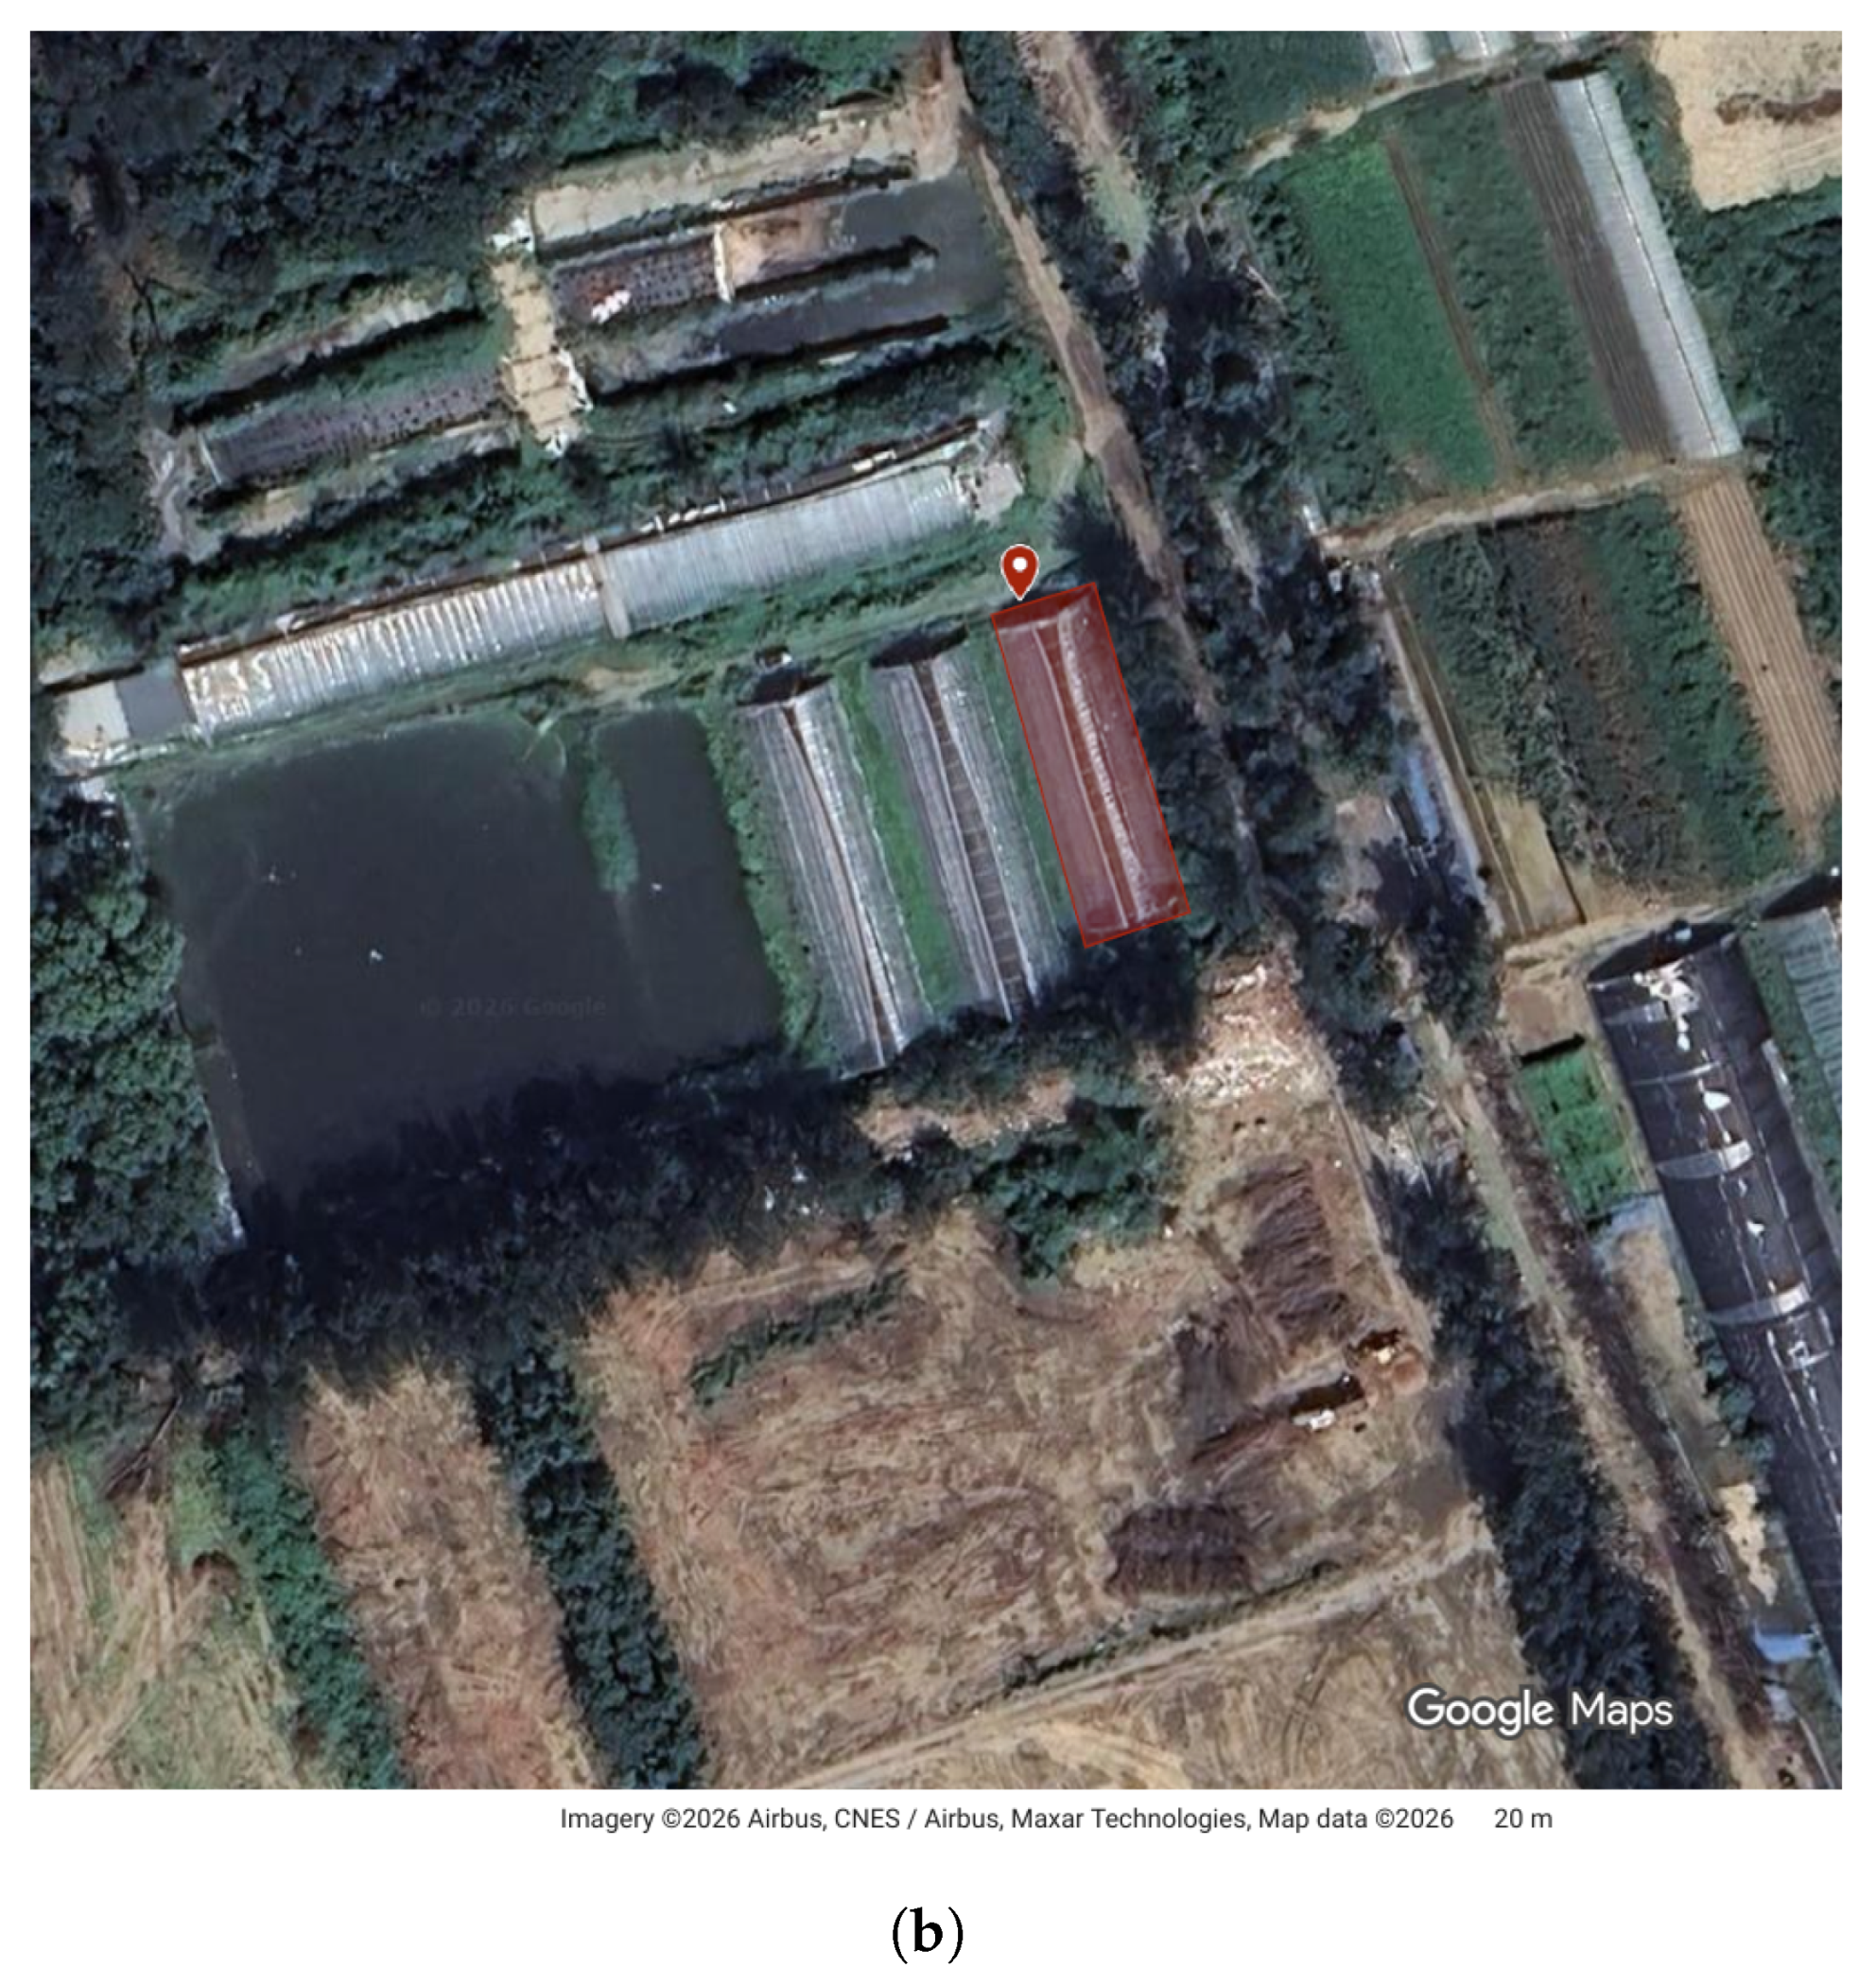
  • GreenTomato-UAV Dataset (Self-Built): Images were collected in a greenhouse at the China Nongjiyuan Agricultural Machinery Test Station (shown in Figure 1), 577M+7X2, Changping District, Beijing, China, 102206, on 19 July 2025, between 16:30 and 18:00. An F450 quadcopter equipped with a 640 × 480-pixel camera was flown at 0.5–0.8 m above the canopy (this height range corresponds to the area where tomato fruits are most densely concentrated in this greenhouse’s tomato cultivation). The 1.5 h interval was the total collection session, not a recorded continuous flight; per-sortie flight times and battery-discharge data were not logged. The UAV traversed between planting beds following the serpentine pattern illustrated in Figure 2 for image acquisition. Approximately 80,000 raw frames were captured. Scenes included soil, stakes, and weeds; most targets were green, unripe tomatoes exhibiting frequent overlapping, leaf occlusion, dense planting, and motion blur caused by UAV movement. Figure 3 illustrates those key challenges encountered in the dataset. An open-source annotation tool, Labelme, was employed, with five annotators independently labeling objects using rectangular bounding boxes. After manual review and cleaning, 600 images were retained (100 without targets). The target-free images were retained as negative samples.
  • Tomato-Recog Public Dataset: A publicly available tomato dataset consisting of 1986 images covering green, turning, and red tomatoes was used for an external multi-ripeness benchmark. We divided all images into 1390 training images and 596 validation images at a 7:3 ratio; the latter is termed the Tomato-Recog public validation set below. The dataset includes official YOLO-format annotations and is fully open-source.

2.2. Incremental Data Augmentation

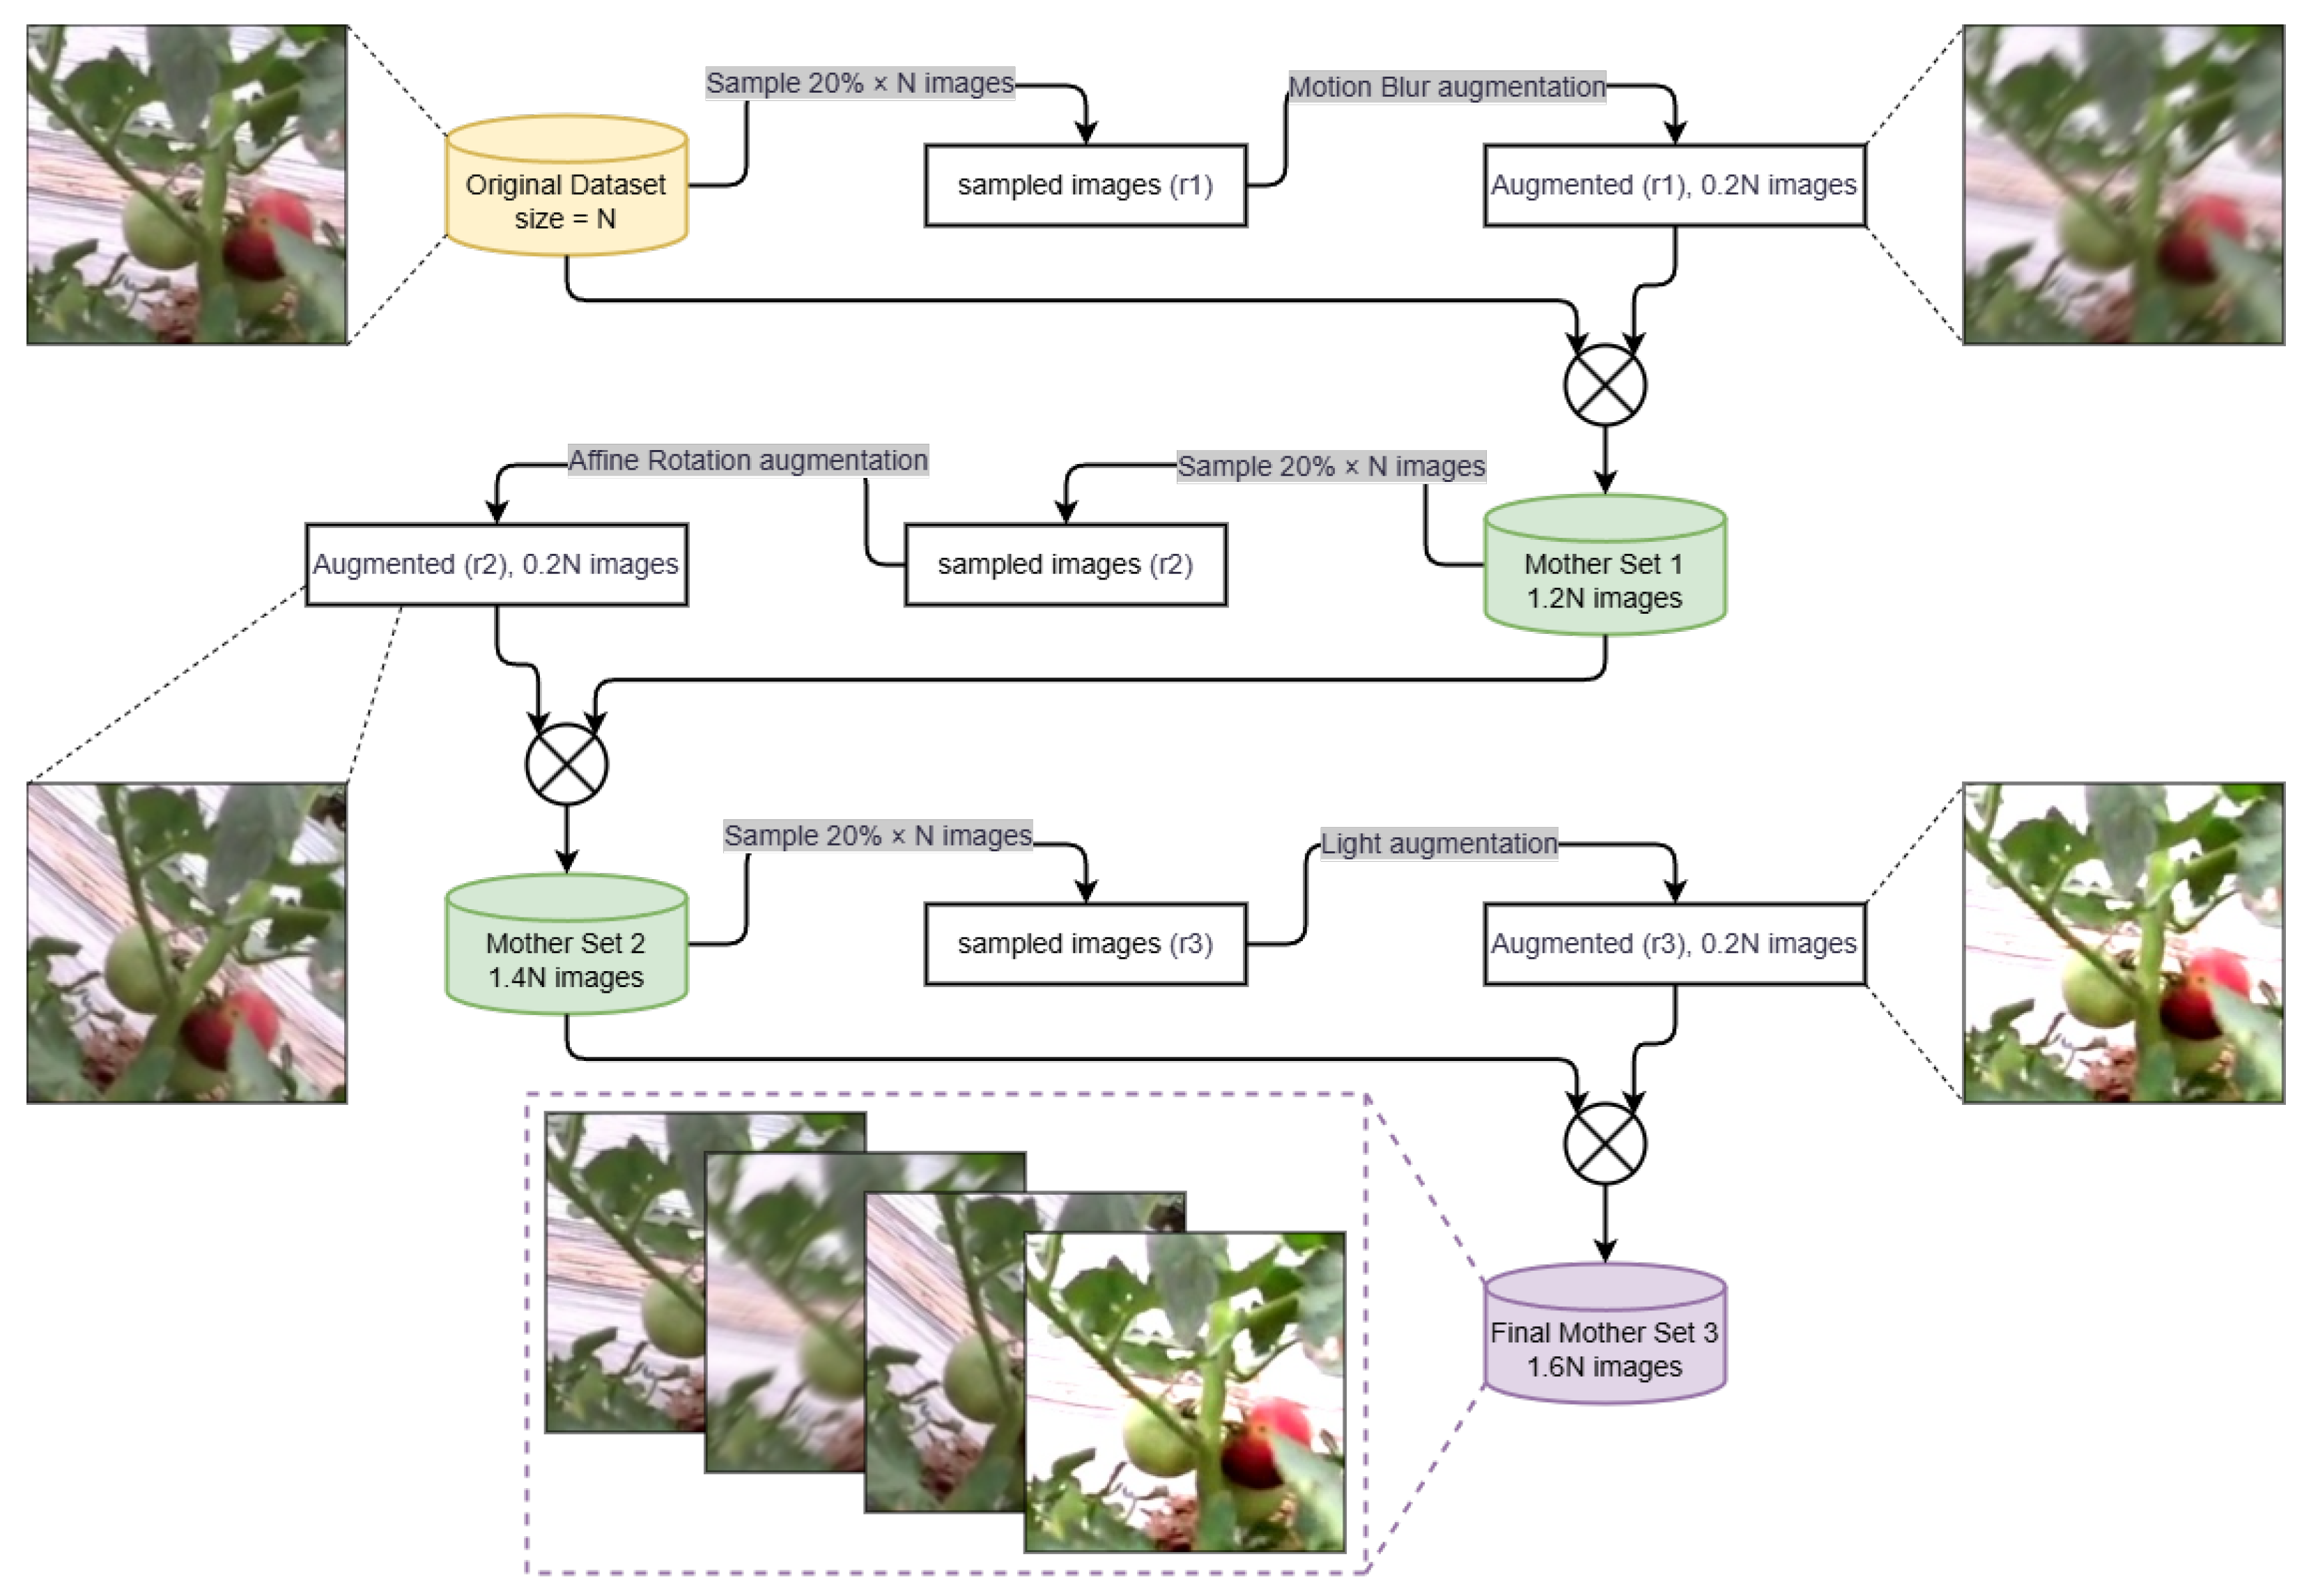
To expand the representation of motion blur, viewing-angle variation, and illumination variation in the limited training set, a label-driven, proportional, multi-stage augmentation strategy was implemented using Python and the imgaug library (version 0.4.0; A. Jung and others, imgaug: Image augmentation for machine learning experiments, GitHub repository, 2017–2025. Available online: https://github.com/aleju/imgaug (accessed on 17 October 2025)). The key idea is:
  • Proportional Sampling: In each augmentation round, the number of images to be augmented is calculated as a fixed proportion (20%) of the original dataset size, while images are randomly sampled from the current dataset (i.e., the master set including all previously augmented images). This procedure permits cumulative combinations of transformations while expanding the training set.
  • Augmentation Operations: Each sampled image undergoes three successive augmentation steps:
    • Motion Blur: Kernel size of 15, with the blur angle randomly chosen from [ 45 , 45 ] .
    • Affine Rotation: Rotation angle randomly selected from the range [ 30 , 30 ] .
    • Lighting Adjustment: Brightness and contrast scaling factors randomly set within [ 0.7 , 1.3 ] .
  • Dataset Management: For geometric transformations, bounding-box coordinates were updated with the images. Filenames were appended with the augmentation-round suffix (e.g., _r1, _r2), and each augmented set was merged into the mother set before the next round.
  • Cumulative Effect: Following three augmentation rounds, the overall dataset size grew by about 60% relative to the original, providing additional training examples for motion blur, rotation, and illumination variation. Color jittering and random cropping were not evaluated in this study. Mosaic augmentation was enabled during training and disabled for the final 10 epochs (close_mosaic=10).
The specific data augmentation workflow is illustrated in Figure 4.
A total of 600 images from the Self-Built dataset are first randomly divided into training and validation sets at a 7:3 ratio. Then, the training set images are augmented through the above process to obtain 672 images, finally resulting in 672 training images and 180 validation images, which is referred to as the GreenTomato-UAV validation set in subsequent sections.

2.3. Improvement in YieldNet Network

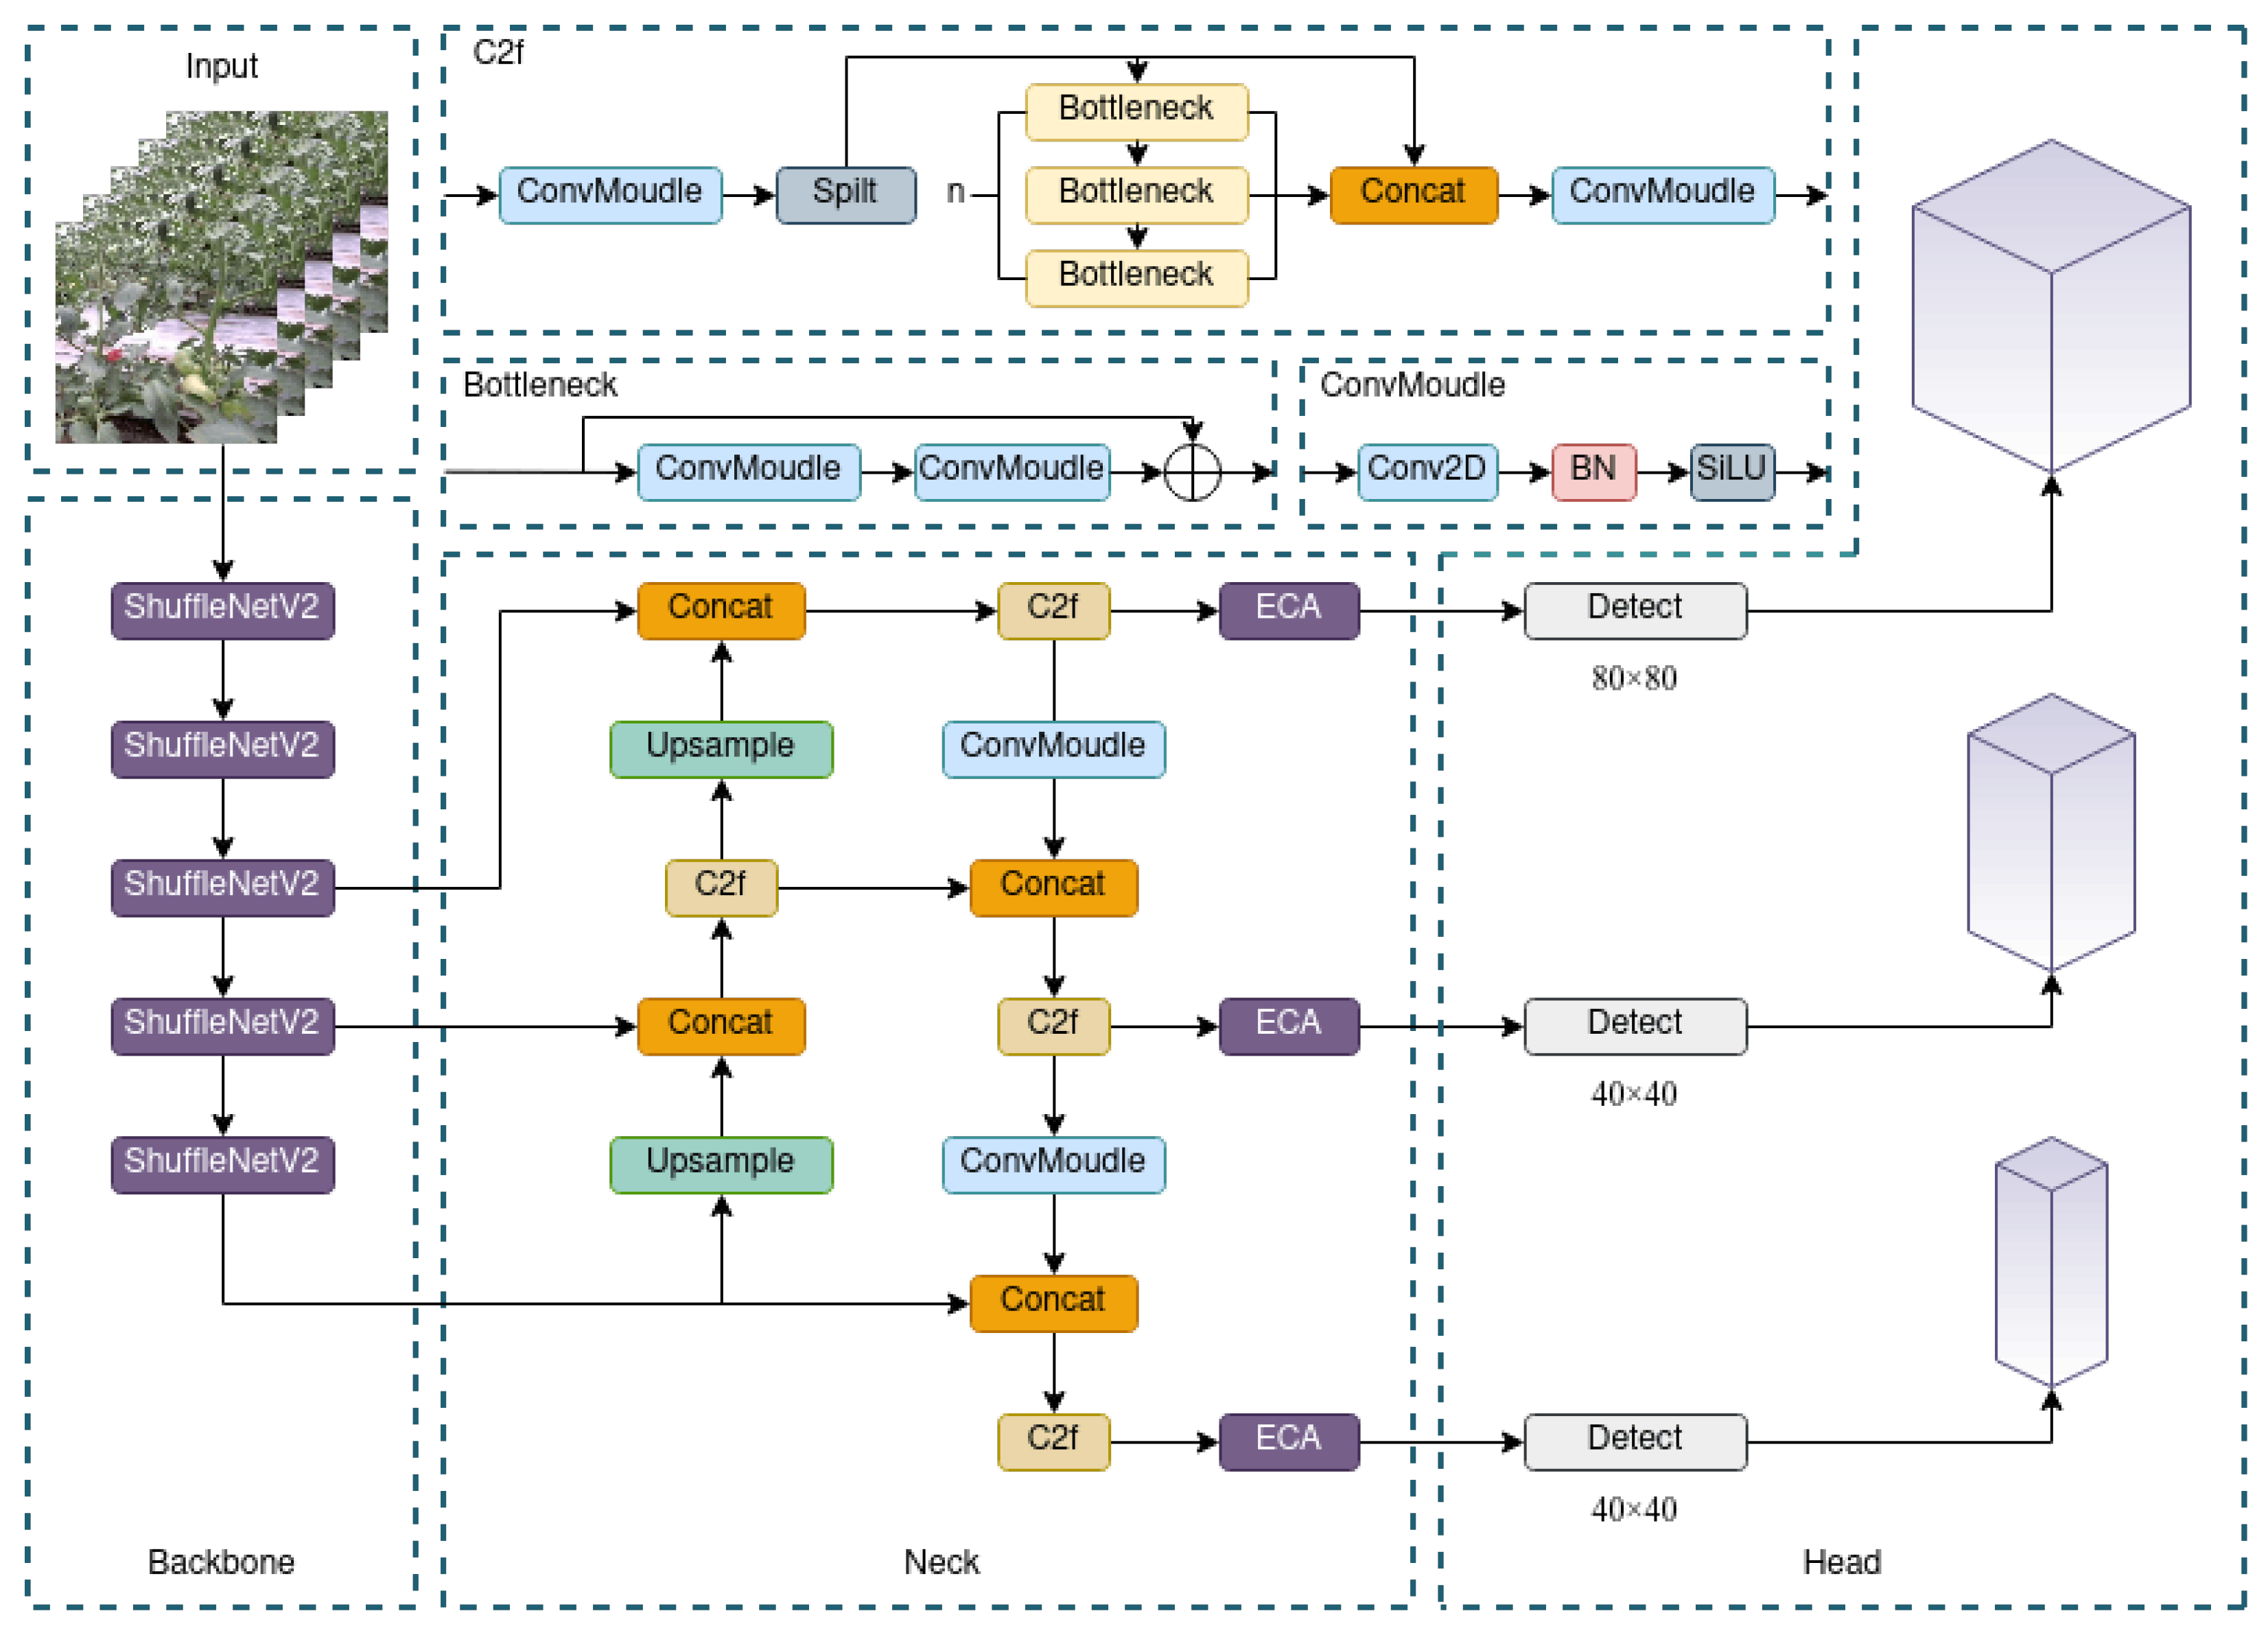
As depicted in Figure 5, the model is constructed based on the YOLOv8 detection framework, featuring P3–P5 feature outputs. In the backbone network, the original convolutional blocks are replaced with five ShuffleNetV2 [20] modules to reduce computational load while maintaining feature representation capability; modifications to the neck involve adding Efficient Channel Attention (ECA) [21] modules after each layer output to enhance inter-channel dependencies in the feature maps; finally, the head predicts bounding boxes at three scales (P3/8, P4/16, P5/32) through the Detect layer, enabling precise detection of objects of varying sizes. 
In addition to architectural enhancements, we also incorporate the Powerful-IoU v2 (PIoU v2) [22] strategy into the calculation of the loss function. PIoU v2 uses a size-adaptive penalty term and a non-monotonic focusing mechanism for bounding-box regression. Its effect in YieldNet is assessed in the ablation study.

2.3.1. Improvement in Backbone Network

YOLOv8n baseline uses CSPDarknet for hierarchical feature extraction. However, its deep residual modules introduce too many parameters, which slows down real-time inference on resource-limited UAV platforms. To solve this problem, we replace the backbone with ShuffleNetV2—a hardware-efficient architecture originally designed for mobile use. This architecture has been successfully used in applications such as apple detection [16] and tomato detection [17], and serves as an improvement over the original ShuffleNet V1 [23].
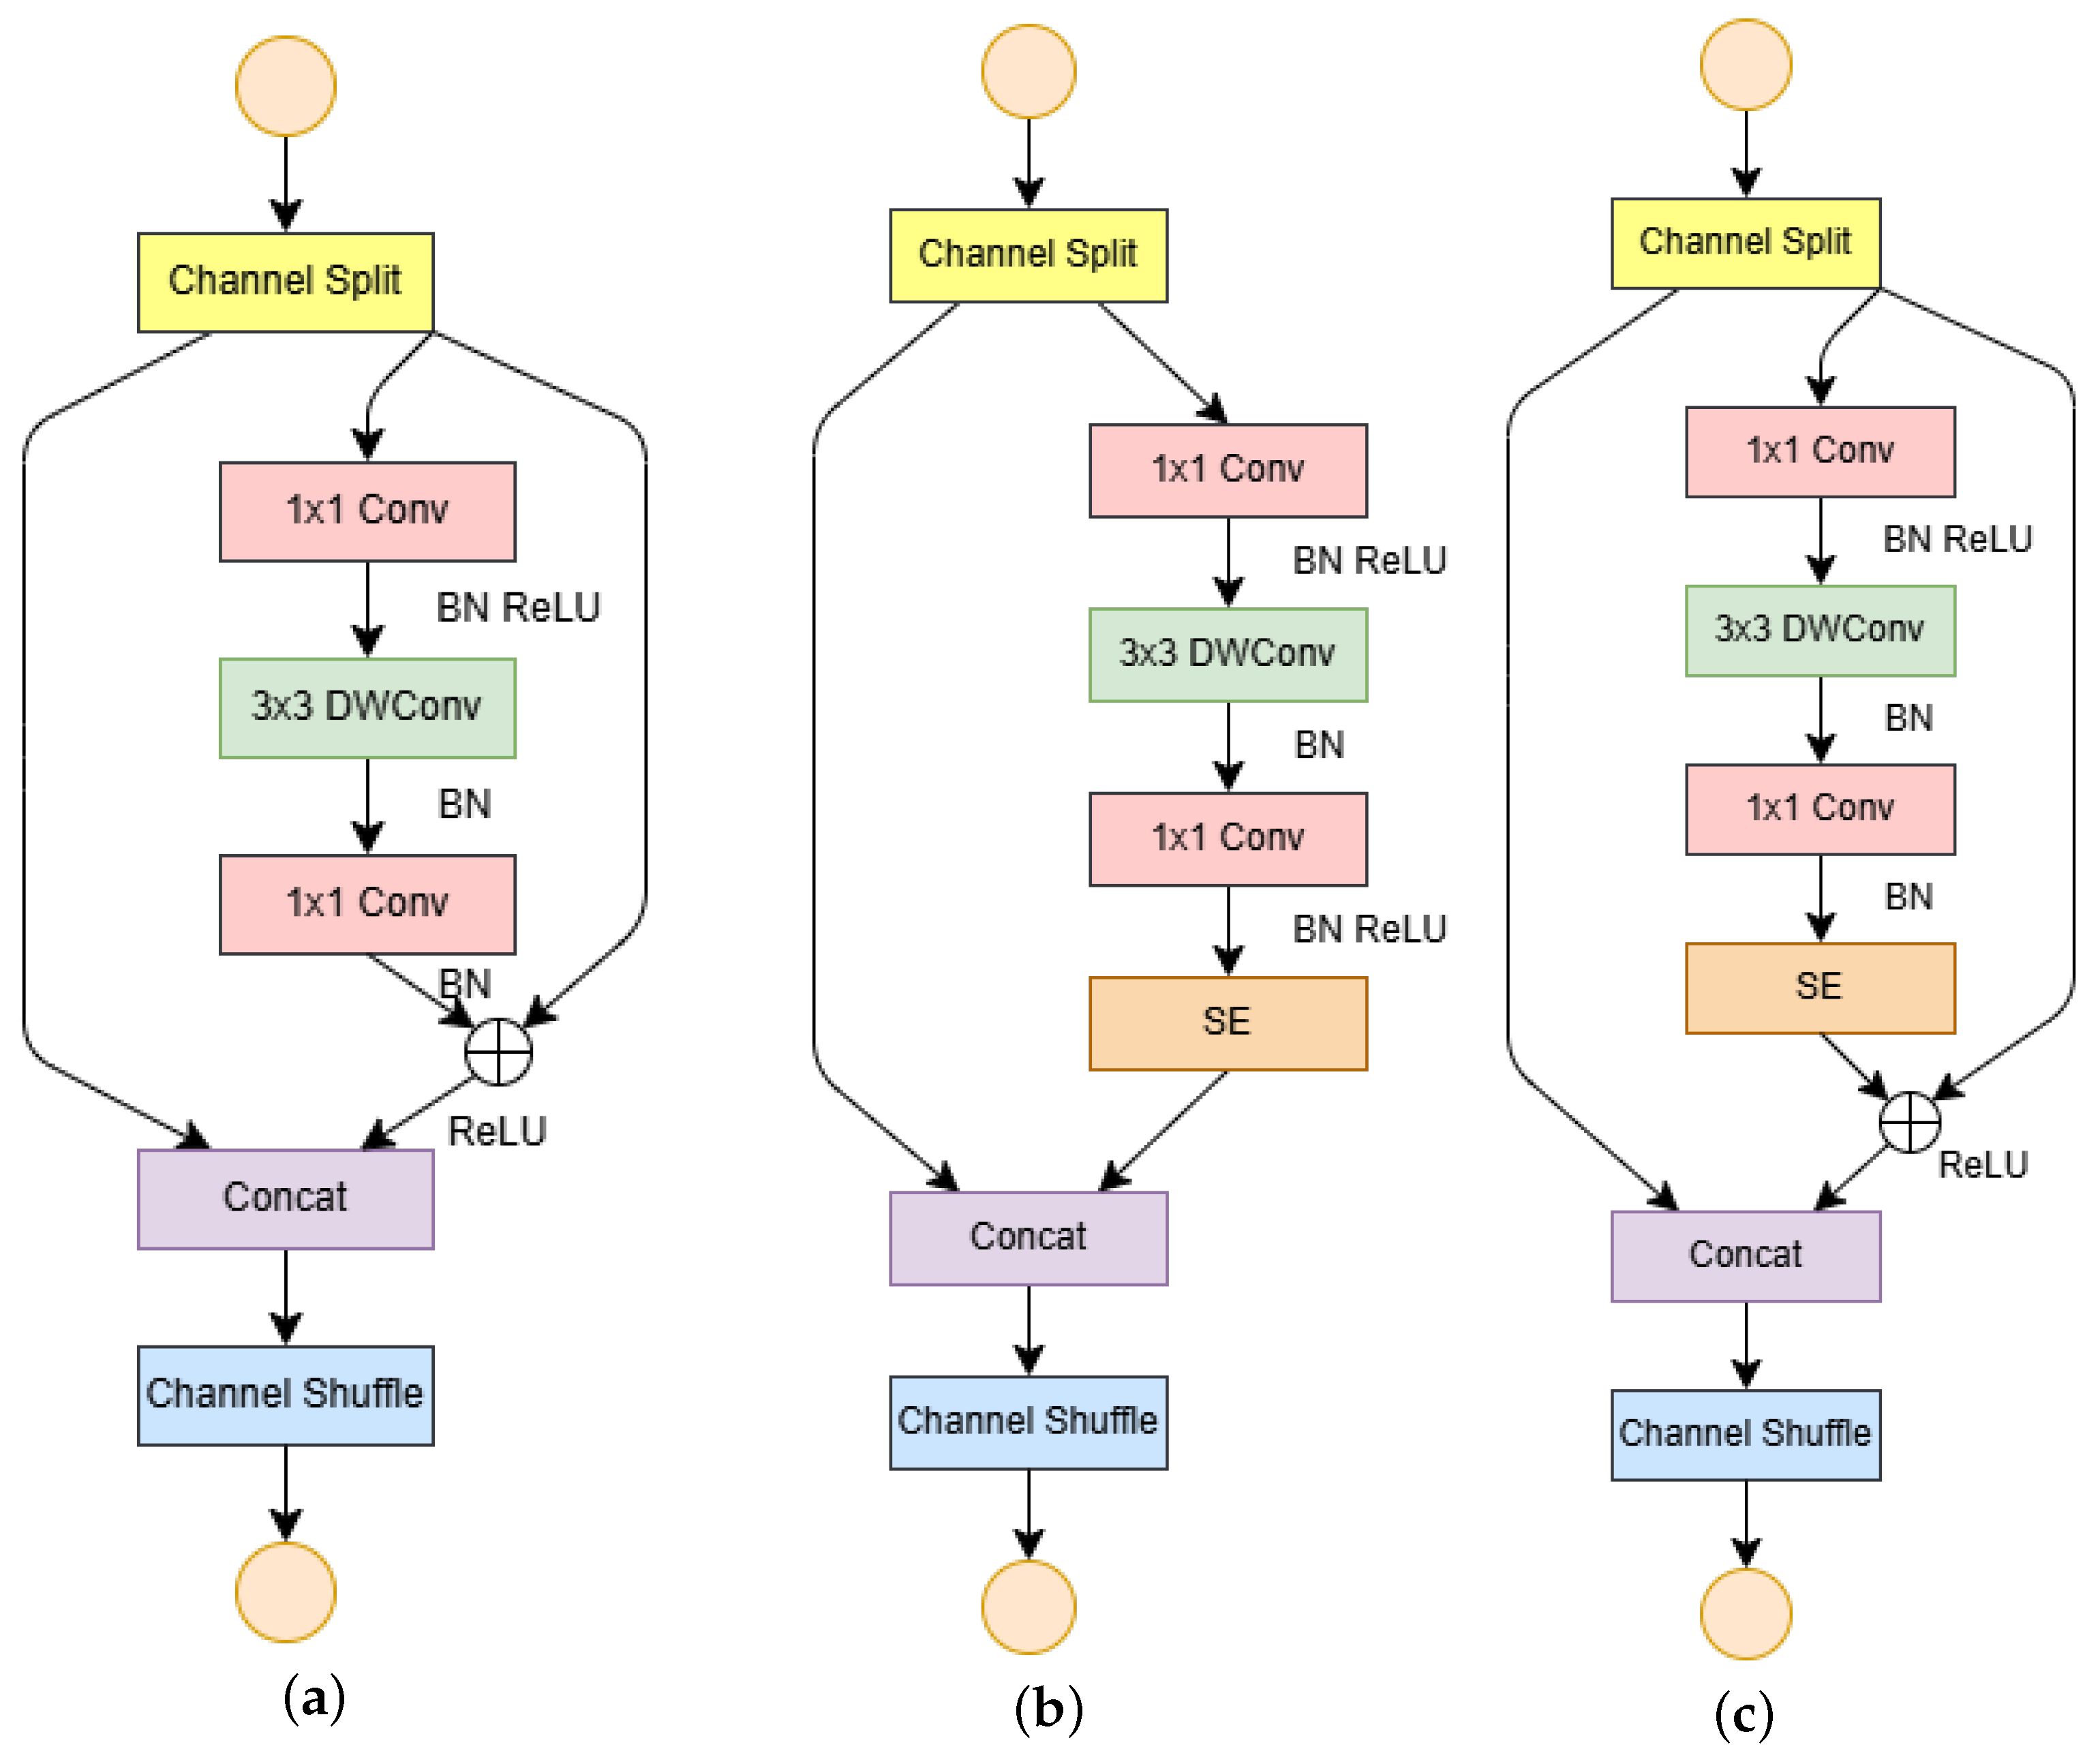
Unlike conventional group convolutions, ShuffleNetV2 uses channel splitting and shuffling operations to enable information exchange between parallel branches while keeping memory access costs low. Its basic unit splits input features into two branches: one branch uses identity mapping, and the other uses depthwise separable convolutions for lightweight feature transformation. We further modify the downsampling module into a symmetric dual-branch structure, where both branches use parallel 3 × 3 depthwise convolutions with stride 2 to reduce spatial resolution and expand channel capacity at the same time. This modification is intended to preserve multi-scale information while controlling computational cost. In the final YieldNet configuration, the complete model has 3.3 M parameters and 8.0 GFLOPs, compared with 3.0 M and 8.1 GFLOPs for YOLOv8n. The building-block variants are shown in Figure 6.

2.3.2. Improvement in Neck Network

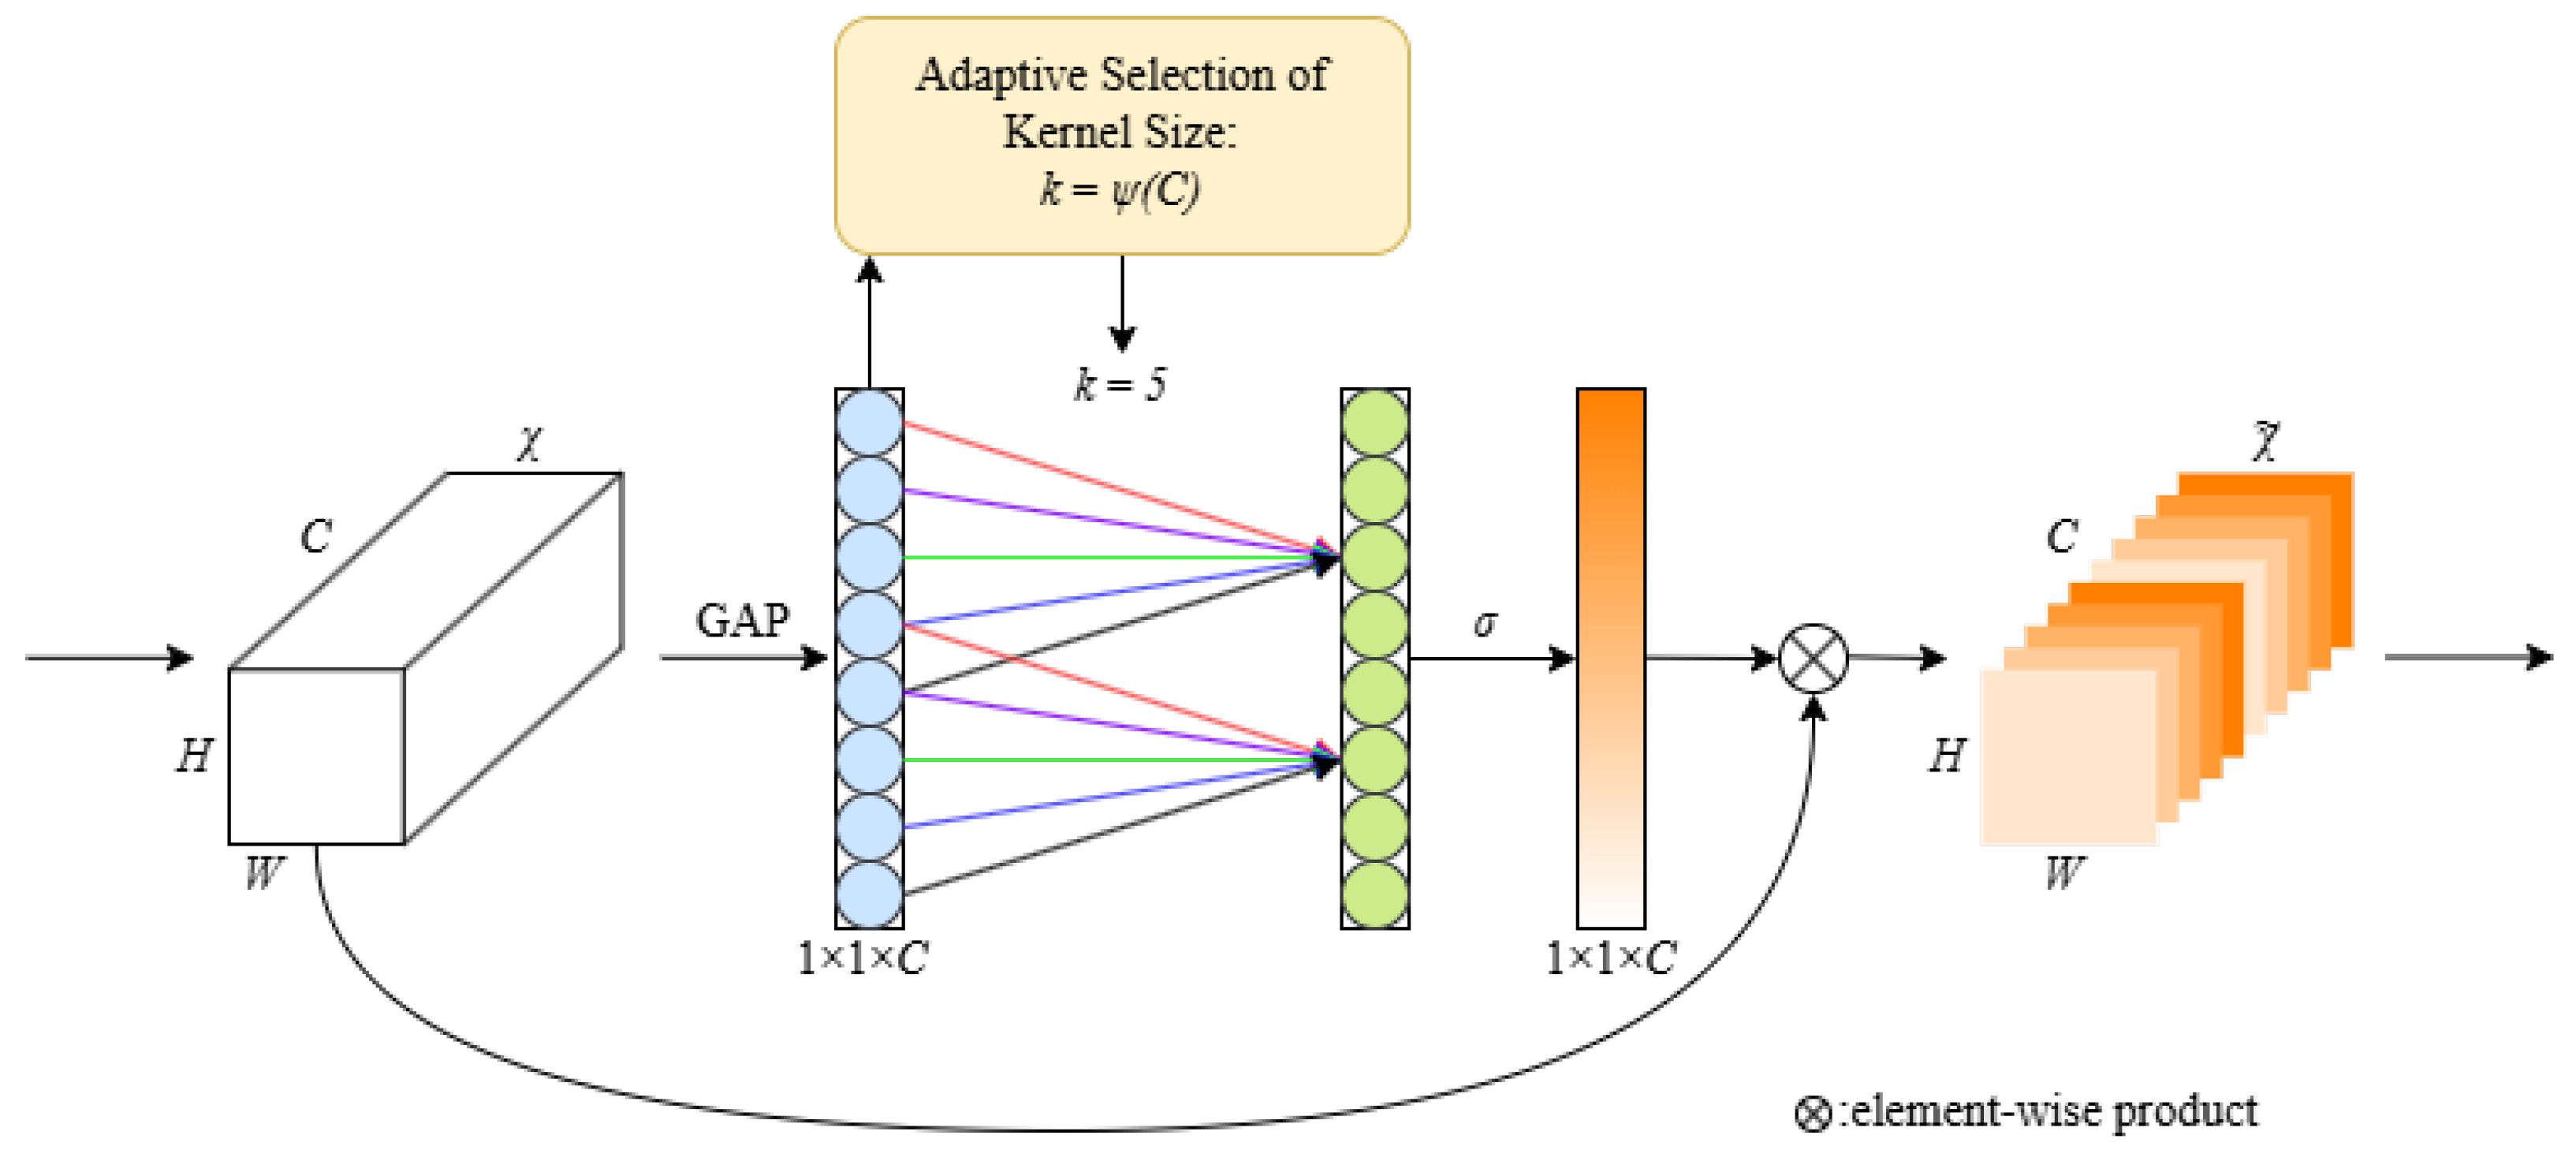
After reducing backbone FLOPs with ShuffleNetV2, we turn our attention to the neck. The original YOLOv8 neck is retained, with an ECA module (kernel size 3) inserted after each C2f output at P3, P4, and P5 (80 × 80, 40 × 40, and 20 × 20). These modules recalibrate the features supplied to the detection head and are intended to reduce responses to background foliage. Moreover, benefiting from the lightweight design of the ECA module (one-dimensional convolution) and the fixed kernel size parameter, the implementation of this improvement results in almost zero increase in parameters and computational cost [24]. The ECA mechanism is illustrated in Figure 7.
Parameters γ and b remain as hyperparameters in the original formulation, where σ denotes the sigmoid activation function. Unlike the adaptive kernel sizing proposed in the original ECA design, we fix the 1-D convolution kernel to k = 3 for all three inserted modules.
The feature processing flow in the ECA module is as follows: the input tensor [ H , W , C ] is first compressed to a vector of length C with shape [ 1 , 1 , C ] through global average pooling, then the pooled feature vector undergoes convolution operation through the 1-D convolution kernel with fixed k = 3 and generates per-channel weights; finally, after sigmoid operation, it is multiplied with the original features from the initial input to obtain the final weighted features.
For the feature y R C after average pooling (its feature dimension remains unchanged), the process of obtaining feature weights through convolution operation by fast 1-D convolution (denoted as C1D) with our fixed-size kernel can be expressed as follows:
ω = σ ( C 1 D k = 3 ( y ) )
The original ECA formulation posits an exponential mapping between kernel size k and channel dimension C:
C = ϕ ( k ) = 2 ( γ k b )
We depart from this adaptive scheme. The present experiments use fixed k = 3 throughout and do not compare fixed and adaptive kernel sizing.

2.3.3. Improvement in Loss Function

To address the bounding-box regression accuracy issue for densely overlapped green tomatoes in detection, we use Powerful-IoU v2 (PIoU v2) to replace the standard CIoU loss. PIoU designs a penalty factor P that depends on the absolute distance between corresponding edges of the predicted box and the target box:
P = d w 1 + d w 2 w g t + d h 1 + d h 2 h g t / 4
where d w 1 , d w 2 , d h 1 , d h 2 are the absolute distances between corresponding edges of the predicted box and the target box, and w g t and h g t are the width and height of the target box.
Simultaneously, a gradient adjustment function f ( x ) = 1 e x 2 is introduced, and the PIoU loss is defined as:
L PIoU = L IoU + f ( P ) = 2 IoU e P 2
Furthermore, PIoU v2 introduces a non-monotonic attention mechanism controlled by the hyperparameter λ (in this experiment, λ = 1.5 ), defining the attention function:
q = e P , u ( x ) = 3 x · e x 2
The final loss function is:
L PIoU v 2 = u ( λ q ) · L PIoU = 3 · ( λ q ) · e ( λ q ) 2 · L PIoU
For the green-tomato dataset, PIoU v2 was introduced to increase the penalty for inaccurate localization and to modulate gradients according to localization quality. Its contribution to the present model is evaluated through the ablation results rather than inferred from a separate mechanism experiment.

2.4. Experimental Environment and Model Evaluation Indicators

2.4.1. Experimental Environment

All experiments were conducted on the hardware platform specified in Table 1. To ensure fair comparisons, all models were trained under identical settings. The main hyperparameters are summarized as follows:
  • Input resolution: 640 × 640 pixels;
  • Training epochs: 150;
  • Batch size: 8;
  • Optimizer: SGD (initial learning rate 0.01, momentum 0.937);
  • Single-class mode (single_cls=True) for tomato detection.
All compared models were trained from scratch under this common 150-epoch protocol. No architecture-specific hyperparameter search was conducted for the competing detectors; thus, the comparison reports their performance under a common protocol rather than individually optimized performance ceilings.
The model checkpoint with the best validation performance during training was used to report all evaluation metrics.

2.4.2. Model Evaluation Indicators

Detection performance is assessed using:
  • F1 Score:
    P = T P T P + F P , R = T P T P + F N , F 1 = 2 · P · R P + R
    tallied at IoU ≥ 0.5.
  • mAP@50:
    Derived from the precision-recall curve area per category:
    AP c = 0 1 P ( R ) d R
    then averaged across C classes at IoU = 0.5:
    mAP @ 50 = 1 C c = 1 C AP c
  • mAP@50-95:
    Averaged over IoU ∈ [0.50:0.05:0.95]:
    mAP @ 50 - 95 = 1 10 C c = 1 C t AP c , t
    where t indexes the ten thresholds. This metric imposes stricter localization constraints than mAP@50.
Model efficiency is measured by parameters (M) and GFLOPs.

2.4.3. Supplementary Stability Evaluation

To examine run-to-run variation on the 180-image GreenTomato-UAV validation set, we retrained YOLOv8n and YieldNet with seeds 42, 43, and 44 under the same protocol. Table 2 reports the mean ± sample standard deviation. This repeated evaluation covers only the baseline and final YieldNet and does not constitute a significance test across the individual ablation variants.

3. Results

3.1. Comparison of Model Before and After Improvement

To evaluate the performance of the improved YieldNet model, this study compares it with the YOLOv8n baseline model across multiple metrics—mAP@50, mAP@50-95, Precision (P), Recall (R), F1, Params, and GFLOPs—after training on the Tomato-Recog public validation set and the GreenTomato-UAV validation set. The comparison results are presented in Table 3 and Table 4 below.
As depicted in Table 3 and Table 4, YieldNet achieves higher values than the baseline across all metrics for all categories on both datasets. This is particularly evident in the Tomato-Recog public validation set, where the mAP@50-95 metric shows a relative gain of up to 18.92%, while mAP@50 and F1-Score improve by relative gains of 4.75% and 5.82%, respectively. The model also performs well on the GreenTomato-UAV validation set, with mAP@50-95, mAP@50, and F1-Score improving by relative gains of 3.50%, 3.51%, and 4.02% respectively. For Tomato-Recog, mAP@50-95 increased from 0.666 to 0.792: an absolute increase of 0.126 (12.6 percentage points) and a relative increase of 18.92% ( 0.126 / 0.666 ).
Under the present protocol, YieldNet reports higher validation metrics than the YOLOv8n baseline on both datasets. The final configuration combines ShuffleNetV2-ECA feature extraction with PIoU v2 bounding-box regression; their individual metric changes are reported in the ablation study. Relative to YOLOv8n, the parameter count increases from 3.0 M to 3.3 M, whereas FLOPs decrease from 8.1 G to 8.0 G. This comparison characterizes the accuracy–complexity trade-off obtained in the present experiments.
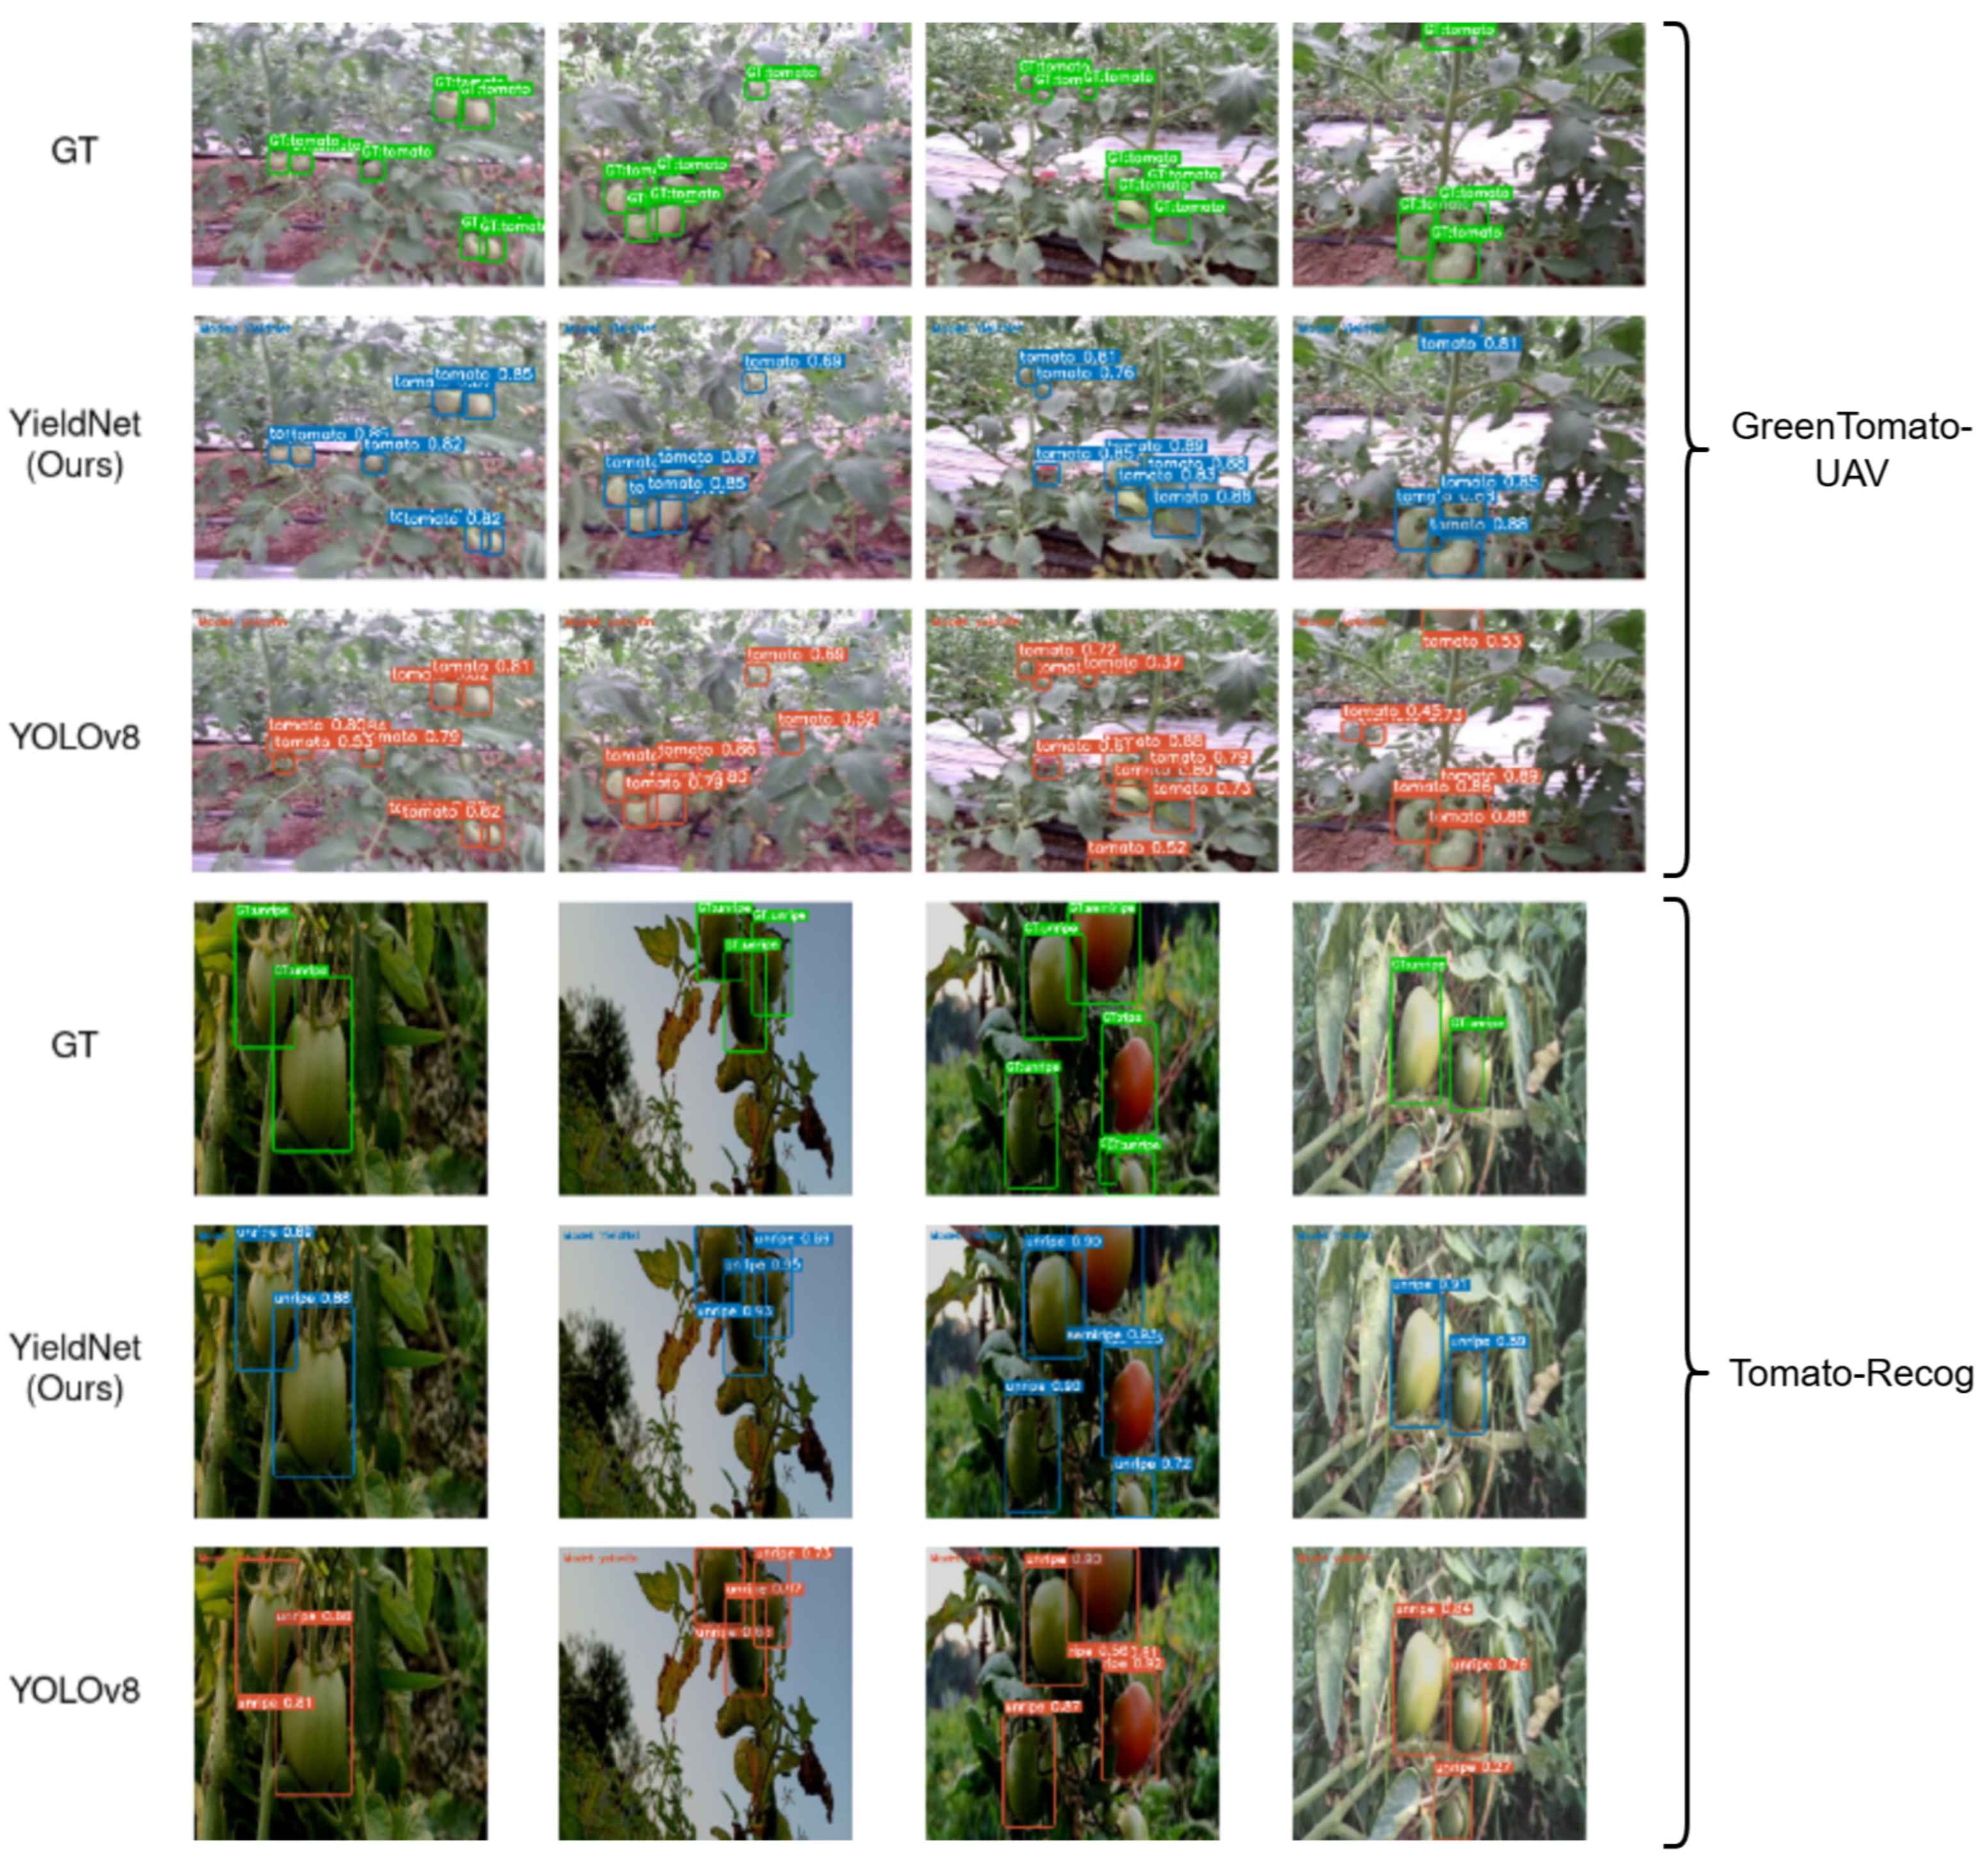
Figure 8 shows the qualitative comparison between the baseline YOLOv8n and our proposed YieldNet on random samples. In these examples, YieldNet detects more of the visible small and occluded objects than YOLOv8n. These examples are qualitative; the corresponding quantitative results are reported in Table 3 and Table 4.

3.2. Ablation Experiment

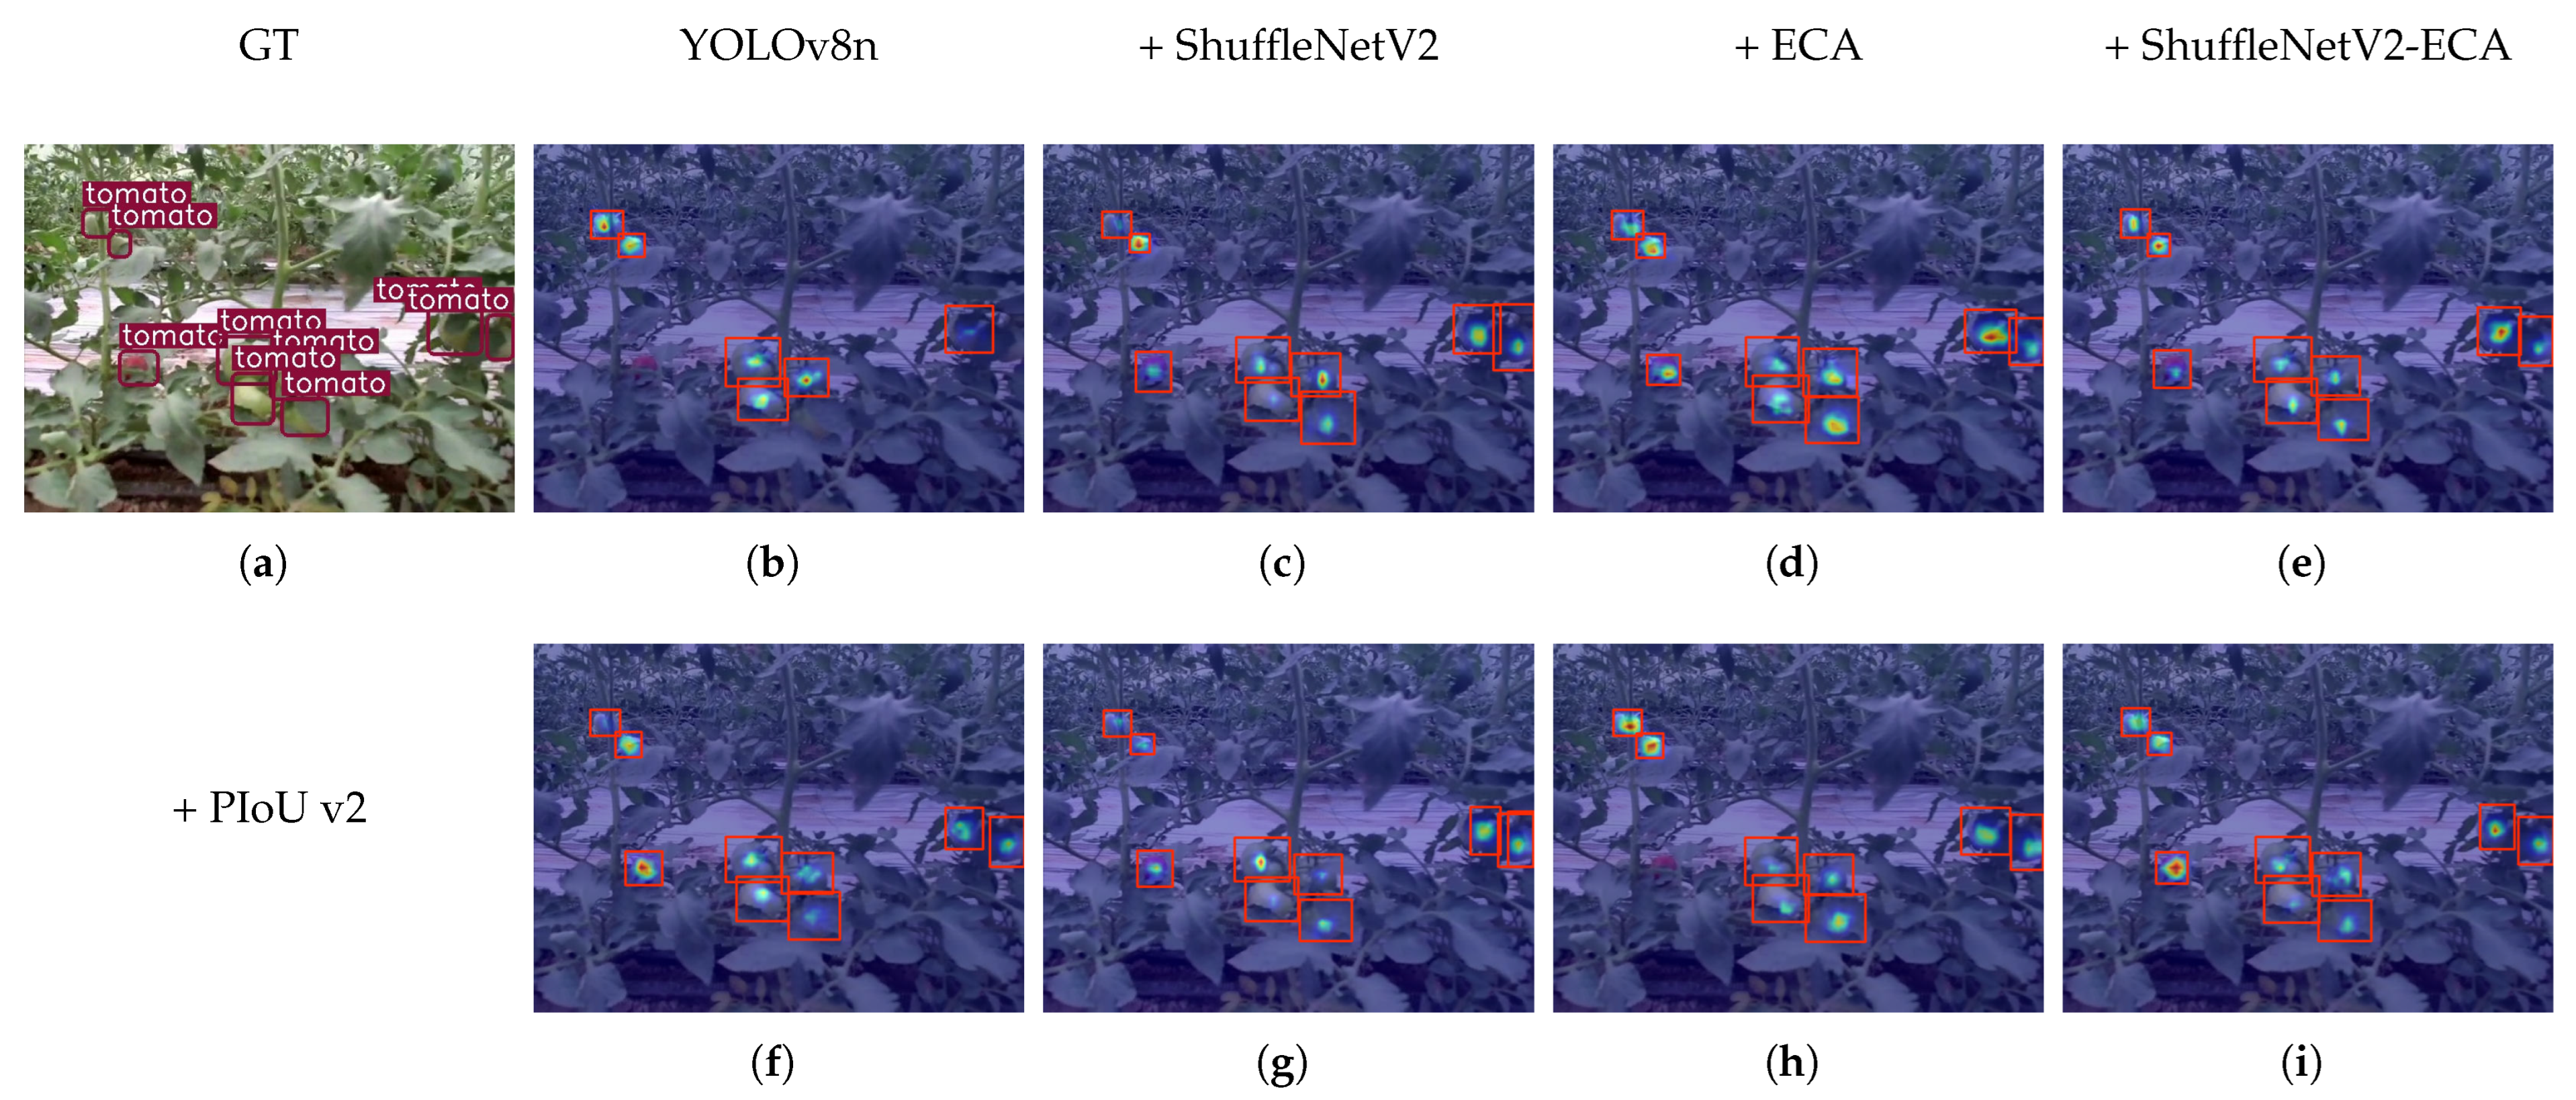
To further investigate the roles played by each improvement module, this study conducts an ablation experiment on the model: quantitative comparisons are made on the GreenTomato-UAV validation set between the training results of the baseline YOLOv8n model and those of various model variants after progressively incorporating each improvement module, with the comparison results presented in Table 5; on the same dataset, attention heatmaps are generated for selected images using the baseline YOLOv8n model and each variant model, and the results are shown in Figure 9. The table reports the metric changes associated with each variant, and the heatmaps provide representative visual comparisons.
Table 5 shows that when ECA and ShuffleNet V2 act alone, they both enhance all performance metrics, especially on mAP@50 and Precision: ECA improves mAP@50 by 0.021 (2.1 percentage points, reaching 0.905), with Precision increasing from 0.872 to 0.893; ShuffleNet V2 improves mAP@50 by 0.028 (2.8 percentage points, reaching 0.912), and Precision by 0.032 (3.2 percentage points, reaching 0.904). These observed differences are consistent with the intended feature-extraction and channel-recalibration roles of ShuffleNetV2 and ECA, but this ablation does not independently establish those internal mechanisms.
Furthermore, when ShuffleNet V2 and ECA are combined, the ShuffleNet V2-ECA structure improves several metrics over either module alone in this run, achieving relative improvements of +3.2% and +3.7% on mAP@50 and Precision respectively, while also improving mAP@50-95 by +3.9% (reaching 0.475), Recall by +2.3% (reaching 0.839), and driving the F1 score up by +3.0% (reaching 0.870). This variant combines backbone feature extraction with subsequent ECA channel recalibration; the table reports the associated metric values without a separate mechanism test.
When PIoU v2 acts alone, its clearest increase is in Recall (from 0.820 to 0.842, an absolute increase of 0.022, or 2.2 percentage points). When combined with ShuffleNetV2 or ECA, the observed mAP@50-95 values are 0.462 and 0.469, respectively, compared with 0.457 for the baseline and 0.460 for PIoU v2 alone. These single-run differences do not establish a statistically significant interaction among modules.
On this basis, strengthening multi-component collaborative design, the finally proposed YieldNet (ShuffleNetV2-ECA + PIoU v2) reports the following values on the GreenTomato-UAV validation set: mAP@50 reaches 0.915 (an absolute increase of 0.031, or 3.1 percentage points, over the baseline), mAP@50-95 reaches 0.473, Precision reaches 0.905 (an absolute increase of 0.033, or 3.3 percentage points), and F1 score reaches 0.879, while the model uses 3.30 M parameters and approximately 8.0 GFLOPs. These results support the combined design on this validation set, while the small sample size limits broader inference.
In the representative example in Figure 9, YOLOv8n misses three displayed targets and shows weaker activation around several targets near the image boundary. The ShuffleNetV2-only and ECA-only variants detect the displayed targets, with different activation distributions around the fruit regions. These observations describe this example only and are not an occlusion-stratified evaluation.
In the displayed ShuffleNetV2-ECA example, target regions appear brighter than in the ShuffleNetV2-only map and more spatially concentrated than in the ECA-only map. This qualitative visualization is consistent with, but does not independently verify, an interaction between the two modules.
For the PIoU v2-only variant, Recall increases from 0.820 to 0.842 (an absolute increase of 0.022, or 2.2 percentage points), whereas the other metrics show only small changes in this run. In the displayed examples, variants containing PIoU v2 produce boxes that appear closer to the ground-truth boxes for the two targets at middle right; this qualitative observation is not a separate localization-accuracy test.
In this example, ShuffleNetV2 + PIoU v2 produces a false detection at the middle right, whereas ECA + PIoU v2 misses the red tomato. The final YieldNet detects the displayed targets and shows more concentrated activation around several target regions. Because the dataset has no occlusion-level labels, this example is not used to claim performance for a particular occlusion category; quantitative comparisons are reported in Table 5.

3.3. Comparison Between Different Models

To further evaluate the proposed YieldNet, this experiment conducts a head-to-head comparison on the two datasets mentioned above between YieldNet and representative nano- and small-scale models from the current mainstream YOLOv5, YOLOv8, and YOLOv11 [25] families, as well as the transformer-based detector RT-DETR-n. The detailed comparison results are presented in Table 6.
As shown in Table 6, on both the Tomato-Recog public validation set and GreenTomato-UAV validation set, YieldNet achieves the best results across all performance metrics among all nano-level models.
Furthermore, on the Tomato-Recog public validation set, YieldNet even achieves the best overall performance on all metrics (mAP@50 of 0.970, mAP@50-95 of 0.792, Precision of 0.972, Recall of 0.921, and F1 of 0.946). On the GreenTomato-UAV validation set, YieldNet similarly achieves the best overall results on mAP@50 (0.915) and F1 (0.879), and ranks second in mAP@50-95 (0.473; tied with YOLOv8s), Precision (0.905), and Recall (0.855).
In summary, whether on the Tomato-Recog public validation set or the GreenTomato-UAV validation set, YieldNet is competitive with the listed small models: its performance on the GreenTomato-UAV validation set is close to that of small-sized models, while on the Tomato-Recog public validation set it surpasses all small-sized models. With 3.3 M parameters and 8.0 G FLOPs, its computational scale remains close to YOLOv8n.

3.4. Training Visualization Analysis

To further analyze the dynamic characteristics during the training process and compare the observed training behavior, we visualize the mAP@50-95 curves and the training loss components of the models mentioned in the previous section (Comparison Between Different Models) on the two datasets.
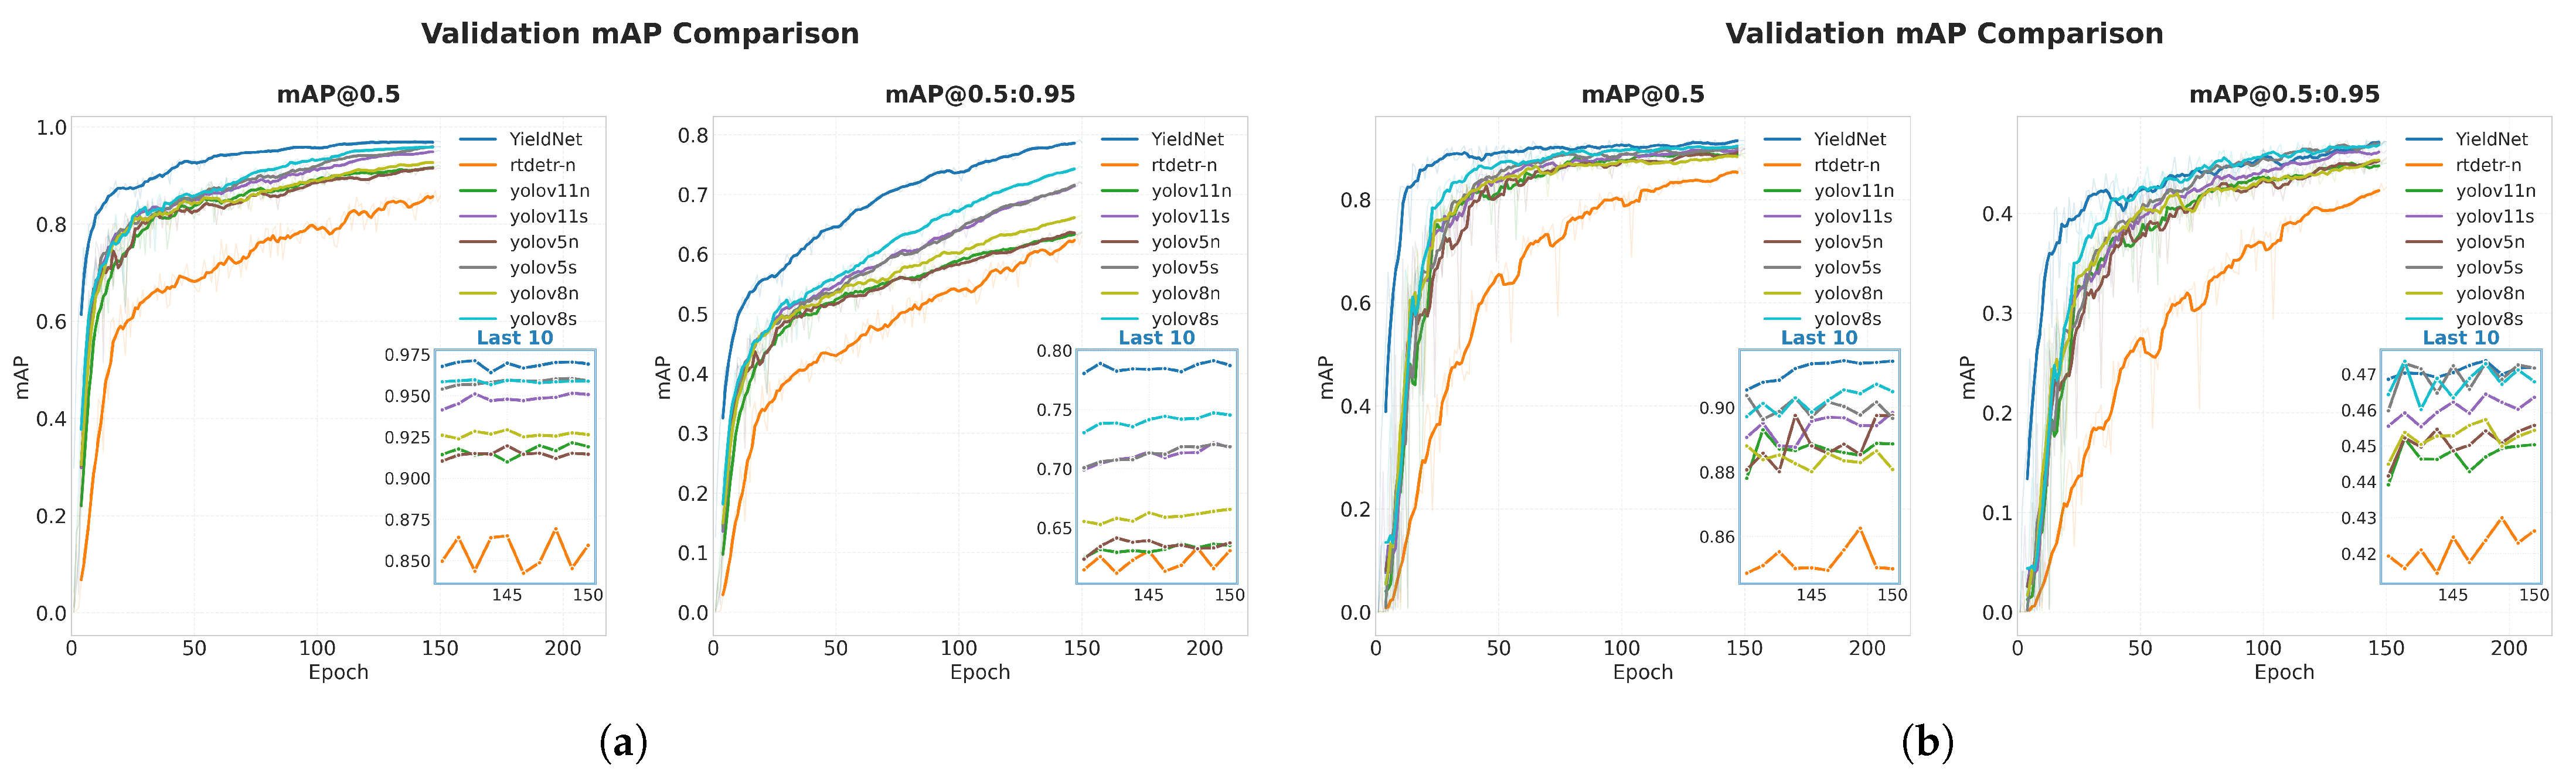
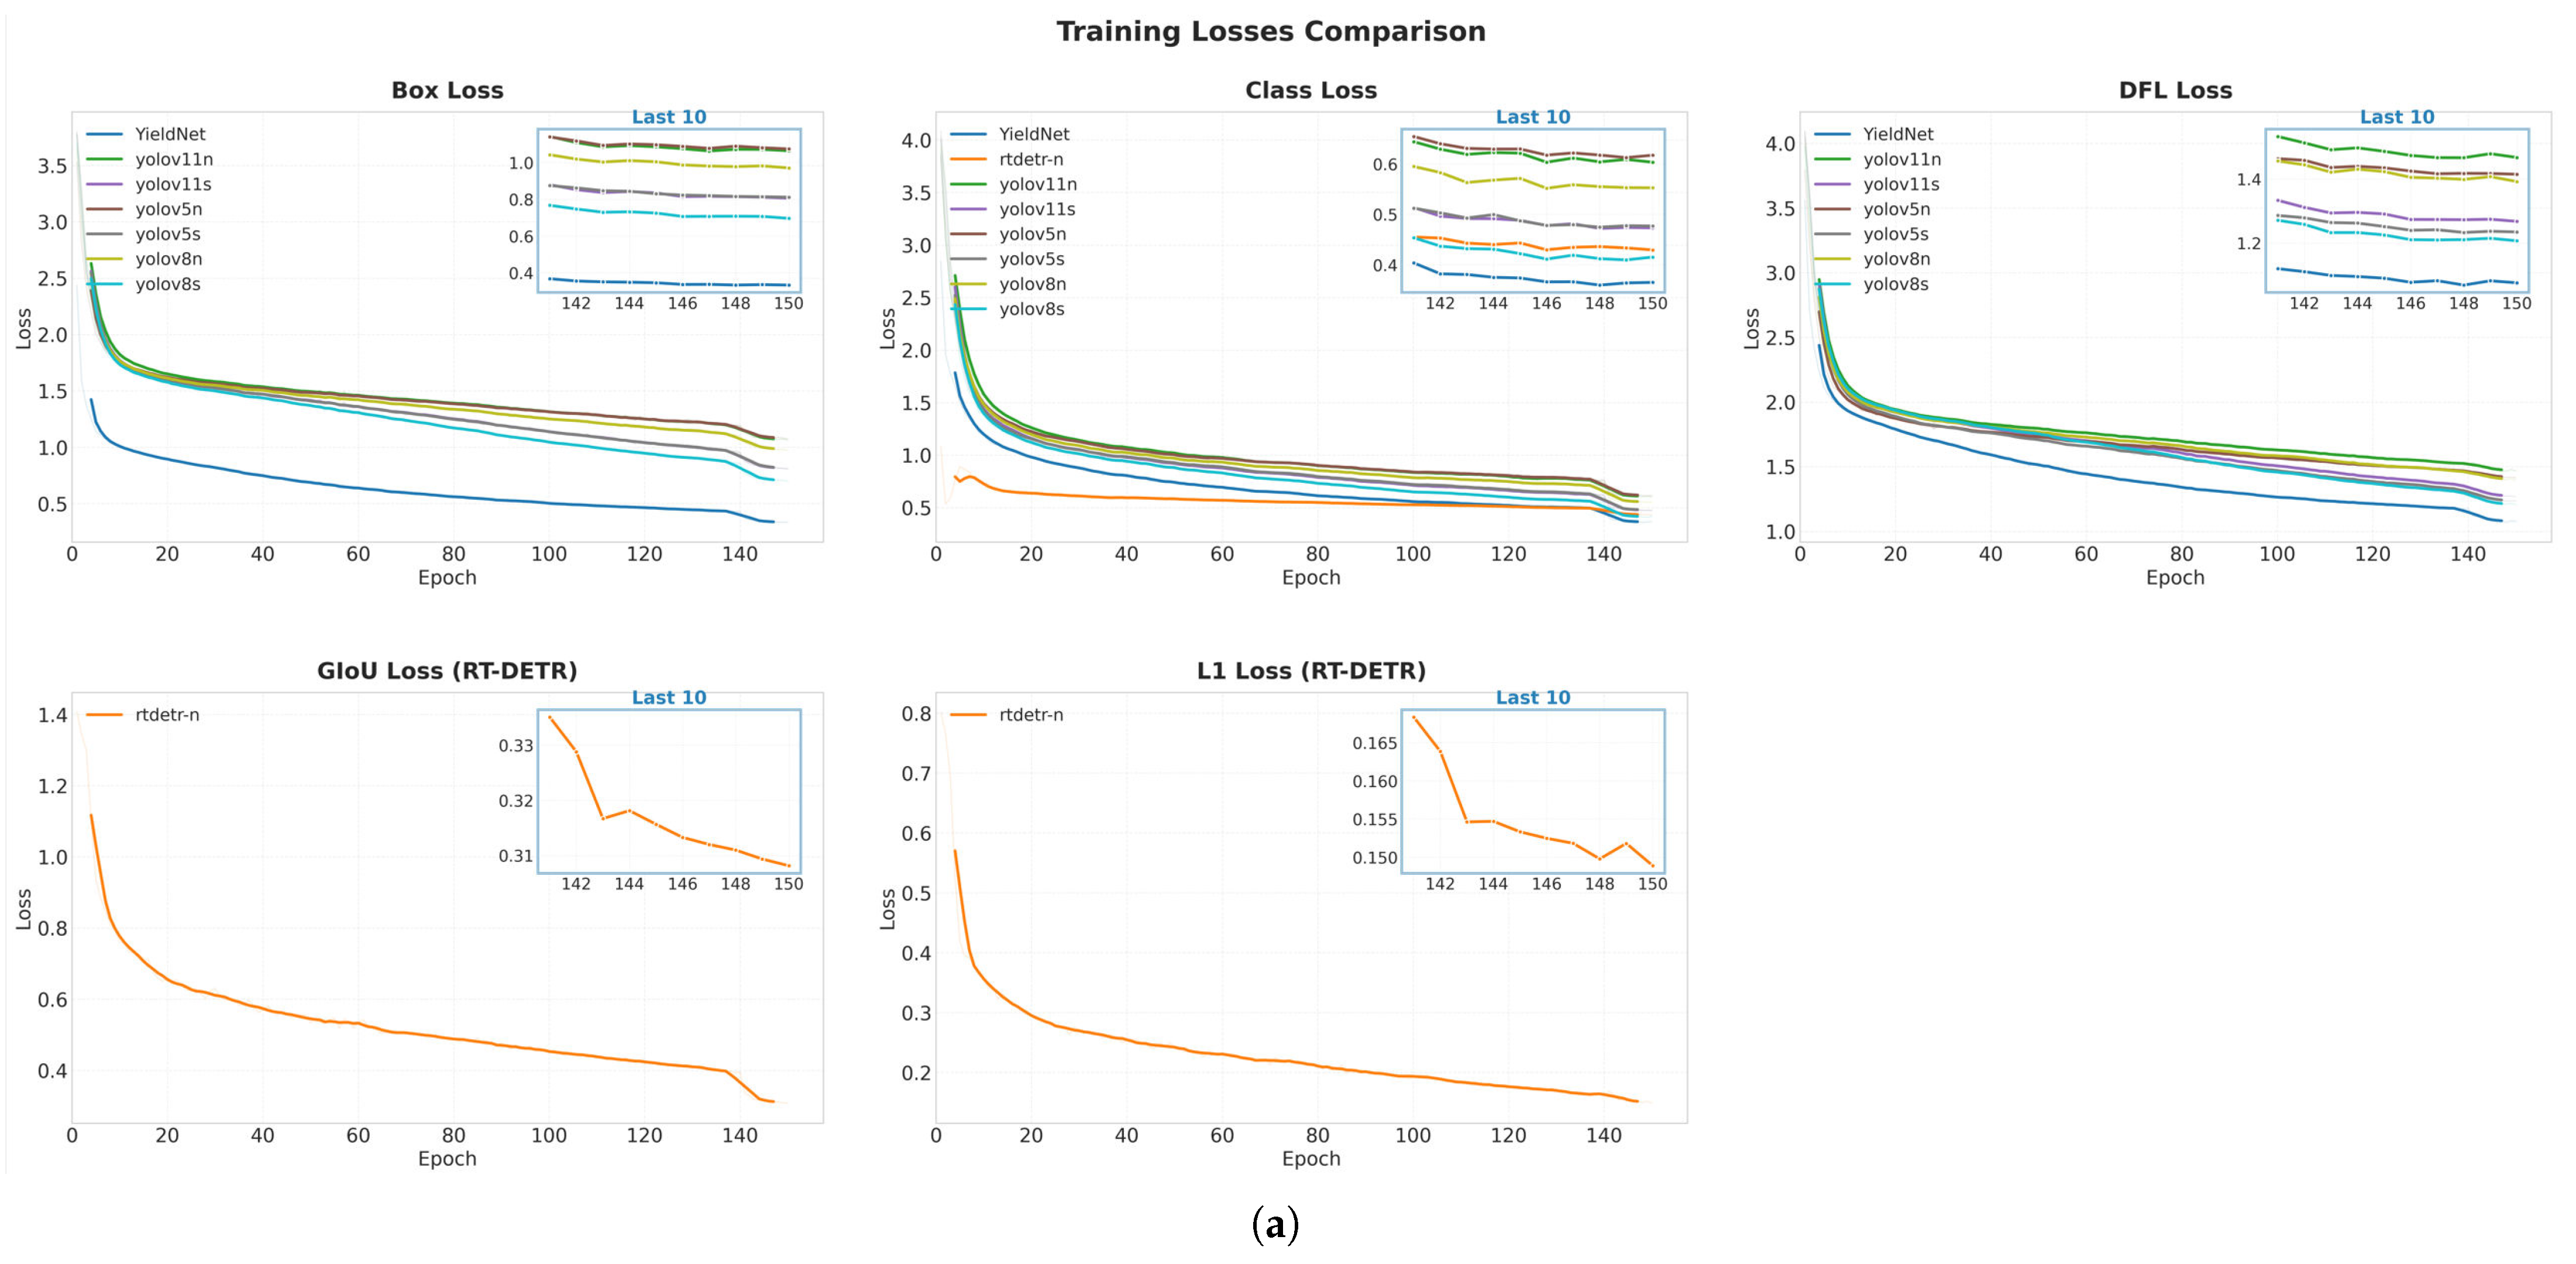
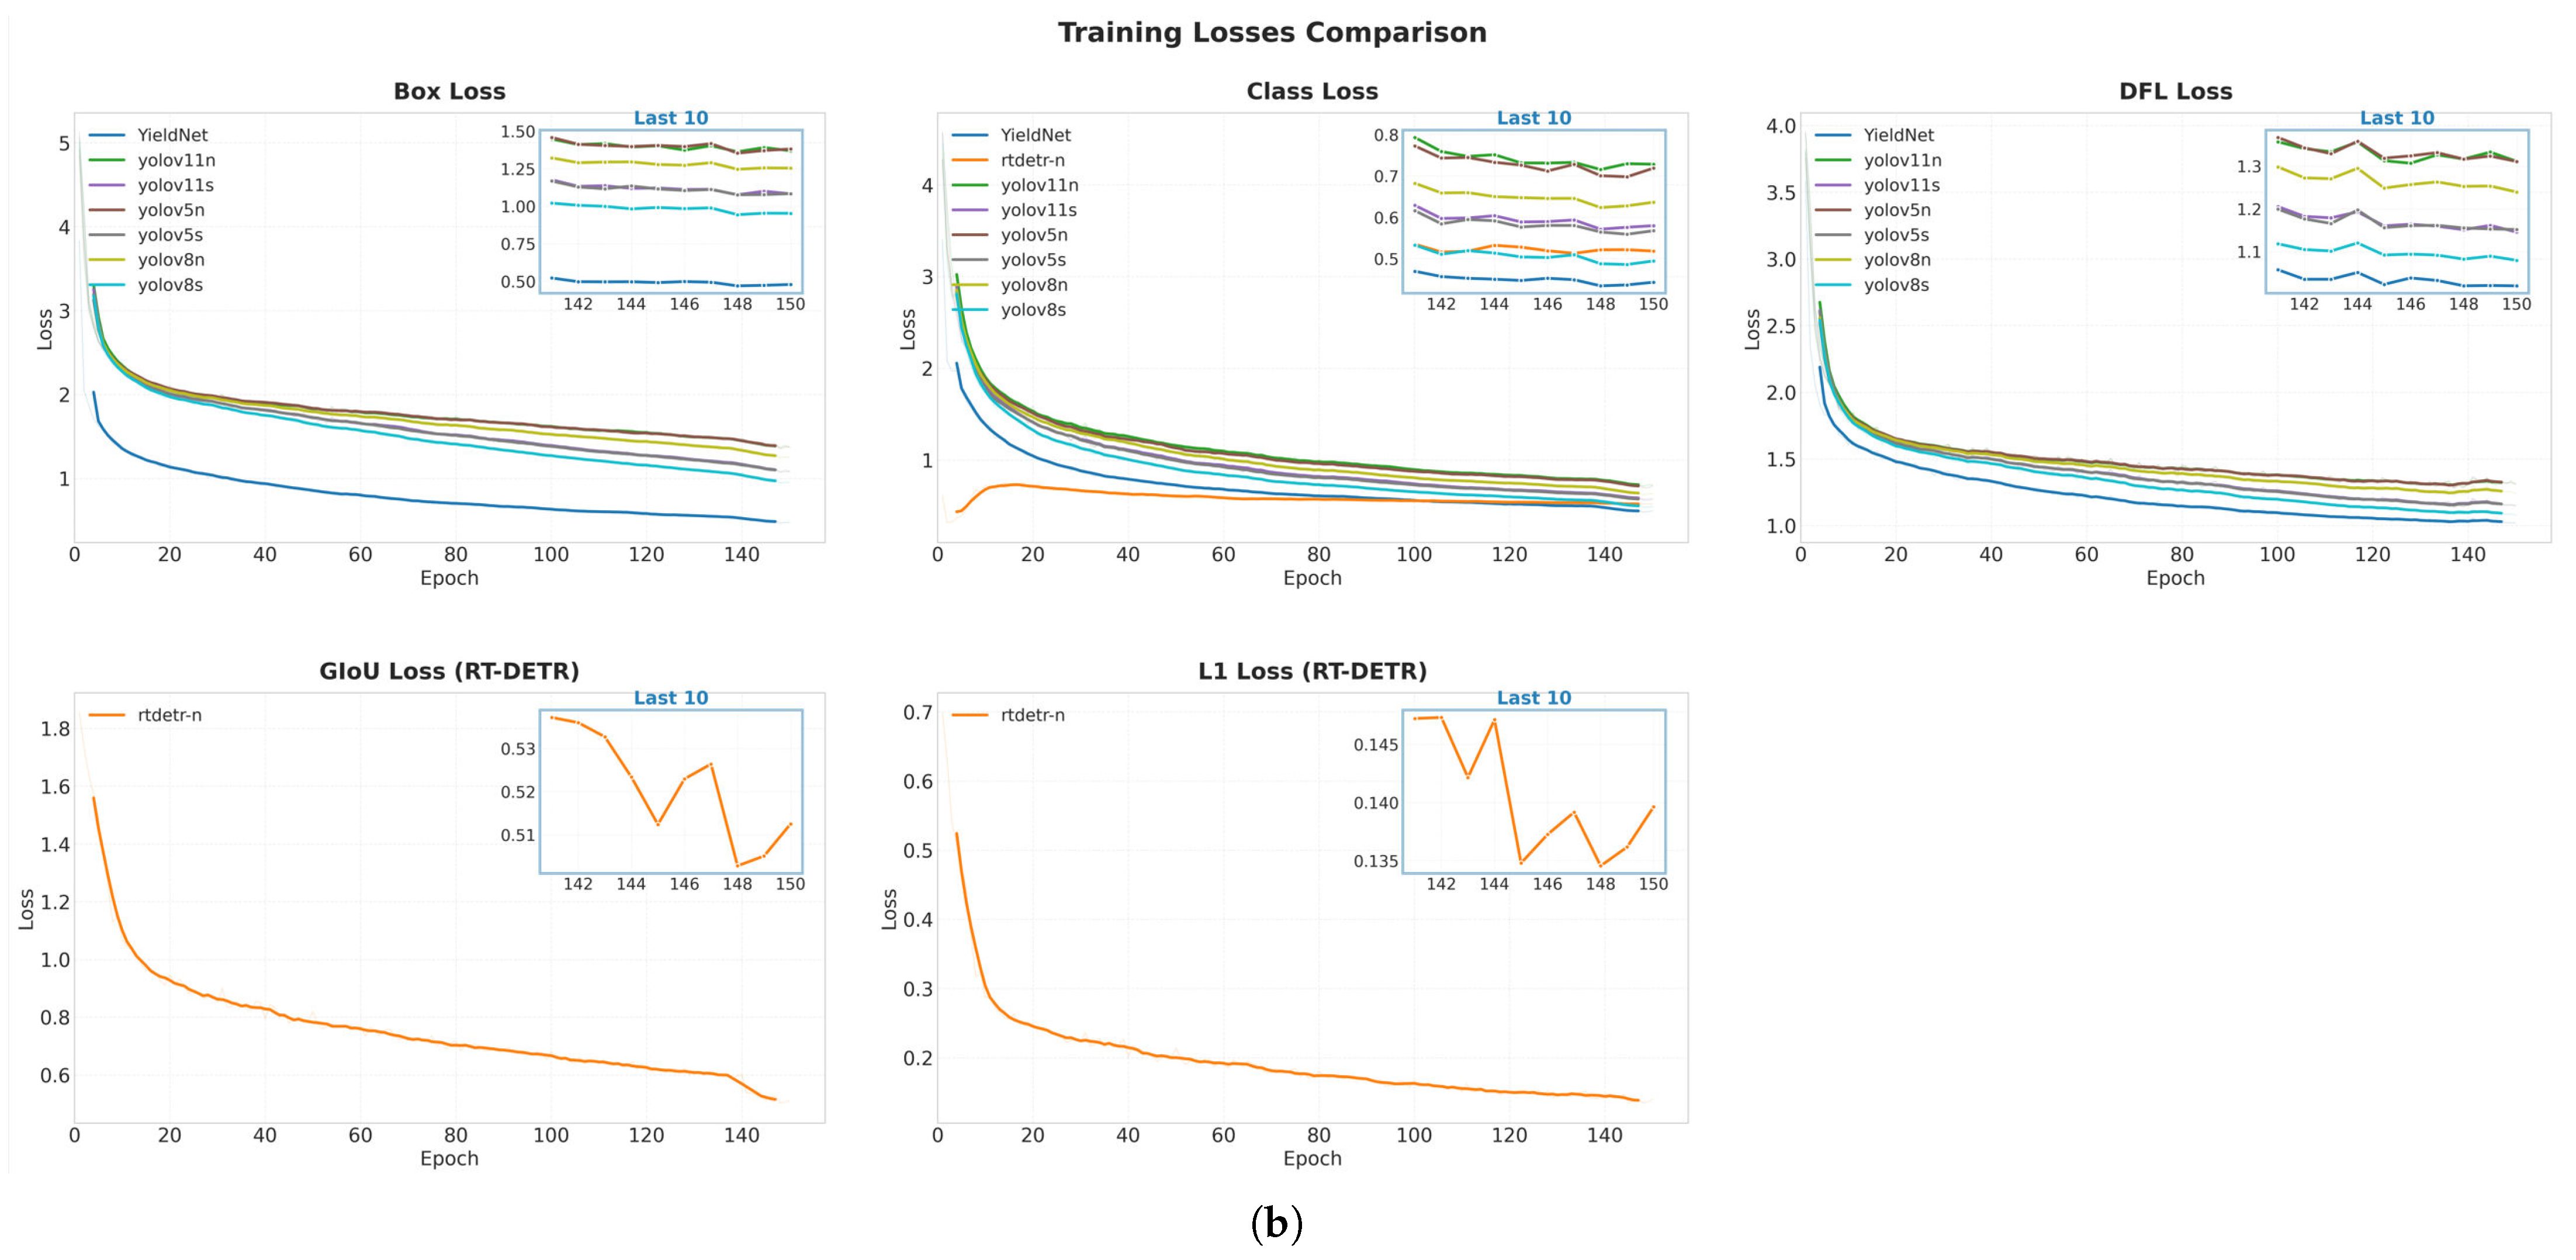
Figure 10 shows the validation mAP@50 and mAP@50-95 curves during training, illustrating how mAP@50 and mAP@50-95 changes with the number of epochs; Figure 11 displays the training loss curves, including the box loss, classification loss, and DFL loss (also GIoU loss and L1 loss for RT-DETR model).
Figure 10 illustrates the validation mAP@50 and mAP@50–95 curves during the training process. In the plotted runs, YieldNet has higher mAP values than the other YOLO variants during the early training stages and the highest final plotted mAP on both datasets. These curves describe training behavior under the present protocol but do not establish robustness across deployment scenarios.
Figure 11 presents the training loss curves for each component, including Box Loss, Classification Loss (Cls Loss), and Distributed Focal Loss (DFL Loss) (RT-DETR model is not included in the comparison scope). It can be observed that, in both datasets, YieldNet’s loss components decrease most rapidly and reach the lowest loss values among all models by the end of training, with a particularly notable advantage in Box Loss.
In summary, YieldNet shows higher plotted mAP values from the initial stages of training: at earlier epochs in the present training runs, it reaches comparatively high mAP values; moreover, throughout the entire training period, its final plotted mAP exceeds that of most comparative models. Particularly on the GreenTomato-UAV validation set and with low epoch settings, the plotted results indicate a favourable accuracy–efficiency trade-off under this protocol.

3.5. Edge-Device Deployment and Performance

YieldNet was deployed on an Orange Pi 5 Max with a Rockchip RK3588 SoC. Table 7 summarizes the hardware, software, model, and live-input settings.
For offline comparison, the YOLOv8n baseline, YieldNet, and YOLOv8s replayed the same 180 GreenTomato-UAV validation images as non-quantized RKNN models. Each measurement used 640 × 640 input, batch size 1, 12 warm-up inferences, and three RKNN instances bound to NPU cores 0–2. Table 8 reports per-request p50 NPU latency and aggregate throughput. YieldNet achieved 69.65 ms and 37.46 FPS; it was slower than YOLOv8n but faster than YOLOv8s under this protocol.
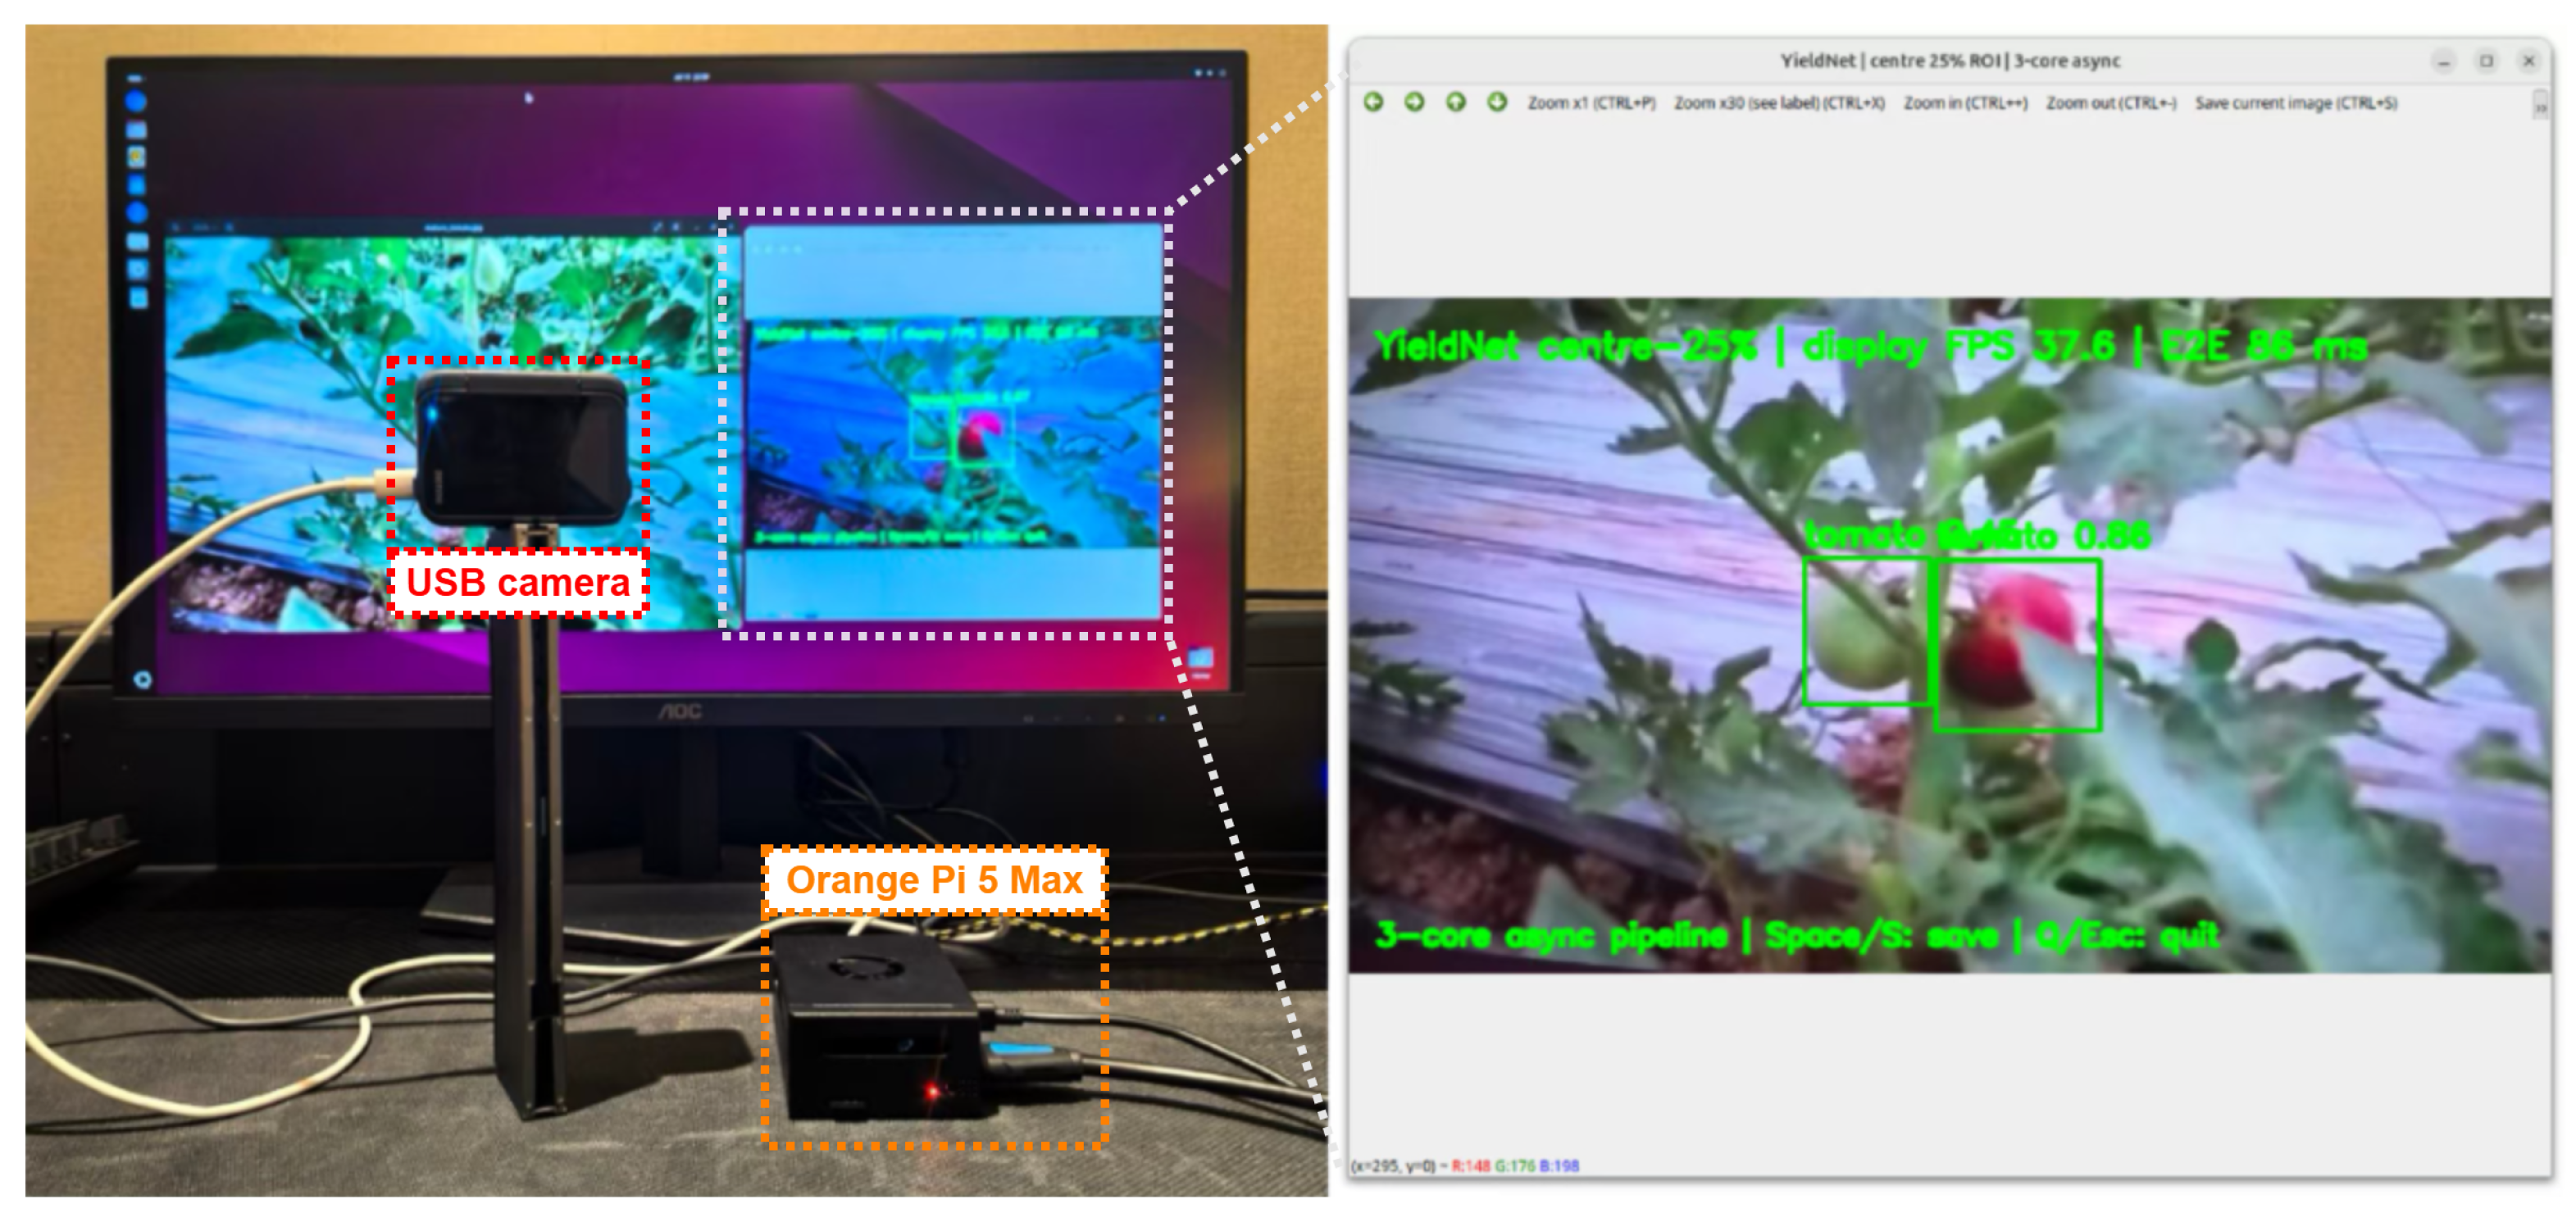
On the Orange Pi 5 Max, the three-core asynchronous pipeline processed the centre 25% region of a live 1280 × 720 UVC camera stream from an Insta360 Ace Pro 2. One representative display reading showed 37.6 FPS throughput and 86 ms end-to-end latency for this specified pipeline. This reading includes the camera-stream demonstration and display path, but it does not represent an in-flight UAV test or a power measurement. The bench setup and live detection display are shown in Figure 12.

4. Discussion

This study proposes YieldNet, a lightweight immature-green-tomato detector built upon an improved YOLOv8n backbone, for detecting and counting green tomatoes in greenhouse UAV imagery. Through the redesign of the backbone, neck, and loss function, the model shows higher measured values. On the Tomato-Recog public validation set, YieldNet has higher metric values than the YOLOv8n baseline model: mAP@50 increases from 0.926 to 0.970 (4.8% relative increase), mAP@50-95 increases from 0.666 to 0.792 (18.9% relative increase), Precision increases from 0.921 to 0.972 (5.5% relative increase), Recall increases from 0.868 to 0.921 (6.1% relative increase), and F1 score increases from 0.894 to 0.946 (5.8% relative increase). On the GreenTomato-UAV validation set, YieldNet reports the following values relative to YOLOv8n: mAP@50 increases from 0.884 to 0.915 (3.5% relative increase), mAP@50-95 increases from 0.457 to 0.473 (3.5% relative increase), Precision increases from 0.872 to 0.905 (3.8% relative increase), Recall increases from 0.820 to 0.855 (4.3% relative increase), and F1 score increases from 0.845 to 0.879 (4.0% relative increase). The ablation results report the metric changes associated with ShuffleNetV2, ECA, PIoU v2, and their combinations; they do not independently verify the proposed internal mechanisms.
Among the detectors listed in Table 6, YieldNet ranks first in mAP@50 and F1 and second in mAP@50-95, Precision, and Recall on the GreenTomato-UAV validation set. On the Tomato-Recog public validation set, it ranks first in all reported metrics among the listed detectors. Compared with RT-DETR-n, YieldNet has absolute Precision differences of 0.087 on the Tomato-Recog public validation set and 0.081 on the GreenTomato-UAV validation set, while using 8.0 rather than 37.4 GFLOPs. These table values show YieldNet’s performance under the common training protocol. Despite an increase in parameters from 3.0 M to 3.3 M, the FLOPs decrease from 8.1 G to 8.0 G, almost maintaining the computational footprint unchanged, supporting real-time processing in the specified RK3588 bench configuration without establishing in-flight UAV performance. The final architecture uses the ShuffleNetV2 backbone and ECA attention, with 0.3 M more parameters and 0.1 G fewer FLOPs than YOLOv8n. These measurements define the lightweight performance trade-off evaluated in this study.
In related research, most tomato detection efforts have primarily focused on ripe or mixed-ripe fruits. Studies targeting the unripe green tomatoes, which can provide early count information relevant to later yield estimation, are still very scarce, and those that combine the use of UAVs in low-altitude scenarios are even rarer. Egi et al. [13] evaluated UAV-based tomato detection and counting in a greenhouse and reported lower class-level detection performance for green tomatoes than for red tomatoes. In this study, YieldNet was evaluated on both GreenTomato-UAV and Tomato-Recog. On Tomato-Recog, the absolute mAP@50-95 and Recall gaps between the Ripe and Unripe classes are 0.083 and 0.039, respectively; with the Ripe class as the reference, the corresponding relative gaps are 9.8% and 4.1%.
However, this study still has several limitations: the images in our self-built dataset were all collected from the same tomato greenhouse, which may raise concerns about excessive data similarity and insufficient generalization capability of the model structure. To address this concern, we also introduced testing on the public dataset Tomato-Recog in both baseline comparison experiments and mainstream model comparison experiments. These results provide an additional benchmark, but do not establish generalization across greenhouse sites, varieties, seasons, illumination conditions, or UAV platforms. The current annotations do not contain occlusion-level labels; therefore, no quantitative comparison among non-occluded, mildly occluded, and severely occluded targets is reported.
The offline RK3588 benchmark in Table 8 places YieldNet between YOLOv8n and YOLOv8s in latency, throughput, model size, and memory use. The live UVC result is a representative bench reading rather than an in-flight test; power and battery use were not measured.
We plan to expand the scale of the dataset in future research work, incorporating more diverse real agricultural scenarios and images under different lighting and climatic conditions, to further improve the generalization performance of the model. In addition, future work will extend the current Orange Pi bench demonstration to in-flight UAV integration and power-aware testing. Field evaluations against manual fruit counts will also be required to assess practical counting performance.

5. Conclusions

In summary, this study proposes the lightweight detector YieldNet for immature tomato detection in UAV-acquired greenhouse images. YieldNet modifies YOLOv8n through a ShuffleNetV2 backbone, ECA modules in the neck, and PIoU v2 loss. The ablation study evaluates the metric changes associated with these components and their final combination. In the evaluated images, the model detects green tomatoes among visually similar leaves and branches. The evaluation used both self-acquired UAV imagery of greenhouse green tomatoes and the public Tomato-Recog benchmark. Under the present protocol, YieldNet reports higher validation metrics than YOLOv8n: On the Tomato-Recog public validation set, YieldNet has higher reported metric values than YOLOv8n, with Precision improving by a relative 5.5% (from 0.921 to 0.972), F1-score improving by a relative 5.8% (from 0.894 to 0.946), and most notably mAP@50-95 substantially improving by a relative 18.9% (from 0.666 to 0.792). On the GreenTomato-UAV validation set, YieldNet also has higher reported values than YOLOv8n, improving mAP@50 by a relative 3.5% (from 0.884 to 0.915), mAP@50-95 by a relative 3.5% (from 0.457 to 0.473), and F1-score by a relative 4.0% (from 0.845 to 0.879). These results support YieldNet for green-tomato detection on the evaluated datasets. Relative to YOLOv8n, YieldNet increases the parameter count from 3.0 M to 3.3 M and decreases FLOPs from 8.1 G to 8.0 G. The results provide countable detections as inputs to a future pre-harvest yield-estimation pipeline; fruit size, temporal tracking, count-to-weight conversion, and harvest-weight validation were not evaluated.

Author Contributions

Conceptualization, C.Y. and L.L.; methodology, C.Y.; software, C.Y.; validation, C.Y. and B.H.; formal analysis, C.Y.; investigation, C.Y. and B.H.; resources, L.L.; data curation, C.Y. and B.H.; writing—original draft preparation, C.Y.; writing—review and editing, C.Y. and L.L.; visualization, C.Y.; supervision, L.L.; project administration, L.L.; funding acquisition, L.L. All authors have read and agreed to the published version of the manuscript.

Funding

This research was funded by the National Natural Science Foundation of China, grant number 62471049, and the Beijing Natural Science Foundation Undergraduate “Qiyan” Program, grant number 26QY0320. The APC was funded by the National Natural Science Foundation of China.

Institutional Review Board Statement

Not applicable.

Informed Consent Statement

Not applicable.

Data Availability Statement

The data presented in this study are available on request from the corresponding author.

Conflicts of Interest

The authors declare no conflicts of interest. The funders had no role in the design of the study; in the collection, analyses, or interpretation of data; in the writing of the manuscript; or in the decision to publish the results.

References

  1. Kitinoja, L.; AlHassan, H.Y. Identification of Appropriate Postharvest Technologies for Small Scale Horticultural Farmers and Marketers in Sub-Saharan Africa and South Asia—Part 1. Postharvest Losses and Quality Assessments. Acta Hortic. 2012, 934, 31–40. [Google Scholar] [CrossRef] [Scilit]
  2. Izdori, F.J.; Mkwambisi, D.; Karuaihe, S.T.; Papargyropoulou, E. Multi-stakeholder collaboration framework for post-harvest loss reduction: The case of tomato value chain in Iringa and Morogoro regional in Tanzania. Agric. Food Econ. 2025, 13, 6. [Google Scholar] [CrossRef] [Scilit]
  3. Shawon, S.M.; Ema, F.B.; Mahi, A.K.; Niha, F.L.; Zubair, H.T. Crop yield prediction using machine learning: An extensive and systematic literature review. Smart Agric. Technol. 2025, 10, 100718. [Google Scholar] [CrossRef] [Scilit]
  4. Tsouros, D.C.; Bibi, S.; Sarigiannidis, P.G. A Review on UAV-Based Applications for Precision Agriculture. Information 2019, 10, 349. [Google Scholar] [CrossRef] [Scilit]
  5. Radoglou-Grammatikis, P.; Sarigiannidis, P.; Lagkas, T.; Moscholios, I. A compilation of UAV applications for precision agriculture. Comput. Netw. 2020, 172, 107148. [Google Scholar] [CrossRef] [Scilit]
  6. Hu, P.; Zhang, R.; Yang, J.; Chen, L. Development Status and Key Technologies of Plant Protection UAVs in China: A Review. Drones 2022, 6, 354. [Google Scholar] [CrossRef] [Scilit]
  7. Rejeb, A.; Abdollahi, A.; Rejeb, K.; Treiblmaier, H. Drones in agriculture: A review and bibliometric analysis. Comput. Electron. Agric. 2022, 198, 107017. [Google Scholar] [CrossRef] [Scilit]
  8. Zhou, H.; Huang, F.; Lou, W.; Gu, Q.; Ye, Z.; Hu, H.; Zhang, X. Yield prediction through UAV-based multispectral imaging and deep learning in rice breeding trials. Agric. Syst. 2025, 223, 104214. [Google Scholar] [CrossRef] [Scilit]
  9. Shahi, T.B.; Xu, C.-Y.; Neupane, A.; Guo, W. Machine learning methods for precision agriculture with UAV imagery: A review. Electron. Res. Arch. 2022, 30, 4277–4317. [Google Scholar] [CrossRef] [Scilit]
  10. Redmon, J.; Divvala, S.; Girshick, R.; Farhadi, A. You Only Look Once: Unified, Real-Time Object Detection. In Proceedings of the 2016 IEEE Conference on Computer Vision and Pattern Recognition (CVPR), Las Vegas, NV, USA, 27–30 June 2016; pp. 779–788. [Google Scholar] [CrossRef] [Scilit]
  11. Redmon, J.; Farhadi, A. YOLOv3: An Incremental Improvement. arXiv 2018, arXiv:1804.02767. [Google Scholar] [CrossRef] [Scilit]
  12. Sohan, M.; Ram, T.S.; Reddy, C.V.R. A Review on YOLOv8 and Its Advancements. In Data Intelligence and Cognitive Informatics; Springer: Singapore, 2024; pp. 529–545. [Google Scholar] [CrossRef] [Scilit]
  13. Egi, Y.; Hajyzadeh, M.; Eyceyurt, E. Drone-Computer Communication Based Tomato Generative Organ Counting Model Using YOLO V5 and Deep-Sort. Agriculture 2022, 12, 1290. [Google Scholar] [CrossRef] [Scilit]
  14. Wang, A.; Xu, Y.; Hu, D.; Zhang, L.; Li, A.; Zhu, Q.; Liu, J. Tomato Yield Estimation Using an Improved Lightweight YOLO11n Network and an Optimized Region Tracking-Counting Method. Agriculture 2025, 15, 1353. [Google Scholar] [CrossRef] [Scilit]
  15. Chai, S.; Wen, M.; Li, P.; Zeng, Z.; Tian, Y. DCFA-YOLO: A Dual-Channel Cross-Feature-Fusion Attention YOLO Network for Cherry Tomato Bunch Detection. Agriculture 2025, 15, 271. [Google Scholar] [CrossRef] [Scilit]
  16. Ji, W.; Pan, Y.; Xu, B.; Wang, J. A Real-Time Apple Targets Detection Method for Picking Robot Based on ShufflenetV2-YOLOX. Agriculture 2022, 12, 856. [Google Scholar] [CrossRef] [Scilit]
  17. Zeng, T.; Li, S.; Song, Q.; Zhong, F.; Wei, X. Lightweight tomato real-time detection method based on improved YOLO and mobile deployment. Comput. Electron. Agric. 2023, 205, 107625. [Google Scholar] [CrossRef] [Scilit]
  18. Chen, W.; Liu, M.; Zhao, C.; Li, X.; Wang, Y. MTD-YOLO: Multi-task deep convolutional neural network for cherry tomato fruit bunch maturity detection. Comput. Electron. Agric. 2024, 216, 108533. [Google Scholar] [CrossRef] [Scilit]
  19. Xu, Z.; Luo, T.; Lai, Y.; Liu, Y.; Kang, W. EdgeFormer-YOLO: A Lightweight Multi-Attention Framework for Real-Time Red-Fruit Detection in Complex Orchard Environments. Mathematics 2025, 13, 3790. [Google Scholar] [CrossRef] [Scilit]
  20. Ma, N.; Zhang, X.; Zheng, H.-T.; Sun, J. ShuffleNet V2: Practical Guidelines for Efficient CNN Architecture Design. In Proceedings of the Computer Vision—ECCV 2018, Munich, Germany, 8–14 September 2018; pp. 122–138. [Google Scholar] [CrossRef] [Scilit]
  21. Wang, Q.; Wu, B.; Zhu, P.; Li, P.; Zuo, W.; Hu, Q. ECA-Net: Efficient Channel Attention for Deep Convolutional Neural Networks. In Proceedings of the 2020 IEEE/CVF Conference on Computer Vision and Pattern Recognition (CVPR), Seattle, WA, USA, 13–19 June 2020; pp. 11531–11539. [Google Scholar] [CrossRef] [Scilit]
  22. Liu, C.; Wang, K.; Li, Q.; Zhao, F.; Zhao, K.; Ma, H. Powerful-IoU: More straightforward and faster bounding box regression loss with a nonmonotonic focusing mechanism. Neural Netw. 2024, 170, 276–284. [Google Scholar] [CrossRef] [Scilit] [PubMed]
  23. Zhang, X.; Zhou, X.; Lin, M.; Sun, J. ShuffleNet: An Extremely Efficient Convolutional Neural Network for Mobile Devices. In Proceedings of the 2018 IEEE/CVF Conference on Computer Vision and Pattern Recognition (CVPR), Salt Lake City, UT, USA, 18–23 June 2018; pp. 6848–6856. [Google Scholar] [CrossRef] [Scilit]
  24. Dong, Q.; Sun, L.; Han, T.; Cai, M.; Gao, C. PestLite: A Novel YOLO-Based Deep Learning Technique for Crop Pest Detection. Agriculture 2024, 14, 228. [Google Scholar] [CrossRef] [Scilit]
  25. Kotthapalli, M.; Ravipati, D.; Bhatia, R. YOLOv1 to YOLOv11: A Comprehensive Survey of Real-Time Object Detection Innovations and Challenges. arXiv 2025, arXiv:2508.02067. [Google Scholar] [CrossRef] [Scilit]
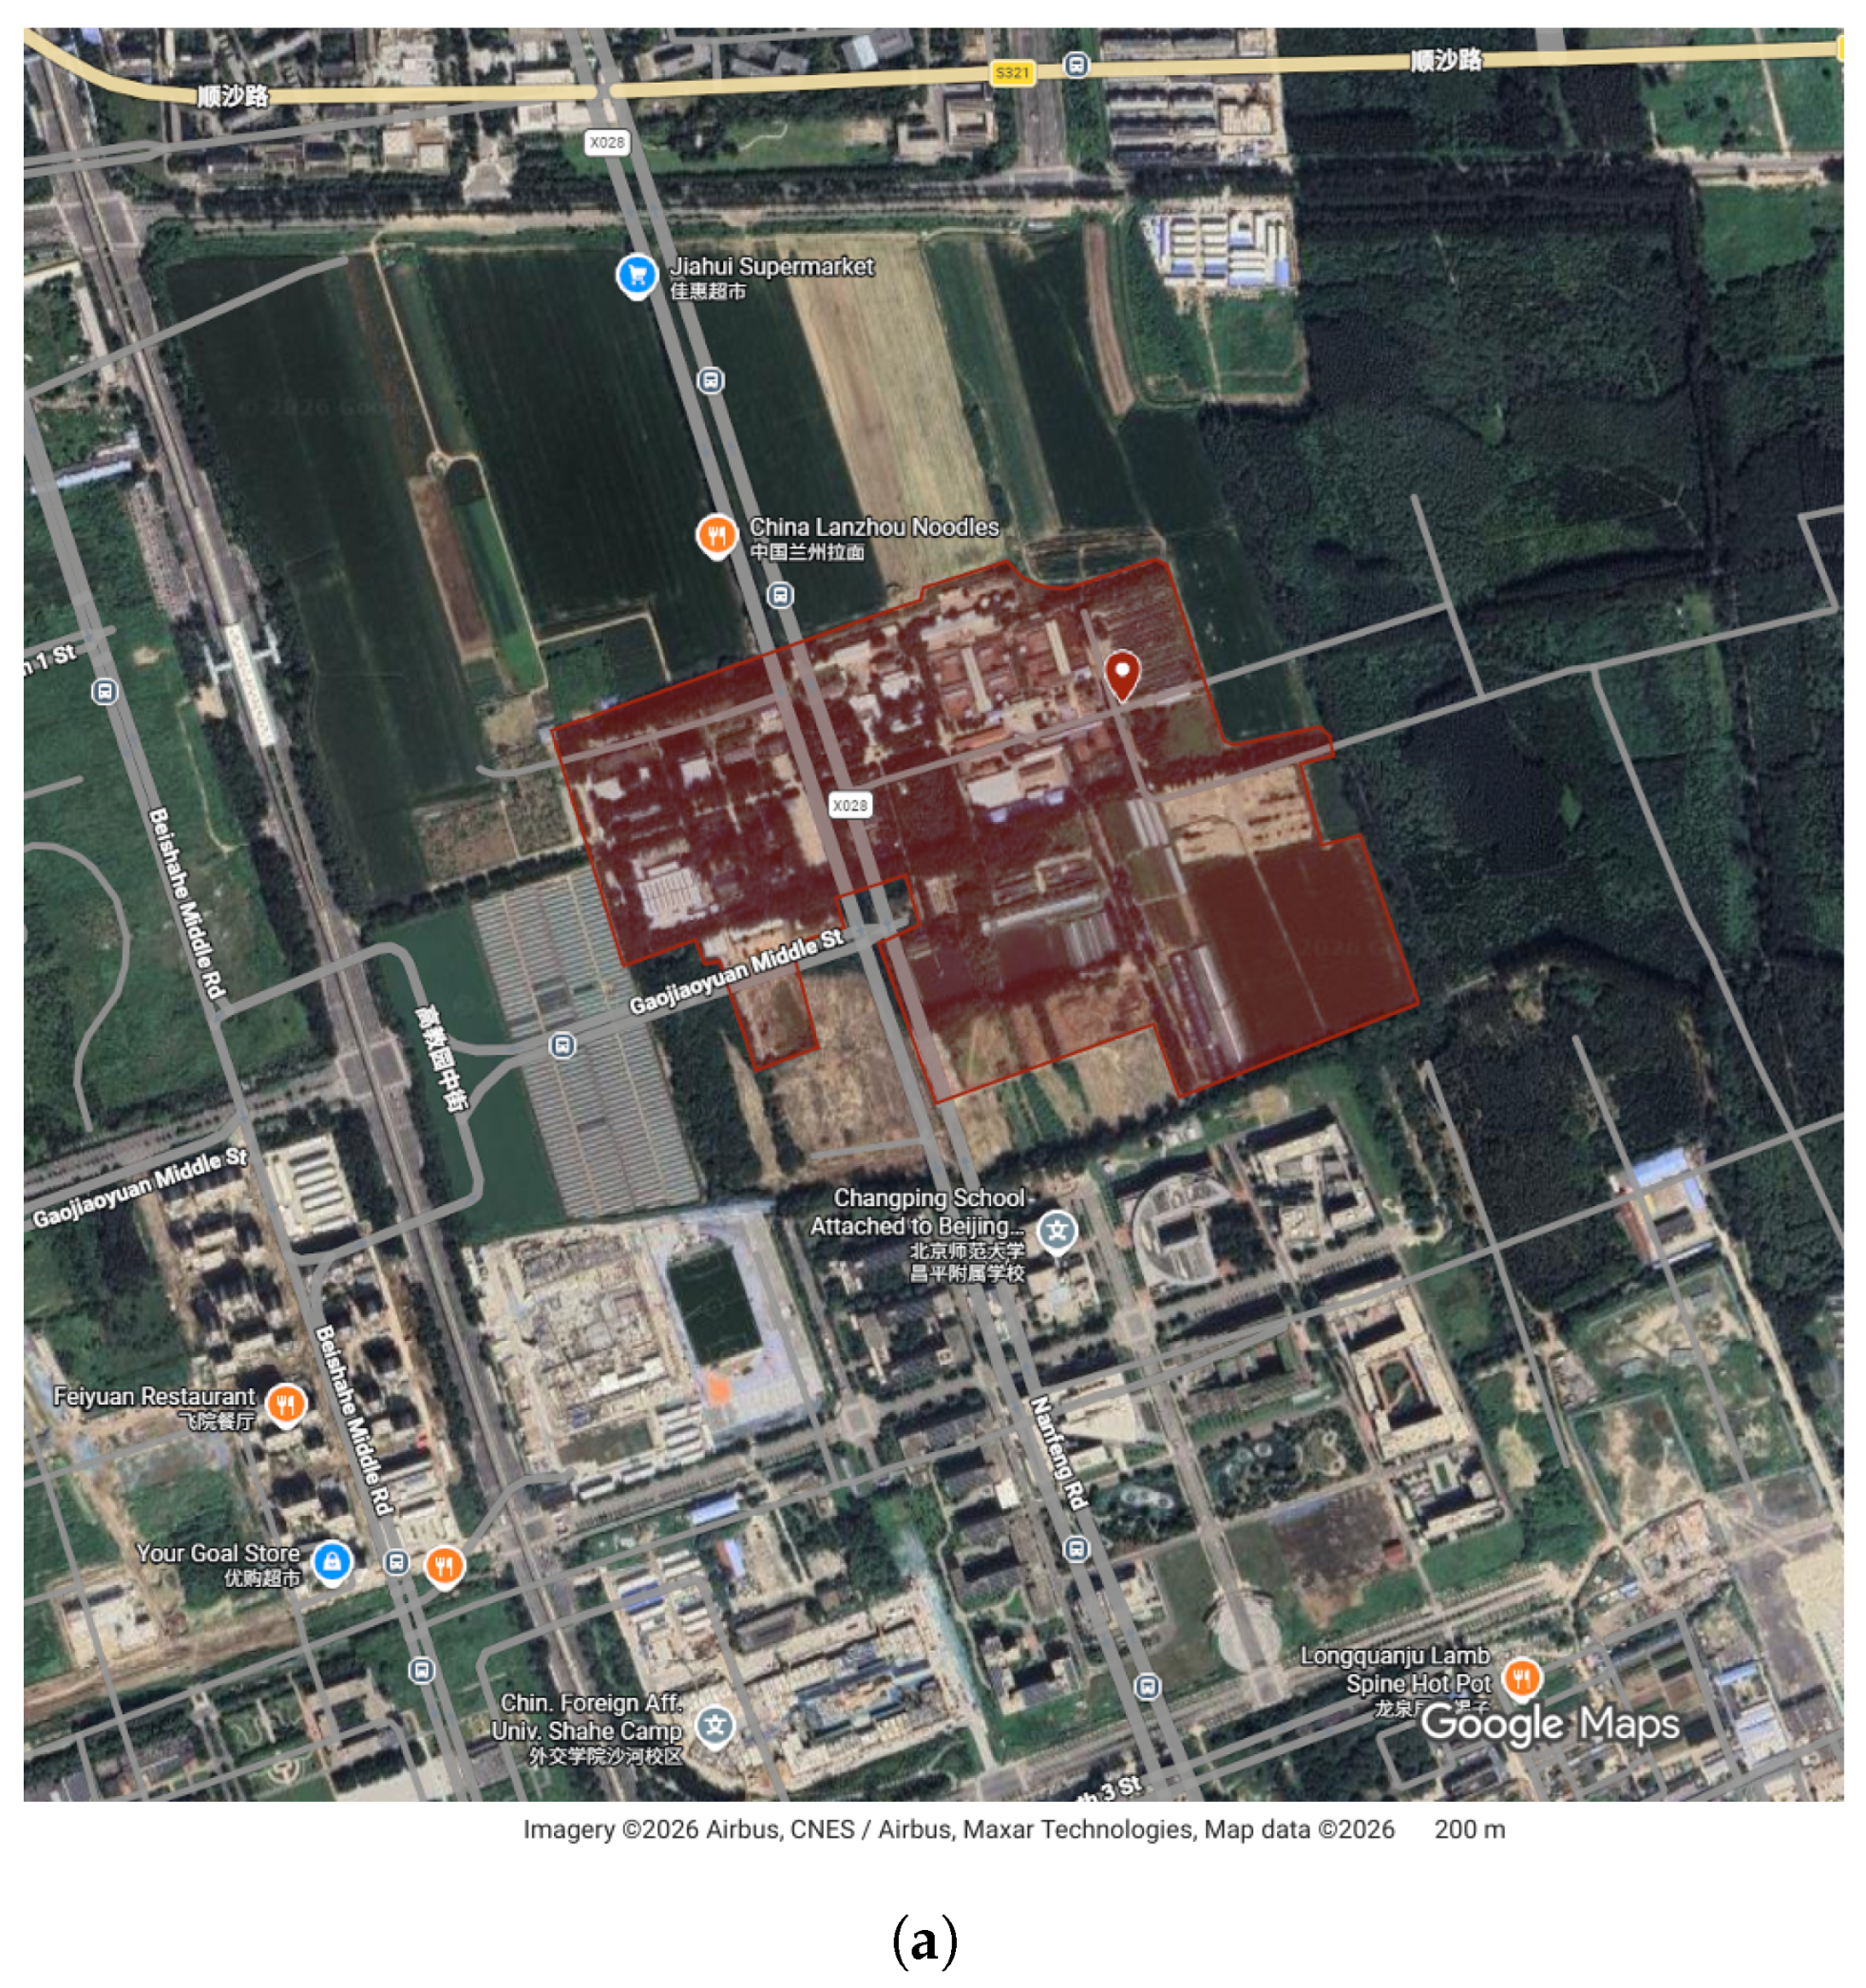
Figure 1. Study site and greenhouse acquisition area: (a) regional location of the China Nongjiyuan Agricultural Machinery Test Station; (b) greenhouse image-acquisition area outlined in red. Source: Google Maps satellite imagery (web service) (accessed 15 July 2026). Imagery © 2026 Airbus, CNES/Airbus, and Maxar Technologies; map data © 2026. Original on-image attribution is retained.
Agriengineering 08 00311 g001aAgriengineering 08 00311 g001b
Figure 2. UAV serpentine flight path for image acquisition over planting beds. Orange arrows indicate the flight direction; green and red fruit symbols indicate unripe and ripe tomatoes, respectively; and the pale green rectangles indicate planting beds.
Agriengineering 08 00311 g002
Figure 3. Representative UAV-acquired dataset samples illustrating key challenges in agricultural UAV imagery: (a) mature tomatoes, (b) complex greenhouse environment, (c) overexposure, (d) weed interference, (e) motion blur, and (f) leaf occlusion.
Agriengineering 08 00311 g003
Figure 4. Incremental data augmentation workflow (S-shaped). Nodes represent datasets/mother sets, while augmentation operations are indicated on the arrows. Each round samples 0.2 N images from the current mother set. After three rounds, the final mother set contains 1.6 N images.
Agriengineering 08 00311 g004
Figure 5. Overall architecture of YieldNet. The purple module highlights the components modified or added compared to the YOLOv8n baseline.
Agriengineering 08 00311 g005
Figure 6. Evolution of ShuffleNetV2 building blocks: (a) original basic block with channel split, DWConv and shuffle; (b) SE module inserted in the residual branch; (c) SE module applied after concatenation for global channel recalibration. All blocks maintain channel shuffle for cross-group information exchange.
Agriengineering 08 00311 g006
Figure 7. Model of ECA mechanism. H is the height, W is the width, and C is the number of channels.
Agriengineering 08 00311 g007
Figure 8. Qualitative comparison of detection results on two datasets: GreenTomato-UAV (top) and Tomato-Recog (bottom).
Agriengineering 08 00311 g008
Figure 9. Ablation visualization on the GreenTomato-UAV validation set. (a) Ground-truth boxes; (b) baseline YOLOv8n; (c) YOLOv8n + ShuffleNetV2; (d) YOLOv8n + ECA; (e) YOLOv8n + ShuffleNetV2 + ECA; and (fi) further equipped with PIoU v2. Rectangular frames denote ground-truth boxes in (a) and model-predicted boxes in (bi); heatmap colors indicate relative activation intensity. Best viewed in color.
Agriengineering 08 00311 g009
Figure 10. Validation mAP@50 and mAP@50-95 curves during training: (a) Tomato-Recog public validation set; (b) GreenTomato-UAV validation set.
Agriengineering 08 00311 g010
Figure 11. Training loss curves during training: (a) Tomato-Recog public validation set; (b) GreenTomato-UAV validation set.
Agriengineering 08 00311 g011aAgriengineering 08 00311 g011b
Figure 12. Bench demonstration of YieldNet on the Orange Pi 5 Max with live UVC camera input.
Agriengineering 08 00311 g012
Table 1. Experimental platform configuration.
ComponentConfiguration
Operating SystemUbuntu 20.04.6 LTS (Kernel 5.15.0-139-generic)
CPU13th Gen Intel Core i9-13900HX @ 2.4 GHz (Turbo Boost 5.4 GHz)
GPUNVIDIA GeForce RTX 4060 Laptop GPU 8 GB GDDR6
GPU AcceleratorCUDA 12.1, cuDNN 8.7
Deep Learning FrameworkPyTorch 2.4.1 + cu121
Hardware Configuration15 GB RAM, 320 GB NVMe SSD
CompilerPython 3.8.20 (Anaconda environment)
Programming LanguagePython 3.8.20
Table 2. Stability evaluation over three random seeds on the GreenTomato-UAV validation set.
ModelmAP@50mAP@50-95PrecisionRecallF1
YOLOv8n baseline0.8887 ± 0.00720.4583 ± 0.00320.8727 ± 0.02300.8253 ± 0.01860.8480 ± 0.0028
YieldNet0.9097 ± 0.00570.4730 ± 0.00360.9057 ± 0.00810.8483 ± 0.00860.8760 ± 0.0043
Table 3. Detection performance on the Tomato-Recog public validation set (596 images, 2228 instances).
ModelClassmAP@50mAP@50-95PrecisionRecallF1Params (M)GFLOPs
YOLOv8n baselineAll0.9260.6660.9210.8680.8943.008.1
Ripe0.9310.7090.9590.8820.9193.00
Semiripe0.9060.6520.9190.8200.8673.00
Unripe0.9420.6370.8840.9010.8923.00
YieldNet (Ours)All0.9700.7920.9720.9210.9463.308.0
Ripe0.9900.8461.0000.9600.9803.30
Semiripe0.9510.7650.9530.8830.9173.30
Unripe0.9690.7630.9640.9210.9423.30
Bold indicates improvement over baseline (≥1.5% absolute gain where applicable).
Table 4. Detection performance on the GreenTomato-UAV validation set (180 images, 590 instances).
ModelClassmAP@50mAP@50-95PrecisionRecallF1Params (M)GFLOPs
YOLOv8n baselineAll0.8840.4570.8720.8200.8453.008.1
YieldNet (Ours)All0.9150.4730.9050.8550.8793.308.0
Same notation as Table 3.
Table 5. Ablation study on the integration of ShuffleNetV2, ECA, and PIoU v2 components on the GreenTomato-UAV validation set (180 images, 590 instances).
ModelmAP@50mAP@50-95PrecisionRecallF1Params (M)GFLOPs
YOLOv8n baseline (no PIoU)0.8840.4570.8720.8200.8453.008.1
+ShuffleNetV2 (no PIoU)0.9120.4600.9040.8340.8673.308.0
+ECA (no PIoU)0.9050.4590.8930.8270.8583.008.1
+ShuffleNetV2-ECA (no PIoU)0.9120.475 *0.9040.8390.8703.308.0
+PIoU v20.8960.4560.8620.8420.8513.008.1
+ShuffleNetV2 + PIoU v20.9080.4620.8960.871 *0.883 *3.308.0
+ECA + PIoU v20.8960.4690.8880.8140.8493.008.1
YieldNet (ShuffleNetV2-ECA + PIoU v2)0.915 *0.4730.905 *0.8550.8793.308.0
Bold indicates improvement over baseline (≥1.5% absolute gain). * indicates the best value in the column. All values are reported for the “All” class on the GreenTomato-UAV validation set.
Table 6. Comparison with other models on the Tomato-Recog public validation set and GreenTomato-UAV validation set.
ModelmAP@50mAP@50-95PrecisionRecallF1Params (M)GFLOPs
Tomato-Recog public validation set (596 images, 2228 instances)
YOLOv8n (baseline)0.9260.6660.9210.8680.8943.008.1
YieldNet (Ours)0.970 *0.792 *0.972 *0.921 *0.946 *3.308.0
YOLOv8s0.9580.7470.9560.8980.92611.1028.4
YOLOv5n0.9150.6410.8720.8650.8682.507.1
YOLOv5s0.9600.7210.9520.9070.9299.1023.8
YOLOv11n0.9200.6360.9010.8560.8782.606.3
YOLOv11s0.9510.7220.9630.8680.9139.4021.3
RT-DETR-n0.8690.6330.8850.8440.86415.5037.4
GreenTomato-UAV validation set (180 images, 590 instances)
YOLOv8n (baseline)0.8840.4570.8720.8200.8453.008.1
YieldNet (Ours)0.915 *0.4730.9050.8550.879 *3.308.0
YOLOv8s0.9010.4730.8940.861 *0.87711.1028.4
YOLOv5n0.8980.4560.8490.8530.8512.507.1
YOLOv5s0.9000.474 *0.910 *0.8240.8659.1023.8
YOLOv11n0.8970.4530.8820.8340.8572.606.3
YOLOv11s0.9010.4680.8850.8350.8599.4021.3
RT-DETR-n0.8620.4300.8240.8160.82015.5037.4
Bold indicates improvement over YOLOv8n baseline (≥1.5% absolute gain where applicable). * indicates the best value in the column for the respective validation set. All values are reported on the “All” class.
Table 7. Key settings for Orange Pi 5 Max deployment.
CategoryItemValue
HardwareDeviceOrange Pi 5 Max
SoC and memoryRockchip RK3588; 8 GB RAM
SoftwareOperating systemUbuntu 24.04.1 LTS ARM64
NPU runtimeRKNN Lite/librknnrt 2.3.2
ModelFormatNon-quantized YieldNet RKNN
Input 640 × 640 ; batch size 1
Live pipelineCameraInsta360 Ace Pro 2 UVC
Stream 1280 × 720 MJPEG; 30 FPS
ProcessingCentre 25% ROI; three asynchronous NPU cores
Table 8. Offline RK3588 inference performance at 640 × 640 input and batch size 1.
ModelParams
(M)
GFLOPsRKNN
(MB)
p50
(ms)
FPSMemory
(MiB)
YOLOv8n3.008.17.9952.7947.00314.0
YieldNet (Ours)3.308.013.5869.6537.46332.1
YOLOv8s11.1028.424.6698.0026.42450.4
Non-quantized RKNN models; latency is per-request NPU p50, FPS is aggregate three-core throughput, and memory is maximum resident set size. Power was unavailable.
Disclaimer/Publisher’s Note: The statements, opinions and data contained in all publications are solely those of the individual author(s) and contributor(s) and not of MDPI and/or the editor(s). MDPI and/or the editor(s) disclaim responsibility for any injury to people or property resulting from any ideas, methods, instructions or products referred to in the content.