Article

Optimizing Farm-Scale Emission Estimation: A Prototype Decision Support Tool for Livestock Systems


by
Evangelos Alexandropoulos
1,*,
Vasileios Anestis
1,
Federico Dragoni
2,
Alexandros Mavrommatis
3,
Eleni Tsiplakou
3,
Nicholas John Hutchings
4,
Barbara Amon
2,5 and
Thomas Bartzanas
1
1
Department of Natural Resources Development and Agricultural Engineering, Agricultural University of Athens, Iera Odos 75, 11855 Athens, Greece
2
Leibniz-Institute for Agricultural Engineering and Bioeconomy (ATB), 14469 Potsdam, Germany
3
Department of Animal Science, Agricultural University of Athens, Iera Odos 75, 11855 Athens, Greece
4
Department of Agroecology, Aarhus University, Blichers Allé 20, 8830 Tjele, Denmark
5
Faculty of Civil Engineering, Architecture and Environmental Engineering, University of Zielona Góra, 65-417 Zielona Góra, Poland
*
Author to whom correspondence should be addressed.
AgriEngineering 2026, 8(8), 309; https://doi.org/10.3390/agriengineering8080309
Submission received: 4 June 2026 / Revised: 22 July 2026 / Accepted: 23 July 2026 / Published: 27 July 2026

Abstract

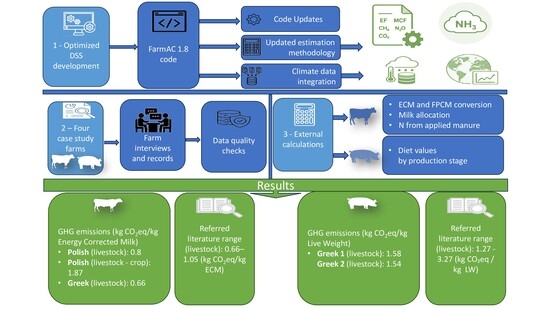
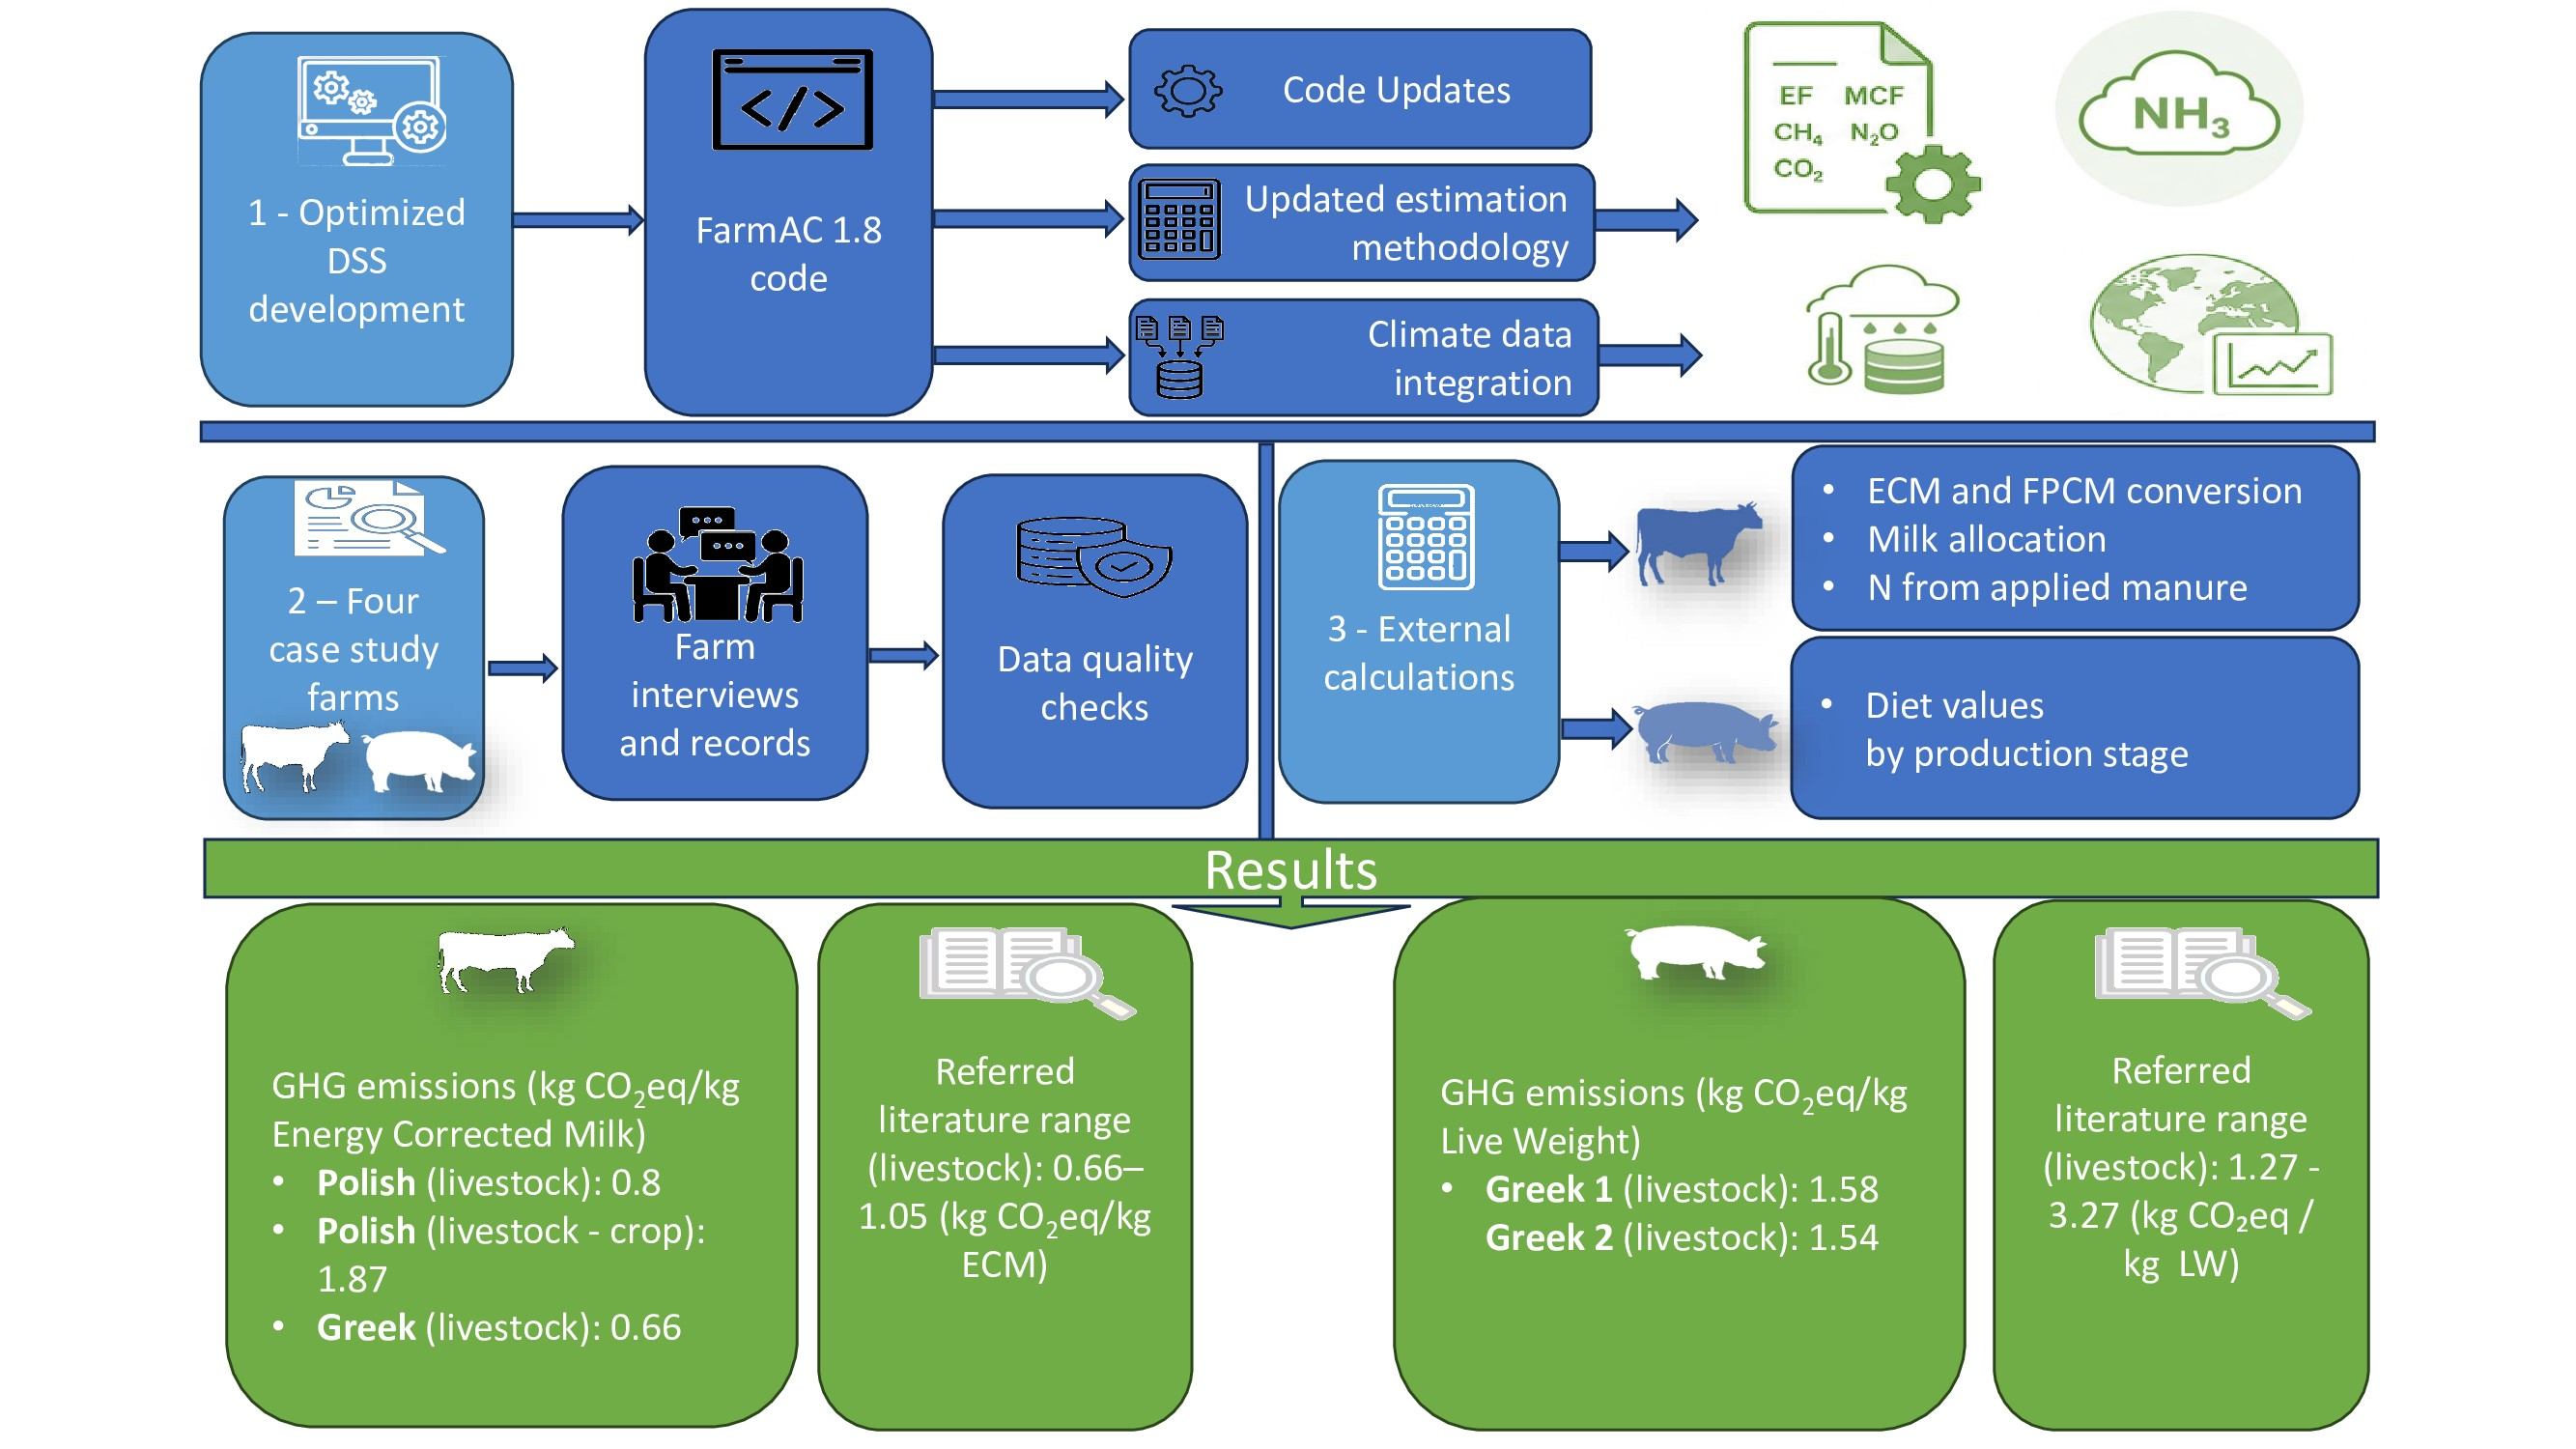
To meet national and global air quality and climate ceilings, it is essential to provide farm-level decision support tools for mitigating gaseous emissions from agriculture. A major challenge is to develop reliable tools that can be adapted to country-specific conditions, particularly in countries where such tools are currently lacking, and support farmers in assessing emission mitigation measures. To address this challenge, a Prototype Decision Support Tool (PDST) for estimating and mitigating gaseous emissions at the livestock farm scale was developed based on the FarmAC whole-farm model. The PDST supports livestock farm-level assessment of carbon emissions, including CH4 and CO2, and nitrogen-related emissions, including N2O and NH3. Emissions were estimated using the IPCC 2006 Guidelines, their 2019 Refinement, and the EMEP/EEA 2023 methodology. The PDST was applied to two intensive pig farms in Greece, both with fully slatted housing and outdoor slurry tank storage, and two intensive dairy cattle farms, one in Greece and one in Poland, both using deep-litter housing with solid manure storage. For these farms, the PDST estimated total annual emissions of 1.58 and 1.54 kg CO2eq per kg of pig live weight and 0.80 and 0.66 kg CO2-eq per kg of raw milk, respectively. These estimates were consistent with values reported in the literature for comparable production systems and emission sources, supporting the preliminary consistency of the PDST outputs. The PDST can form the software basis to support stakeholders in choosing farm-level practices that specifically reduce emissions.

Graphical Abstract

1. Introduction

Global greenhouse gas (GHG) emissions (all sectors, including Land Use, Land Use Change and Forestry—LULUCF) have increased exponentially over the last three decades, with the overall increase from 1990 to 2021 being close to 34% [1]. Over the same period, most UNFCCC countries (35 out of 44) recorded a decline in anthropogenic GHG emissions, reflecting a growing commitment to emission reduction and long-term climate objectives such as the Paris Agreement [2,3,4,5]. In addition to GHG, NH3 and other air pollutants continue to pose significant challenges to environmental quality and public health. Ammonia contributes to eutrophication, acidification, and the formation of health-threatening secondary fine particulate matter [6,7]. Although NH3 is not itself a greenhouse gas, it is indirectly linked to GHG emissions, as its subsequent deposition to the earth’s surface increases nitrous oxide (N2O) emissions [8,9]. The global livestock sector contributes significantly to GHG emissions: in 2023, it accounted for 64.3% of the GHG emissions from agriculture, forestry, and other land uses (AFOLU) [1].
In the context of climate change mitigation, accurate estimation of GHG emissions from every on-farm source is of critical importance [10,11,12,13,14]. Despite the extensive efforts that have been made to measure GHG emissions from key sources on farms, it is impractical and costly to monitor all emissions simultaneously from such dispersed emission sources [15,16]. Decision support systems (DSSs), also known as Decision Support Tools (DSTs), are essential in precision agriculture as they integrate data analysis and predictive modeling to improve accuracy and forecasting capabilities and allow decision making [17,18,19]. The use of farm-scale emission-based DSTs could provide a user-friendly interface for facilitating the on-farm estimation of GHG and NH3 emissions and their mitigation options [10,20,21,22]. Many farm-scale DSTs have been developed so far (e.g., Overseer [23], Holos [24], Carbon Navigator [25]) to estimate GHG emissions by using different types of methodologies and functions [26]. The IPCC guidelines provide the most widely recognized methodology for estimating GHG emissions from livestock systems at the national emission inventory level, and they can be applied at the farm level with some precautions, owing to how emission factors (EFs) are defined [26,27,28].
Farm-scale DSTs can support emission estimation, scenario comparison, and the identification of relevant mitigation options, helping farmers and advisors make more informed decisions while improving their understanding of GHG and nitrogen (N) emission sources in livestock systems [15,26,29,30,31]. In order to ensure reliable results and widespread adoption, it is essential that a DST integrates up-to-date methodologies and parameter values [13,28,32,33]. Furthermore, it should offer an easy-to-use interface and deliver reliable, targeted, and easily understandable outputs that enable rapid access to relevant advice [26,34].
A key limitation of existing DSTs is the lack of a standardized estimation methodology, which results in inconsistent indicators across tier approaches, default values, and EFs [26,35,36]. Higher IPCC tier methods can improve reliability [37,38]. However, they require more detailed data [37,38], which, in some cases, are impossible to collect in the livestock sector, particularly in mixed systems. Estimates of GHG emissions also vary with climate conditions and may use location-specific emission factors [39,40], so direct comparison between DSTs is difficult.
In countries that currently lack such tools, any new DST should apply up-to-date inventory methodologies and use climate data specific to the farm’s agroecological zone [41,42]. At the national scale, this can be achieved by adapting existing systems to local conditions, integrating country-specific data, EFs, and other relevant information [43,44]. However, methodologies used for reporting under UNFCCC aim to create an emission inventory that is representative of the whole country. The extent to which these inventories can reflect variations in emissions from different farming systems is constrained by the difficulty in obtaining detailed activity data. This limits the detail required for EFs and other parameters. At the farm scale, the aim is to create an inventory that is representative of a specific farm. Here, the potential availability of detailed activity data is high, so the challenge is to collect these data and provide appropriately detailed EFs and other parameters. The latter is resource-demanding, since it will generally require collection of empirical data and real-world experimentation. A pragmatic approach is to begin with the methodology and EFs developed for the national scale and then seek to increase the level of specificity as and when resources become available. In this respect, it is important to note that the availability of country-specific agricultural EFs varies across Europe and by emission source. For instance, countries such as Denmark, Belgium, Italy, and Poland use country-specific or higher-tier approaches for certain livestock and manure management categories [45]. In contrast, other countries, including Greece, still rely partly on IPCC default EFs for specific parameters and emission sources, particularly manure management and managed-soil N2O emissions [45]. The current evidence suggests a stronger representation of EF references and observations in Western and Northern European countries rather than in Southern and Eastern Europe, although this pattern is not uniform across all countries [46,47]. Although there are large variations in farming systems between (and sometimes within) countries, all integrated GHG DSTs have a common requirement to manage on-farm nitrogen (N) and carbon (C) flows. This requires a significant investment in software infrastructure, so resources can be saved if the necessary software already exists and is available for adaptation. In the work reported here, we adapted existing software to develop DSTs for two case-study countries.

2. Materials and Methods

2.1. Case Study Countries

Two countries were selected: Greece and Poland. Greece was used as a Southern European case with limited country-specific EF literature. Poland was used as a Central–Eastern European case with available EF literature. Recent studies by Anestis et al. [48] and Akamati et al. [49] have reported emission intensity values and related coefficients for Greek pig production systems, which can be combined with relevant activity data to estimate GHG emissions. However, there is a methodological gap, as country-specific farm-level decision support tools dedicated to the integrated estimation of GHG and NH3 emissions appear to be limited or not widely available in either Greece or Poland. Additionally, two different types of cattle production systems were examined, since livestock systems in Greece often involve only livestock, whereas the cattle systems in Poland can typically integrate livestock with crop production.
The present study focuses on cattle and swine because these species represent major contributors to livestock-related GHG emissions. They also offer practical opportunities for improvements through farm-level monitoring. Poultry systems are generally more standardized and strongly housing-dependent, while sheep and goat systems are more heterogeneous in terms of breeds, production purposes, and management practices, making them more difficult to assess within the scope of this prototype tool.
The purpose of this work is to develop a reliable DST based on the existing code of the FarmAC farm-scale model (version 1.8, Aarhus University, Tjele, Denmark) [50]. The FarmAC model has the ambition to have global scope and include the effects of C sequestration. Therefore, the FarmAC methodology and code were updated and adapted into the PDST prototype. Recent IPCC and EMEP/EEA methodologies were integrated, together with country-specific agroecological-zone information. The resulting prototype was then applied to selected commercial case-study farms to assess its technical applicability and methodological consistency.
The initial development focused on software reliability. Key functions were enabled, including agroecological zone (AEZ) selection, parameter updating (EFs/activity data), and closure of carbon (C) and nitrogen (N) budgets at the component and whole-farm levels. Specifically, this study aims to adapt FarmAC to existing AEZs (country-specific inputs) so that they better represent the climatic conditions in Greece and Poland, refine the empirical models and underlying algorithms used for emission calculations, and incorporate additional farm-specific parameters, such as feed types, housing type, and animal development stage. These improvements aim to enhance the robustness of the methodology, improve the accuracy and applicability of emission estimates in livestock systems, and provide a more reliable, regionally relevant, and country-specific tool for farm-scale assessment of GHG and N emissions and mitigation options. Overall, the study provides practical guidance for applying the PDST and its underlying code to estimate emissions according to the specific characteristics of each country or region.

2.2. Development of Modifications

All updates and integrations to the FarmAC code (version 1.8) focused on estimating GHG and NH3 emissions from housing and manure storage in dairy cattle and pig farming systems under Greek and Polish conditions, thus demonstrating the use of FarmAC as a platform DST for the development of country-specific prototypes of farm-scale GHG tools.
FarmAC allows data entry in two ways: (1) via its interface, where the user can create a scenario following the website guidance and insert basic input data related to crop production, yields, ruminant production (cattle), non-ruminant production (pigs), and fertilizer/manure management, and (2) via its code, which can be freely downloaded and modified by users with sufficient knowledge of C#. The first option supports standard data entry through predefined fields, while the second provides greater flexibility, allowing users to implement additional changes and adaptations to achieve more representative and reliable estimations for specific case studies.
The code of FarmAC v1.8 [50] was used as a basis for developing and updating the PDST code.
In the PDST, the estimation of farm-level GHG emissions and other N emissions (such as NH3 and nitrogen oxides (NOx)) was updated by integrating the most recent IPCC [51,52] and EMEP/EEA [45] inventory compilation guidelines.
In addition, data from the UNECE Guidance document for NH3 mitigation [53] was used to integrate the assessment of the NH3 emission reduction associated with a number of farm-level mitigation practices. Furthermore, information from other guidebooks and standards was integrated (e.g., the N excretion per animal per day [54]).
The integrated modifications regarding the methodology are summarized in the Supplementary Materials Table S1.
Advancements in the PDST’s coding framework were executed in two stages:
A thorough audit of the default systemic values and parameters encoded within the FarmAC framework.
Modification of empirical models and computational algorithms for emission estimation, regarding volatile solids and enteric methane emissions from cattle and pigs.

2.2.1. Integration of Climate Data

The AEZs’ climate data constitute the core of both FarmAC and the newly developed PDST since all the parameters (e.g., livestock type, manure storage, livestock housing, fertilizers) are modeled in the context of a specific agroecological zone. However, the FarmAC graphical user interface (GUI) is based on predefined AEZs that have already been implemented in the tool. This means that users cannot directly enter or modify site-specific climate data, such as Greek or Polish precipitation, evapotranspiration, and temperature values, directly from the GUI. This is only possible by using the tool’s code version if these values are already represented by the existing AEZ structure. Therefore, during the development of the PDST, climate data were processed separately and integrated into the tool, enabling it to better reflect the specific climatic conditions of the selected Greek and Polish case-study areas.
All the climate data (i.e., precipitation, evapotranspiration, temperature) were acquired from the Climate Research Unit of CEDA [55], as suggested in [52], and then processed to be included in the PDST. The climate data values for the year 2021 were collected from each country’s specific datasheets.
Greek and Polish climate data were included in the ‘Agroecological zone’ setup of the PDST and are presented in Table S2.
Greece was associated with a warm, temperate, dry climate (average annual temperature > 10 °C and a climate ratio < 1) [52]. Poland was classified as a cool, temperate, dry climate (0 °C < average annual temperature < 10 °C and a climate ratio < 1) [52].
Climate data are included in the model through the agroecological zone setup and can influence the emission estimates in different ways. For instance, the climatic conditions of each zone are connected with the MCF values used for estimating CH4 emissions from manure management [52], while air temperature can also affect NH3 losses during manure application [45]. Climate variables such as air temperature, precipitation, potential evapotranspiration, and drought index affect soil C and N dynamics, crop N uptake, nitrate leaching, and soil CO2 emissions, thereby influencing the overall farm-scale emission balance.

2.2.2. Parameter Modification and Software Execution

The FarmAC v1.8 files were obtained through the FarmAC online tool and subsequently restructured to create the appropriate file paths and ensure the correct execution of the code. The updated PDST version is available through the specified GitHub repository branch. Detailed instructions for downloading and installing the software, preparing and modifying the XML input files, executing the model, and accessing the generated outputs are provided in Method S4.
In order to facilitate the reproducibility of PDST, the repository branch used for the present study is specified in the GitHub repository. The repository contains the example case-study datasets, including the farm XML input files, together with the corresponding parameter, feedstuff, fertilizer/manure, and climate/agroecological zone input files required for model execution. By using these files, the reported case-study calculations can be reproduced by executing the software version under the same .NET 6.0 environment. The generated output files include the results presented in this study. Therefore, the reported calculations can be verified and reproduced.
The GitHub repository also includes a guidebook and an instructional video to help users install the software, prepare and modify the input files, run the model, and understand the generated outputs.

2.2.3. Modifications to Algorithms for Gas Emission Estimation

The PDST is based on FarmAC, which follows the methodological framework of the 2006 IPCC Guidelines for estimating enteric CH4, manure management CH4, and N2O emissions [56]. In parallel, NH3 emissions are estimated using the TAN-based mass-flow approach described in the EMEP/EEA methodology. Therefore, this section focuses only on the main algorithmic modifications introduced in the PDST. The modifications in the gas emission estimation algorithms are related to the following:
Volatile solids. The relevant equation of volatile solid (VS) excretion from livestock (cattle and pigs) [52] was integrated as Equation (1). VS excretion is an important estimation parameter for manure carbon flow in outdoor manure storage installations and, therefore, relevant CH4 emissions.
VS = [{(GEI/day) × (1 − DMdig/day)} + 0.4 (GEI/day)] × {(1 − ASHconc)/18.45)}
The equation used in FarmAC model Equation (2) [50] was based on several parameters related to excreted manure, specifically degradable carbon (Cdeg), non-degradable carbon (CnonDeg), humic carbon (Chumic), and concentration of carbon in organic matter (OMCconc).
VS = (Cdeg + CnonDeg + Chumic)/OMCconc
Emissions from sow housing and manure management. With respect to sows, the PDST distinguishes between the period when the sow is in gestation and in lactation, while the FarmAC model does not differentiate between these two periods. During these two periods, sows could require different housing and manure management. The average number of parturitions per sow per year (PPS) was integrated into the parameter file of the software to be multiplied by a 30-day mean lactation period.
Period for sows in lactation (annual fraction) = (PPS × 30)/365 (days)
Period for sows in gestation (annual fraction) = (365 – (PPS × 30))/365) (days)
Enteric fermentation of pigs. The IPCC Tier 1 methodology is the latest inventory compilation approach for estimating enteric CH4 emissions from pigs (Equation (5)) [52]:
Enteric methane emissions (kg CH4/year) = ((Nnm − (Nnm × DRnm)) × PSS × Ns) × (Dnm/360) × EFshps) + ((Nfp − (Nfp × DRfp)) × (Dsl − Dnm/360) × EFshps) + (Ns × EFshps)
where the number of non-mature pigs (Nnm) is expressed in heads per parturition in heads yr−1; the death rate of non-mature pigs (DRnm) is expressed as a percentage; the final day of non-mature period (Dnm) is expressed as the number of days; the number of finishing pigs is expressed as the number of pigs that complete the non-mature period and enter the finishing stage Nfp = (Nnm − (Nnm × DRnm)) × PSS × Ns), expressed in heads yr−1; the death rate of finishing pigs (DRfp) is expressed as a percentage; the slaughter day (Dsl) is expressed as the number of days; EF = 1.5 kg CH4 head−1 yr−1; and the number of sows (Ns) is expressed in heads yr−1.
Finally, the 100-year Global Warming Potential (GWP100) values for CH4 and N2O were updated according to the most recent IPCC estimates used in the PDST, as presented in Table S3 [57]. Additional qualitative parameters incorporated into the PDST, including livestock categories, feedstuffs, and housing types, are presented in Table S4.

2.2.4. Current Decision Support Functionality

The PDST should be implemented as a prototype calculation and scenario-assessment tool, rather than as a fully automated advisory system. Its decision support function is based on creating a baseline scenario and then comparing it to alternative management scenarios. Mitigation options can be assessed by changing key inputs, such as feed ration, animal numbers, housing, manure storage, manure or fertilizer application, and agroecological zone, and then comparing how these changes affect the estimated GHG and N emissions. However, the present version does not automatically rank mitigation measures or provide direct farm-specific recommendations. As a result, its current use is more suitable for researchers, model developers, and trained advisors.

2.3. Case Studies

Data were collected from two commercial, intensive dairy cattle systems, one in Greece (case study GDCF) and one in Poland (case study PDCF). Furthermore, data from two farrow-to-finish commercial pig farms in Greece (one in the Central Macedonia region—GPF1 and one in the Thessaly region—GPF2) were used to test and enhance the non-ruminant section of the tool.
The case study farms were selected as commercial examples for testing the prototype and not as a statistically representative sample of Greek and Polish livestock production. The main reason for their selection was the availability of complete farm-level input data. At the same time, they provided the possibility to test whether the PDST can be applied under different farm conditions, including different animal species, agroecological zones, manure management systems, and housing systems.
Data were collected through structured on-farm interviews performed by using a previously validated questionnaire [58] designed to capture detailed farm-level information. In the pig case, an analogous template was derived from the cattle one. The questionnaire recorded a wide range of variables, including farm size, production system, herd structure, number of animals across production stages, feeding practices, dietary ingredients, waste management strategies, bedding materials, and animal performance indicators, such as milk yield, growth rates, and live weight. To ensure data accuracy, animal performance metrics and nutritional information were cross-validated against the calculated chemical composition of the diets and evaluated in relation to breed, physiological stage, and production level. Nutrient requirements for dairy calves, growing heifers, dry cows, and lactating cows were estimated using the Nutrient Requirements of Dairy Cattle [59], which provides standardized prediction models for energy and protein needs across all major life stages of dairy cattle. In contrast, nutrient requirements for sows and pigs in all productive phases were derived from the Nutrient Requirements of Swine [60], the most recent edition offering updated physiological models for maintenance, growth, gestation, and lactation in swine. For consistency and comparability across farms and species, feed composition tables from the respective NRC systems [59,60] were used to estimate the chemical composition of all diets assessed.
Input data quality was checked by combining information from farm interviews with available farm records and verifying that the data met the model requirements. The input values were separated into three groups according to their origin. Farm-reported values were obtained from interviews and available farm records and included animal numbers, production outputs, feed rations, housing systems, manure storage, and crop or fertilizer management information. Calculated values were derived from the reported data and included diet chemical composition, ECM and FPCM, allocation factors, N application rates, daily average pig numbers, and live-weight flows. Default or guideline-based values were used only when farm-specific values were not available. These mainly included EFs, manure management coefficients, climate zone parameters, N-excretion values, and GWP values, obtained from the IPCC, EMEP/EEA, UNECE, CEDA, and animal nutrition sources.
To apply the PDST to the case studies, a two-step approach was employed:
  • Initially, baseline estimates for GHG and NH3 emissions were derived using the FarmAC model and the data collected.
  • Subsequently, to refine the PDST output, the developed agroecological zones were used to integrate climate data for Greece and Poland, along with refined EFs and other parameters.

2.3.1. Dairy Cattle Farming

Data for the GDCF and PDCF case studies were collected using templates for environmental impact assessment via Life Cycle Analysis (LCA). Only livestock-related inputs were necessary to run the PDST for the GDCF, while both livestock- and crop-related inputs were necessary for the PDCF. For both systems, data refer to the year 2021. Furthermore, in the PDCF, the daily N excretion per animal [54] was utilized to estimate the amount of N in the cattle manure applied per hectare as organic fertilizer, after having subtracted the N emission flows at the cattle housing and manure storage stages. The total N application per hectare was estimated after having also considered the synthetic fertilizer’s N content.
In addition, the outputs of Energy-Corrected Milk (ECM) and Fat- and Protein-Corrected Milk (FPCM) were computed to allow a comparison of the emission results of the present study with relevant scientific literature results. To compute ECM [61,62] and FPCM [63,64], Equations (6) and (7) were utilized:
ECM = (0.25 × Total Milk Production) + (12.2 × Total Milk Fat Production) + (7.7 × Total Milk Protein Production)
FPCM = Total Milk Production × ((0.1266 × Total Milk Fat Production) + (0.0776 × Total Milk Protein Production) + 0.2534)
An allocation factor (AF) was applied to distribute the emissions to milk production, as the dairy cattle farms produced both raw milk and cattle live weight (LW), according to Equation (8) [61].
Milk AF = 1 − 6.04 × (total kg of LW sold per year/total kg of FPCM produced per year)

2.3.2. Pig Farming

Adjustments to the data were made to reflect the daily average number of weaned piglets and finished pigs on the farm. The pig population (excluding sows) was deduced by dividing the annual total by the PPS (2.22 to 2.49 of parturitions per sow per year [65]). Furthermore, the average annual dry matter intake per sow was estimated based on the different feeds provided in the first 2/3 (76 days) of the gestation period, the last 1/3 (38 days) of the gestation period, the 28 days of the lactating period, and the reproduction period (weaning-to-estrus interval and recovery). The same logic was implemented per growing pig, including a starter (period up to 28 days), grower (period from 28 to 70 days, 30 kg average LW), and a finishing (70–190 days, 110 kg average LW at slaughter) ration in the calculations.
In addition, the GHG emissions were not separately allocated to the sows’ LW product output due to their minimal contribution to the total annual LW output. Specifically, the PDST distinguishes between three live-weight animal emission sources: (a) finishing pigs (fattening and finishing stages), (b) weaners (starter and grower stages), and (c) sows that were all added to a total live-weight flow, to which the environmental burden was attributed.
The annual sow replacement rate was 30%. In GPF1 and GPF2, the average sows’ live weight sold per year was 19,800 kg and 26,675 kg, respectively, representing 1.76% and 1.4% of the total sold live weight.

2.4. Inputs to the Tools

The inputs that are used to run a scenario in both FarmAC and the PDST are presented in S5. In all the Greek case studies (i.e., GDCF, GPF1, GPF2), only livestock-related inputs were relevant since there was no on-farm crop cultivation. In the Polish case study (i.e., PDCF), both livestock- and crop-related inputs were relevant.

2.4.1. Dairy Cattle Farming: PDCF

In Tables S6 and S7, the livestock-related and crop-related inputs of the Polish dairy farm are shown, respectively. The total farm size was 90 ha. It covered 80 ha of utilized agricultural land, along with an additional hectare designated as woodland. Fodder was produced using 38% of this agricultural land. Various crops were also cultivated, such as maize, rye, oats, barley, meadows, and alfalfa. The herd size was based on the average daily number of Holstein dairy cattle reared. In 2021, the farm produced a total of 336,083.23 and 344,292.08 L year−1 of ECM and FPCM (incorporation of 0.7% of milk used for calf feeding), respectively (on average 6721.67 and 6885.84 L year−1 cow−1 of ECM and FPCM). The cattle LW production was low, as the male calves (n = 20) were sold at a low average live weight (50.0 kg/head), while the cull cows (n = 5) were sold at 650.0 kg/head. The AF to raw milk was equal to 0.93. Furthermore, the cattle were supplied maize–silage-based diets in deep litter houses, and manure from all houses was stored as dunghill, without a cover (Table S6). The cultivated crops (i.e., maize, rye, winter barley, oats, grass, alfalfa grass) were sowed at clay loam soil, and the fertilizers (i.e., solid manure, urine, urea, ammonium nitrate, and superphosphate) were applied using spreading and spraying machinery and equipment (Table S7).

2.4.2. Dairy Cattle Farming: GDCF

The GDCF was associated with raw milk and cattle LW co-products. The GDCF was an intensive production system with 0.6 ha of total farm size, and feed crops were not grown on-farm. Furthermore, the annual raw milk production was 2,581,923.4 L ECM year−1 and 2,645,233.08 L FPCM year−1 (incorporation of 5.68% of milk used for calf feeding and milk losses). The milk yield was 7376.9 L ECM year−1 cow−1 and 7557.8 L FPCM year−1 cow−1 (including the milk sold, the milk fed, and the milk wasted). The GDCF sold 75.0 young bulls of 525.0 kg LW (39,345.0 kg year−1), 8.0 mature bulls (6800.0 kg year−1), and 30.0 cull cows of 650.0 kg LW (19,500.0 kg). The AF of the milk output was equal to 0.85. Moreover, the cattle were supplied maize–soybean meal and silage-based diets (based more on concentrates) in deep litter houses, and the manure from all houses was stored as dunghill, without a cover (Table S8).

2.4.3. Pig Farming: GPF1 and GPF2

The GPF1 maintained a total of 360 sows, each averaging a litter of 11.4 piglets per parturition (resulting in 9108.0 piglets annually from a PPS of 2.22 parturitions sow−1 year−1 and considering a piglet death rate of 9.09%). The sows were provisioned an average of 7.81 kg of feed/day (6.8 kg DM) during the gestation and lactation stages. Upon birth, the piglets’ average weight was 1.1 kg/head. In addition, GPF2 managed 485 sows, each averaging a litter of 12.92 piglets per parturition (annual production of 15,600.0 piglets from a PPS of 2.49 parturitions sow−1 year−1 and considering a piglet death rate of 10.26%). The sows were supplied an average of 6.89 kg of feed (6.0 kg of DM) during both the gestation and lactation stages. Upon birth, the piglets weighed 0.85 kg/head on average. Neither farm included on-farm crop production. Both farms used similar diets in terms of substances used (e.g., maize grain, barley grain, soybean meal, wheat bran, regulators, and sodium chloride), with some differences in quantities. For example, GPF1 supplied more maize grain and soybean meal, while GPF2 supplied more barley grain. Both farms used fully slatted houses and outdoor slurry tanks without crusts (Table S9).

2.5. Workflow of the PDST

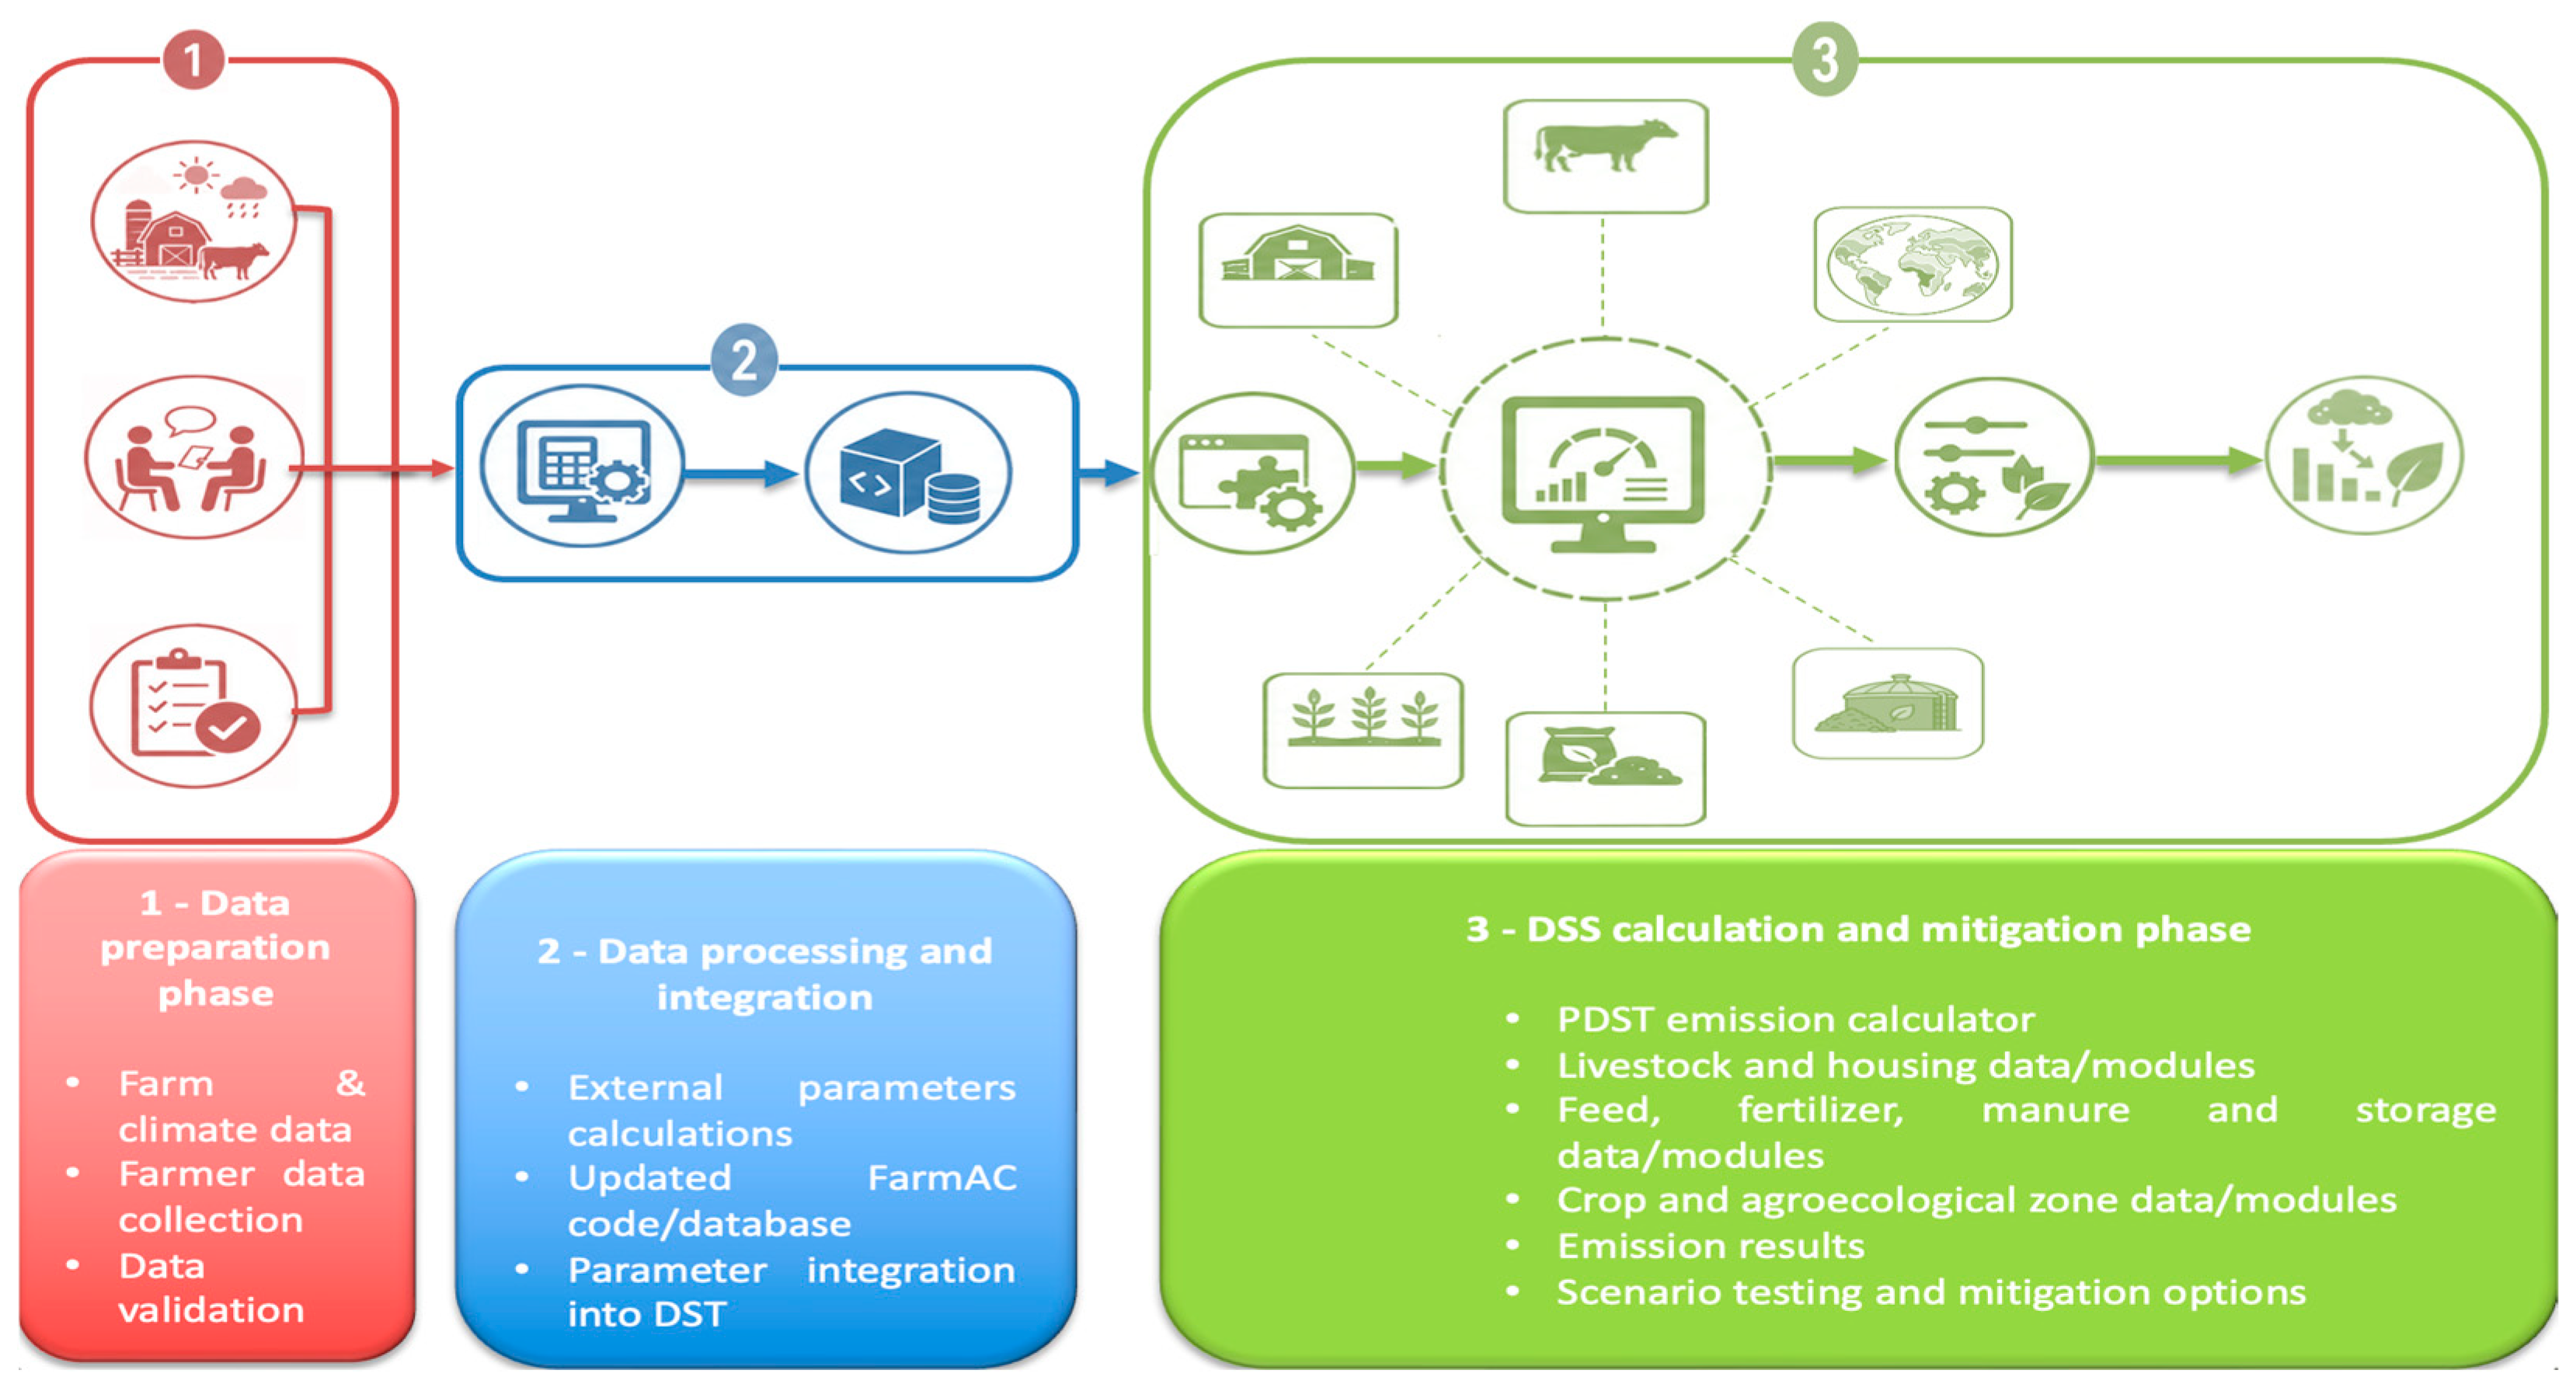
The methodological workflow of the PDST (Figure 1) consists of three main phases: data preparation, data processing and integration, and DSS-based emission calculation. Farm, climate, and management data are first collected and validated and then integrated into the FarmAC-parameterized code/database. In the final phase, the PDST emission calculator estimates emissions and supports scenario testing and mitigation option assessment.

2.6. Output Evaluation Approach

The PDST outputs were assessed through technical verification and literature-based consistency assessment, not through empirical validation of model accuracy. Technical verification focused on checking input data, parameter values, C and N flows, and the correct execution of the emission calculation algorithms. A full validation of a farm-scale emission decision support tool would need measurements of farm-level CH4, N2O, and/or NH3 emissions or a systematic comparison with other independent models using exactly the same input data [35,66,67]. Because neither measured emissions nor an independent model comparison was available, the present evaluation should be interpreted as a preliminary assessment of output reliability.
Following the technical checks, the emission estimates and contributions of individual emission sources were compared with studies examining similar production systems, system boundaries, and IPCC- or LCA-based approaches [26,66]. The national inventories of Greece and Poland were also used as a general benchmark to examine whether the main emission sources identified by the PDST followed the same pattern as national agricultural emissions [68,69]. The comparison showed a reasonable source hierarchy, as enteric fermentation, manure management, and agricultural soils are also key categories in national and European inventory frameworks [70]. However, the national inventories are based on aggregated data and inventory assumptions. As a result, they cannot directly validate farm-level results. Additionally, the comparison with other farm-scale tools was not undertaken since past experience [56] indicates that differences in model structure, EFs, parameterization, transparency, and system boundaries could make the interpretation of output differences difficult. As a result, the evaluation was limited to internal C and N flow checks, comparison with the relevant literature, and the use of national inventory data as supportive material.

3. Results

3.1. Product and Emission Outputs

PDST provides N (e.g., N in imported manure and N deposited from the atmosphere) and C (e.g., C fixed from the atmosphere, C in imported feed) flows. Furthermore, it provides information about the livestock product outputs (e.g., total farm milk production, total farm meat production) of each farming system. All generated emission outputs refer exclusively to on-farm processes and production. The production of inputs that occurs outside the farm boundary is not integrated into the final results.

3.1.1. Dairy Cattle Farming: PDCF and GDCF

The annual milk production (expressed also in ECM and FPCM) as well as the annual GHG emissions for the PDCF and GDCF are shown in Table 1. The total on-farm GHG emissions include combined direct and indirect emissions from livestock and crop production. However, to better compare emissions between the PDCF, GDCF, and available literature, the total livestock-related emissions (including direct enteric CH4, direct CH4 from manure, direct N2O from manure, indirect N2O due to N volatilization from housing, and indirect N2O due to N volatilization from manure storage and field application) are presented separately.
The difference between the two dairy farms mainly reflects the contrast between a livestock system and a mixed crop–livestock system. Although the GDCF had higher absolute emissions due to its larger herd size and higher milk production, its emission intensity was lower because emissions were distributed over a much larger milk output and because no on-farm crop-production emissions were included within the farm boundary. In contrast, the PDCF included crop-related emission sources, such as field N2O emissions from manure and synthetic fertilizer application, N volatilization, and N leaching, which increased the farm-level emission intensity. Additionally, differences in diet composition also contributed to the variation in enteric CH4 and manure CH4 emissions through their effect on dry matter intake, digestibility, and volatile solid excretion. Finally, the GDCF had a lower milk allocation factor because a larger proportion of the total farm output was attributed to live-weight production. As a result, a smaller share of the total emissions was allocated to milk than in the PDCF.

3.1.2. Pig Farming: GPF1 and GPF2

According to Table 2, there is a reduction observed in both total direct and indirect GHG emissions, leading to an aggregate decrease in GHG emissions when comparing the PDST with the FarmAC model for both GPF1 and GPF2. Indirect nitrous oxide due to N volatilization from housing is the only emission flow that increased when using the PDST.
The difference between the two pig farms was smaller than that observed between the dairy farms, as both used the same configuration of housing (i.e., fully slatted housing) and manure management (i.e., outdoor slurry storage). Consequently, methane emissions from manure management were the main source in both cases. Other differences were mainly related to herd productivity, live-weight output, and diet composition. However, it also produced a higher total live-weight output. As a result, these emissions were distributed over a larger amount of production, resulting in lower emission intensity per kg of live weight. In contrast, the slightly higher emission intensity of GPF1 can be attributed to the higher dry matter intake and diet-related volatile solid production per kg of live weight. Therefore, the difference between GPF1 and GPF2 is explained by differences in productivity and diet-related excretion rather than differences in housing or manure storage.

4. Discussion

4.1. Literature-Based Consistency Assessment of PDST Emission Estimates

4.1.1. Dairy Production Emission Benchmarking

The selected literature references were chosen on the basis of their relevance to the present case study, particularly with respect to similar climatic conditions and comparable emission sources. Table 3 compares the GHG emission estimates obtained in the present study with those reported in the literature for dairy production systems.
Several key factors can explain the differences in GHG emissions across production systems and regions, including variations in herd management practices, feed composition, manure handling techniques, and climatic conditions [78,79,80]. Additionally, the methodology, EFs, and the GHG global warming potentials implemented in each study differ, resulting in considerable variation in the results (Table 3). Table 4 provides an overview of the main emission sources identified in most relevant scientific publications. Regarding enteric fermentation, GDCF showed lower emissions than Bartzanas et al. [71], with 0.372 compared with 0.444 kg CO2-eq/kg FPCM, corresponding to a reduction of approximately 16.2%. This difference may be partly associated with differences in ration composition and modeled digestibility, as the GDCF ration is more concentrate-oriented (e.g., maize grain and soybean meal). In contrast, the Bartzanas et al. [71] case study included more forage feed ingredients. Furthermore, the gross energy intake differs between the two cases since the difference in milk production per cow is 8.81 tn/year/animal [70] vs. 7.56 tn/year/animal (present study). Regarding methane emitted from manure management, GDCF emitted 0.157 kg CO2-eq/kg FPCM, while Bartzanas et al. [71] reported 0.346 kg CO2-eq/kg FPCM. This difference can be mainly explained by the different manure management systems, as Bartzanas et al. [71] examined slurry manure management, whereas the present study used deep bedding combined with solid manure storage. In addition, differences in feed composition and feed digestibility may have influenced VS production and, consequently, manure CH4 emissions. Moreover, Bartzanas et al. [71] implemented the IPCC 2006 methodology [81,82]. In comparison, the IPCC 2019 Refinement [52] includes updates to MCF estimation by considering additional parameters, such as climate conditions, storage duration, and temperature. Therefore, if the same manure management system were applied, the estimated methane emissions could differ under the updated methodology, depending on the selected MCF assumptions and site-specific conditions. Fantin et al. [73] came to a different conclusion based on values proposed by another study that used IPCC 2006 Tier 1 and estimated 130 kg of methane per cow per year for both enteric fermentation and manure management [81,82]. The manure management in Fantin et al. [73] included a mixture of liquid and solid manure stored in tanks. As in Bartzanas et al. [71], temperature was used instead of duration of manure storage and climate. Furthermore, in Fantin et al. [73], there was no separation of manure management systems. Tier 1 uses temperature, regions, and two general production systems. As a result, the difference in methodologies and information used created a discrepancy in the final results. Regarding methane emissions, the PDCF and Danish study [76] are close enough for enteric fermentation emissions, with a difference of 0.01 kg CO2-eq per kg of ECM. However, there is a difference of 0.155 kg CO2-eq per kg of ECM in manure management emissions. The indoor manure management system integrates 60% deep litter and 40% slurry [76]. This difference lies in the methane conversion factor (different EF guidelines) since, in PDCF, the farm implemented deep bedding (0.26), while Kristensen et al. [76] examined both slurry (0.1) and deep litter (0.01). Regarding N2O emissions, there is a difference (0.042 kg CO2-eq per kg of FPCM) between the GDCF and the study of Bartzanas et al. [71] for direct manure N2O emissions. This is expected as the crude protein content of the feed supplied to dairy cows in GDCF is higher. Finally, the respective difference between PDCF and the Danish case study is 0.028 kg CO2-eq per kg of ECM. This is because in the PDCF, a higher N2O EF (deep bedding (0.01 kg N2O-N/kg N excreted)) was implemented in comparison to the study by Kristensen et al. [76] (combination of deep litter (0.01 kg N2O-N/kg N excreted) and slurry (0.005 kg N2O-N/kg N excreted)). This difference could have been higher, but Kristensen et al. [76] used a GWP for N2O equal to 298 CO2-eq/kg, whereas the present study had 273 CO2-eq/kg. Finally, regarding indirect emissions, GDCF emits 0.0023 kg CO2-eq per kg of FPCM and the farm in Bartzanas et al. [71] emitted 0.02 kg CO2-eq per kg of FPCM. PDCF emits 0.015 kg CO2-eq per kg of ECM. The respective emissions found by Kristensen et al. [76] were 0.0669 kg CO2-eq per kg of ECM due to different milk production and manure management systems.

4.1.2. Pig Production Emission Benchmarking

Regarding the major emission sources in pig production as assessed with the PDST, methane emissions from manure management (GPF1: 80.77% of total emissions—1.105 kg CO2-eq kg−1 LW, GPF2: 84.55% of total emissions—1.242 kg CO2-eq kg−1 LW) contributed the most, followed by methane from enteric fermentation (GPF1: 13.13% of total emissions, GPF2: 9.11% of total emissions). This contribution of emission sources seems to be in agreement with previously published studies examining the on-farm emissions of pig production systems (Table 5). In the study by Anestis et al. [48] on pig production in Greece, methane emissions from enteric fermentation were low, with reported values of 0.202 and 0.210 kg CO2-eq per kg LW. By contrast, methane emissions from manure management were considerably higher, at 1.078 and 1.168 kg CO2-eq per kg LW. Direct N2O emissions were reported as 0.111 and 0.125 kg CO2-eq per kg LW, while indirect N2O emissions were 0.109 and 0.119 kg CO2-eq per kg LW. The present study shows similar results to those of Anestis et al. [48]. The difference observed was due to the fact that productivity results vary among the two studies (e.g., final meat production and duration of the production cycle); in the present study, the finishing pigs reached a slaughter weight 10 kg higher, and the fattening period was 20 days longer. Additionally, differences in feed composition resulted in different levels of volatile solid (VS) production, which were 0.575, 0.560, 0.494, and 0.456 kg VS/kg LW for GPF1, GPF2, and the two feed cases examined by Anestis et al. [48], respectively. Overall, the Greek pig case-study values fall within the lower part of the European on-farm emission estimates considered here. Compared with Monteiro et al. [83], this can partly be related to the contrast between intensive Greek farms and local-breed systems with litter-based, indoor/outdoor, or grazing components. Compared with Noya et al. [84], however, the explanation is different: both systems are intensive, so the lower Greek values are more likely associated with differences in productivity, production stage structure, manure management modeling, diet-related excretion, and emission factor assumptions. Thus, breed and grazing are important for interpreting the comparison with Monteiro et al. [83], whereas manure management, productivity, and system boundary consistency are more important for interpreting the comparison with Noya et al. [84].

4.1.3. Selection and Representativeness of the Case Studies

The four case-study farms were selected as commercial, data-rich examples for prototype testing rather than a statistically representative sample of Greek and Polish livestock production. Their selection was based on the availability of detailed farm-level data and their ability to test the PDST under contrasting production conditions. The GDCF represents an intensive livestock-only dairy system in Greece, with no on-farm feed-crop production and maize–soybean meal and silage-based diets. Similar to the present study, previous Greek dairy research used detailed data from a commercial farm to estimate emissions associated with milk production, particularly from livestock and manure management. The PDCF represents an integrated Polish dairy system that combines livestock production with on-farm crop cultivation and feed production. Similar system components, including cattle production, crop cultivation for feed, silage production, animal feeding, and manure management, were included in the Polish farm-level assessment of Bieńkowski et al. [75]. The two Greek pig farms represent intensive farrow-to-finish systems with fully slatted housing and outdoor slurry storage. Previous Greek studies have also examined the environmental performance of commercial intensive pig production and the effect of feeding and management assumptions on pig emission estimates [48,49]. Therefore, the selected farms cover different combinations of species, feeding systems, housing conditions, manure management systems, and farm structures that are useful for prototype testing. However, they should not be considered representative of the full variability of dairy and pig production in Greece or Poland. A broader assessment would require a larger and stratified sample of farms across regions, herd sizes, production systems, and manure storage types.

4.2. Comparison Between FarmAC and PDST

The methodological updates introduced in the PDST substantially affected the dairy cattle emission estimates. Therefore, Table 6 compares the results of the FarmAC v1.8 and the updated PDST for the Greek and Polish dairy cattle case studies.
The changes presented in Table 6 were mainly related to the replacement of the FarmAC v1.8 manure-carbon approach by the updated PDST VS and B0 structure. In the old version, VS was estimated through a carbon-flow equation using degradable carbon, non-degradable carbon, humic carbon, and carbon concentration in organic matter. Therefore, the old VS calculation was mainly based on the quantity of carbon entering and remaining in the manure stream, without directly using qualitative feed parameters such as digestibility and ash. In contrast, the updated PDST applies the IPCC 2019 VS equation, where VS is calculated from dry matter intake, gross energy intake, feed digestibility, urinary energy, and ash [52]. This means that the new calculation integrates both quantitative parameters, such as DMI and GEI, and qualitative feed parameters, especially digestibility. As a result, the updated VS calculation is more directly connected with feed quality and animal-stage diet characteristics than the FarmAC v1.8 carbon-flow calculation. For GDCF, this changed the VS basis from 983,949 to 552,596 kg VS/year. In addition, the FarmAC v1.8 calculated B0 as a carbon-weighted methane potential of the manure stream, while in the updated PDST, the IPCC 2019 default B0 values for cattle were applied according to animal category [52]. This change reduced B0 for dairy cows from 0.2737 to 0.2400 m3 CH4/kg VS, corresponding to a decrease of 12.3%. For dry cows, B0 decreased slightly from 0.1836 to 0.1800 m3 CH4/kg VS, equal to a decrease of 2.0%. For heifers aged 15–22 months, B0 decreased from 0.1985 to 0.1800 m3 CH4/kg VS, corresponding to a decrease of 9.3%. For heifers up to 15 months, B0 remained almost unchanged, increasing slightly from 0.1793 to 0.1800 m3 CH4/kg VS, equal to an increase of 0.4%. For young bulls, B0 decreased from 0.1836 to 0.1800 m3 CH4/kg VS, corresponding to a decrease of 2.0%. For mature bulls, the reduction was stronger, from 0.2295 to 0.1800 m3 CH4/kg VS, equal to a decrease of 21.6%. In contrast, for calves, B0 increased from 0.1422 to 0.1800 m3 CH4/kg VS, corresponding to an increase of 26.6%. Therefore, the B0 update did not have the same effect across all animal stages, but generally reduced the methane potential for the main manure-producing cattle categories. Enteric CH4 emissions decreased only slightly in both farms, by about 2.8%, mainly due to the updated CH4 GWP100. In contrast, direct N2O emissions increased by about 3.0% in both case studies, mainly due to the updated N2O GWP100.

4.3. Sources of Emissions

4.3.1. Main Emissions Sources: Dairy Cattle Farming

Enteric fermentation.
For both PDCF and GDCF, direct CH4 emissions from enteric fermentation were estimated using the IPCC Tier 2 methodology. No separate enteric EF is reported in the text; however, the calculation in PDST used an updated GWP100 for biogenic CH4, which was lower than the corresponding value used in FarmAC.
Manure management.
For direct CH4 emissions from manure, different methane conversion factors (MCFs) were applied in the two dairy systems. In PDCF, the MCF was 0.26 for deep bedding stored for more than one month, whereas in GDCF, the MCF was 0.225 for deep bedding combined with solid storage for a similar duration. For direct N2O emissions from manure housing and storage, the EF applied in both systems was 0.01 kg N2O-N per kg N excreted. In relation to manure storage and indirect N2O emissions from volatilization, the NH3 EF used was 0.33 kg NH3-N + NOx-N per kg TAN. For PDCF, additional field-application-related factors were also reported. In the direct N2O calculation from field application, the text refers to 0.21 kg NH3-N + NOx-N per kg N applied for urea and 0.15 kg NH3-N + NOx-N per kg N applied for ammonium nitrate. For indirect N2O emissions from fertilizer application, the reported factors were 0.15 kg NH3-N + NOx-N per kg N for urea and 0.05 kg NH3-N + NOx-N per kg N for ammonium nitrate. In the case of indirect N2O emissions due to N leaching, the EF for leached nitrate-N was 0.0112 kg N2O-N emitted per kg NH3-N emitted.
Housing.
For indirect N2O emissions associated with N volatilization from housing, the NH3 EF used in both PDCF and GDCF was 0.12 kg NH3-N per kg NH4. This factor was applied to represent emissions from the dairy housing system under the updated PDST approach.

4.3.2. Main Emissions Sources: Pig Farming

Enteric fermentation.
For the pig production systems GPF1 and GPF2, enteric methane emissions were estimated using the IPCC Tier 1 approach. The EF applied was 1 kg CH4 head−1 year−1, corresponding to low-productivity systems.
Manure management.
With regard to methane emissions from manure management, the methane conversion factor (MCF) applied to slurry stored in a pit over a three-month period was 0.28. For direct N2O emissions from manure management, the Tier 2 EF for slurry tanks was 0.0 kg N2O-N per kg N excreted, resulting in zero direct N2O emissions from this source in both GPF1 and GPF2. With regard to indirect N2O emissions related to manure storage, the NH3 EF applied was 0.11 kg NH3-N + NOx-N per kg TAN.
Housing.
With regard to housing-related emissions, the NH3 EFs vary depending on the animal category and housing system. For gestating sows in individual stalls, sows in fully slatted stalls, and growing and finishing pigs on fully slatted floors, the NH3 EFs used were 0.272 and 0.21 kg NH3-N + NOx-N per kg NH4+, respectively. For piglets and weaners housed in deep-litter systems, the NH3 EF was 0.187 kg NH3-N per kg NH4+.

4.4. Feed Evaluation

4.4.1. Dairy Cattle Diet Assessment

In the case of Poland, the ratio of dairy cows was quite balanced regarding their low milk production (Table S10). However, the proportion of forages in the diet exceeded the optimum level, resulting in a high NDF content (55.2%). This likely contributed to the elevated enteric methane emissions observed [85]. In heifers and dry cows (20–24 months), the diet showed an imbalance in the energy-to-protein ratio, with protein supply slightly exceeding nutritional requirements while energy supply was below the required levels (Table S10). Additionally, total dry matter intake did not meet the animals’ expected requirements. In heifers (12–20 months), the diet showed a marked imbalance in the energy-to-protein ratio (Table S10). Metabolizable energy supply exceeded NRC [59] requirements by approximately 20%. The ration provided for heifers aged 2.5–12 months meets nutritional requirements primarily for animals closer to 12 months of age. Younger heifers are likely to regulate their intake through reduced dry matter consumption, thereby partially compensating for the oversupply. For calves aged 2–10 weeks, the diet supplies approximately 10% more energy and 20% more protein than the average requirements when the nutrient contribution of the milk replacer is also considered. However, the reported weaning live weights and the corresponding feed quantities appear to be poorly aligned, suggesting inconsistencies between intake data and observed growth performance.
In the case of Greece, the forage-to-concentrate ratio of the diet was inadequate, as the minimum required forage inclusion was not met, resulting in a low overall NDF concentration (Table S11). Dry matter intake was below the expected requirements, while protein supply exceeded the cows’ nutritional needs, further contributing to an imbalanced ration. The diet should be supplemented with additional forages to improve NDF supply and optimize energy availability, with the aim of increasing milk yield and thereby reducing farm-level GHG emissions (kg CO2-eq/kg raw milk). Alternatively, if the genetic potential for higher milk production has plateaued, the ration should be reformulated by reducing dietary protein to enhance nitrogen utilization efficiency and minimize associated emissions. Although it is generally not recommended to feed heifers and young bulls the same diet, the ration provided to these groups appeared to be reasonably balanced. Furthermore, the formulations for finishing bulls, heifers up to 15 months of age, and calves were within a rational margin and met the respective nutritional requirements (Table S11). However, it should be emphasized that cattle diets should be formulated using advanced, up-to-date nutritional models that incorporate key physiological and ruminal parameters, such as feed fermentation kinetics, degradation rates, nutrient absorption, and utilization efficiency, with the aim of improving feed efficiency and reducing the environmental burden of cattle production.

4.4.2. Pig Diet Assessment

In Central Macedonia (GPF1), the diet provided to sows was formulated appropriately for lactation requirements (Table S12). However, although farmers supply a nutritionally adequate diet for the 28-day lactation period, they also provide a substantially nitrogen-rich diet during the 115-day gestation period. This practice results in an unnecessary oversupply of protein, contributing to a considerable environmental burden due to increased nitrogen excretion. Similarly, there is a clear need to formulate and provide distinct diets for the gestation and lactation periods in sows. Finally, although the diets for the grower, fattening, and finishing phases were generally close to meeting the pigs’ nutritional requirements on average, the crude protein levels were formulated closer to those needed for the grower stage (approx. 17%). As a result, excess nitrogen was supplied during the fattening and finishing phases, periods in which feed intake is highest, leading to elevated nitrogen excretion. Given that pigs are commonly fed in groups under ad libitum conditions, it is critical to formulate diets whose chemical composition is accurately aligned with the animals’ stage-specific nutrient requirements in order to minimize nutrient wastage and associated environmental impacts.
In the Thessaly case study (GPF2), the diets supplied to sows showed notable mismatches between nutrient supply and nutritional requirements (Table S13). During the lactation stage, crude protein concentration was lower than recommended, as optimal levels for lactating sows range between 16–18%. In contrast, crude protein content during the pregnancy stage was higher than the recommended 13–14%, resulting in unnecessary nutrient oversupply and inefficient nitrogen utilization. This imbalance represents a significant waste of nutrients and may contribute to increased environmental burdens through excess nitrogen excretion. To ensure both nutritional adequacy and resource efficiency, pregnant and lactating sows should be offered physiologically distinct diets formulated according to their respective requirements (Table S13). The starter diet for piglets is highly conservative, and solid feed intake remains negligible until approximately 28 days of age; therefore, an in-depth assessment of this ration is not particularly relevant. Both the grower and finisher diets are very close to meeting the nutritional requirements for fattening pigs (Table S13).
In the case study of Central Macedonia (GPF1), the diet provided to sows was formulated more appropriately for lactation requirements compared with GPF2. However, although farmers supply a nutritionally adequate diet for the 28-day lactation period, they also provide a substantially nitrogen-rich diet during the 115-day gestation period. This practice results in an unnecessary oversupply of protein, contributing to a considerable environmental burden due to increased nitrogen excretion. Similarly, there is a clear need to formulate and provide distinct diets for the gestation and lactation periods in sows. Finally, although the diets for the grower, fattening, and finishing phases were generally close to meeting the pigs’ nutritional requirements on average, the crude protein levels were formulated closer to those needed for the grower stage (approx. 17%). As a result, excess nitrogen was supplied during the fattening and finishing phases, periods in which feed intake is highest, leading to elevated nitrogen excretion. Given that pigs are commonly fed in groups under ad libitum conditions, it is critical to formulate diets whose chemical composition is accurately aligned with the animals’ stage-specific nutrient requirements in order to minimize nutrient wastage and associated environmental impacts.
Overall, diets in both animal species were not perfectly aligned with nutritional recommendations, with greater deviations observed in cattle. This outcome is expected, as swine husbandry and nutrition are generally more standardized, relying predominantly on commercial concentrate mixes offered ad libitum. In contrast, cattle herds often include animals at different physiological and production stages housed within the same pen, resulting in more complex nutritional management and a higher likelihood of dietary mismatches. Consequently, the need for cost-effective, robust, and rapid assessment tools for estimating on-farm GHG emissions is critical.

4.5. Parameters Influencing Emission Estimates

Although a quantitative uncertainty analysis was not performed in the present PDST application, a basic one-at-a-time sensitivity screening calculation was added to evaluate the numerical influence of selected key parameters on the final outputs. This approach changes one parameter at a time, while the other inputs are kept constant. It was used here only as a first screening step since it does not capture interactions between parameters as fully as global or Monte Carlo-based approaches [86,87]. The selected parameters were chosen because they were directly connected with the main outputs that depend on guideline-based EFs, climate-related classifications, and default or literature-derived parameters, particularly for enteric CH4, manure CH4, VS excretion, MCF values, and allocation factors. Enteric methane and manure methane were therefore included, together with the main assumptions controlling these emissions, such as VS excretion and MCF values. The allocation factor was also included for the dairy farms because it directly affects the final emission indicator per kg FPCM and ECM.
Regarding GDCF, a 10% change in the enteric methane term would change the result by approximately ±0.037 kg CO2-eq/kg FPCM and ±0.038 kg CO2-eq/kg ECM. These changes would affect the total GDCF emissions by ±5.8%, using total emissions of 0.64 kg CO2-eq/kg FPCM and 0.66 kg CO2-eq/kg ECM. A 10% change in manure methane, for example, through the MCF or VS estimate, would change the result by approximately ±0.016 kg CO2-eq/kg FPCM and ±0.016–0.017 kg CO2-eq/kg ECM, corresponding to about ±2.5% of the total emissions. Allocation also affected the dairy result. For example, increasing the GDCF milk allocation factor from 0.85 to 0.90 would increase the indicator from 0.64 to approximately 0.68 kg CO2-eq/kg FPCM and from approximately 0.66 to 0.70 kg CO2-eq/kg ECM, which is an increase of about 6.3%, assuming unchanged total emissions.

4.6. Scenario-Based Assessment of Mitigation Measures

DSS in livestock farming should not be regarded as standalone calculators [88]. Instead, they are broader, computer-based systems that integrate farm data, models, indicators, and user-oriented interfaces in order to support decision-making across the environmental, economic, and social pillars of sustainability [22,36,43].
At the farm level, whole-farm modeling is of particular importance since livestock management decisions are made at this level, and, at this level, the interactions among feeding, manure management, productivity, fertility, land use, and mitigation options are assessed and visible [13,14,89]. Accordingly, livestock DSS can be used not only to estimate emissions but also to compare scenarios, identify the main drivers of emissions, assess mitigation measures, and guide more sustainable farm management strategies [26,43]. The PDST provides a wide variety of interactive parameters in a scenario, allowing users to test the farm’s practices and future production implementations that could reduce greenhouse gas and NH3 emissions. Additionally, the accessibility of the methodology and parameters provides an opportunity to update the tool with the most recent data on mitigation methods, ensuring it aligns with the latest guidance. Finally, there is an extensive presentation of the results via different Excel files: (1) an extensive presentation of every parameter and output of a scenario; (2) a presentation of results related to livestock production; (3) a presentation of results of crop production; (4) details of the C and N dynamics in the soil; (5) details of the water budget; (6) a summary of the results at the farm scale. This provides the user with the opportunity to gain a deep understanding of the impact of production processes on final farm production, GHG and NH3 emissions, and C and N cycles.

4.7. Future Improvements

Although the PDST currently employs numerous parameters and functions to manage diverse data, the trend in DS tools is moving toward simplification without compromising reliability [10,19]. Therefore, future developments of the PDST would need to focus on refining the interface [90] to enhance its user-friendliness and wider adoption [29,91], especially since the current PDST code structure and XML input files still require technical knowledge that may limit direct use by farmers and non-specialist stakeholders. Future development should also focus on automated scenario comparison and translating the model outputs into practical recommendations for farmers, advisors, and other stakeholders. Beyond these decision support improvements, future PDST applications would need to include quantitative uncertainty analysis, using parameter distributions and Monte Carlo uncertainty propagation, together with global sensitivity analysis, to identify the most influential inputs. Further improvements should also facilitate the incorporation of specific climate, livestock, feeding, manure management, housing, crop, and fertilizer data from individual countries and case studies, instead of relying only on the available mean values for each agroecological zone, as already occurs in other DSTs (e.g., the Cool Farm Tool) [92]. This approach would effortlessly allow the use of country-specific data within PDST and improve the relevance of its results to local conditions. These data may include climate information from CEDA or local climate authorities, EFs from country-specific scientific research (if available), or the integration of EFs recommended by the most up-to-date methodologies. These modifications pertain to the inclusion of data across all specified parameters and do not affect the computation process of the code, as they strictly relate to input data. Future improvements should examine the possibility of linking the PDST with sensor-based and remote-sensing data streams. In livestock systems, Precision Livestock Farming and data-driven decision support approaches can provide information on animal performance, feed intake, health, behavior, milk yield, barn conditions, and other variables relevant to emission calculations [19,93,94,95,96]. In mixed crop–livestock systems, remote-sensing methods could also support crop-related inputs, such as soil moisture, crop water status, nutrient status, and irrigation management [97,98,99,100]. Such integration was not implemented in the current prototype, but it should be examined in future versions to reduce manual data entry and improve the temporal resolution of PDST input data. Furthermore, in an updated version of the PDST, an advisory function providing comparative results could be integrated. This feature is essential, as users need to simultaneously compare results from two or more different scenarios and instantly observe how changes in input affect the final results.
The livestock modules could be improved by allowing more detailed animal sub-categories and production-stage-specific inputs. For cattle and pigs, this would enable users to better represent differences in diet, growth, housing, enteric fermentation, and manure C and N flow characteristics across development stages. For cattle, this would include more specific calf and heifer stages, while for pigs, it would include the separation of sow gestation and lactation, as well as the pre-fattening and fattening stages of finishing pigs. This would make the PDST more flexible and reduce the need for external user calculations.

5. Conclusions

This study examines the development and initial evaluation of a prototype decision support tool (PDST), designed for estimating on-farm greenhouse gas (GHG) emissions, based on the latest version of the FarmAC model. The PDST supports emission estimation tailored to the specific characteristics of different countries and regions (e.g., climate data, national EFs, manure management systems). A key strength of the tool is its adaptability, as its code structure allows for modifications, updates, and refinements. This version integrates updated parameters and data from authoritative bodies (IPCC, UNECE, CEDA), including climate data, EFs, and the latest emission estimation methodologies and guidelines, while activity data were collected from livestock producers. The input data used were obtained from four different farms (two cattle and two pig farms) in order to cover all the requirements of the tool’s inputs. The input data were evaluated and refined (where needed) to ensure consistency with the production levels reported by the producers and expected animal growth and production performance. As a result, the tool generated emission estimates that are consistent with the literature when applied to cattle and pig farm case studies supported by carefully evaluated and cross-checked input data. These findings suggest that the PDST can produce realistic and scientifically grounded emission estimates. However, the findings are based on four commercial case-study farms selected for prototype testing and should not be considered representative of the variability of Greek and Polish livestock production.
Overall, the PDST provides a useful foundation on which to develop a practical, farm-level emissions assessment tool. This tool will support researchers, advisors, and producers in evaluating livestock-related emissions and identifying mitigation options based on the specific characteristics of each case. Future work should focus on testing the tool on a larger number of commercial farms and production systems. This will make the tool applicable to more livestock groups and management conditions, improve accessibility for users, and strengthen its role in supporting decision-making on emission mitigation.

Supplementary Materials

The following supporting information can be downloaded at https://www.mdpi.com/article/10.3390/agriengineering8080309/s1: Table S1: Integrated emission factor parameters in the PDST; Table S2: Climate data for the Greek and Polish agroecological zones; Table S3: The Global Warming Potential of greenhouse gases in 100-year timeframe as implemented in the FarmAC model and PDST; Method S4: Installation, input-file preparation, parameter modification, and execution of the PDST software. Table S4: Additional qualitative parameters in the PDST; Table S5: Overview of the inputs used to run scenarios in the FarmAC model and the PDST; Table S6: Livestock-related inputs (dairy cows) in the PDCF; Table S7: Crop-related inputs for the PDCF; Table S8: Livestock-related inputs for the GDCF; Table S9: Inputs for the GPF1 and GPF2 case studies; Table S10: Chemical composition of the diets (key ingredients only) supplied in the PDCF; Table S11: Chemical composition of the diets (key ingredients only) supplied in the GDCF; Table S12: Chemical composition of the diet supplied in the GPF1; and Table S13: Chemical composition of the diet supplied in the GPF2.

Author Contributions

Conceptualization, E.A., V.A. and F.D.; methodology, E.A.; software, E.A. and N.J.H.; validation, E.A.; formal analysis, E.A. and A.M.; investigation, E.A.; resources, B.A. and T.B.; data curation, E.A. and N.J.H.; writing—original draft preparation, E.A., V.A., F.D. and A.M.; writing—review and editing, E.A., V.A., F.D., A.M., E.T., N.J.H., B.A. and T.B.; visualization, E.A.; supervision, B.A. and T.B.; project administration, B.A. and T.B.; funding acquisition, B.A. and T.B. All authors have read and agreed to the published version of the manuscript.

Funding

This research received no external funding.

Data Availability Statement

The original data presented in the study are openly available at https://github.com/mike1821/MELS/tree/Final-PDST-code (accessed on 13 July 2026).

Acknowledgments

This work was financially supported by the Greek General Secretariat for Research and Innovation under the “MELS” project (grant no. T11EΡA4-00076), funded under the Joint Call 2018 ERA-GAS (grant no. 696356), SusAn (grant no. 696231), and ICT-AGRI 2 (grant no. 618123) on “Novel technologies, solutions and systems to reduce the greenhouse gas emissions in animal production systems”. The authors would further like to acknowledge Marek Kieronczyk, who provided the data for the Polish Dairy Cattle Farm; Aggelos Manolopoulos (angelosmanolopoulos@gmail.com) for providing valuable expertise in incorporating all the necessary modifications and analyzing the program’s code; and K. Stathopoulos (kstathoroach@hotmail.gr) and M. Ahmed (mmohamet@gmail.com) for constructing the input framework and organizing the modifications for the tool.

Conflicts of Interest

The authors declare no conflicts of interest.

Abbreviations

The following abbreviations are used in this manuscript:
Nomenclature
Symbols
Ccarbon
CO2carbon dioxide
CH4methane
Nnitrogen
N2Onitrous oxide
NH3ammonia
NOxnitrogen oxide
Abbreviations
AEZagroecological zone
AFallocation factor
AFOLUagriculture, forestry, and other land uses
ASHconcash concentration in the feed dry matter
AWMSmanure management system
B0maximum amount of methane able to be produced from that manure
CAEZcontinental agroecological zone
Cdegdegradable carbon
CEDACentre for Environmental Data Analysis
Chumichumic carbon
CnonDegnon-degradable carbon
DMIdry matter
DMdigdigestibility of dry matter
Dnmend day of the immature growth period in pigs
DRfpdeath rate of finishing pigs
DRnmdeath rate of non-mature animals
DSdecision support
DSLslaughter day
DSSdecision support system
ECMenergy-corrected milk (kg)
EFemission factor
EFshpsemission factor of swine high productivity systems
EMEP/EEAEuropean Monitoring and Evaluation Programme and the European Environment Agency
FPCMfat/protein-corrected milk (kg)
GEIgross energy intake
GDCFGreek dairy cattle farm
GHGgreenhouse gas emission
GPF1Greek pig farm in Central Macedonia
GPF2Greek pig farm in Thessaly
GUIgraphical user interface
GWPglobal warming potential
GWP100-year global warming potential
IPCCIntergovernmental Panel on Climate Change
LCAlife cycle analysis
LULUCFLand Use, Land Use Change, and Forestry
LWlive weight (Kg)
MAEZMediterranean region—FarmAC
MCFmethane conventional factor
Nfpnumber of finishing pigs
Nnmnumber of non-mature pigs per parturition
Nsnumber of sows
NPKsynthetic fertilizer’s nitrogen, phosphorus, and potassium content (kg)
OMCconcconcentration of carbon in organic matter
PDCFPolish dairy cattle farm
PDSTprototype decision support tool
PPSaverage number of parturitions per sow per year
UNECEUnited Nations Economic Commission for Europe
VSvolatile solid

References

  1. Food and Agriculture Organization of the United Nations (FAO). FAOSTAT Database. Available online: https://www.fao.org/faostat/en/#data/GT (accessed on 2 December 2024).
  2. United Nations Framework Convention on Climate Change (UNFCCC). Adoption of the Paris Agreement; FCCC/CP/2015/L.9/Rev.1; UNFCCC: Paris, France, 2015; Available online: https://unfccc.int/resource/docs/2015/cop21/eng/l09r01.pdf (accessed on 9 January 2026).
  3. United Nations Framework Convention on Climate Change (UNFCCC). Time Series—GHG Total Without LULUCF, in kt CO2 Equivalent. 2023. Available online: https://di.unfccc.int/time_series (accessed on 9 January 2026).
  4. European Commission. Communication from the Commission to the European Parliament, the European Council, the Council, the European Economic and Social Committee and the Committee of the Regions—The European Green Deal. COM(2019) 640 Final, Brussels. 11 December 2019. Available online: https://eur-lex.europa.eu/legal-content/EN/TXT/?uri=COM:2019:640:FIN (accessed on 10 March 2026).
  5. European Commission. Annex to the Communication from the Commission to the European Parliament, the European Council, the Council, the European Economic and Social Committee and the Committee of the Regions: The European Green Deal; COM(2019) 640 Final; European Commission: Brussels, Belgium, 2019. [Google Scholar]
  6. European Parliament and Council of the European Union. Directive (EU) 2016/2284 of the European Parliament and of the Council of 14 December 2016 on the Reduction of National Emissions of Certain Atmospheric Pollutants, Amending Directive 2003/35/EC and Repealing Directive 2001/81/EC. Off. J. Eur. Union 2016, L344, 1–31. [Google Scholar]
  7. United Nations Economic Commission for Europe (UNECE). Protocol to the 1979 Convention on Long-Range Transboundary Air Pollution to Abate Acidification, Eutrophication and Ground-Level Ozone; ECE/EB.AIR/72; United Nations: Geneva, Switzerland, 2000; Available online: https://digitallibrary.un.org/record/433592 (accessed on 9 January 2026).
  8. Hou, Y.; Velthof, G.L.; Oenema, O. Mitigation of Ammonia, Nitrous Oxide and Methane Emissions from Manure Management Chains: A Meta-Analysis and Integrated Assessment. Glob. Change Biol. 2015, 21, 1293–1312. [Google Scholar] [CrossRef] [Scilit] [PubMed]
  9. Lam, S.K.; Suter, H.; Mosier, A.R.; Chen, D. Using Nitrification Inhibitors to Mitigate Agricultural N2O Emission: A Double-Edged Sword? Glob. Change Biol. 2017, 23, 485–489. [Google Scholar] [CrossRef] [Scilit] [PubMed]
  10. Rotz, C.A. Modeling Greenhouse Gas Emissions from Dairy Farms. J. Dairy Sci. 2018, 101, 6675–6690. [Google Scholar] [CrossRef] [Scilit] [PubMed]
  11. Chianese, D.S.; Rotz, C.A.; Richard, T.L. Whole-Farm Greenhouse Gas Emissions: A Review with Application to a Pennsylvania Dairy Farm. Appl. Eng. Agric. 2009, 25, 431–442. [Google Scholar] [CrossRef] [Scilit]
  12. Olander, L.; Wollenberg, E.; Tubiello, F.; Herold, M. Advancing Agricultural Greenhouse Gas Quantification. Environ. Res. Lett. 2013, 8, 011002. [Google Scholar] [CrossRef] [Scilit]
  13. Rawnsley, R.; Dynes, R.A.; Christie, K.M.; Harrison, M.T.; Doran-Browne, N.A.; Vibart, R.; Eckard, R. A Review of Whole Farm-System Analysis in Evaluating Greenhouse-Gas Mitigation Strategies from Livestock Production Systems. Anim. Prod. Sci. 2018, 58, 980–989. [Google Scholar] [CrossRef] [Scilit]
  14. Del Prado, A.; Crosson, P.; Olesen, J.E.; Rotz, C.A. Whole-Farm Models to Quantify Greenhouse Gas Emissions and Their Potential Use for Linking Climate Change Mitigation and Adaptation in Temperate Grassland Ruminant-Based Farming Systems. Animal 2013, 7, 373–385. [Google Scholar] [CrossRef] [Scilit] [PubMed]
  15. Ahmed, M.; Ahmad, S.; Waldrip, H.M.; Ramin, M.; Raza, M.A. Whole Farm Modeling: A Systems Approach to Understanding and Managing Livestock for Greenhouse Gas Mitigation, Economic Viability and Environmental Quality; American Society of Agronomy and Soil Science Society of America: Madison, WI, USA, 2020; Volume 67, pp. 345–371. [Google Scholar] [CrossRef] [Scilit]
  16. Hu, E.; Babcock, E.L.; Bialkowski, S.E.; Jones, S.B.; Tuller, M. Methods and Techniques for Measuring Gas Emissions from Agricultural and Animal Feeding Operations. Crit. Rev. Anal. Chem. 2014, 44, 200–219. [Google Scholar] [CrossRef] [Scilit] [PubMed]
  17. Tedeschi, L.O.; Greenwood, P.L.; Halachmi, I. Advancements in Sensor Technology and Decision Support Intelligent Tools to Assist Smart Livestock Farming. J. Anim. Sci. 2021, 99, skab038. [Google Scholar] [CrossRef] [Scilit] [PubMed]
  18. Rupnik, R.; Kukar, M.; Vračar, P.; Košir, D.; Pevec, D.; Bosnić, Z. AgroDSS: A Decision Support System for Agriculture and Farming. Comput. Electron. Agric. 2019, 161, 260–271. [Google Scholar] [CrossRef] [Scilit]
  19. Niloofar, P.; Francis, D.P.; Lazarova-Molnar, S.; Vulpe, A.; Vochin, M.C.; Suciu, G.; Balanescu, M.; Anestis, V.; Bartzanas, T. Data-Driven Decision Support in Livestock Farming for Improved Animal Health, Welfare and Greenhouse Gas Emissions: Overview and Challenges. Comput. Electron. Agric. 2021, 190, 106406. [Google Scholar] [CrossRef] [Scilit]
  20. Hillier, J.; Walter, C.; Malin, D.; Garcia-Suarez, T.; Mila-i-Canals, L.; Smith, P. A Farm-Focused Calculator for Emissions from Crop and Livestock Production. Environ. Model. Softw. 2011, 26, 1070–1078. [Google Scholar] [CrossRef] [Scilit]
  21. Ouatahar, L.; Bannink, A.; Lanigan, G.; Amon, B. Modelling the Effect of Feeding Management on Greenhouse Gas and Nitrogen Emissions in Cattle Farming Systems. Sci. Total Environ. 2021, 776, 145932. [Google Scholar] [CrossRef] [Scilit]
  22. Arulnathan, V.; Heidari, M.D.; Doyon, M.; Li, E.; Pelletier, N. Farm-Level Decision Support Tools: A Review of Methodological Choices and Their Consistency with Principles of Sustainability Assessment. J. Clean. Prod. 2020, 256, 120410. [Google Scholar] [CrossRef] [Scilit]
  23. Overseer Limited. Overseer. Available online: https://www.overseer.org.nz/ (accessed on 9 February 2026).
  24. Government of Canada. HOLOS. Available online: https://www.agr.gc.ca/eng/scientific-collaboration-and-research-in-agriculture/agricultural-research-results/holos-software-program/?id=1349181297838 (accessed on 9 February 2026).
  25. Buckley, C.; Donnellan, T.; Dillon, E.; Hanrahan, K.; Moran, B.; Ryan, M.; Curley, A.; Deane, L.; Delaney, L.; Harnett, P.; et al. Teagasc National Farm Survey 2017 Sustainability Report; Teagasc: Carlow, Ireland, 2019; ISBN 978-1-84170-650-4. [Google Scholar]
  26. Alexandropoulos, E.; Anestis, V.; Dragoni, F.; Hansen, A.; Cummins, S.; O’Brien, D.; Amon, B.; Bartzanas, T. Decision Support Systems Based on Gaseous Emissions and Their Impact on the Sustainability Assessment at the Livestock Farm Level: An Evaluation from the User’s Side. Sustainability 2023, 15, 13041. [Google Scholar] [CrossRef] [Scilit]
  27. IPCC. 2019 Refinement to the 2006 IPCC Guidelines for National Greenhouse Gas Inventories. Available online: https://www.ipcc.ch/report/2019-refinement-to-the-2006-ipcc-guidelines-for-national-greenhouse-gas-inventories/ (accessed on 30 May 2026).
  28. Amon, B.; Çinar, G.; Anderl, M.; Dragoni, F.; Kleinberger-Pierer, M.; Hörtenhuber, S. Inventory Reporting of Livestock Emissions: The Impact of the IPCC 1996 and 2006 Guidelines. Environ. Res. Lett. 2021, 16, 075001. [Google Scholar] [CrossRef] [Scilit]
  29. Alexandropoulos, E.; Anestis, V.; Rychła, A.; Dragoni, F.; Salazar, F.; O’Brien, D.; Bartzanas, T.; Amon, B. Understanding Stakeholder Perspectives on Decision Support Tools for Managing Emissions on Livestock Farms. Front. Anim. Sci. 2026, 7, 1814387. [Google Scholar] [CrossRef] [Scilit]
  30. Kilpatrick, S. Education and Training: Impacts on Farm Management Practice. J. Agric. Educ. Ext. 2000, 7, 105–116. [Google Scholar] [CrossRef] [Scilit]
  31. Schils, R.L.M.; Ellis, J.L.; de klein, C.A.M.; Lesschen, J.P.; Petersen, S.O.; Sommer, S.G. Mitigation of Greenhouse Gases from Agriculture: Role of Models. Acta Agric. Scand. A Anim. Sci. 2012, 62, 212–224. [Google Scholar] [CrossRef] [Scilit]
  32. Rose, D.C.; Morris, C.; Lobley, M.; Winter, M.; Sutherland, W.J.; Dicks, L.V. Exploring the Spatialities of Technological and User Re-Scripting: The Case of Decision Support Tools in UK Agriculture. Geoforum 2018, 89, 11–18. [Google Scholar] [CrossRef] [Scilit]
  33. Eska, N.; Lee, J.S.; Park, K.H. Greenhouse Gas Emissions from Livestock: Sources, Estimation, and Mitigation. J. Anim. Sci. Technol. 2024, 66, 1083–1098. [Google Scholar] [CrossRef] [Scilit] [PubMed]
  34. Rose, D.C.; Sutherland, W.J.; Parker, C.; Lobley, M.; Winter, M.; Morris, C.; Twining, S.; Ffoulkes, C.; Amano, T.; Dicks, L.V. Decision Support Tools for Agriculture: Towards Effective Design and Delivery. Agric. Syst. 2016, 149, 165–174. [Google Scholar] [CrossRef] [Scilit]
  35. Thumba, D.A.; Lazarova-Molnar, S.; Niloofar, P. Estimating Livestock Greenhouse Gas Emissions: Existing Models, Emerging Technologies and Associated Challenges. In Proceedings of the 2021 6th International Conference on Smart and Sustainable Technologies, SpliTech 2021; Institute of Electrical and Electronics Engineers Inc.: New York, NY, USA, 2021. [Google Scholar] [CrossRef] [Scilit]
  36. Niloofar, P.; Lazarova-Molnar, S.; Thumba, D.A.; Shahin, K.I. A Conceptual Framework for Holistic Assessment of Decision Support Systems for Sustainable Livestock Farming. Ecol. Indic. 2023, 155, 111029. [Google Scholar] [CrossRef] [Scilit]
  37. Gurmu, E.B.; Ndung’u, P.W.; Wilkes, A.; Getahun, D.; Graham, M.W.; Leitner, S.M.; Marquardt, S.; Mulat, D.G.; Merbold, L.; Worku, T.; et al. Comparison of Tier 1 and 2 Methodologies for Estimating Intake and Enteric Methane Emission Factors from Smallholder Cattle Systems in Africa: A Case Study from Ethiopia. Anim. Open Space 2024, 3, 100064. [Google Scholar] [CrossRef] [Scilit]
  38. Caro, D.; Davis, S.J.; Bastianoni, S.; Caldeira, K. Global and Regional Trends in Greenhouse Gas Emissions from Livestock. Clim. Change 2014, 126, 203–216. [Google Scholar] [CrossRef] [Scilit]
  39. Colomb, V.; Touchemoulin, O.; Bockel, L.; Chotte, J.L.; Martin, S.; Tinlot, M.; Bernoux, M. Selection of Appropriate Calculators for Landscape-Scale Greenhouse Gas Assessment for Agriculture and Forestry. Environ. Res. Lett. 2013, 8, 015029. [Google Scholar] [CrossRef] [Scilit]
  40. Díaz de Otálora, X.; Dragoni, F.; Del Prado, A.; Estellés, F.; Wilfart, A.; Krol, D.; Balaine, L.; Anestis, V.; Amon, B. Identification of Representative Dairy Cattle and Fodder Crop Production Typologies at Regional Scale in Europe. Agron. Sustain. Dev. 2022, 42, 94. [Google Scholar] [CrossRef] [Scilit]
  41. Janssens-Maenhout, G.; Petrescu, A.M.R.; Muntean, M.; Blujdea, V. Verifying Greenhouse Gas Emissions: Methods to Support International Climate Agreements. Greenh. Gas Meas. Manag. 2011, 1, 132–133. [Google Scholar] [CrossRef] [Scilit]
  42. Ogle, S.M.; Buendia, L.; Butterbach-Bahl, K.; Breidt, F.J.; Hartman, M.; Yagi, K.; Nayamuth, R.; Spencer, S.; Wirth, T.; Smith, P. Advancing National Greenhouse Gas Inventories for Agriculture in Developing Countries: Improving Activity Data, Emission Factors and Software Technology. Environ. Res. Lett. 2013, 8, 015030. [Google Scholar] [CrossRef] [Scilit]
  43. Alex Thumba, D.; Lazarova-Molnar, S.; Niloofar, P. Comparative Evaluation of Data Requirements and Level of Decision Support Provided by Decision Support Tools for Reducing Livestock-Related Greenhouse Gas Emissions. J. Clean. Prod. 2022, 373, 133886. [Google Scholar] [CrossRef] [Scilit]
  44. Seebauer, M. Whole Farm Quantification of GHG Emissions within Smallholder Farms in Developing Countries. Environ. Res. Lett. 2014, 9, 035006. [Google Scholar] [CrossRef] [Scilit]
  45. European Environment Agency (EEA). EMEP/EEA Air Pollutant Emission Inventory Guidebook 2023—Technical Guidance to Prepare National Emission Inventories; EEA Report No. 06/2023; European Environment Agency: Copenhagen, Denmark, 2023; Available online: https://www.eea.europa.eu/en/analysis/publications/emep-eea-guidebook-2023 (accessed on 30 May 2026).
  46. Hassouna, M.; van der Weerden, T.J.; Beltran, I.; Amon, B.; Alfaro, M.A.; Anestis, V.; Cinar, G.; Dragoni, F.; Hutchings, N.J.; Leytem, A.; et al. DATAMAN: A Global Database of Methane, Nitrous Oxide, and Ammonia Emission Factors for Livestock Housing and Outdoor Storage of Manure. J. Environ. Qual. 2023, 52, 207–223. [Google Scholar] [CrossRef] [Scilit] [PubMed]
  47. Anestis, V.; Umar, W.; Dragoni, F.; van der Weerden, T.J.; Hassouna, M.; Noble, A.; Bartzanas, T.; Amon, B. Mitigation of Greenhouse Gas and Ammonia Emissions Due to Livestock Housing Management Practices: Analysis of the DATAMAN Database. Biosyst. Eng. 2025, 258, 104260. [Google Scholar] [CrossRef] [Scilit]
  48. Anestis, V.; Papanastasiou, D.K.; Bartzanas, T.; Giannenas, I.; Skoufos, I.; Kittas, C. Effect of a Dietary Modification for Fattening Pigs on the Environmental Performance of Commercial Pig Production in Greece. Sustain. Prod. Consum. 2020, 22, 162–176. [Google Scholar] [CrossRef] [Scilit]
  49. Akamati, K.; Laliotis, G.P.; Bizelis, I. Comparative Assessment of Greenhouse Gas Emissions in Pig Farming Using Tier Inventories. Environments 2022, 9, 59. [Google Scholar] [CrossRef] [Scilit]
  50. Aarhus University. FarmAC. Available online: https://www.farmac.dk/ (accessed on 9 February 2020).
  51. IPCC. Chapter 11: N2O Emissions from Managed Soils, and CO2 Emissions from Lime and Urea Application. In 2019 Refinement to the 2006 IPCC Guidelines for National Greenhouse Gas Inventories. Volume 4: Agriculture, Forestry and Other Land Use; IPCC: Geneva, Switzerland, 2019; pp. 11.1–11.48. Available online: https://www.ipcc-nggip.iges.or.jp/public/2019rf/pdf/4_Volume4/19R_V4_Ch11_Soils_N2O_CO2.pdf (accessed on 30 May 2026).
  52. IPCC. Chapter 10: Emissions from Livestock and Manure Management. In 2019 Refinement to the 2006 IPCC Guidelines for National Greenhouse Gas Inventories. Volume 4: Agriculture, Forestry and Other Land Use; IPCC: Geneva, Switzerland, 2019; pp. 10.1–10.87. Available online: https://www.ipcc-nggip.iges.or.jp/public/2019rf/pdf/4_Volume4/19R_V4_Ch10_Livestock.pdf (accessed on 30 May 2026).
  53. Bittman, S.; Dedina, M.; Howard, C.M.; Oenema, O.; Sutton, M.A. (Eds.) Options for Ammonia Mitigation: Guidance from the UNECE Task Force on Reactive Nitrogen; Centre for Ecology & Hydrology: Edinburgh, UK, 2014; ISBN 978-1-906698-46-1. Available online: https://www.clrtap-tfrn.org/sites/default/files/2024-11/clrtap_AGD_final_file.pdf (accessed on 30 May 2026).
  54. American Society of Agricultural Engineers. ASAE D384.2 MAR2005: Manure Production and Characteristics; American Society of Agricultural Engineers: St. Joseph, MI, USA, 2005; Available online: https://elibrary.asabe.org/abstract.asp?aid=32018 (accessed on 6 February 2026).
  55. CEDA. CRU TS4.09: Climatic Research Unit Time-Series Version 4.09 of High-Resolution Gridded Data of Month-by-Month Variation in Climate, January 1901–December 2024; Centre for Environmental Data Analysis: Harwell, UK, 2025. [Google Scholar]
  56. Hutchings, N.J.; Ozkan Gulzari, S.; De Haan, M.; Sandars, D. How Do Farm Models Compare When Estimating Greenhouse Gas Emissions from Dairy Cattle Production? Animal 2018, 12, 2171–2180. [Google Scholar] [CrossRef] [Scilit] [PubMed]
  57. IPCC. Climate Change 2023: Synthesis Report. Contribution of Working Groups I, II and III to the Sixth Assessment Report of the Intergovernmental Panel on Climate Change; Lee, H., Romero, J., Eds.; Intergovernmental Panel on Climate Change: Geneva, Switzerland, 2023. [Google Scholar] [CrossRef] [Scilit]
  58. Wilfart, A.; Baillet, V.; Balaine, L.; Díaz de Otálora, X.; Dragoni, F.; Krol, D.J.; Frątczak-Müller, J.; Rychła, A.; Rodriguez, D.G.P.; Breen, J.; et al. DEXi-Dairy: An Ex Post Multicriteria Tool to Assess the Sustainability of Dairy Production Systems in Various European Regions. Agron. Sustain. Dev. 2023, 43, 82. [Google Scholar] [CrossRef] [Scilit]
  59. National Research Council. Nutrient Requirements of Dairy Cattle, 7th ed.; National Academies Press: Washington, DC, USA, 2001; ISBN 978-0-309-06997-7. [Google Scholar] [CrossRef] [Scilit] [PubMed]
  60. National Research Council. Nutrient Requirements of Swine, 11th ed.; National Academies Press: Washington, DC, USA, 2012; ISBN 978-0-309-22423-9. [Google Scholar] [CrossRef] [Scilit] [PubMed]
  61. National Academies of Sciences, Engineering, and Medicine. Nutrient Requirements of Dairy Cattle, 8th ed.; The National Academies Press: Washington, DC, USA, 2021. [Google Scholar] [CrossRef] [Scilit] [PubMed]
  62. Reincke, K.; Saha, A.; Wyrzykowski, Ł. The Global Dairy World 2017/18: Results of the IFCN Dairy Report 2018; IFCN Dairy Research Network: Kiel, Germany, 2018; Available online: https://ifcndairy.org/wp-content/uploads/2018/10/Dairy-Report-Article-2018.pdf (accessed on 6 February 2026).
  63. Gislon, G.; Bava, L.; Colombini, S.; Zucali, M.; Crovetto, G.M.; Sandrucci, A. Looking for High-Production and Sustainable Diets for Lactating Cows: A Survey in Italy. J. Dairy Sci. 2020, 103, 4863–4873. [Google Scholar] [CrossRef] [Scilit] [PubMed]
  64. Mc Geough, E.J.; Little, S.M.; Janzen, H.H.; McAllister, T.A.; McGinn, S.M.; Beauchemin, K.A. Life-Cycle Assessment of Greenhouse Gas Emissions from Dairy Production in Eastern Canada: A Case Study. J. Dairy Sci. 2012, 95, 5164–5175. [Google Scholar] [CrossRef] [Scilit] [PubMed]
  65. Rojo-Gimeno, C.; Postma, M.; Dewulf, J.; Hogeveen, H.; Lauwers, L.; Wauters, E. Farm-Economic Analysis of Reducing Antimicrobial Use Whilst Adopting Improved Management Strategies on Farrow-to-Finish Pig Farms. Prev. Vet. Med. 2016, 129, 74–87. [Google Scholar] [CrossRef] [Scilit] [PubMed]
  66. Schils, R.L.M.; Olesen, J.E.; del Prado, A.; Soussana, J.F. A Review of Farm-Level Modelling Approaches for Mitigating Greenhouse Gas Emissions from Ruminant Livestock Systems. Livest. Sci. 2007, 112, 240–251. [Google Scholar] [CrossRef] [Scilit]
  67. Lengers, B.; Schiefler, I.; Büscher, W. A Comparison of Emission Calculations Using Different Modeled Indicators with 1-Year Online Measurements. Environ. Monit. Assess. 2013, 185, 9751–9762. [Google Scholar] [CrossRef] [Scilit] [PubMed]
  68. Hellenic Republic. National Inventory Document of Greece for Greenhouse and Other Gases for the Years 1990–2024; Submission Under the United Nations Framework Convention on Climate Change (UNFCCC): Athens, Greece, 2026. [Google Scholar]
  69. Poland. National Inventory Document 2026: Greenhouse Gas Inventory 1988–2024; Submission Under the United Nations Framework Convention on Climate Change (UNFCCC): Warsaw, Poland, 2026. [Google Scholar]
  70. European Environment Agency (EEA). Greenhouse Gas Emissions from Agriculture in Europe; EEA Indicators: Copenhagen, Denmark, 2025; Available online: https://www.eea.europa.eu/en/analysis/indicators/greenhouse-gas-emissions-from-agriculture (accessed on 13 July 2026).
  71. Bartzanas, T.; Anestis, V.; Papaioannou, C.; Kittas, C. Assessment of environmental footprint of livestock facilities. In Proceedings of the 2nd International Conference on Food and Biosystems Engineering (FaBE 2015), Mykonos Island, Greece, 28–31 May 2015; pp. 157–163. [Google Scholar]
  72. Doltra, J.; Villar, A.; Moros, R.; Salcedo, G.; Hutchings, N.J.; Kristensen, I.S. Forage Management to Improve On-Farm Feed Production, Nitrogen Fluxes and Greenhouse Gas Emissions from Dairy Systems in a Wet Temperate Region. Agric. Syst. 2018, 160, 70–78. [Google Scholar] [CrossRef] [Scilit]
  73. Fantin, V.; Buttol, P.; Pergreffi, R.; Masoni, P. Life Cycle Assessment of Italian High Quality Milk Production. A Compari-son with an EPD Study. J. Clean. Prod. 2012, 28, 150–159. [Google Scholar] [CrossRef] [Scilit]
  74. Guerci, M.; Knudsen, M.T.; Bava, L.; Zucali, M.; Schönbach, P.; Kristensen, T. Parameters Affecting the Environmental Impact of a Range of Dairy Farming Systems in Denmark, Germany and Italy. J. Clean. Prod. 2013, 54, 133–141. [Google Scholar] [CrossRef] [Scilit]
  75. Bieńkowski, J.; Baum, R.; Holka, M. Eco-Efficiency of Milk Production in Poland Using the Life Cycle Assessment Methodologies. Eur. Res. Stud. 2021, 24, 890–912. [Google Scholar] [CrossRef] [Scilit]
  76. Kristensen, T.; Mogensen, L.; Knudsen, M.T.; Hermansen, J.E. Effect of Production System and Farming Strategy on Greenhouse Gas Emissions from Commercial Dairy Farms in a Life Cycle Approach. Livest. Sci. 2011, 140, 136–148. [Google Scholar] [CrossRef] [Scilit]
  77. Hagemann, M.; Hemme, T.; Ndambi, A.; Alqaisi, O.; Sultana, M.N. Benchmarking of Greenhouse Gas Emissions of Bovine Milk Production Systems for 38 Countries. Anim. Feed Sci. Technol. 2011, 166–167, 46–58. [Google Scholar] [CrossRef] [Scilit]
  78. Wang, Y.; Liu, S.; Xie, Q.; Ma, Z. Carbon Footprint of a Typical Crop–Livestock Dairy Farm in Northeast China. Agriculture 2024, 14, 1696. [Google Scholar] [CrossRef] [Scilit]
  79. Hörtenhuber, S.J.; Matzhold, C.; Herndl, M.; Steininger, F.; Linke, K.; Wieser, S.; Egger-Danner, C. Sustainability Assessment of Austrian Dairy Farms Using the Tool NEU.rind: Identifying Farm-Specific Benchmarks and Recommendations, Farm Typologies and Trade-Offs. Sustainability 2026, 18, 303. [Google Scholar] [CrossRef] [Scilit]
  80. Ferraz, P.F.P.; Ferraz, G.A.S.; Ferreira, J.C.; Aguiar, J.V.; Santana, L.S.; Norton, T. Assessment of Ammonia Emissions and Greenhouse Gases in Dairy Cattle Facilities: A Bibliometric Analysis. Animals 2024, 14, 1721. [Google Scholar] [CrossRef] [Scilit] [PubMed]
  81. IPCC. Chapter 11: N2O Emissions from Managed Soils, and CO2 Emissions from Lime and Urea Application. In 2006 IPCC Guidelines for National Greenhouse Gas Inventories. Volume 4: Agriculture, Forestry and Other Land Use; IPCC: Geneva, Switzerland, 2006; pp. 11.1–11.54. Available online: https://www.ipcc-nggip.iges.or.jp/public/2006gl/pdf/4_Volume4/V4_11_Ch11_N2O%26CO2.pdf (accessed on 15 March 2026).
  82. IPCC. Chapter 10: Emissions from Livestock and Manure Management. In 2006 IPCC Guidelines for National Greenhouse Gas Inventories. Volume 4: Agriculture, Forestry and Other Land Use; IPCC: Geneva, Switzerland, 2006; pp. 10.1–10.87. Available online: https://www.ipcc-nggip.iges.or.jp/public/2006gl/pdf/4_Volume4/V4_10_Ch10_Livestock.pdf (accessed on 15 March 2026).
  83. Monteiro, A.N.T.R.; Wilfart, A.; Utzeri, V.J.; Batorek Lukač, N.; Tomažin, U.; Costa, L.N.; Čandek-Potokar, M.; Fontanesi, L.; Garcia-Launay, F. Environmental Impacts of Pig Production Systems Using European Local Breeds: The Contribution of Carbon Sequestration and Emissions from Grazing. J. Clean. Prod. 2019, 237, 117843. [Google Scholar] [CrossRef] [Scilit]
  84. Noya, I.; Villanueva-Rey, P.; González-García, S.; Fernandez, M.D.; Rodriguez, M.R.; Moreira, M.T. Life Cycle Assessment of Pig Production: A Case Study in Galicia. J. Clean. Prod. 2017, 142, 4327–4338. [Google Scholar] [CrossRef] [Scilit]
  85. Aguerre, M.J.; Wattiaux, M.A.; Powell, J.M.; Broderick, G.A.; Arndt, C. Effect of Forage-to-Concentrate Ratio in Dairy Cow Diets on Emission of Methane, Carbon Dioxide, and Ammonia, Lactation Performance, and Manure Excretion. J. Dairy Sci. 2011, 94, 3081–3093. [Google Scholar] [CrossRef] [Scilit] [PubMed]
  86. Food and Agriculture Organization of the United Nations. Greenhouse Gas Emissions from the Dairy Sector: A Life Cycle Assessment; Animal Production and Health Division, FAO: Rome, Italy, 2010. [Google Scholar]
  87. Schouten, M.A.H.; Verwaart, T.; Heijman, W.J.M. Comparing Two Sensitivity Analysis Approaches for Two Scenarios with a Spatially Explicit Rural Agent-Based Model. Environ. Model. Softw. 2014, 54, 196–210. [Google Scholar] [CrossRef] [Scilit]
  88. Thumba, D.A.; Lazarova-Molnar, S.; Niloofar, P. Data-Driven Decision Support Tools for Reducing GHG Emissions from Livestock Production Systems: Overview and Challenges. In Proceedings of the 2020 7th International Conference on Internet of Things: Systems, Management and Security (IOTSMS 2020); Institute of Electrical and Electronics Engineers Inc.: Piscataway, NJ, USA, 2020. [Google Scholar]
  89. Crosson, P.; Shalloo, L.; O’Brien, D.; Lanigan, G.J.; Foley, P.A.; Boland, T.M.; Kenny, D.A. A Review of Whole Farm Systems Models of Greenhouse Gas Emissions from Beef and Dairy Cattle Production Systems. Anim. Feed Sci. Technol. 2011, 166–167, 29–45. [Google Scholar] [CrossRef] [Scilit]
  90. da Silva, T.E.; Cabrera, V.E. The DairyPrint Model: A Decision Support Model to Help Dairy Farmers and Other Stakeholders toward Improved Sustainability. J. Dairy Sci. 2024, 107, 10998–11015. [Google Scholar] [CrossRef] [Scilit] [PubMed]
  91. Adesogan, A.T.; Gebremikael, M.B.; Varijakshapanicker, P.; Vyas, D. Climate-Smart Approaches for Enhancing Livestock Productivity, Human Nutrition, and Livelihoods in Low- and Middle-Income Countries. Anim. Prod. Sci. 2025, 65, AN24215. [Google Scholar] [CrossRef] [Scilit]
  92. Cool Farm Alliance. Cool Farm Tool. Available online: https://coolfarmtool.org/ (accessed on 9 February 2025).
  93. Nsabiyeze, A.; Zhang, M.; Li, J.; Zhao, Q.; Zhang, X. Precision Livestock Farming for Climate-Resilient Livestock Management: A Review of Real-Time Monitoring and Decision Support Systems. J. Clean. Prod. 2025, 524, 146454. [Google Scholar] [CrossRef] [Scilit]
  94. Lovarelli, D.; Bacenetti, J.; Guarino, M. A Review on Dairy Cattle Farming: Is Precision Livestock Farming the Compromise for an Environmental, Economic and Social Sustainable Production? J. Clean. Prod. 2020, 262, 121409. [Google Scholar] [CrossRef] [Scilit]
  95. Kleen, J.L.; Guatteo, R. Precision Livestock Farming: What Does It Contain and What Are the Perspectives? Animals 2023, 13, 779. [Google Scholar] [CrossRef] [Scilit] [PubMed]
  96. Papakonstantinou, G.I.; Voulgarakis, N.; Terzidou, G.; Fotos, L.; Giamouri, E.; Papatsiros, V.G. Precision Livestock Farming Technology: Applications and Challenges of Animal Welfare and Climate Change. Agriculture 2024, 14, 620. [Google Scholar] [CrossRef] [Scilit]
  97. Atanasov, S. State-of-the-Art Technologies for Remote Sensing of Crops Water Status and Nutrients in Agriculture: A Review. Sci. Horiz. 2023, 26, 167–177. [Google Scholar] [CrossRef] [Scilit]
  98. Atanasov, S. Automated Remote Sensing System for Crops Monitoring and Irrigation Management, Based on Leaf Color Change and Piecewise Linear Regression Models for Soil Moisture Content Predicting. Sci. Horiz. 2024, 27, 127–139. [Google Scholar] [CrossRef] [Scilit]
  99. Sishodia, R.P.; Ray, R.L.; Singh, S.K. Applications of Remote Sensing in Precision Agriculture: A Review. Remote Sens. 2020, 12, 3136. [Google Scholar] [CrossRef] [Scilit]
  100. Wang, J.; Wang, Y.; Li, G.; Qi, Z. Integration of Remote Sensing and Machine Learning for Precision Agriculture: A Comprehensive Perspective on Applications. Agronomy 2024, 14, 1975. [Google Scholar] [CrossRef] [Scilit]
Figure 1. Schematic workflow of the PDST.
Agriengineering 08 00309 g001
Table 1. Product and emission outputs of the two dairy cattle farms (Polish and Greek) as provided by the PDST.
Annual GHG Emissions (tn CO2eq)PDCF 1,3GDCF 2,3
Direct enteric CH4187.881156.71
Direct CH4 from manure (housing and storage)95.32488.13
Direct N2O from manure (housing and storage)29.54275.78
Direct N2O from field application of synthetic fertilizers and manure156.42NR 5
Total direct GHG emissions593.681920.63
Indirect N2O due to N volatilization from housing1.5420.03
Indirect N2O due to N volatilization from manure storage4.150.66
Indirect N2O due to N volatilization from field application of manure4.16NR
Indirect N2O due to N volatilization from field application of synthetic fertilizers8.95NR
Indirect N2O due to N leaching64.79NR
Total indirect GHG emissions83.5370.69
Total farm-level GHG emissions (direct + indirect) allocated to raw milk629.811692.62
Total livestock-related GHG emissions (direct + indirect) allocated to raw milk293.31692.62
Farm-level GHG emissions 4 (kg CO2eq/kg raw milk (ECM; FPCM))1.87; 1.830.66; 0.64
Livestock-related GHG emissions 4 (kg CO2eq/kg raw milk (ECM; FPCM))0.88; 0.860.66; 0.64
1 Polish agroecological zone, as implemented in the PDST; 2 Greek agroecological zone, as implemented in the PDST; 3 in the case of the PDST, N volatilization in manure management includes NH3 and nitrogen oxides; 4 equivalent to the Global Warming Potential—100 years (GWP100); 5 NR, not relevant, as the farm had no fields.
Table 2. Product and emission outputs of GPF1 and GPF2 for the PDST.
Annual GHG Emissions (tn CO2eq)GPF1 1,2GPF2 1,2
Total pig LW production (kg)918,872.01,551,132.0
Direct enteric CH4190.54317.14
Direct CH4 from manure management1172.211925.99
Direct N2O from manure management0.00.0
Total direct GHG emissions1362.752243.13
Indirect N2O due to N volatilization from housing64.31103.49
Indirect N2O due to N volatilization from manure storage24.8840.92
Total indirect GHG emissions 89.19144.41
Total GHG emissions1451.342500.61
GHG emissions 3 (kg CO2eq/kg pig LW produced)1.581.54
1 Greek agroecological zone, as implemented in the PDST; 2 in the case of the PDST, indirect GHG emissions from N volatilization in manure management include NH3 and nitrogen oxides; 3 equivalent to the Global Warming Potential—100 years (GWP100).
Table 3. Comparison of GHG in dairy production systems between the present study and the literature.
Study/SystemTotal or Farm-Related GHG Emissions (kg CO2-eq/kg Product) 1Livestock-Related/on-Farm Emissions (kg CO2-eq/kg Product) 2Qualitative Information
GDCF—PDST (present study)-0.66 (ECM); 0.64 (FPCM)Present study.
PDCF—PDST (present study)1.87 (ECM); 1.83 (FPCM) (livestock and crop production)0.88 (ECM); 0.86 (FPCM)Present study.
[71], Greece 0.91 (FPCM) (enteric methane, manure management, manure storage/application. and on-farm crop production)Intensive dairy system; slurry tank; cradle-to-farm-gate LCA.
[72], Spain1.5, 1.3, and 1.1 (milk)-FarmAC; slurry tank; non-grazing-oriented systems; values differed by production level and forage system.
[73], ItalyFarm-gate range in European systems: 0.9–1.5 (milk)1.07 (milk) (livestock production, crop production, diesel consumption, and fertilizer production)Tied stall housing; slurry tank; on-farm emissions were 82% of total supply chain emissions.
[74], Italy/Europe1.11–1.91 (ECM)0.66–1.05 (ECM) (enteric and storage emissions)Non-grazing intensive farms; solid manure storage, liquid slurry, and pit storage systems.
[75], Poland1.09 kg CO2-eq/kg FPCMApprox. 0.7 kg CO2-eq/kg FPCM (a mean value of 15 farms, 64% for enteric fermentation + manure management)Intensive farms; mainly litter-based manure management.
[76], Denmark0.97–1.56 (ECM)0.73–1.03 (ECM) (livestock and manure management of 35 conventional farms)Intensive conventional farms; 40% slurry and 60% deep litter manure; cradle-to-farm-gate LCA.
[77], Germany1.19 (ECM)0.833 (ECM) (a mean value of 1 farm, 70% for enteric fermentation + manure management)Forage-based intensive farm; fully confined housing; liquid slurry.
1 Total or farm-related emissions refers to the broader system boundary reported in each study, which may include crop production and other farm inputs. 2 Livestock-related or on-farm emissions refers to the livestock emission sources reported in each study, mainly enteric fermentation and manure management.
Table 4. Comparison of emission sources in dairy production systems from the present study and selected literature.
Study/SystemMethane Emissions (kg CO2-eq/kg Product)N2O Emissions (kg CO2-eq/kg Product)
PDCFEnteric CH4: 0.520 (ECM), 0.507 (FPCM); manure CH4: 0.264 (ECM), 0.258 (FPCM).Direct N2O: 0.082 (ECM), 0.08 (FPCM); indirect N2O: 0.015 (ECM), 0.015 kg (FPCM).
GDCFEnteric CH4: 0.381 (ECM), 0.372 (FPCM); manure CH4: 0.161 (ECM) (0.157 (FPCM).Direct N2O: 0.091 (ECM), 0.089 (FPCM); indirect N2O: 0.023 (ECM), 0.023 (FPCM).
[73]Enteric + manure CH4: 0.477 (milk) (45% of total emissions).N2O from manure management and fertilizers: 0.318 (milk) (30% of total emissions).
[71]Total on-farm CH4 (enteric + manure): 0.79(FPCM); enteric: 0.444(FPCM); manure: 0.346 (FPCM).Direct N2O from storage: 0.047 (FPCM); total direct + indirect N2O from storage and application: 0.067 (FPCM).
[76]Total CH4: 0.62 (ECM); enteric CH4: 0.53 (ECM); manure CH4: 0.09 (ECM).Total N2O: 0.29 (ECM); direct N2O: 0.054 (ECM), indirect N2O: 0.0669 (ECM).
Table 5. Comparison of greenhouse gas emissions in intensive pig production systems between the present study and the selected literature.
Study/SystemTotal or Farm-Related GHG Emissions (kg CO2-eq/kg LW) 1Livestock-Related/On-Farm Emissions (kg CO2-eq/kg LW) 2Qualitative Information
GPF11.58Present study; intensive Greek pig farm; fully slatted housing and outdoor slurry tank storage; closer to literature for similar systems. Enteric CH4: 0.207; manure CH4: 1.28; indirect N2O: 0.097 kg CO2-eq/kg LW.
GPF21.54Present study; intensive Greek pig farm; fully slatted housing and outdoor slurry tank storage; closer to literature for similar systems. Enteric CH4: 0.205; manure CH4: 1.242; indirect N2O: 0.093 kg CO2-eq/kg LW.
Anestis et al. [48], Greece3.85–4.151.46–1.58Farrow-to-finish pig systems; cradle-to-farm-gate/supply chain approach; on-farm emissions accounted for 38% of total.
Monteiro et al. [83], France5.071.27–1.7811 farrow-to-finish and 10 feeder-to-finish farms; litter-based manure management; on-farm (estimated non-feed/pig-production-stage) share 25–35% of total emissions.
Monteiro et al. [83], Italy9.352.34–3.277 farrow-to-finish and 1 farrow-to-feeder farm; slatted floors for some housing and deep litter systems; on-farm (estimated non-feed/pig-production-stage) share 25–35%.
Monteiro et al. [83], Slovenia6.941.74–2.438 indoor/outdoor farms; slatted and deep-litter floors; farrow-to-finish and feeder-to-finish systems; on-farm (estimated non-feed/pig-production-stage) share 25–35%.
Noya et al. [84], Spain3.422.10Cradle-to-gate LCA of finished pigs; on-farm emissions contributed 61.4% of total GWP; feed inputs contributed 38.6%.
1 Total or farm-related emissions refers to the broader system boundary reported in each study, which may include crop production and other farm inputs. 2 Livestock-related or on-farm emissions refers to the livestock emission sources reported in each study, mainly enteric fermentation and manure management.
Table 6. Comparison of FarmAC and PDST dairy cattle emissions.
Case StudyBoundaryFarmAC Before Allocation, t CO2-eq/yrFarmAC After Allocation, t CO2-eq/yrFarmAC kg CO2-eq/kg ECM, FPCMPDST Before Allocation, t CO2-eq/yrPDST After Allocation, t CO2-eq/yrPDST kg CO2-eq/kg ECM, FPCMChange (%) 1
PDCFLivestock-only sources409.04380.411.132; 1.105318.38296.090.881; 0.860−22.2%
PDCFFarm-level with crop production741.03689.162.051; 2.002677.21629.811.874; 1.829−8.6%
GDCFLivestock-only sources2530.252150.710.833; 0.8131991.321692.620.656; 0.640−21.3%
1 The percentage change was calculated from the allocated FarmAC and PDST emissions as (PDST-FarmAC)/FarmAC × 100.
Disclaimer/Publisher’s Note: The statements, opinions and data contained in all publications are solely those of the individual author(s) and contributor(s) and not of MDPI and/or the editor(s). MDPI and/or the editor(s) disclaim responsibility for any injury to people or property resulting from any ideas, methods, instructions or products referred to in the content.