


Abstract
In the development of intelligent processing for fresh corn cobs, automated inspection of ear appearance quality to promptly sort out cobs with surface defects and ensure overall product compliance is currently a hot topic in agricultural product processing research. However, fresh corn cob surfaces are covered with numerous independent, densely packed kernels, and defects affecting one or more kernels create surface anomalies of highly variable sizes. This leads to defect targets with multi-scale features and scattered distributions, making it challenging for existing deep learning-based visual inspection methods to simultaneously optimize small-target modeling capacity and computational efficiency. Consequently, these methods cannot effectively balance the accuracy of small-scale defect detection with computational efficiency, making it difficult to meet practical requirements. To address these issues, this paper proposes the SSAD-YOLOv8s-Prune defect detection method for small-scale defect detection in white fresh corn cobs. First, the backbone layer of the original model is replaced with a custom-designed SSA structure, which not only expands the feature dimensions for small-scale defects and enriches feature representation but also reduces the number of computational parameters to achieve model compression. Second, the original neck layer is replaced with a custom-designed RepDyFPN structure to enable feature fusion and interaction across different scales and depths. Finally, the LAMP algorithm is employed to prune and compress the newly improved model, further achieving model compression performance. Compared with the baseline YOLOv8s, our method reduces model parameters by 9.33 M, floating-point operations (FLOPs) by 12.5 G, and model size by 17.6 MB, while simultaneously improving mAP50 by 1.2 percentage points to 96.1% and mAP50–95 by 4.1 percentage points to 62.8%. Furthermore, our method maintains advantages over other mainstream detection models. Therefore, the proposed SSAD-YOLOv8-Prune detection model successfully balances detection accuracy with model compression, providing a feasible detection method for small-scale defect detection in fresh corn cobs.
1. Introduction
As a globally significant food crop, fresh corn cob possesses characteristics of both fruits and vegetables. It is highly nutritious, has a short growing cycle, and offers significant economic benefits, making it highly favored by consumers, growers, and processing enterprises [1,2]. While fresh corn cob processing has become increasingly automated and intelligent, external quality inspection and grading still rely predominantly on manual labor. This bottleneck prevents the implementation of fully automated production lines, creating an urgent demand for vision-based external quality assessment technologies.
In recent years, the rapid advancement of computer vision technology has provided new technical tools for the visual quality inspection of agricultural products. Visual inspection technology extracts features such as color, texture, and shape from the surface of the produce and combined with corresponding image processing algorithms, enables the automated identification of visual defects and quality grades in agricultural products. Early studies primarily employed manually designed features (such as color histograms, texture, shape, and edge features) in conjunction with classification models like Support Vector Machines (SVMs), Random Forests (RFs), and K-Nearest Neighbors (KNNs) for inspection [3,4,5,6]. However, these methods are highly feature-dependent and exhibit limited robustness and adaptability in complex environments. Convolutional Neural Network (CNN)-based deep learning models automatically learn hierarchical semantic features from large-scale datasets, delivering substantial improvements in detection accuracy and robustness. These models have thus been widely adopted for crop pest and disease detection and agricultural product quality inspection. For example, Asaduzzaman et al. [7] designed a hybrid CNN model to achieve high-precision detection of fresh corn leaf diseases, obtaining F1 scores of 0.94 and 0.97 for the common rust disease and healthy categories; Gokila et al. [8] designed a CNN-based classification and detection model for green peppers, achieving a classification accuracy of over 90%. However, CNN-based classification and detection methods are typically designed for single-object or single-class tasks, limiting their ability to simultaneously localize and identify multiple defect categories. This imposes significant constraints on their practical application. Region-based Convolutional Neural Network (R-CNN) object detectors introduce a Region Proposal Network (RPN) to jointly model multi-object localization and classification and have achieved promising detection accuracy in fruit and grain recognition tasks [9,10,11,12]. However, these two-stage detectors separate region proposal generation from regression and classification, leading to high inference latency and making them unsuitable for real-time detection applications.
In contrast, the YOLO series of models achieve higher inference speeds through single-stage prediction, making them more suitable for online detection and real-time monitoring tasks in agricultural production. For example, to address the issue of insufficient accuracy in predicting citrus ripeness in complex growing environments, Huang et al. [13] introduced the Re-parameterizable Generalized Feature Pyramid Network (RepGFPN) based on YOLOv8, significantly enhancing the model’s multi-scale feature fusion capabilities and improving detection accuracy to over 96%. To achieve model compression, Zhao et al. [14] constructed the model compression detection model SS-YOLOv8 based on ShuffleNetV2. With a model size of only 4.2 MB, it achieved a detection accuracy of 98.7% for fresh corn cobs ear quality assessment. Yuan et al. [15] combined the Ghost module with the SEAM attention mechanism to design the CES-YOLO compression model, successfully deploying it on edge devices to enable real-time detection of blueberry ripeness. Meanwhile, Yang et al. [16] built a high-precision, high-speed corn kernel quality detection model based on YOLOv7, which performed excellently in online quality inspection applications. With successive iterations of the YOLO series, their small-object detection performance has improved steadily, enabling more stable and robust feature extraction for tasks including fruit and vegetable defect detection, grain mold identification, and minute surface defect detection on corn cobs. For example, Hu et al. [17] introduced an attention mechanism to enhance the extraction of subtle textures from diseased grape leaf regions, improving detection accuracy in complex environments; Zhang et al. [18] proposed an improved FSL-YOLOv8 model to address the challenges of small target size, high object density, and similar appearance between corn kernels and impurities, achieving over 95% accuracy; and Chen et al. [19] optimized YOLOv8’s feature representation and multi-scale fusion capabilities for small-scale passion fruit skin lesion detection, achieving a final accuracy of 94.8%.
Zhang et al. [20] addressed the inherent challenges of field crop pests—small size, scattered distribution, and complex backgrounds—by integrating a dedicated small-object detection branch, multi-scale feature fusion module, and adaptive anchor box mechanism into YOLOv8. This approach significantly improved millimeter-scale pest detection accuracy and established a general technical framework for agricultural small-object detection. Hou et al. [21] developed a tomato leaf disease detection method that combines super-resolution enhancement with an optimized YOLOv8 model. This approach reconstructs fine-grained features of tiny lesions using a super-resolution module, effectively overcoming the critical bottlenecks of low pixel occupancy and blurred feature representation in early-stage lesions. Their feature enhancement strategy provided valuable insights and a key reference for the fresh corn cob small-scale defect detection task presented herein. Huang et al. [22] comprehensively reviewed the technical evolution of YOLO-series models for small-object detection, identifying core research directions including downsampling layer optimization, attention mechanism integration, and multi-scale feature pyramid refinement. Building on this systematic review, we refined the background discussion of small-object detection technologies and validated the technical rationale for our two core design decisions: reducing backbone downsampling layers and constructing the RepDyFPN multi-scale fusion architecture.
Li et al. [23] proposed a model compression maize disease detection method combining pruning and knowledge distillation. They removed redundant channels via structured pruning and then restored model accuracy through knowledge distillation, achieving a favorable balance between model size and detection accuracy and validating the effectiveness of hybrid model compression strategies in agricultural scenarios. Yang et al. [24] optimized the YOLOv8n model via channel pruning. In the tomato pest and disease detection task, they achieved a 62% reduction in model parameters and a 47% improvement in inference speed and successfully deployed the optimized model on embedded edge devices, providing solid experimental evidence for the pruning optimization of the compression model in this study. Pan et al. [25] designed the PLP-net model compression for impurity detection during potato harvesting. By combining depthwise separable convolution and channel pruning techniques, they obtained a model with a size of only 2.3 MB. Zhao et al. [26] further investigated deployment optimization methods for model compression algorithms on edge chips, including engineering techniques such as operator fusion and quantization acceleration, completing the full technical chain from model compression to hardware deployment. Sapkota et al. [27] systematically summarized the evolution of YOLO models from YOLOv1 to YOLOv12, with a focus on analyzing edge-deployment-oriented model design trends. They pointed out that model pruning is currently the core technology for the practical deployment of agricultural YOLO models, thereby further highlighting the research value of our adoption of the LAMP algorithm for model compression.
Based on the above studies, visual detection—as the core technology for assessing the appearance quality of agricultural products—has gradually evolved from methods relying on manually defined features to those centered on deep learning. The single-stage detection models of the YOLO series have achieved a good balance between detection speed and accuracy, making them a current research hotspot for real-time detection tasks. However, existing methods often focus on single-dimensional optimization—either improving detection accuracy or reducing model size—and pay insufficient attention to the synergy between the stable representation of small-scale defects and model compression deployment. Furthermore, some models introduce high computational overhead while improving detection accuracy, making them difficult to deploy in resource-constrained agricultural production scenarios. Based on this, this paper designs a high-performance detection model that balances accuracy and model compression deployment, using YOLOv8s as a foundation. The research will focus on the following aspects: First, streamlining the number of layers in the backbone network by introducing the ShuffleNetV2 model compression architecture and a triple attention mechanism to prevent deep convolutions from overwhelming small-scale defect features, thereby enhancing feature representation capabilities. Second, reconstructing the neck architecture using a multi-scale, multi-depth feature fusion network to improve the integration of defect features. Third, compressing the model using the LAMP algorithm to remove redundant parameters and achieve model compression.
2. Experimental Materials
2.1. Dataset Acquisition
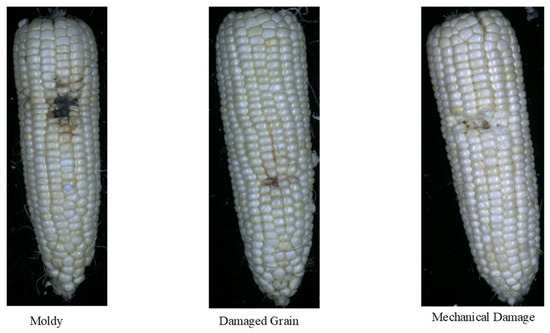
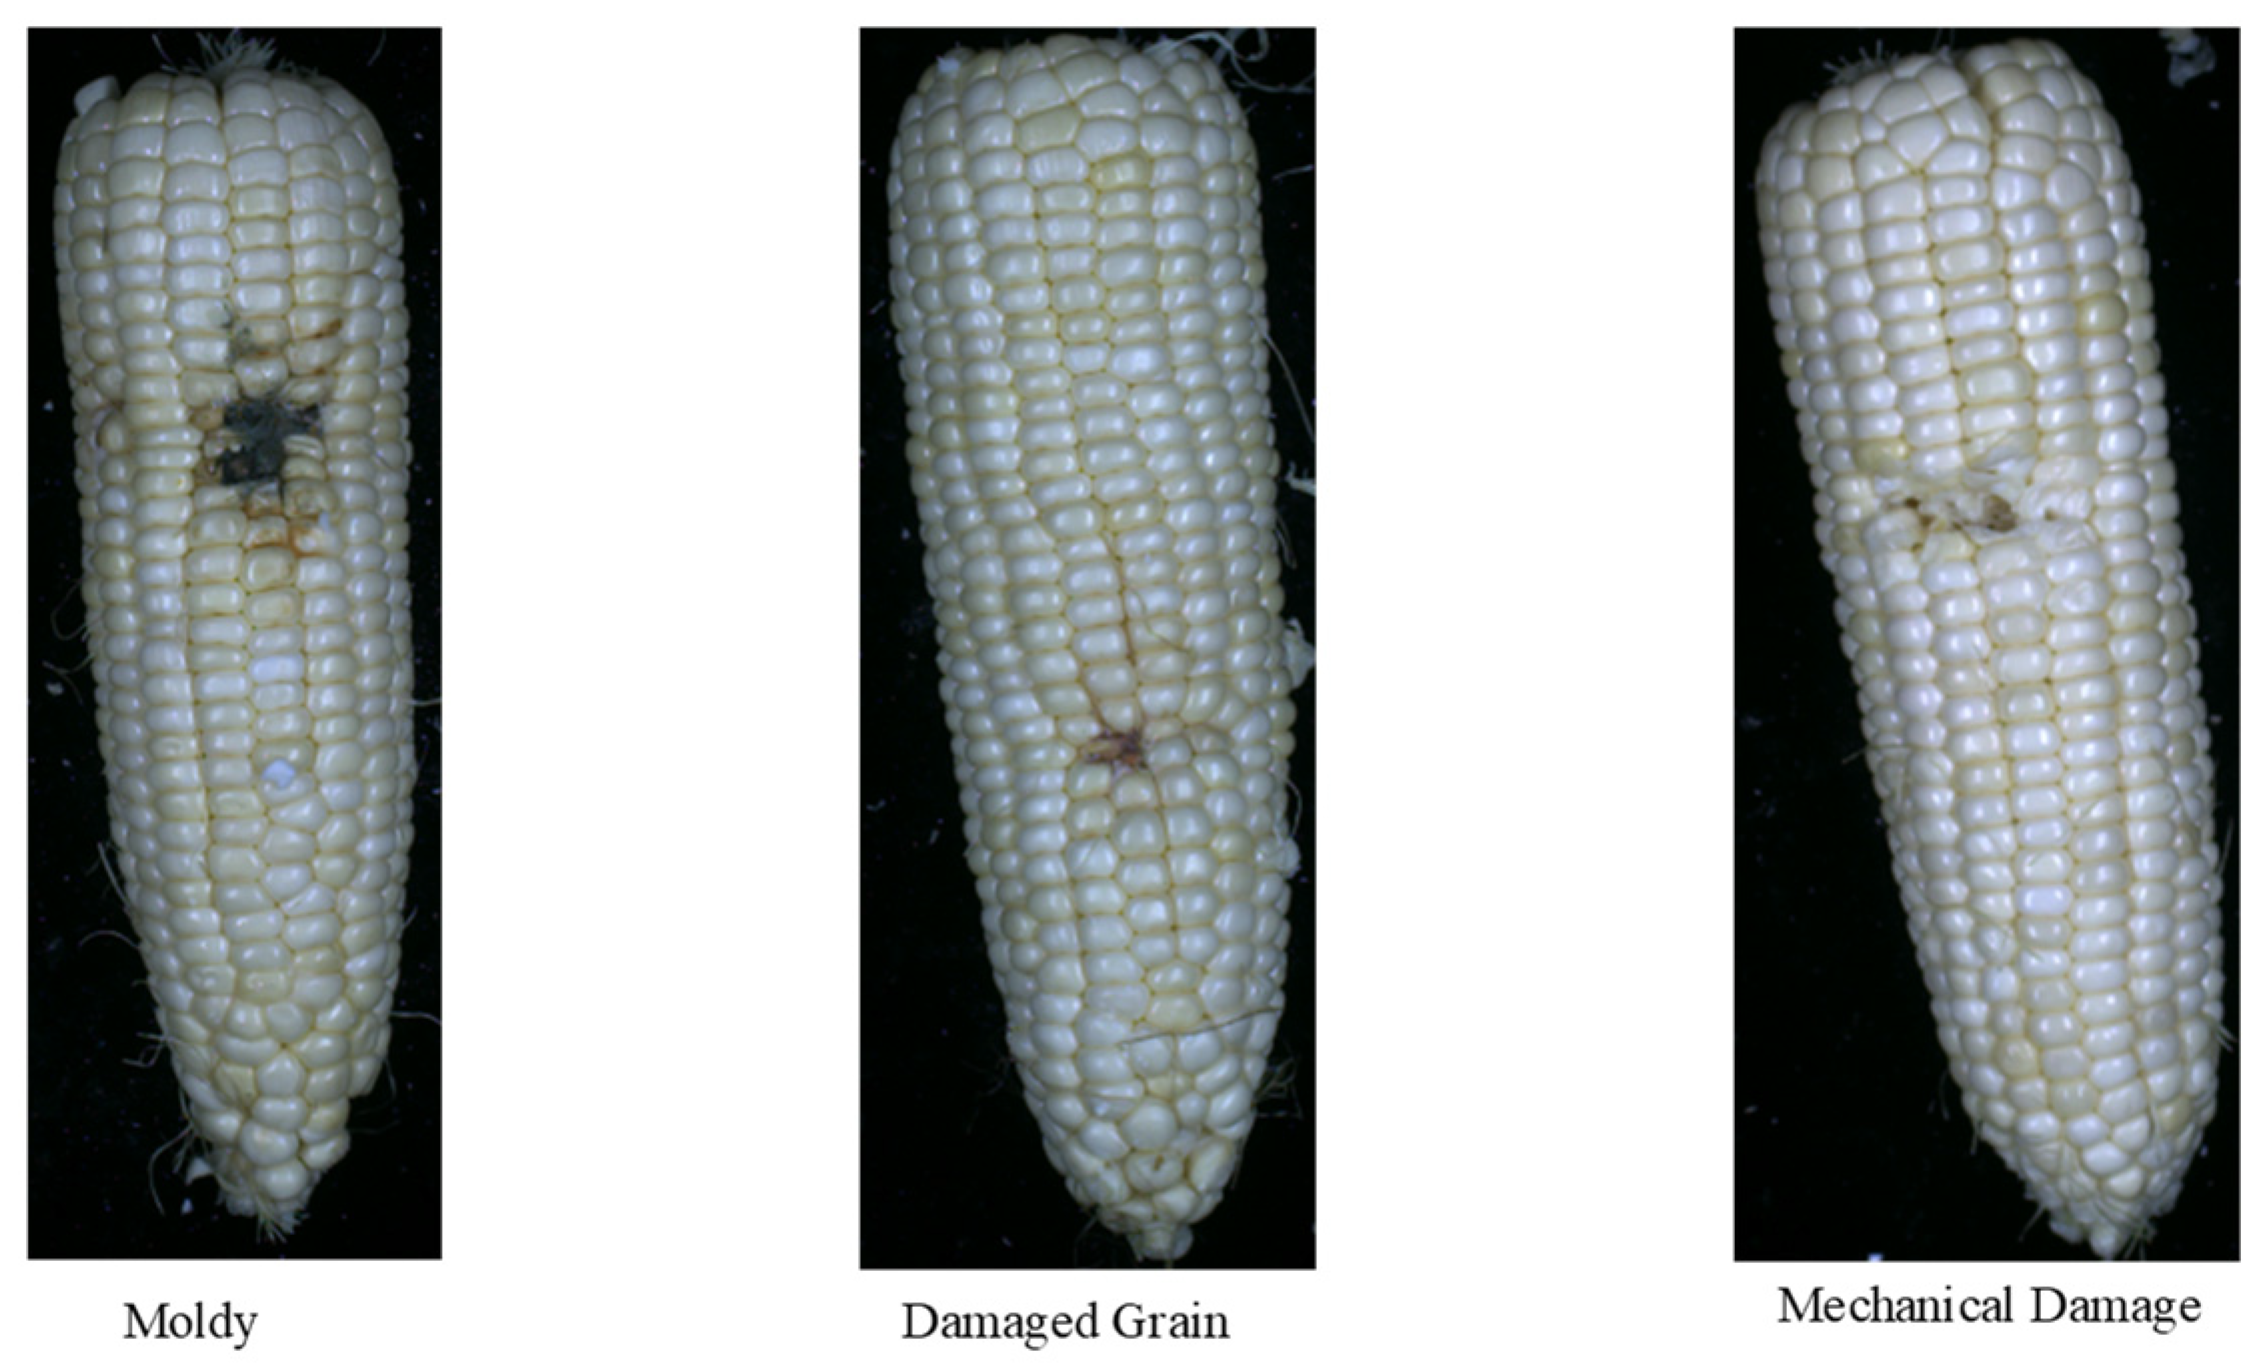
These experiments used fresh corn cobs of the white corn variety “Nongke Nuo 336”. In this study, defective cobs were collected according to a self-established defect classification standard. A total of 350 images were selected for each of the three defect categories: mold, kernel damage (with lesions), and mechanical damage. An example of each type of defect is shown in Figure 1. The three defect categories exhibit significant differences in shape and color: moldy cobs have a central area of mold, appearing largely black with blurred kernel outlines; cobs with damaged kernels have individual kernels with yellowed surfaces and are underdeveloped; and Cobs with mechanical damage exhibit milky-white damaged areas with a pitted appearance.
Figure 1.
Defective Samples.
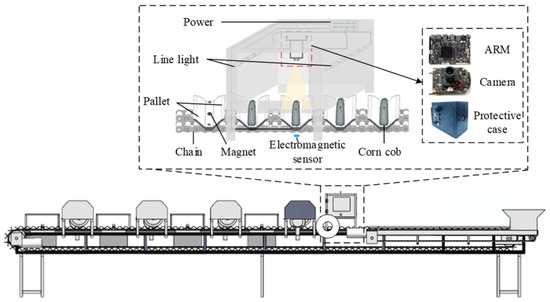
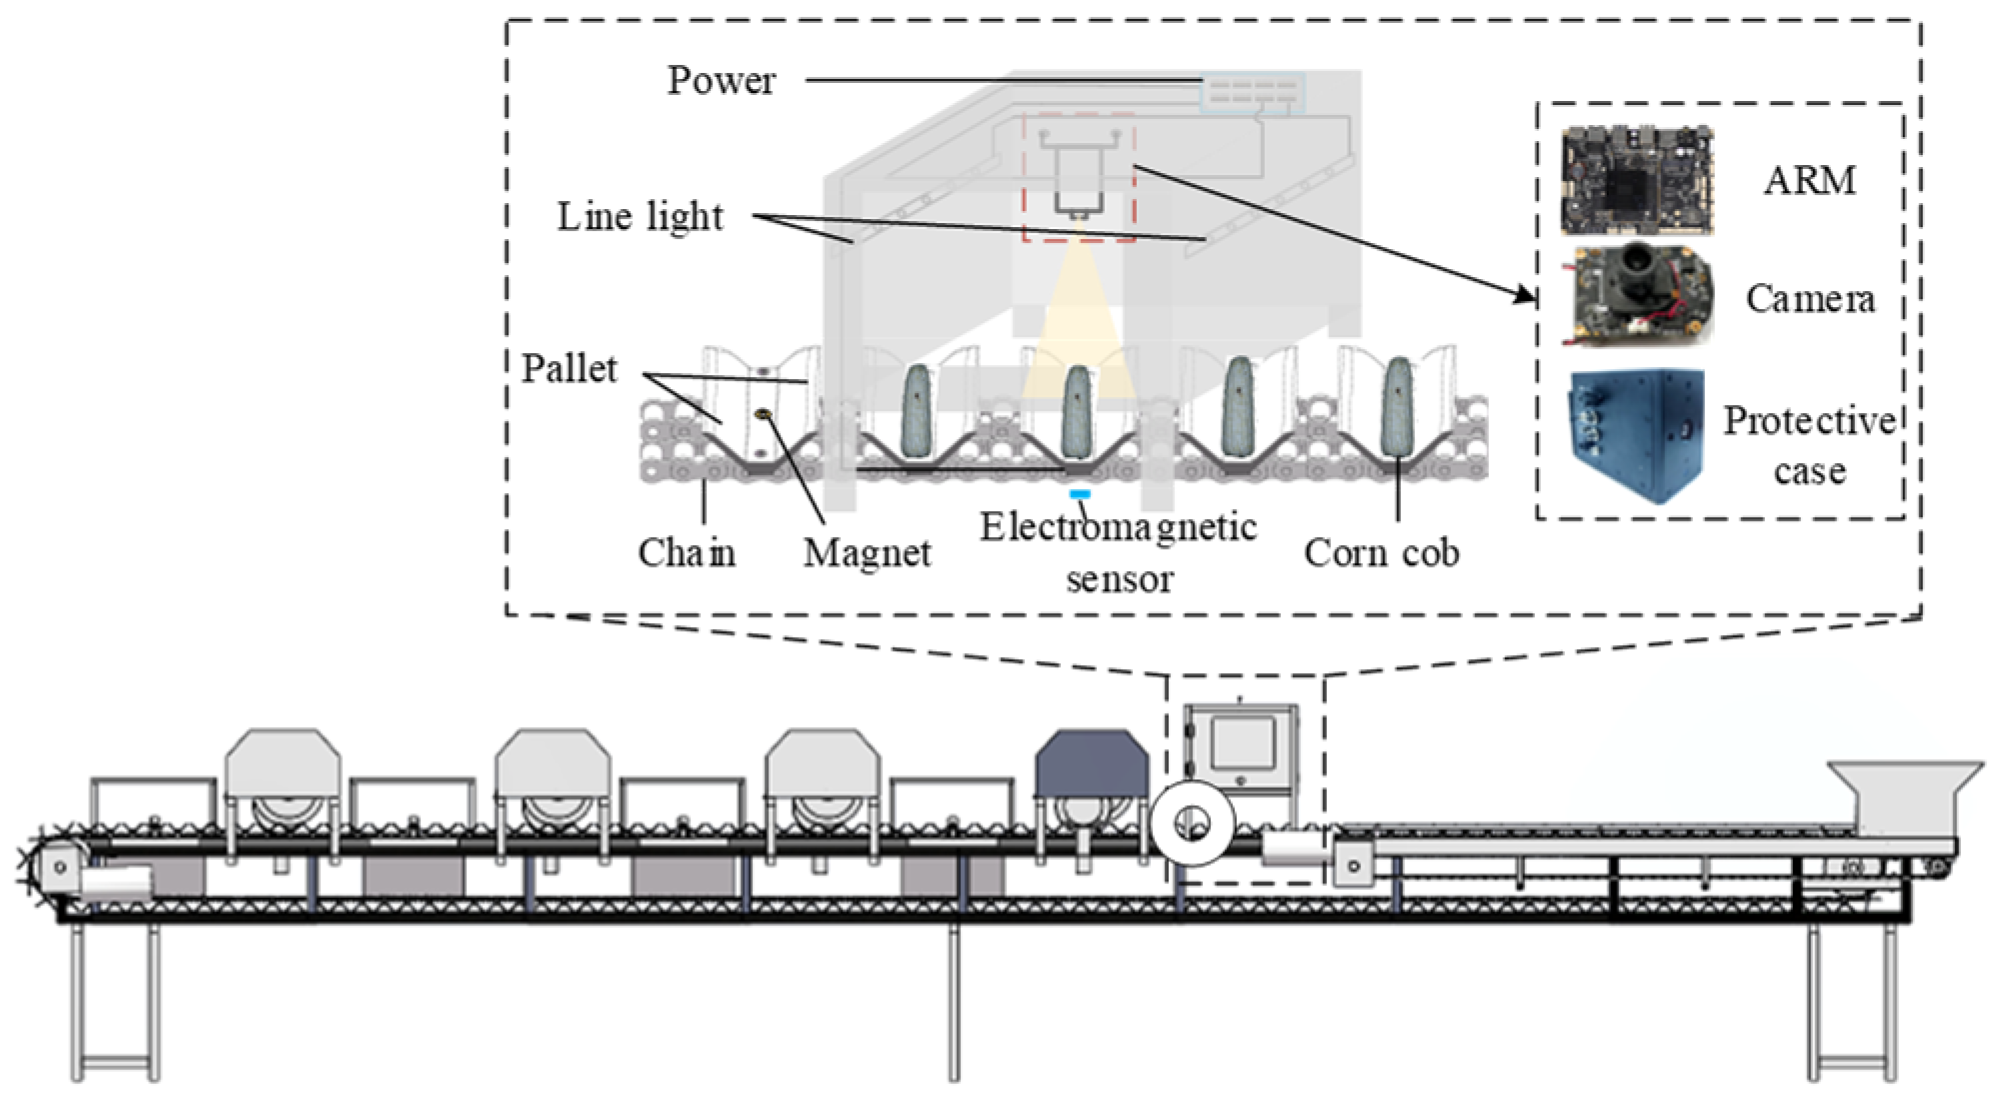
Figure 2 illustrates the overall structure of the image acquisition system, with the lower section showing a schematic diagram of the fresh corn cobs visual sorter and the upper section displaying a simplified diagram of the visual inspection box. The image acquisition process is performed within the visual inspection box. After entering the sorter through the feed inlet, the fresh corn cobs are supported by conveyor belt trays and transported via a conveyor chain directly beneath the industrial camera (Images were acquired in lateral view, where the optical axis of the camera was aligned perpendicular to the longitudinal axis of the corn cob). When the tray reaches a designated position, the camera unit receives a signal triggered by an electromagnetic sensor to capture a single image. The visual inspection box primarily consists of a camera unit, a lighting unit, and a power supply unit. The camera unit includes an industrial camera, RAM embedded with image preprocessing algorithms, an industrial lens, and a protective housing. The industrial camera model is MV-CS016-10UC (Hikvision, Hangzhou, China), with a resolution of 1.6 megapixels; the industrial lens model is MVL-HF0624M-10MP (Hikvision, Hangzhou, China), with a focal length of 6 mm and a resolution of up to 10 megapixels. To reduce interference with the electromagnetic sensor signal caused by complex production environments, a magnet is embedded in the central hole at the bottom of the tray holding the fresh corn cobs. This enhances trigger stability and prevents positional shifts during image capture. In this experiment, the capture distance was set to 50 cm, and optimal imaging results were achieved by adjusting the industrial lens’s focal length and exposure time.
Figure 2.
Image Acquisition Setup (Lateral view, with the camera optical axis perpendicular to the cob longitudinal axis).
2.2. Dataset
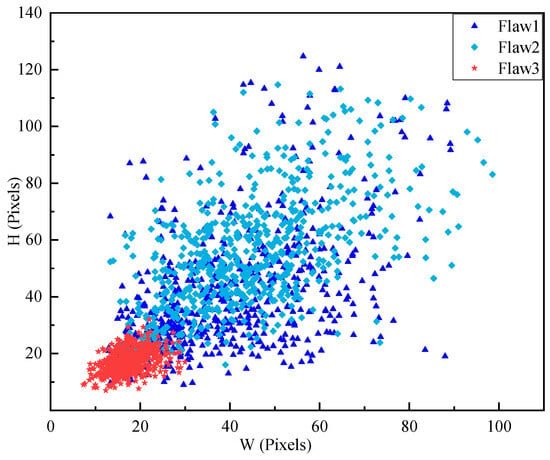
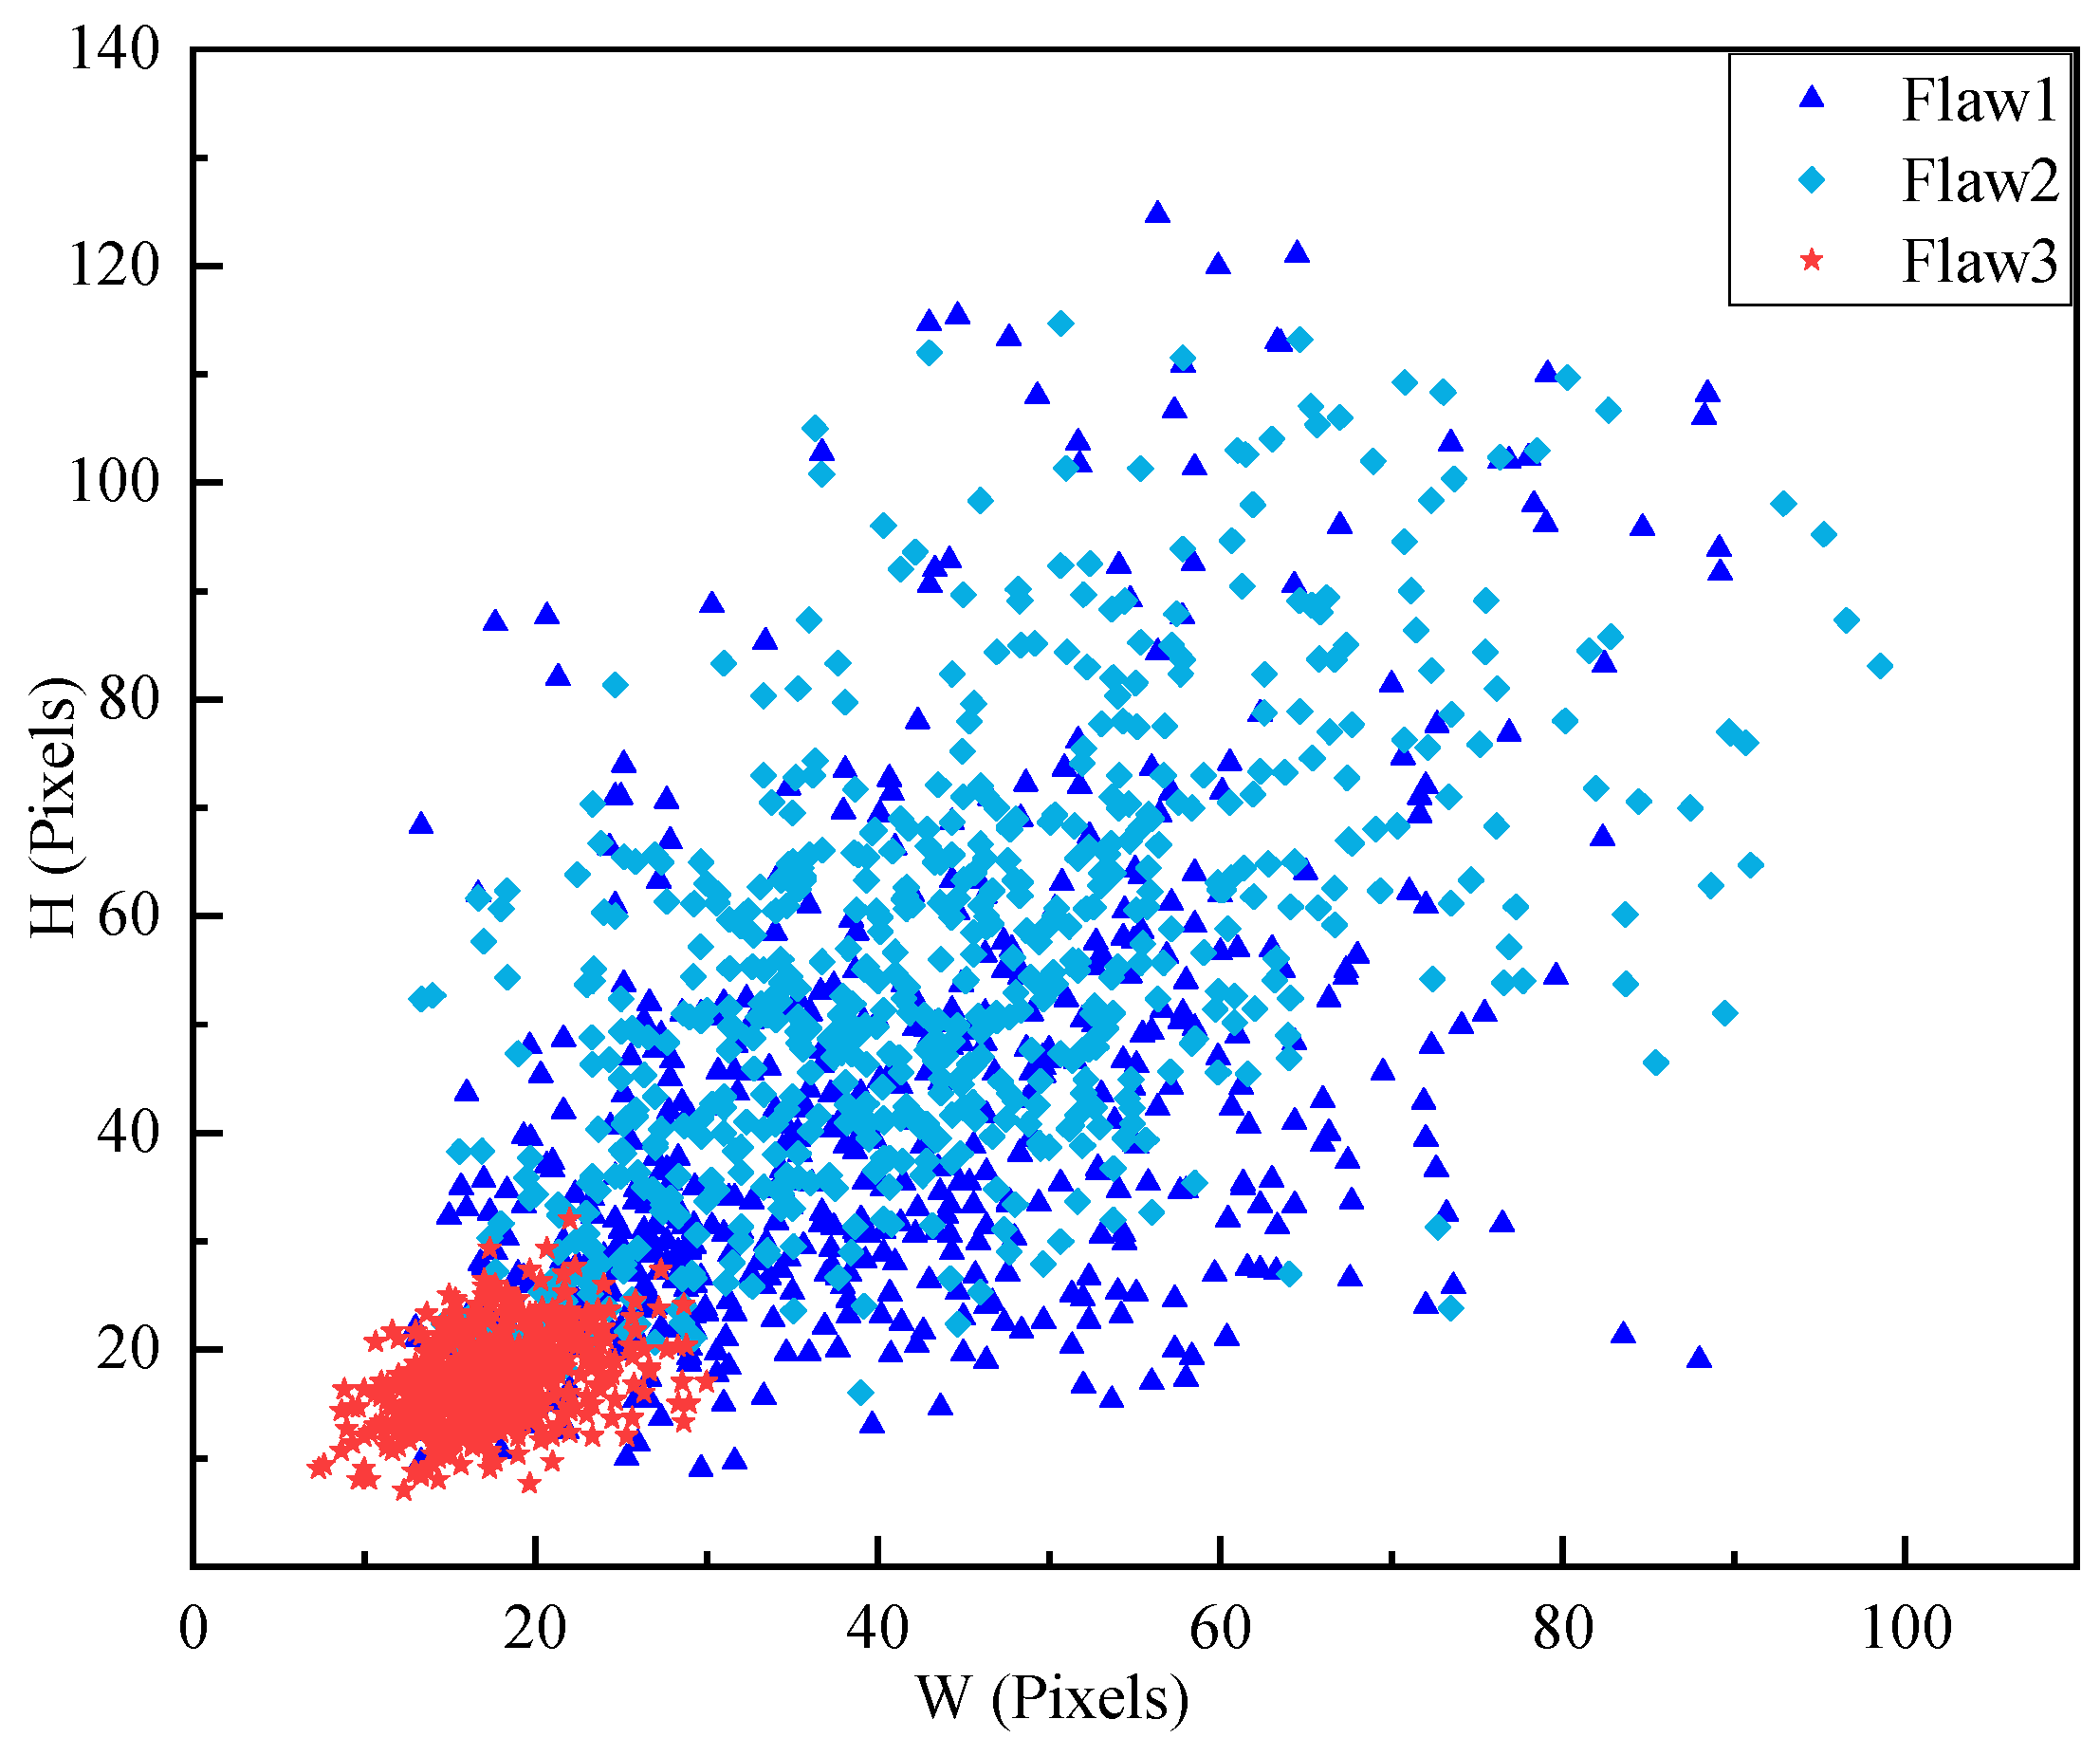
All captured images had a resolution of 1920 × 1200 pixels. We selected 350 images per category, resulting in a total of 1050 images. This dataset was split into an augmentation set and a test set at a 7:3 ratio, and the augmentation set was expanded to 4000 images using rotation, translation, brightness adjustment, and noise injection [28]. Subsequently, the augmented data were split into a training set and a validation set in an 8:2 ratio. The model input pixel size is 640 × 640, scaled based on the longer side, which is equivalent to downscaling the original dimensions by a factor of 3. In the original images, the minimum pixel size of a defect on a single side was 22, and the maximum was 374. After scaling to the model’s required input size, the minimum pixel size on a single side became 7.3, and the maximum became 124.7. In object detection tasks, targets are typically classified into three categories based on size: small, medium, and large [29]. Small targets have dimensions less than 32 × 32 pixels, large targets have dimensions greater than 96 × 96 pixels, and targets with dimensions between these two ranges are classified as medium targets. The distribution of the three defect size categories in the dataset used in this paper is visualized in Figure 3. Among the annotated objects, 100% of the defective kernels (Flaw3) have dimensions smaller than 30 pixels; approximately 30.6% of the mechanical damage (Flaw1) and mold (Flaw2) also fall within this range, and all these can be classified as small objects. Additionally, targets larger than 96 pixels account for approximately 8.5% and are classified as large targets; the remaining 60.9% of mechanical damage (Flaw1) and mold (Flaw2) fall within the 32–96 pixels range and can be classified as medium targets.
Figure 3.
Size distribution of three types of defects.
3. Model Improvements
3.1. Baseline Model
The YOLOv8 model is a version of the YOLO (You Only Look Once) [30] series and belongs to the category of single-stage real-time multi-object detection models. It offers advantages such as fast processing speed and low memory consumption. The network consists of three parts: the backbone network, the neck network, and the head network. The backbone network is used for feature extraction and primarily comprises convolutional modules, C2f modules, and SPPF modules. The neck network combines FPN and PAN to achieve multi-scale feature fusion. The head network serves as the model’s decision-making component, used to predict the final detection results.
3.2. Improved YOLOv8s Model
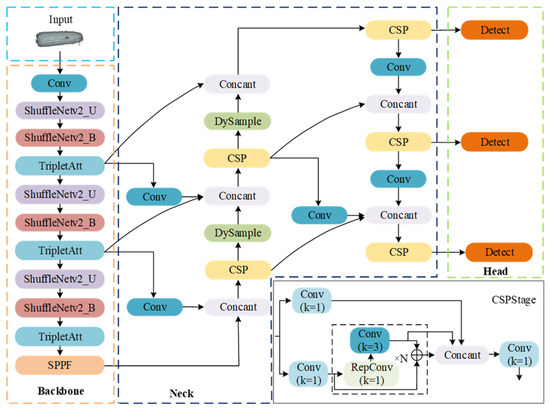
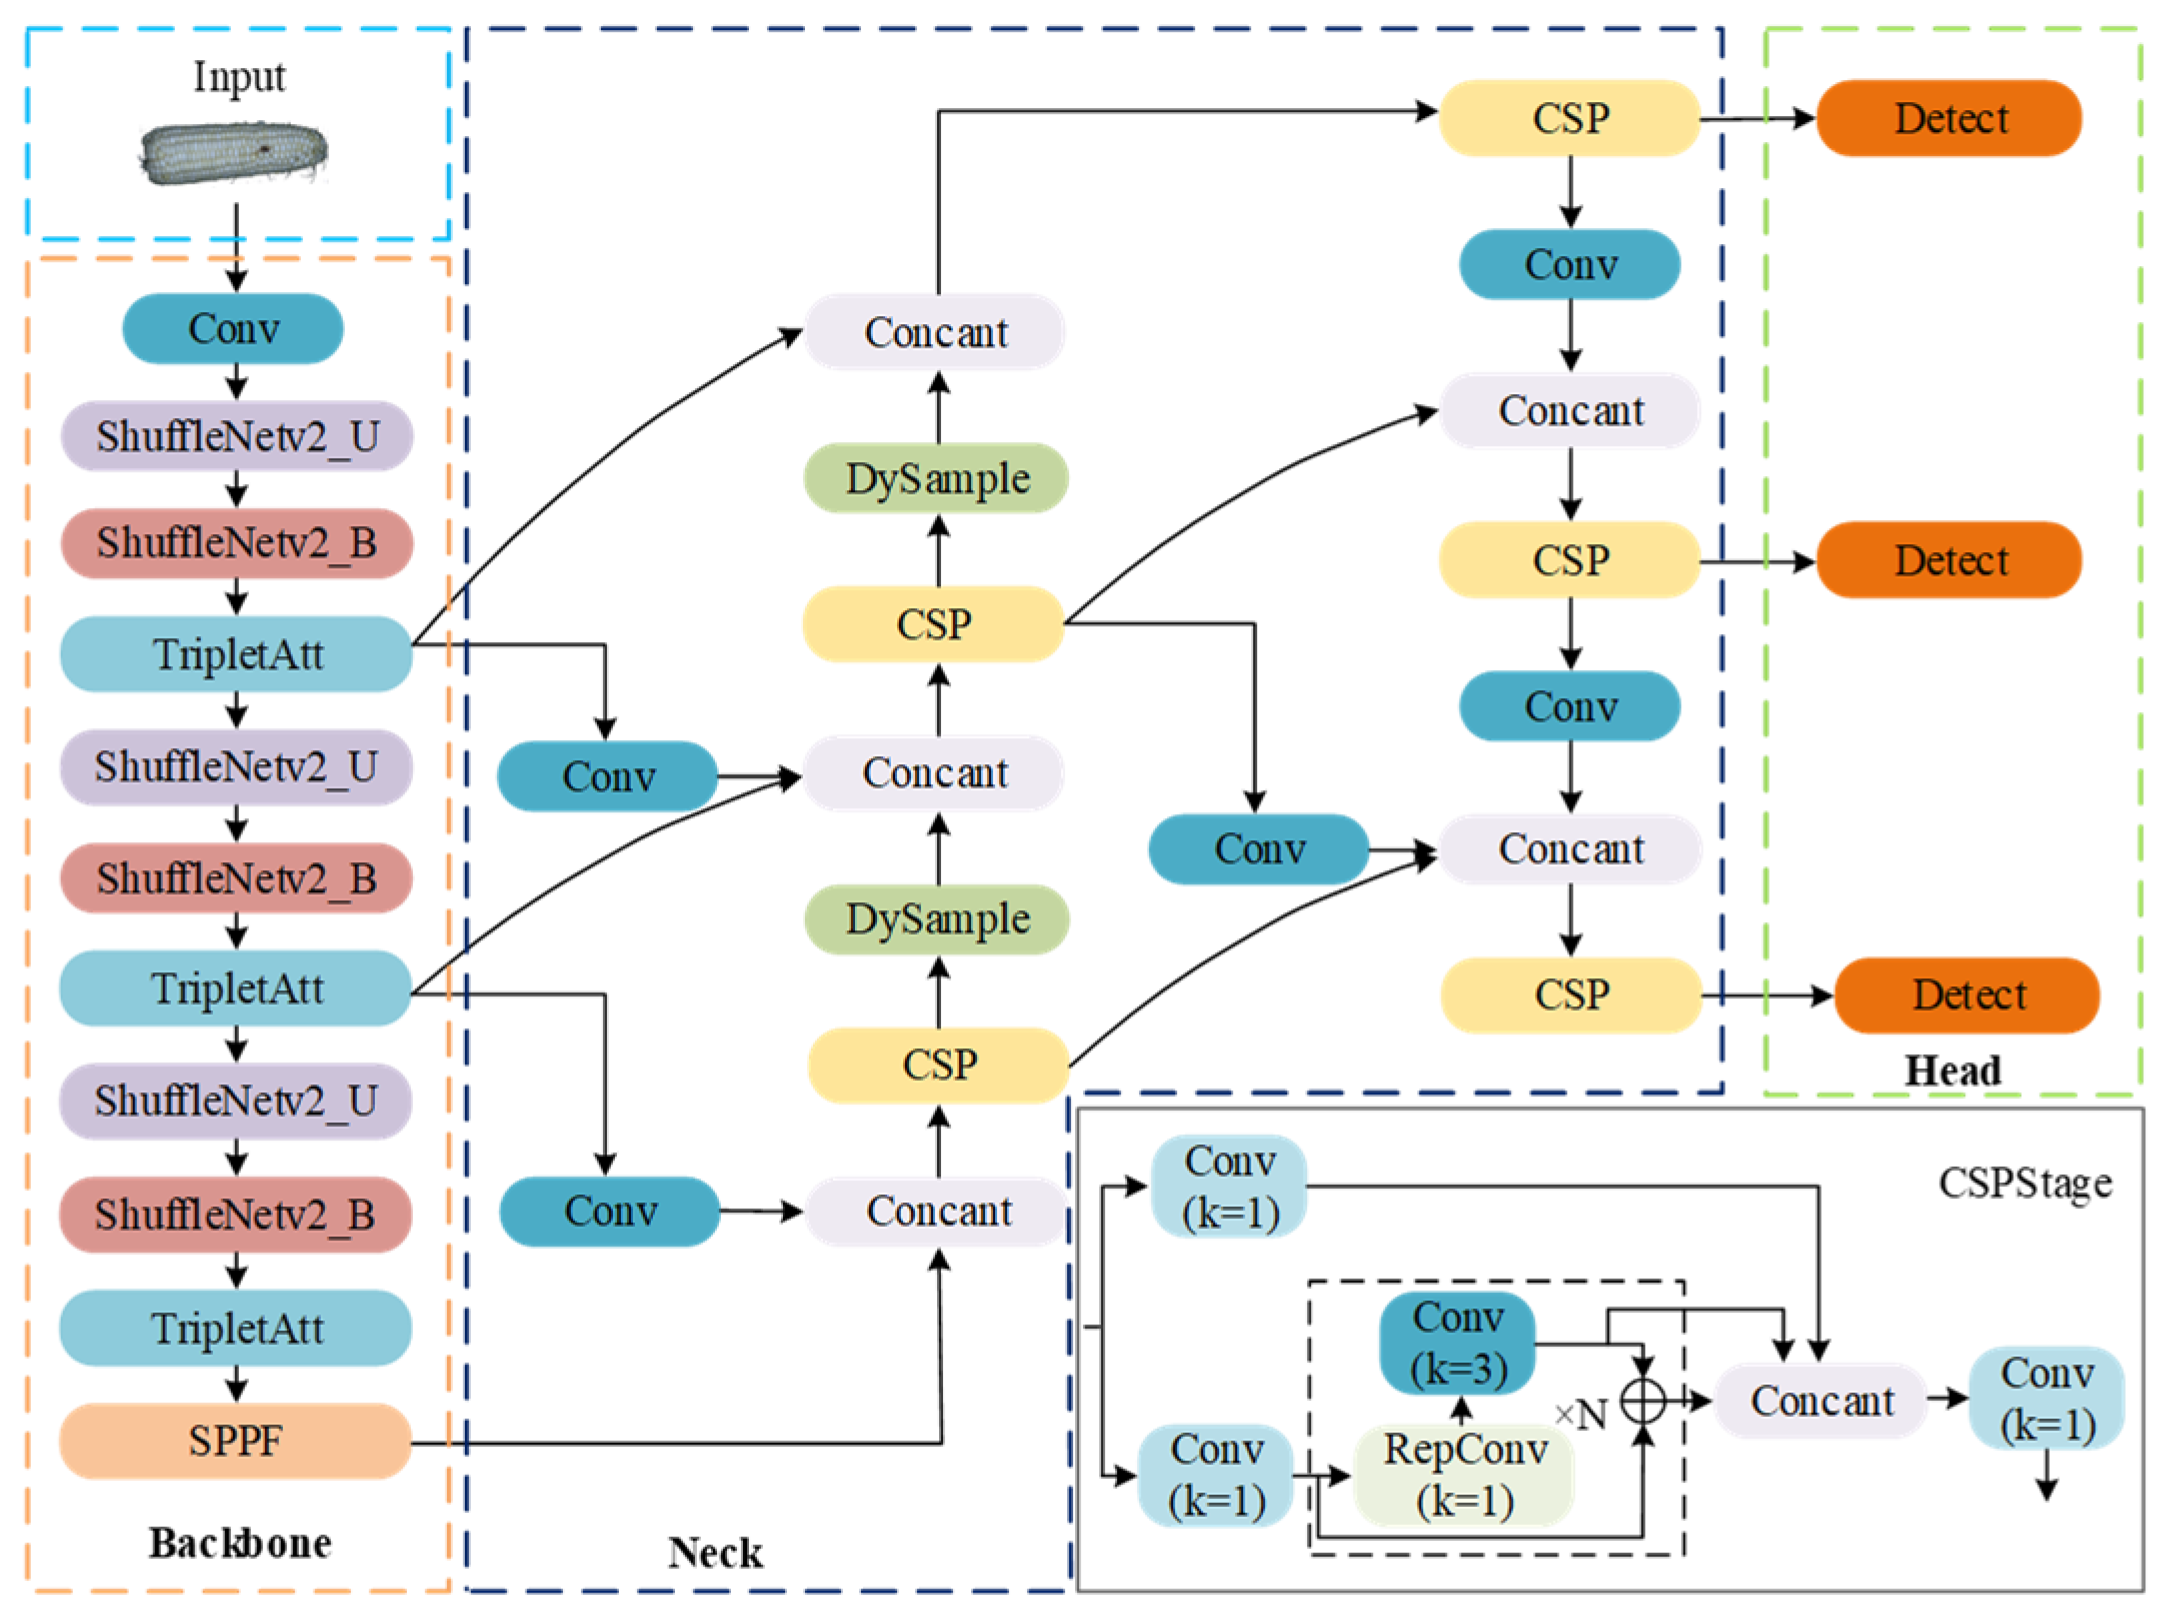
The original model takes input images of size 640 × 640, while the detection heads output images of sizes 80 × 80, 40 × 40, and 20 × 20, which are 8, 16, and 32 times smaller than the input size, respectively. As the number of downsampling steps increases, both feature detail and semantic information in the resulting feature maps degrade. For targets larger than 96 × 96 pixels, multiple downsampling operations preserve sufficient semantic information and do not compromise detection performance. However, for small-scale defects, multiple downsampling steps significantly compress the feature maps, which can weaken or even lose features of small targets, thereby reducing detection accuracy. To address this issue, the model architecture was redesigned. First, we reduced the number of downsampling layers in the backbone network by removing one layer to prevent excessive compression of small-scale defect details. This ensures that the detection head outputs images of sizes 160 × 160, 80 × 80, and 40 × 40, preserving detailed feature information in larger pixels so it is not overwhelmed by deep convolutions. Second, we adopted the feature-reusing, model compression architecture ShuffleNetV2 [31] as the core component of the backbone network to balance detection accuracy with computational efficiency. Subsequently, we incorporated the Triplet Attention [32] module after the three ShuffleNetV2 backbones, enabling modeling across three dimensions to enhance multidimensional feature interaction and strengthen feature representation capabilities. Finally, the design philosophy of RepGFPN [33] and the dynamic upsampling module DySample [34] are introduced into the neck feature fusion network to fuse grape cluster defect features at different scales and depths. This approach treats high-level semantic information and low-level spatial information with equal priority, outputting high-quality feature maps. This processing method effectively balances the model’s representation of defect features of different sizes. Based on the above improvements, the constructed SSAD-YOLOv8s (where SS denotes the basic and downsampling units of ShuffleNetV2, A denotes the Triplet Attention mechanism, and D denotes the RepDyFPN neck structure) model is shown in Figure 4.
Figure 4.
SSAD-YOLOv8s Architecture. The symbol ⊕ denotes element-wise addition of corresponding feature map elements.
3.2.1. SSA Backbone Structure
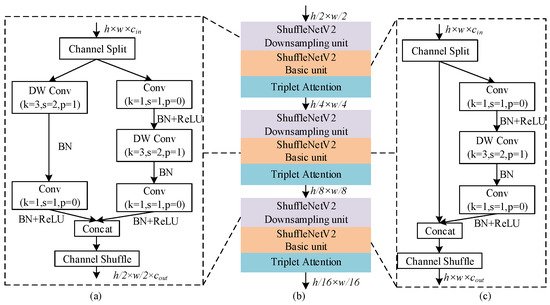
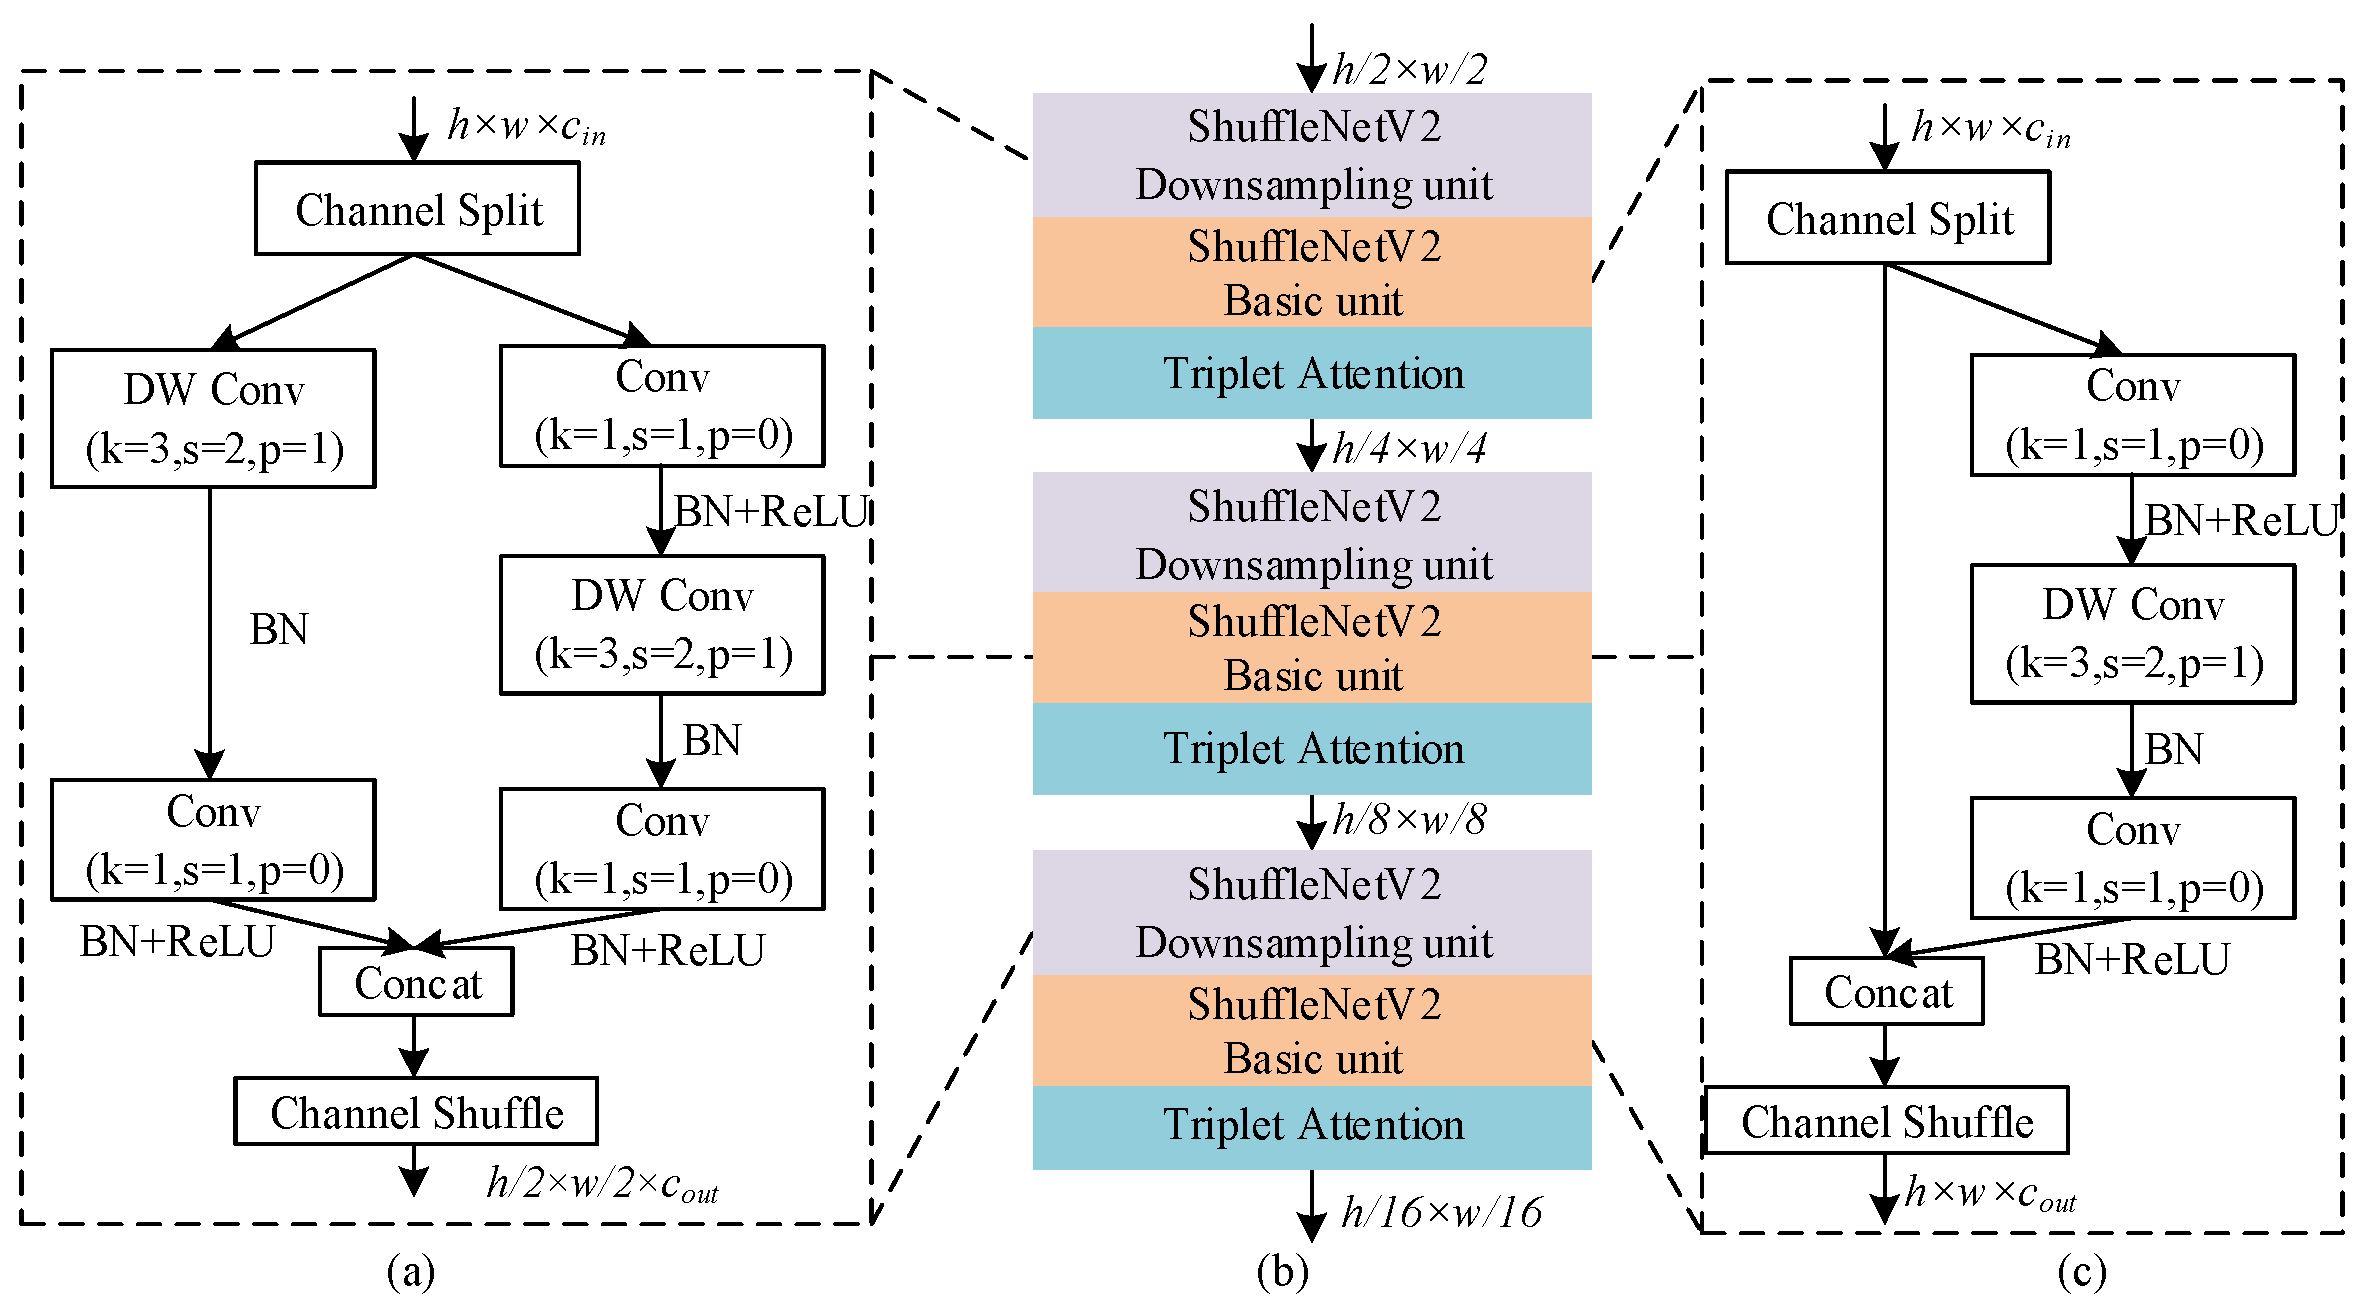
The proposed backbone feature extraction network (Figure 5b) consists of a cascade of three ShuffleNetV2 stages, each comprising a downsampling unit, two basic units, and a Triplet Attention module. This architecture integrates model-compression convolutional units and cross-dimensional attention mechanisms. By regulating the channel depth of feature tensors, this architecture enhances the model’s sensitivity to small-scale defect regions, mitigates fine-grained detail loss during downsampling, and achieves an optimal balance between feature representation capacity and computational efficiency.
Figure 5.
SSA Architecture. (a) ShuffleNetV2 downsampling unit; (b) Overall SSA architecture; (c) ShuffleNetV2 basic unit.
The original YOLOv8s backbone uses four C2f layers and four downsampling convolutions, generating feature maps with resolutions of 80 × 80, 40 × 40, and 20 × 20 that are fed into the neck fusion network. Ultimately, the feature maps output at the model’s detection head have resolutions that are 8, 16, and 32 times lower than those of the original model, respectively. This degree of geometric downsampling leads to the loss of feature information for small-scale defect targets. Furthermore, as network depth increases, deep convolutional operations tend to suppress small-target features, leading to degraded model accuracy. To mitigate these issues, this paper removes the fourth feature extraction layer and its corresponding downsampling layer from the original model. This approach effectively improves the spatial resolution of the feature maps output by the detection head and enhances the model’s ability to detect small-scale defect targets. Furthermore, this approach avoids the excessive compression of small-scale features caused by multiple downsampling steps and deep convolutions, thereby helping to preserve the integrity of fine-grained feature information.
Although the original C2f architecture exhibits strong feature extraction capacity, its stacked bottleneck layers introduce significant parameter redundancy, which impedes model compression. In contrast, ShuffleNetV2—based on channel shuffling, depthwise separable convolutions, and pointwise convolutions—achieves superior feature representation while significantly reducing computational complexity and parameter count. Therefore, this paper adopts the basic units and downsampling units of ShuffleNetV2 as the primary building blocks for the backbone network of the improved model. The ShuffleNetV2 basic unit is shown in Figure 5a. First, the input features undergo channel splitting, dividing the input feature information into two branches: one undergoes an identity mapping, while the other undergoes deep convolution. Next, the feature information from both branches is concatenated, and finally, channel shuffling is performed to ensure thorough integration and interaction of the feature information. The ShuffleNetV2 downsampling unit, as shown in Figure 5c, employs a dual-branch design to perform downsampling on the input features. In this design, the left branch uses 1 × 1 pointwise convolutions to preserve spatial structural information and minimize feature loss, while the right branch uses two rounds of pointwise convolutions to extract higher-level semantic information. After concatenating the features from both branches, a channel shuffle is performed, effectively mitigating the information isolation issue caused by grouped convolutions. After passing through the downsampling unit, the size of the feature maps is halved while the number of channels is doubled. This approach balances computational efficiency with the preservation of feature expressiveness. The channel shuffling mechanism enhances feature flow between branches, which is more conducive to the retention and representation of small-scale object features. In summary, incorporating the basic units and downsampling units of ShuffleNetV2 into the backbone network enables efficient feature extraction, providing a foundation for building model compression small-scale defect detection models.
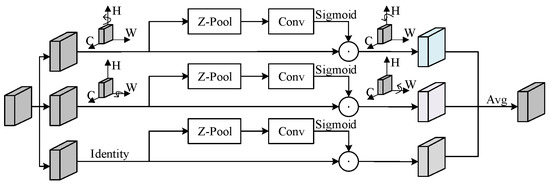
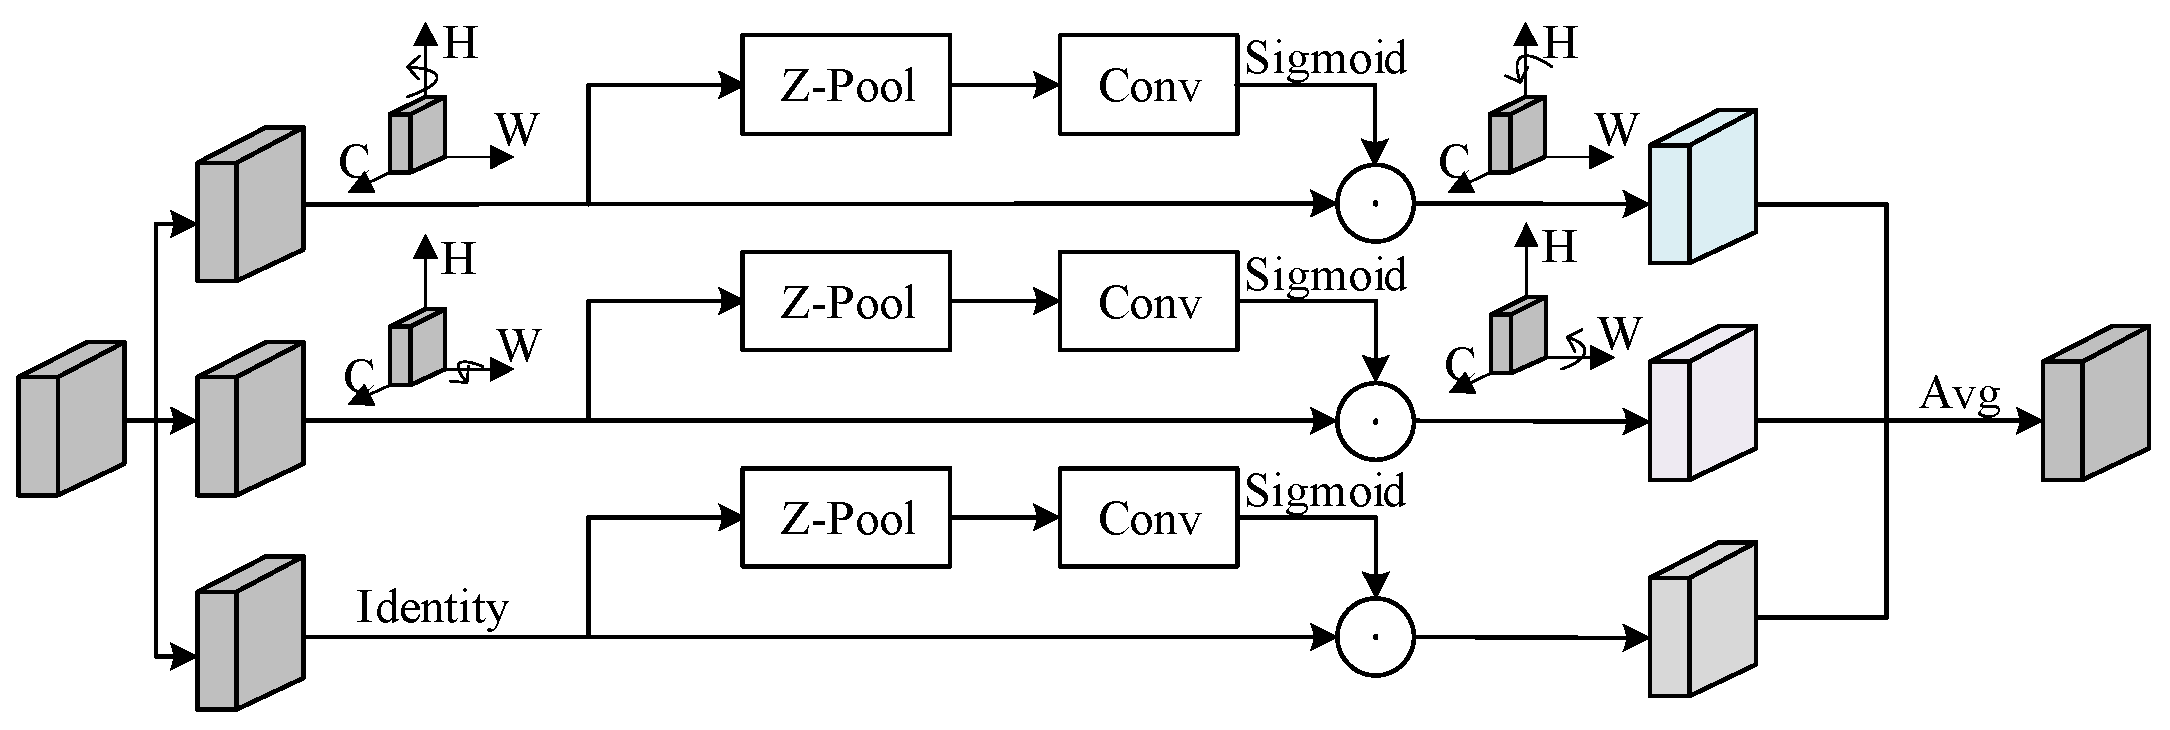
To enhance the ShuffleNetV2 backbone network’s ability to interact with multi-dimensional information and improve the discriminative power of feature representations, a triple attention mechanism (Triplet Attention) is incorporated after the outputs of each layer in the backbone, as shown in Figure 6. This module constructs three parallel branches to perform cross-dimensional modeling across channel and spatial dimensions, capturing comprehensive structural dependencies. The attention responses from all branches are then fused via averaging to generate a unified enhanced feature representation. In the channel-height interaction branch, the input features are rotated 90° along the height dimension, mapping height-dimensional information to the channel dimension for weight calculation, thereby effectively modeling the interaction between channels and height. The second branch adopts a similar strategy, rotating the input features 90° counterclockwise along the width dimension to establish cross-dimensional coupling attention between width and height. The third branch focuses on modeling spatial dependencies, directly generating spatial attention on the original feature maps to complement the channel-related modeling capabilities of the first two branches. All three branches employ Z-pooling operations to reduce the dimensionality of the input 3D feature tensor, mapping it to a 2D representation. This operation combines max-pooling and average-pooling to significantly reduce feature dimensions while preserving key statistical features, thereby reducing the number of parameters and computational overhead in attention calculations to achieve the goal of model compression design. By integrating the above mechanisms, Triplet Attention adds almost no additional model complexity and effectively enhances the feature representation capabilities of the ShuffleNetV2 backbone network, facilitating the classification and detection of small-scale objects.
Figure 6.
Structure of the Triplet Attention Mechanism. Arrows: ↑H = height, →W = width, ←C = channel. Annotations clarify the Z-Pool operation axis and attention weighting flow. The symbol ⊙ denotes element-wise multiplication (Hadamard product) of corresponding feature map elements.
In our proposed SSA backbone architecture, the Triplet Attention module is inserted after the output of each of the three ShuffleNetV2 stages, corresponding to three distinct feature levels. The detailed network configuration and insertion positions of the module are summarized in Table 1.
Table 1.
Detailed network structure and placement positions of the Triplet Attention module.
This architectural design enables the Triplet Attention module to enhance multi-dimensional feature interaction across different scales, which is particularly advantageous for capturing the subtle features of small-scale defects on fresh corn cobs.
3.2.2. RepDyFPN Architecture
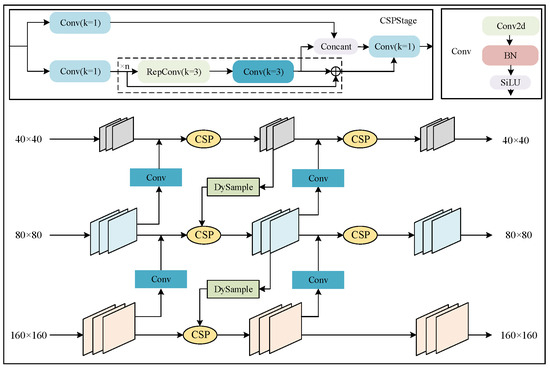
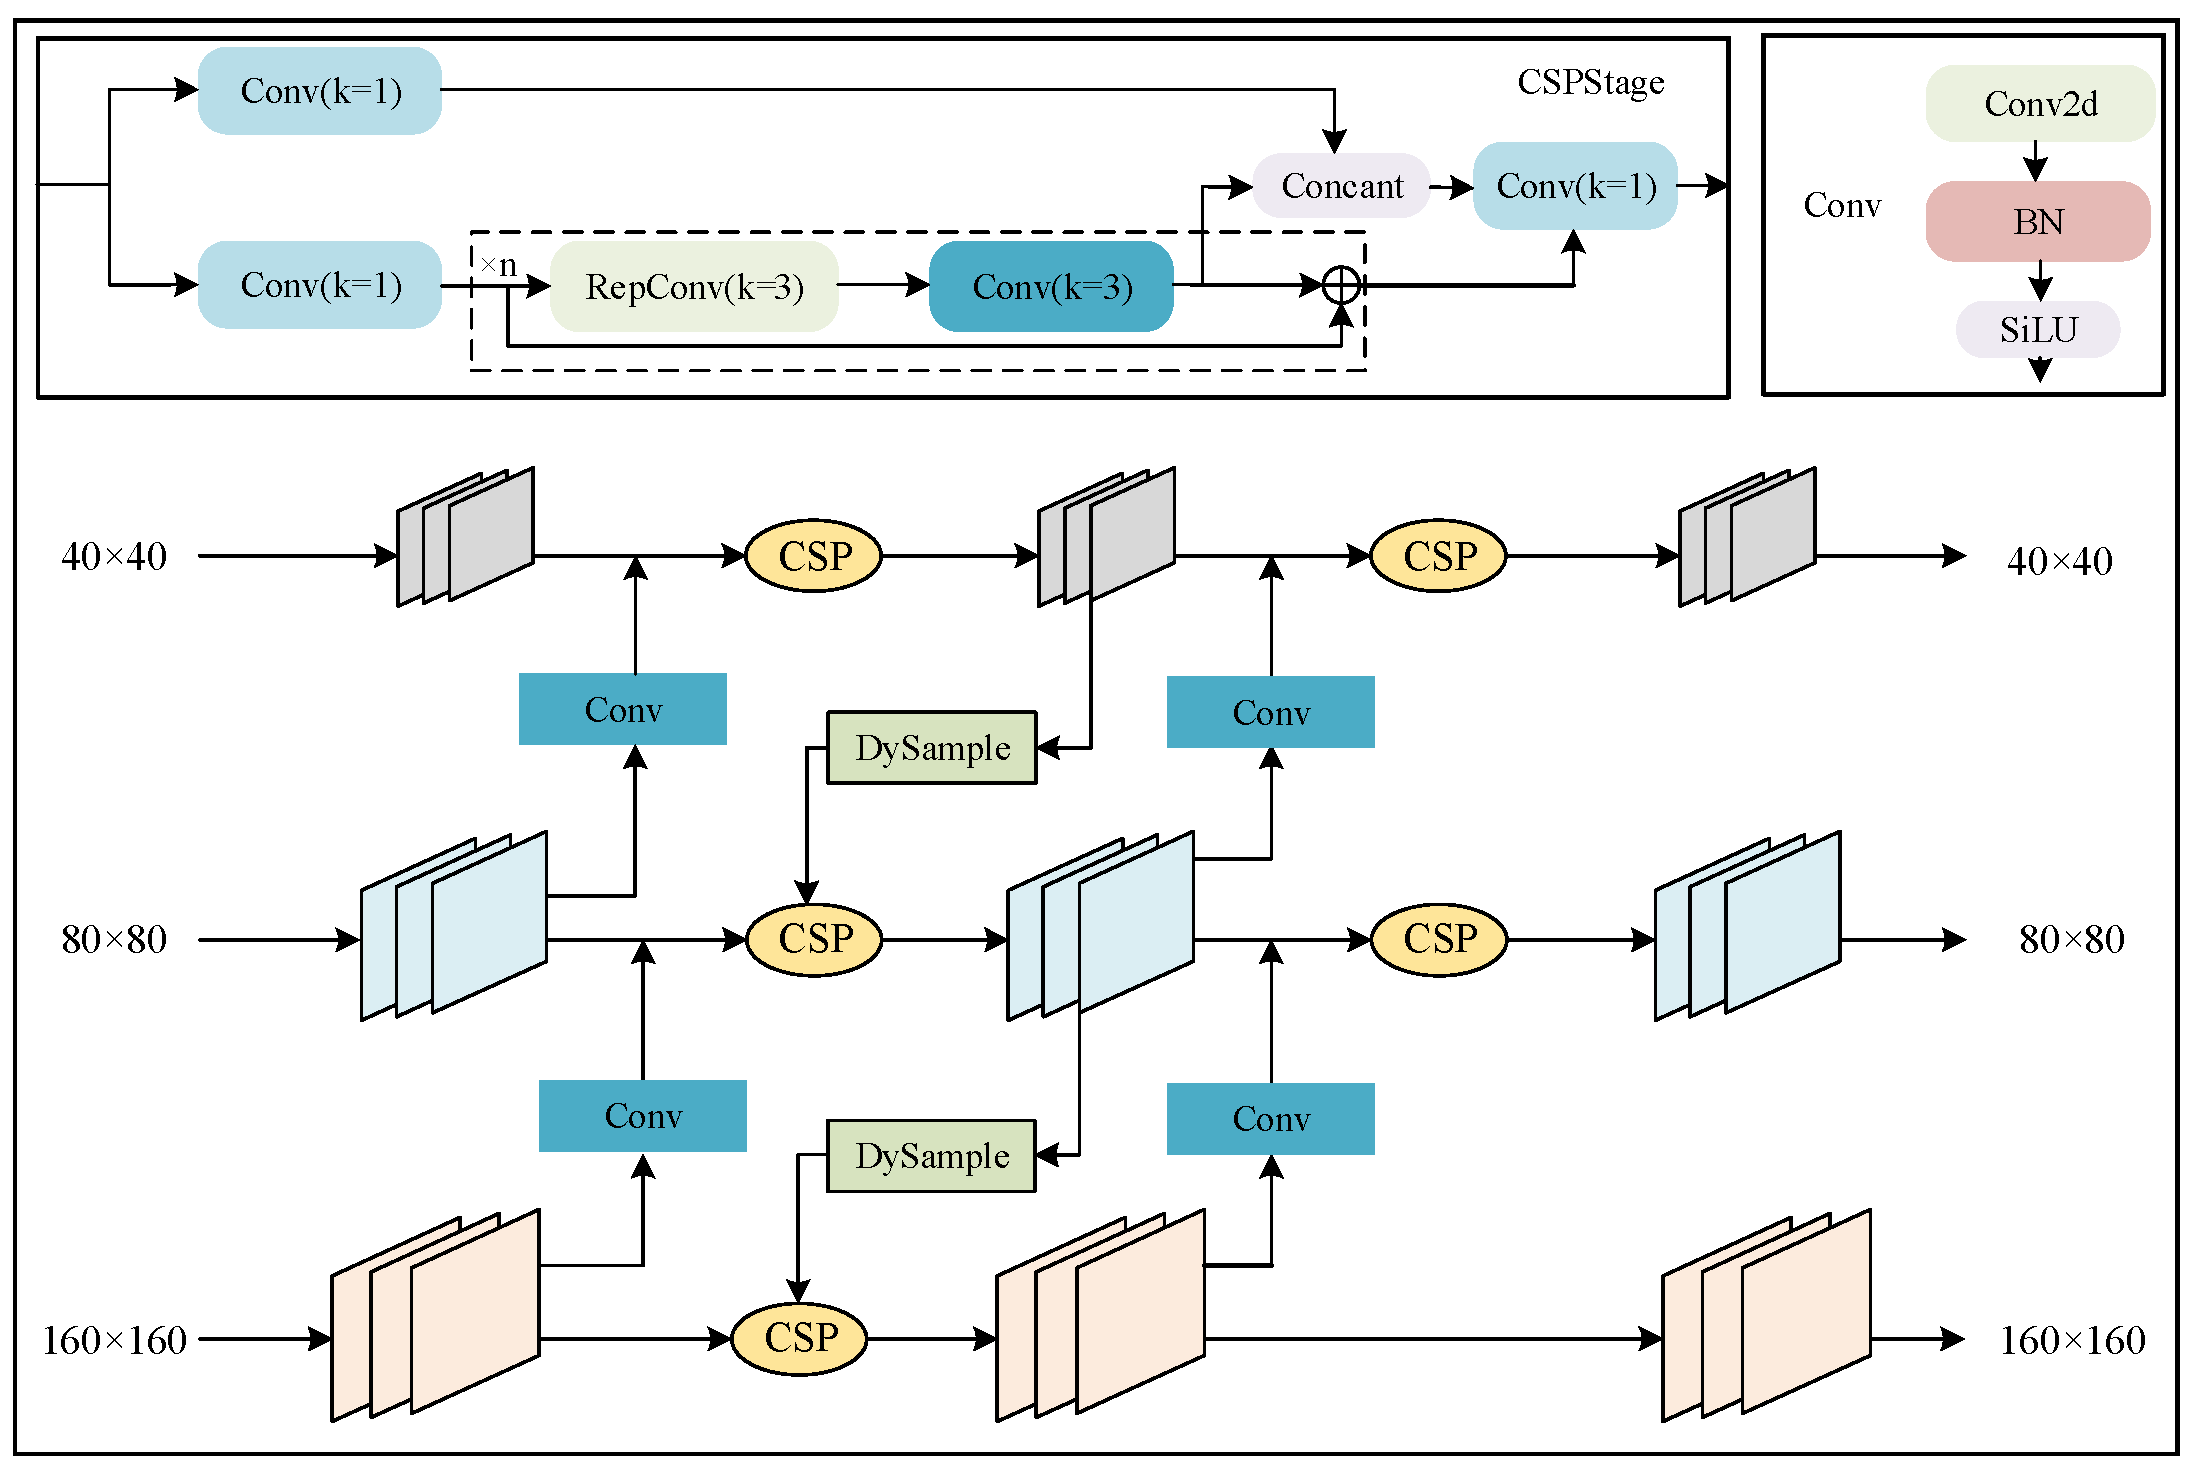
In the YOLOv8 series of models, the neck employs an FPN architecture that achieves hierarchical fusion of features at different scales through a top-down path. However, this fusion approach relies primarily on linear, depth-wise information integration, and fine-grained semantics in low-level features are easily diluted during propagation, leading to insufficient sensitivity to small-scale fresh corn cob defects. To address these issues, this study draws inspiration from the dual-path architecture of RepGFPN-combining top-down and lateral connections-to design a more efficient RepDyFPN neck structure. RepDyFPN employs a multi-branch, re-parameterizable convolutional architecture that enhances the interaction and fusion of cross-scale semantics, effectively improving the model’s ability to represent small-scale defect features and its detection sensitivity. The RepDyFPN architecture is shown in Figure 7.
Figure 7.
RepDyFPN Architecture. The symbol ⊕ denotes element-wise addition of corresponding feature map elements.
As shown in Figure 7, each feature fusion node in the improved neck receives both bottom-up multi-scale features from lower layers and lateral features from the same depth, forming dual feature streams that span both hierarchical levels and the same depth. This cross-scale and skip-connection strategy significantly enhances the fusion capability for small-scale defect features. It enables more thorough and efficient fusion of multi-scale semantic information within the same depth space. The fusion node CSPStage (CSP) enhances feature expressiveness through feature separation and aggregation operations while effectively preserving the original information. This operation also reduces computational overhead to some extent and improves the model’s training stability.
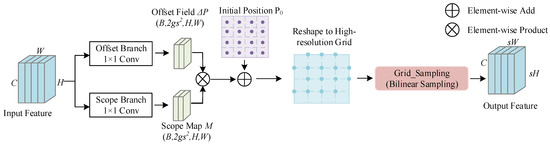
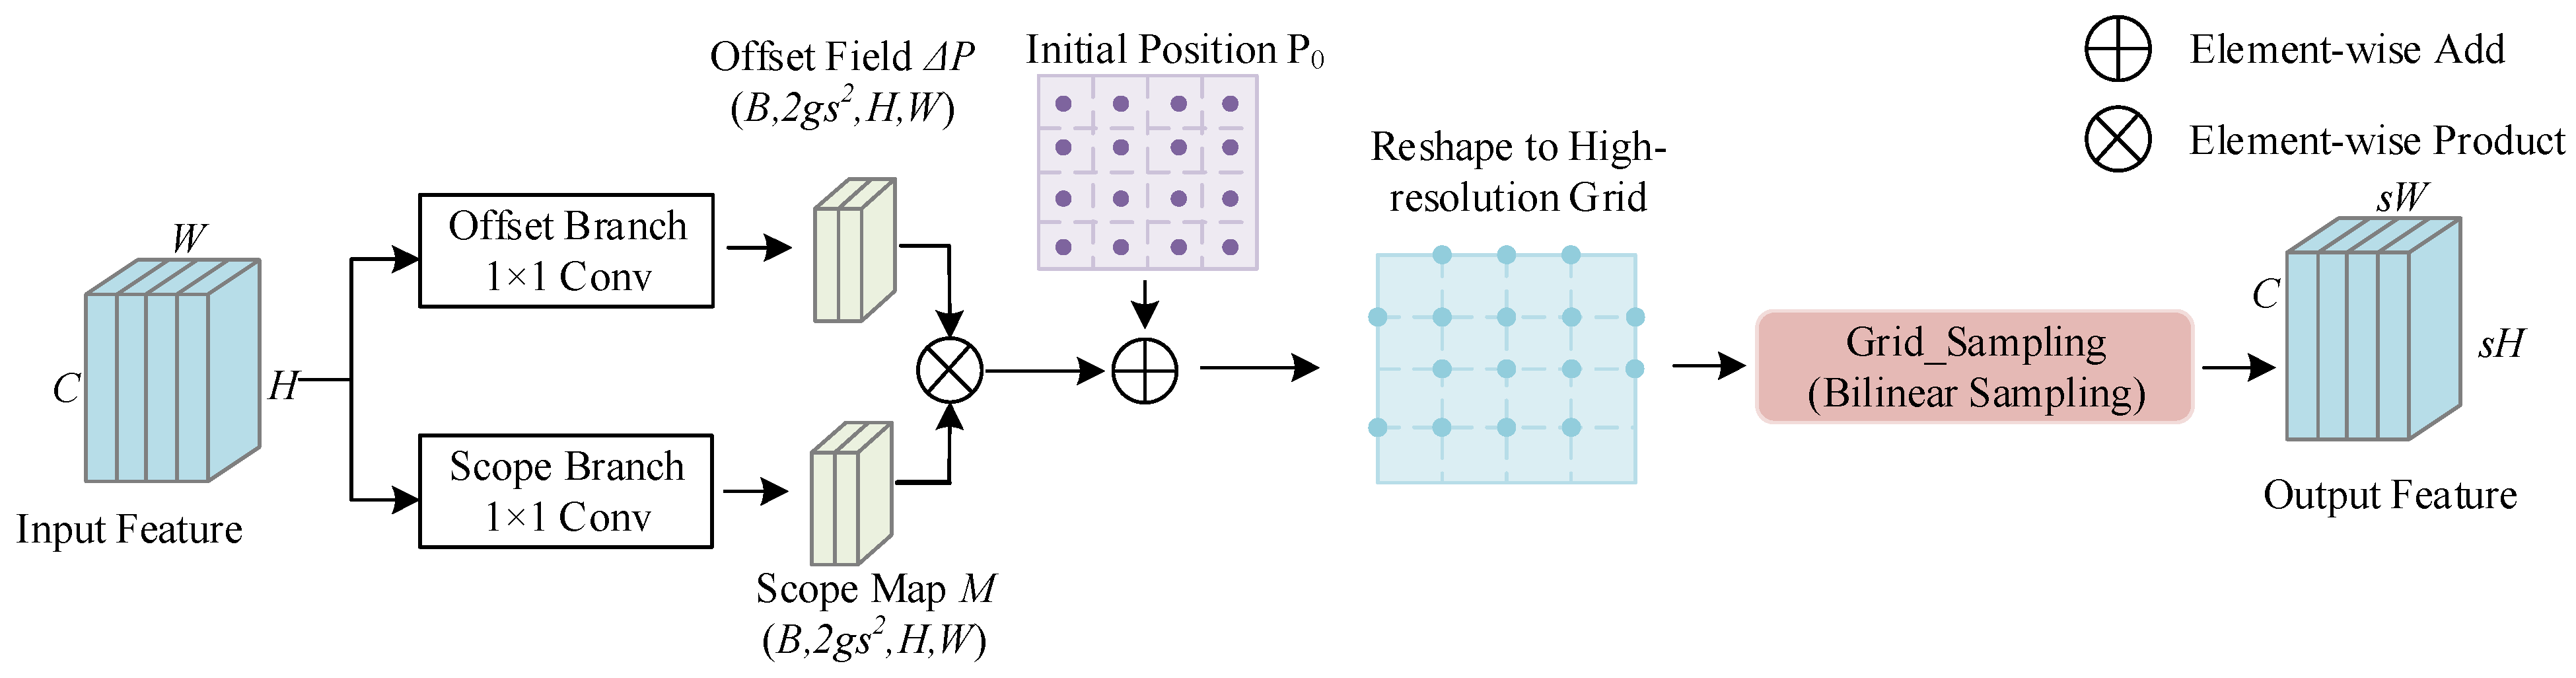
During feature fusion, the spatial resolutions of feature maps between different branches and fusion nodes are often inconsistent, necessitating the introduction of up sampling operations to achieve scale alignment. However, the nearest-neighbor interpolation (UpSample) used in the original model is a fixed interpolation method. When reconstructing the spatial structure of high-level semantic features, it has limited expressive power, which can easily lead to discontinuities at the edges of feature maps and blurred local details, thereby reducing the accuracy of representing and localizing small-scale defect features. To address these issues, this paper introduces a dynamic upsampling module (DySample) into the feature fusion path. This module uses a convolutional network to predict pixel-level sampling weights and spatial offsets, enabling the upsampling process to adaptively adjust local sampling positions and regional upsampling ratios based on feature content, thereby achieving dynamic feature resampling. Compared to traditional fixed interpolation methods, DySample better preserves the structural information and boundary details of high-level semantic features. This effectively mitigates feature blurring and information loss, enhancing the model’s ability to characterize small-scale defects and improving detection robustness.
The DySample module implemented in this work follows the standard architecture proposed by Liu et al. [34], with targeted fine-tuning for the small-scale defect detection task. Its detailed structure is illustrated in Figure 8. The DySample module achieves dynamic upsampling by learning pixel-level sampling offsets. Specifically, a 1 × 1 convolution is employed to predict the offset field , where denotes the number of groups and s represents the upsampling factor. To improve stability, an optional modulation branch is introduced, which generates a modulation map through a 1 × 1 convolution combined with sigmoid activation, for adaptive adjustment of the offset magnitude. A predefined regular grid is used as the initial sampling position, and the final sampling position is calculated as Formula (1):
Figure 8.
Sampling workflow of the DySample module.
Subsequently, the sampling grid is rearranged into the high-resolution space via pixel shuffle, and bilinear interpolation is performed using grid_sample, ultimately yielding an upsampled feature map with dimensions .
It is worth noting that the designed output feature resolution is twice that of the original output resolution. Consequently, the input resolution dimensions of the backbone network and the neck network are large. If the input channels at the high-resolution level of the original model are retained, the model’s floating-point operations will increase significantly. To avoid this, the channels at the 160 × 160 resolution fusion node in the neck network are adjusted to half the size of the original channels.
3.3. Model Pruning
To enhance the deploy ability of the detection model, it is necessary to minimize the number of model parameters and the volume of floating-point operations as much as possible. Common model compression techniques include network architecture optimization, parameter quantization, structured pruning, and knowledge distillation. Our earlier adoption of ShuffleNetV2 as the backbone falls under the category of network architecture optimization. Although this method reduces the number of parameters in the backbone structure, the model as a whole still requires a large number of floating-point operations, which is not conducive to practical deployment and inference. To further optimize the model structure and reduce computational load, this paper performs pruning operations on the previously improved model. The Layer-Adaptive Magnitude-based Pruning (LAMP) algorithm [35] is adopted to trim unimportant weight structures in the model.
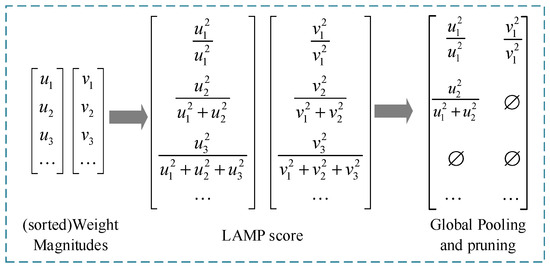
The LAMP algorithm is a weight-level sparsification method that extracts weights from all network layers, computes and normalizes the cumulative magnitude of each weight, and uses these values to quantify the structural importance of model components. Based on these quantification results, it performs adaptive pruning. The pruning process is as follows: (1) Initialize the input model’s weight parameters. Flatten weight tensors from all layers into one-dimensional arrays and sort them in ascending order of magnitude. (2) Compute the LAMP score, defined as the square of a weight’s magnitude divided by the sum of the squares of all weights in the same layer with magnitudes greater than or equal to that weight. (3) Globally prune the connections with the lowest LAMP scores until the required global sparsity constraints are met. (4) Fine-tune the pruned model to restore its accuracy. Figure 9 illustrates the pruning process of the LAMP algorithm.
Figure 9.
LAMP.
The LAMP score is the square of a weight’s magnitude, normalized by the sum of all retained weights in that layer, and is used to measure the relative importance of the target connection among connections in the same layer. The calculation formula is shown in Equation (2):
Among them, u and v are weight indexes, and W represents the weight vector arranged in ascending order of amplitude after expansion. When u < v, |W[u]| < |W[v]|. The square amplitude of the weight with index u is defined as W[u]2. The larger the value, the higher the importance of the weight to the model and the greater its impact on the output. The denominator represents the sum of the square amplitudes of all weights in the same layer that meet the conditions and is used to measure the relative importance of the current index weight in the rest of the current layer. When the score is larger, the score is higher, which means that the index weight is more important and it is more likely to be retained during pruning. From the LAMP score, we can get Formula (3):
Equation (1) intuitively describes the comparison rule for LAMP scores. The larger the magnitude of the squared weight, the higher the LAMP score for the corresponding index. This ensures that during the pruning process, connections with higher LAMP scores are retained first, while those with lower scores are pruned, until the required global sparsity constraint is satisfied. Furthermore, as can be seen from Equation (2), at least one weight is retained in each layer, meaning at least one channel is preserved in each layer. This effectively prevents layer collapse and pruning failure. Through LAMP, the number of parameters and computational complexity of the detection model can be significantly reduced, making the improved model easier to deploy on edge devices for agricultural detection.
4. Experiment
4.1. Training Parameters
The model proposed in this paper is based on YOLO8s and was trained from scratch for 200 epochs without using pretrained weights. For all subsequent experiments, the input image resolution was 640 pixels, the batch size was 16, and the number of workers was 8. The experimental platform was based on the Windows 10 operating system, with an Intel Xeon(R) Gold 6248R CPU (Intel Corporation, Santa Clara, CA, USA) with 256 GB of RAM and an NVIDIA GeForce RTX 4090 GPU (NVIDIA Corporation, Santa Clara, CA, USA) with 24 GB of VRAM. The deep learning frameworks used were Torch 2.2.2+cu121, torchvision 0.17.2+cu121, CUDA 12.1.105, and cuDNN 8.9.7.29.
4.2. Evaluation Metrics
This experiment primarily evaluates performance using precision (P), recall (R), mean average precision (mAP), the number of parameters, model weight size, and floating-point operations (FLOPS) [36]. mAP50 refers to the average of each AP when IoU is set to 0.5. mAP50–95 represents the average of each AP category when the IoU range is 0.5–0.95 with a step size of 0.05. The number of parameters and FLOPS are used to evaluate the computational complexity of the model, while model size is used to assess deployment costs.
The expressions for , , and are as follows:
In the formula, TP denotes true positive, which is the number of samples correctly predicted as positive by the classifier; FP represents false positive, the number of samples incorrectly predicted as positive by the classifier; FN represents false negative, the number of samples incorrectly predicted as negative by the classifier but which are actually positive; TPi and FPj denote the number of samples correctly predicted for the i-th class and the number of samples incorrectly predicted for the j-th class, respectively; n is the total number of samples.
All experiments were conducted under identical hardware and software configurations. Each model was trained and tested three times starting from different random initializations. We report all metrics as the mean ± standard deviation. To evaluate statistical significance, we performed paired two-tailed t-tests on the mAP50–95 scores between our proposed model and all comparative models at a significance level of α = 0.05, as this metric best reflects the overall detection performance.
5. Results and Discussion
Since this detection model is intended for deployment on edge devices, it must balance accuracy with compactness. Detection accuracy is measured by the model’s mAP score, while deployability is assessed based on the model’s size and the number of floating-point operations. First, we conducted comparative tests using the ‘n’ and ‘s’ versions of the YOLOv8 model to determine the most suitable version for this detection task. Second, to verify whether the qualified and unqualified detection models are suitable for this small-scale defect detection task, we tested the ‘s’ version of the YOLOv8 model. The test results are shown in Table 2.
Table 2.
Comparative Test of YOLOv8 Model ‘n’ and ‘s’ versions.
As shown in Table 2, although the ‘n’ variant achieves a smaller model size, fewer parameters, and lower FLOPs, it exhibits significantly lower detection accuracy, recall, and mean average precision (mAP). Deploying the ‘n’ variant would fail to meet the accuracy requirements for small-scale defect detection. In contrast, the ‘s’ version achieves over 93% for all three metrics, reducing missed detections and false detections to ensure detection accuracy. Therefore, the ‘s’ version is selected as the model version for detecting small-scale defect targets in this paper.
5.1. Module Validity Testing
As discussed in Section 2, this study primarily implemented the following three optimizations on the baseline model YOLOv8s. To verify the effectiveness of these optimization strategies, the baseline model was modified to incorporate these optimizations while maintaining consistent testing parameters, and validity tests were conducted. The test results are shown in Table 3.
Table 3.
Module Validity Verification Experiments.
As shown in Table 3, removing the fourth stage from the baseline model and adopting a three-stage structure resulted in a significant reduction in the number of computational parameters—down to just 31.4% of the original model—while improving the mAP50–95 by 0.4 percentage points. This indicates that, for the detection of small defects on fresh corn cobs in this paper, the three-stage backbone structure outperforms the four-stage backbone structure. While maintaining the 3-layer backbone structure, simply introducing the custom-developed model compression SSA module resulted in improvements across all accuracy metrics. Specifically, compared to the baseline model with the fourth stage removed, the mAP50–95 value increased by 3.1 percentage points, and the number of model parameters was reduced by 1.01 million. This is because removing one deep backbone layer allows the model to retain more complete defect feature information; the backbone structure combining the model compression ShuffletNetV2 module with a triple attention mechanism balances model compression and detection accuracy. When only RepDyFPN was introduced, the multi-scale fusion strategy effectively enhanced the model’s feature fusion capability, resulting in a 1.0 percentage point increase in mAP50–95. Compared to the original model, combining all optimization strategies resulted in optimal performance across all metrics except floating-point operations. Accuracy and recall improved by 2.1 and 1.9 percentage points, respectively, mAP50 and mAP50–95 increased by 1.8 and 5.0 percentage points, respectively. The number of model parameters was reduced by 7.66 million, while the number of floating-point operations increased by only 3.4 percentage points. This is primarily because removing one layer increased the feature dimensions input to the neck structure, thereby increasing the computational load. The ablation study results confirm that our proposed improvement strategy is specifically optimized for small-scale fresh corn cob defects. The model exhibits superior feature representation capabilities for these targets, achieving higher detection accuracy and satisfying the precision requirements of industrial fresh corn cob inspection pipelines.
All proposed improvements—removal of the 4th stage, incorporation of the SSA backbone, and introduction of the RepDyFPN neck—yielded statistically significant improvements in mAP50–95 compared to the baseline (p < 0.05).
To quantitatively evaluate the impact of removing the 4th downsampling stage, we conducted additional ablation experiments and calculated the Average Precision (AP) for defects in different size categories following the standard of the COCO dataset: small objects (<32 × 32 pixels), medium objects (32 × 32–96 × 96 pixels), and large objects (>96 × 96 pixels). The results are presented in Table 4.
Table 4.
Average Precision (AP) of Defects in Different Size Categories.
Based on the experimental results, we draw the following two key conclusions:
- (1)
- Impact on large defect detection (>96 pixels).Removing the 4th stage had no adverse effect on large defect detection, with the average precision (AP) for large objects increasing slightly from 92.3% to 92.5%. This can be attributed to two factors:After removing the 4th stage, the maximum downsampling factor decreases from 32× to 16×, yielding a minimum feature map resolution of 40 × 40 (corresponding to 16 × 16 pixels per grid for a 640 × 640 input). A 96 × 96-pixel large defect occupies 6 × 6 grids on this feature map, which is entirely sufficient for accurate localization and classification.Large defects (primarily severe mechanical damage and extensive mold growth) possess distinct semantic features and large spatial extents, which can be effectively captured by the 16× downsampled feature map.
- (2)
- Potential loss of high-level semantic information.Our design does not induce significant loss of high-level semantic information, as evidenced by the 0.4 percentage point improvement in overall mAP50–95. The justifications are as follows:Removing the 4th stage only reduces the downsampling factor rather than the depth of the backbone network. We retain three complete ShuffleNetV2 stages, which provide sufficient depth for extracting high-level semantic features.The original 32× downsampled feature map severely compresses the features of small-scale defects: a single kernel defect smaller than 32 pixels would be reduced to merely 1 × 1 pixel, resulting in irreversible information loss. Removing this stage preserves more fine-grained details of small defects while maintaining adequate high-level semantic representation for large defects.The subsequent Triplet Attention modules and RepDyFPN neck further enhance cross-scale feature fusion, compensating for any potential minor semantic information loss.This modification is particularly tailored to our task, as small-scale defects account for 39.1% of all annotated targets and constitute the primary challenge in fresh corn cob defect detection.
5.2. Comparison of Attention Mechanisms
To validate the superiority of the multi-attention mechanism, we embedded TA, CBAM [37], SE [38], SimAM [39], and CCA [40] at a fixed position following the C2f module in the backbone layer to conduct performance comparison tests. The results are shown in Table 5.
Table 5.
Comparison of Attention Mechanisms.
As shown in Table 5, compared to models equipped with other attention modules, the model with the TA module outperforms other mechanisms in terms of precision, recall, mAP50, and mAP50–95. Compared to the other four models, the accuracy is 0.5 percentage points higher than that of the best-performing CBAM, the recall is on par with the best-performing SE, mAP50 is on par with the best-performing CBAM, and the mAP50–95 is 0.5 percentage points higher than that of the best-performing CBAM. Compared to models without an attention mechanism, introducing TA improves the model’s recall, mAP50, and mAP50–95 by 1.3, 0.9, and 0.9 percentage points, respectively.
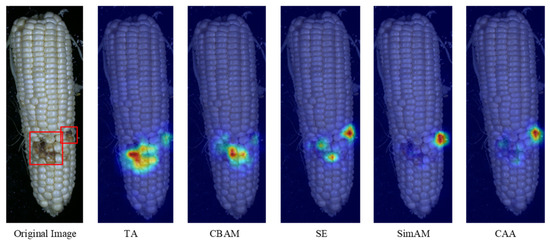
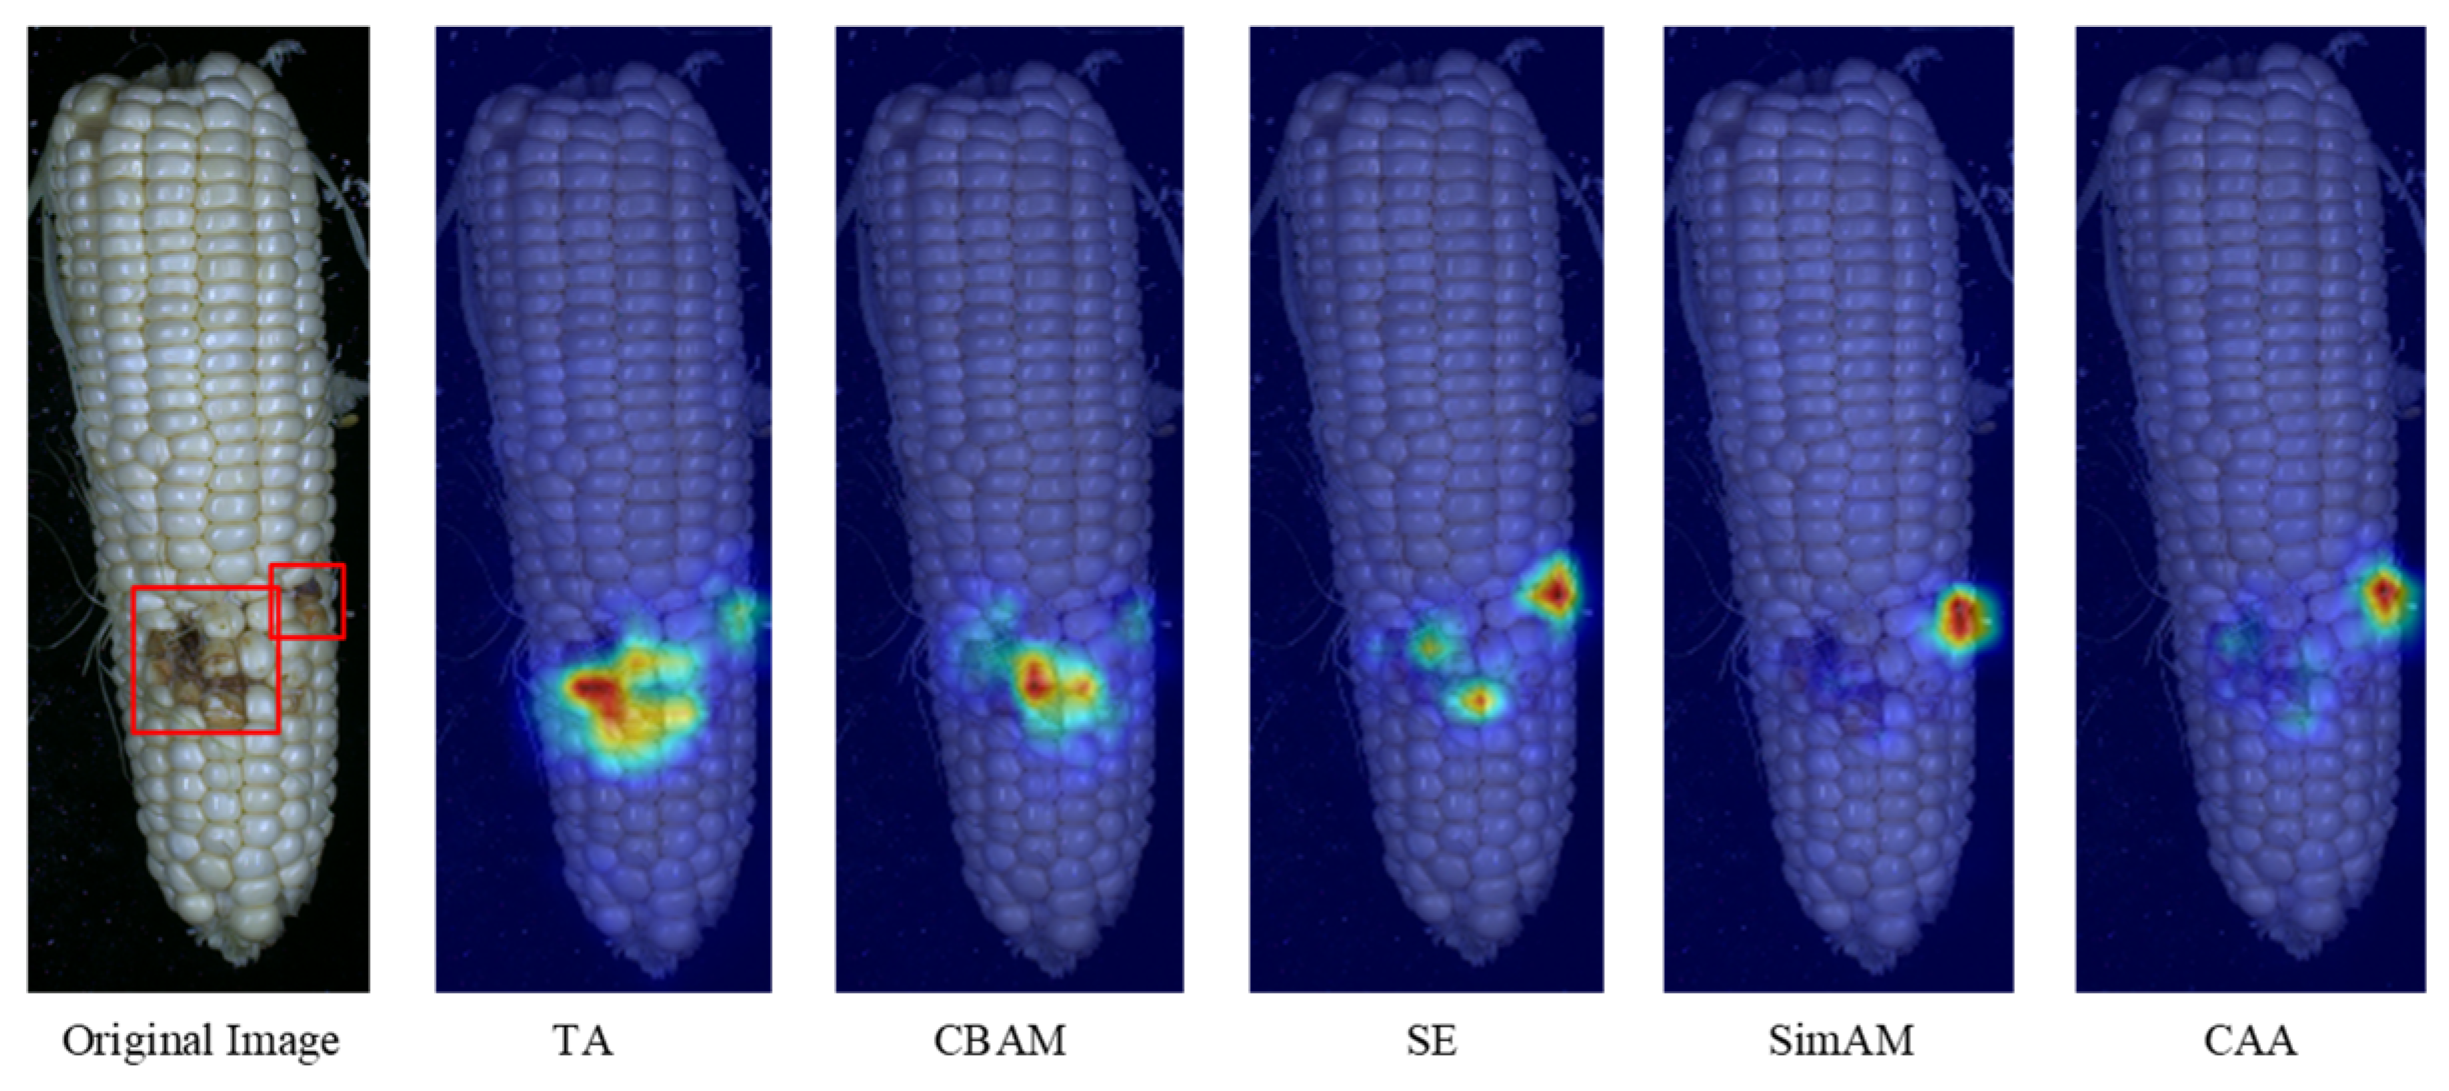
To quantitatively and qualitatively evaluate how different attention mechanisms affect the model’s feature focusing ability, we visualized the feature heatmaps generated by models equipped with each attention module. The results are shown in Figure 10. A comparison of the five heatmaps shows that the Triplet Attention (TA)-equipped model exhibits the largest significant response area, with heat distributions fully covering both target regions. Additionally, it displays deeper heatmap gradations, indicating that under the influence of this attention mechanism, the model can focus more effectively on key areas, significantly enhancing its feature representation capabilities. In contrast, the model using SimAM and CAA produced almost no discernible thermal response in the mold-affected area, suggesting that these modules have limited ability to focus on small-scale defects. The SE module exhibited only a weak thermal distribution in the left mold-affected area, indicating insufficient ability to capture the salience of that region. Although the model using CBAM generated responses in certain areas, the thermal coverage in the right target area was noticeably smaller and the colors were lighter, indicating insufficient attention intensity toward that target.
Figure 10.
Heatmaps with different attention mechanisms. The red squares indicate the target regions for object detection.
Combining the results of quantitative analysis and heatmap analysis effectively demonstrates that the TA module can more effectively enhance the model’s focus on key regions, exhibiting superior feature extraction and representation capabilities, and is more suitable for detecting small-scale defects in fresh corn cobs.
5.3. Pruning Experiment
As shown by the module validity verification experiments, the detection performance of the improved SSAD-YOLOv8s model for small-scale defect detection in fresh corn cobs has been enhanced; however, this has also increased the model’s complexity and computational complexity. To reduce model parameters and computational complexity, we applied the LAMP algorithm to prune the improved model.
All pruning experiments were performed under identical hardware and software configurations to the baseline experiments. Training parameters—including sparse training epochs, fine-tuning epochs, learning rate, and momentum—were kept consistent across all runs. Only the random seed for model initialization was varied to account for the inherent stochasticity of the training process.
The parameters for the model pruning experiments are configured as follows:
During the sparse training phase, the maximum number of epochs is set to 200. Training terminates early once the model achieves the preset pruning ratio. For a pruning ratio of 2.0, the actual training duration is 147 epochs.
For the post-pruning fine-tuning phase: 300 training epochs, an initial learning rate of 0.01, a momentum of 0.937, and a maximum global sparsity of 1.0.
In this experiment, the improved SSAD-YOLOv8s model served as the target model for pruning. The LAMP algorithm was used to remove redundant structures within the model, followed by fine-tuning of the pruned model to restore its accuracy. For this pruning experiment, the pruning ratio was defined as the ratio of floating-point operations between the pre- and post-pruning models, calculated as shown in Equation (7):
The experimental results for different pruning ratios are shown in Table 6. The results indicate that as the pruning ratio increases, the number of model parameters and the number of floating-point operations gradually decrease. When the pruning ratio is 1.5, the mAP50–95 improves by 0.7%, the number of model parameters decreases by 31.7%, and the number of floating-point operations decreases by 33.6%; however, the model compression is not significant. At a pruning ratio of 2.0, mAP50 and mAP50–95 decrease by only 0.7 and 0.9 percentage points, respectively, while model parameters are reduced by 48.1% and FLOPs by 50.0%. When the pruning ratio exceeds 2.5, the model’s accuracy metrics decline significantly, with mAP50–95 decreasing by more than 8.7%. When the pruning ratio exceeds 3.0. From the above results, it can be concluded that appropriate and reasonable pruning of the model can effectively remove redundant parameters and achieve model compression optimization. However, an excessively high pruning ratio leads to a decline in the model’s learning capability, preventing it from capturing all features in the data and causing a significant drop in accuracy. The original design intent of the model in this paper is to be effectively applied to edge devices for fresh corn cobs defect detection, which requires guaranteed detection accuracy. Therefore, a comprehensive balance between accuracy and computational metrics is necessary. Based on the experimental results, only when the pruning ratio is set to 2.0 does the model maintain nearly unchanged accuracy while significantly reducing both floating-point operations and the number of parameters. Therefore, the pruned model with a pruning ratio of 2.0 is selected as the final model for detecting defects in fresh corn cobs in this chapter, and subsequent comparative experiments with different models will be based on this model.
Table 6.
Comparative Performance Test of Models at Different Pruning Ratios.
As shown in Table 6, when the pruning ratio is set to 2.0, the overall pruning effect of the model is relatively reasonable.
The standard deviations of all accuracy metrics across all pruning ratios were extremely small (≤0.5 percentage points), indicating that our pruning experiments exhibited exceptional stability and reproducibility.
Our original conclusion that a pruning ratio of 2.0 achieves the optimal trade-off between detection accuracy and model lightweighting was fully validated. At this pruning ratio, model accuracy was nearly identical to that of the unpruned model (mAP50–95 decreased by only 0.9 percentage points), while FLOPs were reduced by 50% and parameter count by 48.1%.
When the pruning ratio exceeds 2.5, the accuracy drops significantly and the standard deviation increases slightly, indicating that excessive pruning leads to unstable model performance, which is consistent with our original analysis.
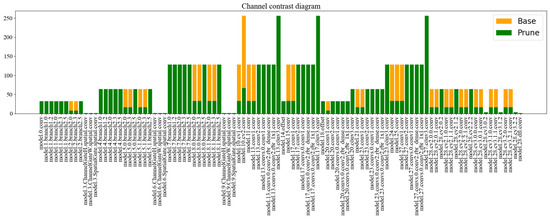
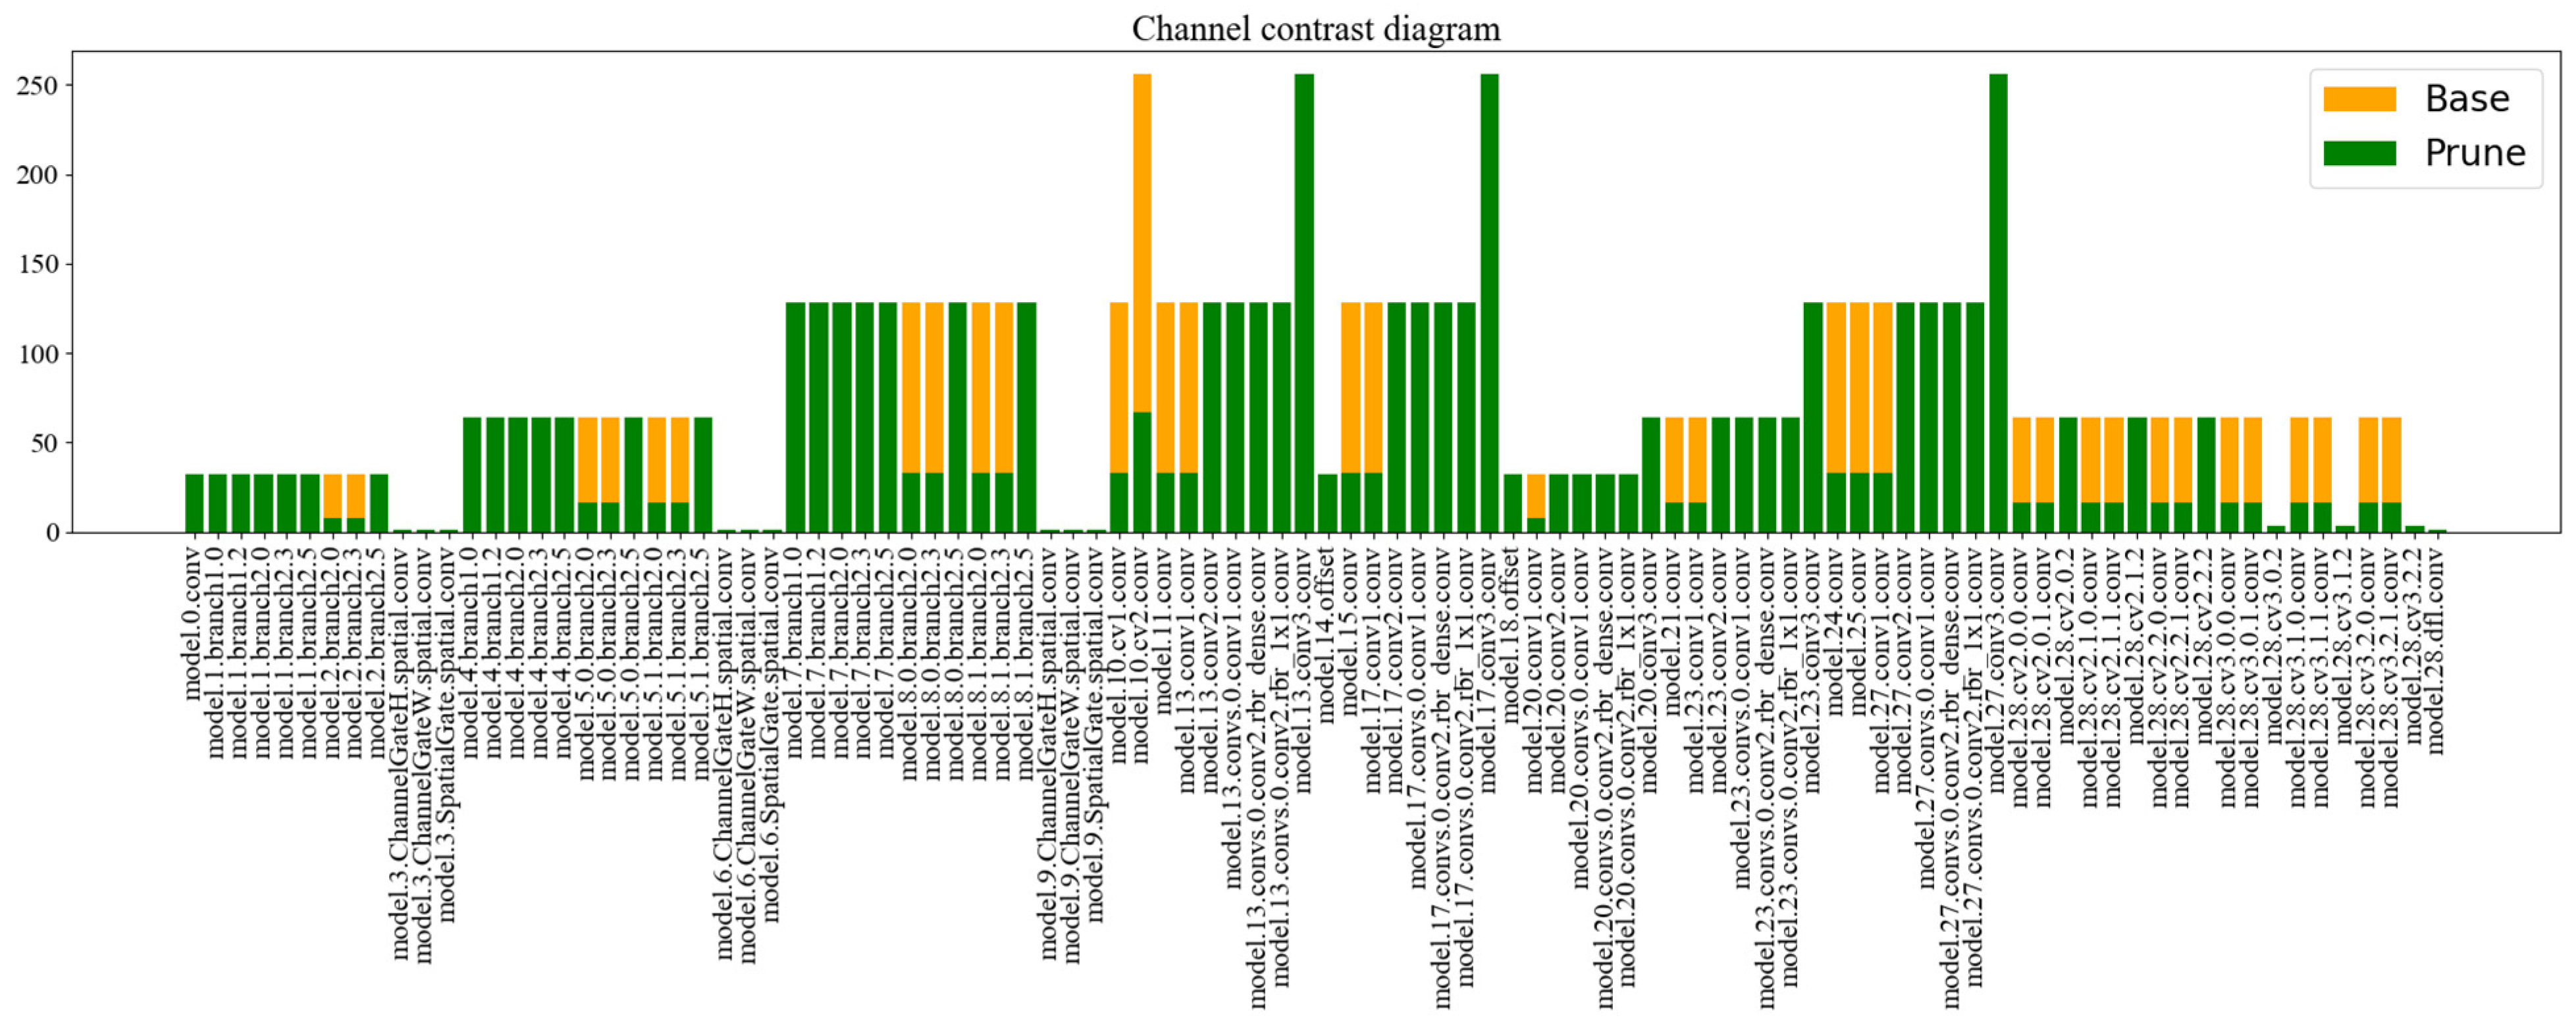
Therefore, this paper statistically analyzed and compared the number of channels in each network layer under this pruning ratio, with the results shown in Figure 11. The horizontal axis represents the names of different network layers, while the vertical axis represents the number of channels in the corresponding layer; the orange and green bars represent the number of channels before and after pruning, respectively. A taller bar indicates that the layer contains more channels. As observed in the figure, the LAMP method ranks the importance of channels in each layer based on the global LAMP score, thereby prioritizing the removal of redundant channels with lower scores to achieve parameter reduction and model compression. When the pruning ratio reaches 2.0, most redundant parameters in the model have been effectively eliminated. However, the number of channels in a few layers remains unchanged, as the pruning process is constrained by the preset pruning ratio. Once the cumulative pruning volume reaches the set upper limit, the algorithm automatically stops to prevent excessive pruning from causing a significant drop in model accuracy. Furthermore, the figure shows that not all layers are suitable for pruning. For modules with complex structures and multiple branch information flows (such as attention mechanism layers), the internal channels are highly coupled and interdependent. Forcing channel pruning on these layers may disrupt their structural coherence, leading to unstable gradient flow in the network or even pruning failure. Therefore, before pruning, such sensitive layers must be designated as “skip layers” (i.e., layers not subject to pruning) to ensure the stability of the overall pruning process and the integrity of the model structure.
Figure 11.
Comparison of the number of model channels before and after pruning when the pruning ratio is 2.0.
Based on the above results, we selected the model pruned with a pruning ratio of 2.0 as our final model, naming it SSAD-YOLOv8s-Prune. Subsequent comparative experiments were conducted using this model as the baseline.
5.4. Comparative Tests with Different Models
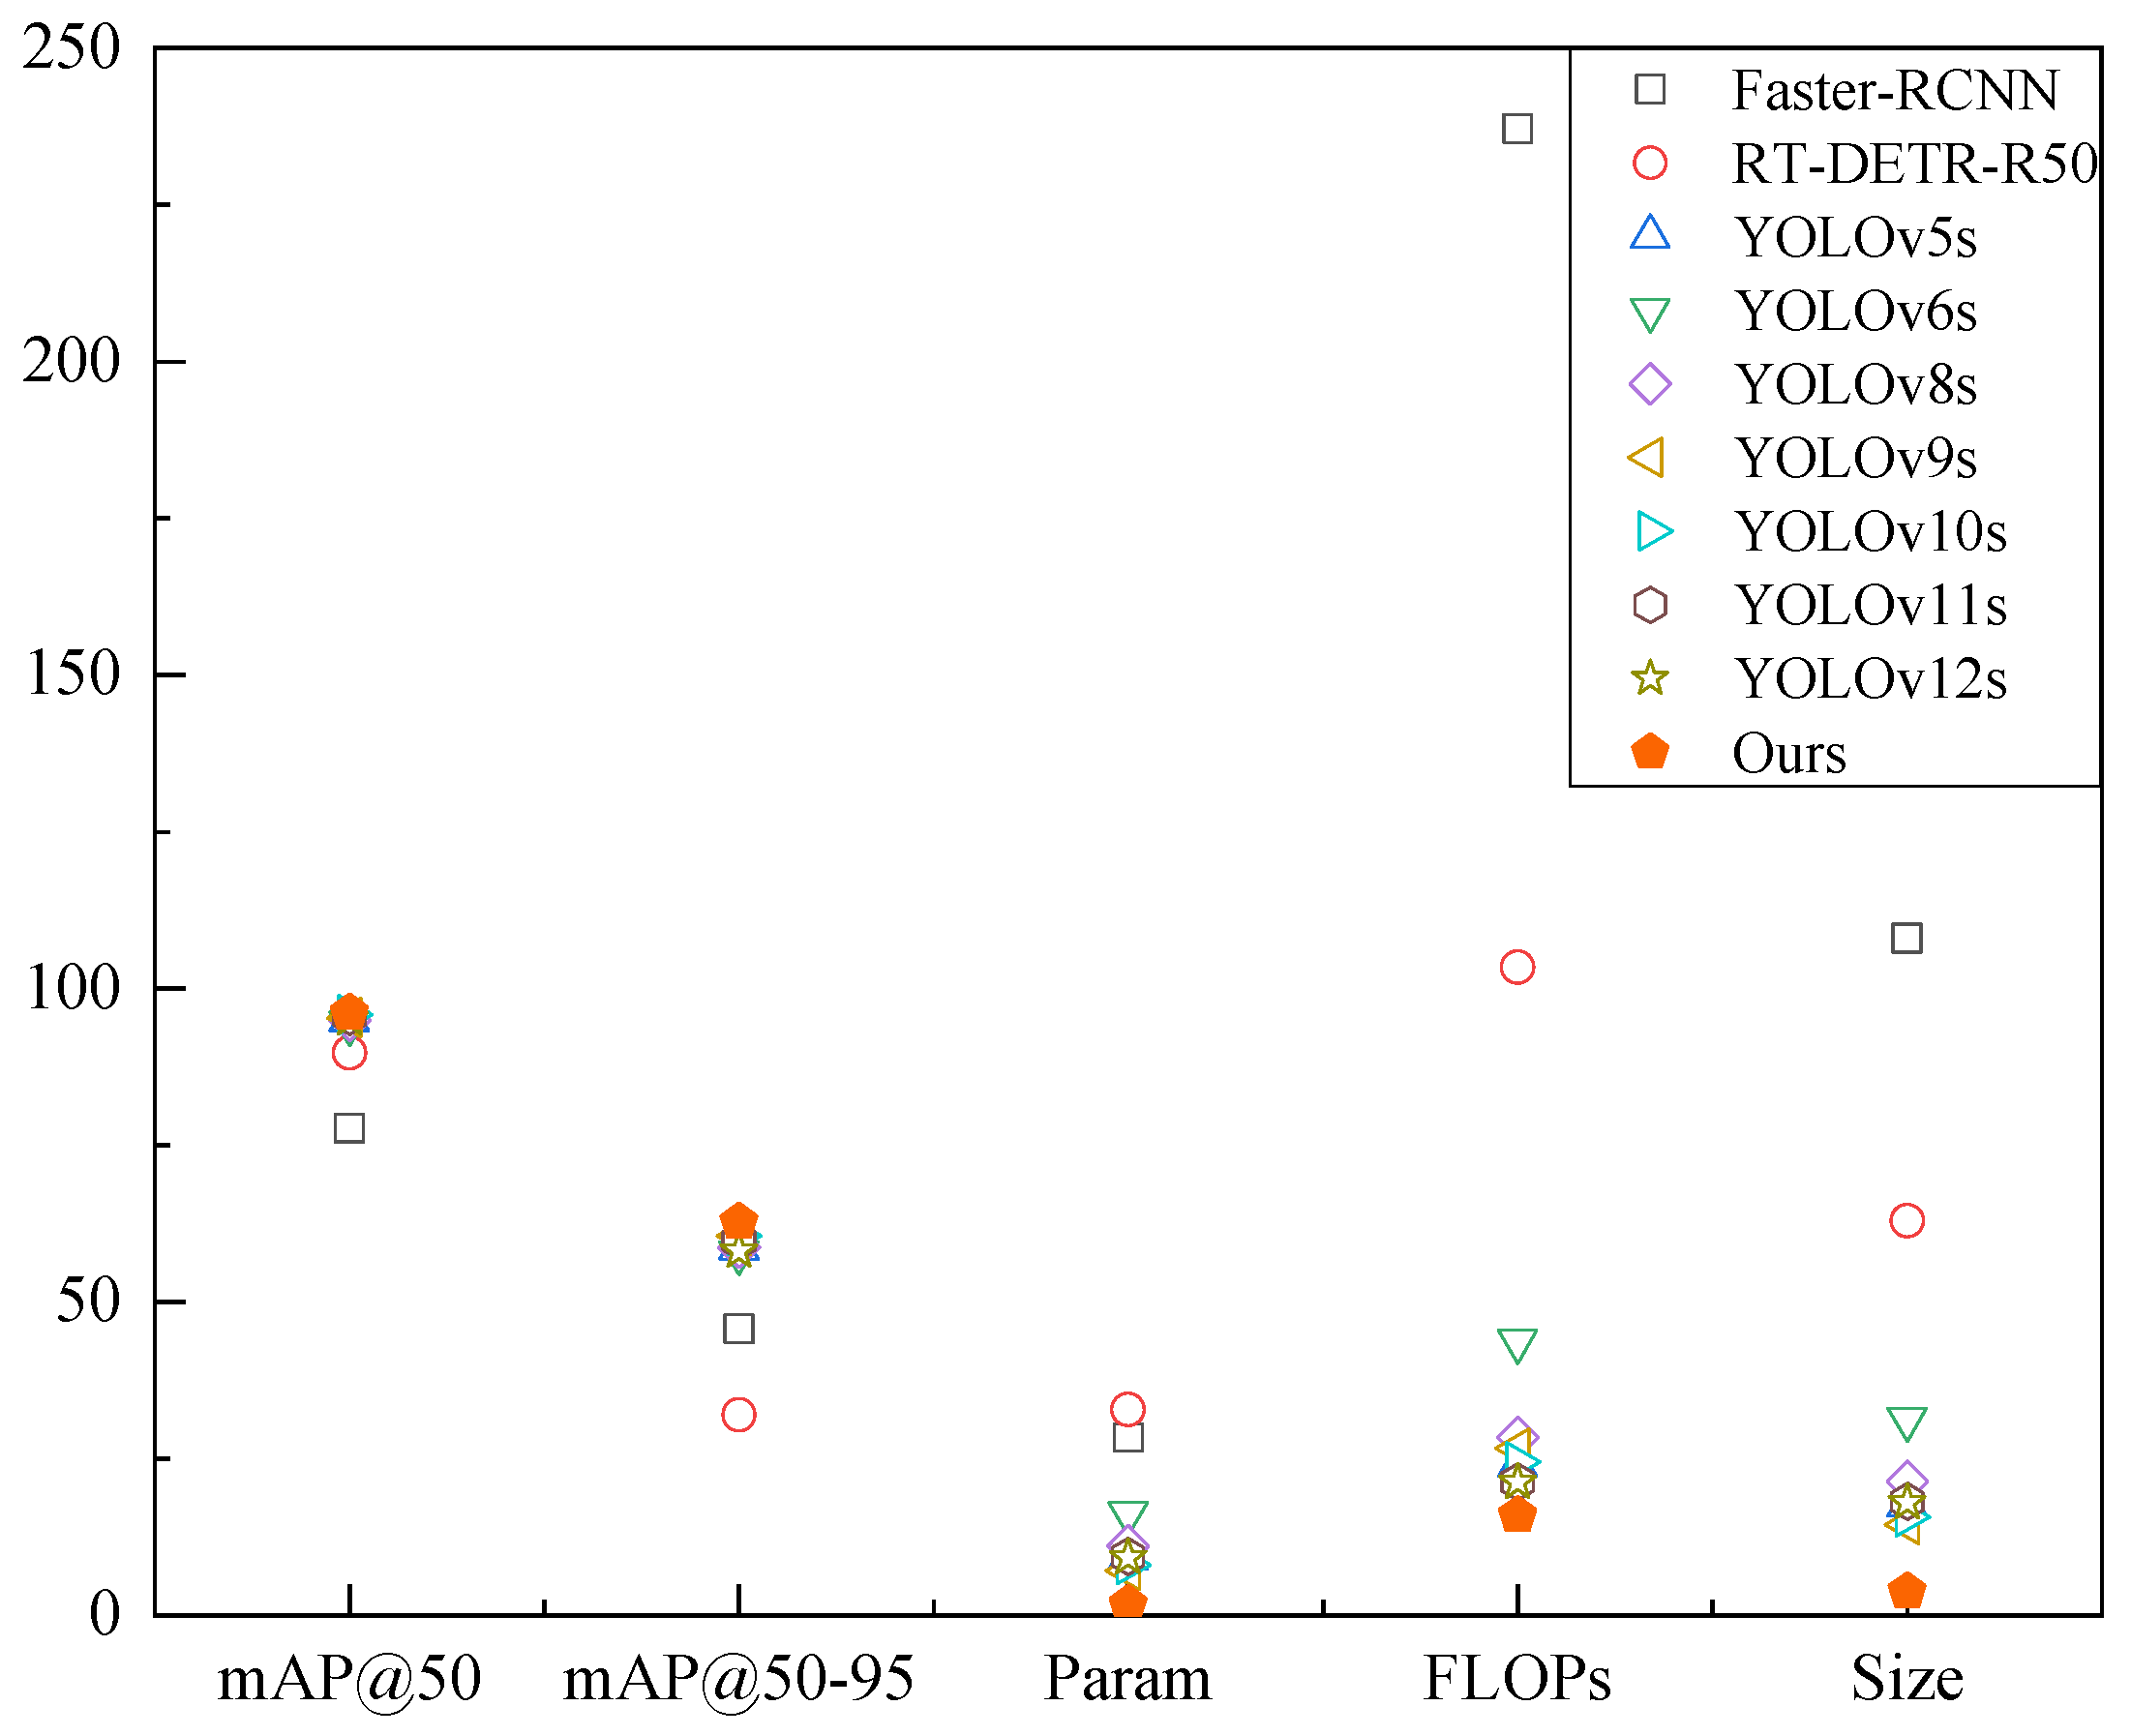
To verify the effectiveness of the improved model in the detection of fresh corn cobs, we compared it with mainstream object detection models, using mAP50, mAP50–95, the number of parameters, the number of floating-point operations, and model (SSAD-YOLOv8s-Prune) size as quantitative metrics. We conducted comparative experiments between our model and the two-stage object detection model Faster-RCNN, the single-stage RT-DETR-R50 model, as well as the YOLO series models including YOLOv5s, YOLOv6s, YOLOv8s, YOLOv9s, YOLOv10s, YOLOv11s, and YOLOv12s [41]. The experimental results are shown in Table 7 below.
Table 7.
Comparison of Different Models.
The two-stage Faster-RCNN and single-stage RT-DETR-R50 exhibit poor detection accuracy and suffer from excessive parameters, high computational complexity, and large model sizes, all of which are orders of magnitude worse than the YOLO-series models. Therefore, the YOLO series models are more suitable for this detection task. Compared to other models in the YOLO series, the model presented in this paper achieves the highest mAP50 and mAP50–95 values, at 96.1% and 62.8% respectively, outperforming all he YOLOs tested (YOLOv5s to 12s) by 0.3–1.6% in mAP50 and 2.2–4.9% in mAP50–95 (Table 7). This demonstrates that our model possesses the optimal capability for detecting small-scale defects in fresh corn cobs. The model has a minimum of 1.80 M parameters representing a reduction of between 5.37 to 14.50 M with the minimum floating-point operations and model size is reduced substantially to 15.9 G FLOPs and 3.8 MB overall size (Table 7). This indicates that the model outperforms other models in the YOLO series in terms of model compression design, significantly reducing the difficulty of deployment on embedded devices and meeting the requirements for real-time detection. The above analysis shows that the improved model demonstrates superior detection performance, is model compression, and has good overall performance, meeting the requirements for detecting small-scale defects on fresh corn cobs.
Our final model achieved a statistically significant improvement in mAP50–95 over all tested YOLO-series models (p < 0.01).
For mAP50, our model outperformed YOLOv10s by 0.3 percentage points, but this difference was not statistically significant (p = 0.072). Accordingly, we revised our conclusion to state that “compared with YOLOv10s, the proposed model achieves a slight improvement in mAP50 and significantly superior performance in mAP50–95”, rather than claiming universally superior performance.
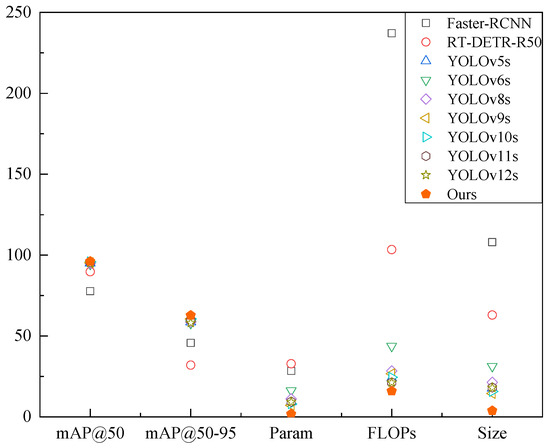
To provide a more intuitive comparison of the performance differences among the various models, this paper visualizes the experimental results, as shown in Figure 12. The x-axis represents various model evaluation metrics, including mAP50, mAP50–95, Param, FLOPs, and Size. The position of each data point on the scatter plot indicates the numerical value of the metric. For accuracy metrics such as mAP, a higher position on the scatter plot indicates a better performance. For efficiency metrics such as Param, FLOPs, and Size, a lower position on the scatter plot is preferable. As shown in the figure, the accuracy metrics of the model designed in this paper are at the highest point, while the efficiency metrics are at the lowest point, indicating that it outperforms other comparison models in terms of both parameter count and detection accuracy.
Figure 12.
Visualization of Comparative Experiment Results.
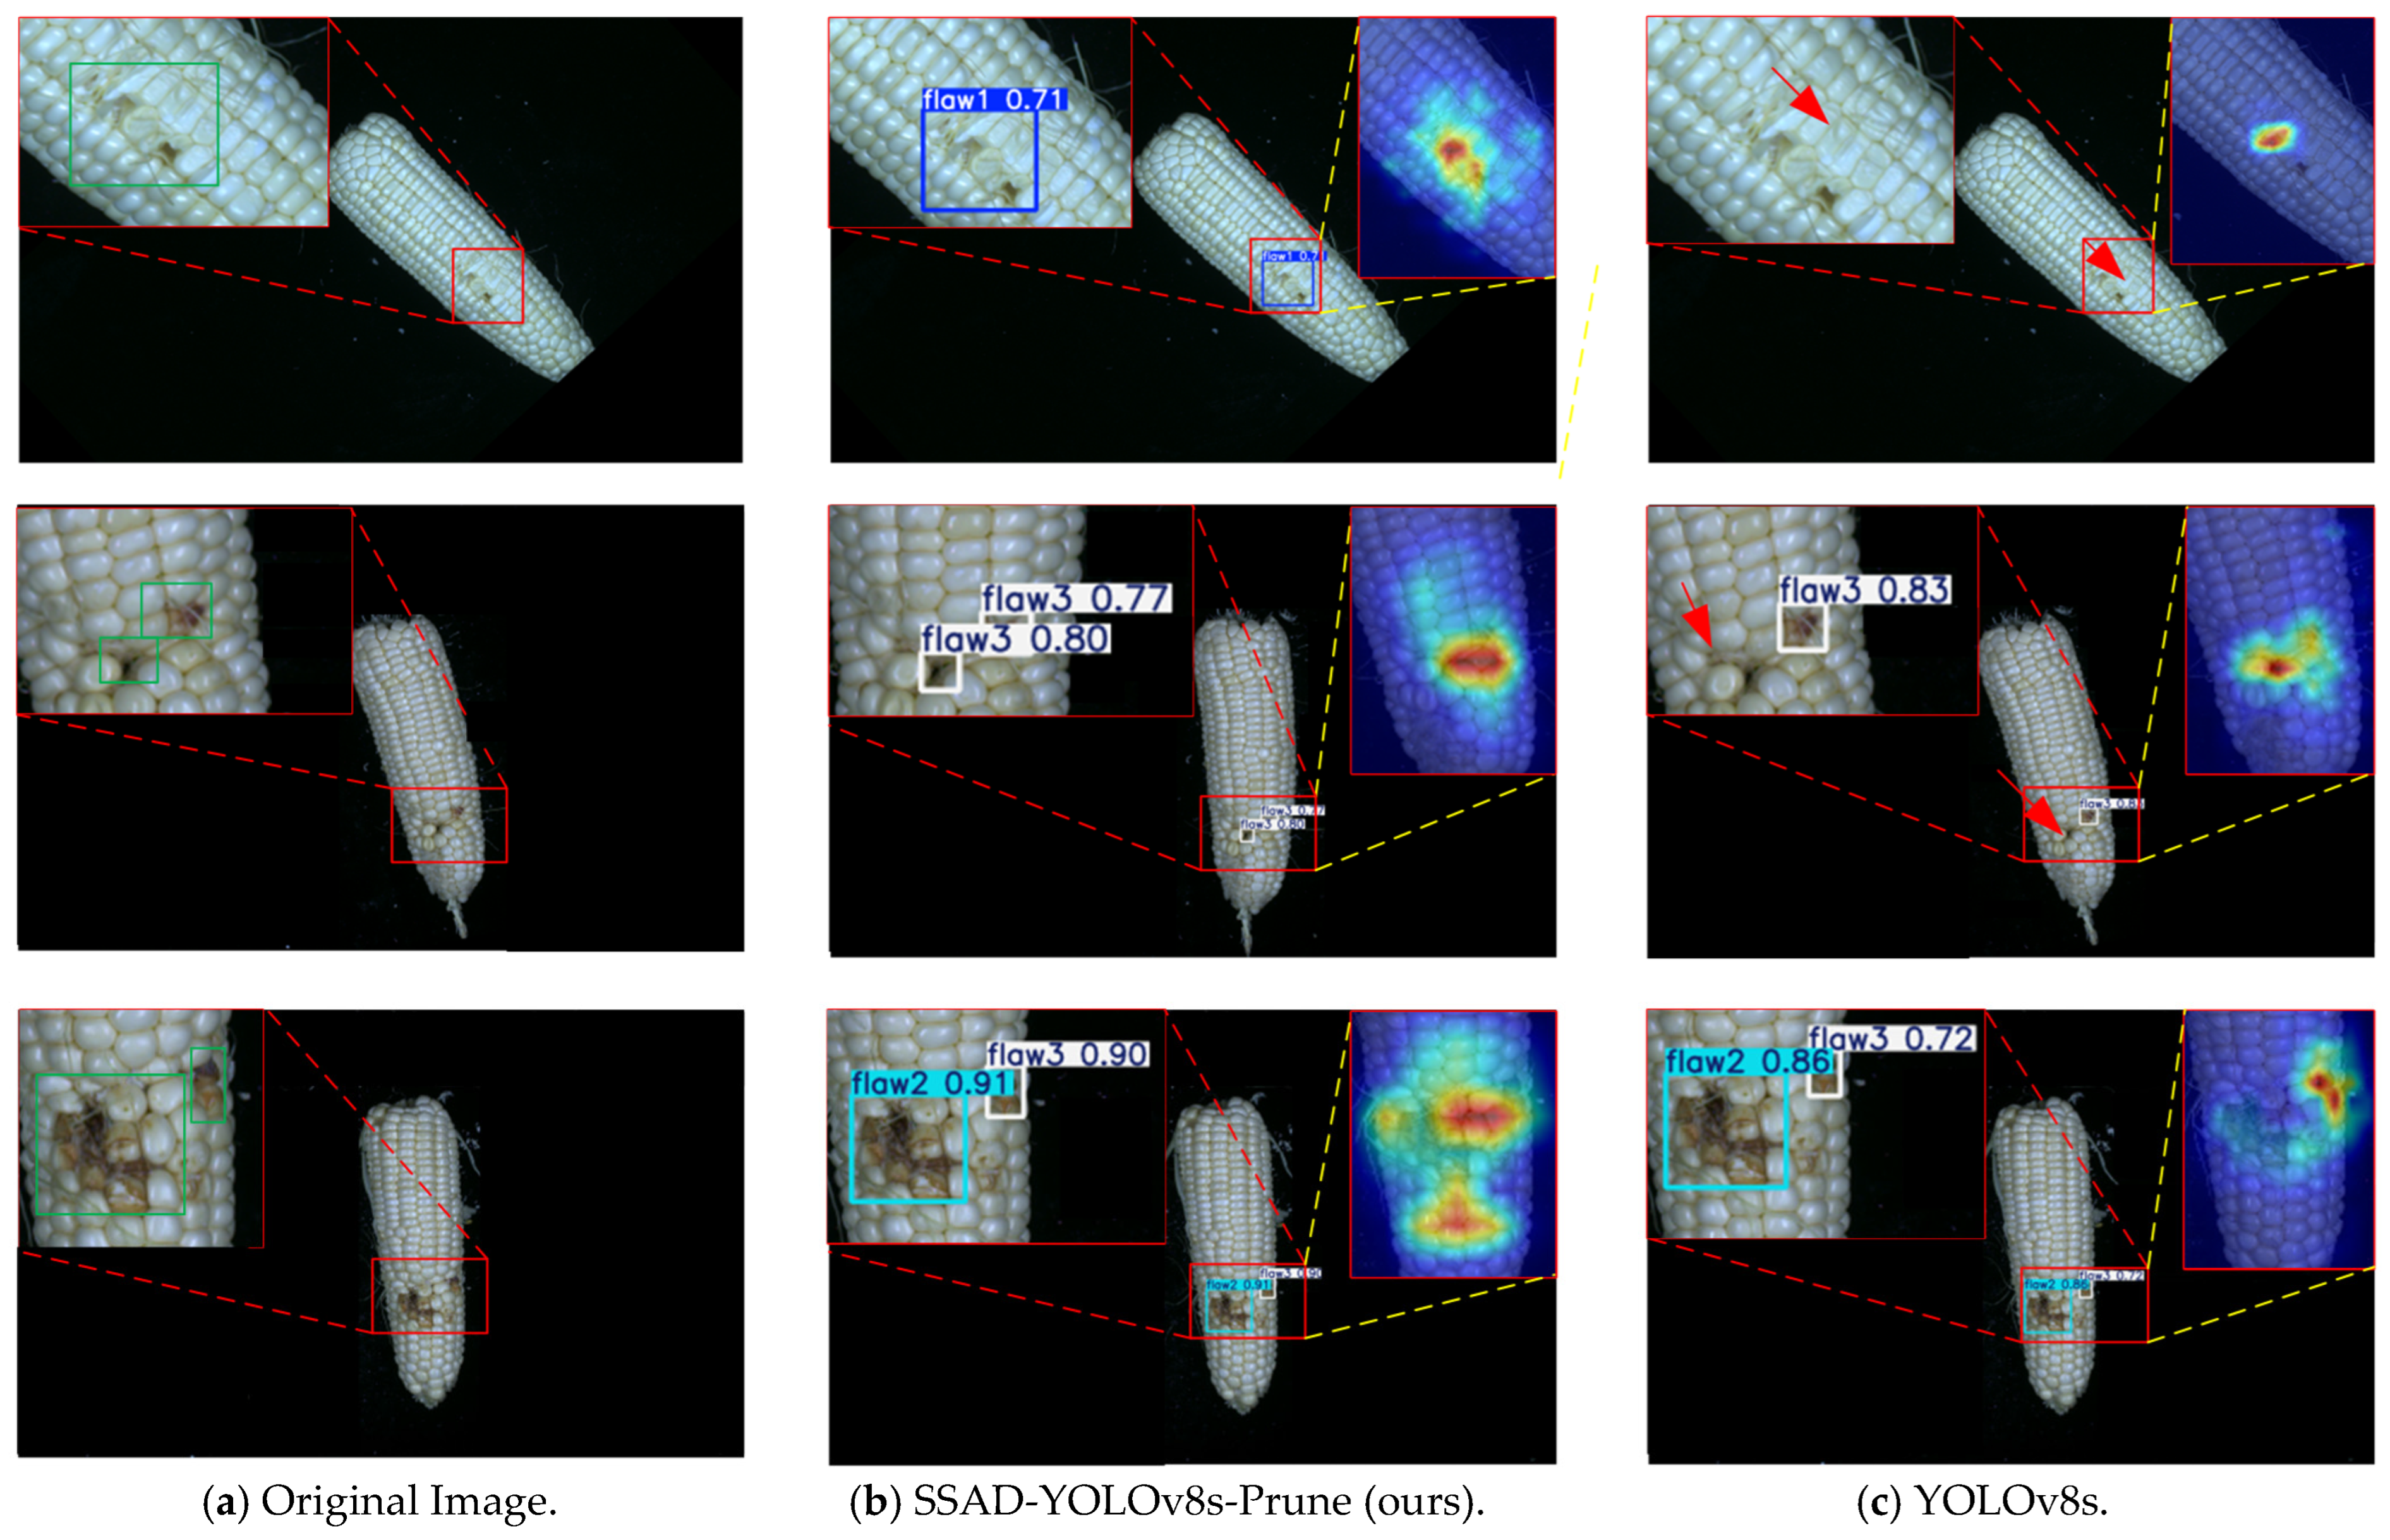
Through visual analysis of the detection results, we examine the performance differences between the YOLOv8s model and the SSAD-YOLOv8s-Prune model, further demonstrating the effectiveness and superiority of the model designed in this paper. Three types of defects were selected from the test dataset for visual inspection.
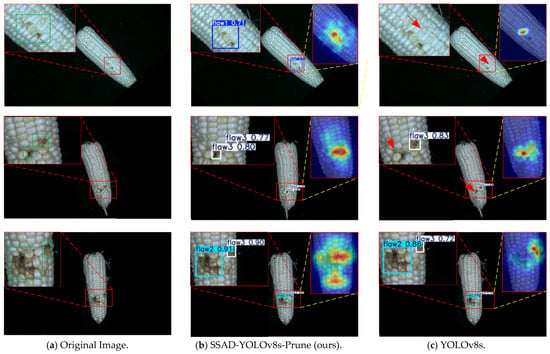
Detection result visualizations are shown in Figure 13, where columns (a), (b), and (c) represent the original image, SSAD-YOLOv8s-Prune detection results, and YOLOv8s detection results, respectively. Each row corresponds to a different defect type. The top row images contain mechanical damage defects and since their features resemble those of local grains, YOLOv8s misses some detections. The middle row of images, for bad grain defects, show that YOLOv8s misses some detections. In the bottom row of images, which contain cobs with a mix of bad grain and moldy defects, YOLOv8s makes accurate predictions but its detection confidence is lower than that of SSAD-YOLOv8s-Prune. In contrast, the SSAD-YOLOv8s-Prune model demonstrates superior robustness, not only avoiding missed detections but also making accurate predictions with high confidence, resulting in better detection performance.
Figure 13.
Visualization results of mechanical damage (top row), defective grains (middle row), and moldy defective grains (bottom row) detected by different models. (a) Original images; (b) Our proposed model (SSAD-YOLOv8s-Prune); (c) YOLOv8s. Green boxes indicate the regions to be detected in the original images. Red boxes mark the cropped regions for local magnification, guiding readers to observe the detailed features. Red arrows denote the undetected defects. In the heatmap-like activation maps, red and yellow represent regions with high model attention, while blue represents regions with low model attention.
To further validate the model’s detection performance, we visualized the feature heatmaps at the fusion node prior to detection. Heatmaps generated by SSAD-YOLOv8s-Prune and YOLOv8s in the upperright corner of the detection results, as shown in the upper-right corners of Figure 13b,c. It is evident that the heatmap generated by SSAD-YOLOv8s-Prune covers a significantly larger area compared to that of YOLOv8s. Furthermore, the heatmap fully encompasses the target region, with the target area appearing darker. This indicates that the model has a stronger ability to focus on the target region and a more robust feature representation capability. For the first row, the heatmap generated by YOLOv8s has a very small heat area, covering only a limited portion of the target region. This may lead to missed detections or false positives at certain confidence levels. For the second row, the heatmap generated by SSAD-YOLOv8s-Prune is darker in color compared to that of YOLOv8s, indicating that the SSAD-YOLOv8s-Prune model focuses much more strongly on this target area. For the third row, the heatmap generated by SSAD-YOLOv8s-Prune has a much larger heat area than YOLOv8s. Additionally, for the mold-affected area on the left, the lower part of the heatmap is lighter in color, indicating that the model’s attention to this area is superior to that of YOLOv8s.
6. Conclusions
Building on the YOLOv8s framework, this paper presents SSAD-YOLOv8s-Prune, a novel compression visual detection model tailored for small-scale defect detection in white fresh corn cobs. First, by integrating the model compression ShuffleNetV2 module with a triple attention mechanism and reducing the number of backbone layers from 4 to 3, we construct a model compression backbone structure, the SSA architecture; This approach not only reduces the parameter size but also minimizes the excessive compression of small-scale defect feature information during transmission through deep layers. Second, we designed a RepDyFPN neck structure based on a dynamic upsample and multi-scale feature fusion to replace the original neck module, thereby integrating feature information from different scales and enhancing the model’s ability to represent defect features at various scales. Finally, the reconstructed model is compressed using the LAMP method to reduce the model’s floating-point operations, the number of parameters, and the magnitude of weights, thereby improving the model’s compression performance. Collectively, these optimizations enable the SSAD-YOLOv8s-Prune model to achieve state-of-the-art performance in small-scale fresh corn cob defect detection.
The experimental results show that, by integrating all optimization strategies, the model designed in this study achieves an accuracy of 96.1%, a recall of 94.7%, an mAP50 of 96.0%, an mAP50–95 of 62.8%, with 1.80 million parameters, 15.9 GB of floating-point operations, and a model size of 3.84 MB. Compared with mainstream detection models such as Faster-RCNN, RT-DETR-R50, YOLOv5s, YOLOv6s, YOLOv9s, YOLOv10s, YOLOv11s, and YOLOv12s, the model proposed in this paper achieves the highest detection accuracy and the best model compression performance. Compared with the baseline YOLOv8s, our detection model improves precision by 1.3 percentage points, recall by 1.6 percentage points, mAP50 by 1.1 percentage points, and mAP50–95 by 4.1 percentage points, while reducing model parameters by 83.8%, FLOPs by 44.0%, and model size by 82.1%. The SSAD-YOLOv8s-Prune model proposed in this study outperforms other models in detection accuracy while having the lowest number of parameters and the fewest floating-point operations among all compared models.
Fresh corn cobs exist in numerous varieties, and defect manifestations vary slightly across varieties with distinct color characteristics. Currently, no public datasets are available for fresh corn cob defect detection, so our model has only been validated on white corn cobs and has not been tested for adaptability to other colored varieties. Future work will focus on three directions: expanding the dataset to include more corn varieties, evaluating the model’s cross-variety adaptability, and improving its robustness via preprocessing optimization and architectural adjustments.
Author Contributions
Conceptualization, Y.Z. and T.H.; methodology, E.Z.; software, Z.Z.; validation, E.Z., Y.L. and X.L.; formal analysis, Z.Z.; investigation, X.L.; resources, Y.Z.; data curation, Z.Z.; writing—original draft preparation, Y.L.; writing—review and editing, X.L.; visualization, Y.L.; supervision, X.L.; project administration, Y.Z.; funding acquisition, T.H. All authors have read and agreed to the published version of the manuscript.
Funding
This work was supported by the National Key Research and Development Program of China (Grant No. 2023YFD2001301); the Independent Research and Development Project of Academy of Agricultural Planning and Engineering, Ministry of Agriculture and Rural Affairs (Grant No. SP202402); and the Key Laboratory of Agro-Products Primary Processing, Ministry of Agriculture and Rural Affairs (Grant No. KLAPPP2024-01).
Institutional Review Board Statement
Not applicable.
Informed Consent Statement
Not applicable.
Data Availability Statement
The original contributions presented in this study are included in the article. Further inquiries can be directed to the corresponding authors.
Conflicts of Interest
The authors declare no conflicts of interest.
References
- Yan, J.B.; Zhao, J.R. Dense Planting for High Yield-The Key Goal of Maize Breeding in China. Biotechnol. Bull. 2023, 39, 1–3. Available online: https://biotech.aiijournal.com/EN/Y2023/V39/I8/1 (accessed on 1 March 2026).
- Xu, L.; Lu, B.S.; Shi, Y.X.; Pan, Y.L.; Zhao, J.R. Development Status and Prospect of ‘15th Five-Year Plan’ of Sweet Corn Industry in China. Vegetables 2026, 1, 11–21. [Google Scholar] [CrossRef]
- Zhang, R.Q.; Yang, N.; Zhang, Y.F. An automatic grading method for apples based on improved CNN-SVM and machine vision. Food Mach. 2025, 41, 75–81. [Google Scholar] [CrossRef]
- He, T.T.; Yao, J.C.; Zhang, L.L.; Lu, T.G.; Yue, H.F. Tomato surface defect detection method based on image local variance considering brightness correction. Food Mach. 2023, 39, 128–133+161. [Google Scholar] [CrossRef]
- Fu, J.; Yuan, H.K.; Zhao, R.Q.; Zhi, C.; Ren, L.Q. Peeling damage recognition method for corn ear harvest using RGB image. Appl. Sci. 2020, 10, 3371. [Google Scholar] [CrossRef] [Scilit]
- Meng, F.J.; Luo, S.; Sun, H.; Li, M.Z. Design and experiment of real-time detection and sorting device for maize seeds. Trans. Chin. Soc. Agric. Mach. 2021, 52, 153–159,177. [Google Scholar] [CrossRef]
- Asaduzzaman, M.; Uddin Bhuiyan, M.J.; Rimi, H.A.; Islam, M.R. A Hybrid CNN Architecture for Efficient Detection of Maize Plant Diseases. In Machine Vision in Plant Leaf Disease Detection for Sustainable Agriculture; Springer Nature: Singapore, 2025; Volume 1202, pp. 69–79. [Google Scholar] [CrossRef] [Scilit]
- Thiju Mashrock, D.; Gokila, S. Green Chili Classification using Deep Learning Models: CNN and VGGNet. In Proceedings of the 2025 International Conference on Inventive Computation Technologies (ICICT); IEEE: Piscataway, NJ, USA, 2025; pp. 668–675. [Google Scholar] [CrossRef] [Scilit]
- Yu, Y.; Zhang, K.L.; Yang, L.; Zhang, D.X. Fruit detection for strawberry harvesting robot in non-structural environment based on Mask-RCNN. Comput. Electron. Agric. 2019, 163, 104846. [Google Scholar] [CrossRef] [Scilit]
- Han, X.W.; Zhou, J.M.; Gao, Y.B.; Tian, X.H.; Li, M.J.; Hao, Y.J.; Li, W.; Li, S.B.; Liu, S.Z. Research on refined selection method for maize seeds based on machine vision technology. Crops 2024, 6, 242–248. [Google Scholar] [CrossRef]
- Guan, B.L.; Wu, Y.Q.; Zhu, J.B.; Kong, J.J.; Dong, W. GC-Faster RCNN: The Object Detection Algorithm for Agricultural Pests Based on Improved Hybrid Attention Mechanism. Plants 2025, 14, 1106. [Google Scholar] [CrossRef] [Scilit]
- Gangadevi, E.; Soufiane, B.O.; Balusamy, B.; Khan, F.; Getahun, M. A novel hybrid fruit fly and simulated annealing optimized faster R-CNN for detection and classification of tomato plant leaf diseases. Sci. Rep. 2025, 15, 16571. [Google Scholar] [CrossRef] [Scilit] [PubMed]
- Huang, Z.B.; Li, X.H.; Fan, S.T.; Liu, Y.; Zou, H.A.; He, X.C.; Xu, S.; Zhao, J.H.; Li, W.F. ORD-YOLO: A Ripeness Recognition Method for Citrus Fruits in Complex Environments. Agriculture 2025, 15, 1711. [Google Scholar] [CrossRef] [Scilit]
- Zhao, Z.W.; Zhang, Y.L.; Han, Z.Y.; Liu, X.; Zhu, G.; Shi, J.; Li, J.; Li, Y. Lightweight model for detecting fresh corn cobs quality using improved SS-YOLOv8. Trans. Chin. Soc. Agric. Eng. 2025, 41, 183–192. [Google Scholar] [CrossRef]
- Yuan, J.; Fan, J.; Sun, Z.K.; Liu, H.T.; Yan, W.L.; Li, D.H.; Liu, H.; Wang, J.X.; Huang, D.Y. Deployment of CES-YOLO: An Optimized YOLO-Based Model for Blueberry Ripeness Detection on Edge Devices. Agronomy 2025, 15, 1948. [Google Scholar] [CrossRef] [Scilit]
- Yang, L.L.; Liu, C.M.; Wang, C.L.; Wang, D. Maize kernel quality detection based on improved lightweight YOLOv7. Agriculture 2024, 14, 618. [Google Scholar] [CrossRef] [Scilit]
- Hu, Q.; Zhang, Y.H. GCS-YOLO: A Lightweight Detection Algorithm for Grape Leaf Diseases Based on Improved YOLOv8. Appl. Sci. 2025, 15, 3910. [Google Scholar] [CrossRef] [Scilit]
- Zhang, W.R.; Du, Y.F.; Li, X.Y.; Liu, L.; Wang, L.Z.; Wu, Z.K. Research on online detection method of corn kernel harvest quality based on FSLYOLOv8n. Trans. Chin. Soc. Agric. Mach. 2024, 55, 253–265. [Google Scholar] [CrossRef]
- Chen, D.; Lin, F.; Lu, C.; Zhuang, J.; Su, H.; Zhang, D.; He, J. YOLOv8-MDN-Tiny: A lightweight model for multi-scale disease detection of postharvest golden passion fruit. Postharvest Biol. Technol. 2025, 219, 113281. [Google Scholar] [CrossRef] [Scilit]
- Zhang, X.A.; Qiao, H.B.; Xi, L.; Ma, C.; Xu, X.; Hui, X.; Tang, Q.; Zhang, H. Detecting Small Objects for Field Crop Pests Using Improved YOLOv8. Trans. Chin. Soc. Agric. Eng. 2025, 41, 225–233. [Google Scholar] [CrossRef]
- Hou, W.H.; Gong, C.Z.; Cao, W.H.; Tang, Q.; Wang, Y.; Gao, J.; Liu, L. Tomato Leaf Disease Detection Method Based on Super-Resolution Enhancement and Improved YOLOv8. Trans. Chin. Soc. Agric. Eng. 2025, 41, 211–220. [Google Scholar] [CrossRef]
- Huang, X.L.; Wen, S.X. Research on Small Object Detection Models Based on YOLO Series. J. Appl. Technol. 2025, 25, 142–149. [Google Scholar] [CrossRef]
- Li, L.H.; Wang, Y.Z.; Wu, Y.Z.; Bao, Y.; Huang, J.; Huang, Y.; Li, Y.; Shi, J.; Xi, D.; Ji, W. Lightweight Maize Disease Detection Method Based on Pruning and Distillation. Trans. Chin. Soc. Agric. Eng. 2025, 41, 194–202. [Google Scholar] [CrossRef]
- Yang, S.; Zhang, P.C.; Wang, L.; Tang, L.; Wang, S.; He, X. Identifying Tomato Leaf Diseases and Pests Using Lightweight Improved YOLOv8n and Channel Pruning. Trans. Chin. Soc. Agric. Eng. 2025, 41, 206–214. [Google Scholar]
- Pan, Z.G.; Qiu, B.H.; Yang, R.B.; Zhang, H.; Zhang, J.; Li, Y.; Deng, Z. Potato Pickup Harvesting Impurity Detection Method Based on PLP-Net Lightweight Model. Trans. Chin. Soc. Agric. Eng. 2025, 41, 208–218. [Google Scholar] [CrossRef]
- Zhao, Z.Y.; Wang, X.Q.; Ma, J.; Xing, Y.J.; Dun, X.; Wang, Z.S.; Cheng, X.B. Edge Chip Deployment Methods for Lightweight Infrared Computational Imaging Reconstruction Algorithms. Air Space Def. 2025, 8, 85–93. [Google Scholar]
- Sapkota, R.; Flores-Calero, M.; Qureshi, R.; Badgujar, C.; Nepal, U.; Poulose, A.; Zeno, P.; Vaddevolu, U.B.P.; Khan, S.; Shoman, M.; et al. YOLO Advances to Its Genesis: A Decadal and Comprehensive Review of the You Only Look Once (YOLO) Series. Artif. Intell. Rev. 2025, 58, 274. [Google Scholar] [CrossRef] [Scilit]
- Li, X.; Liu, Q.; Kuang, M.; Pan, J.; Liu, D.; Xiang, Y.; Xie, F. Detecting chili pepper fruits in a natural environment using improved YOLOX. Trans. Chin. Soc. Agric. Eng. 2024, 40, 119–126. [Google Scholar] [CrossRef]
- Tong, K.; Wu, Y.; Zhou, F. Recent advances in small object detection based on deep learning: A review. Image Vis. Comput. 2020, 97, 103910. [Google Scholar] [CrossRef] [Scilit]
- Hussain, M. YOLO-v1 to YOLO-v8, the rise of YOLO and its complementary nature toward digital manufacturing and industrial defect detection. Machines 2023, 11, 677. [Google Scholar] [CrossRef] [Scilit]
- Zhang, L.L.; Jiang, Y.; Sun, Y.P.; Zhang, Y.; Wang, Z. Improvements based on shuffleNetV2 model for bird identification. IEEE Access 2023, 11, 101823–101832. [Google Scholar] [CrossRef] [Scilit]
- Liu, S.; Shao, F.; Chu, W.; Dai, J.; Zhang, H. An Improved YOLOv8-Based Lightweight Attention Mechanism for Cross-Scale Feature Fusion. Remote Sens. 2025, 17, 1044. [Google Scholar] [CrossRef] [Scilit]
- Xu, X.; Jiang, Y.; Chen, W.; Huang, Y.; Zhang, Y.; Sun, X. Damo-yolo: A report on real-time object detection design. arXiv 2022, arXiv:2211.15444. [Google Scholar] [CrossRef] [Scilit]
- Liu, W.Z.; Lu, H.; Fu, H.T.; Cao, Z.G. Learning to Upsample by Learning to Sample. arXiv 2023, arXiv:2308.15085. [Google Scholar]
- Lin, Y.; Xiao, X.; Lin, H. YOLOv8-FDA: Lightweight wheat ear detection and counting in drone images based on improved YOLOv8. Front. Plant Sci. 2025, 16, 1682243. [Google Scholar] [CrossRef] [Scilit]
- You, H.; Wang, H.; Wei, Z.; Bi, C.; Zhang, L.; Li, X.; Yin, Y. VBP-YOLO-prune: Robust apple detection under variable weather via feature-adaptive fusion and efficient YOLO pruning. Alex. Eng. J. 2025, 128, 992–1014. [Google Scholar] [CrossRef] [Scilit]
- Tian, Y.; Qin, S.; Yan, Y.; Wang, J.; Jiang, F. Detecting blueberry maturity under complex field conditions using improved YOLOv8. Trans. Chin. Soc. Agric. Eng. 2024, 40, 153–162. [Google Scholar] [CrossRef]
- Liu, Y.; Hu, Y.; Cao, G.; Wang, J. SENet: Super-resolution enhancement network for crowd counting. Pattern Recognit. 2025, 162, 111420. [Google Scholar] [CrossRef] [Scilit]
- Yang, L.X.; Zhang, R.Y.; Li, L.; Xie, X.H. SimAM: A simple, parameter-free attention module for convolutional neural networks. In Proceedings of Machine Learning Research; PMLR: Cambridge, MA, USA, 2021; pp. 11863–11874. [Google Scholar]
- Cai, X.H.; Lai, Q.X.; Wang, Y.W.; Wang, W.G.; Sun, Z.R.; Yao, Y.Z. Poly Kernel Inception Network for Remote Sensing Detection. In 2024 IEEE/CVF Conference on Computer Vision and Pattern Recognition (CVPR); IEEE: Piscataway, NJ, USA, 2024; pp. 27706–27716. [Google Scholar] [CrossRef] [Scilit]
- Rana, P.B.; Thapa, S. Comparative study of object detection models for fresh and rotten apples and tomatoes: Faster R-CNN, DETR, YOLOv8, and YOLOv12S. In 2025 International Conference on Inventive Computation Technologies (ICICT); IEEE: Piscataway, NJ, USA, 2025; pp. 660–667. [Google Scholar] [CrossRef] [Scilit]

Disclaimer/Publisher’s Note: The statements, opinions and data contained in all publications are solely those of the individual author(s) and contributor(s) and not of MDPI and/or the editor(s). MDPI and/or the editor(s) disclaim responsibility for any injury to people or property resulting from any ideas, methods, instructions or products referred to in the content. |
© 2026 by the authors. Licensee MDPI, Basel, Switzerland. This article is an open access article distributed under the terms and conditions of the Creative Commons Attribution (CC BY) license.