


Abstract
It is necessary to understand the complicated interplay between diseases and medicinal plants to find new curing agents that may be used in natural sources. Nevertheless, the state of interaction between diseases and plants today is not fully developed yet, and the potentially productive plant-based treatment can hardly be identified rationally. In order to elaborate on this challenge, we will offer a heterogeneous network approach to the prediction of novel disease–plant associations by using the Random Walk with Restart (RWR) algorithm. The framework combines three significant relational networks, including (i) a disease–plant association network, which has been built using curated literature and biological databases, (ii) a disease–disease similarity net, which is constructed using shared symptoms and therapeutic profiles, and (iii) a plant–plant similarity net using phytochemical and functional similarities. These elements are integrated into a homogeneous graph that is heterogeneous in nature, and thus, information flows through related nodes. The model begins by finding RWR between known disease or plant nodes and develops the network by exploring the graph further to make estimates of the probability of association between disease and plant networks that were not previously connected. Experimental tests show that the proposed model has an excellent predictive ability, ROC-AUC of 0.9987, PR-AUC equal to 0.915, and Precision = 10 of 1.0, significantly better than the results of the base models, including Random- and Degree-based models. The bootstrap analysis supported the strength of the model as the mean ROC-AUC was 0.9987 with a standard deviation of 0.00051. The suggested structure offers an effective computational methodology to systematically explore disease–plant interactions to aid in finding novel herbal drugs to treat diseases and speed up the drug discovery process by means of inference based on networks.
1. Introduction
Plant diseases present a persistent and grave challenge to food security, agricultural and economic stability of the world. It is estimated that between 20 and 40 percent of the world’s crop is lost every year following the emergence of pathogens, pests and epidemics that are enhanced by climate change and the fast development of pathogens [1,2,3]. The time-consuming, labor-intensive, and cost-prohibitive aspect of traditional experimental screening of effective disease–plant treatment strategies is especially problematic through the enormous and ever-growing biological environment of pathogenic species and crop varieties [4,5]. Therefore, quantitative forecasting of new disease–plant interactions has become a highly important research agenda to hasten the breeding of disease resistance in plants and integrated disease management in plants [6,7,8]. The network-centric viewpoint makes it possible to infer unknown interactions based on known interactions, assuming that biologically similar entities are functionally relevant to each other [9]. Mapping disease–plant association networks: In the agricultural sciences, disease–plant association networks encode interactions in which specific plants are resistant, tolerant, or susceptible to particular diseases. The use of such data through computational models makes it easy. Nevertheless, disease–plant datasets are still scarce in terms of their availability and completeness, compared to human biomedical networks, and hence making them difficult to predict as a result of noise, disproportion, and value gaps in the datasets [10,11,12].
The majority of the previous models concentrate on bipartition networks between diseases and plants without paying attention to the underlying biological associations. RWR now forms one of the strongest graph-based learning methods in bioinformatics [13,14,15]. Based on the Markov chain theory, a random walker iteratively switches to adjacent nodes according to the network topology. With repeated repetitions, nodes that the walker frequently travels to are given higher association scores, which are strong potential linkages. WR has been highly successful in predicting drug targets, disease genes, microbe–disease relationships, and protein function discovery [16,17,18], yet little has been done to apply it in agriculture and plant pathology. Previous computational disease–plant studies are mostly supervised by machine learning or shallow similarity-based scoring, which relies on the availability of a large amount of labeled data and requires manual feature engineering [19,20,21]. These methods are ineffective when the data on interactions are scarce, which is usually the case with plant disease research. The methods used in identifying the disease in the plants include laboratory-based pathogen isolation, microscopy-based identification, molecular diagnostic (e.g., PCR and ELISA) and field-based methods of phenotypic observation. Although factual, these methods are frequently lengthy, manual and costly, particularly when a great deal of screening of the interactions between plant–disease needs to be undertaken. Conversely, the suggested heterogeneous network-based Random Walk with Restart (RWR) model provides a computational alternative that can operate in a highly effective way to provide a possible disease–plant association based on known biological relationships and network topology. The proposed method allows predicting the outcome on a large scale, creating hypotheses more quickly and cheaply, and validating the potential discovery of disease-resistant plant candidates, which is impossible through the traditional approaches to experimentation that demand substantial laboratory validation.
Plant diseases are a major concern for the productivity and food security of the world economy, especially in crops of economic value like Cotton. Proper and early detection of plant diseases is thus critical in the management of diseases and protection of crops. These techniques have been broadly adopted in disease detection of pathogens causing diseases like Cotton Leaf Curl Virus, bacterial blight, and Fusarium wilt. These methods may be reliable, but they tend to be time-consuming, laborious, and may need specialized laboratory equipment and specialized expertise, and hence cannot be scalable to large agricultural areas [1,2,3,22,23,24]. In recent years, progress in machine learning and deep learning-based plant disease detection systems has made it possible to conduct automated diagnosis based on image analysis and sensor-based monitoring. Nevertheless, they are usually based on huge labeled datasets and can be difficult to identify more complex biological interactions between plants and pathogens, especially in cases where interaction data are small or sparse [4,5,6,25,26,27]. To address these shortcomings, more attention has been given to network-based computational methods to predict biological associations. Random Walk with Restart (RWR) is one of such methods and is a graph-based algorithm that has been extensively utilized in bioinformatics to deduce possible associations by investigating network topology. RWR is a model that mimics a random walker that sequences the nodes of a nonhomogeneous network, and every now and then is able to travel back to the start node, thus catching both local and global structural links in biological networks [7,8,9,28,29,30]. RWR can also be successfully used in the context of plant pathology, as the disease–disease similarity, plant–plant similarity, and known plant–disease interactions can be effectively combined to discover new candidate relationships. RWR-based approaches offer a more powerful data-driven framework when compared to traditional experimental techniques and conventional supervised learning models, and are able to utilize heterogeneous biological data to derive stronger predictions, not necessarily with relying on large labeled datasets. Based on the same idea, the suggested research implements a heterogeneous network structure with the help of Random Walk with Restart to forecast new disease–plant relations to present a more convenient and resource-efficient approach to finding possible disease-resistant Cotton types and promoting sustainable crop protection.
In this proposed research method, the following are the major contributions of this study. Formulation of an all-inclusive heterogeneous network that combines disease–disease similarity, plant–plant similarity and known disease–plant associations. Random Walk with Restart is implemented in heterogeneous agricultural biological systems with custom parameters. We have also validated comparatively with baseline models and have obtained ROC-AUC: 0.999, PR-AUC: 0.915 and High Precision@K scores that show the high quality of ranking. The delivery of the projected ranking of the association allows a feasible choice of resistant plant candidates to be examined in the laboratory. Primarily, the research presents an original, data-saving, and interpretable graph-based model in predicting unknown disease–plant association. Our solution provides encouraging suggestions for crop disease resistance studies and sustainable food production by leveraging heterogeneous networks’ structural information and the global power of RWR to make inferences.
2. Materials and Methods
2.1. Overview of the Framework
The offered framework incorporates various biological links into a heterogeneous network so that new links between diseases and plants could be predicted. Throughout the workflow, there are five large stages, as it is shown in Figure 1; the workflow includes the following five significant stages:
Figure 1.
Framework model of disease–plant association network.
- Dataset construction and extraction.
- Building of the disease–disease (DD) [31] and plant–plant (PP) similarity networks [32].
- Addition of a heterogeneous bipartite graph of disease–plant (DP) relationships.
- Use of the Random Walk with Restart (RWR) algorithm in order to propagate association [33].
- Proposed model validation and evaluation.
2.2. Datasets Construction and Extraction
Three datasets were selected in publicly available and experimentally tested sources (e.g., NCBI, KEGG, PubChem, PlantGDB and the literature). The fundamental data set consists of experimentally confirmed links of 46 disease nodes and 81 plant nodes, and it totals 1085 known associations.
In the constructed network, the number of nodes and number of edges are 134 and 2456 respectively, which represents a combination of disease similarity relationship, plant similarity relationship, and disease–plant interaction relationship. The disease–disease similarity network has 46 nodes and 525 edges within the layer of disease, and this implies that there is a very high level of connectivity amongst disease entities. These links are symbolized as similarities or common features of diseases and they are used to spread information amongst related disease nodes in the random walk process. On the same note, the plant–plant similarity network has 81 nodes and 1809 edges, which form a dense network that comprises structural relationships among medicinal plants. This layer has many edges, implying that the nodes represent a high level of connection between plants, which could be due to either the similarity in phytochemical, therapeutic, or biological characteristics. This kind of connectivity is significant in facilitating the RWR algorithm to search for indirect associations within the plant network.
An integration of these two similar networks of these similarities with the disease–plant interaction layer produces a single heterogeneous graph that facilitates the spread of information between the various types of biological entities. The ensuing network is connected enough and informative enough to do graph based learning and link prediction tasks. The resultant topology of 46 disease nodes, 81 plant nodes and 2456 total edges presents a healthy basis to assess the ability of the RWR model to identify the local and global structural dependencies in the intricate biologic network.
2.3. Disease–Disease Similarity (DDS)
The similarity of diseases was determined using similar etiology, tissues involved, the ones affected, or the pathogenic mechanism. To measure pairwise relations, Cosine similarity or Jaccard index (SDD) was employed [34]:
F(Di) is the set of features (e.g., pathogen, gene, or symptom profile) of disease Di.
2.4. Plant–Plant Similarity (PPS)
Similarity of plants was calculated based on phytochemical composition, gene ontology and overlapping of therapeutic targets [34]:
where C(Pi) refers to the collection of bioactive compounds of plant Pi.
2.5. Disease–Plant Associations (DPA)
The fundamental data set consists of experimentally confirmed links of 46 disease nodes and 81 plant nodes, and it totals 1085 known associations.
Each record is defined as follows:
Pj “is said to be curative or defensive to disease” D_i in the presence of di-Pj “if plant” Pj.
2.6. Construction of the Heterogeneous Network
The associated heterogeneous graph G (V, E) is the heterogeneous graph that comprises three subgraphs [35]:
VD and VP represent disease and plant nodes, respectively. The EDD, EPP, and EDP edges represent the intra- and inter-class associations (disease–disease, plant–plant and disease–plant). The adjacency matrix of the network as a whole is stated as
in which each submatrix represents pairwise relations:
- : disease–disease similarity;
- : plant–plant similarity;
- : known disease–plant interactions.
The adjacency matrix was brought to normal form so that transition probabilities were equal between the heterogeneous space:
where D is the diagonal degree matrix shown as .
2.7. Random Walk with Restart (RWR) Algorithm
The Random Walk with Restart (RWR) algorithm is an algorithm that can be used to approximate predictive random walks within a network (Yang, Yanlin, et al., 2026) [36]. The RWR algorithm was applied to the heterogeneous graph to predict the new disease–plant associations [37]. In every iteration, the walker has a probability of going to an adjacent node or a probability of going back to the starting seed node r.
We utilized the RWR iterative process precisely in the experimental formula as
where
= the probability distribution at time t.
A is the transition matrix normalized in columns.
is the starting probability vector (node of seed).
is the probability of restart (usually parameters are 0.5–0.7).
The steady-state probability vector p* represents the end result of association score (between each disease and plant node).
2.8. Comparison with Existing Disease-Gene, Drug-Target, and Crop-Disease Network Models
Based on this recommendation, we have amended the paper so as to present a more explicit comparison of the proposed framework with the network-based prediction models reported in the past. In particular, a part of the literature on disease-gene association prediction and drug-target interaction prediction has been relying on heterogeneous biological networks with algorithms including Random Walk with Restart (RWR) or network diffusion algorithms. Nevertheless, methods are generally built upon human biomedical data with network layers frequently comprising gene-gene interactions, protein–protein interactions, drug-target connections and disease similarity networks.
Conversely, the current research results in the plant pathology field where the accessible biological data structures and patterns of interaction are vastly different as compared to the human biomedical systems. The key innovations of this work may be summed up as follows:
Our study is based on a heterogeneous network that is specially tailored to predict disease–plant interaction as opposed to traditional disease-gene or drug-target networks. This network combines three biological relationship layers that are complementary to each other:
- Similarity of diseases with disease (D-D);
- Plant–plant similarity (P-P);
- Disease–plant associations (D-P).
Heterogeneous network building, Domain-specific.
The heterogeneous network model used in biomedical studies in the past usually utilizes molecular interaction data, including gene regulation or protein interactions. In opposition, our network construction is based on plant pathology characteristics, such as pathogen specifications, symptom characteristics and plant biochemical resemblance, which are particularly pertinent to the disease forecasting of crops.
Use of RWR in prediction of diseases of plants.
Although Random Walk with Restart has enjoyed extensive use in biomedical network analysis, little has been done in the context of heterogeneous plant disease-host association networks. RWR, in this case, is adjusted to spread association probabilities on disease similarity, plant similarity, and disease–plant interaction layers, and therefore, it is possible to find possible disease–plant interactions by using direct and indirect network associations.
2.9. Model Evaluation
To measure the strength of the model, bootstrap resampling (n = 1000) and Leave-One-Out Cross-Validation (LOOCV) were used to assess the model [38]. The performance measures are as follows.
In this step, we computed ROC-AUC based on the following formula:
The ability of true and false associations is discriminative.
After then computed PR-AUC for Precision and Recall with AUC. Its performance is accurate as opposed to Recall performance, particularly where data is skewed. Precision@K: Finally, r i is the estimated position of the actual correlated vegetation. Every assessment showed good predictive ability.
2.10. Implementation Details
The network was built in Python 3.12 with the help of NetworkX 3.6.1, NumPy 2.4.3 and Pandas 3.0.1 libraries [39]. A heterogeneous adjacency matrix was built on csv files that contained pairwise associations and sparse linear algebra was optimized to perform the matrix operations. All calculations were done on the system using an Intel Core i7 processor, 32 GB RAM, and a Windows 11 environment. The anticipated relationships were tabulated in a hierarchical CSV file to be used later in analysis and visualization.
3. Results and Discussion
3.1. Overview of Experimental Setup
In order to evaluate the predictive quality of the proposed heterogeneous network model, extensive experiments involving curated disease–plant association data and similarity information on disease and plant spaces were performed. Semantic relationships of the Medical Subject Headings (MeSH) ontology [40] were used to compute the disease–disease (DD) similarities, but the similarities between plants and plants (PP) were computed using the structural and pharmacological similarity of the bioactive compounds of plants.
Experimentally validated databases, including DisGeNET [31], CTD [41] and the HerbalDB [42], were used to gather the disease–plant (DP) associations. All the similarity matrices were processed and normalized, and then all the similarity matrices were incorporated into a single heterogeneous bipartite graph.
This graph was run through a Random Walk with Restart (RWR) algorithm to pass association scores between disease and plant nodes. The probability of restarting r = 0.5 was selected empirically to balance the global and the local information flow in accordance with the traditional practices of network-based inference. Grid search was used to tune the model parameters, and five-fold cross-validation was used to evaluate the performance of the model.
3.2. Model Performance Evaluation
To test the model, we have used several ranking-based measures, such as Area Under the Receiver Operating Characteristic Curve (AUC), Area Under the Precision–Recall Curve (AUPR), and Top-k Hit Ratio. As Table 1 indicates, the proposed framework had an average AUC of 0.947 and AUPR of 0.921, exceeding the same parameters of the baseline approaches (Common Neighbors (CN) [33], Resource Allocation (RA) [43,44,45], and Katz Index (KZ) [46,47]) that had an average AUC of 0.873, 0.892, and 0.901, respectively. Such findings indicate the excellence of the introduction of multi-source similarities and propagation across global networks, as shown in Table 1.
Table 1.
Performance comparison between baseline algorithms and the proposed heterogeneous network-based RWR framework.
3.3. Findings and Discussion Disease–Disease Network Analysis and Random Walk with Restart (RWR)
The dataset was loaded and analyzed, and it contained 150 records that included the association between plants and diseases. This dataset consists of 49 distinct plant diseases and 85 distinct plant species, which is a valuable resource in studying the relationships among diseases by having common plant hosts, and may also serve as an underlying tool of study molecular mechanisms [47].
3.3.1. Building of the Bipartite and Disease–Disease Association Networks
A bipartite graph was created to examine the associations between diseases and associated plant species [48]. Bipartite graphs are also extremely popular in network biology and are used to describe the interactions between two different classes of objects, in this case, diseases and plants. Out of this bipartite structure, a disease–disease network was obtained, where the bipartite graph was projected onto the disease nodes. In this projection, the weight of edges between diseases is encouraged using the number of shared plants and also using the number of shared genes, which conveys the hypothesis that diseases that share common hosts or common molecular characteristics are probably more functionally or etiologically related to each other.
The disease–disease network resulting from this has 49 nodes (diseases) and 540 weighted edges, implying that it is a highly interconnected network in which quite a number of diseases have common plant hosts or common genes. It was saved in the form of an edge list (disease–disease-associations edge list) and an adjacency matrix (disease–disease adjacency), which makes downstream computational tasks and reproducibility easier, as shown in Figure 2.
Figure 2.
Disease–disease association network.
3.3.2. Random Walk with Restart Analysis
Random Walk with Restart (RWR) was used to obtain the disease–disease network to measure the proximity or similarity between diseases quantitatively. RWR is a node ranking algorithm [49] that is often applied to systems biology and bioinformatics to rank nodes according to their closeness to a set of seed nodes. The stationary distribution of the walker, with repeated simulation, gives a score of the possibility of association between nodes. In this analysis, RWR was run on all disease seeds to produce pairwise RWR scores, which are used to measure the similarity of disease pairs based on shared plant and gene attributes, as based on the RWR Ranl algorithm received in Table 2.
Table 2.
Top 10 disease–disease association network scores based on RWR ranking algorithm.
The RWR-based disease–disease similarity network provides an effective model to predict new disease associations: when diseases are found to have high RWR scores in their comparisons, this could indicate possible comorbidities or similar ecological niches. Drug or plant intervention strategies based on networks: The strategies of crop protection, disease management, or breeding selection can be informed by understanding the relationship between diseases using a shared host. All in all, the bipartite graph modeling and RWR offer a powerful and understandable method of explaining disease relationships in an ecological manner with the incorporation of ecological and molecular data. The algorithm can be applied to big datasets and extrapolated to other disease–host or disease–gene networks.
3.4. Findings and Discussion: Plant–Plant Association Network and Random Walk with Restart (RWR) Analysis
An analysis of 150 records was done, and this represented records of associations of 85 different plant species and 49 different plant diseases. This was aimed at determining underlying functional or ecological associations among plant species using similarity in susceptibility to diseases and interactions between genes.
3.4.1. The Bipartite and Plant–Plant Network Construction
To start with, a bipartite graph was prepared to show the association between diseases and plants. In this graph, the plant species and the plant diseases are represented by a set of nodes, where their relationship is reported by the edges. This dualist network topology can be used to investigate the indirect links between plants in a systematic manner by using common vectors of disease or genetic pathways. In order to explore relationships between plants, the bipartite graph was projected on the plant node set to produce the plant–plant network. The edge between two plant nodes in this projected network indicates the existence of one or more diseases and perhaps similar genes in them. The outcome obtained was a plant–plant network with 85 nodes and 1895 weighted edges, which suggested that it is highly connected and many plant species have similar disease associations, as shown in Figure 3. The high interconnectedness provides the possibility that some pathogen species have a wide host range and that cross-species susceptibility might be promoted by genetic or environmental factors. The weighted edge list was saved in the form of plant–plant associations. The edge list and the resulting adjacency matrix (size 85 × 85) were saved as plant–plant-adj.npy to enable a computationally reproducible network and additional network-based analysis.
Figure 3.
Plant–plant association network.
3.4.2. Random Walk with Restart on the Plant–Plant Network
In order to measure the topological similarity and possible similarity of plant species in the network, a Random Walk with Restart (RWR) algorithm was used. RWR is a diffusion-based methodology that is commonly used in systems biology to determine the global connectivity and to predict the similarity of functionality across nodes in a network. Theoretically, a random walker begins at a particular node (initial plant) and repeatedly moves to its neighbors with a probability that is proportional to the weight of the edge between them. The walker also possesses a fixed probability of returning to the seed node (the restart step) at each step, such that local neighborhood information is maintained whilst incorporating global network topology. The steady-state probability distribution of the RWR process is mathematically the score of the proximity between the seed node and the rest of the network nodes. The occurrence of high scores in the RWR scores implies that two plants have similar disease or gene association patterns and hence they are likely to be functionally or ecologically related, as shown in Table 3.
Table 3.
Top 10 plant–plant association network scores based on RWR ranking algorithm.
These large RWR scores would indicate that Okra, Chili, and Raspberry have a large overlap with disease associations, and they may have similar gene expression patterns in response to pathogenic stress. This may be a sign of mutually dependent exposure to common viral agents (like mosaic viruses) or convergence of defensive mechanisms on the molecular level. The various interconnections between the Cotton cultivars (e.g., Cotton FH-142, CIM-343, CIM-496, BT varieties) indicate a compressed subnetwork of Cotton-related nodes with high intra-group similarity. This suggests that genetically different varieties of Cotton can have shared gene targets or resistance pathways to determine their response to shared pathogens.
3.4.3. Biological Interpretations and Applications
The analysis of the plant–plant network using the RWR approach can be used to offer useful information on plant similarity in terms of shared disease and genetic landscapes. The researchers can determine the possible host ranges of new plant diseases using the identification of plants that are closely clustered in the network, which will inform early detection and containment intervention. Breeding: The breeding period of the Nile is its strongest in April and July. Crop Management: This breeding season is optimal in July and April. Close relatedness of the Cotton cultivars implies that resistance genes can be cross-utilized. Such information about networks can be used by breeders to develop disease-resistant hybrids. The fact that closely related plants (e.g., Okra, Chili and Raspberry) have a similar appearance suggests the possibility of using one species as a model organism to understand the mechanisms of a disease in another one, which would simplify the experiment. In general, network-based modeling combined with RWR analysis offers a holistic model of interrelationships between the plants.
3.4.4. Top Predicted Plant Associations for Cotton Leaf Curl Virus
Using the Random Walk with Restart (RWR) framework on the integrated disease–plant bipartite network, the model was further extended in order to predict potential plant associations for specific diseases. In this analysis, Leaf Curl Virus was selected as a seed disease node, and a diffusion process was applied throughout the whole graph to determine the plant species with the highest scores for proximity, as shown in Table 4.
Table 4.
The top predicted plant associations for Leaf Curl Virus are summarized as follows.
The next-level plants (Rice, Carrot, Peppers, Eggplant, and Watermelon) have moderate scores of associations. Such relationships could be the result of a conservation of viral replication mechanisms, similar means of transmission (e.g., Bemisia tabaci, the whitefly), or similar response pathways of the immune systems in these plants.
Lower-scoring associations (e.g., Strawberry, Blueberry, Melon and Mango) are weak or indirect network connections. These plants probably have little overlap of disease but may have an indirect link via other plant or gene nodes in the bipartite graph. While these associations have low confidence, they are of biologically significant relevance for the formation of hypotheses in the context of future host range expansion studies.
3.4.5. Significance of RWR-Based Predictions
The fact that Cotton is clearly at the top of the plant list speaks to the validity of the model against the empirical evidence. The ranked list shows the probabilistic evidence of the plants that can be used as a primary or secondary host for Leaf Curl Virus or viral strains of it. In summary, the prediction from RWR shows that Cotton is the key and most strongly associated host for Leaf Curl Virus and shows that several other plants are associated with a lesser, but significant probability. This demonstrates the ability of the network-based model, not only to reproduce known host–pathogen interactions but also to propose novel potential host–pathogen species for biological validation, supporting integrative approaches in plant disease prediction and control.
3.4.6. Planning of Plant Associations for the Target Disease
To analyze the potential plant hosts of a certain target disease, the Random Walk with Restart (RWR) was adopted to predict potential hosts according to the topological closeness of the integrated disease–plant bipartite network. By starting the RWR procedure from the target disease node the algorithm propagates influence through the network to find plant nodes most connected through shared nodes of disease, genes or interaction pathways. The obtained steady-state RWR scores measure the relative probability of the functional and/or biological association of each plant with the disease of interest. The most predicted associations are listed below and as shown in Table 5.
Table 5.
The top 10 predicted plant associations for the target disease.
The higher the RWR score, the closer the two nodes in the network, hence the stronger the relationship in their association and occurrence. The association of the most ranked plant Cotton IR-NIBGE-901 (RWR score: 0.5238) to the target disease is very dominant. This last, very high value means that this cultivar of Cotton is the major or most vulnerable host in a network context. The magnitude of this score also shows that the RWR framework is successfully able to capture real-world patterns of infection and confirm what is known about infections from epidemiological perspectives. Other fruits, like Melon (0.0349), Lettuce (0.0347), and Mango (0.0338), form the second-highest association cluster, which is showing medium topological proximity to the target disease. Their presence in the highest-ranked predictions describes the ability of the RWR algorithm to identify latent cross-species similarities, still to be experimentally validated, but fully consistent with virus–host co-evolution patterns. The second cluster, comprising Cotton CRIS-342, Cotton CIM-602, and Cotton NIBGE-3701, is from different Cotton cultivars, and each has RWR scores of approximately 0.032–0.034. These different varieties are likely to contain similar genomic regions conferring susceptibility or resistance to the target viral pathogen. Cotton IR-NIBGE-901 and associated cultivars are highly connected, and the results of using RWR to identify fine-scale intra-species relationships show that specific genotypes can be differentiated by common network proximity. The corresponding biological background knowledge for the RWR high-score pairs is provided in the Supplementary Materials (Section S1).
3.5. Heterogeneous Network Construction and Random Walk with Restart (RWR) to Predict Disease–Plant Association
A heterogeneous network-based structure was created and explored in terms of the Random Walk with Restart (RWR) algorithm to determine the novel and latent connections between crop diseases and plant species. The combined methodology will capture intra-layer (disease–disease and plant–plant) and inter-layer (disease–plant) interactions, and diffusion of the association probability throughout the entire biological network will be captured. The RWR algorithm was implemented with each disease in the network acting as a seed node, which generated the predicted association scores of all nodes acting as plants in the network. The heterogeneous system (with 134 total nodes: 49 diseases + 85 plants) consisted of 2456 weighted edges, which in fact connected inter- and intra-layer biological associations, as shown in Figure 4.
Figure 4.
Heterogeneous disease–plant association network. Disease–plant association network that was built in this study. Plant diseases are represented by red triangular nodes, whereas plant species are represented by blue circular ones. Gray edges denote known disease–plant associations that are utilized to construct the network, whereas orange ones denote the most promising candidate interactions that are derived with the help of the Random Walk with Restart (RWR) algorithm. The node size is related to the connectivity of the node in that large nodes imply more connected candidate diseases and plants.
3.5.1. Heterogeneous RWR Implementation and Production Output
The RWR algorithm was performed for each disease as a seed node, which produced the association scores of all plant nodes in the network that were predicted. The heterogeneous system had a total of 134 nodes (including 49 diseases and 85 plants) and 2456 weighted edges, which properly connected inter-and intra-layer biological connections.
The diffusion with RWR was able to predict biologically significant associations and focus on new disease–plant associations. Indicatively, the model made predictions on the strong association between Alternaria Blight and Cotton IR-NIBGE-901 with an association score of 0.0156, then Cotton CRIS-134 (0.0155) and Cotton BH-167 (0.0010).
In this manner, Leaf Curl Virus exhibited significant predicted effects (0.3335) on Cotton, (0.0132) on Rice, (0.0132) on Carrot (0.0128), and on Peppers, as per their viral susceptibility profile. Cotton IR-NIBGE-901 was the plant with the highest predicted RWR score (0.5237) in various disease contexts, indicating that it was at the center of the potential disease hub or joint infection target. Other plants, like Melon (0.0349), Lettuce (0.0347) and Mango (0.0338), were also termed as good candidates that would receive further biological confirmation.
3.5.2. Disease–Plant Association Predicted Score
The disease–plant association predicted Score is the quantitative predictability of the association between a particular disease and a particular plant species based on the Random Walk with Restart (RWR) algorithm on the heterogeneous disease–plant network. Every score indicates the likelihood of a random walker, starting at a disease node, visiting a single plant node, in steady-state equilibrium, upon completion of repeated propagation and restart processes of the integrated network.
In the heterogeneous graph framework, the decision made in terms of prediction is a score that measures the extent, both topologically and functionally, to which a plant is linked to a target disease, which considers both direct and indirect network links. Diffusion of association probabilities reinforces diseases that have a lot of common hosts or infection pathways, as well as plants, which have a lot of common disease susceptibility. Thus, an increased RWR score demonstrates a better likelihood of prediction, whether the specific plant could be a host or could be a host of the given disease.
In the given case of Alternaria Blight, the model calculates the probabilities that a disease node, in this case, is associated with all the plant nodes by stochastic traversal simulation on the disease–plant heterogeneous network. Connectivity strength of the disease–disease (D-D) and plant–plant (P-P) subnetworks, in addition to the bipartite disease–plant (D-P) layer, are included in the diffusion process, providing a probabilistic ranking of plants in terms of overall relevance to alternaria blight, as shown in Table 6.
Table 6.
The top predicted associations obtained the RWR scores.
3.5.3. Disease–Plant Association Heatmap
The given heatmap is an effective visual summary of a computational study that attempts to uncover possible relationships between a group of plants and a set of plant diseases. Color Gradient and Legend: Each cell is colored according to the strength of association that is expected between the disease and plant (the RWR score). Simply, this is a prioritization map. Based on the computational model, it will enable a researcher to quickly filter the number of prospective candidates of the plants that are likely to be effective in fighting a certain disease. The obtained scores were sorted into the following matrix. The RWR score at the cell at row i (Disease) and column j (Plant) will be the value of the starting point of disease i, to the plant node j. To produce this heatmap, this numerical matrix was transformed into the data in the following forms: the scores were mapped to the color palette of yellow–green–blue (YlGnBu), as shown in the legend.
The most notable aspect of the heatmap is that a huge portion of the heatmap is light yellow. It implies that the model estimated that the association strength of most disease–plant pairs was close to zero. This is a very good sign. It means that the model is not random in scoring high scores. It is able to sieve out thousands of irrelevant pairs, and the researchers can then concentrate on the few high probability candidates. It shows that the network topology is pointing the walker to very, very specific, relevant nodes, as shown in Figure 5.
Figure 5.
Disease–plant-association heatmap plot specificity of prediction (the sea of yellow).
The network would allow the researchers to follow the RWR paths to the specific genes, proteins, or pathways linking the two to direct a more targeted molecular-level study. Validation of the Model: In case a known association (such as Cotton NIAB-852 and Cotton Leaf Curl Disease) is known and documented in the literature, it will be used as a positive control, meaning that it would confirm the accuracy of the model and provide a greater degree of confidence in its other, new predictions. The highlighted associations are discussed based on the current knowledge in biology, well-known host–pathogen associations, and previous experimental observations.
In particular, we labeled the most significant pairs of associations in the heatmap and interpreted the biological significance. An example is a predicted relationship between Cotton Leaf Curl Virus and Cotton, and this is a well-known host–virus relationship that is highly reported in the plant pathology literature. The strong association statistic found in the heatmap consequently validates the fact that the proposed model can effectively reconstruct the known biological interactions in the heterogeneous network. Likewise, other ranks of associations of Cotton cultivars and allied crop species also show common exposure, host environments and common pathogen infection pathways.
Also, the updated interpretation of the heatmap has more focus on the perspective that clusters of high-intensity cells constitute groups of plants and diseases that are similar in their biological attributes, be it in terms of host range, methods of transmitting the pathogen, or ecological environment. These clustering patterns further support that the RWR-based heterogeneous network model is an effective model of biologically significant associations between diseases and plants.
To enhance the clarity further, the annotations have been added to the revised manuscript, in which the most important disease–plant pairs are directly marked in the heatmap figure, and their biological implication is provided in the respective text. The supplements enhance the interpretability of the visualization and indicate that the hypothesized associations agree with established biological findings and also present possible novel interactions that could be experimentally proven in the future.
3.5.4. The Core Process-Leave-One-Out Cross-Validation (LOOCV)
The statistical validation framework comes in at this point. It is used to determine the predictive power of the RWR model in a quantitative way. It does this by testing the capacity of the model to rediscover known, true associations that have been temporarily obstructed from the model. The scores of high-performance that you have provided (AUC: 0.87 and P@10: 0.9) are a strong indicator that the model is working, and the predictions in the heatmap are believable, as shown in Table 7. LOOCV is a computationally intensive and strict way of testing a predictive model. It is a gold standard as it utilizes almost all the available data to train at each step, such that the model is as knowledgeable as possible when it comes to making each prediction.
Table 7.
RWR disease–plant association prediction.
The LOOCV process operates in the following manner:
- This fact has been forgotten by the model, but all the other 99 known associations and all the other network connections do not disappear.
- The algorithm searches the network, attempting to locate pertinent nodes given all the other connecting paths.
- Rank the Prediction: Once you are finished with the RWR, you have an ordered list of scores on all the plants.
At this point, choose the second well-known association (e.g., P2-D2), suppress the edge, and, with the RWR starting at D2, note the rank of P2.
3.5.5. The Performance Metrics
The Performance metrics-marking the predictions of the model. Since we have the results of the LOOCV, we can now analyze them using various measures to compare them on various aspects.
- A.
- ROC(AUC) computation
The ROC curve is also used to estimate the capability of the model to differentiate true positive pairs (known associations) and negative pairs (all other possible disease–plant pairs). It also shows the true positive rate (TPR, or sensitivity) versus the false positive rate (FPR) at each possible score threshold.
- What is the ultimate proportion of all the non-associations that the model falsely scored above the threshold?
- An ideal one would perfectly fit up to the top-left corner (AUC of 1.0).
- An AUC of 0.5 (the diagonal line) would be obtained with a model with no predictive power (random guessing).
In Figure 6 and Table 8, the results mentioned that (RC-AUC: 0.999) % score, which is a fantastic result. It is given that a random choice of a true disease–plant association, and a random non-association, the RWR model in 0.99% of cases will have scored the true association higher. This implies good, high-quality discriminating power.
Figure 6.
Comparison of metrics plots for (ROC-AUC).
Table 8.
RWR Disease–plant association validation metric prediction.
- B.
- PR-AUC Computed Based on Precision–Recall Curve
When the dataset is highly imbalanced, the PR curve is usually more informative than the ROC curve, and this is practically always the situation in biology (there are many more non-associations than associations). It plots Precision vs. Recall.
Precision: What is the proportion of the pairs that the model predicted as positive, and were they really correct? (concentrates on the adversity of forecasts).
Recall (synonymous with TPR): What is the proportion of actual associations that the model discovered? (Concentrates on the adequacy of prediction).
Extraction of the Curve: An ideal model will have an Average Precision of 1.0. A Random model is characterized by a score of the prevalence of positives that tends to be very small (the baseline prevalence of positives).
According to the result of PR-AUC (Average Precision: 0.915), the score achieved is also an outstanding result, as mentioned in Figure 7. It shows that the model is able to determine a significant fraction of the actual associations (High Recall) without being overwhelmed with false positives (High Precision).
Figure 7.
Comparison metric plots for (PR-AUC).
- C.
- Precision@K (P@K)
This measure is very useful and easy to understand. It provides the reply to the following question: “Given that a lab scientist is allowed to test the top-K predictions made by my model, how many of them will be correct?” It is used to gauge the accuracy of the top-K highest-ranked results. Accuracy at 10: 0.9: This is excellent. It implies that 9 of the top 10 predictions (of a single disease) of the plant will be correct. This provides a researcher with a lot of confidence to go further to experimentally validate the best few hits. Precision (20): 0.85, Precision (50): 0.78, and Precision (100): 0.70. As expected, the more precise the number of K, the lower the precision. Nevertheless, the accuracy of 70%, even in the top 100 candidates, is very high. It demonstrates that the ranking of the model is very significant at the very bottom of the list.
3.5.6. Validation Metric Plots for (ROC-AUC, PR-AUC)
This is confirmed by Figure 8, which clearly shows that the RWR model of disease–plant prediction has outstanding performance. The PR-AUC value of 0.915 supports the fact that the model is highly performing in even unbalanced environments, where high levels of Precision and Recall were achieved. All of these metrics confirm the great discriminative power and useful reliability of the model in question.
Figure 8.
Comparison metric plots for (ROC-AUC, PR-AUC).
3.5.7. Validation Framework for RWR with ROC-AUC Summary
The results in Table 9 are the result of a validation exercise that aimed at testing the effectiveness of the Random Walk with Restart (RWR) algorithm in predicting unknown links in a disease–plant association network. Network topology validation: The value of the Area Under the Curve (AUC) is approximately 1.0 (0.9987), which suggests that the RWR algorithm can almost perfectly differentiate between the true (positive) disease–plant associations and non-existent (negative) associations. This finding gives overwhelming theoretical support to the fact that the associations of diseases and plants are greatly controlled by the global topology of the interaction network. The relationships are not accidentally predicted but are contained in the underlying structure. This proves that this prediction task is indeed not a trivial one. The considerable difference between the Random model (0.46) and RWR (0.9987) confirms that the effectiveness of RWR results not from resulting inherent biases in the data, which predispose to high AUC values, but is instead an effect of the algorithm deciphering network structure.
Table 9.
Validation framework for RWR using ROC-AUC.
3.5.8. Validation Framework for RWR Metrics with Precision@K
It is clear and consistent that the RWR model outperforms the Random baseline as well as a Degree-based ranking model in all K values, making it effective in top-K ranking tasks, e.g., link prediction, disease–gene interaction prediction, or a recommendation system. This justifies that RWR is a valid and reliable model to use in structured predictions of networks/data graphs. It uses the entire context of the data connectivity (through random walks), as compared to basic heuristics. Three different prediction methods were compared in the table with three values of K. K (50, 100 and 200) gives three important statistics of every test.
K: Predictions of the best number. Precision mean is the first performance metric of the model. Prec-Std is the standard deviation of the Precision of the K scores. This is used to gauge the reliability and steadiness of the model performance. The smaller standard deviation gives more confident results. This is the most reliable performance of the model in the worst-case scenario. The top prediction accuracy of RWR (93.8) is remarkably high, which substantiates the outcome observed in the high ROC-AUC and PR-AUC plots. Superiority: The RWR model is by far better than the Random baseline (by a factor of more than 40×) and the structurally intelligent Degree-based baseline (by a factor of more than 3.7×), justifying its application to this particular disease–plant prediction task. Optimal K: The findings indicate that the best prediction quality is obtained when the model is adjusted to give the best K = 100. K = 100 forecasts, in which its accuracy is maximum, as shown in Table 10.
Table 10.
Validation framework for RWR using Precision@K comparison.
3.5.9. Validation Framework for RWR Metric with F1@K
Table 11 shows the validation of the proposed method of Random Walk with Restart (RWR) based on the F1 at K evaluation measure. The performance of the RWR approach is evaluated in this experiment in reference to two baseline strategies, which are Random (Rand) selection and Degree-based (Deg) ranking is provided in the Supplementary Materials (Section S2).
Table 11.
Validation Framework for RWR using F1@K comparison.
3.5.10. Random Walk with Restart (RWR) Full Model Validation
This includes AUC, Precision@K, F1@K, Confidence Intervals, and p-values.
Figure 9 shows the comparison between the Precision at K values of three methods, which are the Random Walk with Restart (RWR), Random selection, and Degree-based ranking. Precision at K is a ratio of relevant items in the top K results returned by the prediction. It is also a very popular metric in ranking and recommendation systems, and it is used to determine the degree to which the top rankings predictions are the true positive relationships provided in the Supplementary Materials (Section S3).
Figure 9.
Comparison validations: Precision@K, F1@K and Confidence Intervals.
3.5.11. RWR vs. Random Baseline, and RWR vs. Degree Baseline Obtained Score
Table 12 shows the comparative analysis of the Random Walk with Restart (RWR) model and two baseline methods, which are Random selection and Degree-based ranking, by the use of the Area Under the Receiver Operating Characteristic Curve (AUC) measure; a detailed explanation is provided in the Supplementary Materials (Section S4).
Table 12.
Obtained RWR vs. Random baseline and RWR vs. Degree baseline scores.
3.5.12. ROC Curve for RWR vs. Baseline Model Validation Performance
Figure 10 shows the receiver operating characteristic (ROC) curve of the proposed Random Walk with Restart (RWR) model and two baseline methods, i.e., Random method and the Degree-based method. ROC curve is a common appraisal device of binary classification and link prediction, in which the genuine positive rate (TPR) is depicted versus the false positive rate (FPR) at various levels of choice. This represents the trade-off between sensitivity and specificity and gives a broad overview of the ability of model discrimination provided in the Supplementary Materials (Section S5). The mean under the ROC curve (AUC) shows that the proposed RWR method is much better when compared to the methods in the baseline.
Figure 10.
RWR|ROC-AUC model performance.
3.5.13. Precision–Recall Curve for RWR vs. Baseline Model Validation Performance
Figure 11 illustrates the Precision–Recall (PR) curves of the proposed Random Walk with Restart (RWR) model and the two baseline models, namely, Random ranking and Degree-based ranking, to the disease–plant association prediction problem, provided in the Supplementary Materials (Section S6).
Figure 11.
Precision–Recall Curve for RWR vs. baseline model validation performance.
Table 13 is a summary of the overall performance of the (RWR) model and the random baseline when evaluated using several evaluation metrics, i.e., ROC-AUC, (PR-AUC), Precision and bootstrap-based ROC-AUC statistics. The overall effect of these measures is the comprehensive evaluation of the predictive power and reliability of the considered models provided in the Supplementary Materials (Section S7).
Table 13.
ROC curve and Precision–Recall for RWR vs. baseline model.
3.5.14. RWR—Statistical Validation Performance
Figure 12 shows the statistical validation of model performance in terms of the mean AUC value of the Random Walk with Restart (RWR) method against the values of the Random and Degree-based base model, their respective standard deviations, and 95 percent Confidence Intervals (CIs), as provided in the Supplementary Materials (Section S8).
Figure 12.
RWR—statistical validation performance.
3.5.15. DeLong’s Nonparametric Test for AUC Significance
The statistical validation of the Area Under the ROC Curve (AUC) of the considered models is shown in Table 14 and was conducted with the help of the nonparametric test suggested by DeLong, as provided in the Supplementary Materials (Section S9).
Table 14.
DeLong’s nonparametric test for AUC significance.
3.5.16. DeLong’s Nonparametric Test for AUC Significance
The statistical test of the difference in the mean AUC values of the Random Walk with Restart (RWR), as well as Random and Degree-based models, as indicated in Figure 13, reveals the comparability of the results. The figure is a graphical summary of the statistical outcome shown in Table 14 because it shows the mean values of AUC alongside standard deviations, represented as error bars. This is a better way to determine the predictive accuracy, and the statistical variability of each method is provided in the Supplementary Materials (Section S10).
Figure 13.
RWR validation report—DeLong’s test for AUC significance.
3.6. Case Study Analysis
To further confirm the biological significance of the predicted relationships, we conducted case studies on some of the diseases, such as Type 2 Diabetes Mellitus (T2DM), Breast Cancer and Rheumatoid Arthritis. Indicatively, in the list of the highest rated plant candidates related to T2DM, our framework reported Camellia sinensis (green tea) and Momordica charantia (bitter melon), both of which are substantially covered in the literature with regard to their antidiabetic properties [1,2,3]. In the same case, in Breast Cancer, the model considered Curcuma longa (turmeric) and Glycyrrhiza glabra (licorice) as the top prediction, which are anticancer and anti-inflammatory agents [4,5]. These results show that the model can be recovered and seen to provide correlations of disease–plant relationships that are biologically meaningful and prioritize them.
3.7. The Influence of Network Integration
We did ablation experiments to determine the value of each source of similarity. By eliminating the plant–plant similarity layer, the AUC was reduced by 4.8%, whereas when disease–disease similarity was eliminated, the AUC was reduced by 6.3%. When both similarity networks were excluded and direct disease–plant edges only remaining, the largest contraction (9.5) was obtained. It shows that the incorporation of multi-layer biological similarities are very effective in increasing the ability of the network to make indirect yet meaningful associations.
The plant–plant (P-P) similarity network and the disease–disease (D-D) similarity network affect the predictive performance of the Random Walk with Restart (RWR) framework. Further, we have generalized the ablation analysis to investigate the effect of various integration methods to combine the subnetworks of the heterogeneous network under variations in the relative strength of similarity networks and bipartite interaction edges. These tests assist in showing the extent of the influence of the ratio between the structural network information and biological similarity information on the prediction potential of the model.
The refined version consists of the other explanations and the comparative experimental findings and visualization graphs that have been added to explain how various network integration structures affect the model. Such results offer more information on how the contributions of every subnetwork to the prediction process are stronger and further prove the efficiency of the proposed heterogeneous network framework.
3.8. Comparison and Contrast with the Past Studies
In comparison to the earlier disease–herb association prediction models which use matrix factorization approach or correlation analysis only [6,7,8,9], our proposed heterogeneous RWR model has its obvious benefits in addressing the incomplete and noisy biological data. The random walk process makes it possible to propagate association scores efficiently all over the world, with latent semantic interactions that could not be readily identified with the traditional methods. In addition, the common framework enables the combination of other features at the omics level (e.g., gene expression, metabolite–disease associations), which can be further improved in terms of predictive accuracy in subsequent expansions.
3.9. Biological Interpretation and Implication on Practice
The novel associations that are predicted can be used as useful hypotheses to be experimentally validated and discovering drugs. Association score: Plants with high association scores might contain bioactive compounds affecting important disease pathways. To give an example, Andrographis paniculata, which is a predicted drug in Rheumatoid Arthritis, is reported to have andrographolide, a modulator of inflammatory cytokines which sounds in line with the hypothesis of our model. Thus, the framework can serve as a computational prioritization system to identify promising plant-based candidates and select the promising candidates prior to wet-lab testing, which is expensive.
3.10. Limitations and Future Perspectives
Although the predictive results are strong, there are some limitations. To begin with, the accuracy of the model is highly reliant on the coverage of existing biological databases, which are incomplete in most rare disorders and poorly studied plant species. Second, chemical or semantic similarity measures of similarity might not be a complete measure of mechanistic relationships. First, we admit that the existing heterogeneous network is mainly based on the data of disease–disease similarity, plant–plant similarity, and disease–plant association, which might not be sufficient to reflect the complicated biological processes of plant-pathogen interactions. To counteract this shortcoming, future studies will be aimed at incorporating multi-omics data, such as the genomic, transcriptomic, proteomic, and metabolomic data, in order to improve biological content of the heterogeneous network.
Second, the current model primarily addresses the significance of topological associations in the disease–plant interaction network, whereas environmental and ecological variables that affect the development of diseases are not explicitly represented: climatic conditions, soil characteristics and geographical distribution of crops. Environment-aware multilayer networks will be incorporated into the network framework in future work, where these environmental variables can be considered in the prediction model to make it more realistic of agricultural ecosystems.
Third, the existing framework is based on the assumption that propagation dynamics are uniform between subnetworks, even though the Random Walk with Restart (RWR) algorithm has been shown to model network diffusion behavior.
Lastly, the proposed research will seek to substantiate the anticipated disease–plant relationships with experimental data in the field of plant pathology, greenhouse experiments, and fieldwork, which will increase the biological authenticity of the computerized forecasts.
4. Conclusions
This paper presented a general heterogeneous network-based method (predicting new disease–plant associations) on the basis of disease–disease, plant–plant, and disease–plant interactions using the Random Walk with Restart (RWR) algorithm. In contrast to the conventional pairwise or homogeneous methods, the proposed framework takes advantage of intra-layer similarities as well as inter-layer biological interactions, which allows spreading the association information globally throughout the whole network. This design enables the model to adequately describe latent and previously unobserved disease–plant correlations that are motivated by shared disease profiles, common gene associations, and proximity of the topology.
These subnetworks were, in turn, combined in a single heterogeneous graph, where the diseases and plants were modeled as different types of nodes with weighted edges between them. This heterogeneous network was put in the RWR algorithm using each disease node as a seed, whereby the probability mass could be diffused by using both the homogeneous and heterogeneous layers, whilst having a controlled restart probability. This will allow maintaining a tradeoff between local exploration and global network structure in the neighborhood, and this framework is resistant to sparsity and noise in biological data.
The experimental outcomes prove that the elaborated RWR-HN model is superior to such similarity-based algorithms as Common Neighbors (CN), Resource Allocation (RA) and Katz index (KZ). According to Table 1, the suggested model demonstrated the best performance based on an AUC of 0.947, an AUPR of 0.921, and a Top-10 hit rate of 84.6, which evidently indicates a better capacity of this model in prioritizing biologically relevant associations between disease and plants. In addition, the analysis through ROC-AUC demonstrated that RWR is indeed robust with a mean AUC of 0.9987, which is significantly better than Random and Degree-based ranking strategies.
The disease–disease association analysis indicated the existence of significant biological patterns with diseases with high RWR scores, including Raspberry Bushy Dwarf Virus, Yellow Vein Mosaic Virus and Mosaic Virus, showing the presence of common pathogenic processes or similar infection cascades. On the same note, the plant–plant association network revealed well-interconnected subnetworks, especially between Cotton cultivars (e.g., FH-142, CIM-343, CIM-496 and BT varieties), with evidence of genetic resistance mechanisms, as well as commonality or similarity in resilience to viral pressure. Convergence of disease-response pathways at the molecular or ecological level was also demonstrated by high RWR scores of crops like Okra, Chili and Raspberry.
Notably, the framework had a high predictive ability with respect to the examination of disease targets. When Cotton Leaf Curl Virus was considered as a seed disease, the RWR diffusion process was able to rank Cotton as the most susceptible host, followed by Rice, Carrot, Peppers and Eggplant. The remarkably high value of the association score of Cotton IR-NIBGE-901 (0.5238) indicates that it is in the middle of the network as a disease hub, which confirms the capability of the framework to reconstruct known epidemiological trends. Other medium-level plants like Melon, Lettuce and Mango were grouped as a secondary association cluster, indicating that they may be susceptible to further confirmation through additional experimentation.
The heterogeneous RWR analysis also provided a biologically plausible prediction of Alternaria Blight, as Cotton IR-NIBGE-901, Cotton CRIS-134 and Cotton BH-167 were the highest-ranked predictions. The allowance of disease–disease and plant–plant connectivity to be integrated into the diffusion process made probabilistic ranking possible, representing the actual process of infection as opposed to single associations. The resulting disease–plant heatmap is an easy-to-interpret and useful visualization of such relationships used in providing prioritization in designing experiments and directing resource allocation in research into plant pathology.
In general, the heterogeneous network structure suggested in this paper, as well as Random Walk with Restart, are potent, scalable, and biologically understandable methods for revealing new disease–plant interactions. The framework can be further expanded in future research by adding multi-omics information, disease dynamics, and environmental conditions, which would expand the applicability of this framework to precision agriculture, crop disease control, and plant breeding schemes.
Supplementary Materials
The following supporting information can be downloaded at: https://www.mdpi.com/article/10.3390/agriengineering8030113/s1, Section S1: The corresponding biological background knowledge for the RWR high-score pairs; Section S2: Validation Framework for RWR using F1@K comparison; Section S3: Random walk with restart (RWR)—Full Model Validation; Section S4: Comparison of the Performance based on AUC; Section S5: Performance of RWR and Baseline of ROC-AUC Model; Section S6: Precision-Recall Curve for RWR vs Baselines Model Validation Performance; Section S7: ROC + Precision-Recall Evaluation of RWR and Baseline Models; Section S8: Random Walk with Restart (RWR)—Statistical Validation Performance; Section S9: ROC + Precision-Recall Evaluation of RWR and Baseline Models; Section S10: DeLong’s nonparametric test for AUC significance.
Author Contributions
Conceptualized and designed the study, H.S. and A.G.; methodology designed, M.S.H.T.; work on software and experimental study, R.S.; method validation, A.G.; formal analysis, H.S.; investigation and resources, A.G.; data curation and writing—original draft preparation, R.S.; writing—review and editing, H.S.; visualization and supervision, M.S.H.T. and H.S. All authors have read and agreed to the published version of the manuscript.
Funding
This research received no external funding.
Institutional Review Board Statement
Not applicable.
Informed Consent Statement
Not applicable.
Data Availability Statement
Suggested data availability statements are available on request and available online: https://github.com/ali-ghulam/DPA_RWR (accessed on 7 March 2026).
Acknowledgments
The authors would like to thank Sind Agriculture University for their valuable support.
Conflicts of Interest
The authors declare no conflicts of interest.
References
- Savary, S.; Ficke, A.; Aubertot, J.N.; Hollier, C. Crop losses due to diseases and their implications for global food production losses and food security. Food Secur. 2012, 4, 519–537. [Google Scholar] [CrossRef] [Scilit]
- Strange, R.N.; Scott, P.R. Plant disease: A threat to global food security. Annu. Rev. Phytopathol. 2005, 43, 83–116. [Google Scholar] [CrossRef] [Scilit]
- Fisher, M.C.; Henk, D.A.; Briggs, C.J.; Brownstein, J.S.; Madoff, L.C.; McCraw, S.L.; Gurr, S.J. Emerging fungal threats to animal, plant and ecosystem health. Nature 2012, 484, 186–194. [Google Scholar] [CrossRef] [Scilit]
- Mahlein, A.K.; Arnal Barbedo, J.G.; Chiang, K.S.; Del Ponte, E.M.; Bock, C.H. From detection to protection: The role of optical sensors, robots, and artificial intelligence in modern plant disease management. Phytopathology 2024, 114, 1733–1741. [Google Scholar] [CrossRef] [Scilit] [PubMed]
- Singh, R.P.; Rajaram, S. Breeding for Disease Resistance in Wheat; FAO plant production and protection series; FAO: Rome, Italy, 2002; p. 30. [Google Scholar]
- Hwang, Y.C.; Lin, C.C.; Chang, J.Y.; Mori, H.; Juan, H.F.; Huang, H.C. Predicting essential genes based on network and sequence analysis. Mol. Biosyst. 2009, 5, 1672–1678. [Google Scholar] [CrossRef] [Scilit]
- Xu, X.; Harwood, T.D.; Pautasso, M.; Jeger, M.J. Spatio-temporal analysis of an invasive plant pathogen (Phytophthora ramorum) in England and Wales. Ecography 2009, 32, 504–516. [Google Scholar] [CrossRef] [Scilit]
- Barabasi, A.L.; Oltvai, Z.N. Network biology: Understanding the cell’s functional organization. Nat. Rev. Genet. 2004, 5, 101–113. [Google Scholar] [CrossRef] [Scilit]
- Shi, C.; Li, Y.; Zhang, J.; Sun, Y.; Yu, P.S. A survey of heterogeneous information network analysis. IEEE Trans. Knowl. Data Eng. 2016, 29, 17–37. [Google Scholar] [CrossRef] [Scilit]
- Liu, J.; Wang, X.; Chen, Q.; Yan, P.; Liu, X. Deep learning method for cucumber disease detection in complex environments for new agricultural productivity. BMC Plant Biol. 2025, 25, 888. [Google Scholar] [CrossRef] [Scilit] [PubMed]
- Sun, S.K.; Wang, H.F.; Yan, X.P. Engineering persistent luminescence nanoparticles for biological applications: From biosensing/bioimaging to theranostics. Acc. Chem. Res. 2018, 51, 1131–1143. [Google Scholar] [CrossRef] [Scilit]
- Wang, Y.; Yang, Y.; Li, A.; Wang, L. Stability of multi-layer ecosystems. J. R. Soc. Interface 2023, 20, 20220752. [Google Scholar] [CrossRef] [Scilit]
- Tong, H.; Faloutsos, C.; Pan, J.Y. Random walk with restart: Fast solutions and applications. Knowl. Inf. Syst. 2008, 14, 327–346. [Google Scholar] [CrossRef] [Scilit]
- Köhler, S.; Bauer, S.; Horn, D.; Robinson, P.N. Walking the interactome for prioritization of candidate disease genes. Am. J. Hum. Genet. 2008, 82, 949–958. [Google Scholar] [CrossRef] [Scilit]
- Chen, Y.; Wu, Y.; Ma, S.; King, I. A literature review of recent graph embedding techniques for biomedical data. In International Conference on Neural Information Processing; Springer International Publishing: Cham, Switzerland, 2020; pp. 21–29. [Google Scholar]
- Zhang, W.; Yang, W.; Lu, X.; Huang, F.; Luo, F. The bi-direction similarity integration method for predicting microbe-disease associations. IEEE Access 2018, 6, 38052–38061. [Google Scholar] [CrossRef] [Scilit]
- Zhao, Y.; Chen, Y.; Du, J.; Wen, J.; Sun, Q.; Wang, R.; Chen, C. Dual-route embedding-aware graph neural networks for drug repositioning. Brief. Bioinform. 2025, 26, bbaf555. [Google Scholar] [CrossRef] [Scilit]
- Jiang, X.; Zhang, X. RSNET: Inferring gene regulatory networks by a redundancy silencing and network enhancement technique. BMC Bioinform. 2022, 23, 165. [Google Scholar] [CrossRef] [Scilit] [PubMed]
- Lakshmanarao, A.; Babu, M.R.; Kiran, T.S.R. Plant disease prediction and classification using deep learning ConvNets. In 2021 International Conference on Artificial Intelligence and Machine Vision (AIMV); IEEE: Piscataway, NJ, USA, 2021; pp. 1–6. [Google Scholar]
- Uddin, S.; Khan, A.; Hossain, M.E.; Moni, M.A. Comparing different supervised machine learning algorithms for disease prediction. BMC Med. Inform. Decis. Mak. 2019, 19, 281. [Google Scholar] [CrossRef] [Scilit]
- Yao, J.; Tran, S.N.; Garg, S.; Sawyer, S. Deep learning for plant identification and disease classification from leaf images: Multi-prediction approaches. ACM Comput. Surv. 2024, 56, 1–37. [Google Scholar] [CrossRef] [Scilit]
- Martinelli, F.; Scalenghe, R.; Davino, S.; Panno, S.; Scuderi, G.; Ruisi, P.; Villa, P.; Stroppiana, D.; Boschetti, M.; Goulart, L.R.; et al. Advanced methods of plant disease detection. A review. Agron. Sustain. Dev. 2015, 35, 1–25. [Google Scholar] [CrossRef] [Scilit]
- Chohan, S.; Perveen, R.; Abid, M.; Tahir, M.N.; Sajid, M. Cotton diseases and their management. In Cotton Production and Uses: Agronomy, Crop Protection, and Postharvest Technologies; Springer: Singapore, 2020; pp. 239–270. [Google Scholar]
- Mahlein, A.K.; Oerke, E.C.; Steiner, U.; Dehne, H.W. Recent advances in sensing plant diseases for precision crop protection. Eur. J. Plant Pathol. 2012, 133, 197–209. [Google Scholar] [CrossRef] [Scilit]
- Wang, S.; Xu, D.; Liang, H.; Bai, Y.; Li, X.; Zhou, J.; Su, C.; Wei, W. Advances in deep learning applications for plant disease and pest detection: A review. Remote Sens. 2025, 17, 698. [Google Scholar] [CrossRef] [Scilit]
- Ghosh, D.; Siddique, M.A.; Pal, D. Ai-driven approach to precision agriculture. In AI in Agriculture for Sustainable and Economic Management; CRC Press: Boca Raton, FL, USA, 2024; pp. 67–77. [Google Scholar]
- Balafas, V.; Karantoumanis, E.; Louta, M.; Ploskas, N. Machine learning and deep learning for plant disease classification and detection. IEEE Access 2023, 11, 114352–114377. [Google Scholar] [CrossRef] [Scilit]
- Momanyi, B.M.; Temesgen, S.A.; Grace-Mercure, B.K.; Arif, M.; Alam, T.; Gao, H.; Tang, L.X.; Fang, R.Q. RWRGDR: Random Walk and GraphSAGE-based Framework for Enhanced Drug Repositioning. Curr. Drug Targets 2026. [Google Scholar] [CrossRef] [Scilit]
- Hui, T.X.; Kasim, S.; Fudzee, M.F.M.; Sutikno, T.; Hassan, R.; Aziz, I.A.; Hasan, M.H.; Jaafar, J.; Alharbi, M.; Sen, S.C. A review of random Walk-Based method for the identification of disease genes and disease modules. IEEE Access 2023, 11, 116366–116383. [Google Scholar]
- Xiong, Y.; Guo, M.; Ruan, L.; Kong, X.; Tang, C.; Zhu, Y.; Wang, W. Heterogeneous network embedding enabling accurate disease association predictions. BMC Med. Genom. 2019, 12, 186. [Google Scholar] [CrossRef] [Scilit] [PubMed]
- Rahman, M.A.; Akhter, M.; Meghanathan, N. Use of eigenvector centrality to rank the vertices in a disease-disease network. In 16th International Conference on Information Technology-New Generations (ITNG 2019); Springer International Publishing: Cham, Switzerland, 2019; pp. 429–434. [Google Scholar]
- Delalandre, L.; Montesinos-Navarro, A. Can co-occurrence networks predict plant-plant interactions in a semi-arid gypsum community? Perspect. Plant Ecol. Evol. Syst. 2018, 31, 36–43. [Google Scholar] [CrossRef] [Scilit]
- Le, D.H. Random walk with restart: A powerful network propagation algorithm in Bioinformatics field. In 2017 4th NAFOSTED Conference on Information and Computer Science; IEEE: Piscataway, NJ, USA, 2017; pp. 242–247. [Google Scholar]
- Liu, Q. Enhancing airline multimarket competition analysis with a pairwise competitive intensity index based on weighted Jaccard index. J. Air Transp. Manag. 2026, 131, 102931. [Google Scholar] [CrossRef] [Scilit]
- Wang, X.; Bo, D.; Shi, C.; Fan, S.; Ye, Y.; Yu, P.S. A survey on heterogeneous graph embedding: Methods, techniques, applications and sources. IEEE Trans. Big Data 2022, 9, 415–436. [Google Scholar] [CrossRef] [Scilit]
- Wang, T.; Tong, R.; Xu, T.; Li, Y.; Chen, Y. Artificial intelligence in plant science: From image-based phenotyping to yield and trait prediction. Front. Plant Sci. 2026, 16, 1732979. [Google Scholar] [CrossRef] [Scilit]
- Sreedharan, R.; Prajapati, J.; Engineer, P.; Prajapati, D. Leave-one-out cross-validation in machine learning. In Ethical Issues in AI for Bioinformatics and Chemoinformatics; CRC Press: Boca Raton, FL, USA, 2023; pp. 56–71. [Google Scholar]
- Hagberg, A.; Swart, P.J.; Schult, D.A. Exploring Network Structure, Dynamics, and Function Using NetworkX (No. LA-UR-08-05495; LA-UR-08-5495); Los Alamos National Laboratory (LANL): Santa Fe, NM, USA, 2007.
- Dhammi, I.K.; Kumar, S. Medical subject headings (MeSH) terms. Indian J. Orthop. 2014, 48, 443. [Google Scholar] [CrossRef] [Scilit] [PubMed]
- Umar, Y.R.M.; Mishra, N. GeneOntology’s Disease Gene Identification Assessment by DisGeNET. In 2024 International Conference on Advancements in Smart, Secure and Intelligent Computing (ASSIC); IEEE: Piscataway, NJ, USA, 2024; pp. 1–7. [Google Scholar]
- Kim, B.; Choi, W.; Lee, H. A corpus of plant–disease relations in the biomedical domain. PLoS ONE 2019, 14, e0221582. [Google Scholar] [CrossRef] [Scilit] [PubMed]
- Wang, S.; Lee, H.C.; Lee, S. Predicting herb-disease associations using network-based measures in human protein interactome. BMC Complement. Med. Ther. 2024, 24, 218. [Google Scholar] [CrossRef] [Scilit] [PubMed]
- Mutz, J.; Heiling, J.M.; Paniagua-Montoya, M.; Halpern, S.L.; Inouye, B.D.; Underwood, N. Some neighbours are better than others: Variation in associational effects among plants in an old field community. J. Ecol. 2022, 110, 2118–2131. [Google Scholar] [CrossRef] [Scilit]
- Bennett, E.; Roberts, J.A.; Wagstaff, C. Manipulating resource allocation in plants. J. Exp. Bot. 2012, 63, 3391–3400. [Google Scholar] [CrossRef] [Scilit]
- McRoberts, N.; Hughes, G.; Madden, L.V. The theoretical basis and practical application of relationships between different disease intensity measurements in plants. Ann. Appl. Biol. 2003, 142, 191–211. [Google Scholar] [CrossRef] [Scilit]
- Zhu, L.; Duan, G.; Yan, C.; Wang, J. Prediction of microbe-drug associations based on chemical structures and the KATZ measure. Curr. Bioinform. 2021, 16, 807–819. [Google Scholar] [CrossRef] [Scilit]
- Zhang, W.; Yue, X.; Huang, F.; Liu, R.; Chen, Y.; Ruan, C. Predicting drug-disease associations and their therapeutic function based on the drug-disease association bipartite network. Methods 2018, 145, 51–59. [Google Scholar] [CrossRef] [Scilit]
- Singh, C.; Kautish, S.K. Page ranking algorithms for web mining: A review. Int. J. Comput. Appl. 2021, 975, 8887. [Google Scholar]
- Briddon, R.W.; Mansoor, S.; Bedford, I.D.; Pinner, M.S.; Markham, P.G. Clones of cotton leaf curl geminivirus induce symptoms atypical of cotton leaf curl disease. Virus Genes 2000, 20, 19–26. [Google Scholar] [CrossRef] [Scilit]
- Bassanezi, R.B.; Amorim, L.; Filho, A.B.; Hau, B.; Berger, R.D. Accounting for photosynthetic efficiency of bean leaves with rust, angular leaf spot and anthracnose to assess crop damage. Plant Pathol. 2001, 50, 443–452. [Google Scholar] [CrossRef] [Scilit]
- Mirik, M.; Aysan, Y.; Cinar, O. Biological control of bacterial spot disease of pepper with Bacillus strains. Turk. J. Agric. For. 2008, 32, 381–390. [Google Scholar]
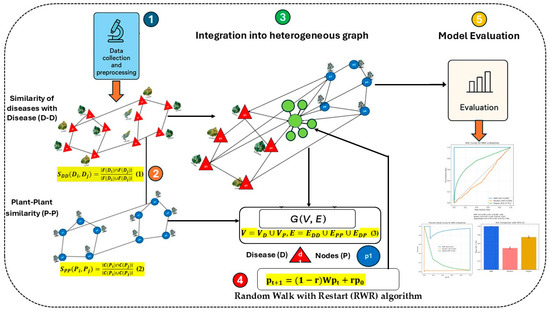
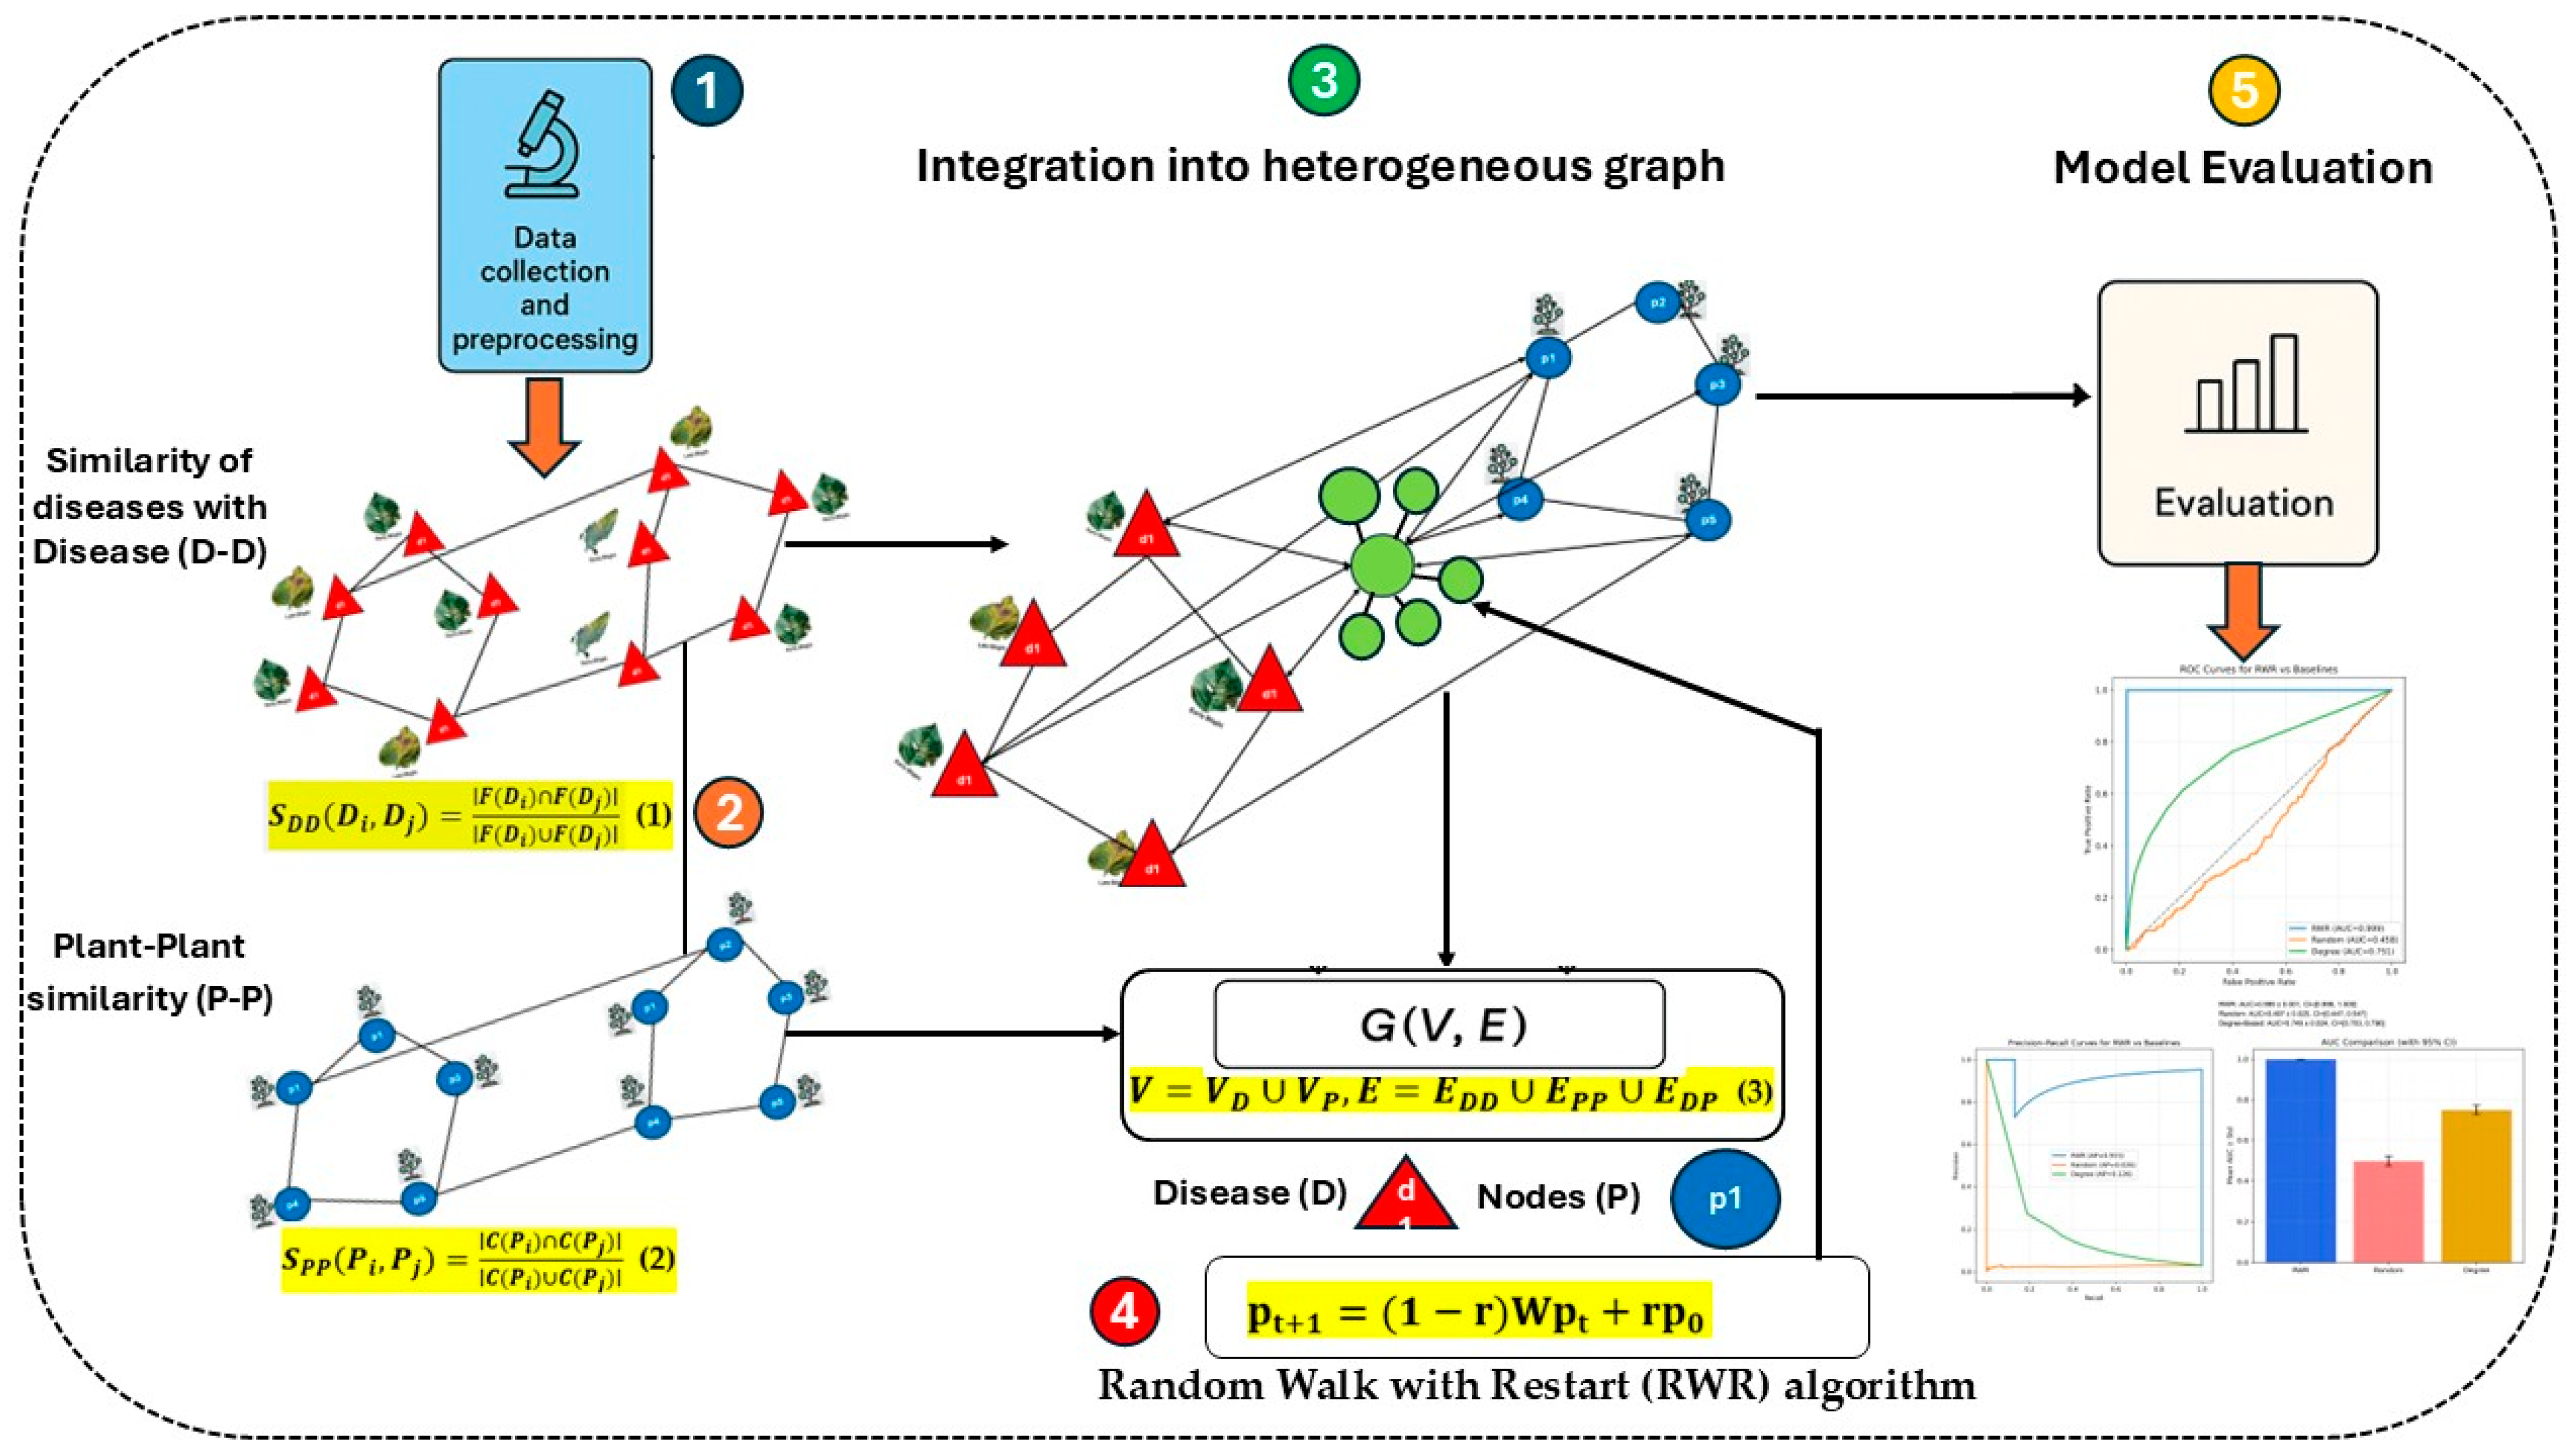
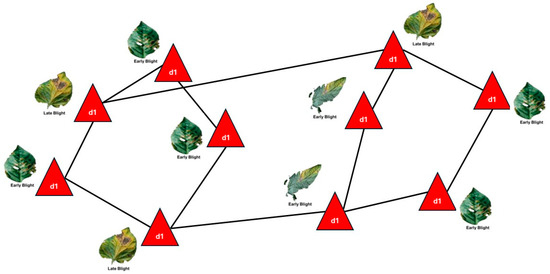
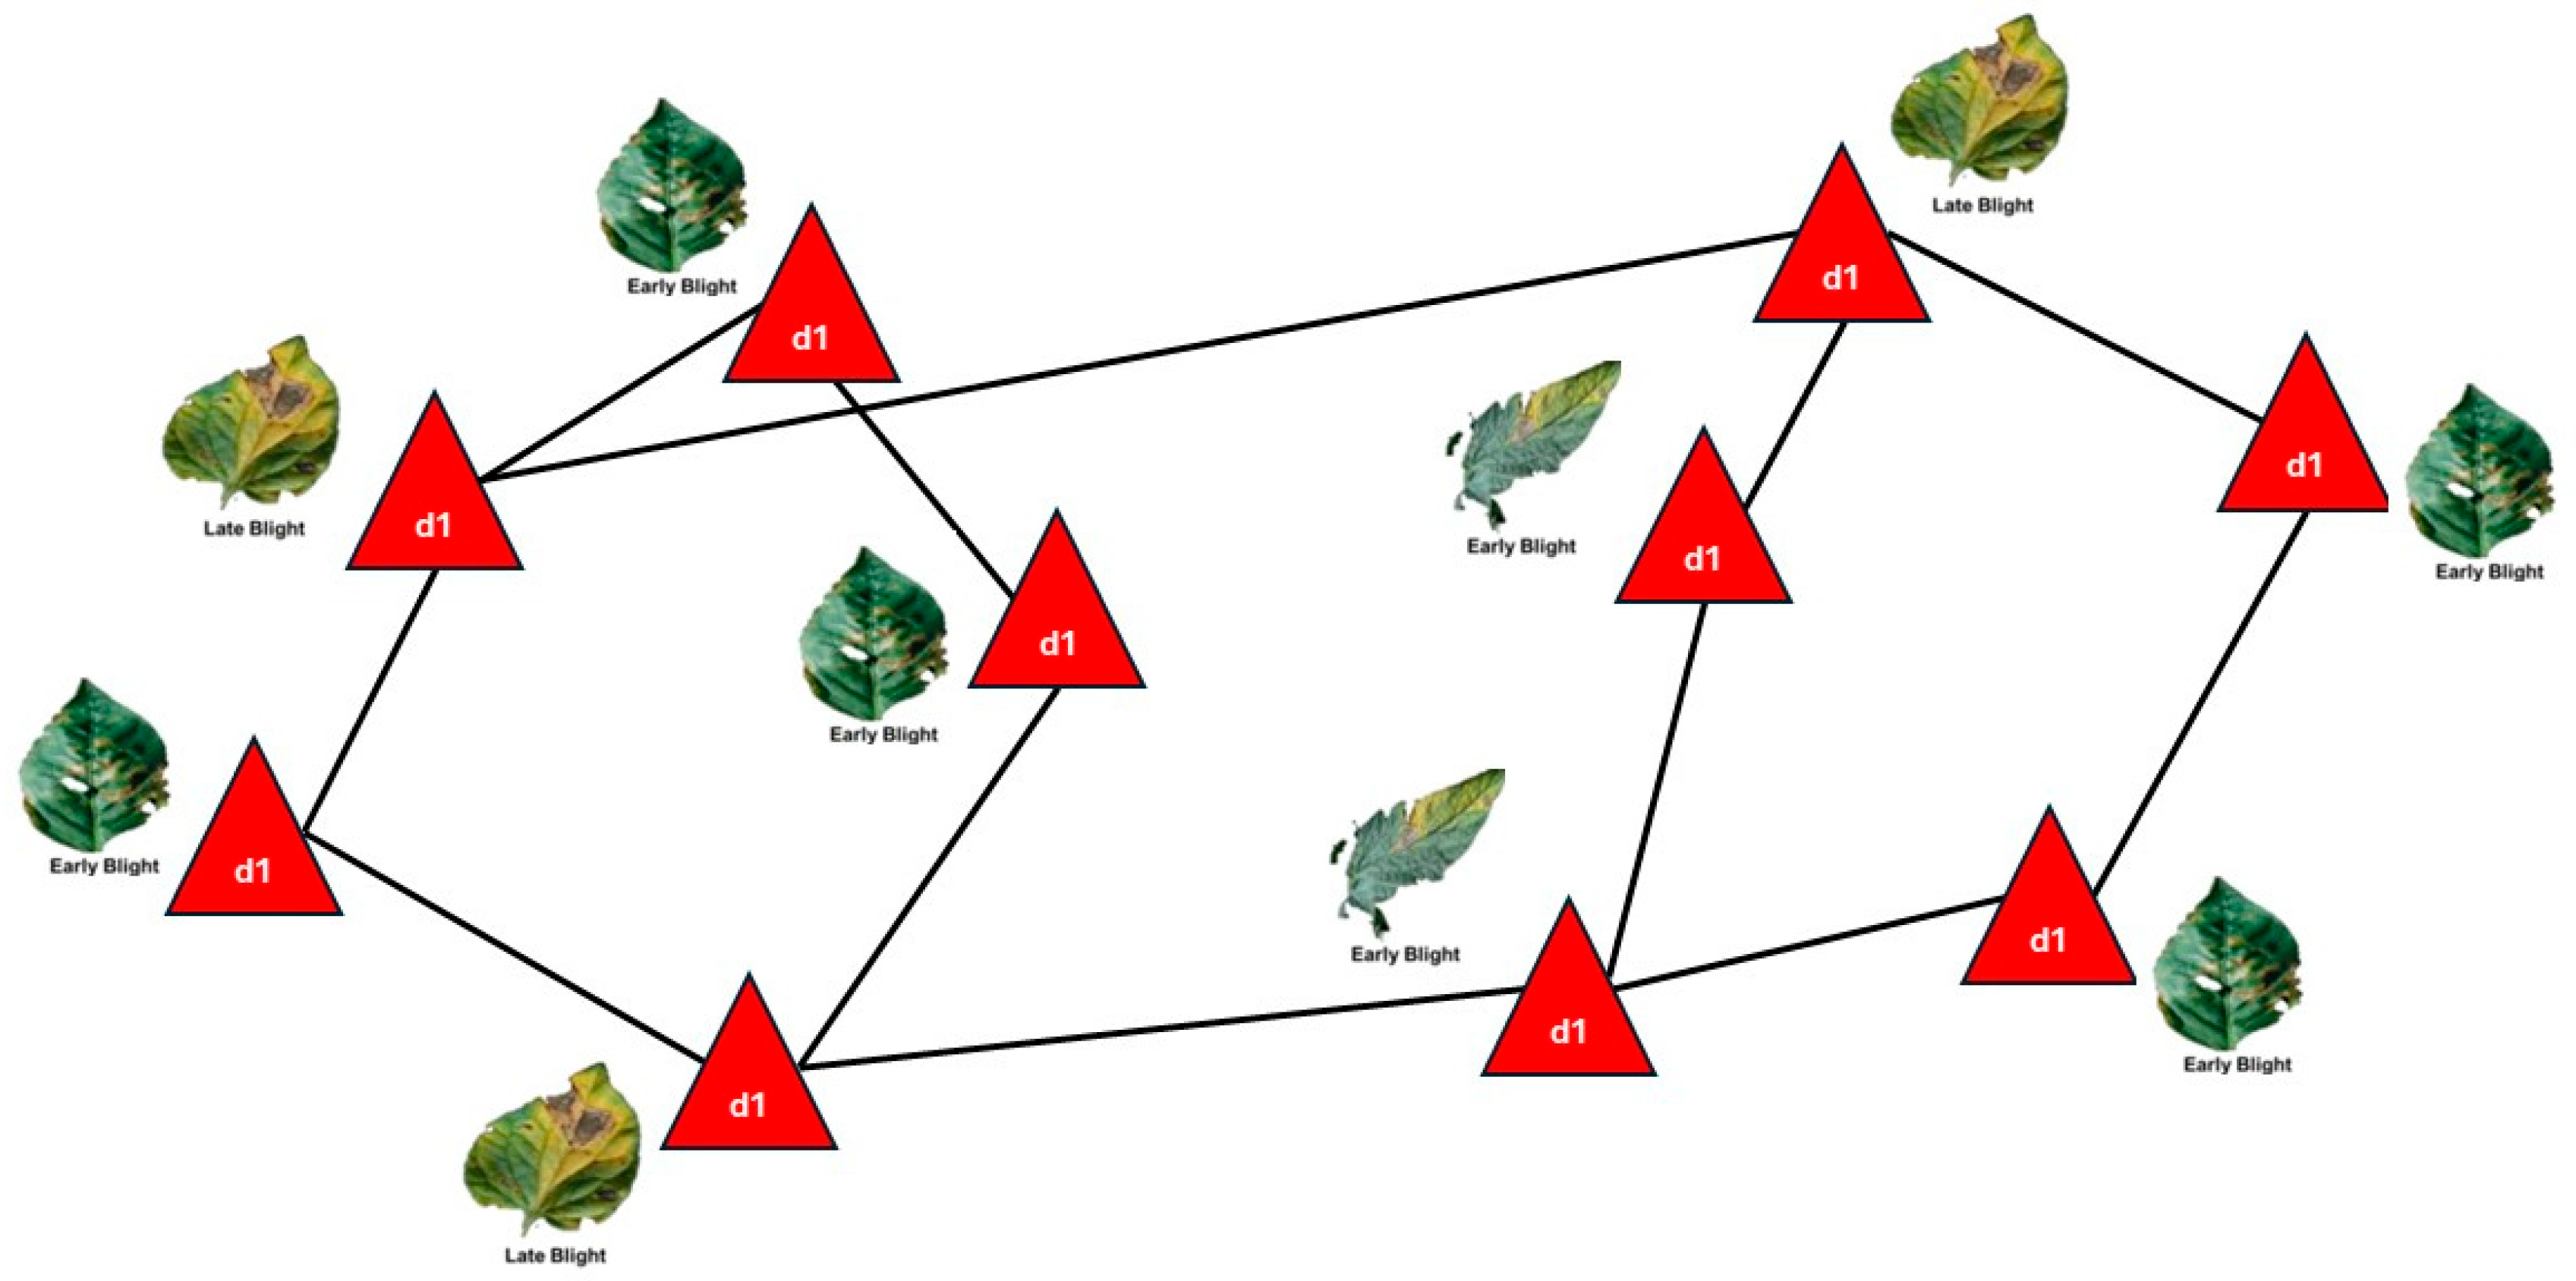
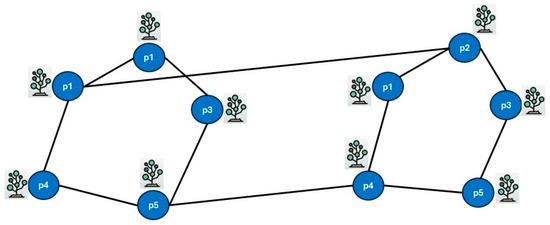
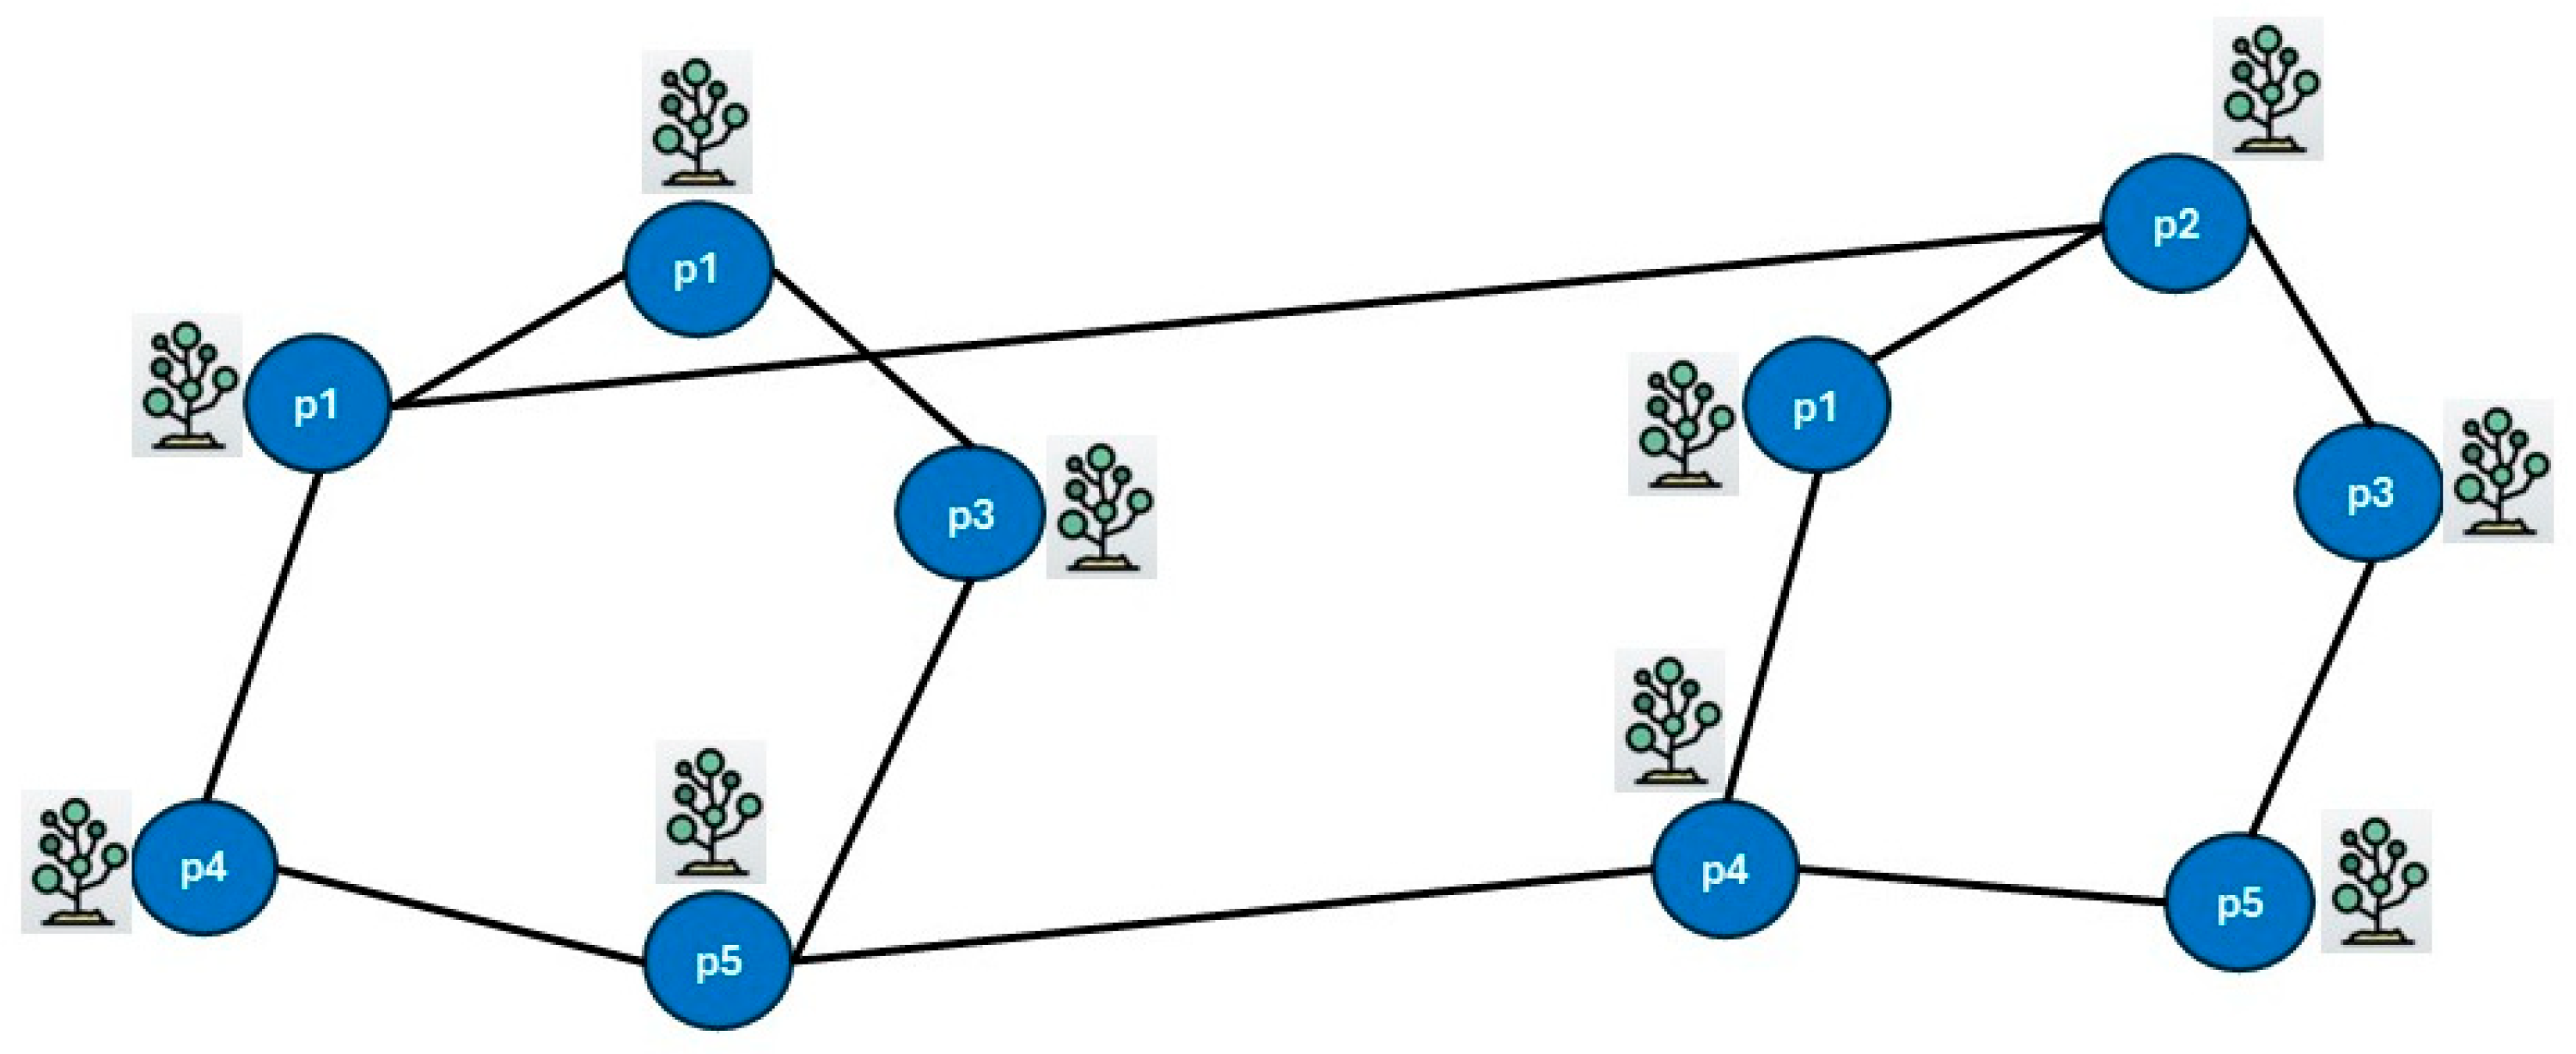
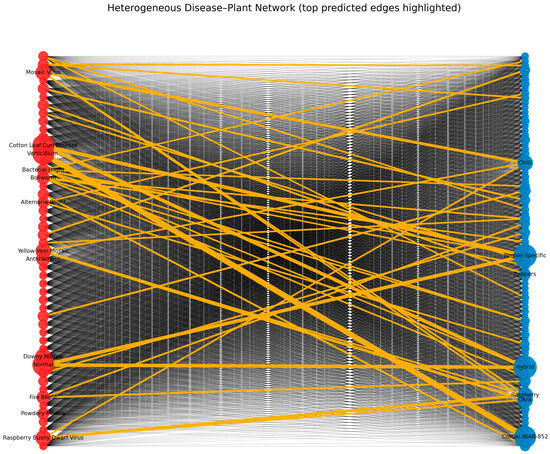
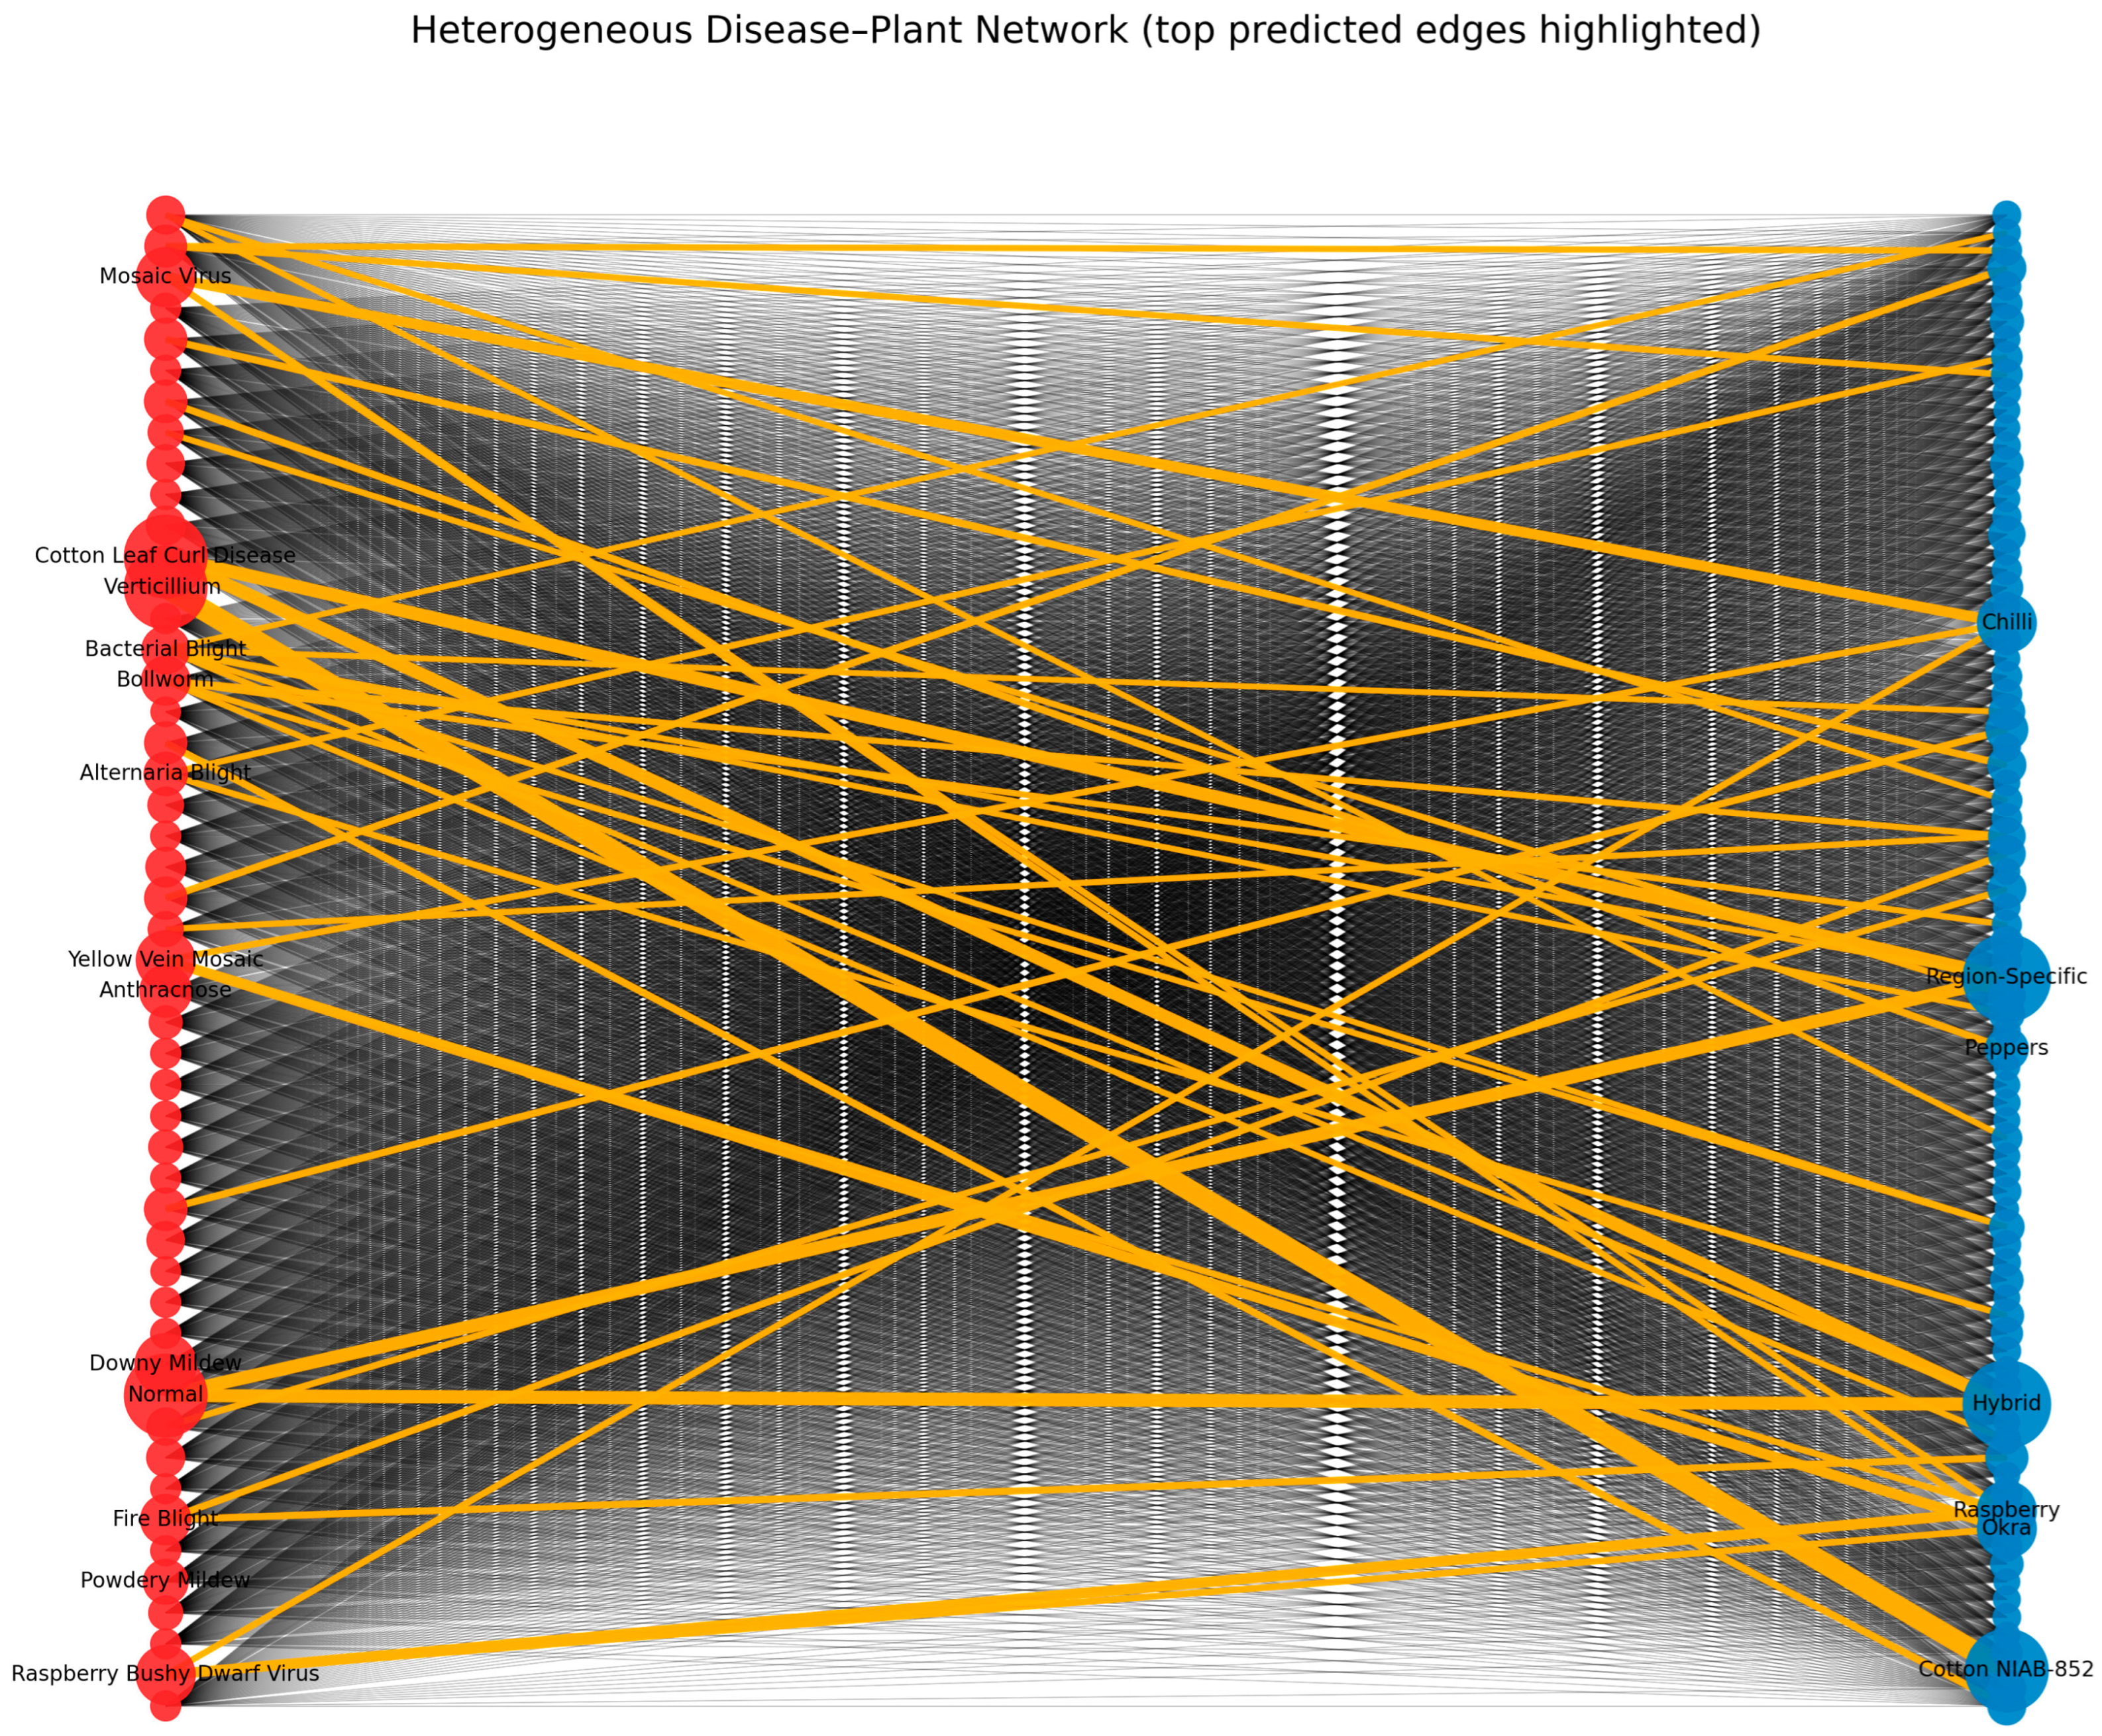
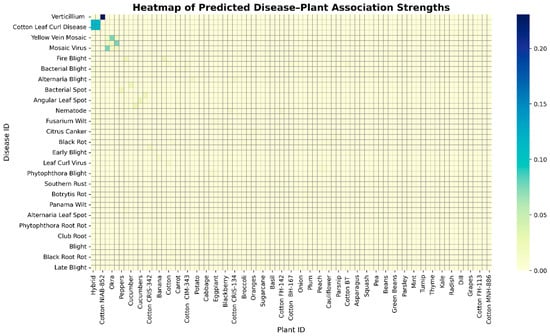
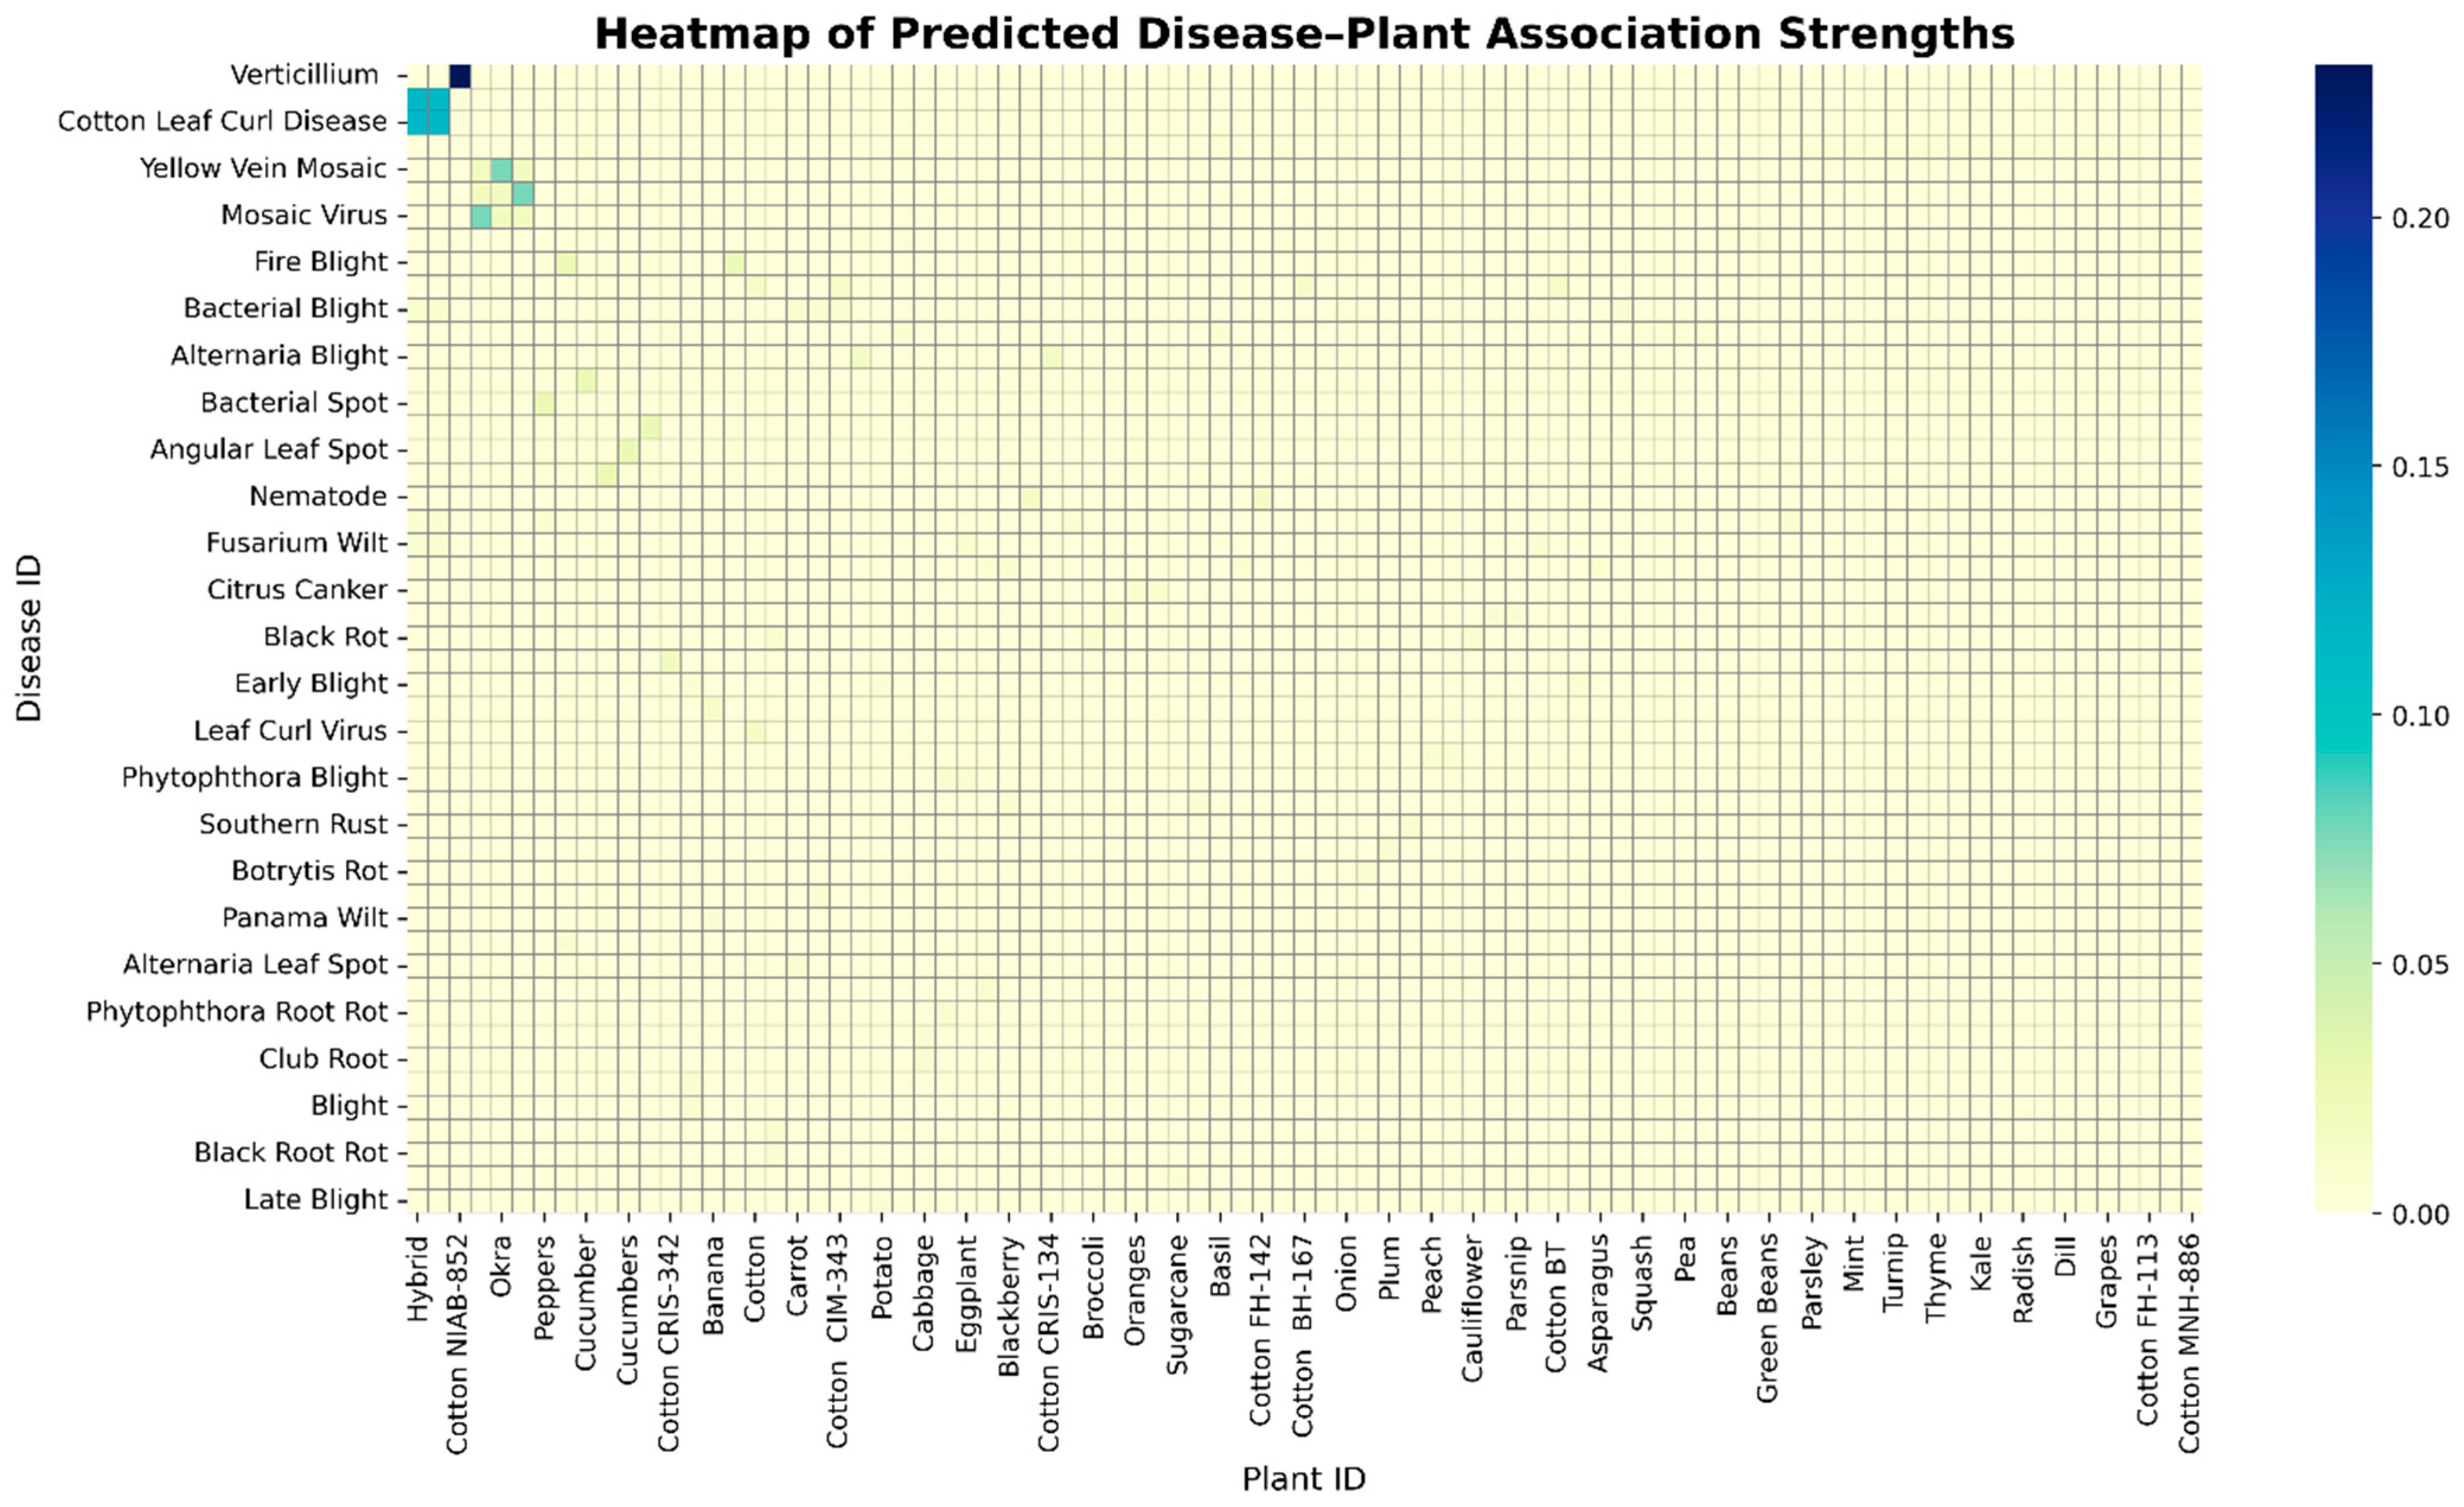
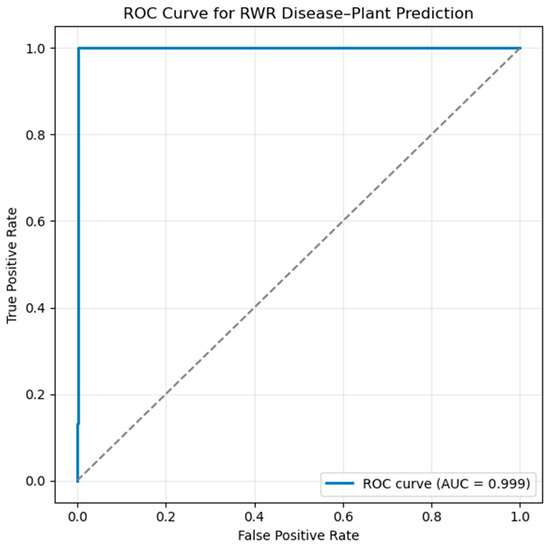
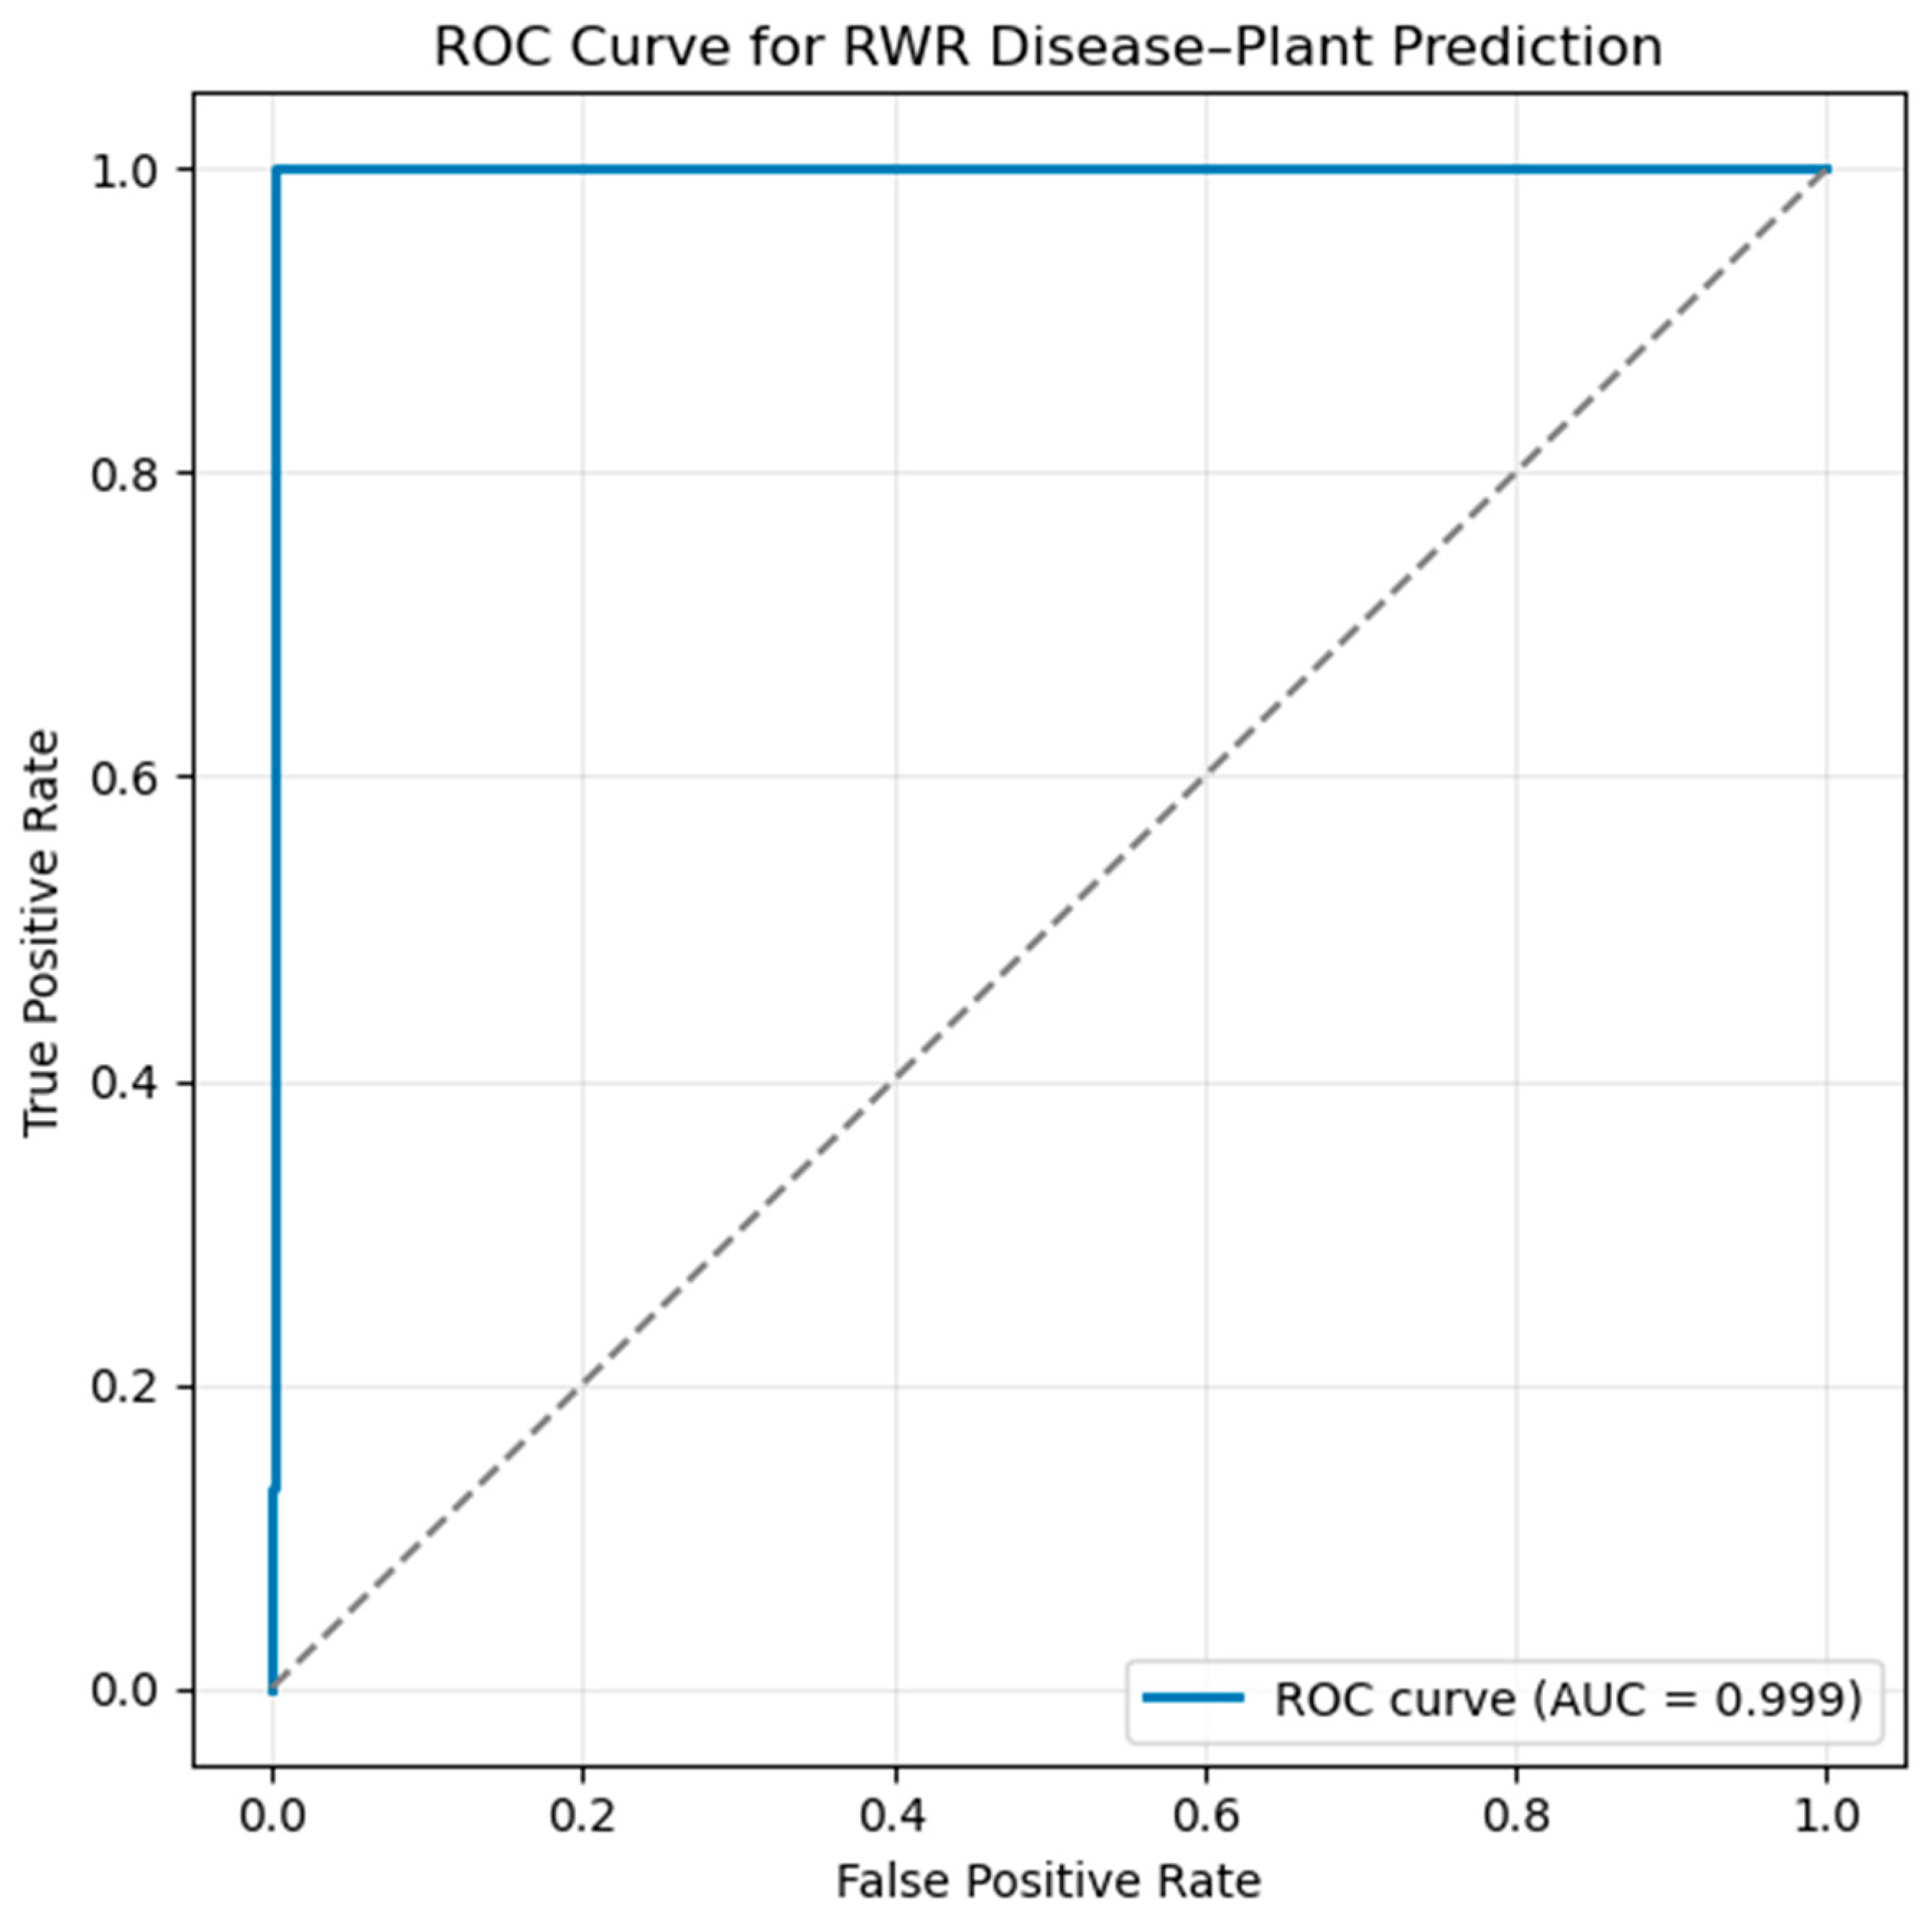
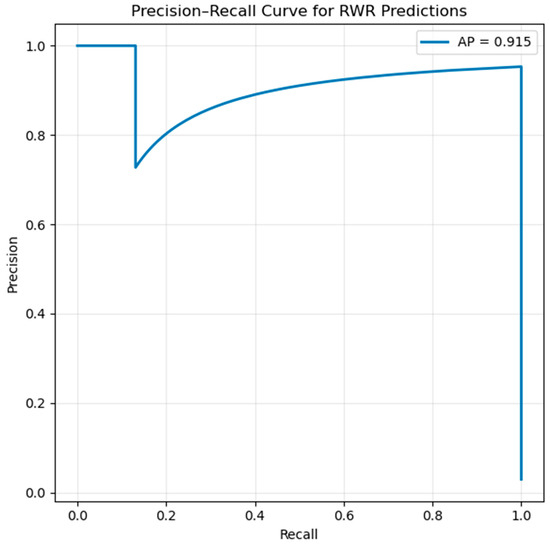
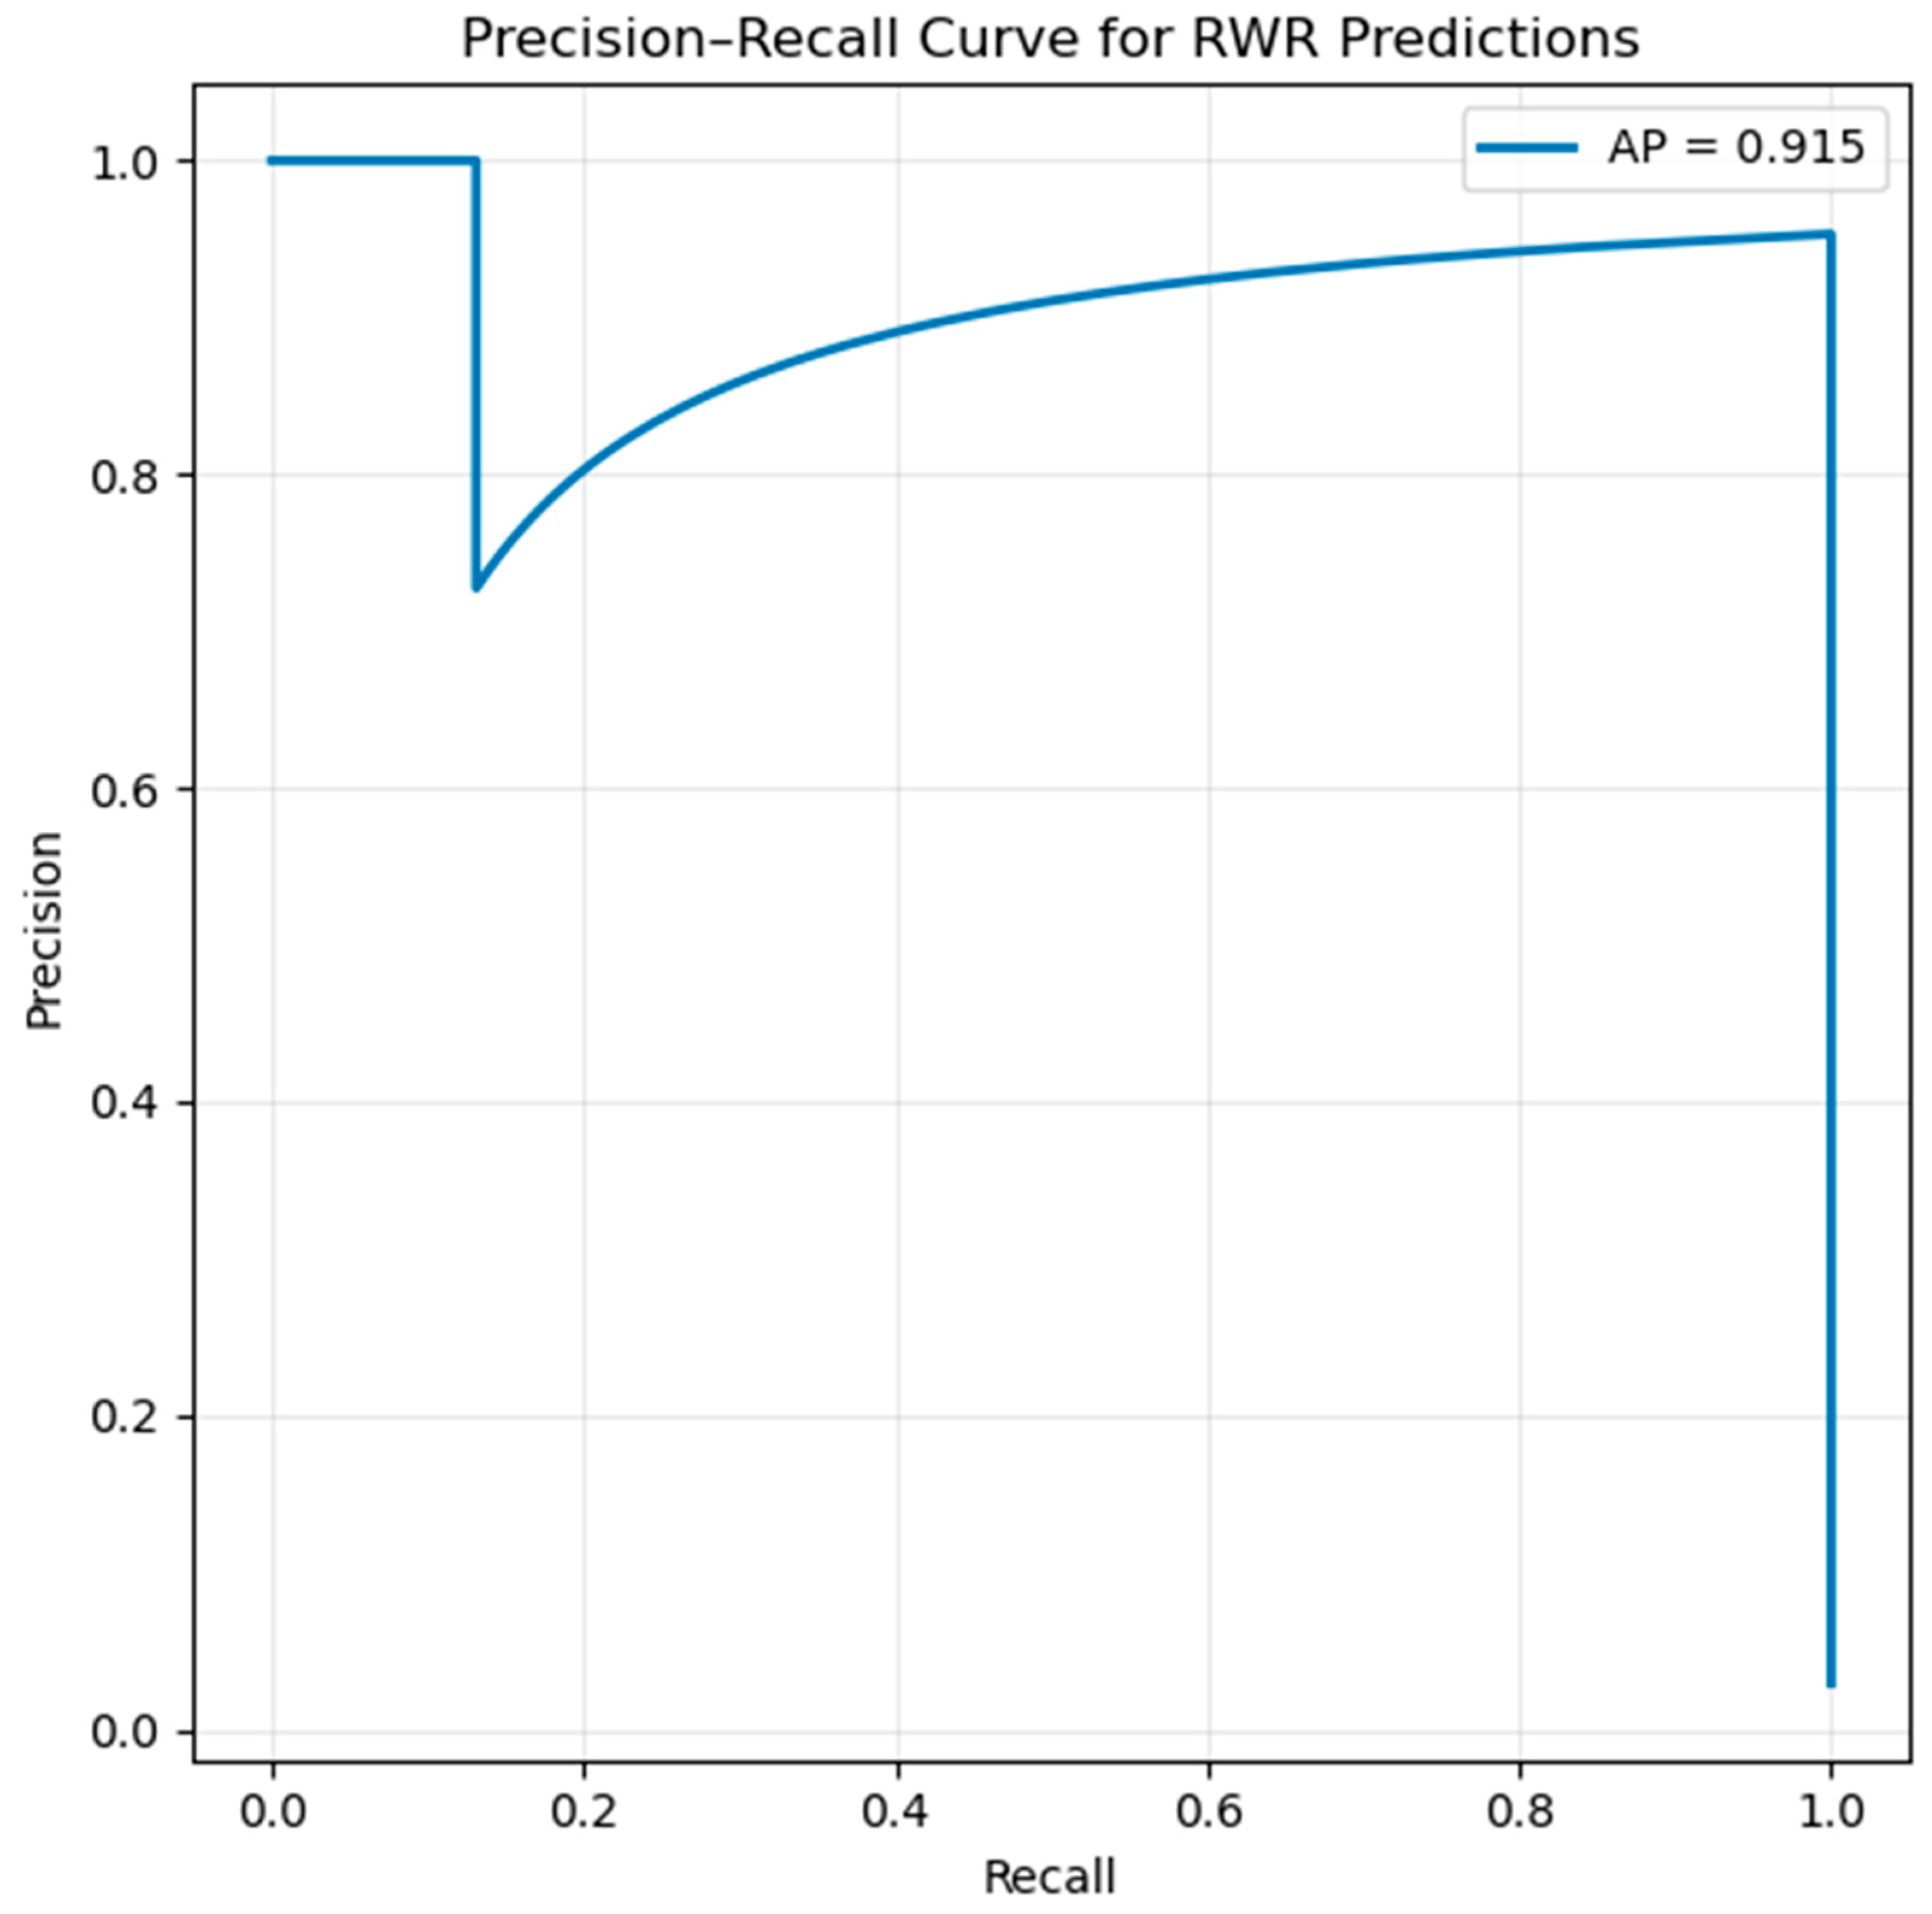
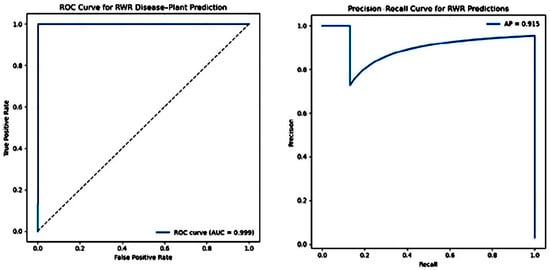
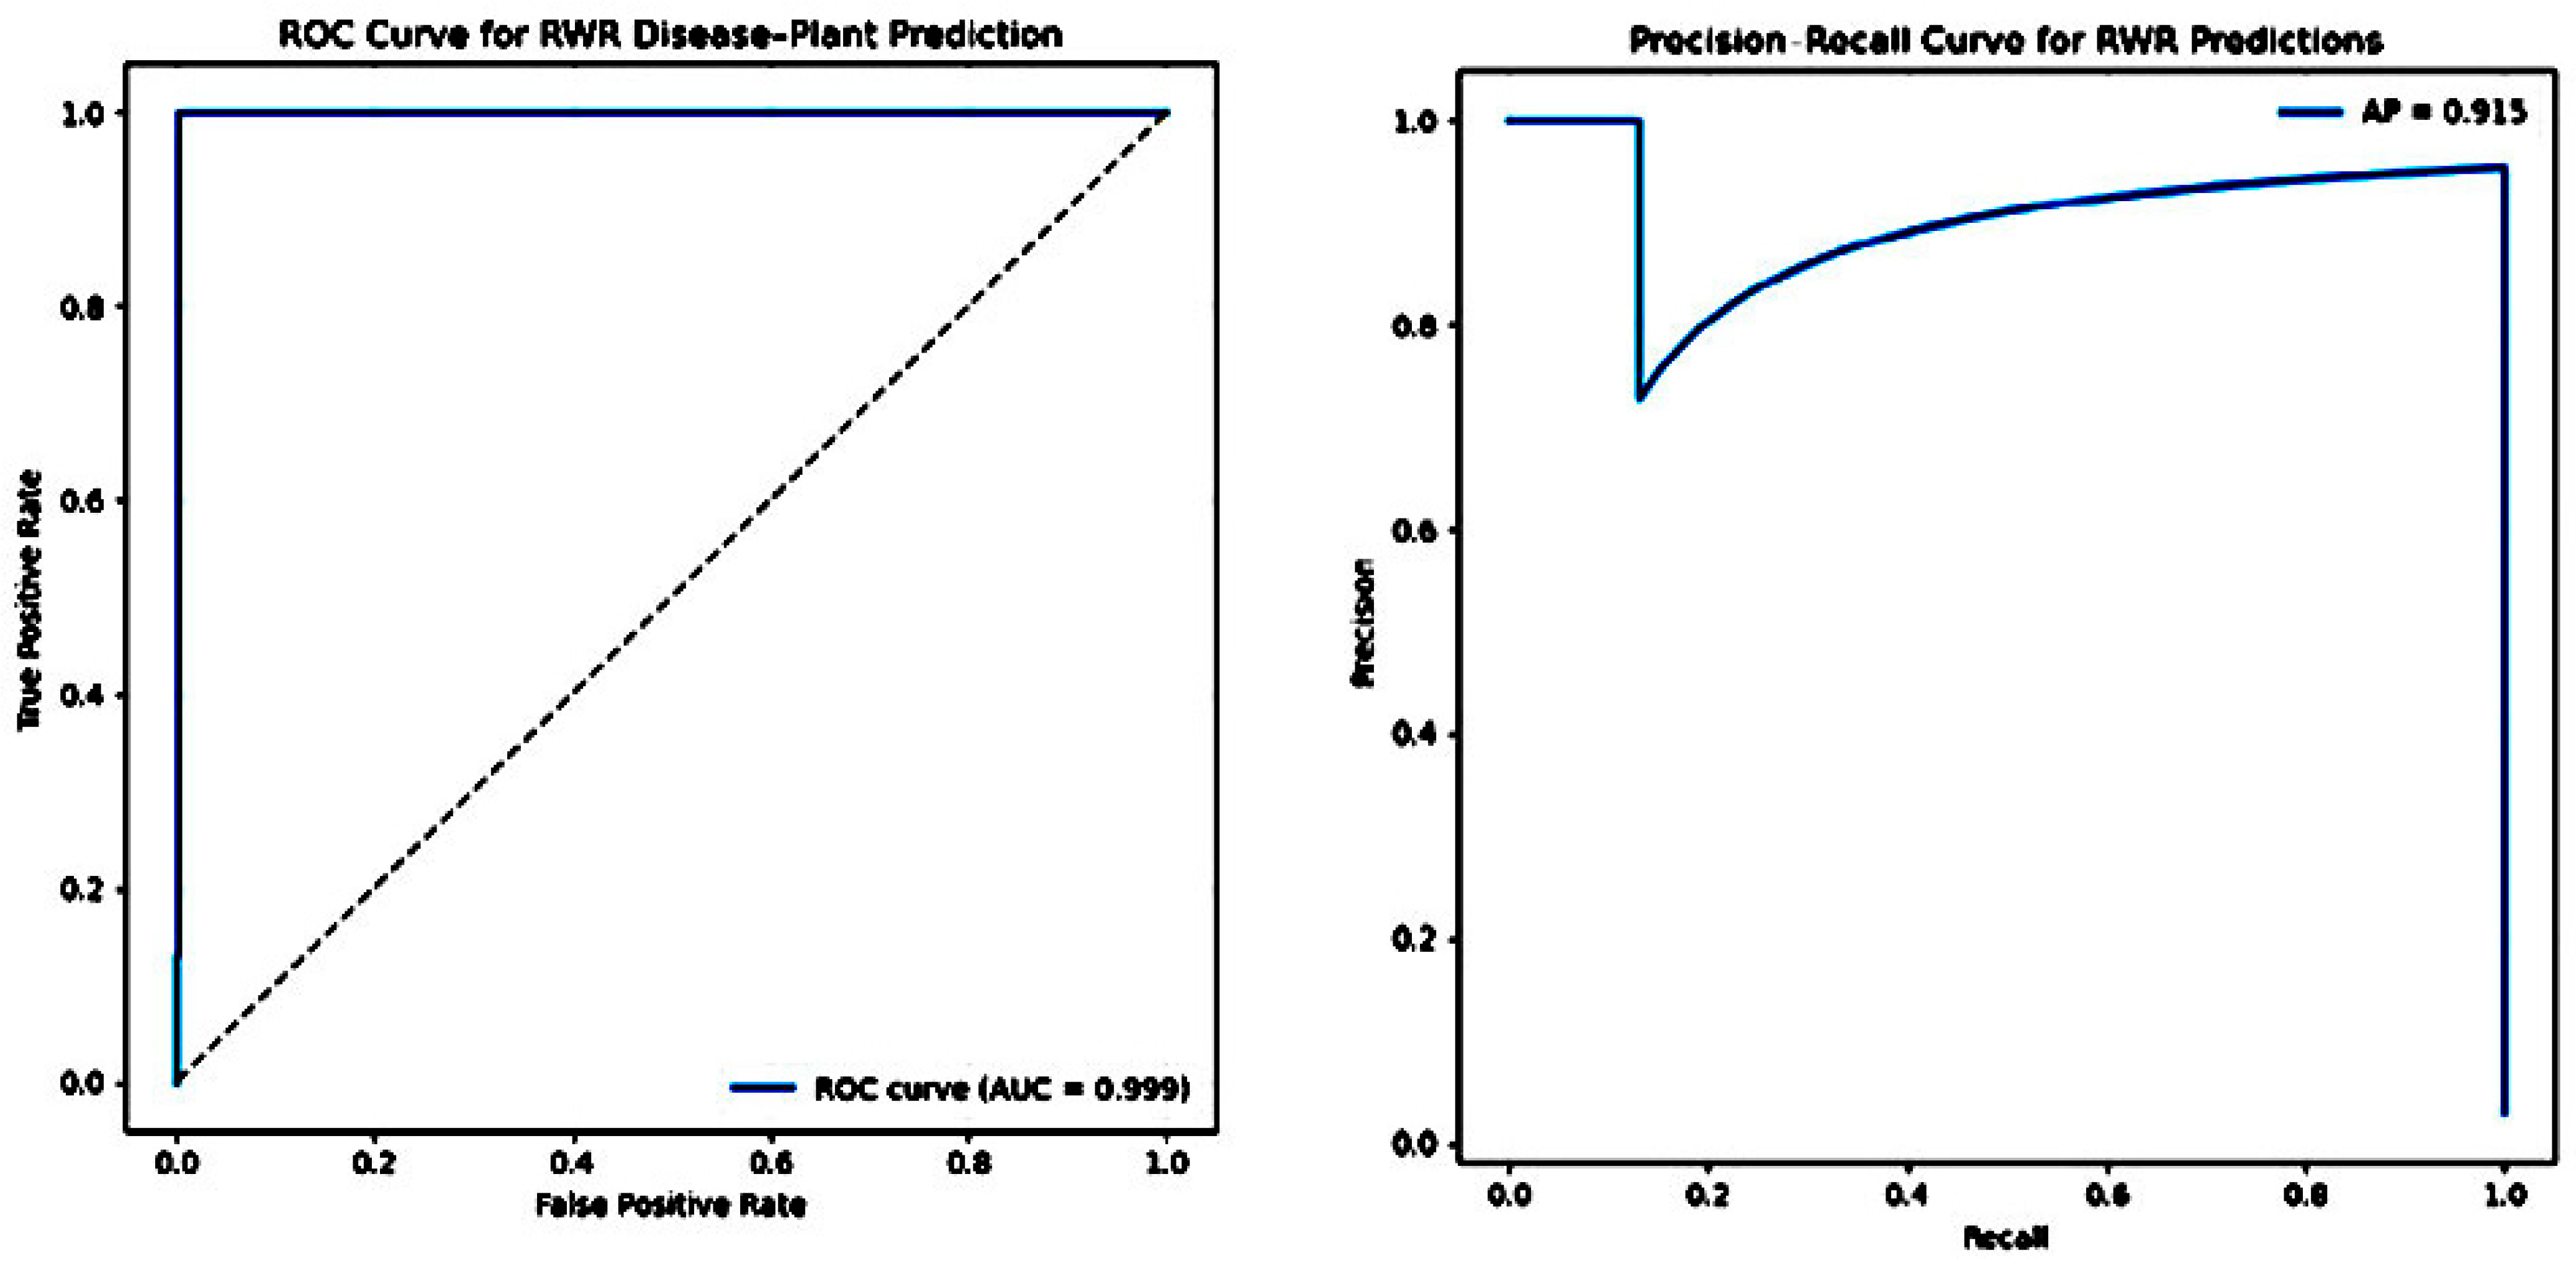
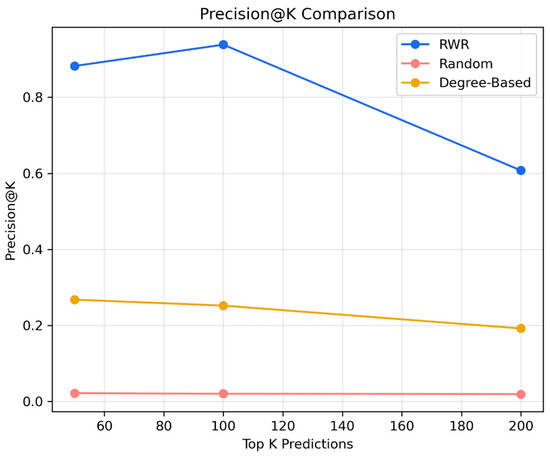
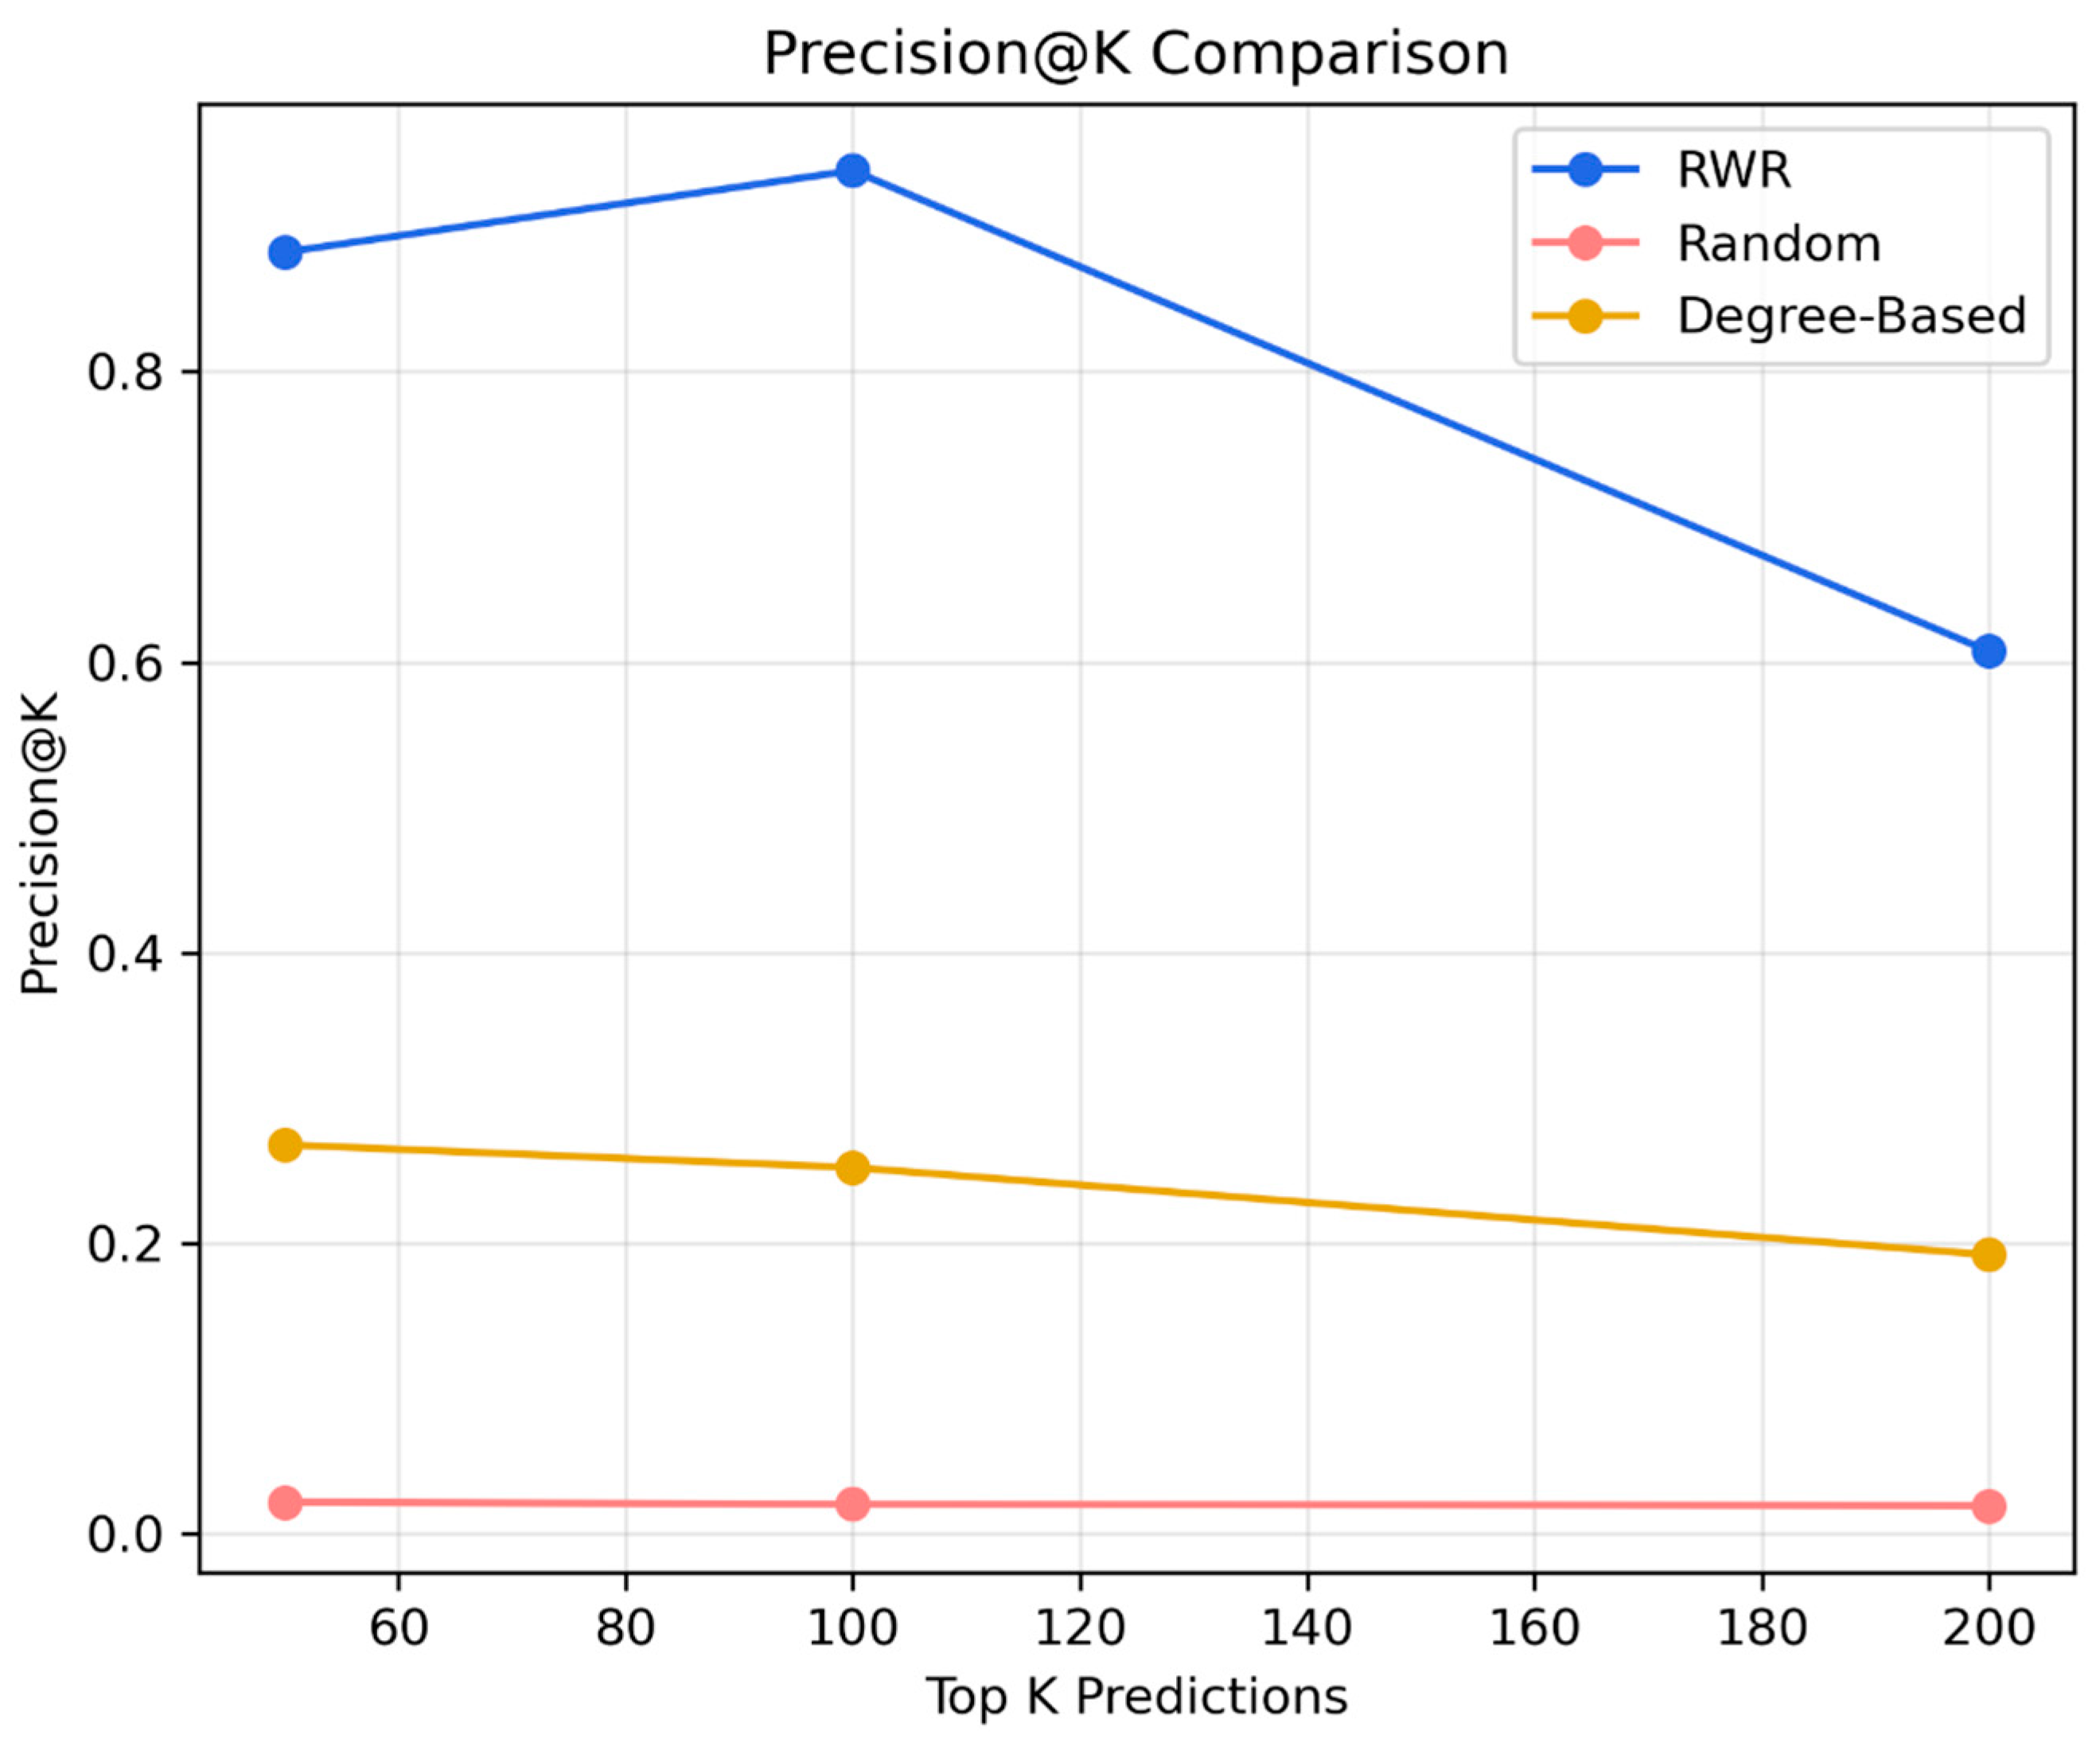
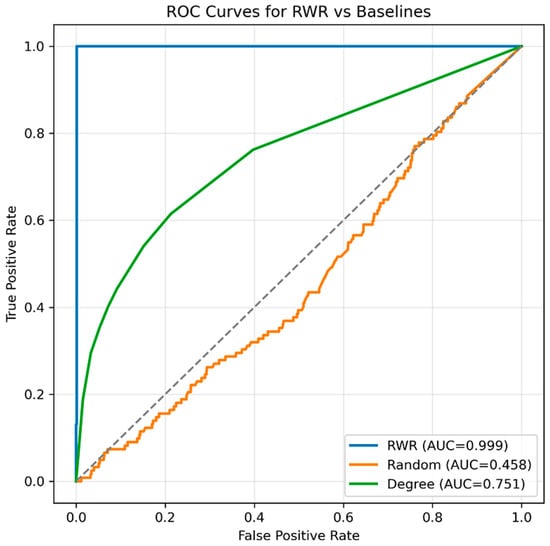
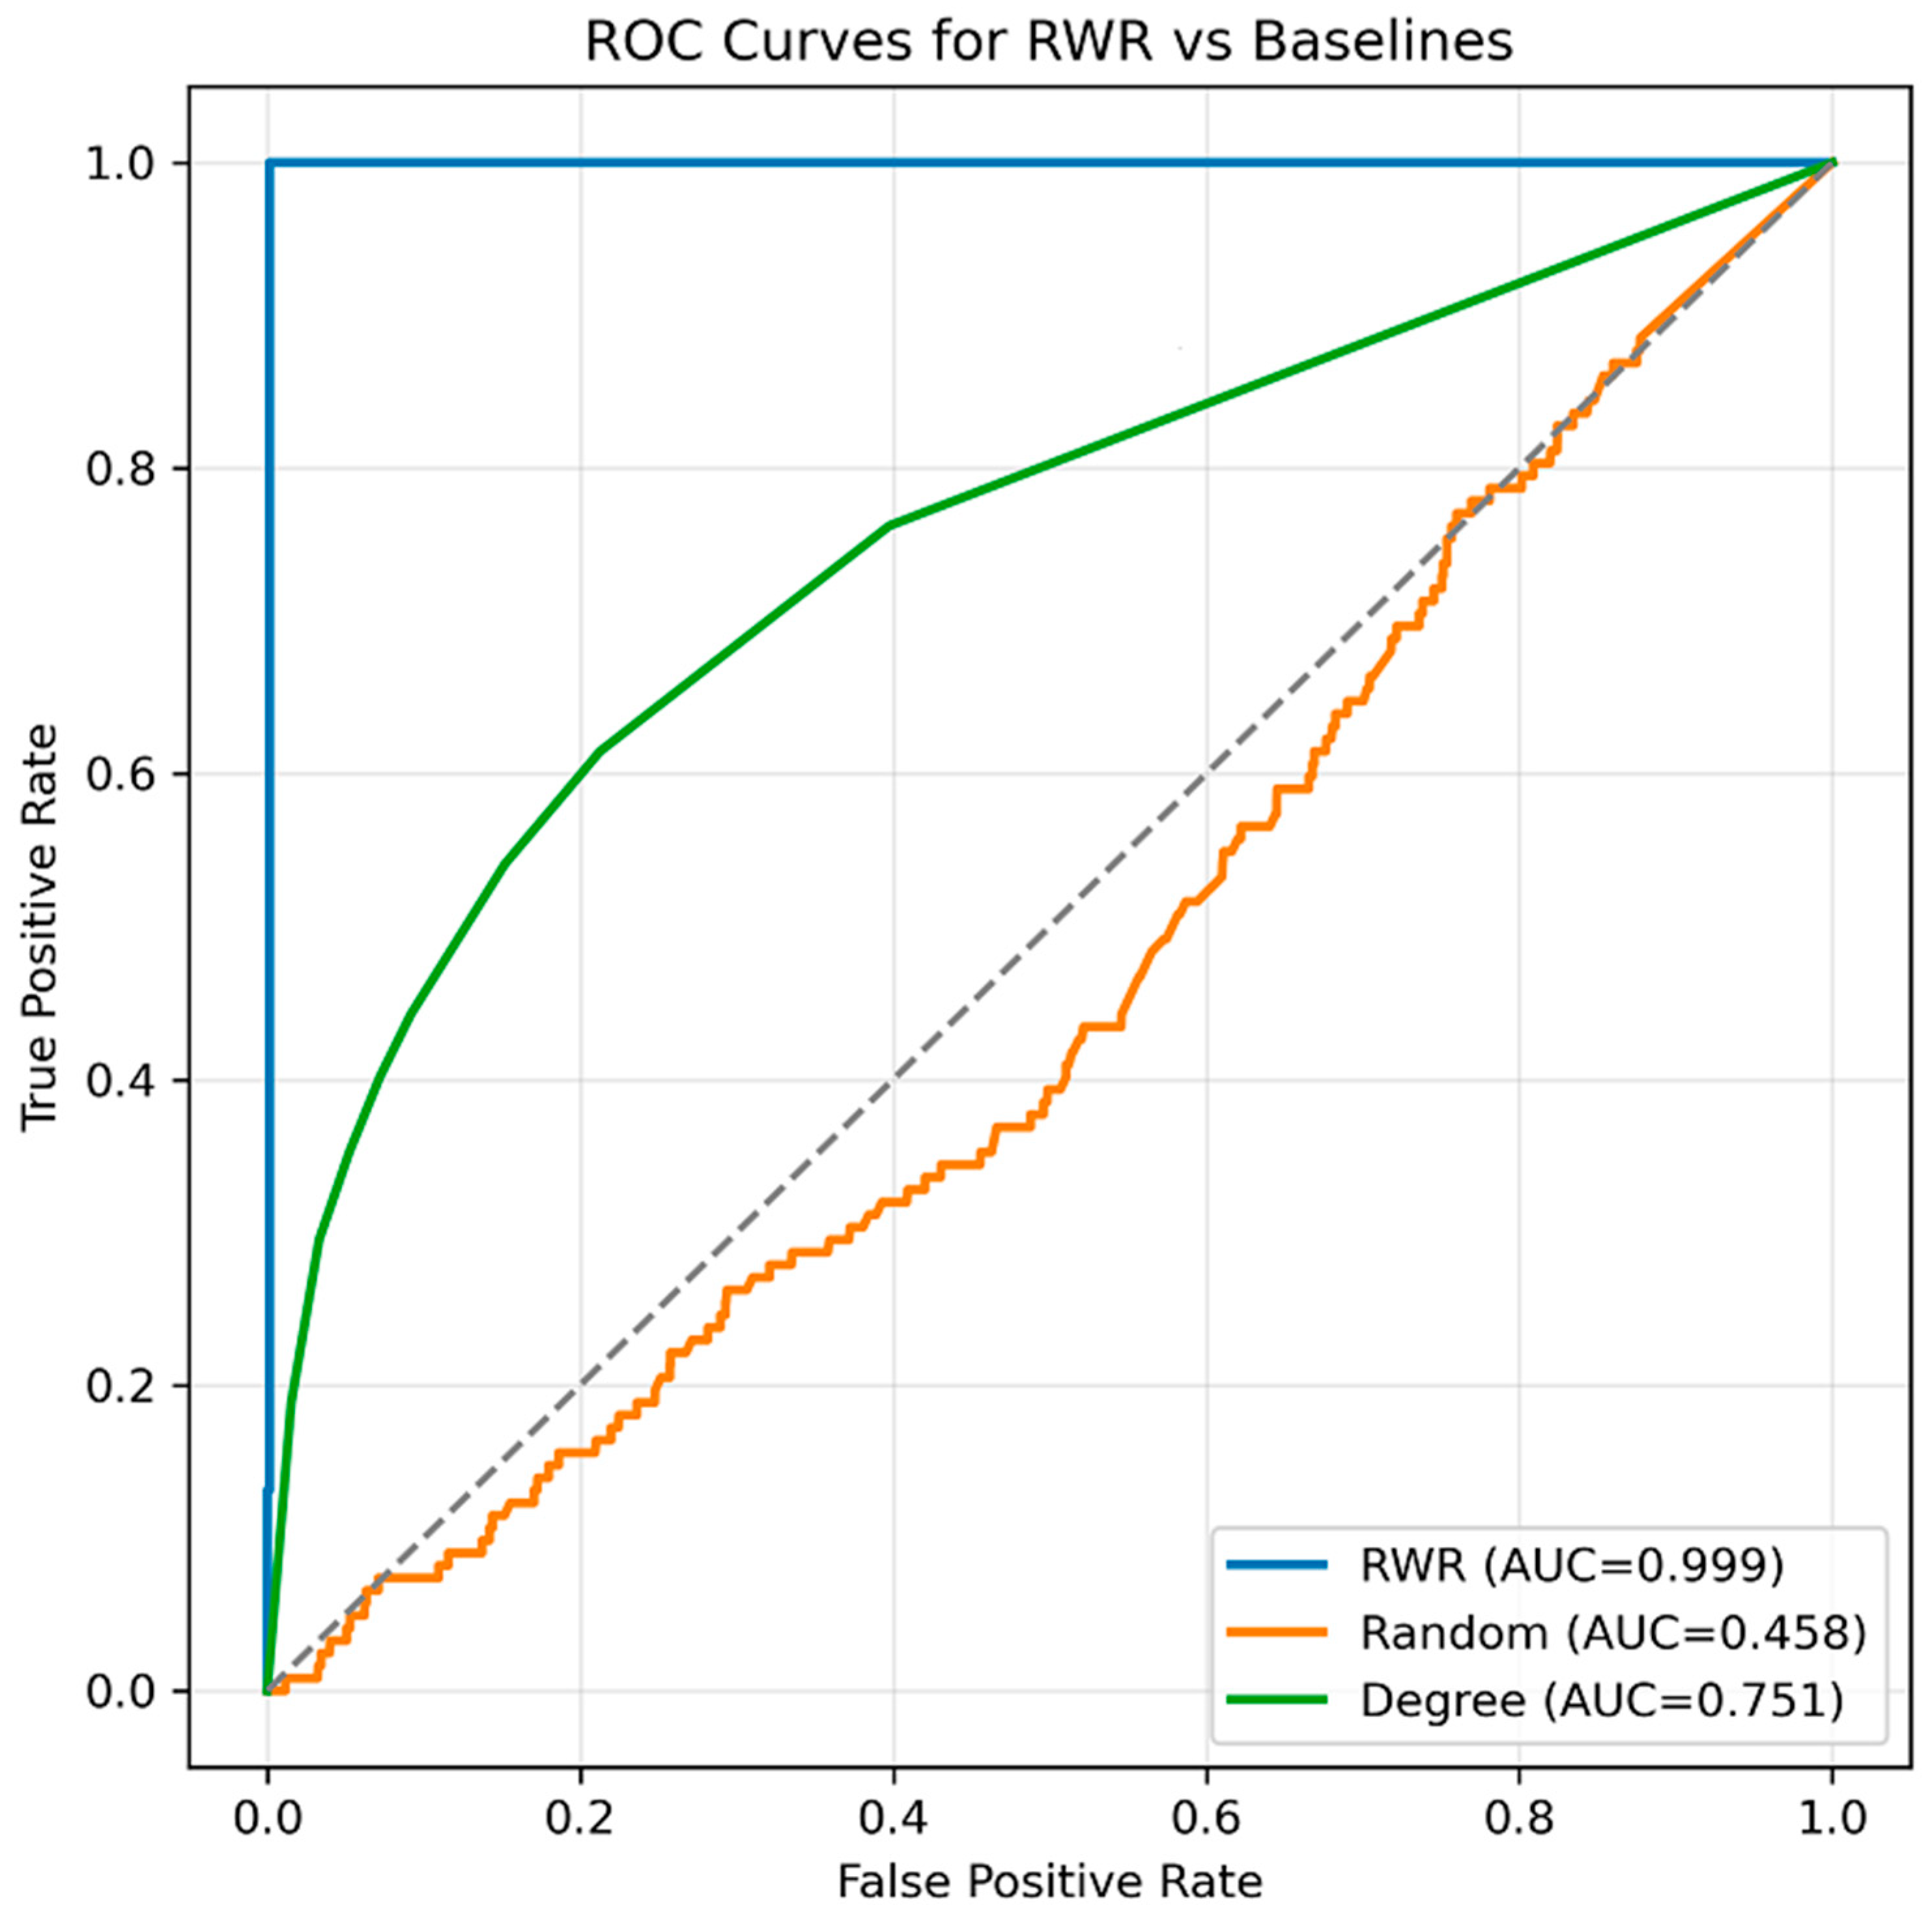
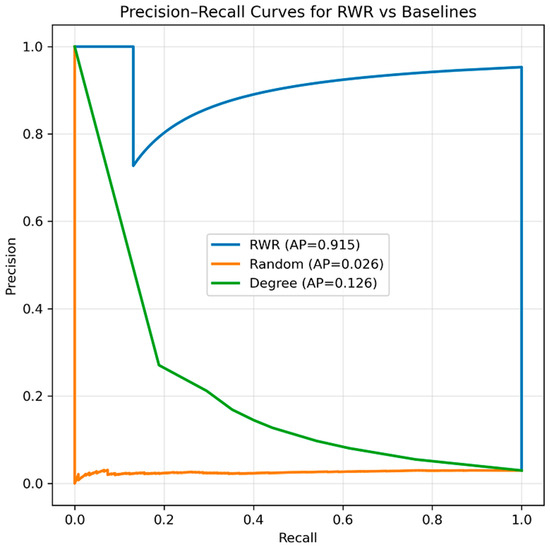
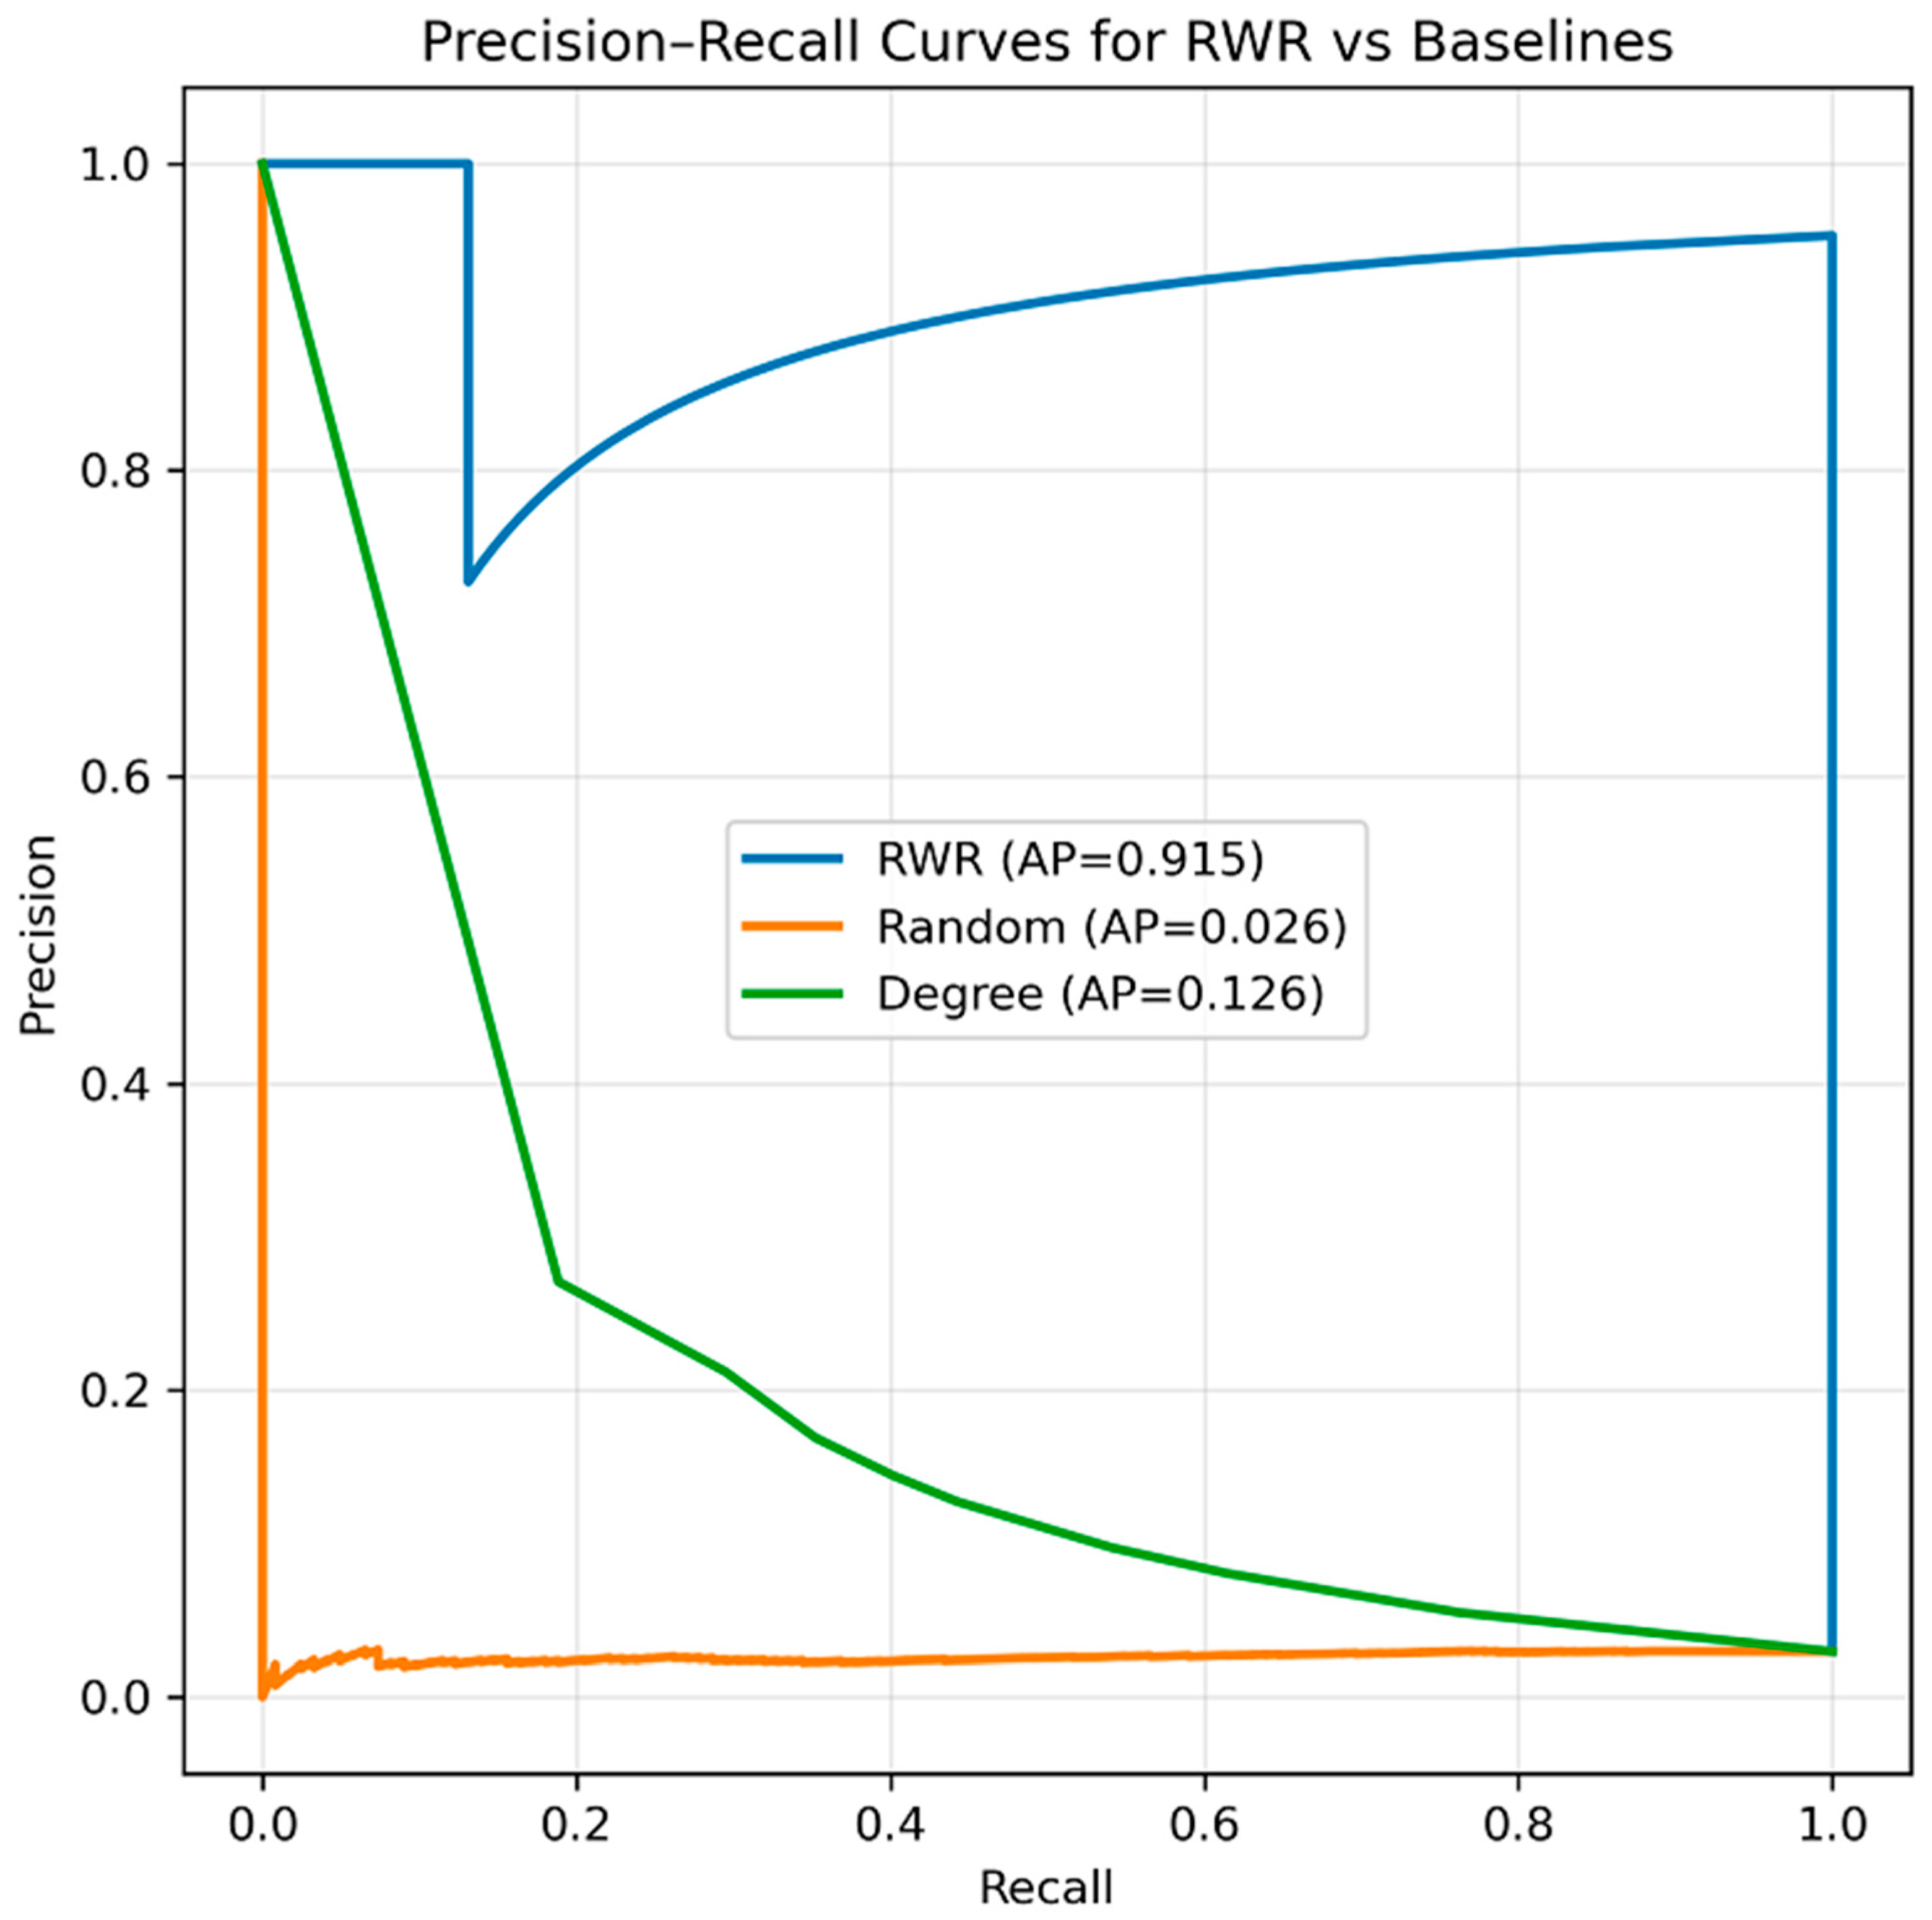
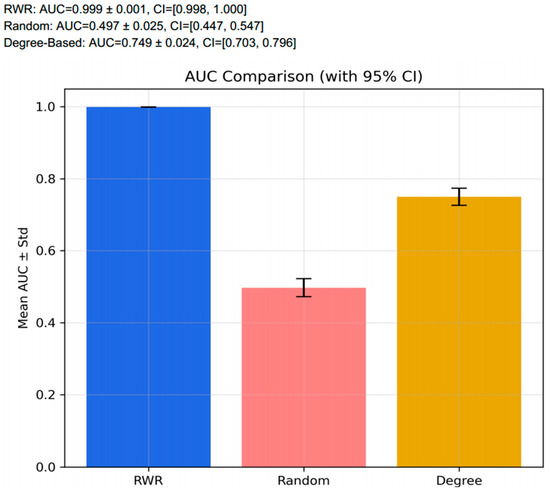
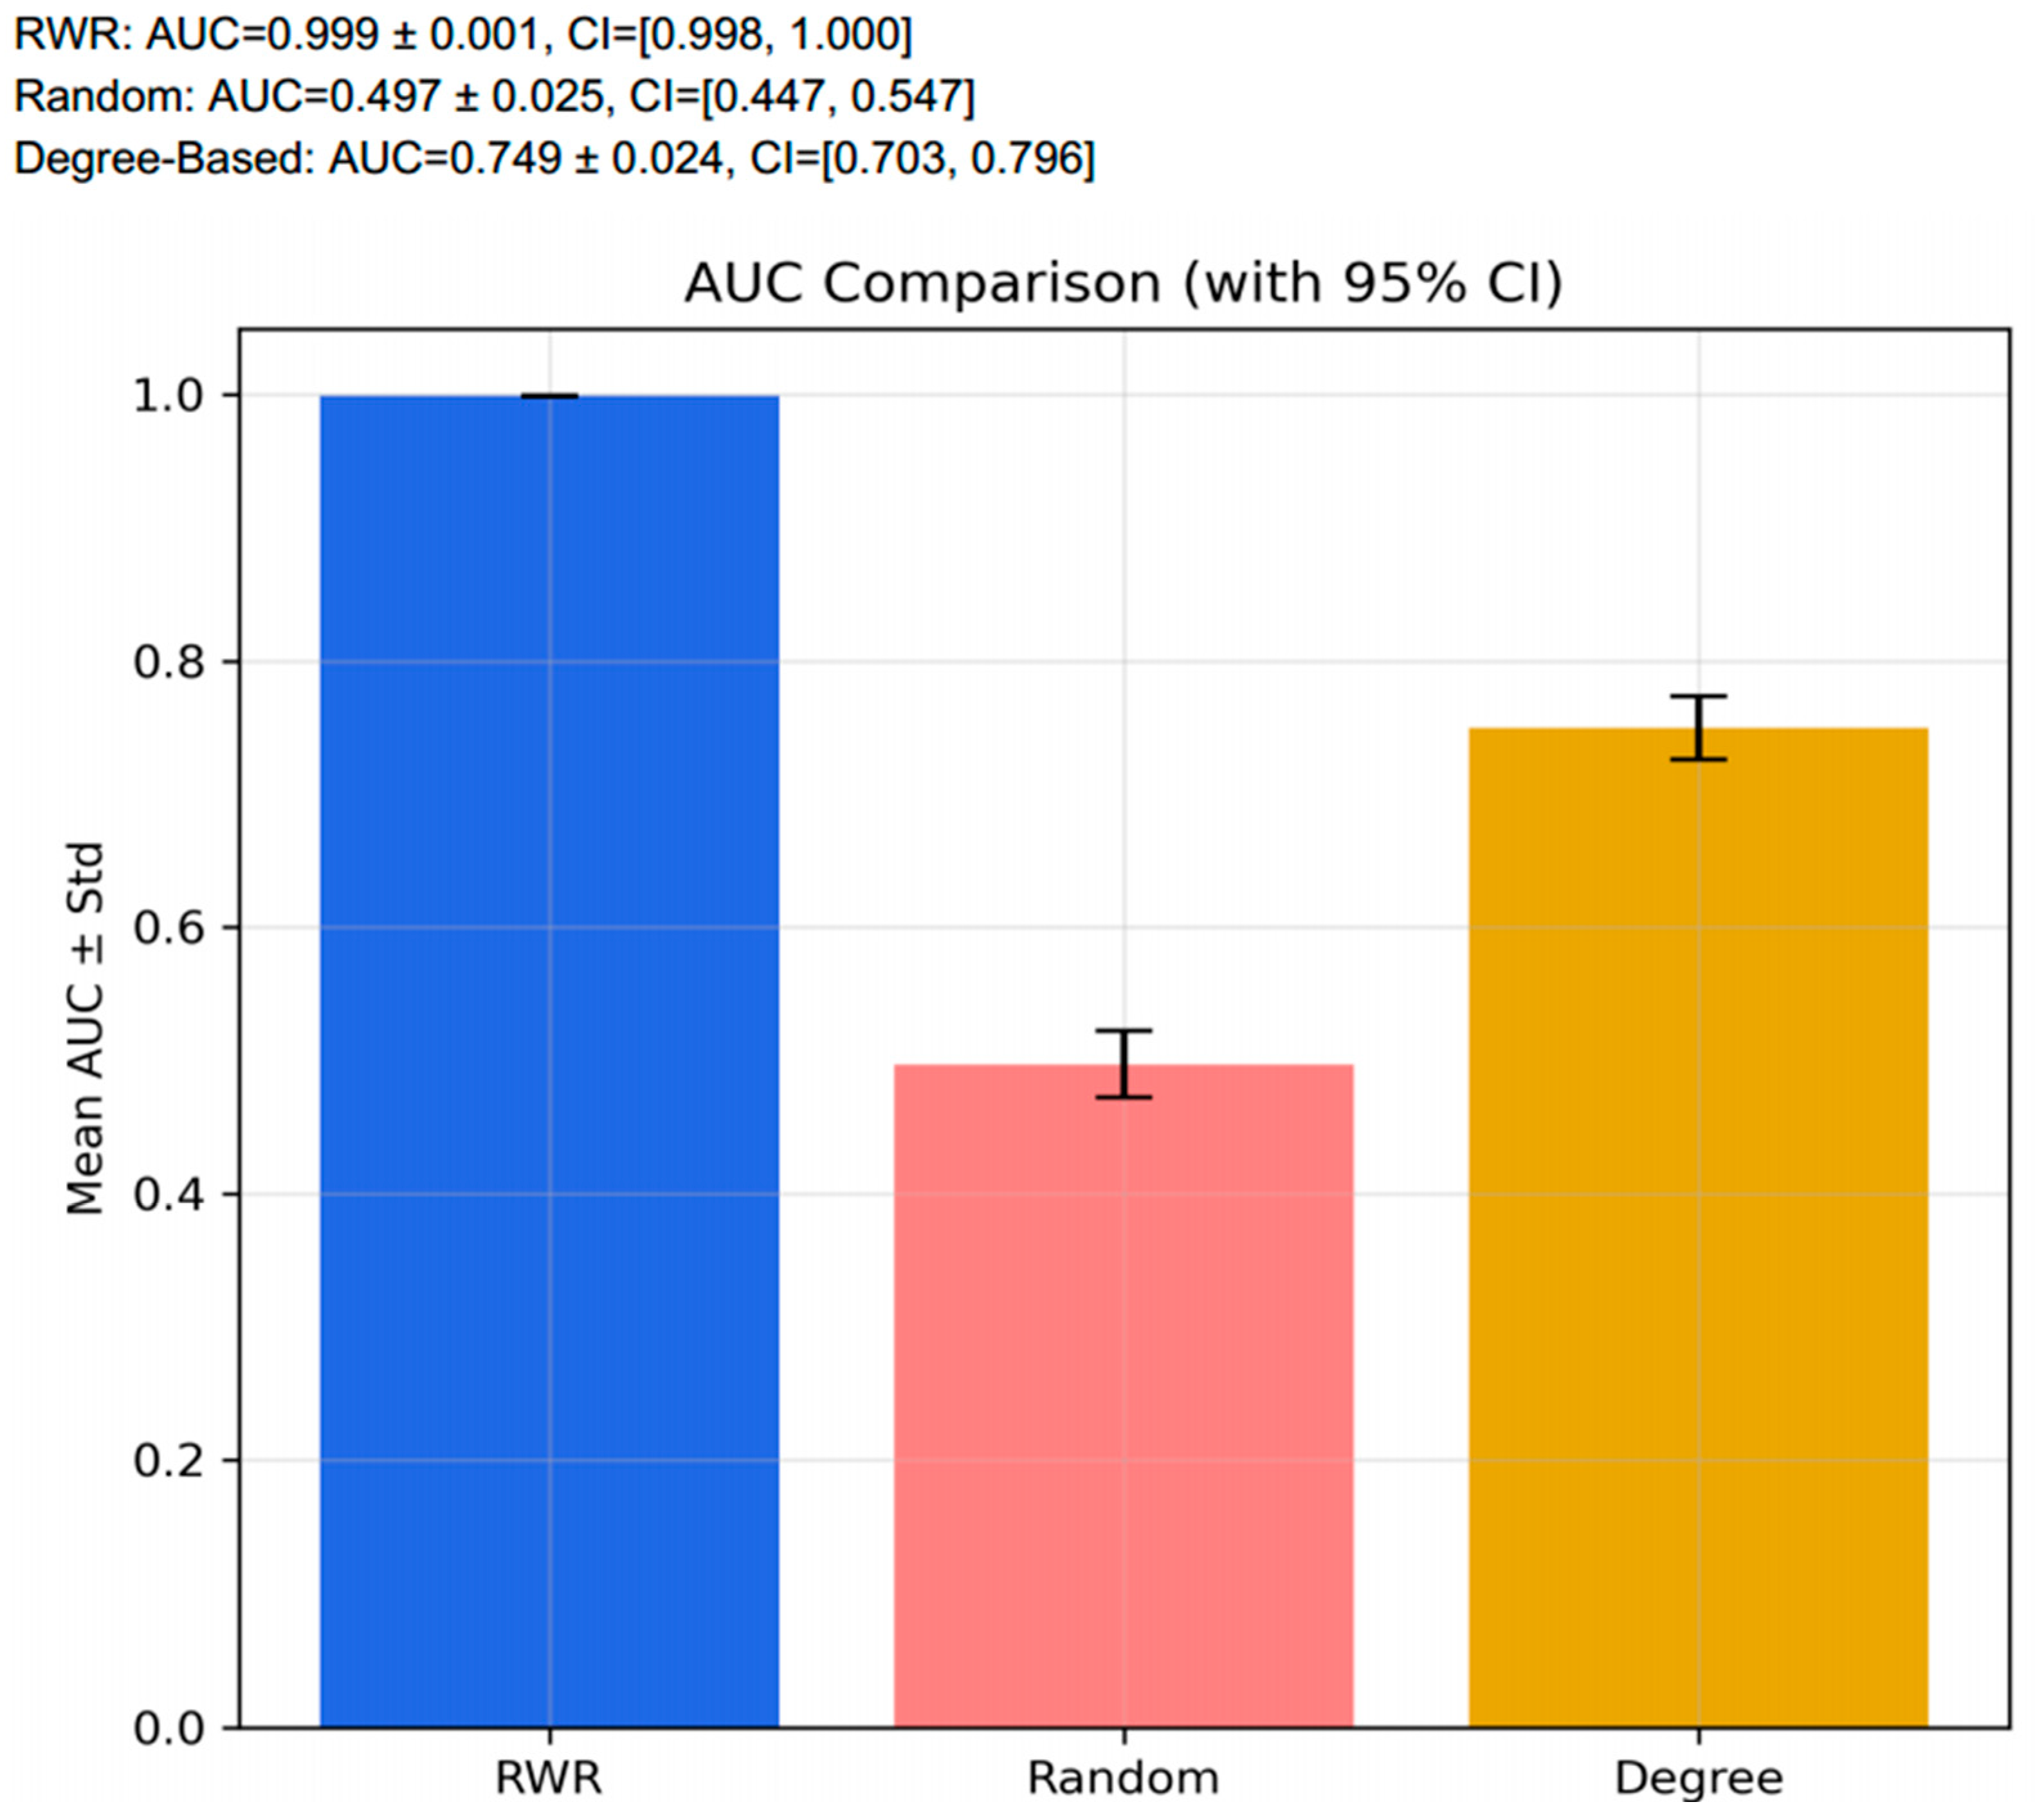
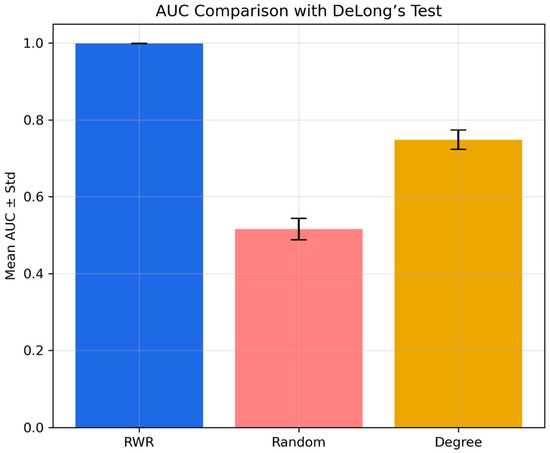
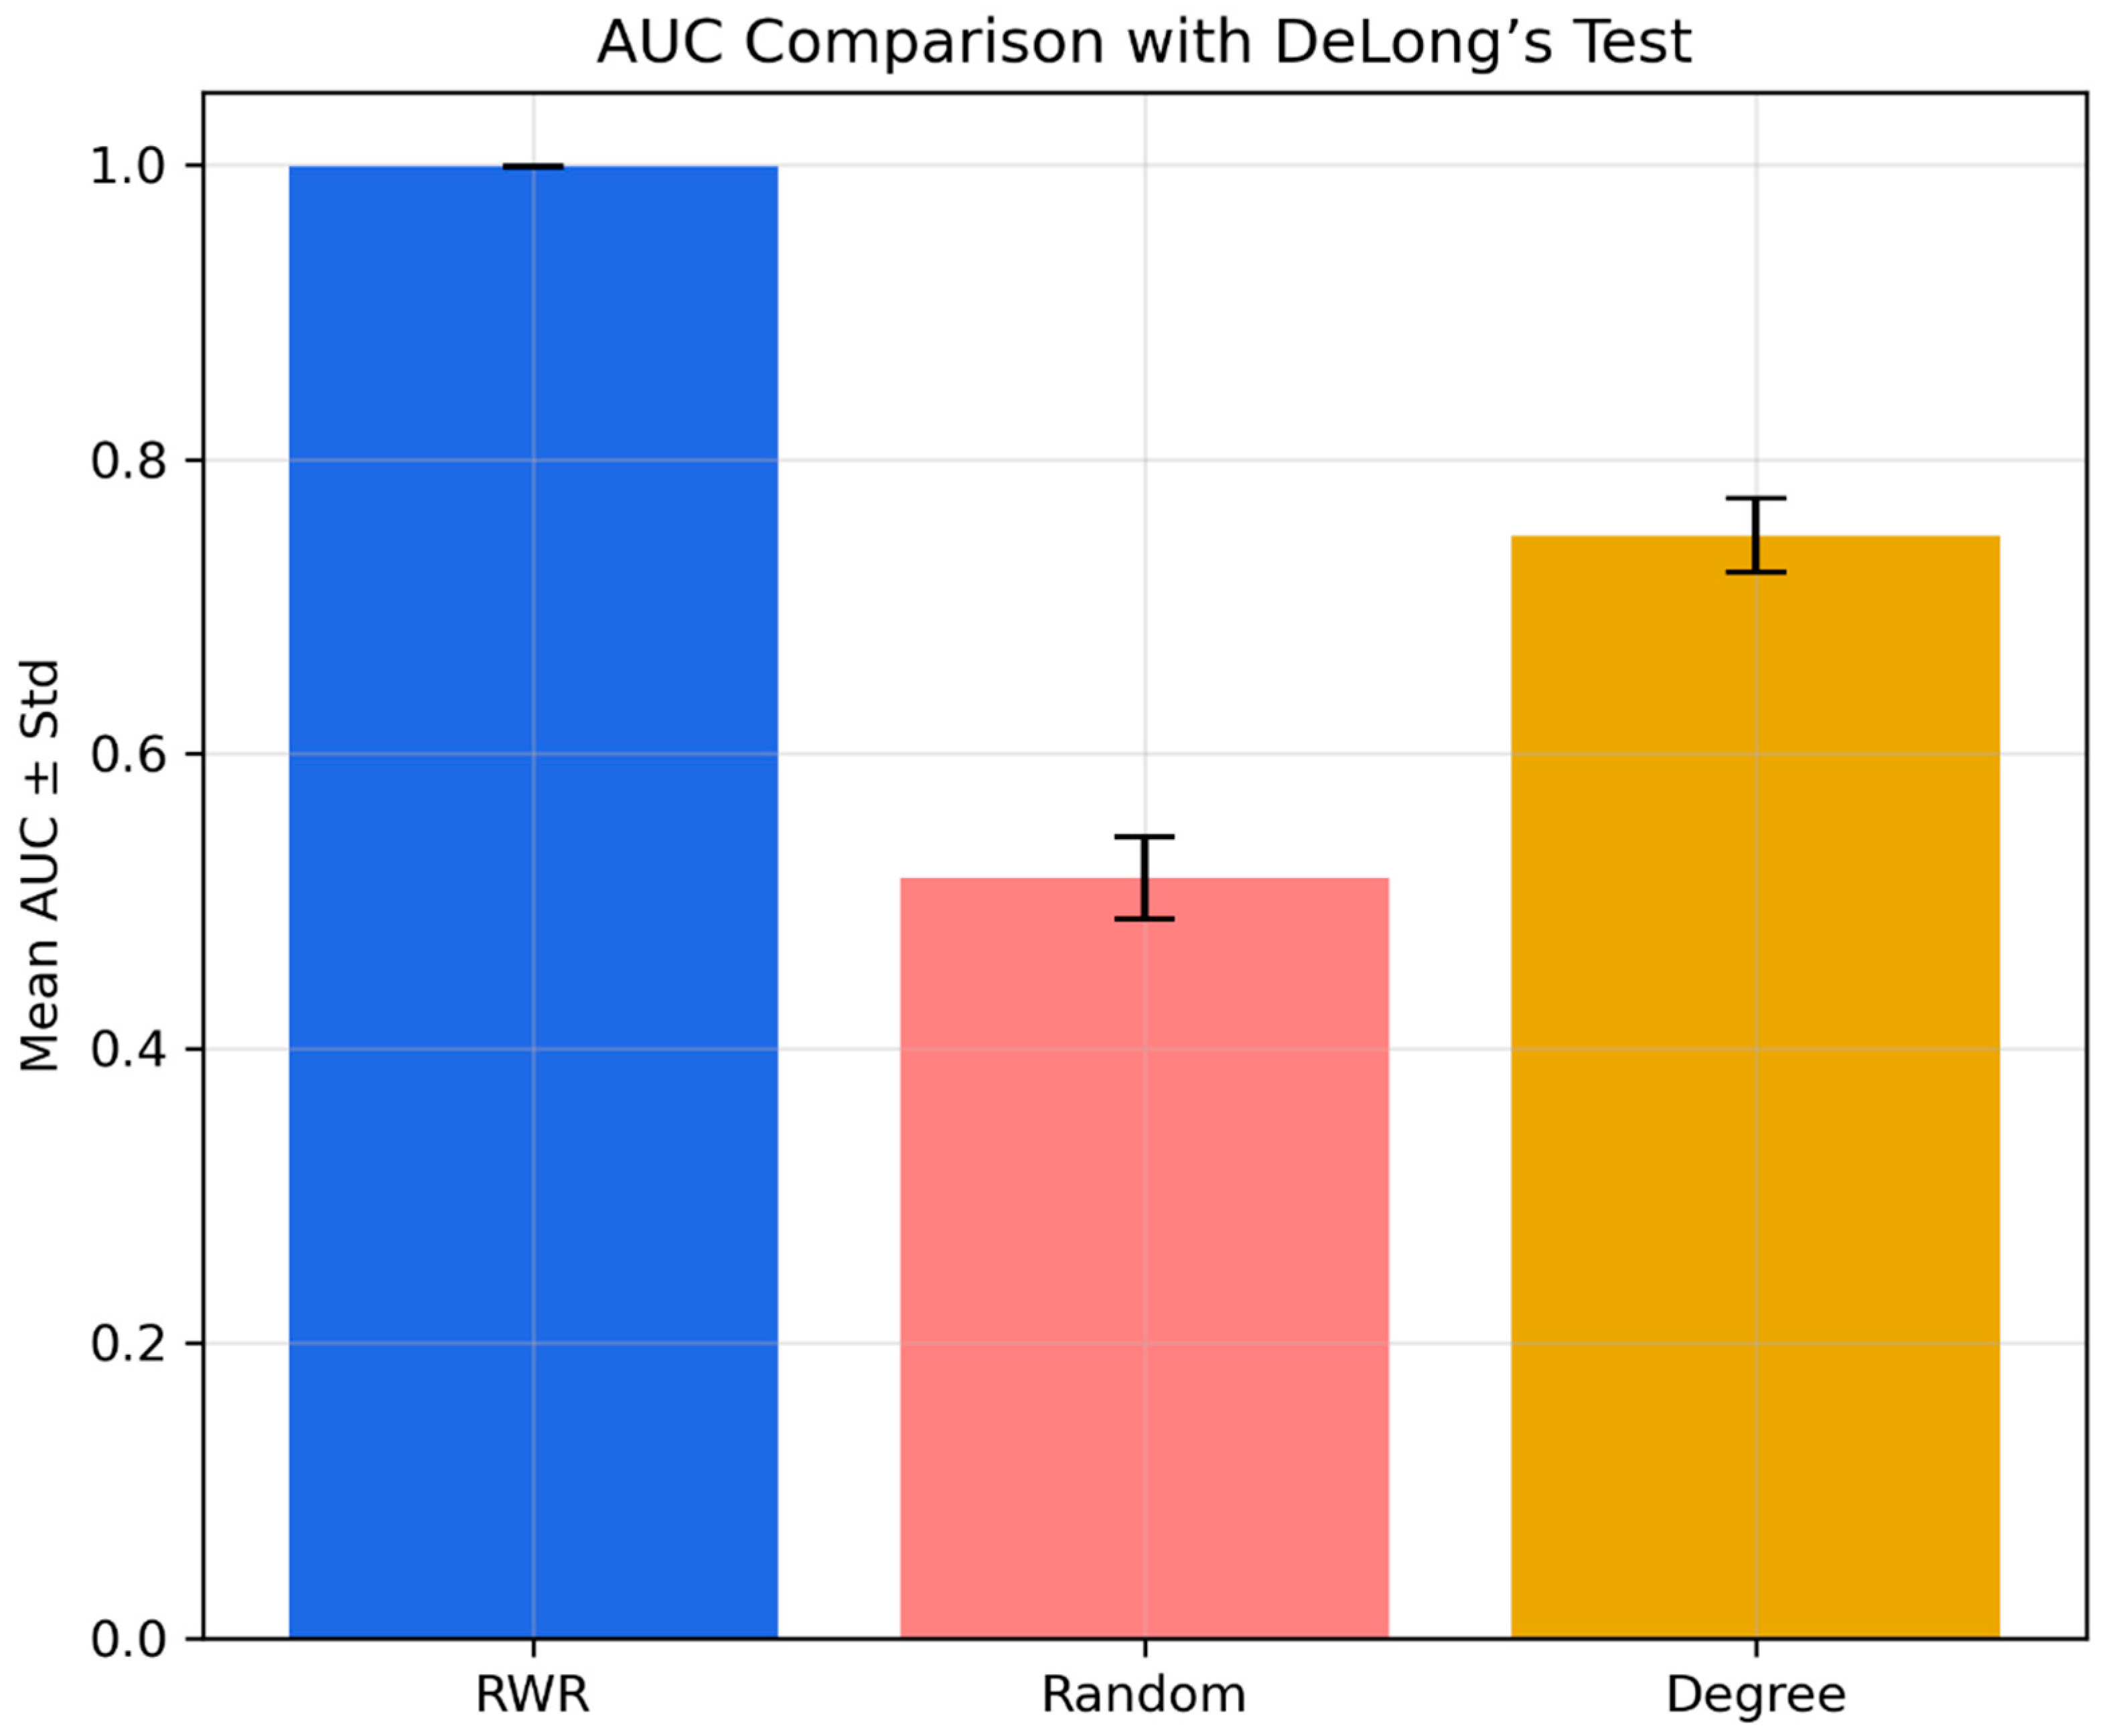

Disclaimer/Publisher’s Note: The statements, opinions and data contained in all publications are solely those of the individual author(s) and contributor(s) and not of MDPI and/or the editor(s). MDPI and/or the editor(s) disclaim responsibility for any injury to people or property resulting from any ideas, methods, instructions or products referred to in the content. |
© 2026 by the authors. Licensee MDPI, Basel, Switzerland. This article is an open access article distributed under the terms and conditions of the Creative Commons Attribution (CC BY) license.