Article

An Investigation of the Impacts of Controlled Traffic Farming on Soil Properties

by
Raveendrakumaran Bawatharani
1,2,*,
Miles Grafton
1,
Paramsothy Jeyakumar
1,
Peter Bishop
1 and
Clive Davies
3
1
School of Agriculture and Environment, Massey University, Private Bag 11 222, Palmerston North 4442, New Zealand
2
Department of Agricultural Engineering, Faculty of Agriculture, Eastern University, Chenkalady 30350, Sri Lanka
3
School of Food and Advanced Technology, Massey University, Palmerston North 4442, New Zealand
*
Author to whom correspondence should be addressed.
AgriEngineering 2026, 8(2), 54; https://doi.org/10.3390/agriengineering8020054
Submission received: 16 December 2025 / Revised: 14 January 2026 / Accepted: 17 January 2026 / Published: 3 February 2026

Abstract

Soil compaction caused by uncontrolled machinery traffic is a major constraint to sustainable crop production. Controlled Traffic Farming (CTF), which restricts machinery movement to permanent lanes, has been practiced in New Zealand for more than a decade but has not been evaluated against Random Traffic Farming (RTF). This knowledge gap limits farmer awareness and adoption. This study hypothesized that CTF reduces soil compaction and improves soil physical properties compared with RTF. A one-year field experiment was conducted at Pukekohe, New Zealand, using annual ryegrass grown under CTF and RTF. Soil penetration resistance (PR), bulk density, total porosity, moisture content, and air-filled porosity were measured to a 40 cm depth. RTF increased soil PR relative to CTF across 10–40 cm. Bulk density was lower under CTF (0.96–1.03 g·cm−3) than RTF (1.11–1.30 g·cm−3), with improved total porosity (0.60–0.62 cm·cm−3) and aeration (12–23 cm·cm−3). CTF achieved a 5.7% higher bed-level yield. When scaled to the whole-field context, the productivity of tramlines contributed to 8% greater dry matter yield under CTF than RTF, indicating that the area allocated to tramlines did not negate the system-level productivity. This study provides the first New Zealand-specific empirical comparison of CTF and RTF to support adoption of CTF.

1. Introduction

Agricultural machinery movements are widely recognized as the primary cause of soil compaction, particularly in intensively managed cropping systems [1]. The increasing size and weight of modern equipment intensify this problem, especially under moist soil conditions where the risk of compaction is greatest [2]. Compaction reduces soil porosity and aeration, lowers saturated hydraulic conductivity, and increases mechanical resistance [3,4]. These changes restrict root elongation, limit water infiltration, and reduce plant access to nutrients and moisture. Compacted soils also exhibit elevated bulk density and penetration resistance, suppressing microbial activity and disrupting biogeochemical processes. Consequently, sustainable crop productivity is threatened, with meta-analyses showing yield losses of up to 30% in cereals such as wheat, maize, and barley under compacted conditions, depending on soil texture and severity [2].
Conventional mitigation strategies, including deep tillage, often fail to alleviate persistent subsoil compaction, which can remain for decades [5]. While repeated tillage may temporarily reduce surface compaction, it does not address deeper layers, particularly in fine-textured soils [6]. Random Traffic Farming (RTF), where machinery moves without fixed lanes, further exacerbates compaction by distributing wheel tracks across the entire field each season, reducing pore space and impairing water and air movement [7]. In contrast, Controlled Traffic Farming (CTF) offers a preventive approach by confining machinery to permanent traffic lanes, thereby protecting the cropped zone from compaction and improving draught efficiency [8,9,10]. CTF reduces wheel load impacts and yield losses [11] and has been shown to enhance bulk density, penetration resistance, infiltration, hydraulic conductivity, and nutrient cycling [12]. It may also improve fertilizer use efficiency by reducing nutrient losses and enhancing root access compared with RTF [13].
International studies report that RTF can compact 80–100% of the field area in intensive tillage systems and 30–60% in conservation tillage systems [14], whereas CTF restricts compaction to only 10–20% of the field [15,16]. Field trials globally have demonstrated yield gains of up to 14% under CTF, along with reduced fuel use and machinery wear [17]. However, despite these documented benefits, CTF adoption in New Zealand remains low, largely due to the absence of region-specific empirical evidence. No published studies have evaluated CTF performance under New Zealand’s unique soil types, climate, and high-intensity vegetable production systems, creating a critical knowledge gap.
To address this gap, the present study provides the first New Zealand-specific field comparison of CTF and RTF, assessing their effects on soil physical properties and crop yield on a clay loam soil in Pukekohe, North Island. This study aims to (i) quantify the extent to which CTF reduces soil compaction relative to RTF, and (ii) evaluate associated changes in soil properties, aeration, and crop performance. We hypothesized that CTF would reduce soil compaction relative to RTF, leading to improved soil physical conditions. By generating locally relevant evidence, this research contributes new insights to support informed adoption of CTF in New Zealand’s horticultural sector.

2. Materials and Methods

2.1. Description of the Experimental Field

A one-year field investigation in Pukekohe (−37.3187 S, 174.9985 E) compared two adjacent 4.0 ha vegetable plots. According to the WRB 2022 classification, the soil at the experimental site is a Haplic Andosol, consistent with the volcanic-ash-derived allophanic soils typical of the Pukekohe region. One of the plots was under CTF and the other plot was the RTF field. The CTF plot consisted of 130 established beds, each based on a 1.72 m module width. Between these beds, there were 260 intermediate tramlines (wheel tracks), each 0.24 m wide. Tramlines were spaced approximately 1.72 m apart, corresponding to the standard wheel gauge used as the basic module. Permanent tramlines designated for spraying operations were spaced 15.5 m apart across the plot. All machinery used for tillage operated strictly within the defined traffic lanes (tramlines), resulting in reduced tillage on the cropped beds and minimizing compaction outside the wheel tracks. In contrast, the RTF plot was managed traditionally without designated wheel tracks or controlled traffic paths. Machinery movement occurred randomly across the field. Over the three years preceding the investigation, the rotation of crops on both plots was potatoes, oats, and carrots.

2.2. Measurement of Initial Soil Properties

Soil pH was measured (soil/water = 1:2.5 w/w) using a Eutech Instruments CyberScan pH 310 meter (Thermo Fisher Scientific, Waltham, MA, USA). Two pH buffers 4 and 7 were used to calibrate the pH electrode. Cation Exchange Capacity (CEC) was determined by the ammonium acetate method [18] and the extracted Mg, Na, K, and Ca concentrations were determined by an MP-AES 4200 (Agilent, Waltham, MA, USA). Total available phosphorous was determined by the Olsen P method [19]. Total C and total N concentrations were measured using the Elementar (Elementar, Vario MACRO, GmbH, Langenselbold, Hesse, Germany). The soil texture was determined by the pipette method [20]. Soil bulk density was measured using a soil core sampler, following the FAO standard procedure [19].
The soil at the experimental site was classified as volcanic ash with a dark reddish-brown clay loam texture. The soil pH ranged from slightly acidic to neutral. Baseline soil physicochemical properties prior to the commencement of the investigation (0–30 cm depth) are presented in Table 1.

2.3. Cropping and Traffic Management

The research design compared CTF and RTF systems by documenting the full sequence of field operations, machinery configurations, and traffic intensities associated with each system. At CTF, all machineries were operated on fixed traffic lanes with consistent track spacing (1.72–2.64 m) and a limited number of passes (two per operation). The machinery used in CTF also varied in working width, from narrow implements such as the 1.72 m grass seeder to wider equipment like the 15.5 m sprayer, while maintaining strict alignment with controlled lanes. In contrast, the RTF system involved a more intensive operational sequence, with three passes for every field activity and wider track spacings (2.7–3.05 m), reflecting typical unrestricted machinery movement across the field (Table 2). RTF operations included additional soil-disturbing steps such as residue management, deep ploughing, and incorporation using heavier tractors (up to 11,000 kg) with various implement widths.
Tama, an annual ryegrass (Lolium multiflorum Lam.), was cultivated in both the CTF and RTF plots. This choice aligned with the cropping sequence objective of capturing residual soil nitrogen. Cultivation operations for ryegrass were recorded for both CTF and RTF plots. During ryegrass establishment, operations such as seedbed preparation, sowing, and hoeing were conducted in the CTF plot using machinery with working widths of 1.72 m and 3.4 m. Deep ploughing was avoided in the CTF plot, except for the use of a subsoiler to preserve the integrity of the controlled traffic lanes. All field operations, including seedbed preparation, sowing/planting, and spraying, were restricted to designated traffic lanes. In contrast, land preparation in the RTF plot involved conventional tillage practices, including deep ploughing, subsoiling, and rotary hoeing (Table 2). At the end of the year, the ryegrass was harvested from the RTF plot. However, harvesting was not performed in the CTF plot, due to harvest machinery incompatibility with permanent traffic lanes. Hence, the biomass was mulched into the soil.

2.4. Soil Sampling and Measurements

Soil sampling was carried out to assess soil physical properties prior to grass planting. To evaluate traffic effects, samples were collected from both CTF and RTF sites at 6 and 10 months after ryegrass establishment, following the methodology of [21], which allowed resampling of the same transects over time. Soil penetration resistance (PR) measurements were conducted along fixed transects to ensure consistency and minimize variability.

2.4.1. Soil Penetration Resistance (PR)

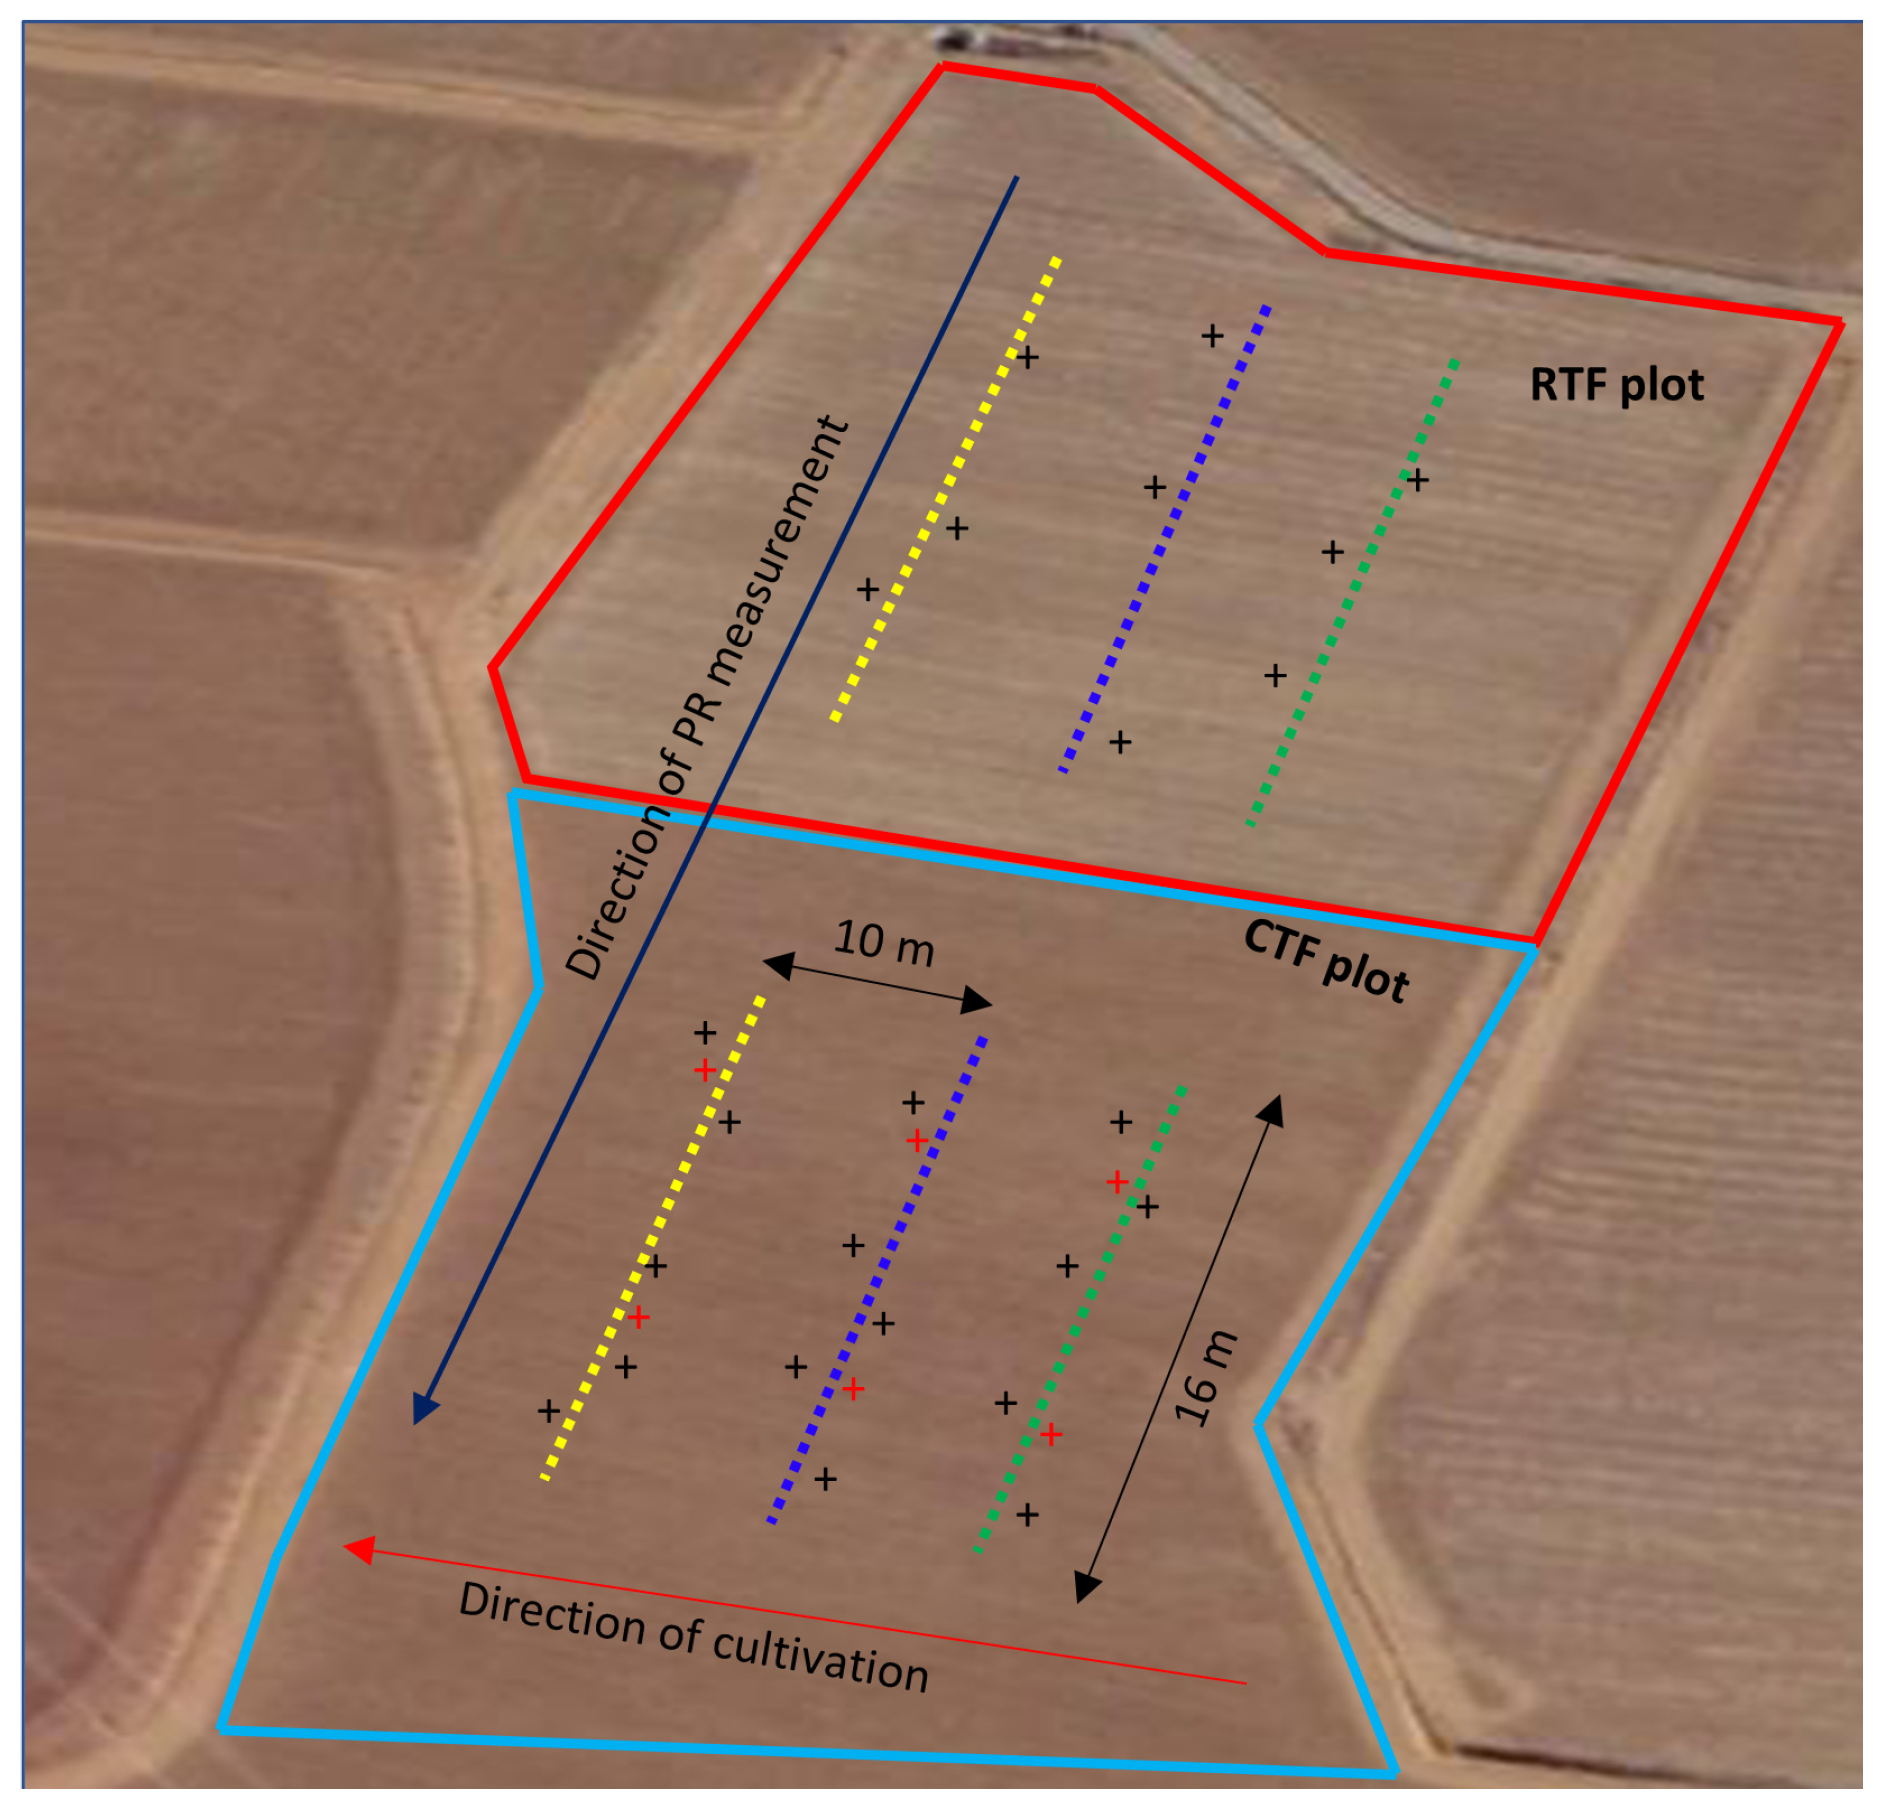
Soil penetration resistance (PR) was assessed post establishment of ryegrass in both CTF and RTF plots, located on sloped terrain. To account for topographical variation, each field was divided into three transects, namely upper, middle, and lower, spanning 16 m horizontally. In the CTF system, transects included crop beds and tramlines, whereas the RTF field had no defined traffic zones. The lower transect was positioned at the field base, the upper at the top, and the middle equidistant between them, with 10 m separating adjacent transects. PR measurements were taken along the lower and middle transects of each plot, using sampling points spaced 10 m apart perpendicular to the cultivation direction. Soil PR measurement locations are indicated by the dotted yellow (lower transect) and blue (middle transect) lines. Black crosses indicate bulk density and soil sampling measurement locations along the lower, middle, and upper transects (green dotted line) from CTF and RTF. Red crosses indicate bulk density and soil sampling locations on tramlines along the lower, middle, and upper transects in CTF (Figure 1).
In the CTF plots, the measurement strategy was designed around “basic modules” comprising a 1.5 m wide bed and a 0.24 m tramline, with the total distance between two spray lines covering 16 m, which was equivalent to nine basic modules (each 1.74 m wide). To minimize spatial variability, soil PR data were collected only along selected transects. At each location, readings were taken at 30 cm horizontal intervals and 1 cm vertical depth intervals down to 70 cm. A digital cone penetrometer (CP40II) with a 130 mm2 cone tip and a 60° angle was used for measurements. In the RTF plots, readings were taken randomly along the lower and middle transects following the same protocol. Each transect had about 50 measurements resulting in approximately 7000 data points per plot. PR measurement locations are shown in Figure 1.

2.4.2. Soil Bulk Density

To assess the impact of traffic systems on soil compaction, bulk density was measured in both CTF and RTF plots. Undisturbed soil cores measuring 4.65 cm in height and 5 cm in diameter were collected near the soil penetration resistance transects using a soil core sampler. Samples were taken from 15 random locations in the CTF beds and 9 in the RTF plot, each with three replicates. Cores were collected from the upper, middle, and lower transects at depths of 0–10 cm, 10–20 cm, and 20–30 cm. However, CTF tramline samples were collected from 6 randomly selected locations in two replicates. Tramline sampling was limited to 0–20 cm soil depth due to soil hardness. This yielded 27 cores from RTF, 45 from CTF beds, and 12 from tramlines. Cores were labelled, trimmed, sealed, weighed, oven-dried at 105 °C for 24 h, and reweighed to calculate bulk density (Equation (1)).
ρ b = M s V t
where ρ b is the dry bulk density (g·cm−3); Ms is the mass of oven-dried soil (g); and V t is the volume of the soil core (cm3).

2.4.3. Field Capacity and Permanent Wilting Point (PWP) of the Soil

Soil samples were collected using water retention rings from the CTF beds, RTF plot, and CTF tramlines at depths of 0–30 cm in three replicates. Field capacity and permanent wilting point (PWP) were measured using a pressure plate apparatus. For field capacity estimation, the saturated soil samples were placed on a tension plate and maintained at −0.1 bar until equilibrium was reached over three days. For PWP, samples were equilibrated at −15 bar over a two-week period. The soil moisture content at both field capacity and PWP was determined gravimetrically. Gravimetric soil moisture content ( θ g ) was determined by the oven dry method.

2.4.4. Other Soil Physical Properties

Based on the measured soil bulk density and gravimetric moisture content, additional soil physical properties such as volumetric moisture content, total porosity, and water-filled pore space were computed assuming a particle density of 2.65 g·cm−3. Air-filled porosity was derived by subtracting water-filled pore space from total porosity.
θ g = W wet − W dry W dry
f = 1 − ρ b ρ s
θ v = ρ b × θ g
W F P S % = θ v f × 100
where θ g is the gravimetric moisture content, W wet is the mass of the moist soil, W dry is the mass of the oven-dried soil, f is the total porosity of the soil, ρ b is the dry bulk density (g·cm−3), ρ s is assumed as a particle density of 2.65 g·cm−3, θ v is the volumetric water content (cm3·cm−3), θ g is the gravimetric water content (g·g−1), and WFPS is the water-filled pore space (%).

2.5. Grass Yields

Grass yield was estimated using samples collected within 0.5 m × 0.5 m quadrats from both the CTF and RTF plots. Yield assessments were conducted across a 16 m wide transect spanning the full width of each plot. For the CTF treatment, grass yields were separately recorded for untrafficked bed areas and tramlines along the lower, middle, and upper transects.

2.6. Statistical Analysis

Statistical analyses were conducted using SAS software, version 9.4 [23]. Repeated-measures ANOVA was performed on soil PR data using the mixed-model procedure, with traffic treatments specified as fixed effects, replication as a random effect, and soil depth treated as the repeated-measure variable. All measured soil physical and hydraulic properties, and grass yield were analyzed using one-way ANOVA. Treatment means were compared using Tukey’s multiple comparison test at a significance level of p < 0.05.

3. Results

3.1. Effect of CTF on Soil Penetration Resistance (Soil Strength)

Soil PR was significantly higher (p < 0.05) under the RTF system than CTF within the 10–40 cm soil profile, peaking at 15–20 cm with 0.502 MPa, which is over 108% greater than CTF (0.241 MPa). Similarly elevated differences were observed at 10–15 cm (96.2%) and 5–10 cm (86.9%). From 25–40 cm, PR in RTF remained consistently elevated, with values ranging from 0.619 to 0.653 MPa, compared to 0.360–0.525 MPa under CTF, representing increases between 24% and 76%. However, below 50 cm, PR under CTF peaked at 0.850 MPa (50–55 cm), exceeding the 0.786 MPa observed in RTF, which is a 7.5% reduction. This reversal continued through 55–65 cm, where PR in RTF was up to 18.5% lower than in CTF. Tramlines showed no significant difference from RTF at 0–10 cm, 40–45 cm, and 50–55 cm, but had a notably higher PR between 10 and 40 cm and beyond 55 cm than both CTF and RTF (Table 3).

3.2. Effect of CTF on Other Soil Physical Properties

At 6 months, the bulk density in CTF-bed was significantly (p < 0.0001) lower, ranging from 0.96–1.03 g·cm−3, while RTF ranged from 1.11–1.30 g·cm−3 across the 0–30 cm profile. By 10 months, bulk density in the CTF-bed reached 1.08 g·cm−3 at 20–30 cm, whereas surface values decreased to 0.93 g·cm−3. In RTF, bulk density was found to be 0.93 g·cm−3 at 0–10 cm but it significantly increased to 1.09 g·cm−3 at 20–30 cm. Bulk density was 1.12 g·cm−3 at 6 months and 1.19 g·cm−3 at 10 months in the tramline areas within the CTF system at 0–10 cm depth (Table 4).
At 6 months, gravimetric moisture content (MC) showed no significant differences between CTF and RTF, though CTF-bed was slightly higher at 10–20 cm (0.46 vs. 0.40 g·g−1). By 10 months, CTF-bed retained a higher MC (0.41–0.45 g·g−1), while RTF declined to 0.36–0.39 g·g−1 and CTF-tramline remained lowest (0.38 g·g−1). Volumetric water content (VWC) was initially higher in RTF (0.46 cm3∙cm−3) than CTF-bed (0.37 cm3∙cm−3), but by 10 months, CTF-bed increased (0.41–0.48 cm3∙cm−3), while RTF declined (0.33–0.42 cm3∙cm−3). Total porosity was greater in CTF-bed (0.60–0.62 cm3∙cm−3), but equalized with RTF by 10 months, except for CTF-tramline (0.55 cm3∙cm−3). WFPS increased in CTF-bed (65.0–78.9%), declined in RTF (68.9–73.6%), and peaked in tramline (84.4%). From 6 to 10 months, plant available water in CTF increased from 5.7% to 10.6% at 0–10 cm, 7.9% to 14.7% at 10–20 cm, and 5.3% to 14.2% at 20–30 cm. In contrast, RTF declined from 10.1–6.6% at 0–10 cm and from 13.6–7.9% at 10–20 cm, while remaining unchanged at 8.4% at 20–30 cm (Table 5).
At 6 months, CTF-bed had a significantly higher porosity than RTF and CTF-tramline across all depths (p < 0.05). By 10 months, RTF surpassed CTF-bed in surface porosity (29 cm3∙cm−3 vs. 22 cm3∙cm−3). CTF-bed maintained a consistently high porosity of 23 cm3∙cm−3 at 6 months and 22 cm3∙cm−3 at 10 months at 0–10 cm depth, with moderate values at deeper layers (12–14 cm3∙cm−3). RTF showed a marked increase in air-filled porosity (AFP) over time from 11–29 cm3∙cm−3 at 0–10 cm depth, while CTF-tramline exhibited low porosity (13 cm3∙cm−3 at 6 months; 7 cm3∙cm−3 at 10 months at 0–10 cm) (Table 6).

3.3. Grass Yield Between Traffic Systems

CTF beds produced a fresh yield of 40,939 kg·ha−1, followed by RTF beds of 37,283 kg·ha−1, with no significant difference between these two traffic systems. In contrast, CTF tramlines yielded a significantly lower fresh yield of 14,452 kg·ha−1 kg·ha−1 (Table 7). Coefficients of variation (cvs) were relatively high across all traffic systems (23.1% for CTF beds, 22.0% for RTF beds, and 28.7% for CTF tramlines). Dry matter yield followed a similar trend, with CTF beds of 9749 kg·ha−1 kg/ha and RTF of 8521 kg·ha−1 showing no significant differences, while CTF tramlines yielded a significantly lower dry matter yield of 4417 kg·ha−1 (p < 0.05).

4. Discussion

4.1. Effect of CTF and RTF on Soil Strength

The observed differences in soil PR between RTF and CTF reflect broader implications for soil structure and root development. Elevated PR in RTF at 15–20 cm suggests mechanical impedance in the critical rooting zone, due to adverse effects of uncontrolled trafficking [24] (Table 3). The progressive increase in PR from 5–40 cm under RTF supports cumulative compaction, consistent with findings on subsoil degradation [25]. In contrast, the lower PR values observed in the upper 40 cm under CTF likely result from the integrated system of controlled traffic, reduced tillage intensity, and the subsoiling conducted prior to measurement. It is important to note that the CTF and RTF systems in this study differed not only in traffic control but also in their overall tillage intensity and field operations. The RTF system involved deep ploughing, and multiple heavy machinery passes, whereas CTF used restricted tillage and controlled machinery movement. Therefore, the differences observed between the two systems represent the combined effects of whole-system management rather than traffic control alone. A significantly higher PR at 55–60 cm in CTF may indicate residual compacted horizons formed by previous tillage operations or natural soil horizon transitions [26].
In CTF, equipment operated exclusively on tramlines with standardized implement widths, resulting in only 13.8% of the cultivated area being trafficked (Table 8). This targeted approach combined with reduced tillage contributed to lower PR values at 0–40 cm depth (0.05–0.52 MPa). Conversely, RTF involved variable implement and tyre widths, resulting in greater wheel traffic intensity. A single pass produced 123.9% traffic intensity, increasing to 371.7% with three passes on separate tracks. This high run-over intensity, together with the heavier tillage operations characteristic of RTF, likely contributed to subsurface compaction through applied tillage draught forces [27]. This is supported by the elevated PR values (0.361–0.653 MPa) between 10 and 40 cm.
Elevated moisture intensifies compaction depth and severity [26,28]. In our study, PR at 20–30 cm with 51% of soil moisture content in RTF ranged from 0.58 to 0.63 MPa, compared to 0.29–0.36 MPa in CTF, indicating a 75–100% reduction in CTF (Table 3 and Table 4). Subsurface compaction may also stem from random traffic [29]. Lower PR in the 0–15 cm layer under RTF likely reflects deep ploughing during grass cropping [30].

4.2. Effect of Soil Penetration Resistance on Soil Properties

Soil penetration resistance (PR) is closely linked to physical properties such as moisture content and bulk density [31]. However, neither system exceeded the critical bulk density threshold of 1.6 g·cm−3, beyond which root growth is restricted [32]. Compaction in RTF increased bulk density and reduced total soil porosity, as reflected in the water-filled pore space, volumetric water content, and plant-available water (Table 4 and Table 5). A significantly lower (p < 0.05) bulk density in CTF at 0–30 cm depth suggests less compaction and greater total porosity and pore continuity compared to RTF and tramlines. Consequently, CTF showed improved gravitational drainage, with a 19.5 cm·cm−3 lower volumetric water content at a 0–10 cm depth relative to RTF, likely due to reduced total porosity from machinery-induced compaction in RTF [33].
At six months following grass establishment, the RTF system exhibited structural limitations due to compaction, as evidenced by a significantly (p < 0.05) higher bulk density of 1.11–1.30 g·cm−3, lower total porosity of 0.55–0.57 cm·cm−3, and restricted air-filled porosity (AFP) of 6–11 cm·cm−3 across 0–30 cm of depth (Table 4 and Table 5). These conditions contributed to a high WFPS of 80.7–87.7% and elevated volumetric water content of 0.46–0.50 cm3·cm−3, indicating near-saturation and limited aeration. In contrast, the CTF-bed maintained a lower bulk density of 0.96–1.03 g·cm−3, higher total porosity of 0.60–0.62 cm3·cm−3, and greater AFP of 12–23 cm3·cm−3, supporting improved pore continuity and aeration. These structural advantages are characteristic of traffic-exclusion zones, which promote macropore development and reduced compaction [3]. The rise in total porosity in RTF from 0.57 to 0.63 cm3·cm−3 by 10 months, matching CTF-bed values, indicates partial structural recovery, possibly due to biological activity and seasonal wetting–drying cycles [24]. However, the persistently low total porosity in CTF-tramlines (0.55 cm3·cm−3) and elevated WFPS of 84.4% highlight the long-term impact of concentrated traffic on aeration and drainage [10]. The CTF-tramline remained more compacted than CTF beds and RTF, with bulk density peaking at 1.19 g·cm−3 and AFP falling to 7 cm3·cm−3, underscoring the persistent effects of traffic.

4.3. Grass Yield

In CTF, all machinery operations are confined to permanent traffic lanes whose spacing is deliberately aligned with the working widths and wheel track gauges of cultivation implements. This alignment is essential to maintain the integrity of the bed–tramline configuration and to minimize soil compaction. However, a well-recognized challenge in CTF systems is that commercially available harvest machinery often does not conform to the same modular working widths used for bed preparation and inter-row operations [34,35]. Harvesters typically have fixed header widths and wheel track spacings that cannot be readily adjusted to match the narrower or modular bed widths used in CTF systems, resulting in incompatibility between the CTF layout and the physical dimensions of the harvesting equipment. As noted in machinery-matching guidelines for CTF, effective implementation requires that all machinery including cultivation, planting, spraying, and harvesting share common multiples of working widths, yet harvesting equipment is frequently the most difficult to integrate due to limited commercial options [34,36]. In our study, the available harvester could not be aligned with either single or multiple bed widths without driving outside the designated tramlines. Conducting harvest operations in a random-traffic manner would have destroyed the permanent beds and traffic lanes, undermining the structural integrity of the CTF system and compromising subsequent measurements. Therefore, to preserve the experimental layout, the aboveground biomass in the CTF plots was mulched rather than harvested.
Fresh yield was highest in non-trafficked CTF beds at 40,939 kg/ha, followed by RTF at 37,283 kg/ha, though the difference was not statistically significant. In contrast, CTF tramlines yielded significantly lower fresh yield at 14,452 kg/ha, highlighting the suppressive effect of compaction in trafficked zones. This trend was evident in dry matter yield, with CTF tramlines producing a significantly lower yield of 4417 kg/ha (p < 0.05) compared to 9749 kg/ha in CTF beds and 8521 kg/ha under RTF. Coefficients of variation were high across treatments, with values of 23.1% for CTF beds, 22.0% for RTF, and 28.7% for CTF tramlines, indicating substantial field-level heterogeneity. These findings align with reported yield penalties of up to 33% in trafficked zones under dry conditions, reinforcing the importance of traffic management to mitigate compaction-related stress [37].
While CTF systems have demonstrated yield improvements, they require dedicated tramlines excluded from crop production [8,38,39]. In well-designed CTF layouts, traffic-affected zones should occupy less than 20% of the cropped area [37]. At the Pukekohe site, alternating 1.72 m beds and 0.24 m tramlines resulted in tramlines covering 13.8% of the field, limiting the effective cropped area to 86.2% and reducing overall yield potential. The total dry matter yield of 9749 kg/ha from CTF was only 5.7% higher than that from RTF (Table 7), underscoring the need to maximize bed productivity.
Although CTF beds produced a 5.7% greater dry matter yield per cropped hectare than RTF, this advantage must be interpreted alongside the 13.8% of land allocated to tramlines. Conceptually, if tramlines produced no yield, whole-field CTF productivity would equal the cropped area fraction (0.862) multiplied by the relative bed-level yield gain (1.057), giving 0.862 × 1.057 = 0.911 , meaning CTF would achieve only 91.1% of the yield of a fully cropped field and the 5.7% increase alone would not offset the 13.8% area loss. However, tramlines in this study were not unproductive. They yielded 4417 kg DM ha−1 compared with 9749 kg DM ha−1 in CTF beds and 8521 kg DM ha−1 in RTF. When weighted by their respective area proportions (86.2% beds; 13.8% tramlines), whole-field CTF yield becomes ( 0.862 × 9749 ) + ( 0.138 × 4417 ) = 9207 kg DM ha−1, which is 8.0% higher than RTF. Thus, while the bed-level 5.7% increase alone is insufficient to compensate for the area penalty, the additional contribution from tramlines results in a modest whole-field advantage, although the difference remains statistically non-significant and therefore represents a numerical trend rather than a definitive productivity benefit.
Although RTF exhibited higher bulk density and lower porosity, both systems provided satisfactory soil physical conditions. Air-filled porosity increased throughout the cropping period and remained above the 10% threshold below which plant growth may be inhibited [40]. Soil PR, a key indicator of root growth, remained below the critical 2.0 MPa threshold even in deeper layers [41,42]. Both systems supported root development, with PR values within the 0–30 cm zone typical for Tama grass, whose dry matter yields (7000–9000 kg/ha) matched expected ranges under New Zealand conditions [43].
The one-year duration of this study, conducted with annual ryegrass, represents an important limitation and therefore the findings should be interpreted as indicative of initial or short-term system responses rather than long-term agronomic or environmental outcomes. While annual ryegrass is widely recognized for its capacity to capture residual soil N, its inclusion here was primarily determined by the established cropping sequence at the study site. Beyond N uptake, ryegrass is also known for its sensitivity to soil compaction and its utility as a diagnostic crop for detecting early structural degradation, making it a relevant choice for evaluating soil physical responses to management interventions [24,44]. Nevertheless, because cover-crop responses and soil processes evolve over multiple seasons, long-term experiments incorporating economically important cash crops are required to validate the agronomic sustainability, economic feasibility, and cumulative environmental benefits of the practices assessed here. Such multi-year studies would provide a more robust basis for evaluating system-level resilience and the persistence of soil improvements under commercial production conditions.

5. Limitations and Further Directions

This study demonstrates the benefits of Controlled Traffic Farming in vegetable production, but some limitations remain. The comparison reflects differences in overall management, including tillage and machinery use, so traffic effects alone cannot be isolated. The single-season scope limits assessment of longer-term soil changes, and economic data were not collected. Future work should include multi-year trials, experiments that separate traffic from tillage effects, and economic evaluations to guide adoption in vegetable systems.
Although this study focused primarily on soil physical responses, an environmental impact analysis is necessary to fully understand how CTF influences fuel use, emissions, nutrient losses, total carbon changes, and long-term soil health in intensive vegetable systems. Such evaluation would provide a more complete picture of the system’s sustainability benefits and trade-offs.

6. Conclusions

CTF successfully minimized compaction and improved soil physical health in the root zone compared to RTF. CTF reduced soil compaction compared to RTF, as shown by noticeably lower soil penetration resistance and bulk density throughout the upper soil profile. Under RTF, penetration resistance was substantially higher than in CTF, with the greatest differences occurring in the mid-depth layers and similarly large increases observed near the surface. Bulk density was consistently lower in CTF beds, while RTF soils exhibited clearly higher levels of compaction. CTF also maintained greater total porosity and a healthier proportion of air-filled pores, supporting better aeration. In contrast, RTF soils had reduced porosity and a much larger share of water-filled pore space, indicating restricted air movement. The only exception to the CTF system was the tramlines, which remained compacted and showed reduced aeration compared to the crop beds.
Although CTF did not produce a statistically significant yield increase with ryegrass, the system delivered clear improvements in soil physical conditions. Thus, even with only a 5.7% numerical yield advantage, the enhancement in the soil environment highlights CTF as a sustainable management strategy with benefits that are likely to accumulate over time. A critical trade-off is the permanent loss of cropped areas to tramlines. When tramline yield is accounted for, CTF achieved an 8% higher whole-field dry matter yield than RTF, indicating a modest numerical advantage despite the cropped-area penalty. These findings verify the hypothesis that CTF reduces soil compaction and improves key soil physical properties compared with RTF, even when yield gains are modest. Given the one-year duration, these findings should be interpreted as preliminary and specific to short-term conditions.

Author Contributions

R.B.: conceptualization, investigation, data collection and analysis, and writing—original draft preparation. M.G.: supervision, writing—review and editing, funding acquisition, and project administration. P.J.: supervision, validation, and writing—review and editing. P.B.: supervision, methodology, validation, and technical support. C.D.: supervision. All authors have read and agreed to the published version of the manuscript.

Funding

We extend our gratitude to the Massey University Research Fund (RM22311) for providing financial support.

Institutional Review Board Statement

Not applicable.

Informed Consent Statement

Not applicable.

Data Availability Statement

The original contributions presented in this study are included in the article. Further inquiries can be directed to the corresponding author.

Acknowledgments

The authors sincerely acknowledge AS Wilcox and Sons Ltd. for providing their field site for this investigation.

Conflicts of Interest

The authors declare no conflicts of interest. The funders had no role in the design of the study; in the collection, analyses, or interpretation of data; in the writing of the manuscript; or in the decision to publish the results.

Abbreviations

The following abbreviations are used in this manuscript:
CTFControlled Traffic Farming
RTFRandom Traffic Farming
AFPAir-Filled Porosity
MCMoisture Content
WFPSWater-Filled Pore Space
PRPenetration Resistance
PWPPermanent Wilting Point

References

  1. Chen, H.; Yan, Y. Effect of controlled traffic system on machine fuel saving in annual two crops region in North China Plain. Soil Tillage Res. 2015, 153, 137–144. [Google Scholar] [CrossRef] [Scilit]
  2. Zhang, B.; Jia, Y.; Fan, H.; Ma, R. Soil compaction due to agricultural machinery: Crop yield impacts and mitigation strategies. Land Degrad. Dev. 2024, 35, 5144. [Google Scholar] [CrossRef] [Scilit]
  3. McHugh, A.; Tullberg, J.; Freebairn, D. Controlled traffic farming restores soil structure. Soil Tillage Res. 2009, 104, 164–172. [Google Scholar] [CrossRef] [Scilit]
  4. Balbuena, R.; Botta, G.; Draghi, L.; Rosatto, H.; Dagostino, C. Soil compaction. Tractor traffic effects on direct sowing systems. Span. J. Agric. Res. 2003, 1, 75–80. [Google Scholar] [CrossRef] [Scilit]
  5. Alaoui, A.; Diserens, E. Mapping soil compaction–A review. Curr. Opin. Environ. Sci. Health 2018, 5, 60–66. [Google Scholar] [CrossRef] [Scilit]
  6. Ren, L.; Wang, L.; Lin, L.; Zhang, B. The progress and prospect of soil compaction by agricultural machinery in arable land: A review. Pedologica 2023, 60, 610–626. [Google Scholar] [CrossRef]
  7. Bangale, R. Controlled Traffic Farming: A Sustainable Solution to Soil Compaction. Acta Sci. Agric. 2023, 7, 18–24. [Google Scholar]
  8. Tullberg, J.N.; Yule, D.F.; McGarry, D. Controlled traffic farming—From research to adoption in Australia. Soil Tillage Res. 2007, 97, 272–281. [Google Scholar] [CrossRef] [Scilit]
  9. McPhee, J.E.; Aird, P.L. Controlled traffic for vegetable production: Part 1. Machinery challenges and options in a diversified vegetable industry. Biosyst. Eng. 2013, 116, 144–154. [Google Scholar] [CrossRef] [Scilit]
  10. Raveendrakumaran, B.; Grafton, M.; Jeyakumar, P.; Bishop, P.; Davies, C. Assessing Controlled Traffic Farming as a Precision Agriculture Strategy for Minimizing N2O Losses. Nitrogen 2025, 6, 63. [Google Scholar] [CrossRef] [Scilit]
  11. Gasso, V.; Sørensen, C.A.G.; Oudshoorn, F.W.; Green, O. Controlled traffic farming: A review of the environmental impacts. Eur. J. Agron. 2013, 48, 66–73. [Google Scholar] [CrossRef] [Scilit]
  12. Tullberg, J. Tillage, traffic and sustainability—A challenge for ISTRO. Soil Tillage Res. 2010, 111, 26–32. [Google Scholar] [CrossRef] [Scilit]
  13. Wolkowski, R.P. Relationship between wheel-traffic-induced soil compaction, nutrient availability, and crop growth—A review. J. Prod. Agric. 1990, 3, 460–469. [Google Scholar] [CrossRef] [Scilit]
  14. Radford, B.J.; Bridge, B.J.; Davis, R.J.; McGarry, D.; Pillai, U.P.; Rickman, J.F.; Yule, D.F. Changes in the properties of a Vertisol and responses of wheat after compaction with harvester traffic. Soil Tillage Res. 2000, 54, 155–170. [Google Scholar] [CrossRef] [Scilit]
  15. Wang, Q.; Chen, H.; Li, H.; Li, W.; Wang, X.; McHugh, A.; Gao, H. Controlled traffic farming with no tillage for improved fallow water storage and crop yield on the Chinese Loess Plateau. Soil Tillage Res. 2009, 104, 192–197. [Google Scholar] [CrossRef] [Scilit]
  16. Soane, B.D.; van Ouwerkerk, C. (Eds.) Soil compaction problems in world agriculture. In Soil Compaction in Crop Production; Elsevier: Amsterdam, The Netherlands, 1994; pp. 1–21. [Google Scholar] [CrossRef] [Scilit]
  17. Antille, D.L.; Peets, S.; Galambošová, J.; Botta, G.F.; Rataj, V.; Macak, M.; Tullberg, J.N.; Chamen, W.C.T.; White, D.R.; Misiewicz, P.A.; et al. Soil compaction and controlled traffic farming in arable and grass cropping systems. Agron. Res. 2019, 17, 653–682. [Google Scholar] [CrossRef]
  18. Blakemore, L.; Searle, P.; Daly, B. Methods for Chemical Soil Analysis; New Zealand Soil Bureau Scientific Report 80; Department of Scientific and Industrial Research: Lower Hutt, New Zealand, 1987; pp. 72–103. [CrossRef] [Scilit]
  19. FAO. Standard Operating Procedure for Soil Bulk Density, Cylinder Method; Global Soil Laboratory Network (GLOSOLAN): Rome, Italy, 2003. [Google Scholar] [CrossRef] [Scilit]
  20. Gee, G.W.; Bauder, J.W. Particle-size analysis. In Methods of Soil Analysis: Part 1, 2nd ed.; Physical and Mineralogical Methods, Soil Science Society of America Book Series 5; Soil Science Society of America: Madison, WI, USA, 1986; pp. 383–411. [Google Scholar] [CrossRef] [Scilit]
  21. Dawson, A.; Knowles, O. To Grid or Not to Grid: A Review of Current Soil Sampling Methods. In Farm Environmental Planning—Science, Policy and Practice; Currie, L.D., Christensen, C.L., Eds.; Massey University: Palmerston North, New Zealand, 2018; Available online: https://www.massey.ac.nz/~flrc/workshops/18/Manuscripts/Paper_Knowles_2018.pdf (accessed on 12 November 2025).
  22. Google Earth. Satellite Imagery of Pukekohe, New Zealand (−37.3187 S, 174.9985 E). Google LLC. 2025. Available online: https://earth.google.com (accessed on 15 December 2025).
  23. SAS Institute. Statistical Analysis Software for Windows, Version 9.4; SAS Institute: Cary, NC, USA, 2016. [Google Scholar]
  24. Hamza, M.A.; Anderson, W.K. Soil compaction in cropping systems: A review of the nature, causes and possible solutions. Soil Tillage Res. 2005, 82, 121–145. [Google Scholar] [CrossRef] [Scilit]
  25. Bawatharani, R.; Grafton, M.; Jeyakumar, P.; Bishop, P.; Davies, C. Characterization of Traffic Induced Compaction in Controlled Traffic Farming (CTF) and Random Traffic Farming (RTF)—A Multivariate Approach. In Adaptive Strategies for Future Farming; Christensen, C.L., Horne, D.J., Singh, R., Eds.; Occasional Report No. 34; Farmed Landscapes Research Centre, Massey University: Palmerston North, New Zealand, 2022; Available online: http://flrc.massey.ac.nz/publications.html (accessed on 22 October 2025).
  26. Batey, T. Soil compaction and soil management—A review. Soil Use Manag. 2009, 25, 335–345. [Google Scholar] [CrossRef] [Scilit]
  27. Tullberg, J.N. Wheel traffic effects on tillage draught. J. Agric. Eng. Res. 2000, 75, 375–382. [Google Scholar] [CrossRef] [Scilit]
  28. Soane, B.; Blackwell, P.; Dickson, J.; Painter, D. Compaction by agricultural vehicles: A review I. Soil and wheel characteristics. Soil Tillage Res. 1980, 1, 207–237. [Google Scholar] [CrossRef] [Scilit]
  29. Strudley, M.W.; Green, T.R.; Ascough, I.I.J.C. Tillage effects on soil hydraulic properties in space and time: State of the science. Soil Tillage Res. 2008, 99, 4–48. [Google Scholar] [CrossRef] [Scilit]
  30. Etana, A.; Håkansson, I.; Zagal, E.; Bucas, S. Effects of tillage depth on organic carbon content and physical properties in five Swedish soils. Soil Tillage Res. 1999, 52, 129–139. [Google Scholar] [CrossRef] [Scilit]
  31. Unger, P.W.; Jones, O.R. Long-term tillage and cropping systems affect bulk density and penetration resistance of soil cropped to dryland wheat and grain sorghum. Soil Tillage Res. 1998, 45, 39–57. [Google Scholar] [CrossRef] [Scilit]
  32. Huber, S.; Prokop, G.; Arrouays, D.; Banko, G.; Bispo, A.; Jones, R.; Rickson, R. Indicators and Criteria. In Environmental Assessment of Soil for Monitoring; Technical Report; Office of the Official Publications of the European Communities: Luxembourg, 2008; Volume, I, p. 339. [Google Scholar] [CrossRef]
  33. Richard, G.; Boizard, H.; Roger-Estrade, J.; Boiffin, J.; Guerif, J. Field study of soil compaction due to traffic in northern France: Pore space and morphological analysis of the compacted zones. Soil Tillage Res. 1999, 51, 151–160. [Google Scholar] [CrossRef] [Scilit]
  34. Morrison, J.E. Machinery requirements for permanent wide beds with controlled traffic. Agric. Eng. 1985, 1, 64–67. [Google Scholar] [CrossRef] [Scilit]
  35. Chamen, W.C.T.; Moxey, A.P.; Towers, W.; Balana, B.; Hallett, P.D. Mitigating arable soil compaction: A review and analysis of available cost and benefit data. Soil Tillage Res. 2015, 146, 10–25. [Google Scholar] [CrossRef] [Scilit]
  36. Misiewicz, P.A.; Galambošová, J. Controlled Traffic Farming. In Encyclopedia of Digital Agricultural Technologies; Springer: Berlin/Heidelberg, Germany, 2003; pp. 176–186. [Google Scholar] [CrossRef] [Scilit]
  37. Galambošová, J.; Macák, M.; Rataj, V.; Antille, D.L.; Godwin, R.J.; Chamen, W.C.; Chlpík, J. Field evaluation of controlled traffic farming in Central Europe using commercially available machinery. Trans. ASABE 2017, 60, 657–669. [Google Scholar] [CrossRef] [Scilit]
  38. Chamen, W.C.T. The Effects of Low and Controlled Traffic Systems on Soil Physical Properties, Yields and the Profitability of Cereal Crops on a Range of Soil Types. Ph.D. Thesis, Cranfield University, Bedford, UK, 2011; pp. 220–225. Available online: http://dspace.lib.cranfield.ac.uk/handle/1826/7009 (accessed on 3 November 2025).
  39. Godwin, R.; Misiewicz, P.; White, D.; Smith, E.; Chamen, T.; Galambošová, J.; Stobart, R. Results from recent traffic systems research and the implications for future work. Acta Technol. Agric. 2015, 18, 57–63. [Google Scholar] [CrossRef] [Scilit]
  40. Lipiec, J.; Håkansson, I. Influences of degree of compactness and matric water tension on some important plant growth actors. Soil Tillage Res. 2000, 53, 87–94. [Google Scholar] [CrossRef] [Scilit]
  41. Materechera, S.; Mloza-Banda, H. Soil penetration resistance, root growth and yield of maize as influenced by tillage system on ridges in Malawi. Soil Tillage Res. 1997, 41, 13–24. [Google Scholar] [CrossRef] [Scilit]
  42. Atwell, B. Response of roots to mechanical impedance. Environ. Exp. Bot. 1993, 33, 27–40. [Google Scholar] [CrossRef] [Scilit]
  43. Scott, W.; Brown, K. How good is Tama ryegrass? Proc. N. Z. Grassl. Assoc. 1978, 40, 180–192. [Google Scholar] [CrossRef] [Scilit]
  44. Chen, G.; Weil, R.R. Penetration of cover crop roots through compacted soils. Plant Soil 2010, 331, 31–43. [Google Scholar] [CrossRef] [Scilit]
Figure 1. Location of field experiment site in Pukekohe (−37.3187 S, 174.9985 E). Adapted from Ref. [22].
Agriengineering 08 00054 g001
Table 1. Initial soil properties measured at the CTF and RTF plots.
Soil Depth (cm)pHSoil Bulk Density (g·cm−3)C%N%CEC
(cmol(+)/kg)
Olsen P
µg P/g
Sand %Silt %Clay %
CTF
0–106.410.942.080.1914.98129.09243838
10–206.870.992.130.2014.85102.31243442.0
20–307.021.032.070.1912.5963.41204634
RTF
0–106.361.162.050.2015.2499.34253540
10–206.621.192.020.1915.3384.18223840
20–306.971.220.180.1815.3579.27193942
Values are mean of five replicates.
Table 2. Machineries used to impose traffic on the CTF and RTF plots under annual grass.
OperationMachinery TypeNumber of Passes Working Width of Implement (m)Track Spacing (m)Total Weight of Machinery (kg)Forward Speed (km/h)
CTF
SubsoilingJD175R23.441.7290006
SprayingJD6530 215.52.6411,50010
Seeding grassJD6140M with seeder21.721.7280006
Mulching grassRotary hoe 23.41.722101.3
RTF
Residue managementJD8245R—chip hoe353.0511,0006.5
SprayingJD6530 315.52.6411,50010
SubsoilingJD8345R33.573.0511,0003
Deep ploughingJD8345R—Jumbo buster33.73.0511,0008
IncorporatorFendt 716—Incorporator35.52.780008
Seeding grassJD6140M with seeder33320004
HarvestingHarvester 34.3313,0006.5
Table 3. Comparison of mean soil penetration resistance across CTF, RTF, and in tramlines at different depths.
Depth (cm)Penetration Resistance (MPa)
CTFRTFTramline
0–50.05 ± 0.004 AB a0.06 ± 0.01 AB a 0.153 ± 0.04 A a
5–100.122 ± 0.008 B a0.228 ± 0.01 AB b0.352 ± 0.09 A b
10–150.184 ± 0.01 C b0.361 ± 0.02 B c0.524 ± 0.13 A c
15–200.241 ± 0.01 C b0.502 ± 0.04 B d0.859 ± 0.21 A d
20–250.296 ± 0.02 C b0.589 ± 0.04 B d0.855 ± 0.21 A d
25–300.360 ± 0.02 C b0.633 ± 0.05 B d0.799 ± 0.19 A d
30–350.435 ± 0.03 C b0.619 ± 0.04 B d0.773 ± 0.19 A d
35–400.525 ± 0.03 C b0.653 ± 0.04 B d 0.816 ± 0.2 A d
40–450.645 ± 0.04 B c 0.710 ± 0.03 AB d0.837 ± 0.2 A d
45–500.761 ± 0.04 BC d0.785 ± 0.04 B d0.948 ± 0.23 A d
50–550.850 ± 0.05 A d0.786 ± 0.04 A d0.882 ± 0.21 A d
55–600.823 ± 0.06 A d0.671 ± 0.05 B e0.931 ± 0.23 A d
60–650.637 ± 0.07 B e0.592 ± 0.05 B e0.855 ± 0.21 A d
65–700.500 ± 0.05 B f0.537 ± 0.06 B e0.757 ± 0.18 A d
Data are shown as a mean ± standard error of 35, 46, and 16 replicates for CTF, RTF, and tramlines, respectively. Values followed by different small alphabet letters within a column for each PR are significantly different between adjacent depths at p < 0.05. Values followed by different capital alphabet letters within a row for each PR are significantly different among traffic treatments at p < 0.05.
Table 4. Mean measurements of other soil physical properties at CTF, RTF, and tramlines.
Soil PropertyAt 6 Months Following Grass
Establishment
At 10 Months Following Grass
Establishment
0–10 cm10–20 cm20–30 cm0–10 cm10–20 cm20–30 cm
Bulk density (g·cm−3)
CTF-bed0.96 b1.03 b0.97 b0.93 b1.08 a1.08 a
RTF1.11 a1.19 a1.3 a0.93 b1.04 a1.09 a
CTF-tramline1.12 a1.20 a-1.19 a--
p value<0.0001<0.0001<0.0001<0.00010.2840.848
Gravimetric MC (g·g−1)
CTF-bed0.39 a0.46 a0.50 a0.41 a0.43 a0.45 a
RTF0.41 a0.40 b0.51 a0.36 b0.38 b0.39 a
CTF-tramline0.38 a0.38 b-0.38 b--
p value0.06<0.00010.08<0.0001<0.00010.004
Volumetric water content (cm3·cm−3)
CTF-bed0.37 b0.48 a0.49 ab0.41 a0.46 a0.48 a
RTF0.46 a0.49 a0.50 a0.33 c0.40 b0.42 b
CTF-tramline0.43 a0.46 a-0.38 b--
p value<0.00010.1850.04<0.00010.0070.131
Total Porosity (cm3∙cm−3)
CTF-bed0.62 a0.60 a0.62 a0.63 a0.57 a0.57 a
RTF0.57 b0.55 b0.57 b0.63 a0.58 a0.57 a
CTF-tramline0.56 b0.53 b-0.55 b--
p value<0.0001<0.0001<0.0001<0.00010.2840.848
Water-filled pore space (%)
CTF-bed59.6 b80.0 b79.0 b65.0 b75.4 a78.9 a
RTF80.7 a89.0 a87.7 a53.9 b68.9 b73.6 b
CTF-tramline76.7 a86.7 ab-84.4 a--
p value<0.00010.0120.017<0.00010.0040.002
Different letters within a column indicate significant differences between treatments at p < 0.05 (n = 5).
Table 5. Soil water retention properties of CTF and RTF plots.
Soil PropertyAt 6 Months Following Grass
Establishment
At 10 Months Following Grass
Establishment
0–10 cm10–20 cm20–30 cm0–10 cm10–20 cm20–30 cm
CTF
Field capacity (%)35.640.841.439.248.549.8
Wilting point (%)29.932.936.128.633.835.6
Plant available water (%)5.77.95.3 10.614.714.2
RTF
Field capacity (%)42.649.344.436.541.943.7
Wilting point (%)32.535.736.029.934.035.3
Plant available water (%)10.113.68.46.67.98.4
p value †0.08 ns0.01 *0.67 ns0.02 *0.007 **0.008 **
† p values were derived from the paired t test to analyze the effects of the two traffic systems on plant available water at p < 0.05 (n = 5). Significance * p < 0.05; ** p < 0.01; ns—not significant at p < 0.05.
Table 6. Effect of traffic management on air-filled porosity under grass.
Soil PropertyAt 6 Months After Grass EstablishmentAt 10 Months After Grass Establishment
0–10 cm10–20 cm20–30 cm0–10 cm10–20 cm20–30 cm
Air-filled porosity (cm3∙cm−3)
CTF-bed25 a12 a13 a22 a14 a12 a
RTF11 b6 b7 b29 a18 a15 a
CTF-tramline13 b7 b-7 b--
Values within a column with different letters are significantly different at p < 0.05 (n = 5).
Table 7. Grass yield from CTF-bed, RTF, and CTF-tramlines.
CTF-BedRTFCTF-Tramlinep Value
Fresh yield (kg·ha−1)40,939 a
(CV = 23.1%)
37,283 a
(CV = 22%)
14,452 b
(CV = 28.7%)
<0.0001
Dry matter yield (kg·ha−1)9749 a8521 a4417 b0.002
Different letters within a row indicate significant differences between traffic treatments at p < 0.05 using Tukey’s test.
Table 8. Additive effect of random traffic compared to controlled traffic.
MachineryTyre Width (mm)Working Width (m)% Run Over †
CTF
JD 175R2403.44
JD 6530 24015.5
JD 6140M with seeder2401.72
Rotary hoe (Chip Hoe)2403.4
Total run over%13.8
Repeatedly run over%13.8
RTF
JD 8245R—chip hoe480519.2
JD 653042015.55.4
JD8345R4803.5726.8
JD 8345R—jumbo buster4803.725.9
Fendt 716—incorporator4605.530.6
JD 6140M with seeder240316.0
Total run over%123.9
Repeatedly run over%371.7
† Run-over (%) was defined as the ratio of tyre width to implement width. In CTF, the working width is always a multiple of the 1.72 m base module (including a 0.24 m tramline), giving a constant 13.8% run-over across all machinery since movement is confined to fixed tramlines. Harvest machinery was excluded from calculations, as PR measurements were taken during the grass-growing season.
Disclaimer/Publisher’s Note: The statements, opinions and data contained in all publications are solely those of the individual author(s) and contributor(s) and not of MDPI and/or the editor(s). MDPI and/or the editor(s) disclaim responsibility for any injury to people or property resulting from any ideas, methods, instructions or products referred to in the content.