


Abstract
Effective and sustainable livestock management within Mediterranean ecosystems depends heavily on accurate and timely monitoring of sward composition. Traditionally, this task has relied on human observers who must traverse large and often rugged areas to identify the distribution of grasses, legumes, shrubs, and other plant groups. However, this approach is not only labor-intensive and slow but also susceptible to substantial human error, especially when observations must be repeated frequently or carried out under difficult field conditions. In the present study, an alternative method that integrates wearable cameras with modern computer-vision techniques to automatically recognize pasture plant species through an edge device present in farm premises was investigated. Additionally, the feasibility of achieving reliable classification performance on resource-constrained edge devices was evaluated. To this end, five widely used pre-trained convolutional neural networks were compared against a lightweight custom model developed entirely from scratch. The results demonstrated that ResNet50 delivered the strongest classification accuracy, achieving a Matthews Correlation Coefficient (MCC) of 0.992. Nonetheless, the custom lightweight model proved to be a practical compromise for real-world field use, reaching an MCC of 0.893 while requiring only 6.24 MB of storage. The inference performance on Raspberry Pi 4, Raspberry Pi 5, and Jetson Orin Nano platforms was also evaluated, revealing that the Selective Search stage remains a major computational limitation for achieving real-time operation. The results obtained confirm the possibility of implementing a plant identification system in agricultural facilities without the need to transfer images to a cloud-based application.
1. Introduction
Pasture-based livestock systems provide essential meat and dairy products while simultaneously contributing to various ecosystem services. The sustainability of those systems, particularly in heterogeneous and biodiverse Mediterranean environments, depends on plant diversity, availability, and nutritive value [1,2]. Knowing sward composition is crucial because it directly influences grazing behavior, diet selection, intake, and the overall productivity of ruminants. Plant species, like grasses, legumes, forbs or shrubs, have different nutritional values. Their availability directly shapes how animals interact with their environment and select pasture species [3,4].
Accurate plant identification significantly influences pasture management by facilitating the detection of invasive species and informing maintenance strategies, as well as enhancing feed management for grazing animals through the assessment of the nutritional value of consumed herbage. Traditional plant identification is hindered by its complexity and time-consuming nature, requiring profound botanical expertise. This creates a knowledge gap that prevents non-experts from accurately identifying species, raising the need for automated solutions that democratize, simplify and accelerate the identification process.
Plant identification increasingly relies on the integration of heterogeneous image features. While traditional leaf shape analysis and landmarking are foundational [5], complex venation patterns—often characterized via graph representations or vein-to-leaf area ratios (A_vein/A_leaf)—provide more robust identifiers [6]. These morphological traits are frequently complemented by color descriptors, such as color moments (CM) and histograms (CH), though these require mitigation strategies for varying illumination and shadowing [7]. Ultimately, while shape is a primary discriminative factor, the fusion of venation, color, and micro-texture provides the most holistic representation, resulting in superior classification accuracy in automated plant identification systems. In addition, recent studies show that combining georeferenced imagery with machine learning enables landscape-scale identification of grassland habitats. Plas et al. [8] propose a multi-stage Convolutional Neural Network (CNN)-based semantic segmentation framework that classifies land cover and quantifies wet grassland fragmentation with high accuracy. Such approaches rely on well-corrected, georeferenced imagery, consistent with remote-sensing practices emphasizing orthorectified very-high-resolution data for vegetation mapping [9]. GPS-centered UAV georeferencing further reduces identification ambiguity in homogeneous agricultural landscapes [10], addressing long-standing challenges in discriminating non-woody vegetation types such as grasslands [11].
Within the framework of Precision Livestock Farming (PLF), automated vision-based systems have emerged as a critical advancement for the continuous, objective monitoring of pasture floristic composition and animal-environment interactions. By leveraging wearable or collar-mounted cameras—specifically point-of-view (POV) devices—researchers can non-invasively assess foraging behavior and the “microstructure” of intake under natural grazing conditions [3,12,13,14]. These devices provide detailed visual records of the specific herbage and plant parts consumed, offering a high-resolution window into diet selection that was previously difficult to capture at scale.
To enhance these observations, the integration of diverse sensor modalities, such as thermal and hyperspectral imaging, allows for a multi-faceted approach to monitoring both subtle shifts in livestock behavior and broader pasture ecosystem dynamics. However, the utility of these systems depends on the efficient processing of raw imagery. Machine learning algorithms, including deep learning and automated feature extraction, are employed to classify plant functional groups and distinguish specific species based on complex image patterns [3,12,13,14]. This computational approach not only improves the performance of species identification but also enables the analysis of large datasets inherent in continuous monitoring.
In a previous work [15], an animal monitoring collar with a video camera that uses animals as vehicles to transport a vegetation sensor was developed. The collar was developed from a monitoring platform [16] that also includes a gateway located on livestock farms. This gateway receives and aggregates the monitoring information collected by the collars and functions as an edge device, implementing algorithms for classifying information and generating alarms. Communication between the collars and the gateway works through an opportunistic method based on Bluetooth Low Energy that transfers information from the collars’ memory to the gateway when the animals return to the sheepfold and the collars obtain radio coverage from the gateway. Due to the lack of a permanent communication mechanism, the photos collected by the collar are timestamped and georeferenced and are stored in the collar’s internal memory until they can be transferred to the gateway, provided there is radio coverage. The gateway also communicates with a cloud-based application that centralizes monitoring information from different livestock farms and allows human operators access to the information.
The present work applied advanced computer vision and deep learning techniques to establish a robust methodology for recognizing and categorizing key plant species, including legumes, grasses, and shrubs, using image data from pasturelands. Such a protocol, when implemented on wearable cameras, will additionally contribute to a better understanding of ruminant foraging behavior in complex landscapes and promote more efficient and sustainable livestock production. However, deploying such systems on animals presents unique challenges. Wearable devices, such as smart collars, operate under strict battery and storage constraints. Therefore, this study emphasizes not only classification accuracy but also the trade-off between performance and resource consumption.
2. Materials and Methods
In this study, a dataset of meadow images collected in Portuguese pastures [17] in the last week of February 2025, consisting of 741 photographs captured with standard cameras positioned about 50 cm above the ground, was used. Photographs were taken with basic cameras, a Canon EOS 850D camera (Canon Inc., Tokyo, Japan) and mobile phones (iPhone 15 Pro, Apple Inc., Cupertino, CA, USA; Huawei P40 Pro, Huawei Technologies Co., Ltd., Shenzhen, China), to reflect the inferior image quality expected from cameras attached to the animals’ collars. No special equipment was used, nor was any other parameter considered [e.g., light incidence (light/shadow), angle, …] besides height from the ground (~50 cm); thus, models based on the present dataset should perform well with everyday photographs taken in other contexts.
The dataset includes 1744 annotations distributed across four categories: shrubs, grasses, legumes, and others. The distribution of these classes is presented in Table 1, providing a clear overview of the vegetation types represented and supporting a detailed characterization of the plant elements found within the surveyed pasture areas.
Table 1.
Dataset Class Distribution.
2.1. Classification Model Implementation
The implementation phase involved testing different model architectures to find an optimal balance between performance and computational efficiency. After building the dataset, a two-stage approach was adopted: first, training and evaluating heavyweight transfer learning models to establish a performance benchmark and then developing a custom lightweight model optimized for practical deployment.
Although modern single-stage detectors (e.g., YOLO) provide superior inference speed, the present work adopted a two-stage R-CNN framework based on Selective Search. This design choice was deliberate to decouple the region proposal stage from the classification stage. It enables an isolated assessment of CNN classification architectures, independent of potential learning biases introduced by Region Proposal Networks (RPNs). To address class imbalance, stratified sampling for the validation split and applied data augmentation (rotation, flips, zoom) were employed during training. Furthermore, the Matthews Correlation Coefficient (MCC) was selected as primary evaluation metric, as it provides a more robust evaluation of classifier performance on imbalanced datasets compared to accuracy or F1-score.
2.2. Heavyweight Classification Models Implementation
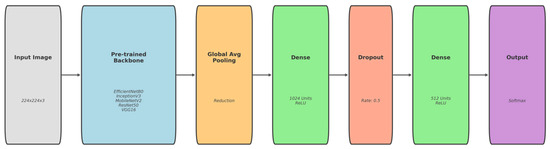
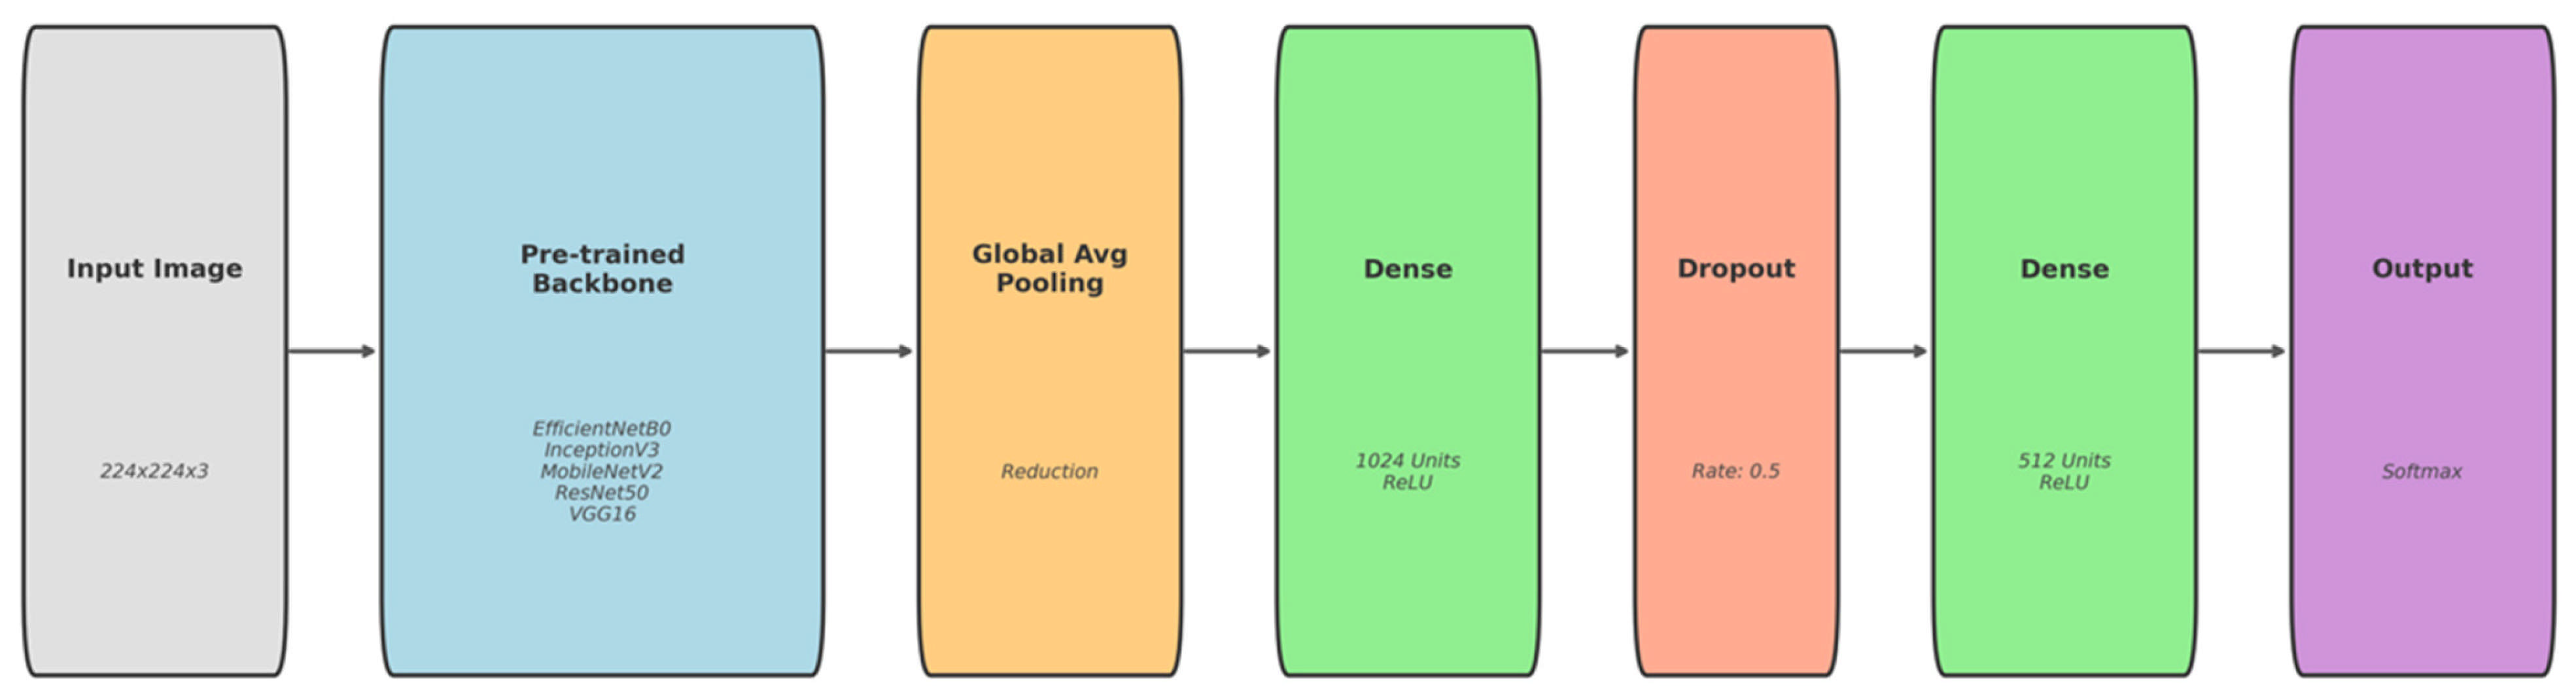
To establish a performance baseline, five pre-trained deep learning architectures were evaluated: EfficientNetB0, InceptionV3, MobileNetV2, ResNet50, and VGG16. As shown in Figure 1, each model employed an identical fully connected layer configuration appended to the pre-trained backbone Figure 1. A transfer learning strategy was adopted whereby the backbone weights were frozen and only the custom fully connected layers were trained. This approach leveraged the feature extraction capabilities acquired from the ImageNet dataset while adapting the models to the specific plant classification task.
Figure 1.
Heavyweight Model Architecture.
Following this evaluation, ResNet50 demonstrated the highest performance, achieving an MCC of 0.992. This result was subsequently selected as the target benchmark for the development of a more computationally efficient model. The objective was to design a lightweight convolutional neural network trained from scratch that could attain comparable performance while significantly reducing model size and computational complexity.
Hyperparameters were optimized using Optuna [18], a Bayesian optimization framework. The search space was limited to ensure that the resulting model would be lightweight while maximizing performance, as in Table 2.
Table 2.
Hyperparameter search space for lightweight CNN (Convolutional Neural Network) optimization.
All models were trained on the training set, with a 10% validation split retrieved using stratified sampling to maintain class distribution balance. Every model used the same preprocessing across all architectures to process 224 × 224 pixel regions of interest (ROIs) that were taken from bounding box annotations. The transfer learning models used pre-trained ImageNet weights with frozen base layers, only training the custom classification heads. These models were trained for up to 50 epochs using the Adam optimizer, with a learning rate of 0.0001, a batch size of 32, and a sparse categorical cross-entropy loss. To avoid overfitting, early stopping was used with validation accuracy monitoring and a 15-epoch waiting period.
After the initial Optuna optimization, the Scratch-built CNN was further trained for additional epochs with early stopping based on validation accuracy, which improved its MCC from 0.836 to 0.894, approaching 90% of the heavyweight model’s performance benchmark. It was trained for up to 300 epochs using the RMSprop optimizer with a learning rate of 0.000176 and a batch size of 16, as defined by the Optuna optimization method. Early stopping was used with a patience of 70 epochs based on validation of accuracy monitoring.
Data augmentation techniques were applied during training to each model to improve their generalization: random horizontal and vertical flips, small random rotations (±15°), slight zoom variations (±10%), and minor brightness adjustments.
2.3. Dataset Split
For model training and evaluation purposes, the dataset was divided into training and testing sets using the cocosplit tool [19] according to Table 3. This tool is simple and specifically designed to handle COCO-format datasets and maintain proper distribution of classes, particularly in multi-class scenarios where images contain multiple object categories. The dataset was split with a 70/30 ratio. Crucially, while images were collected from the same pastoral regions, the split was performed at the image level, ensuring that no specific image used for training appeared in the test set to prevent data leakage. The training set included 676 images with a total of 1221 plant annotations, while the test set had 369 images with 523 plant annotations. It is worth noticing that the class distribution varies considerably between the training and test sets, with shrubs dominant and grasses under-represented in the testing set compared to the training set. This variance in distribution was considered when evaluating model performance to ensure that the results properly reflected the model’s capacity to generalize across all plant categories. All models were implemented and evaluated on a system running Ubuntu LTS (24.04.3) with the latest available releases of TensorFlow and PyTorch (2.20 and 2.9.1, respectively), utilizing CUDA 12.4 drivers for GPU acceleration.
Table 3.
Training/testing set class distribution.
2.4. ROI Generation Implementation
At the base of the detection mechanism is the ROI-generating component, which oversees locating potential plant sampling areas in input images. The approach used implements the Selective Search algorithm, available through the selectivesearch Python 3.12 library (installable with pip install selectivesearch), which provides a straightforward, MIT-licensed implementation developed by AlpacaTechJP on GitHub (version v0.4, September 2017). Available at: https://github.com/AlpacaTechJP/selectivesearch (accessed on 1 December 2025) [20]. It is a hierarchical grouping method that combines bottom-up segmentation and exhaustive search strategies to generate object proposals without prior knowledge of object categories.
The Selective Search method used a multi-scale approach, beginning with pixel-level segmentation and progressively merging segments based on color, texture, size, and shape. Algorithm parameters were tuned to balance computational efficiency with detection accuracy for botanical identification. Three key parameters were critical: the scale (set to 500) controls initial segmentation granularity, preventing over-segmentation of unified plant structures; sigma (1.0) applied Gaussian smoothing to reduce noise while preserving true plant edges; and a minimum size threshold (250 pixels) filtered out irrelevant micro-segments, reducing computational load without excluding the smallest annotated specimens.
The generated candidate regions were sorted by area in descending order, and only the top 100 proposals per image were retained. This prioritized the largest, most significant plant specimens for classification and ensures practical processing times suitable for field deployment.
A dedicated preprocessing pipeline then standardized each selected region for CNN input. This involved spatial cropping to extract the proposal’s bounding box, with coordinate clipping applied if regions extend beyond image borders. The cropped regions were resized to 224 × 224 pixels using OpenCV’s [21] resize function, which maintains a balance between efficiency and image quality while preserving aspect ratio through appropriate scaling. Finally, pixel value normalization converted integer values (0–255) to a floating-point range of [0, 1], matching the statistical distribution used during the CNN’s training phase. This ensured consistency between the model’s training data and the input provided during inference, maintaining classification reliability.
2.5. Non-Maximum Suppression Implementation
Non-Maximum Suppression Implementation (NMS) was the detection pipeline’s final refining stage, which eliminates redundant detections caused by numerous overlapping regions successfully classifying the same plant specimen. The method solved a common problem of region-based detection systems: a single plant might produce several positive detections over overlapping candidate regions.
The approach uses IoU to determine spatial overlap between bounding boxes. IoU was calculated by dividing the intersection area by the union area, producing values ranging from 0 to 1 (complete overlap). The implementation considers non-overlapping boxes, degenerate regions, and division-by-zero scenarios, resulting in reliable and accurate overlap calculations.
The complete algorithm is shown in Listing 1. Detections were first sorted by confidence. The algorithm selected the highest-confidence detection and discarded any others with IoU greater than 0.3, assuming they represented the same plant. This step was repeated until no detections remain. The threshold was established to achieve a balance between removing duplicates and preserving nearby different specimens.
| Listing 1. Non-Maximum Suppression Implementation. |
| def non_max_suppression(results, iou_threshold = 0.3): if not results: return [] sorted_results = sorted(results, key = lambda x: x[‘confidence’], reverse = True) final_detections = [] while sorted_results: best = sorted_results.pop(0) final_detections.append(best) best_box = box_coords(best[‘region’][‘rect’]) filtered = [] for r in sorted_results: if calculate_iou(best_box, box_coords(r[‘region’][‘rect’])) < iou_threshold: filtered.append(r) sorted_results = filtered return final_detections [:5] |
After suppression, only the top five detections per image were returned. Each detection preserved the bounding box coordinates, species label, and confidence score. Results were still sorted by confidence, ensuring that users see the most reliable identifications first while making the output realistic for field use.
The evaluation process provides a fair comparison across all models by using the same hardware and software setup for all testing. The test set included 523 plant annotations divided into four categories (bushes, grasses, legumes, and others). Two evaluation methodologies were used: classification-only evaluation with ground truth bounding boxes to isolate CNN performance and comprehensive system evaluation that included the entire detection process.
2.6. Classification Performance Evaluation
Model performance was primarily assessed using the MCC, selected for its robustness to class imbalance and its comprehensive consideration of true and false positives and negatives. MCC values range from −1 (total disagreement) to +1 (perfect prediction). Model efficiency was additionally evaluated through the number of trainable parameters and model size (MB), reflecting computational and memory demands relevant to real-world deployment. All models were trained to convergence using optimal configurations, and classification was evaluated using ground-truth ROIs to isolate classification performance. Given the class distribution mismatch, MCC ensured a fair and consistent comparison across all architectures.
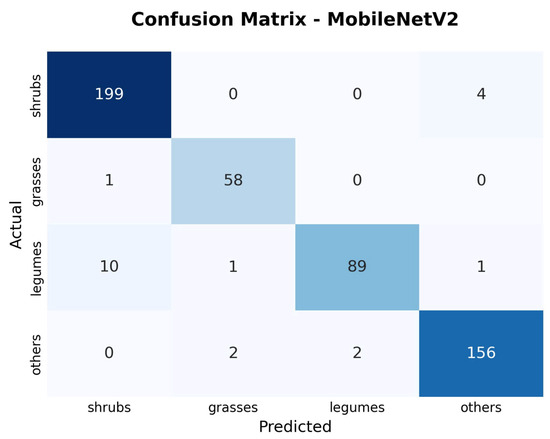
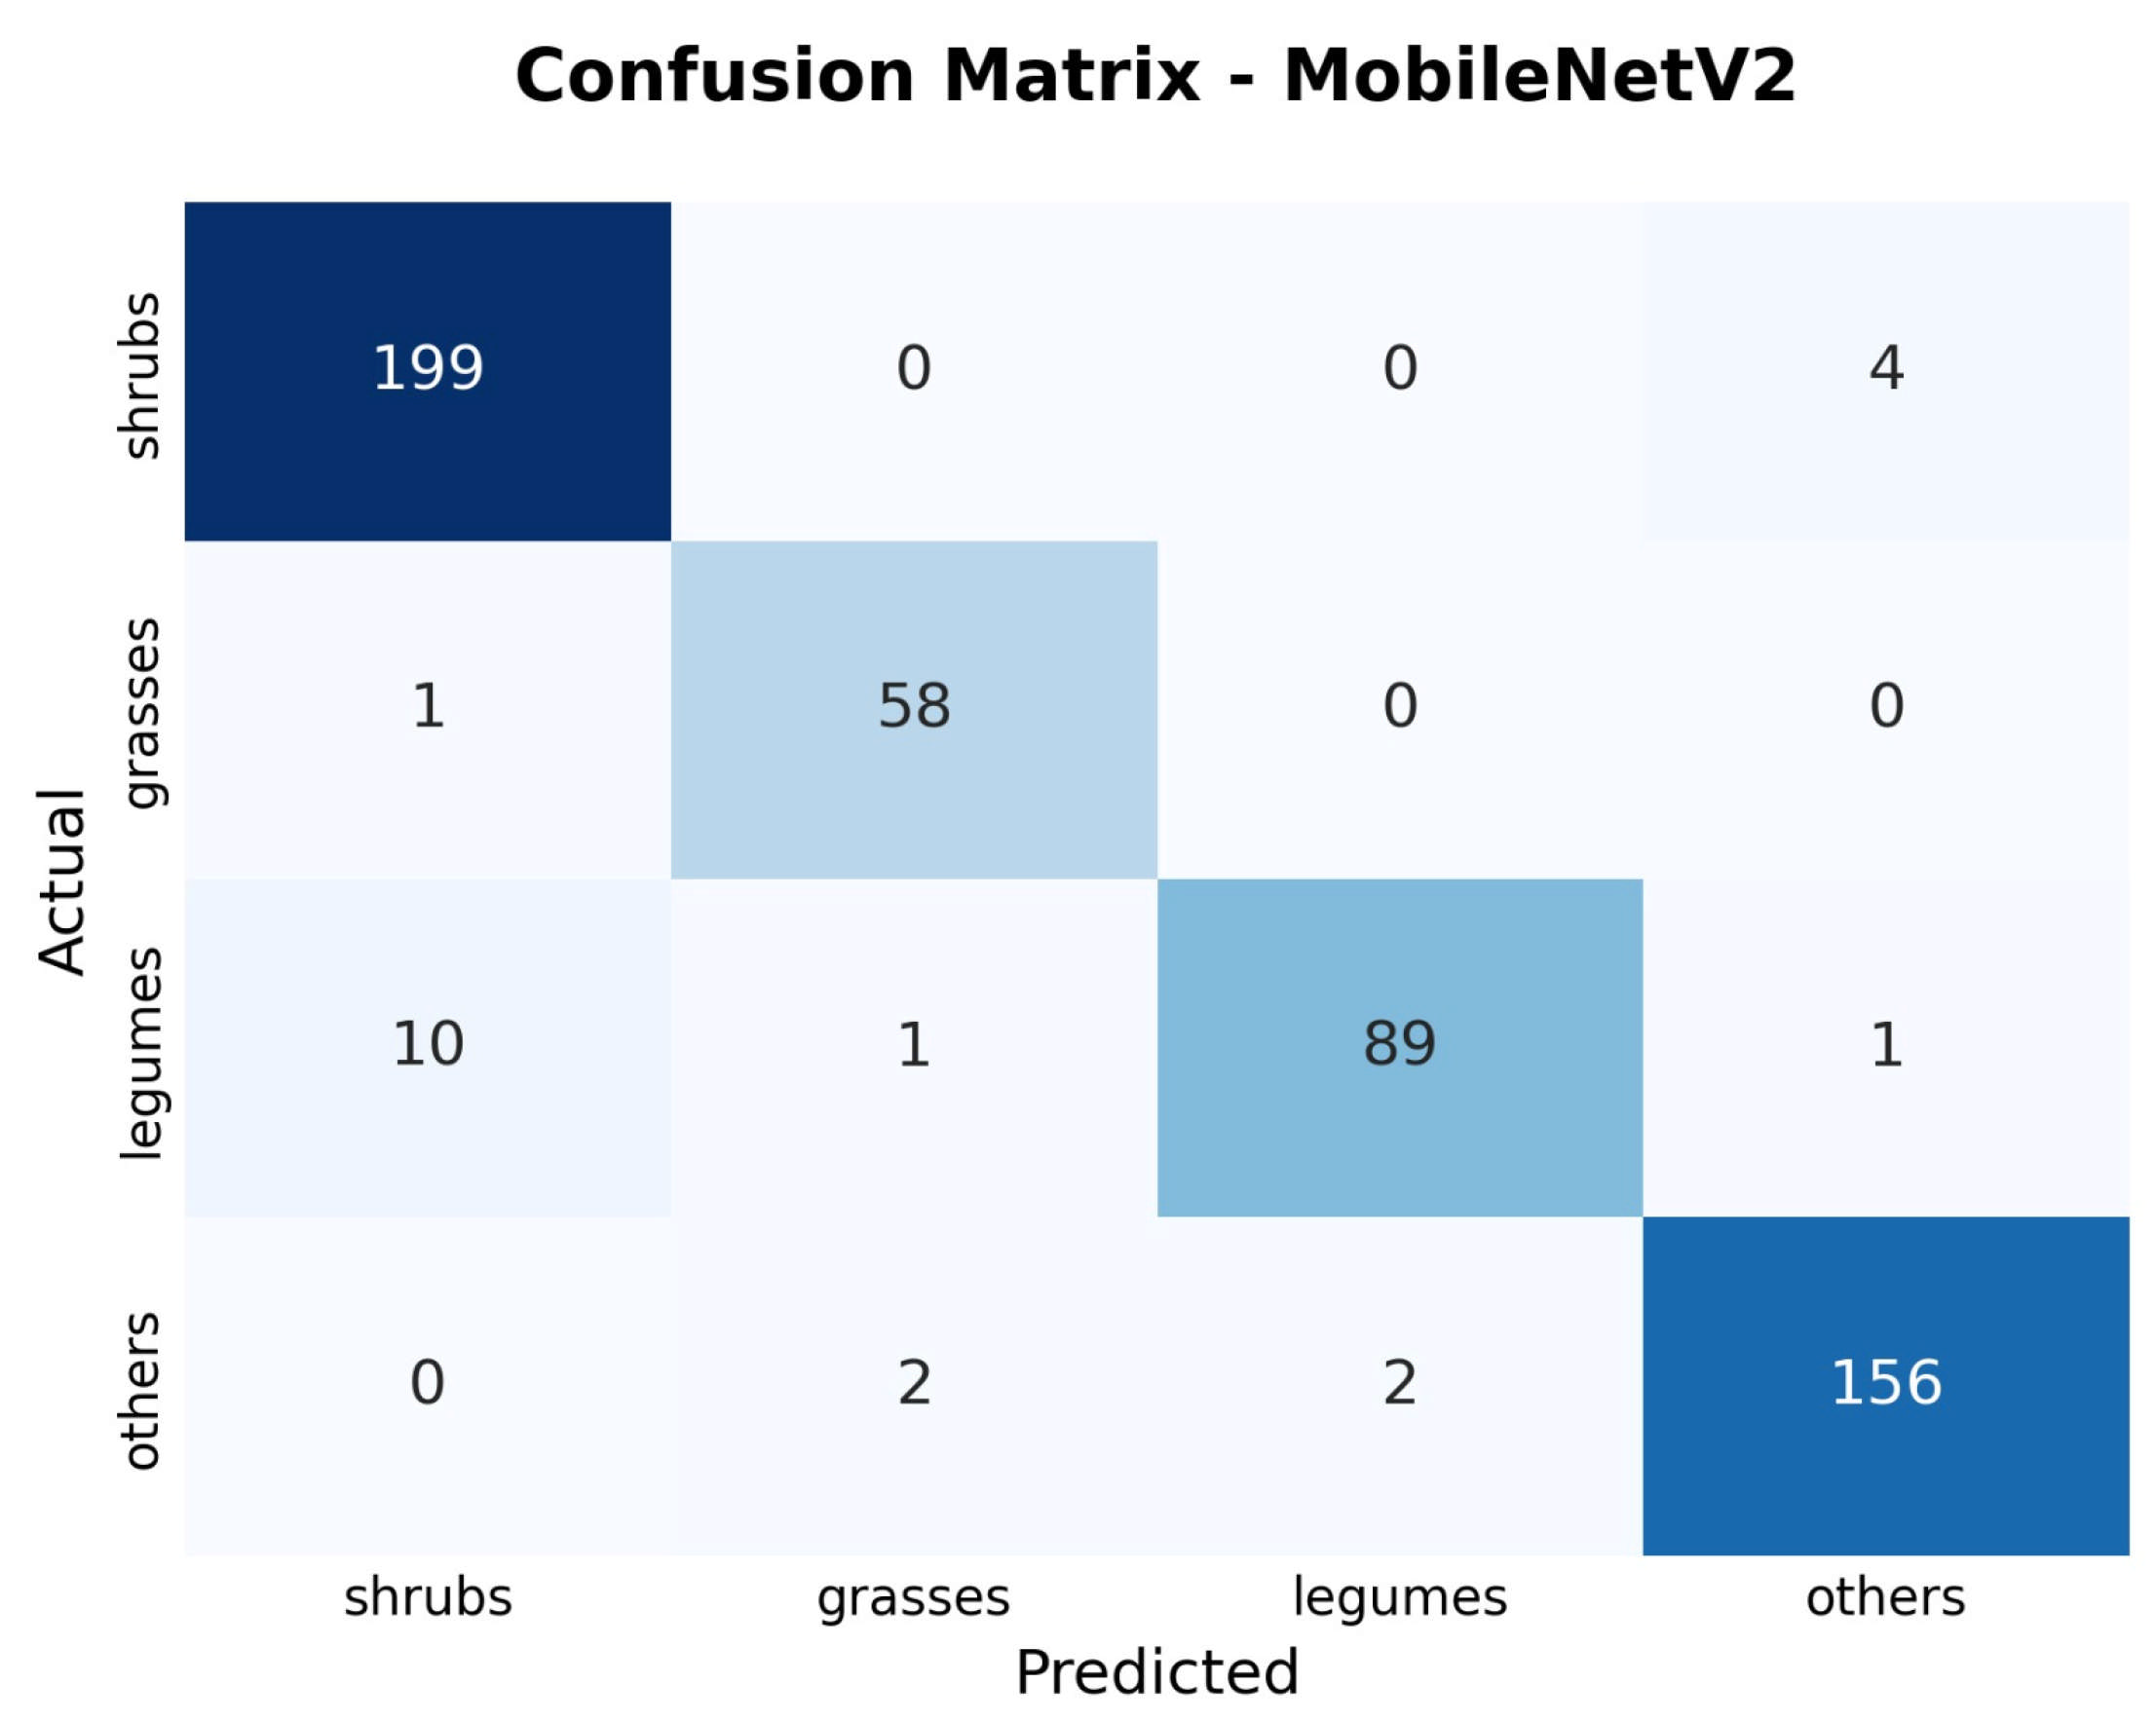
The confusion matrices provided critical insight into the system’s reliability for key grazing categories. For instance, the misclassification of ‘Legumes’ as ‘Shrubs’ (False Negatives for Legumes) in the MobileNetV2 model could lead to an underestimation of the pasture’s nutritional value. Conversely, misclassifying ‘Others’ (which may include toxic weeds) as edible ‘Shrubs’ (False Positives) poses a risk to animal health management. These patterns highlight that while overall MCC high, model selection must consider the specific cost of these false positive errors in a real-world grazing context.
2.7. Computational Performance Tests
The complete detection system, featuring ROI generation, classification, and NMS components, was evaluated across three different embedded hardware platforms to determine real-world deployment feasibility and performance details. The Raspberry Pi 4 [22] was a low-cost alternative for edge computing applications; however, its computational resources were restricted when compared to specialized AI hardware. This single-board computer has a quad-core ARM Cortex-A72 processor running at 1.5 GHz and 4 GB of LPDDR4 RAM. Its extensive use in IoT and embedded systems makes it a key metric for determining model deployment viability in resource-constrained contexts.
The latest generation of Raspberry Pi [23] has a quad-core ARM Cortex-A76 processor running at 2.4 GHz and 8 GB of LPDDR4X RAM. This platform significantly outperforms the previous version while maintaining the same factor and power consumption characteristics. The improved processing capabilities make it suited for more demanding computer vision applications while maintaining the accessibility of the Raspberry Pi ecosystem and its affordability. The Jetson Nano [24], with 4GB of LPDDR4 memory and native support for common deep learning frameworks, is a customized solution designed for AI workloads on the edge. This AI-focused embedded system has a quad-core ARM Cortex-A57 processor and a 128-core Maxwell GPU, offering specialized hardware acceleration for machine learning inference. Its GPU acceleration capabilities make it ideal for CNN inference tasks, providing a link between general-purpose single-board computers and high-performance computing systems.
These diverse hardware platforms allowed for an effective evaluation of the system’s performance across different computational capabilities, power consumption profiles, and price points, ensuring that the developed solution can be adapted to a variety of deployment scenarios and resources.
3. Results
3.1. Hyperparameter Optimization Process
After 150 trials, the Optuna optimization process found the ideal configuration, presented in Table 4. The best-performing configuration produced an MCC of 0.83618 on the validation set, indicating that hyperparameters were selected effectively within the given search space. The optimization results in Table 4 revealed a preference for smaller kernel sizes (3 × 3) and a moderate network depth (3 convolutional layers). This suggests that for this specific pasture dataset, extracting fine-grained local texture features is more critical for classification than capturing high-level global semantic structures.
Table 4.
Optimal hyperparameters identified by Optuna.
This configuration provided a lightweight model with just three convolutional layers (32, 64, and 16 filters) and a single dense layer with 128 units before the output layer. It used the RMSprop optimizer with a learning rate of approximately 0.00018.
3.2. Overall Model Performance Analysis
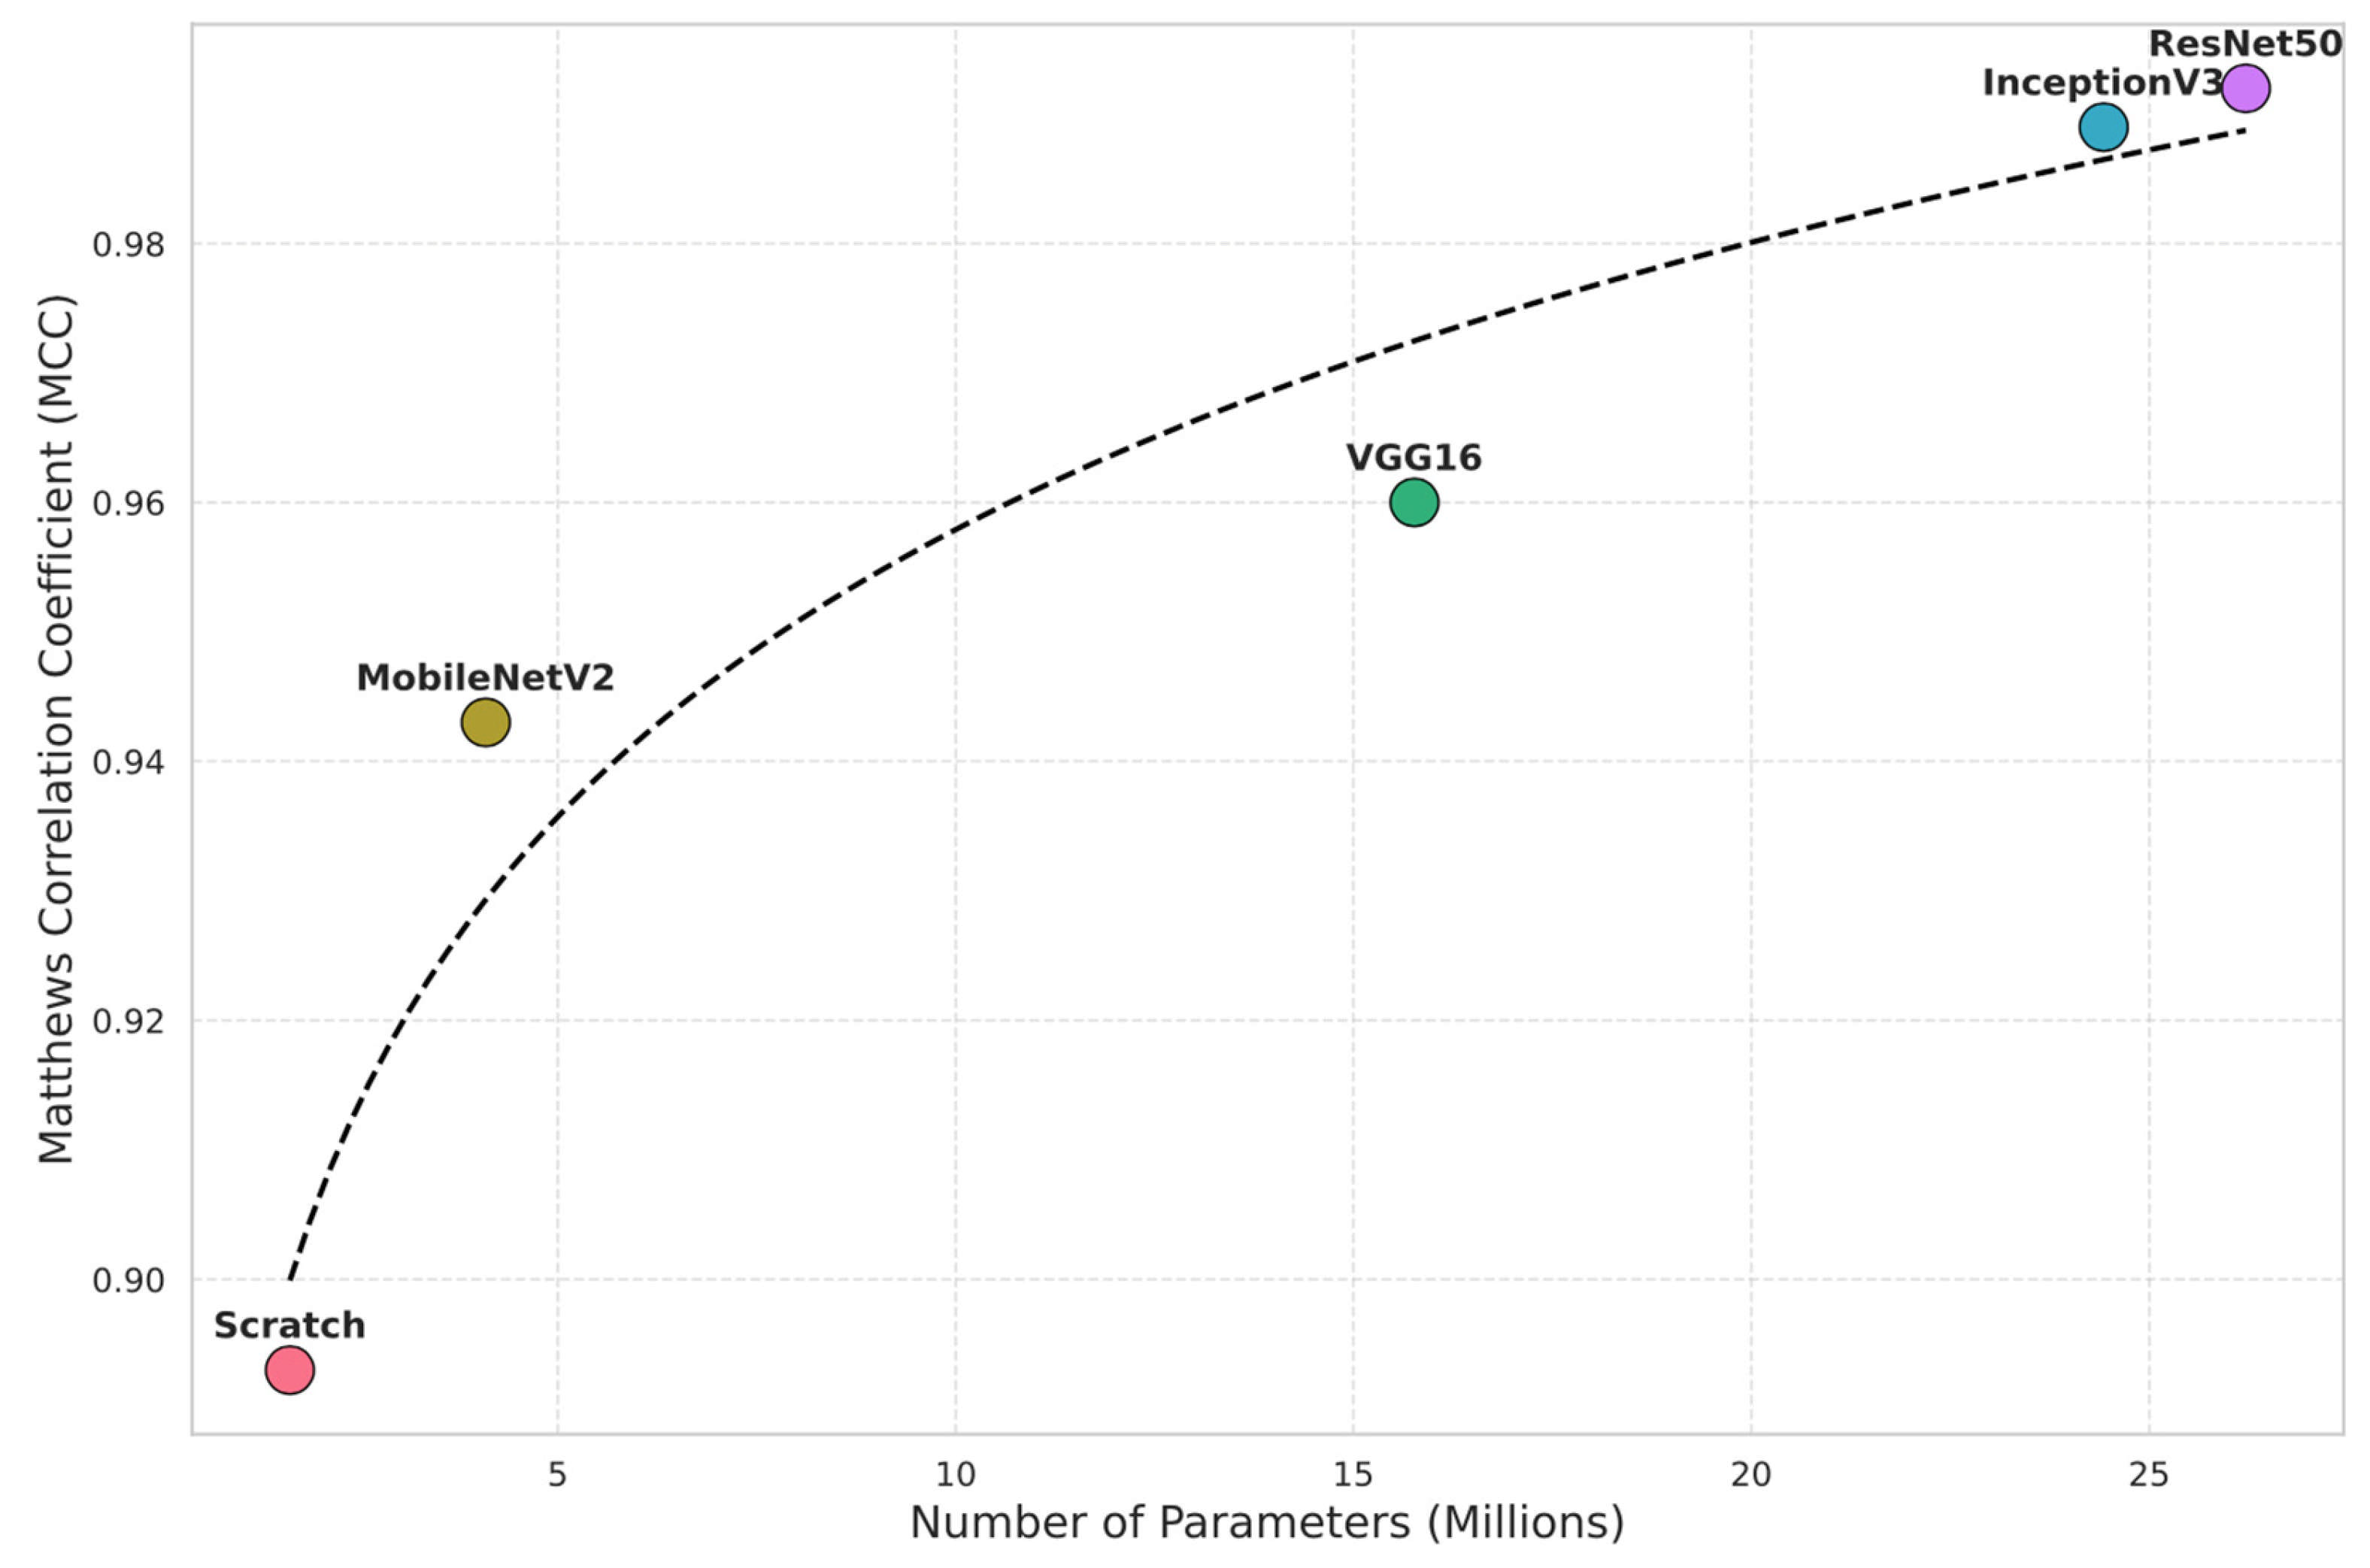
The Scratch-built network had the most lightweight architecture, with just 1,635,028 parameters and a model size of 6.24 MB, resulting in an MCC of 0.893. Among the pre-trained architectures, MobileNetV2 provided a good balance between efficiency and performance, with 4,096,580 parameters (15.63 MB) and an MCC of 0.943. Despite its reputation for efficiency, EfficientNetB0 performed worse, having 5,888,167 parameters (22.46 MB) and achieving an MCC of 0.770. The classification performance was superior for the bigger, more complex architectures. With 15,768,852 parameters (60.15 MB), VGG16 obtained an MCC of 0.960 and InceptionV3 used 24,427,812 parameters (93.18 MB) to achieve 0.989 MCC. With an MCC of 0.992, ResNet50 produced the best results; however, it came at the cost of the largest model size, with 26,212,740 parameters (99.99 MB).
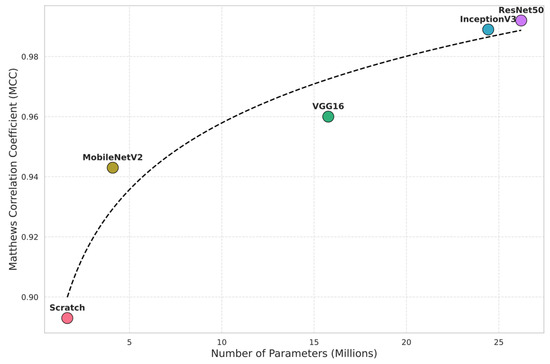
These results illustrate the typical trade-off between model complexity and classification accuracy, with the detailed performance metrics presented in Table 5 and Figure 2.
Table 5.
Comparison of results of the CNN (Convolutional Neural Network) architectures tested based on parameters, model size, and MCC (Matthews Correlation Coefficient).
Figure 2.
Relationship between the number of parameters (in millions) and the MCC (Matthews Correlation Coefficient) for InceptionV3, MobileNetV2, ResNet50, Scratch, and VGG16 CNN (Convolutional Neural Network) architectures. Each point represents a distinct model evaluated on the plant classification task.
EfficientNetB0 was excluded from the visual comparison in Figure 2 solely to maintain a high-resolution y-axis scale that allows for a clearer distinction between the top-performing architectures (MCC > 0.89). Full performance metrics for all models, including EfficientNetB0, are detailed in Table 5.
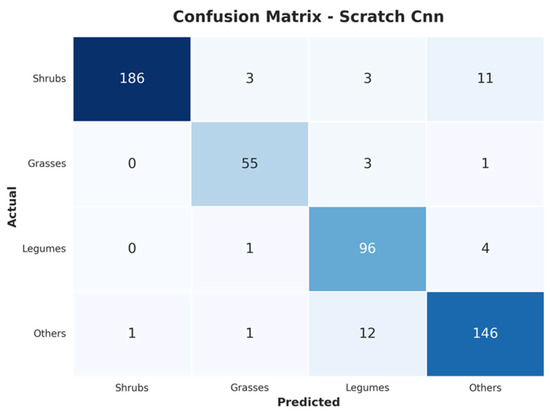
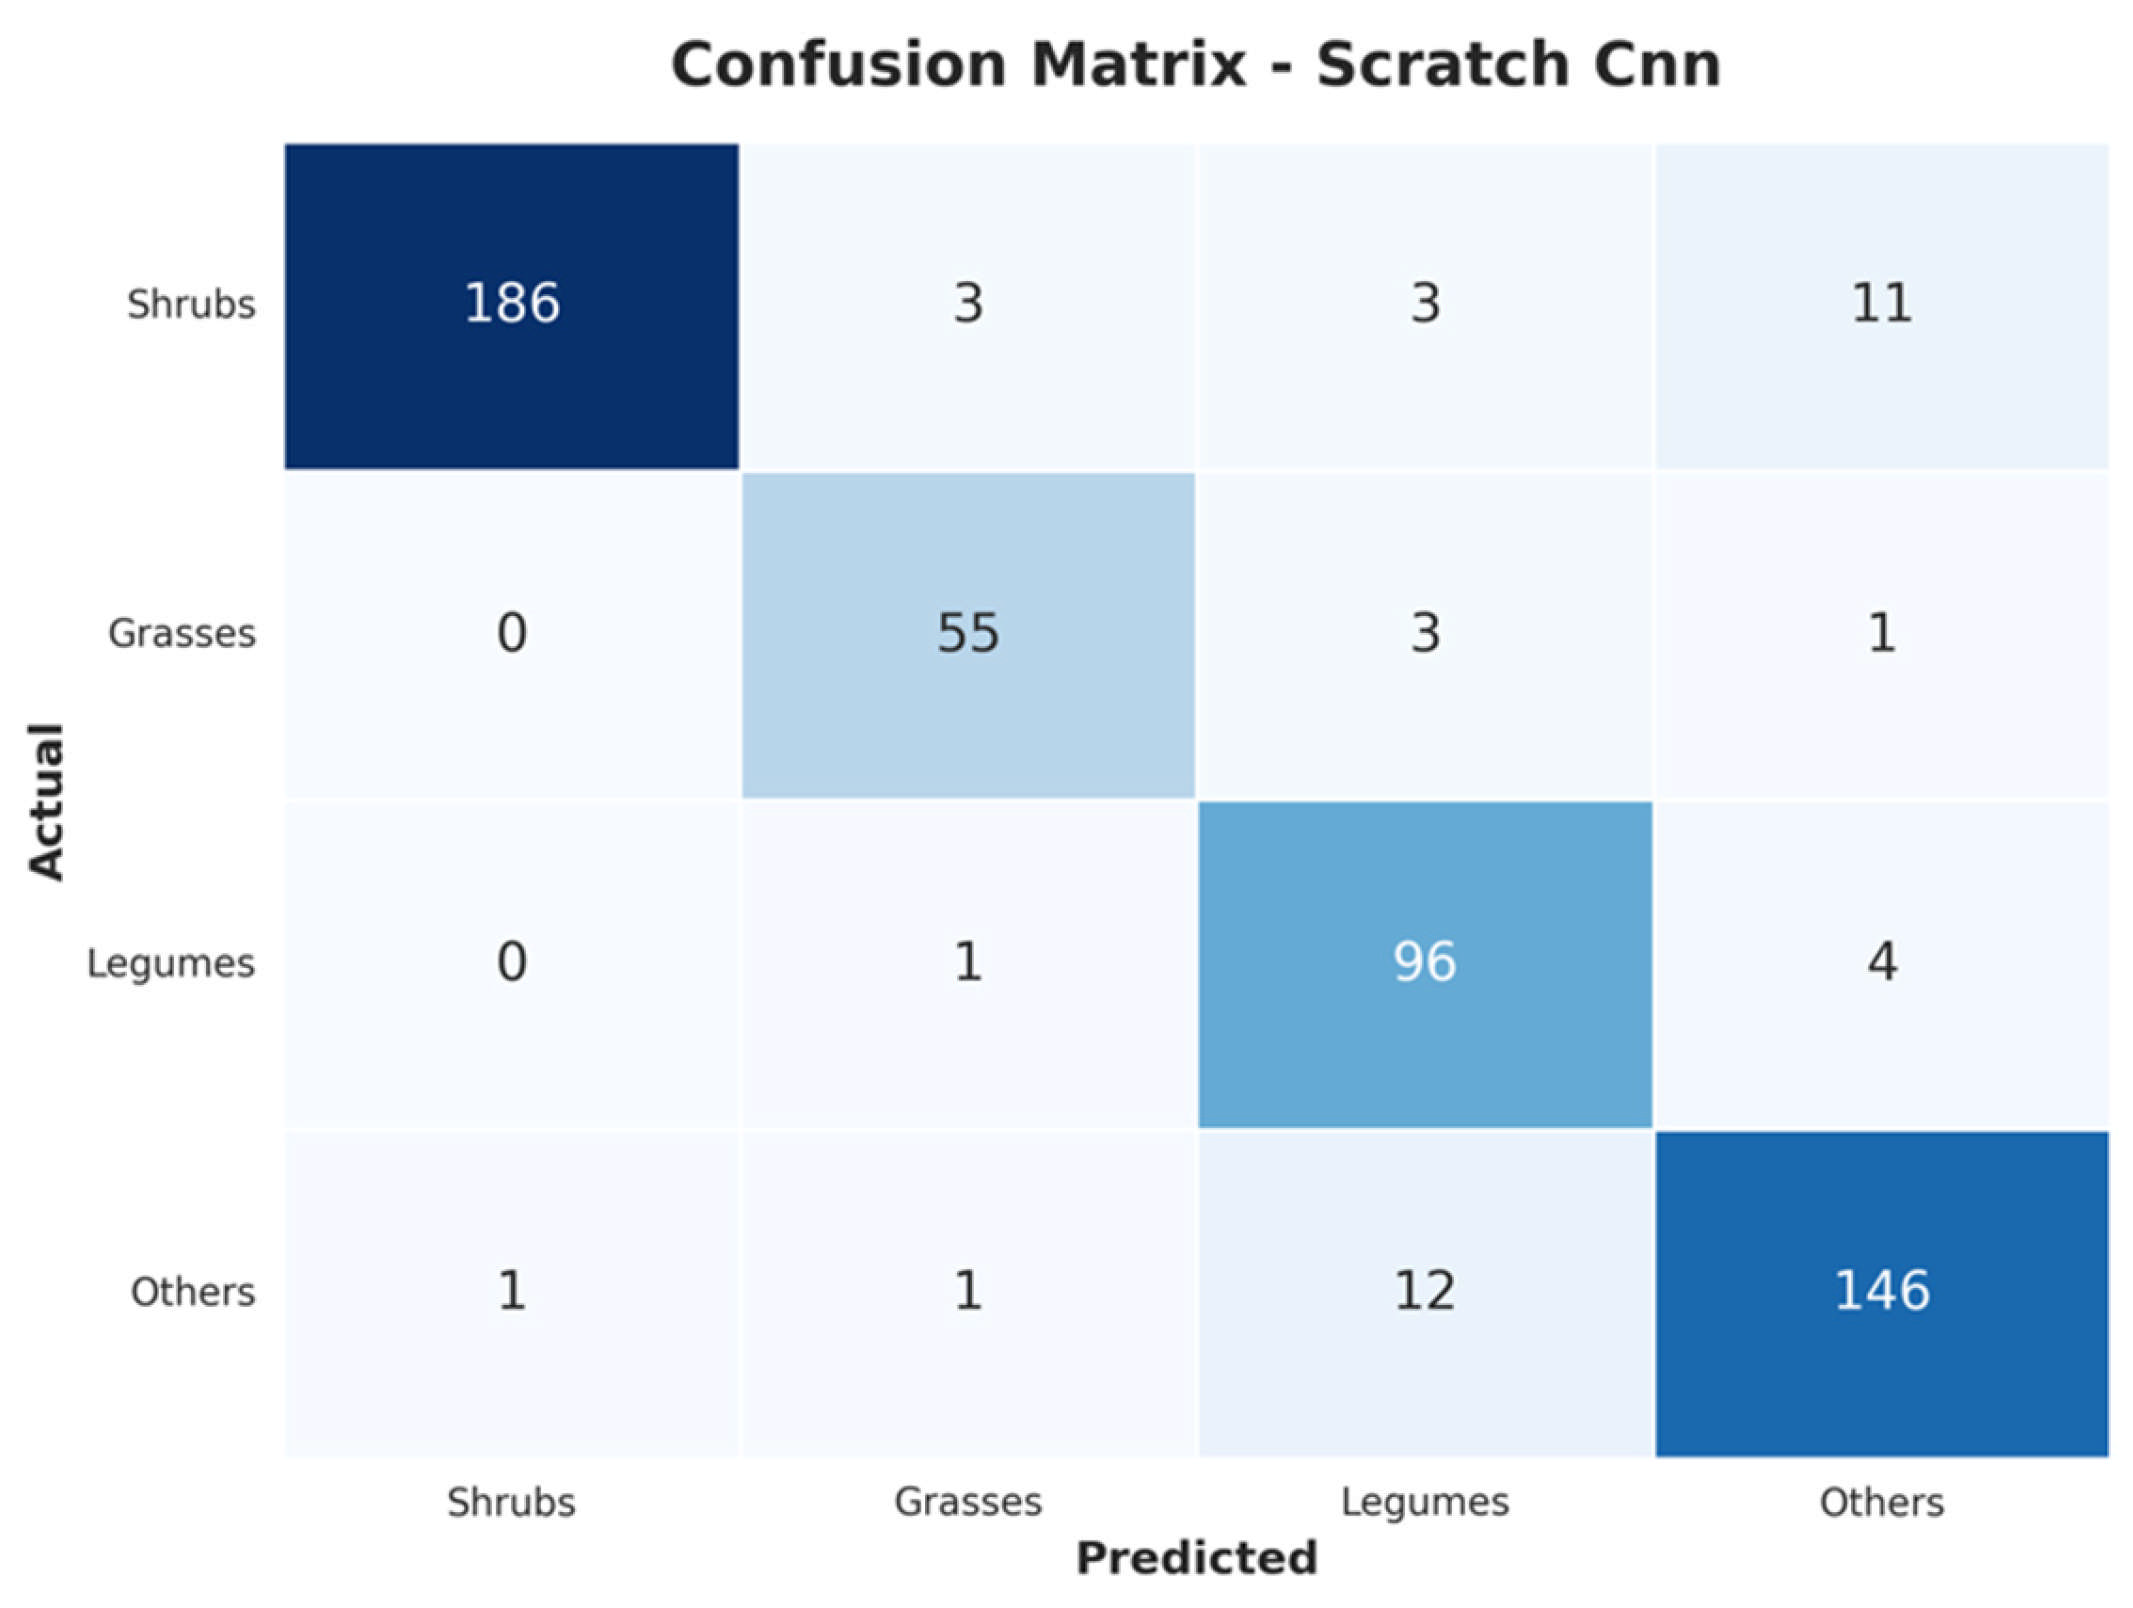
The distribution differences between training and test sets demonstrated that the evaluated architectures differed in terms of resilience. The Scratch-built model achieved an MCC of 0.894, indicating reasonable robustness considering its lightweight nature. However, when analyzing its confusion matrix, presented in Figure 3, it shows some bias in misclassifying “shrubs” as “others” (11 examples) and “others” as “legumes” (12 examples), indicating sensitivity to physical similarities between shrubs or legumes and weeds when training data distributions differed from test conditions.
Figure 3.
Confusion matrix for the CNN (Convolutional Neural Network) trained from scratch.
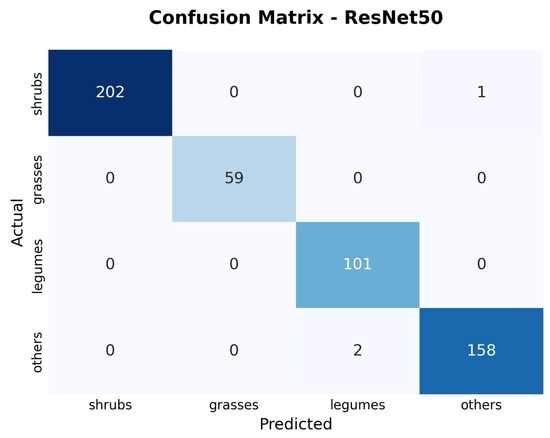
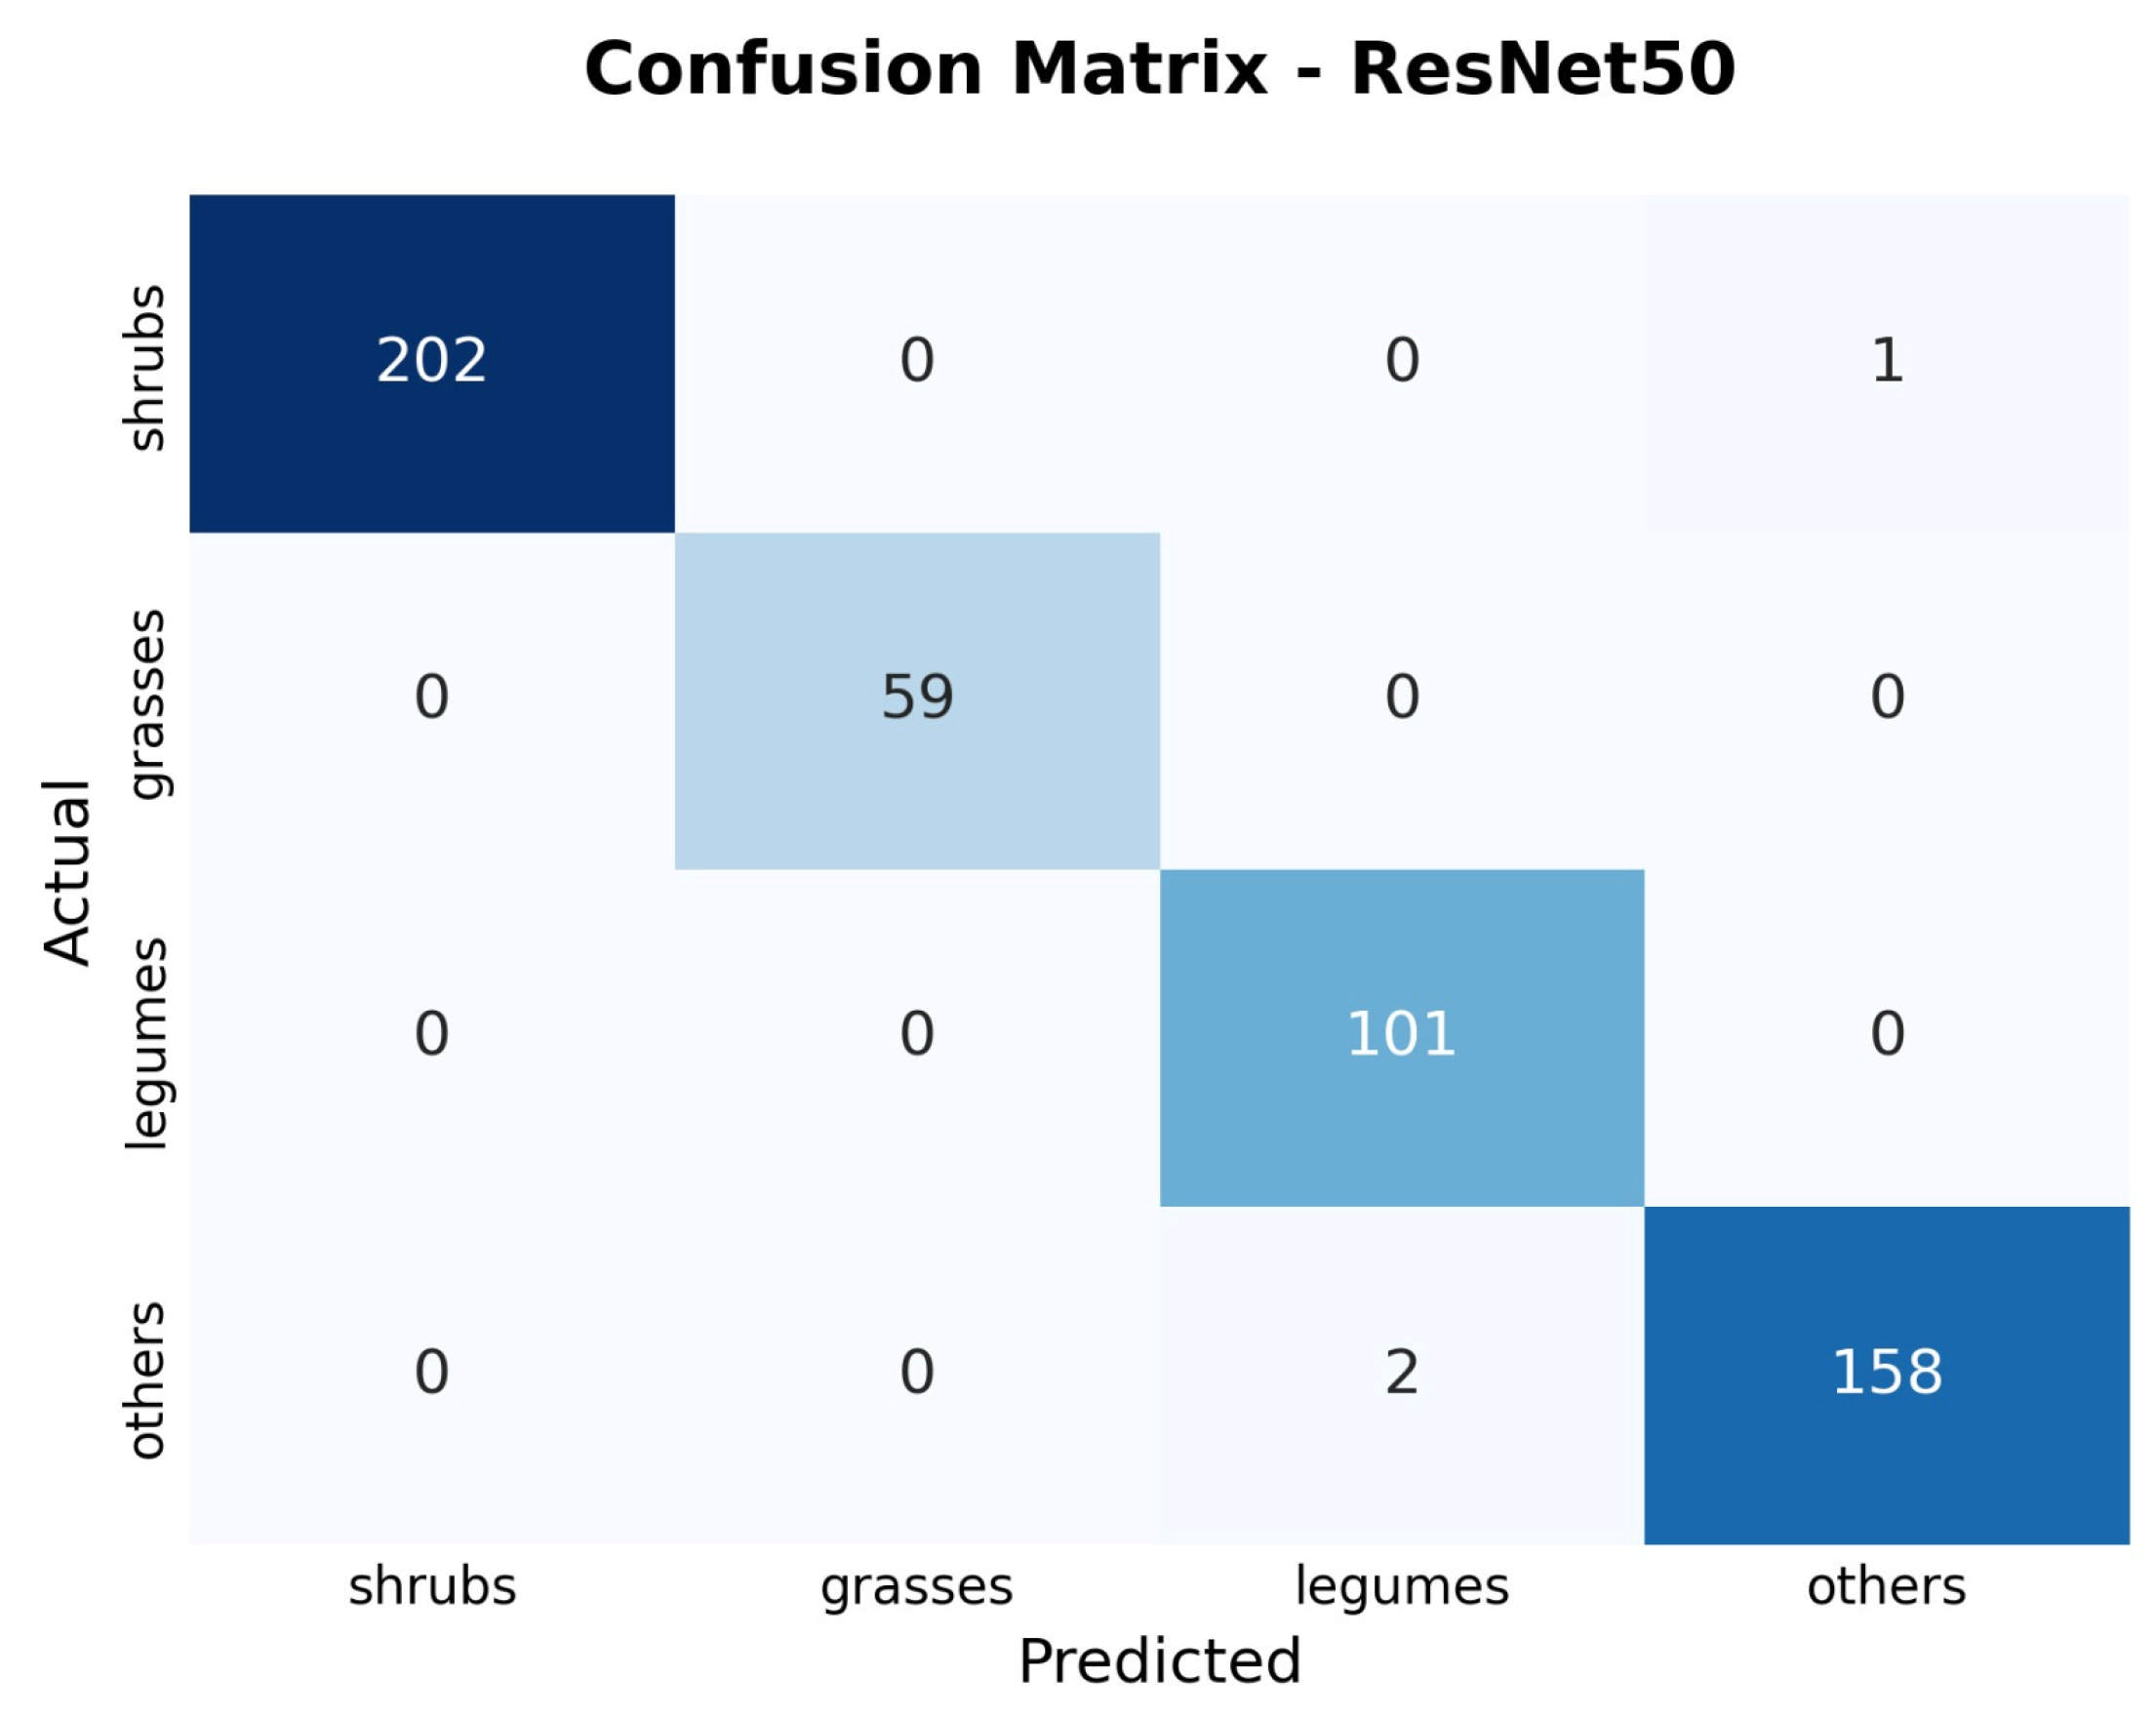
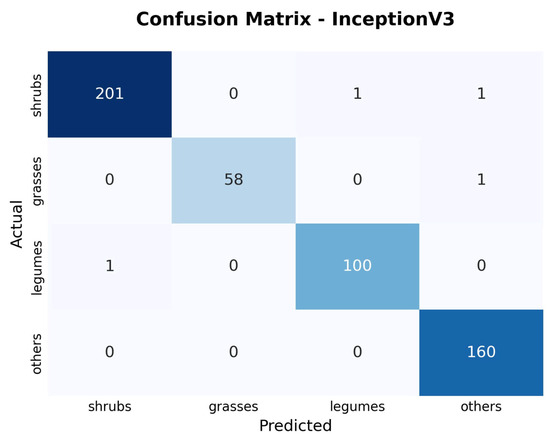
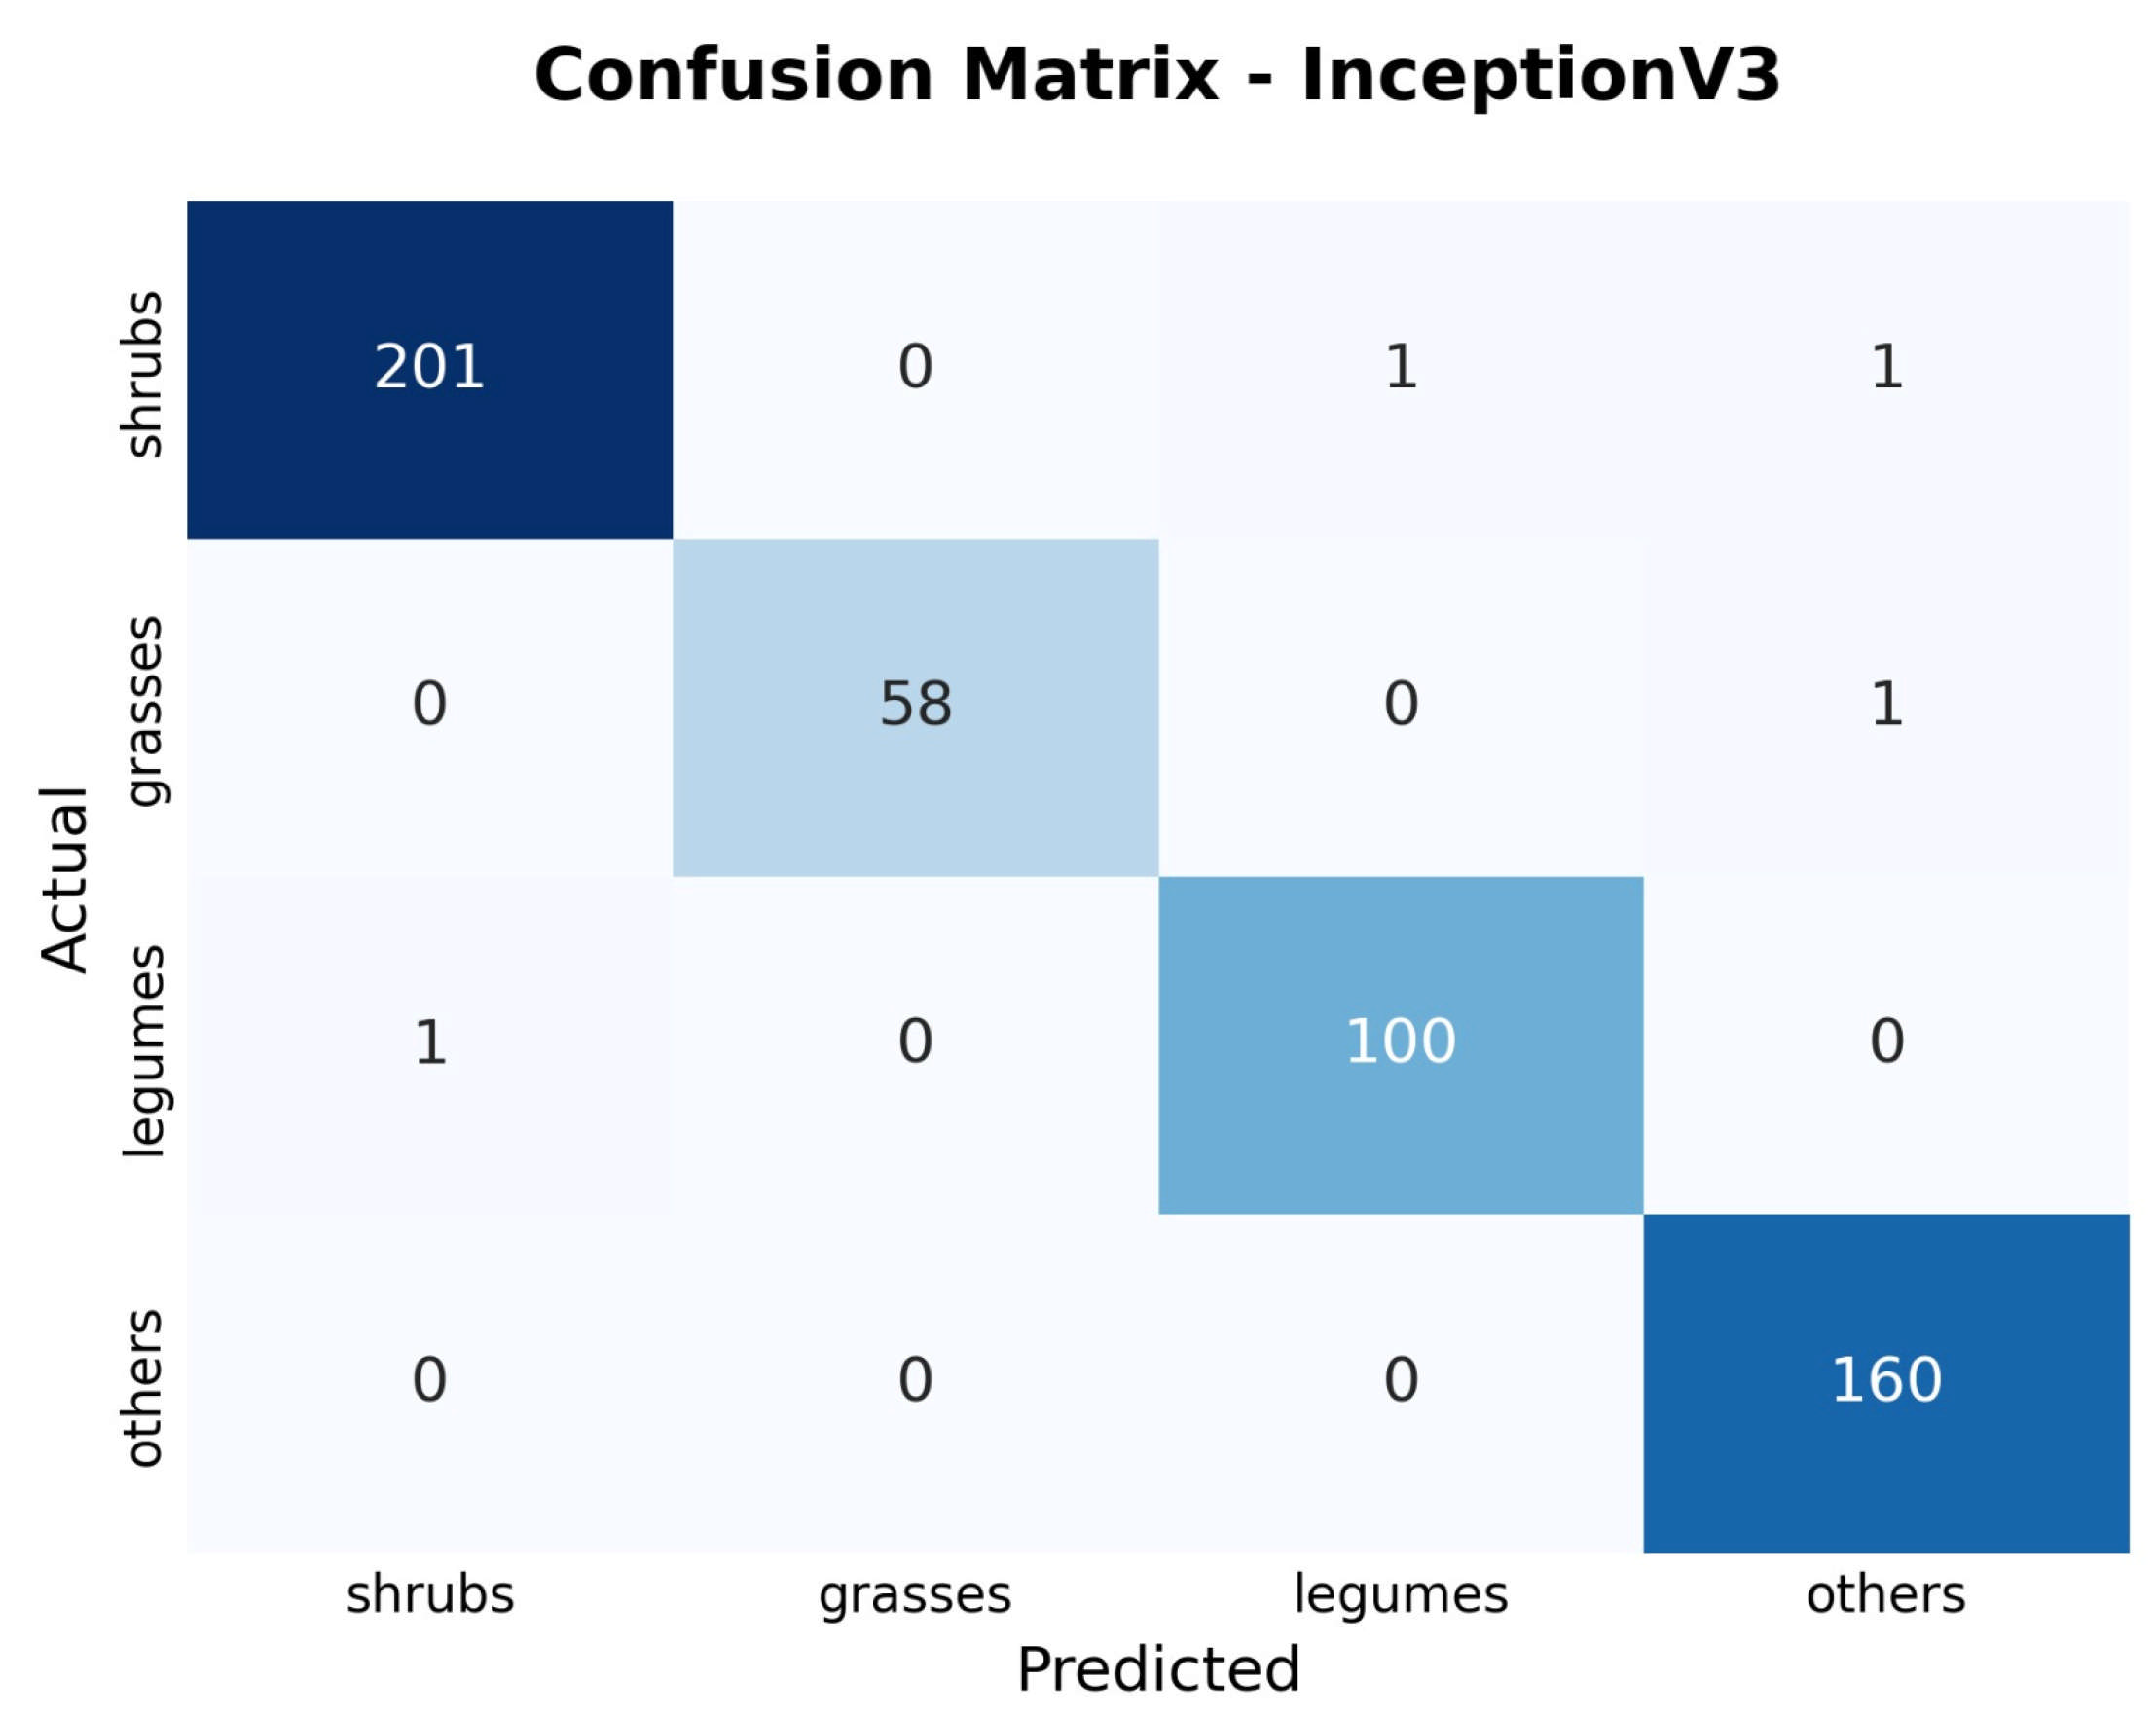
ResNet50 and InceptionV3 demonstrated the highest resilience to class imbalance, achieving MCC values of 0.992 and 0.989, respectively (Figure 4 and Figure 5). Both architectures yielded near-perfect classification, confirming superior feature extraction capabilities. The few observed misclassifications, particularly between “shrubs” and “legumes,” suggest morphological overlaps between these groups.
Figure 4.
Confusion matrix for ResNet50.
Figure 5.
Confusion matrix for InceptionV3.
MobileNetV2 demonstrated good overall robustness (MCC 0.943), yet Figure 6 reveals specific weaknesses in distinguishing “legumes” from “shrubs,” with ten misclassifications. EfficientNetB0 showed significant sensitivity to class imbalance, achieving a lower MCC of 0.770.
Figure 6.
Confusion matrix for MobileNetV2.
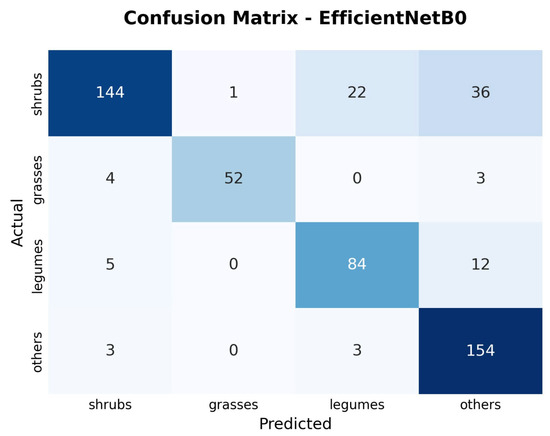
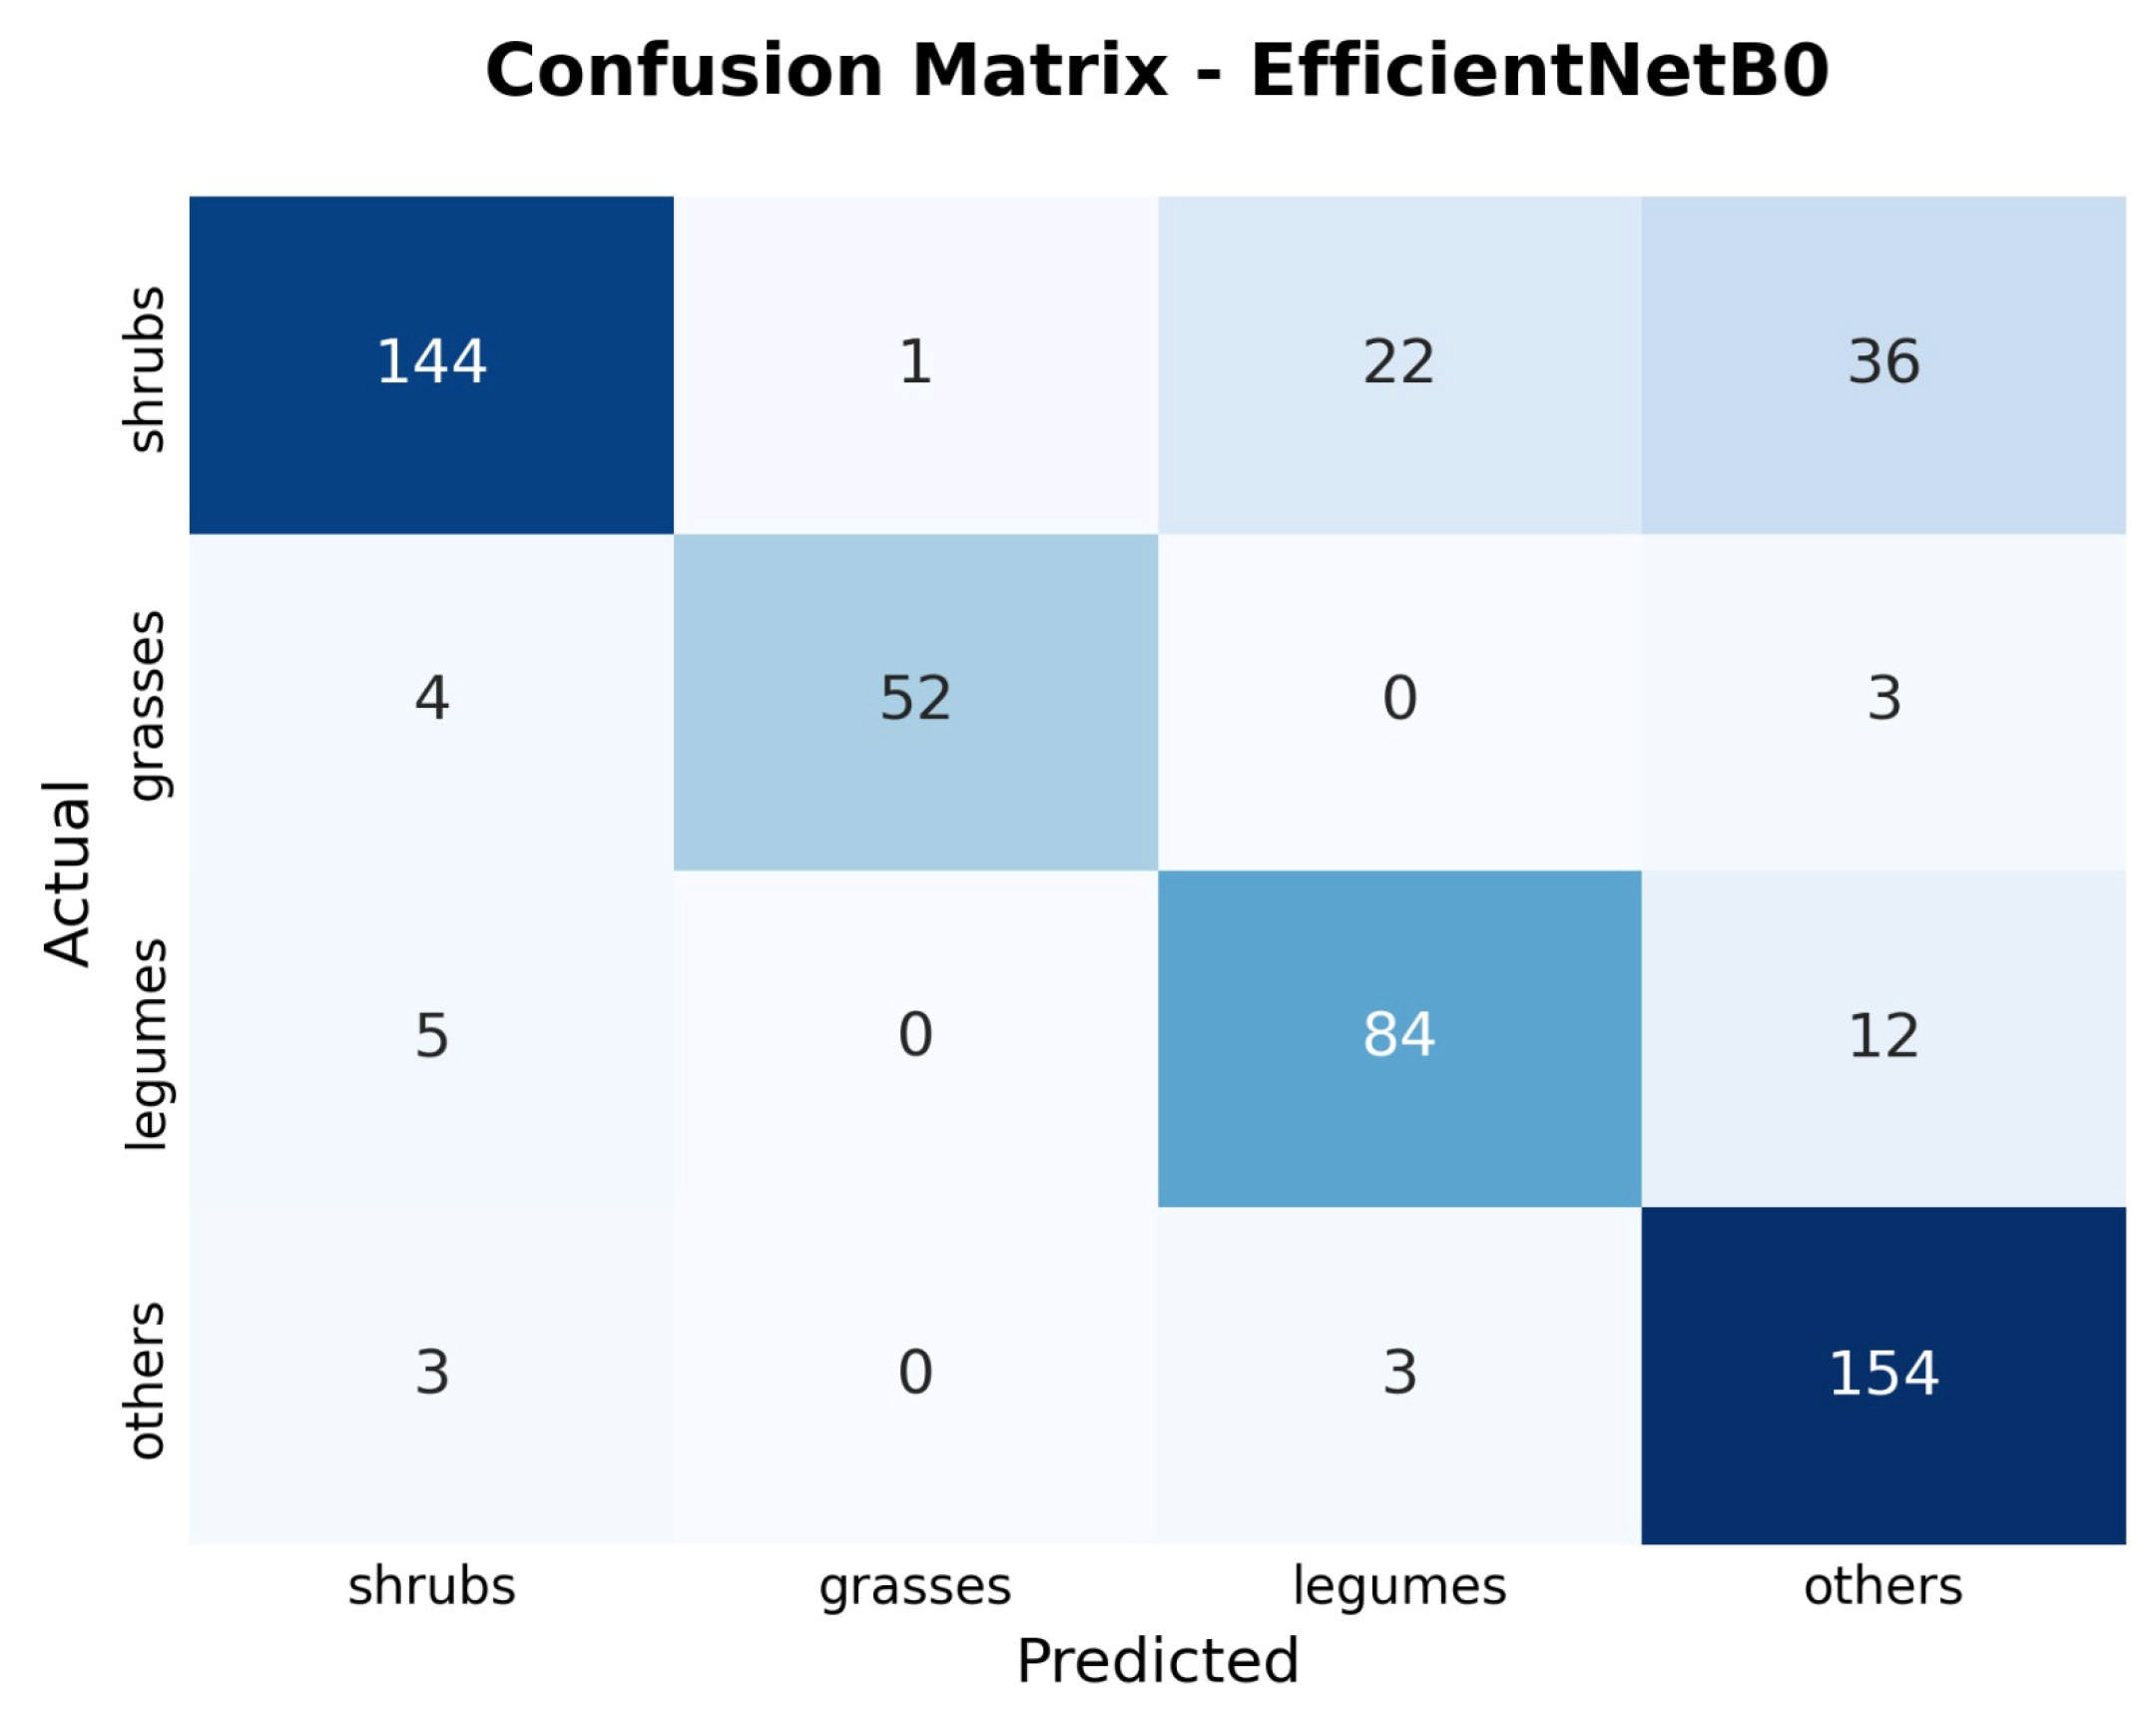
The confusion matrix in Figure 7 highlights systematic misclassification patterns for EfficientNetB0, particularly regarding “shrubs,” where 59 of 203 samples were incorrectly labeled (36 as “others” and 22 as “legumes”). This performance indicates a failure to learn discriminative features when confronted with distribution shifts.
Figure 7.
Confusion matrix for EfficientNetB0.
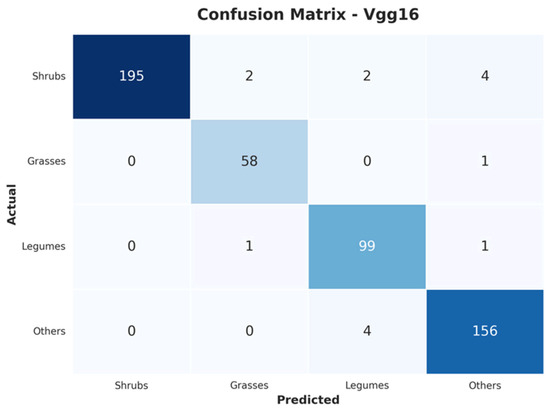
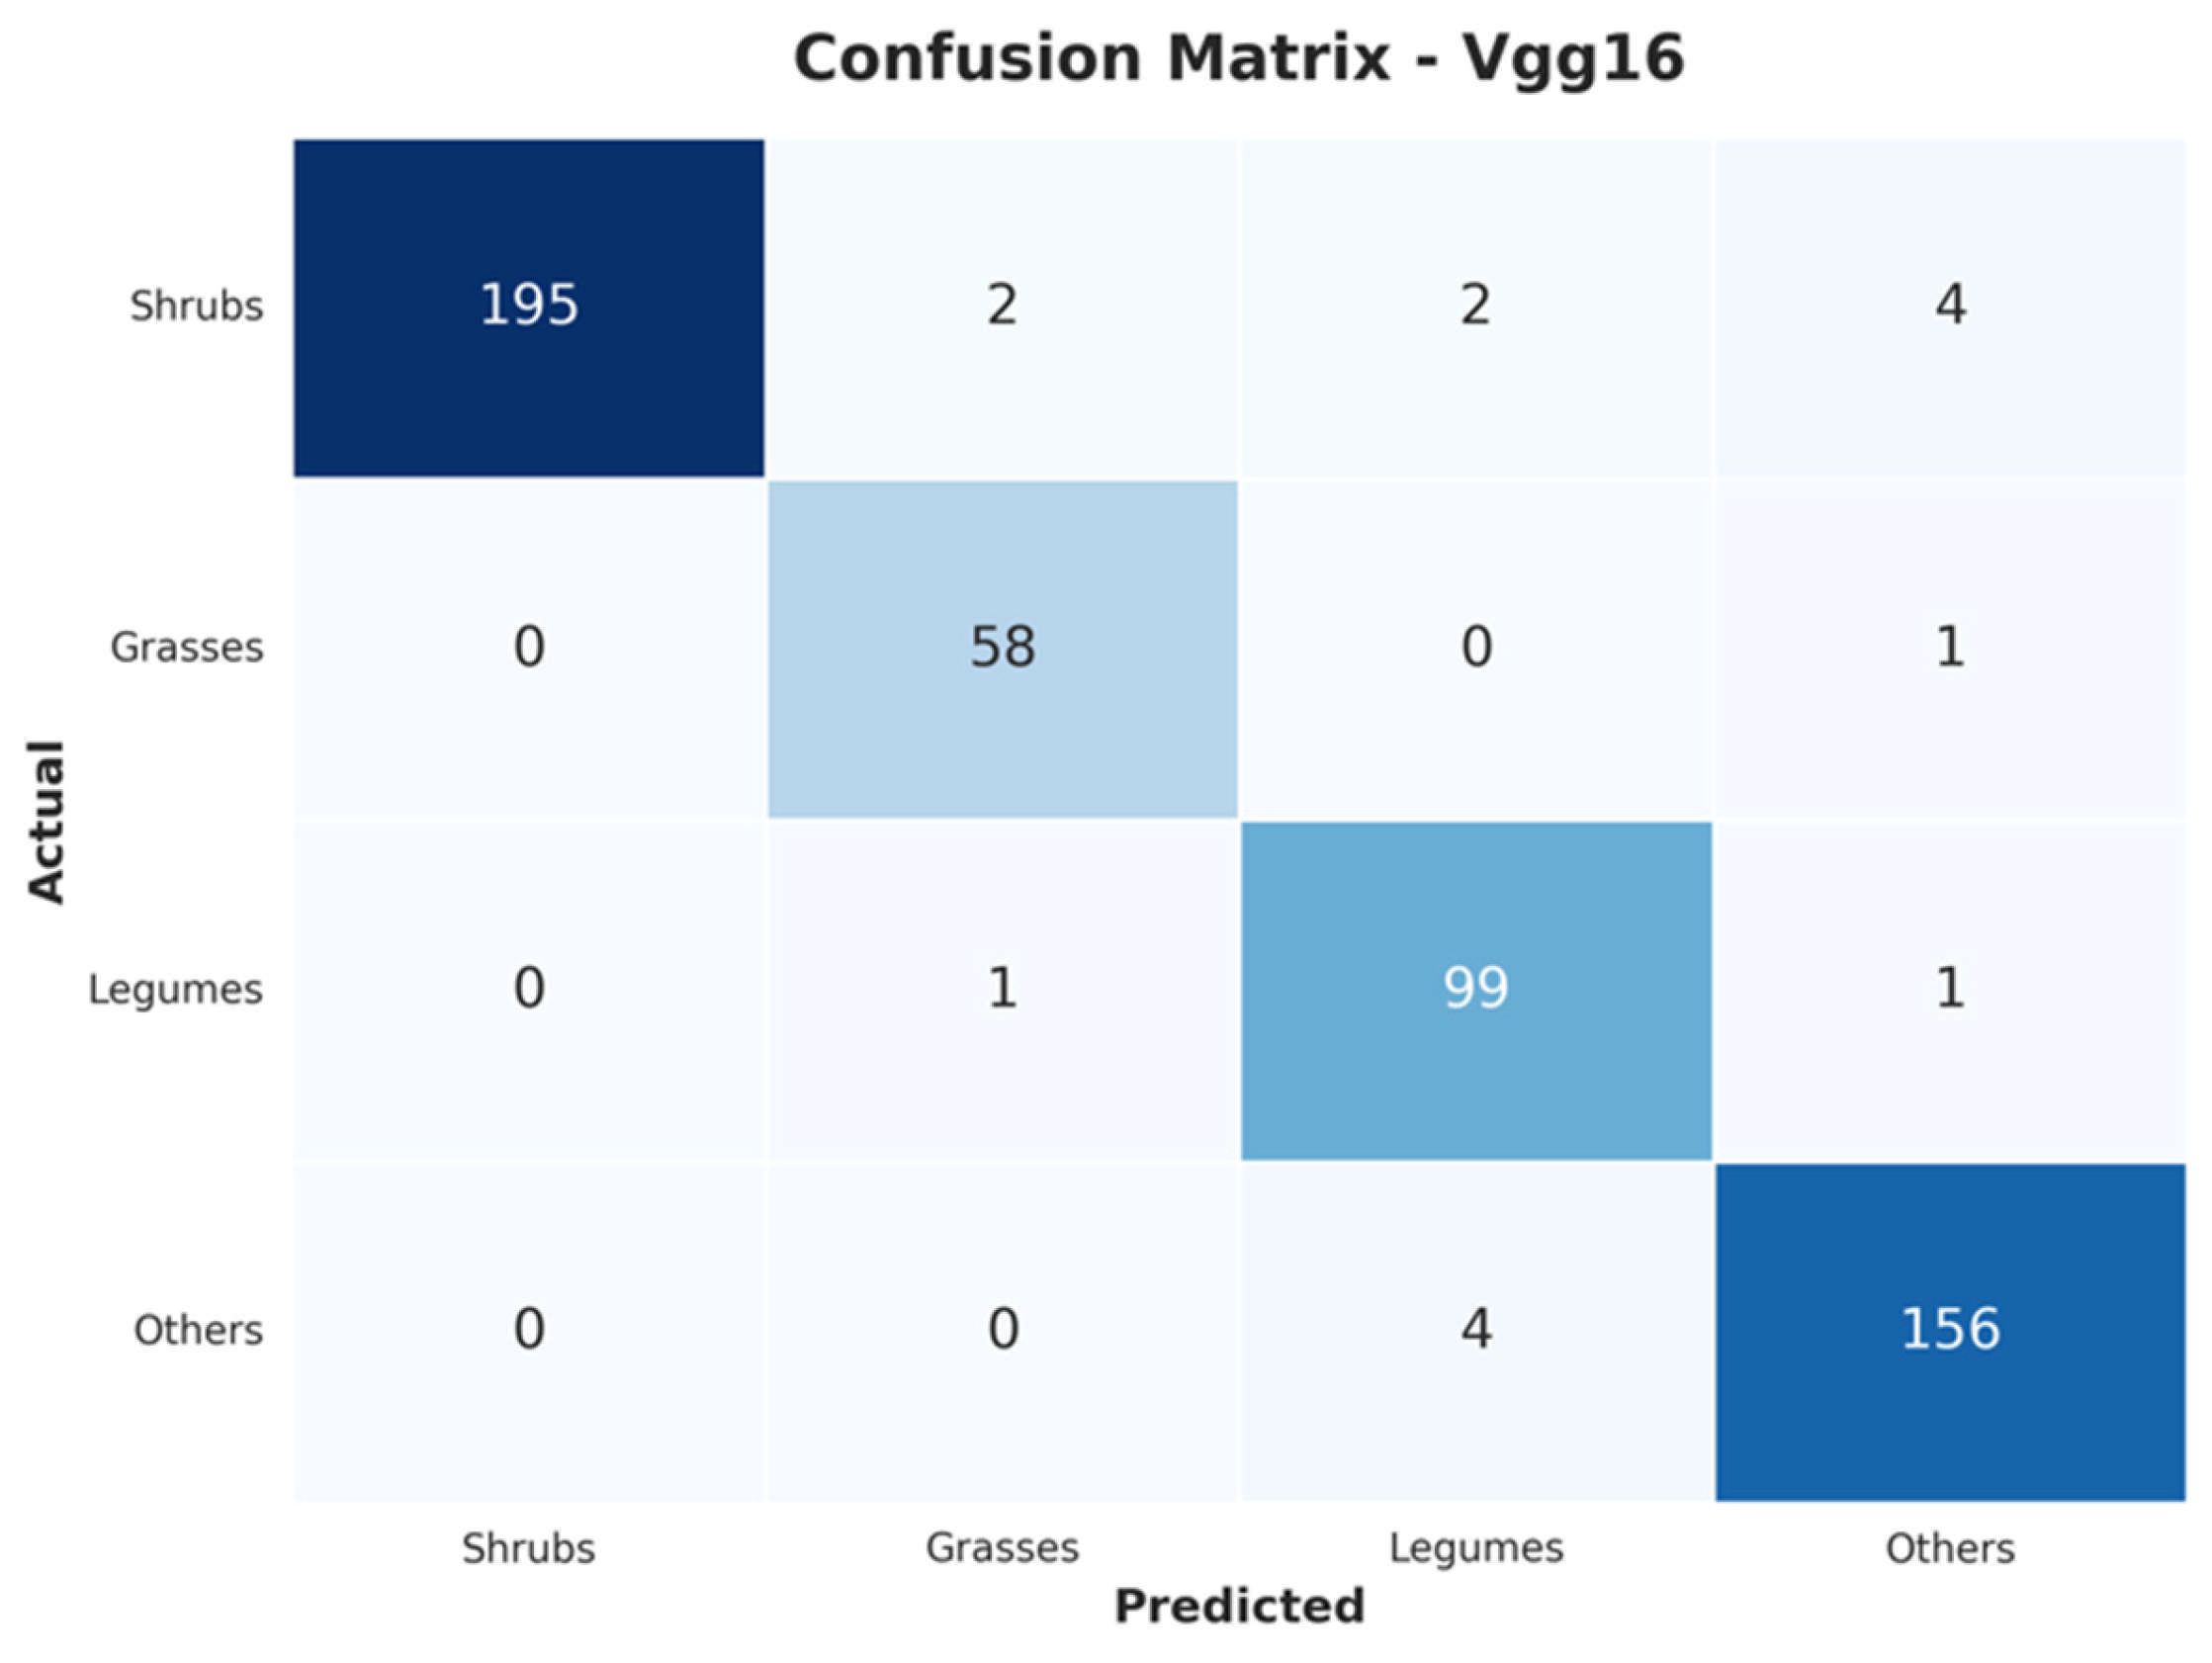
VGG16 achieved high robustness to class imbalance (MCC 0.960), though Figure 8 indicates moderate confusion in classifying “shrubs,” with eight errors distributed across categories. The model also exhibited minor confusion between “others” and “legumes.”
Figure 8.
Confusion matrix for VGG16.
Consistently, the most challenging boundary across models was between “shrubs” and “others,” likely due to overlapping woody growth patterns. The second most problematic distinction was between “legumes” and “shrubs,” a difficulty particularly evident in MobileNetV2 and EfficientNetB0.
3.3. End-to-End System Performance
The end-to-end evaluation assesses the integrated system’s suitability for field deployment by analyzing both individual component metrics and their aggregate behavior. This comprehensive analysis is essential for understanding real-world performance and identifying the primary factors affecting the system’s effectiveness as a wearable plant identification tool.
The processing pipeline converts raw field images into classified detections through three core stages: Selective Search for Region of Interest (ROI) generation, CNN-based classification, and Non-Maximum Suppression (NMS) for refinement. Evaluating the individual and combined contributions of these components reveals critical processing requirements, accuracy constraints, and practical deployment limitations.
3.3.1. Overall Processing Time Analysis
The processing time analysis provides critical insights into the computational load distribution across the system’s pipeline. Experiments indicate that Selective Search for ROI generation and CNN classification account for the vast majority of computing resources. Consequently, steps such as NMS and preprocessing—which contribute less than 5% to the overall time—are excluded from this analysis to focus on the performance-critical components.
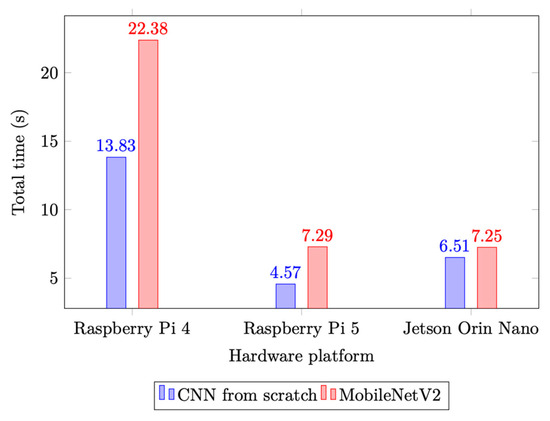
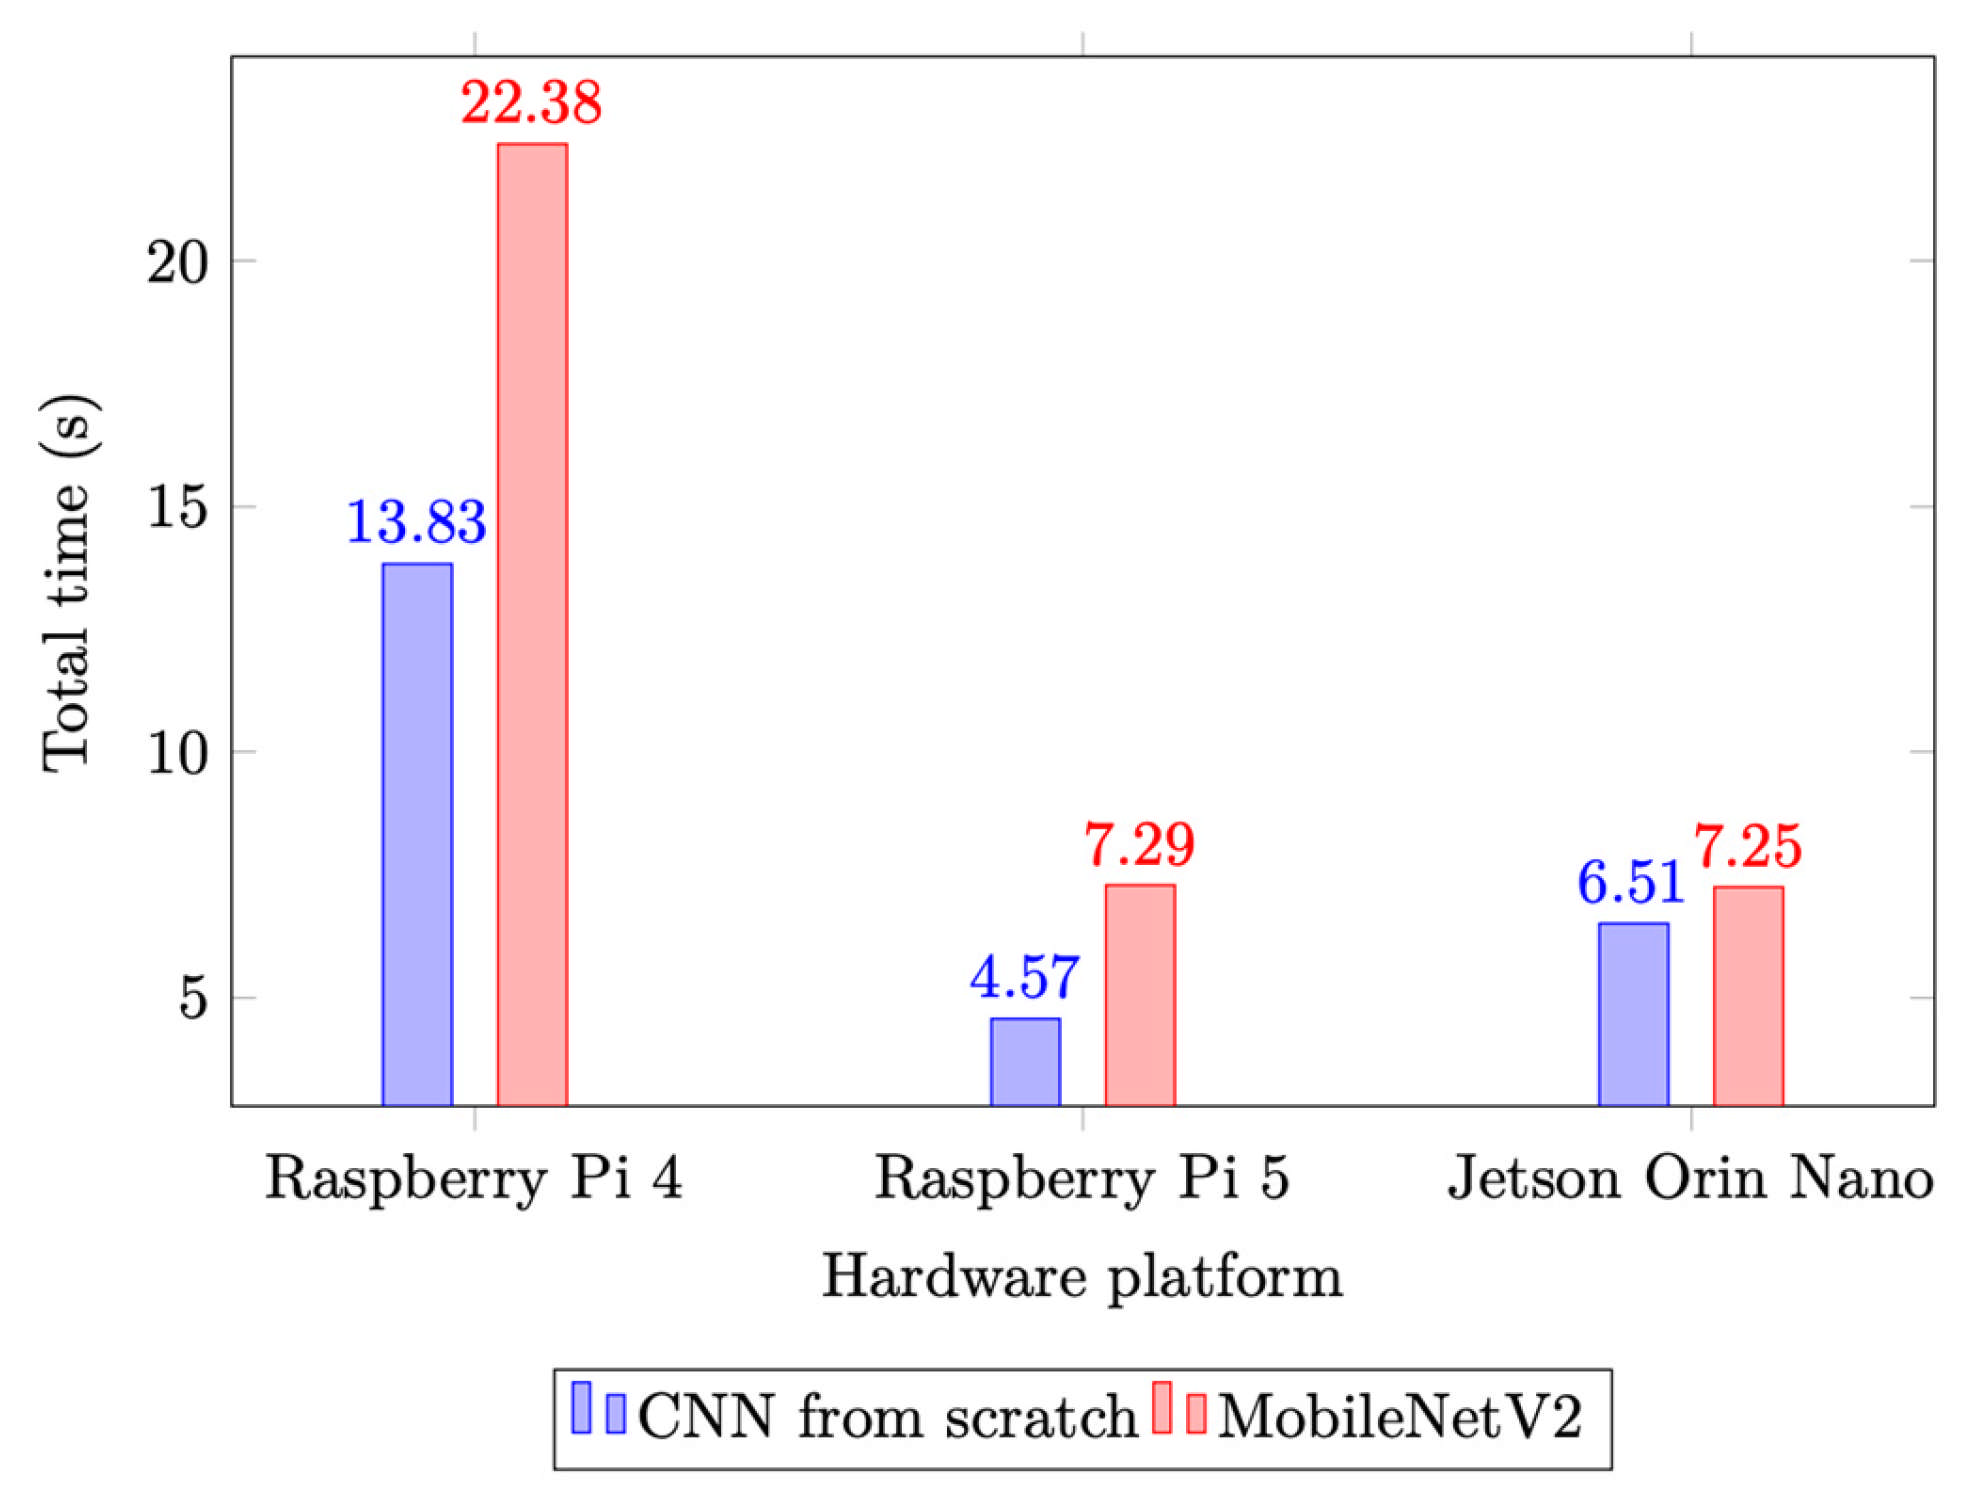
As shown in Figure 9, total inference times varied significantly across hardware platforms. The Raspberry Pi 4, representing the most cost-effective deployment option, required 13.83 s to complete image processing using the lightweight “Scratch” CNN, increasing to 22.38 s with MobileNetV2.
Figure 9.
Total inference time comparison across platforms (avg over 10 images).
The Raspberry Pi 5 demonstrated a substantial performance improvement, reducing total inference time to 4.57 s for the Scratch CNN and 7.29 s for MobileNetV2 (Figure 9). This efficiency gain underscores the importance of processor selection in embedded vision applications, where computational speed directly impacts the feasibility of real-time monitoring.
The Jetson Orin Nano presented a distinct case for specialized hardware, achieving 6.51 s for the Scratch CNN and 7.25 s for MobileNetV2 (Figure 9). While its performance with the lightweight model was slower than the Raspberry Pi 5, the Jetson’s GPU acceleration becomes advantageous for larger architectures, suggesting that its capabilities are best utilized for computationally demanding models like ResNet50 or InceptionV3.
3.3.2. Component-Wise Processing Time Analysis
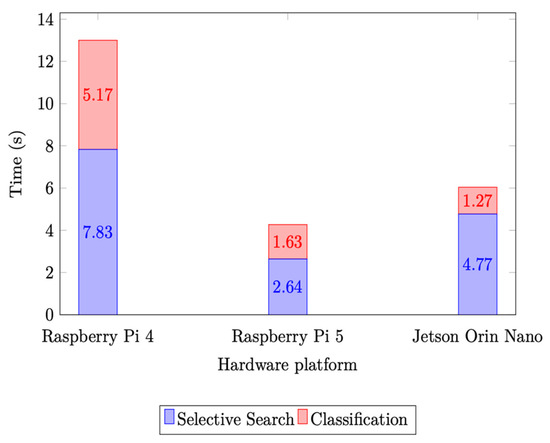
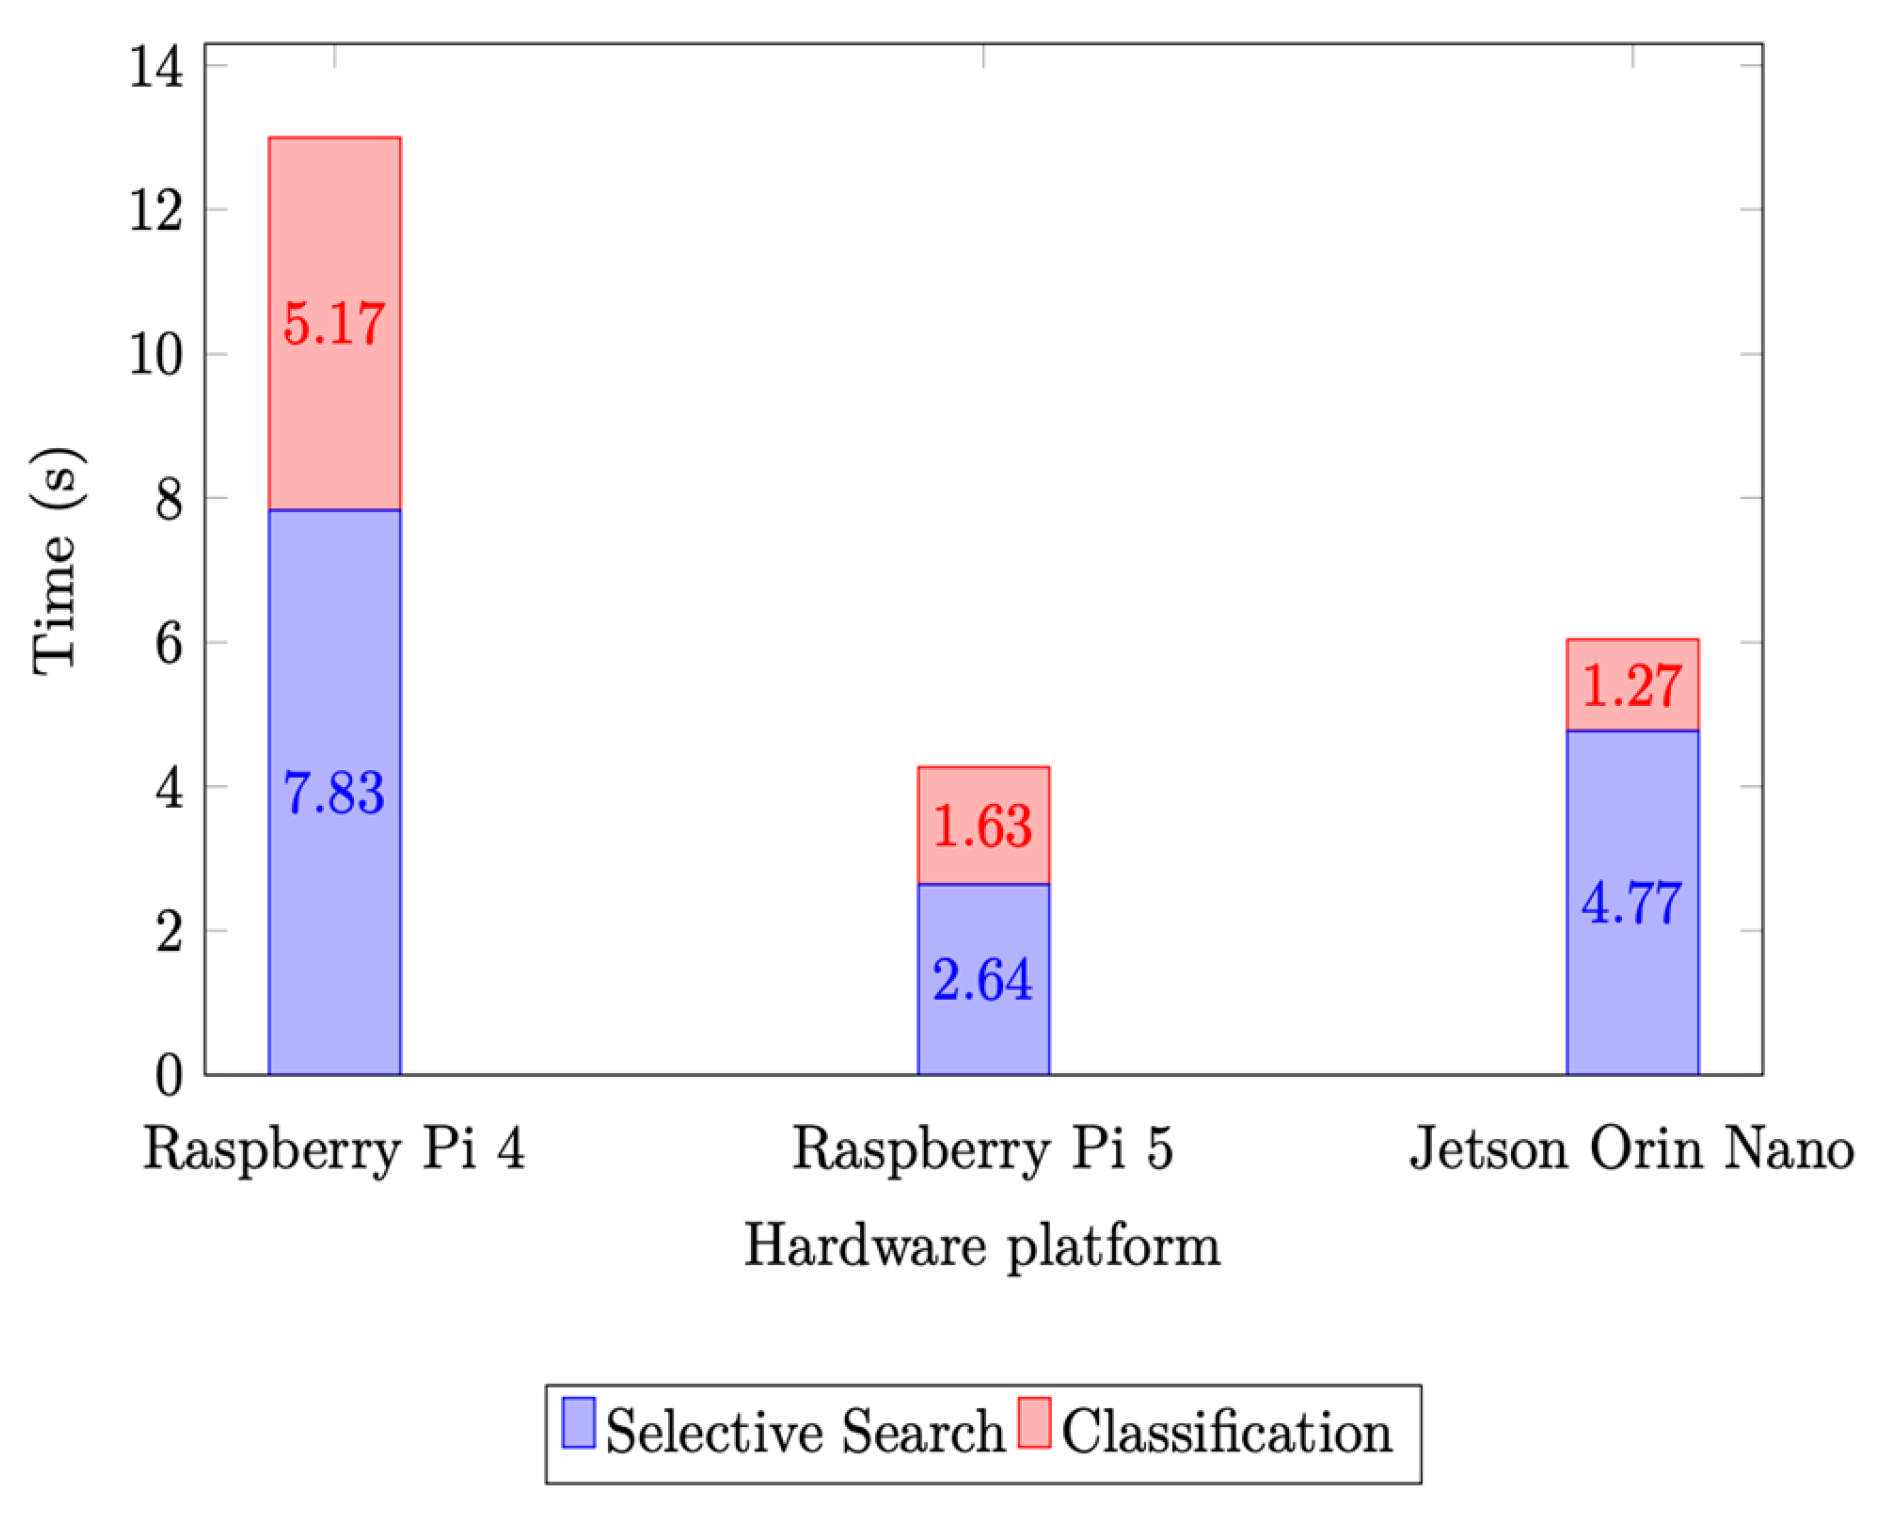
The analysis revealed distinct performance characteristics guiding hardware selection and optimization. Selective Search consistently emerged as the primary bottleneck, consuming 50–65% of total processing time. This dominance highlights a critical trade-off between detection robustness and speed. Execution times—7.9 s on Raspberry Pi 4, 2.6 s on Raspberry Pi 5, and 4.7 s on Jetson Orin Nano—indicate that ROI generation is a CPU-bound function benefiting from raw processor clock speed rather than specialized acceleration. Consequently, optimizing this component offers the most significant potential for system-wide improvement. Figure 10 details these timings for Selective Search and the custom CNN.
Figure 10.
Selective Search vs. Classification time [Scratch-built CNN (Convolutional Neural Network)].
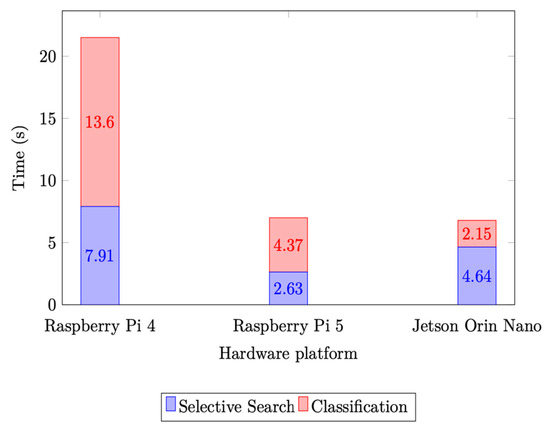
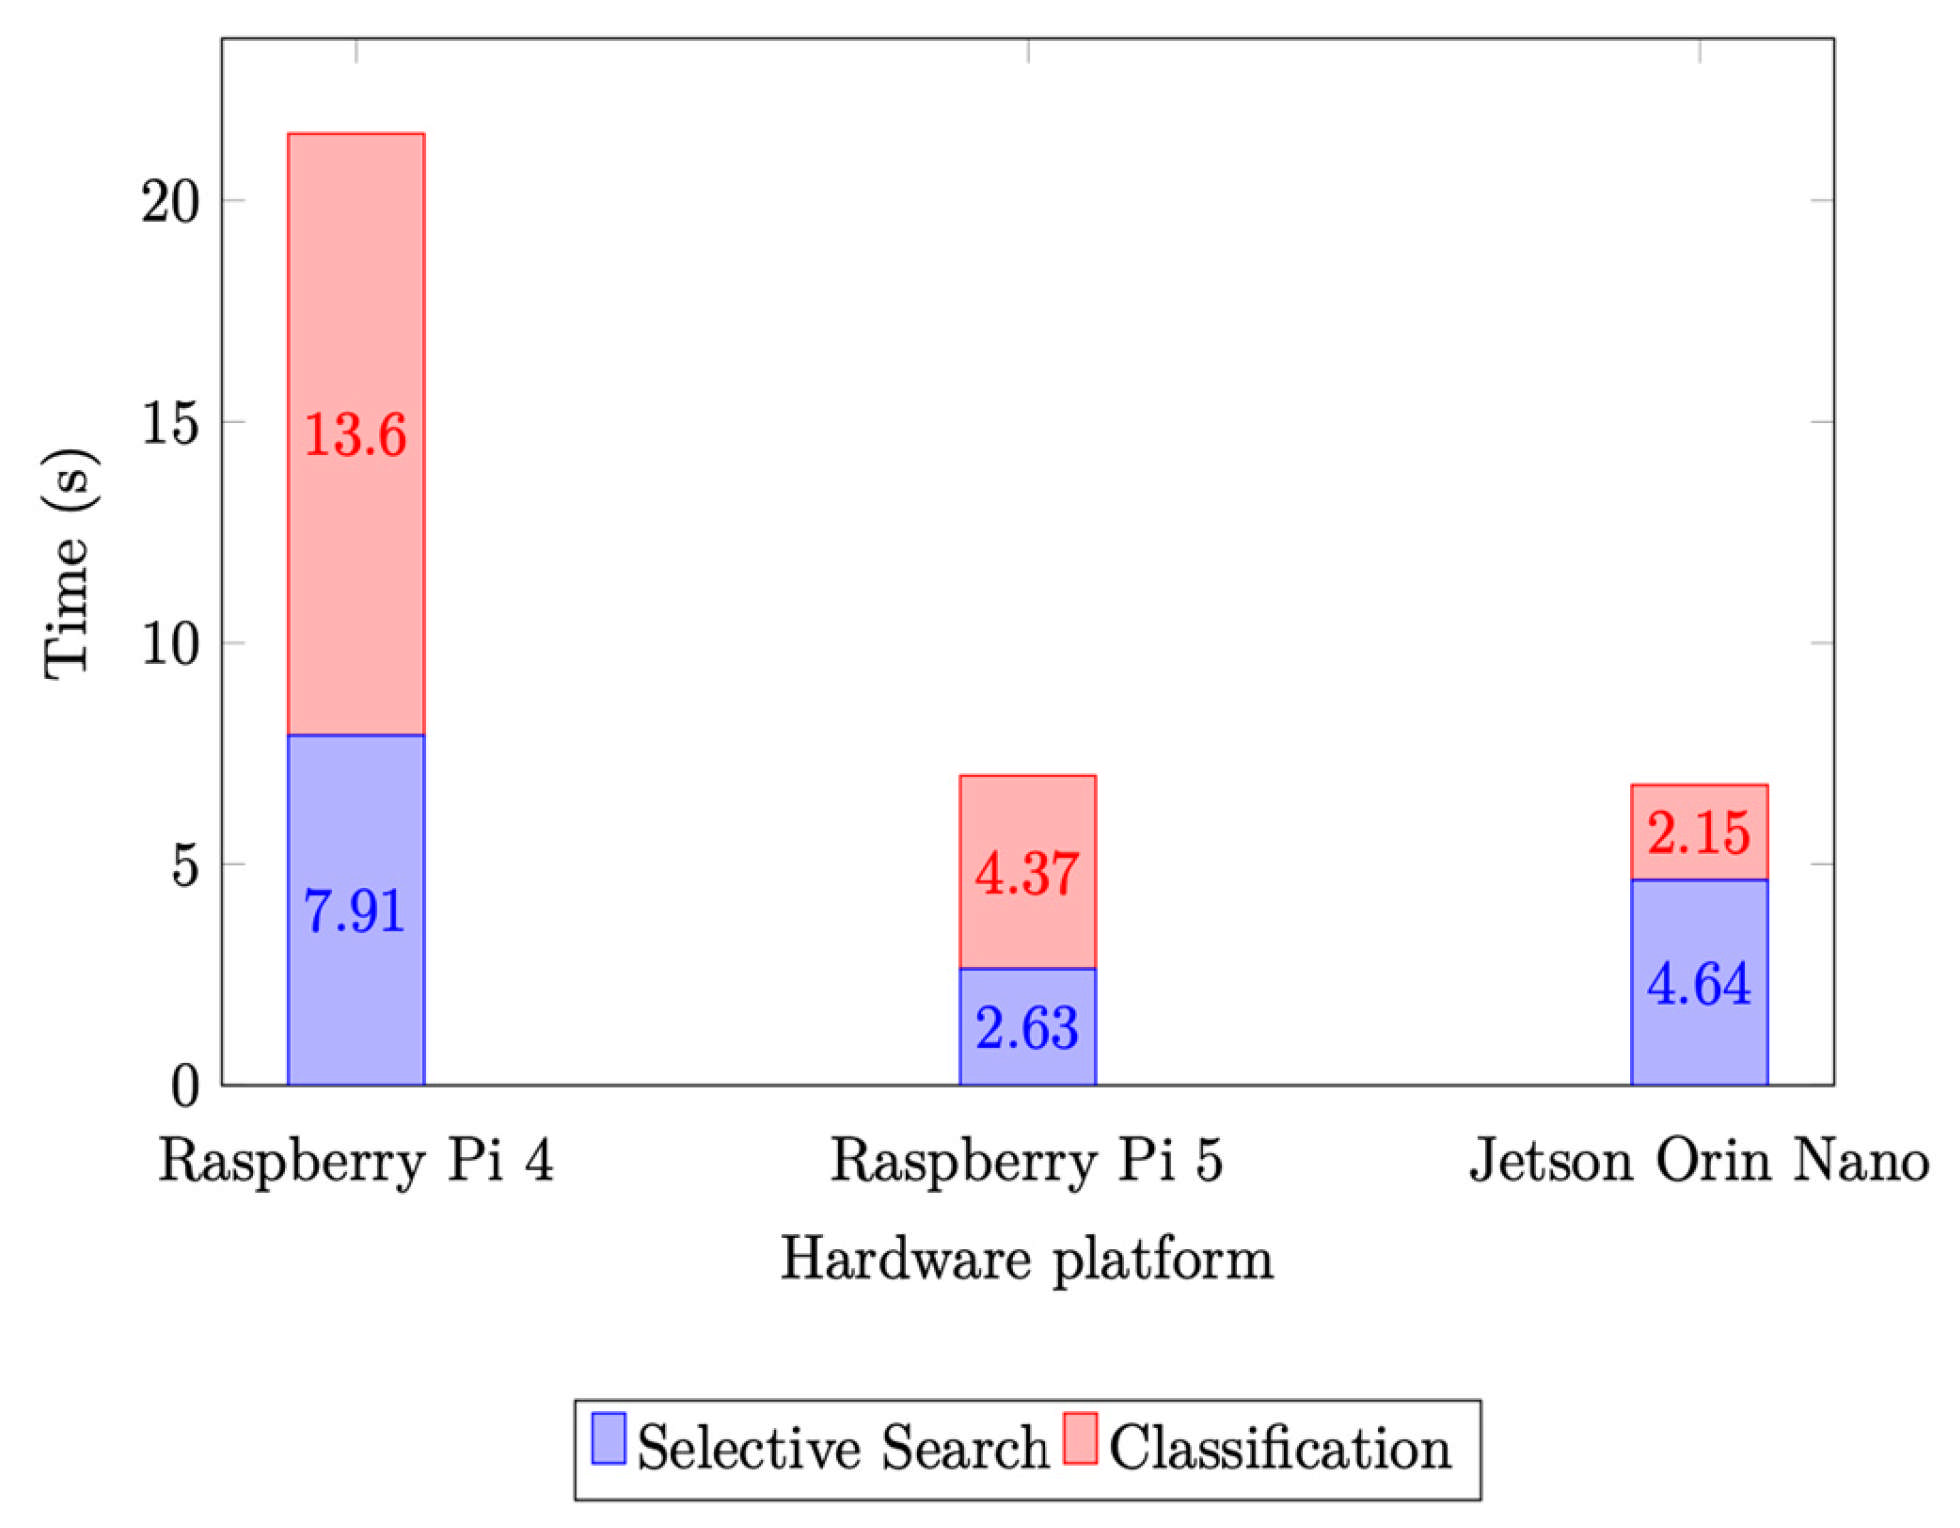
In contrast, CNN classification performance varied significantly based on hardware capabilities. The custom-built CNN averaged 5.17 s on the Raspberry Pi 4 (37% of total time) compared to 1.27 s on the Jetson Orin Nano (19%), proving the value of GPU acceleration for inference. This hardware dependency is further evident in the MobileNetV2 classification times shown in Figure 11. The Jetson Orin Nano completed the task in 2.15 s, an 84% reduction compared to the Raspberry Pi 4’s 13.60 s.
Figure 11.
Selective Search vs. Classification time (MobileNetV2).
The results demonstrate that our proposed custom model achieves nearly 90% precision while being half the size of the next smallest model (MobileNetV2, 94% precision). This trade-off is crucial for the proposed workflow, where plant identification occurs opportunistically on edge gateways (specifically tested on a Raspberry Pi 5) during data offloading. Performance benchmarking confirms that our model achieves a 1.47× speedup (47% faster on average). This efficiency is sufficient to support the system’s primary applications—nutritional monitoring and field mapping—within the computational constraints of the hardware.
4. Discussion
This study represents the first step in developing a fully automated pasture monitoring system. While our ultimate goal is a comprehensive wearable solution, this work restricts its scope to evaluating the feasibility of using CNNs to identify plant functional groups in static, complex environments. The current iteration has not yet been deployed on the physical collar system for live video analysis or combined with animal behavior tracking. Therefore, our discussion on real-time capabilities and edge processing power relies on experimental performance metrics, providing a theoretical basis for future in situ integration.
The detailed evaluation of the wearable floristic sensor system provides additional information on the complex combination of architectural choices, computational limitations, and practical deployment needs for automated plant identification.
4.1. Mapping from Static Image Classification Performance to Dynamic Monitoring Needs
In this study, the architecture effectiveness and performance of six classification models (Scratch-built, MobileNetV2, EfficientNetB0, VGG16, InceptionV3, and ResNet50) were tested.
ResNet50’s superior performance (MCC = 0.992) indicates that its residual architecture was particularly effective at preserving the fine-grained leaf margin and vein details necessary to distinguish between morphologically similar legumes and grasses, a capability that shallower networks struggled to match. The unexpected underperformance of EfficientNetB0 (MCC = 0.770) questions the reputation of the algorithm for efficiency in computer vision tasks. Results highlighted the limitations of general-purpose architectural innovations when applied to specialized biological classification tasks. Many factors most likely contributed to this result: the compound scaling methodology may be inadequate for botanical classification jobs where fine-grained characteristics are more significant than overall image complexity. Furthermore, the dataset size may be insufficient to effectively utilize EfficientNetB0’s architecture, as compound scaling techniques typically benefit from larger datasets. EfficientNetB0’s compound scaling strategy and architecture were specifically designed for large-scale, diverse datasets like ImageNet, which provides sufficient data volume to justify its depth and width scaling [25]. The scaling settings were meticulously tuned for ImageNet’s characteristics (1.2 million images, 1000 categories), and performance may degrade significantly on smaller, specialized datasets without extensive fine-tuning [20]. The moderate size of the pasture plant dataset may be insufficient for EfficientNetB0 to fully leverage its compound scaling benefits, particularly when the model must learn domain-specific fine-grained features rather than leveraging its ImageNet-pretrained general features. Thereby, results show that architectural advances developed for general computer vision applications may not directly translate to domain-specific challenges, reinforcing the value of specialist model development for botanical identification applications. This underperformance aligns with literature suggesting that compound scaling strategies, while effective on massive datasets like ImageNet, may struggle to generalize to smaller, specialized domains without extensive fine-tuning. The results suggest that the model architecture could not fully leverage its scaling capabilities given the moderate size of the pasture dataset.
The lightweight Scratch-built model, with only 1.6 million parameters, achieved a competitive performance with an MCC of 0.893, demonstrating the importance of task-specific model optimization. The Optuna hyperparameter optimization algorithm effectively identified a configuration that balances model capacity with plant classification-specific requirements, avoiding both underfitting and overfitting while maintaining computational efficiency. This shows that when applied to specialized classification tasks, correctly built, domain-specific architectures can achieve performance levels comparable to much larger, general-purpose models. The success of the Optuna-optimized architecture demonstrated the importance of rigorous hyperparameter optimization for achieving peak performance in specialized fields.
The models were developed and validated using vegetation data from Santarém, representing the plant species typical of this particular pastoral system. Consequently, the demonstrated classification performance is validated specifically for this Mediterranean flora and may not generalize directly to pasture systems in different geographic regions or climatic zones with substantially different botanical compositions. Different regions exhibit distinct plant communities shaped by climate, soil, and biogeographic factors, and the trained models may exhibit reduced accuracy when encountering species not represented in the training data. Addressing the geographic and floristic scope limitations requires expanding the botanical dataset to include diverse geographic regions, climatic zones, seasonal variations, and plant species variety. Future data collection should encompass pasture systems from multiple regions and capture variations across growth stages. Data gathering across geographic regions, using standardized protocols, could efficiently generate comprehensive datasets supporting globally applicable botanical identification systems. Transfer learning and domain adaptation techniques may also enable efficient model deployment in new regions with reduced data collection requirements.
Environmental sensitivity is also a major obstacle for reliable field deployment in a variety of agricultural conditions. The system’s effectiveness varies significantly depending on the lighting conditions, with decreased accuracy in direct sunshine due to shadow effects and reduced performance in cloudy settings due to color desaturation. These limitations need either adaptive processing algorithms or user training to optimize image-capturing circumstances for consistent operation. Plant density and distribution variations limit the system’s performance in dense vegetation environments, where overlapping regions provide challenges for both ROI generation and classification. This limitation may impair the system’s application to specific pasture types, needing adjusted data-gathering techniques that focus on isolated plant specimens rather than typical vegetation samples.
Class imbalance issues, despite careful attention during dataset creation, continue to impact model performance for under-represented plant categories. The inherent difficulty of acquiring balanced representation across all plant species of interest in natural grazing contexts presents constant challenges to maintaining consistent classification performance across all botanical categories.
For resource-constrained situations like mobile applications or edge devices, the Scratch-built model provides the best balance of performance and efficiency. With only 6.24 MB and an MCC of 0.893, it provides adequate classification accuracy while requiring few computational resources for real-time field applications. ResNet50 is the best option for applications when accuracy is crucial and computing resources are available, even if it is larger (99.99 MB). It is appropriate for research applications, precision agriculture systems, or situations with high misclassification costs given its nearly perfect MCC of 0.992. MobileNetV2 is an excellent middle-ground solution for applications that need both reasonable precision (MCC = 0.943) and reasonable resource use (15.63 MB).
4.2. System-Level Bottleneck Analysis and Feasibility Reassessment
Despite the significant achievements of this research, some important constraints limit the existing system’s potential and highlight possibilities for future development. Recognizing these limitations gives critical context for understanding the current state of technology and determining priorities for future research and development.
The processing time analysis indicates fundamental computational limitations, which have significant effects on the practical deployment of wearable botanical identification systems. The processing time analysis across different hardware platforms provides useful information for deployment decisions, with the Raspberry Pi 5 emerging as the best platform for most field research applications. On this platform, the system achieves very fast performance, processing images in 4.57 s using the lightweight CNN architecture (translating to approximately 13 images per minute), allowing for natural field research operations while maintaining acceptable classification accuracy. Although this monitoring frequency works well for assessing the pasture composition periodically during grazing sessions, when animals usually stay in confined spaces for a few minutes, it is insufficient for applications that need real-time feedback or continuous video-stream analysis. This computational limitation represents an accepted and deliberate trade-off inherent to the research design. The selection of the original R-CNN architecture with Selective Search enabled the research to concentrate entirely on the primary objective: developing and evaluating domain-specific CNN architectures for botanical classification.
Selective Search dominates the overall computational resources, indicating a severe bottleneck that affects real-time performance regardless of the CNN architecture chosen. The dominance of Selective Search in the computational budget is a crucial limitation affecting real-time performance, regardless of developments in neural network efficiency or hardware acceleration. This bottleneck restricts the system to practically real-time operation at best, cutting out applications that demand instant response or continuous video-based analysis. By avoiding the complexity of training RPNs or implementing end-to-end detection frameworks, resources were directed toward the core research question of whether domain-specific CNN architectures could achieve competitive performance relative to large-scale pre-trained models. However, this bottleneck feature suggests that future optimization efforts should prioritize ROI generation alternatives over neural network acceleration, as improvements in classification speed will yield diminishing returns while Selective Search remains the primary performance constraint. Thus, replacing Selective Search with learned detection mechanisms represents the primary optimization target for achieving true real-time performance suitable for continuous monitoring applications.
4.3. Comprehensive Challenges and Roadmap Toward Practical System Realization
The dominance of Selective Search in the computational budget is the definitive bottleneck affecting real-time performance. Our results indicate that using Selective Search renders the current iteration incapable of achieving real-time processing on edge devices for continuous video streams. This is an accepted cost of our benchmarking methodology, which prioritized classifier isolation over speed. Consequently, future iterations must replace the Selective Search algorithm with single-shot detection frameworks (e.g., YOLO or SSD) to bridge the gap between the current static-image processing speed (~4.5 s) and the requirements of real-time video monitoring.
Power management, environmental robustness, and user experience are just a few of the major issues that come with combining different components into a working wearable device, as the end-to-end system evaluation shows. The identification of Selective Search as the primary computational bottleneck demonstrates that system-level optimization needs comprehensive approaches that consider the complete processing pipeline rather than concentrating solely on individual component improvements.
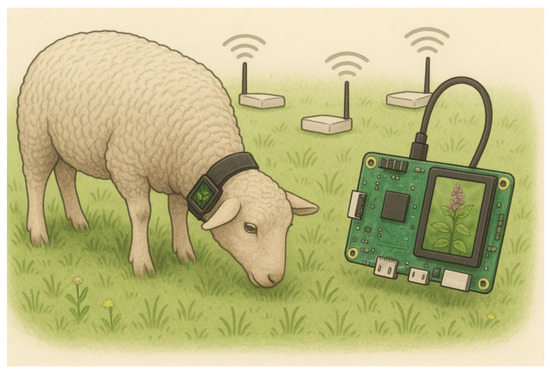
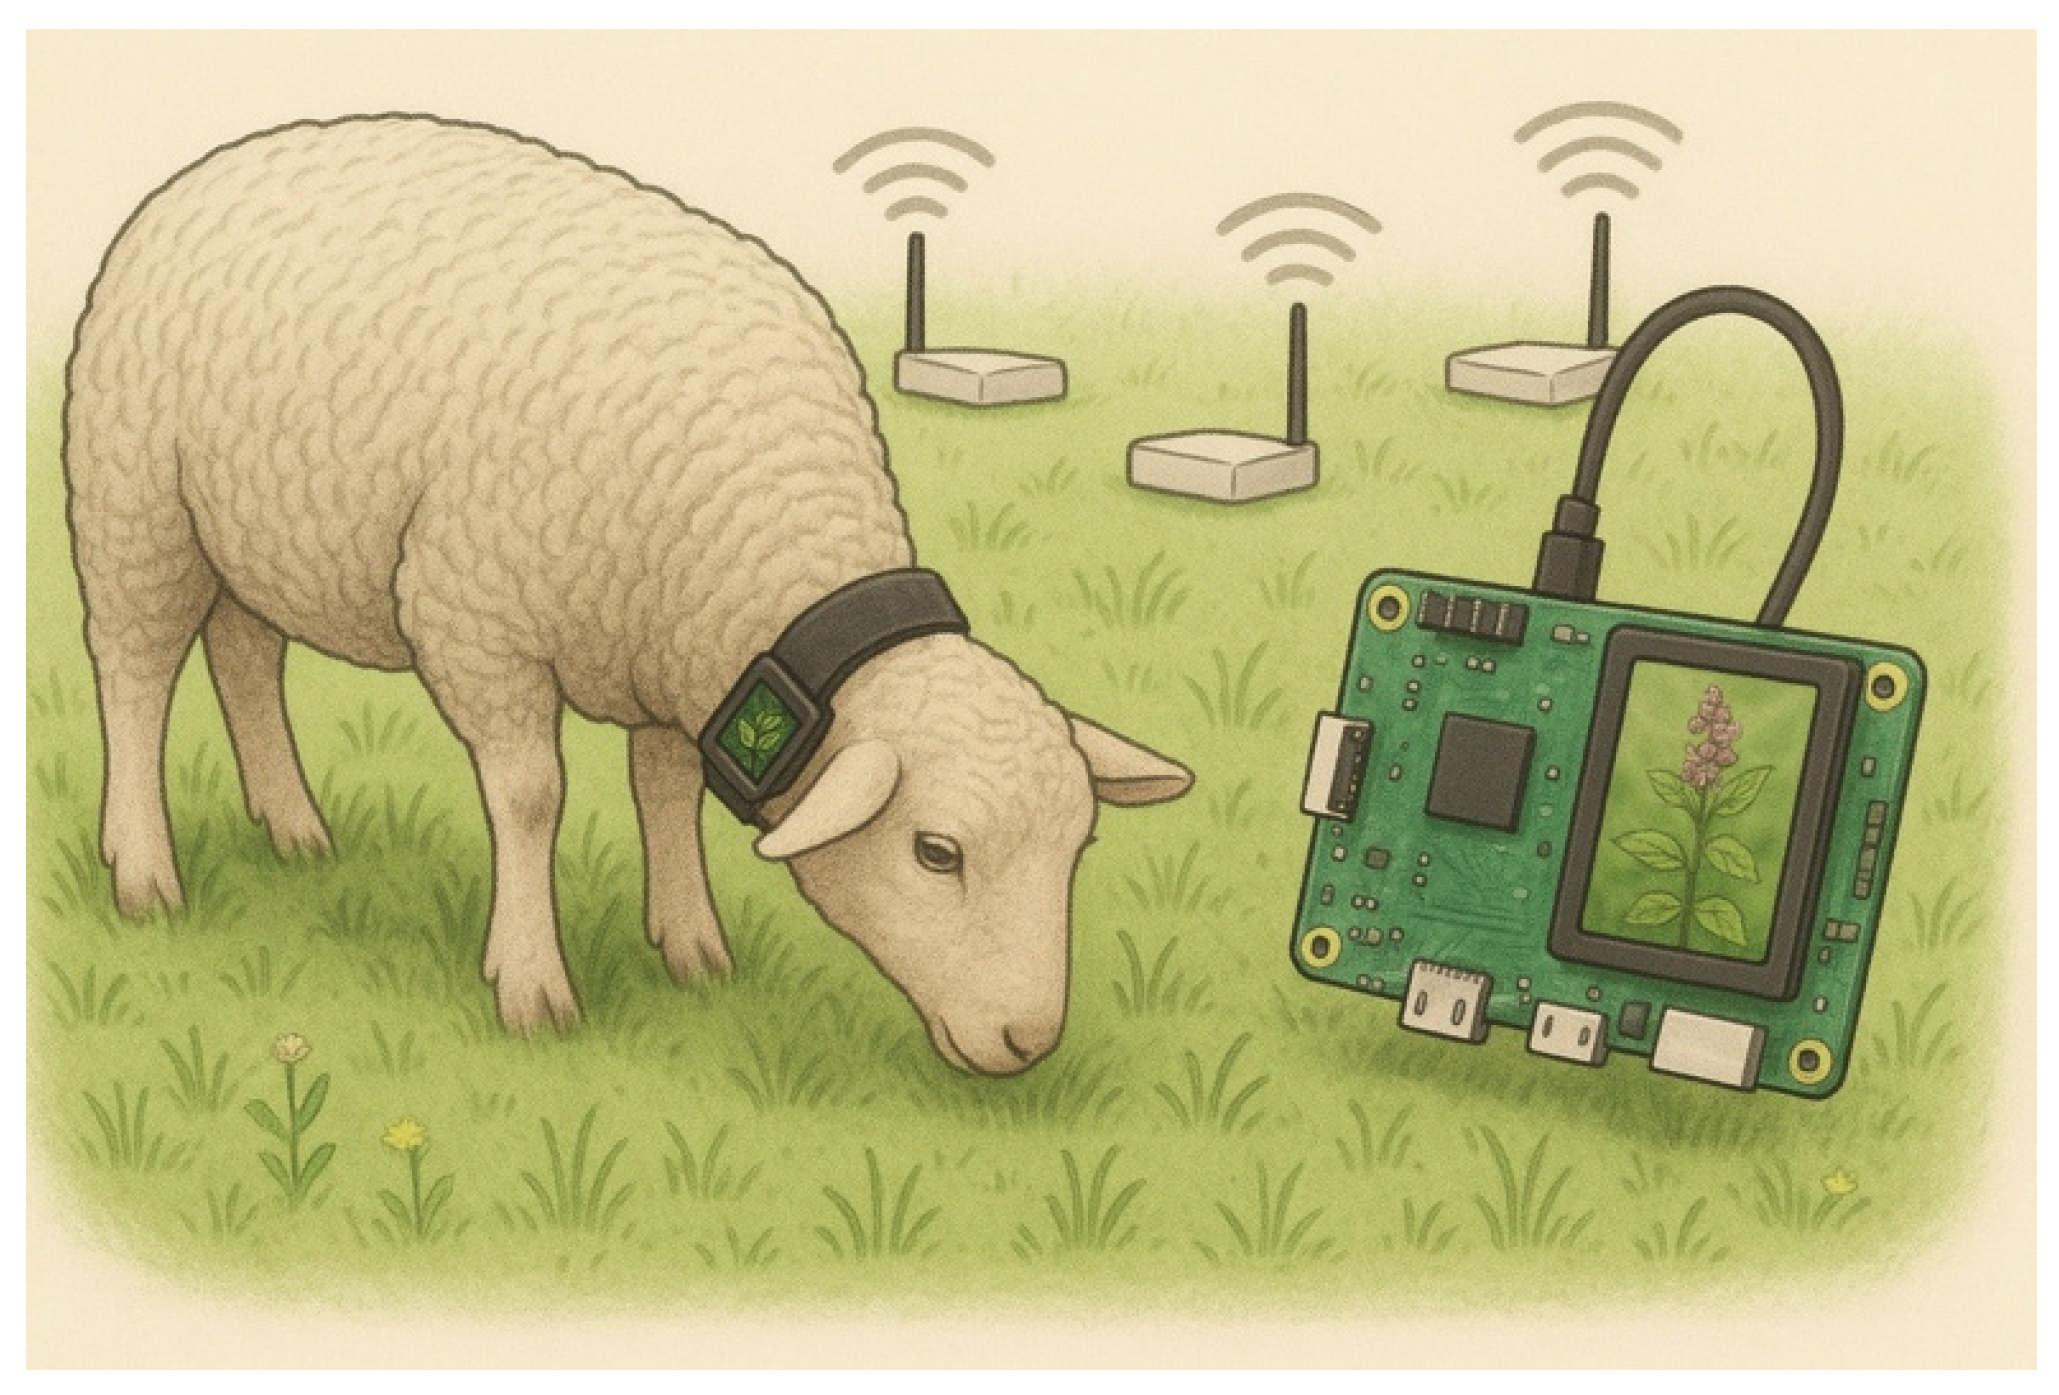
The considerable variations in CNN classification performance across hardware platforms highlight the crucial role of architecture-hardware matching in embedded vision applications. The Jetson Orin Nano’s 84% reduction in MobileNetV2 classification time compared to the Raspberry Pi 4 highlights the significant benefits of GPU acceleration, especially for bigger neural network topologies. However, these advantages must be balanced against increased power consumption, thermal management requirements, and system costs, which may limit acceptable deployment options. The end-to-end processing time of 4.57 s on the Raspberry Pi 5 using the lightweight model translates to a practical monitoring frequency of approximately 13 images per minute. For a grazing animal (Figure 12), this rate is sufficient to build a comprehensive map of pasture composition over a feeding session, as animals often graze in a single area for several minutes before moving. This result demonstrates the system’s feasibility for near-real-time analysis in field conditions.
Figure 12.
Grazing sheep.
It is also important to note that this study benchmarked the core plant recognition module using static images. The impact of dynamic factors inherent to live animal monitoring—such as motion blur, rapid illumination changes, and temporal coherence in continuous video streams—was not evaluated. Future work will focus on end-to-end latency testing on video data to validate the system under dynamic field conditions.
5. Conclusions
This study successfully conducted high-performance automated floristic analysis using a wearable sensor system with deep learning implemented in an edge device. The autonomous pasture monitoring system showed that computer vision, specifically ResNet50, can match human expert accuracy in plant classification. Additionally, a lightweight custom-built CNN achieved competitive results, proving that task-specific models can outperform larger, general-purpose ones in specialized biological classification.
The end-to-end system evaluation revealed key deployment challenges; the identification of Selective Search as the primary computational bottleneck implies that hardware acceleration alone cannot solve the latency issue. This finding dictates that future development must prioritize algorithmic changes—specifically transitioning to single-shot detection frameworks—rather than solely relying on more powerful edge hardware to achieve real-time monitoring. Meanwhile, hardware analysis showed that the Raspberry Pi 5 provides the best field-ready balance, processing images in 4.57 s with the lightweight model. Thus, a system based on this type of classifier should store the images in the wearable device’s memory, along with location information and a timestamp indicating when the image was captured, and identify the plants at a later time, after the images have been transferred to the device at the edge.
Nevertheless, the study revealed several limitations that warrant future investigation. The reliance on Selective Search remains the primary barrier to real-time performance, indicating the need to adopt single-shot detectors such as YOLO or SSD to enable real-time inference on Jetson platforms. Furthermore, classification performance was validated only on Mediterranean flora from the Santarém region, highlighting the need to expand the dataset across diverse geographic and climatic contexts to improve generalizability. Ongoing challenges related to environmental variability and class imbalance emphasize the importance of adaptive processing, model optimization, and standardized datasets. Such advances could support the deployment of more capable neural networks on resource-constrained embedded systems. Moreover, the current work focused on the classification component of the system pipeline and utilized static, top-down simulated datasets for evaluation. It was developed as a standalone module and must be integrated in the future within the monitoring platform to create an autonomous plant identification system.
Author Contributions
Conceptualization, P.G. and M.R.M.; methodology, R.C., P.G., M.R.M. and M.A.; software, R.C.; validation, R.C. and M.A.; formal analysis, R.C., P.G., M.R.M. and M.A.; investigation, R.C., P.G., M.R.M. and M.A.; resources, R.C., P.G. and M.R.M.; data curation, P.G.; writing—original draft preparation, R.C., P.G. and M.A.; writing—review and editing, R.C., P.G., M.R.M. and M.A.; visualization, P.G.; supervision, P.G. and M.A.; project administration, P.G.; funding acquisition, P.G. All authors have read and agreed to the published version of the manuscript.
Funding
This work is funded by national funds through FCT—Fundação para a Ciência e a Tecnologia, I.P., and, when eligible, co-funded by EU funds under project/support UID/50008/2025—Instituto de Telecomunicações, with DOI identifier—https://doi.org/10.54499/UID/50008/2025.
Institutional Review Board Statement
Not applicable.
Informed Consent Statement
Not applicable.
Data Availability Statement
The original data presented in the study are openly available in the “Plant species identification” dataset: https://zenodo.org/records/17741075 (accessed on 9 December 2025).
Acknowledgments
During the preparation of this manuscript, the authors used chatgpt.com (GPT-5) for the purposes of generating the image included in Figure 12. The authors have reviewed and edited the output and take full responsibility for the content of this publication.
Conflicts of Interest
The authors declare no conflicts of interest.
References
- Carreira, E.; Serrano, J.; Lopes de Castro, J.; Shahidian, S.; Pereira, A.F. Montado Mediterranean Ecosystem (Soil–Pasture–Tree and Animals): A Review of Monitoring Technologies and Grazing Systems. Appl. Sci. 2023, 13, 6242. [Google Scholar] [CrossRef] [Scilit]
- Pullanagari, R.R.; Kereszturi, G.; Yule, I.J. Mapping of Macro and Micro Nutrients of Mixed Pastures Using Airborne AisaFENIX Hyperspectral Imagery. ISPRS J. Photogramm. Remote Sens. 2016, 117, 1–10. [Google Scholar] [CrossRef] [Scilit]
- Sales-Baptista, E.; Ferraz-De-Oliveira, M.I.; Terra-Braga, M.; de Castro, J.A.L.; Serrano, J.; d’Abreu, M.C. Characterization of Grazing Behaviour Microstructure Using Point-of-View Cameras. PLoS ONE 2022, 17, e0265037. [Google Scholar] [CrossRef] [Scilit] [PubMed]
- Marques, M.; Belo, C. Estudo do Comportamento Alimentar de Ovelhas Serra da Estrela em Condições de Pastoreio Diferido//Rotacional. Influência da Suplementação Energética da Erva na Quantidade e Qualidade do Leite Produ-Zido. Pastagens Forrag. 2001, 22, 19–36. [Google Scholar]
- Oso, O.A.; Jayeola, A.A. Digital Morphometrics: Application of MorphoLeaf in Shape Visualization and Species Delimitation, Using Cucurbitaceae Leaves as a Model. Appl. Plant Sci. 2021, 9, e11448. [Google Scholar] [CrossRef] [Scilit] [PubMed]
- Uddin, A.H.; Arif, A.S.M. Plant Species Recognition from Leaf-Vein Structures Using ResNets. In Emerging Technologies in Data Mining and Information Security; Lecture Notes in Networks and Systems; Springer: Singapore, 2023; Volume 491, pp. 471–478. [Google Scholar] [CrossRef] [Scilit]
- Zhang, D.; Islam, M.M.; Lu, G. A Review on Automatic Image Annotation Techniques. Pattern Recognit. 2012, 45, 346–362. [Google Scholar] [CrossRef] [Scilit]
- van der Plas, T.L.; Geikie, S.T.; Alexander, D.G.; Simms, D.M. Multi-Stage Semantic Segmentation Quantifies Fragmentation of Small Habitats at a Landscape Scale. Remote Sens. 2023, 15, 5277. [Google Scholar] [CrossRef] [Scilit]
- Belfiore, O.; Parente, C. Comparison of Different Algorithms to Orthorectify WorldView-2 Satellite Imagery. Algorithms 2016, 9, 67. [Google Scholar] [CrossRef] [Scilit]
- See, B.D.; Hashim, S.J.; Shafri, H.Z.M.; Azrad, S.; Hassan, M.R. A New Rapid, Low-Cost and GPS-Centric Unmanned Aerial Vehicle Incorporating in-Situ Multispectral Oil Palm Trees Health Detection. J. Agric. Sci. Bot. 2018, 2, 12–16. [Google Scholar] [CrossRef] [Scilit]
- Keith, D.A.; Simpson, C.C. A Protocol for Assessment and Integration of Vegetation Maps, with an Application to Spatial Data Sets from South-eastern Australia. Austral Ecol. 2008, 33, 761–774. [Google Scholar] [CrossRef] [Scilit]
- Avondo, M.; Bognanno, M.; Beritelli, F.; Avanzato, R.; Biondi, L.; Gimmillaro, F.; Bognanno, S.; Piccitto, A.; Tumino, S. Sound and Video Detection as a Tool to Estimate Free Grazing Behavior in Sheep on Different Swards. Animals 2025, 15, 2671. [Google Scholar] [CrossRef] [Scilit] [PubMed]
- Sneddon, J.; Mason, A. Automated Monitoring of Foraging Behaviour in Free Ranging Sheep Grazing a Bio-Diverse Pasture Using Audio and Video Information. Int. J. Smart Sens. Intell. Syst. 2014, 7, 1–4. [Google Scholar] [CrossRef] [Scilit]
- Camara, F.; Romano, R.; Markkula, G.; Madigan, R.; Merat, N.; Fox, C. Sheep Nocturnal Grazing Behavior Using Infrared Point-of-View Camera—A Preliminary Study. In Proceedings of the Measuring Behavior, Manchester, UK, 5–8 June 2018; pp. 238–244. [Google Scholar]
- Soares, G.; Pedreiras, P.; Xavier, W.; Gonçalves, P. Smart Collars for Sheep: Leveraging Machine Learning for Improved Pasture Management. In Proceedings of the CSRF 2024 the First International Conference on Sustainable and Regenerative Farming; Valencia, Spain, 17 September 2024, Parra, L., Ed.; ThinkMind: Coimbatore, India, 2024. [Google Scholar]
- Gonçalves, P.; Xavier, W.; Corrente, G. iRunMon: A Real-Time Ruminant Monitor. In Proceedings of the 11th International Conference on Information and Communication Technologies in Agriculture, Food & Environment (HAICTA 2024), Karlovasi, Greece, 17–20 October 2024; CEUR Workshop Proceedings. Volume 3930, pp. 1–6. Available online: https://ceur-ws.org/Vol-3930/paper5.pdf (accessed on 18 November 2025).
- Gonçalves, P.; Marques, M.R.; Antunes, M. Plant Species Identification; Zenodo: Geneva, Switzerland, 2025. [Google Scholar] [CrossRef]
- Optuna—A Hyperparameter Optimization Framework. Available online: https://optuna.org/ (accessed on 5 October 2025).
- GitHub—Akarazniewicz/Cocosplit: Simple Tool to Split COCO Annotations into Train/Test Datasets. Available online: https://github.com/akarazniewicz/cocosplit (accessed on 18 November 2025).
- AlpacaTechJP—GitHub. Available online: https://github.com/AlpacaTechJP (accessed on 18 November 2025).
- Raspberry Pi 4 Model B Specifications—Raspberry Pi. Available online: https://www.raspberrypi.com/products/raspberry-pi-4-model-b/specifications/ (accessed on 18 November 2025).
- Buy a Raspberry Pi 5—Raspberry Pi. Available online: https://www.raspberrypi.com/products/raspberry-pi-5/ (accessed on 18 November 2025).
- NVIDIA. Jetson Nano Traz o Poder da AI Moderna Para Dispositivos No Edge. Available online: https://www.nvidia.com/pt-br/autonomous-machines/embedded-systems/jetson-nano/product-development/ (accessed on 18 November 2025).
- Hoang, V.T.; Jo, K.H. Practical Analysis on Architecture of EfficientNet. In Proceedings of the International Conference on Human System Interaction, HSI 2021, Gdańsk, Poland, 8–10 July 2021. [Google Scholar] [CrossRef] [Scilit]
- GitHub—AlpacaTechJP/Selectivesearch: Selective Search Implementation for Python. Available online: https://github.com/AlpacaTechJP/selectivesearch (accessed on 18 November 2025).

Disclaimer/Publisher’s Note: The statements, opinions and data contained in all publications are solely those of the individual author(s) and contributor(s) and not of MDPI and/or the editor(s). MDPI and/or the editor(s) disclaim responsibility for any injury to people or property resulting from any ideas, methods, instructions or products referred to in the content. |
© 2026 by the authors. Licensee MDPI, Basel, Switzerland. This article is an open access article distributed under the terms and conditions of the Creative Commons Attribution (CC BY) license.