Abstract
Climate change has led to rising temperatures and increasingly extreme weather conditions, largely driven by human activity, including agriculture. The food and agriculture sector is responsible for approximately 21–37% of global greenhouse gas (GHG) emissions. In response to climate change, various innovative agricultural systems have emerged in recent decades. Among them, soilless systems represent revolutionary methods for producing large quantities of vegetables while using fewer inputs, including water, fertilizers, and pesticides. This study assesses the carbon footprint of two greenhouse-based lettuce (cv. Romana) growing systems using a cradle-to-gate life cycle assessment (LCA) approach. The first system employs an aeroponic growing method, whereas the second relies on a soil-based growing method within the greenhouse. To contextualize their environmental performance, the carbon footprints of these greenhouse cultivation systems are compared with those of the outdoor pot system. Results indicate that the highest Global Warming Potential (GWP) is associated with soil-based cultivation in the greenhouse, reaching 7.98 kg CO2eq per kilogram of fresh weight (FW) lettuce, followed by the outdoor pot system (1.72 kg CO2eq/kg), while the aeroponic system demonstrates the lowest GWP, achieving 0.98 kg CO2eq/kg. The greenhouse structure contributed 9357.93 kg CO2eq to the total GWP, representing 23% of the total impact in the aeroponic system and 22.7% in the soil-based greenhouse system. These findings suggest that soilless cultivation systems can provide a more sustainable and higher-yield alternative to soil-based methods, potentially reducing the environmental impact of vegetable production in the Mediterranean region.
1. Introduction
Within the broader context of climate change, the agricultural sector alone accounts for approximately 23% of global greenhouse gas (GHG) emissions [1,2], highlighting the urgent need to adopt more sustainable production practices. At the same time, agriculture is facing increasing pressure due to rising food demand, limited natural resources, and the necessity to further reduce emissions in line with global sustainability and climate policies [3]. In response to these challenges, the agricultural sector is progressively shifting toward more intensive and technologically advanced production systems aimed at improving productivity, resource-use efficiency, and overall sustainability.
In this context, soilless cultivation systems, such as hydroponics and aeroponics, are increasingly implemented in protected and controlled environments, including greenhouses and vertical farms [4,5]. These systems enable higher yields and improved crop quality while reducing land use and pesticide application compared to conventional open-field cultivation [5,6]. Moreover, controlled-environment agriculture enhances resilience to extreme weather events and enables year-round food production [7]. However, the environmental sustainability of these systems cannot be assumed a priori and must be assessed using comprehensive and standardized analytical methodologies.
Life cycle assessment (LCA) is a well-established tool for quantifying the environmental impacts of products and production systems throughout their entire life cycle [8]. A substantial number of LCA studies have examined lettuce production in open-field systems, greenhouses, and highly controlled environments [9,10,11]. Overall, these studies consistently indicate that soilless and controlled systems achieve higher yields but are associated with higher environmental impacts, particularly in terms of Global Warming Potential (GWP) [11,12]. The adoption of soilless systems is often linked to increased energy and material requirements, which can significantly influence their overall environmental performance [12,13]. Energy consumption related to climate control, artificial lighting, and automation systems is frequently identified as the main environmental hotspot, whereas open-field systems generally exhibit lower impacts per unit of product [9,10].
Comparisons among greenhouse-based systems further reveal that environmental performance is strongly influenced by local conditions, technological configurations, and management practices, leading to heterogeneous results across studies [10,11]. The available literature also shows a strong focus on systems located in Northern European contexts, while Mediterranean greenhouse systems—characterized by specific climatic conditions, distinct structural solutions, and unique energy profiles—remain relatively underexplored [10,12,13].
Despite the extensive literature on soilless cultivation systems, several relevant gaps persist. Many LCA studies primarily focus on operational inputs, while the environmental contribution of greenhouse structures and construction materials is often excluded, simplified through generic assumptions [9,13,14], or addressed separately in different contexts [15]. This approach may lead to an underestimation of overall environmental impacts [14]. Furthermore, aeroponic systems are still underrepresented in comparative LCA studies and are rarely assessed alongside soil-based greenhouse and open-field systems within a coherent methodological framework [13], particularly in Mediterranean regions [10]. Differences in system boundaries and modeling approaches further limit the comparability of results across studies. Understanding these trade-offs is essential to support sustainable agricultural intensification and facilitate the transition toward low-impact food production systems. As highlighted in methodological studies on LCA applied to indoor and protected food production systems, environmental assessments often focus primarily on agricultural cultivation phases, while the contribution of greenhouse structures is treated in a simplified or marginal way using methodologies not specifically developed for the building sector. This can result in an incomplete representation of overall environmental impacts, particularly in protected cultivation systems, where greenhouse materials, service life, and structural solutions may significantly influence the environmental balance [14]. In response to these gaps, the present study compares different lettuce cultivation systems under Mediterranean conditions, including a soilless aeroponic system in a greenhouse and soil-based systems in greenhouse and outdoor conditions, by adopting an integrated LCA approach. The cultivation phase is assessed in accordance with the ISO 14040 methodology, while the greenhouse structure is evaluated using a standard specifically developed for the building sector (EN 15804 A2), which is more suitable for the life cycle assessment of construction materials and structural components [16]. By integrating these two methodological frameworks, this study provides more comprehensive LCA modeling of protected cultivation systems, reducing the marginalization of greenhouse structural impacts. The proposed approach aims to advance scientific knowledge on LCA applications in controlled-environment agriculture and to support both researchers and practitioners in adopting more robust and representative methodologies for assessing the environmental performance of protected agricultural systems.
2. Materials and Methods
The lettuce cultivation was planned in three growing scenarios during the spring of 2024, from 10 to 31 May 2024. The data on inputs and average fresh weight per plant were derived from a previously conducted experimental study by Impallomeni et al. [6], in which lettuce yield was measured and expressed as mean ± standard error (SE). Three different scenarios were considered:
- (1)
- Soil-based tub system (TS) in PVC tubs inside the GH, consisting of growing lettuce seedlings in polyvinyl chloride (PVC) tubs spaced 20 cm × 20 cm apart.
- (2)
- Outdoor pot cultivation system (PSO), which refers to growing lettuce seedlings in polyethylene (PE) pots.
- (3)
- Lettuce seedlings grown in an aeroponic system inside the greenhouse in cultivation trays (A) (Supplementary Materials Figure S1).
The novelty of this study lies in the inclusion of the greenhouse structure in the LCA, which was identical for both the TS and A systems. Indeed, two separate life cycle assessments (LCAs) were conducted. The first focused on the cultivation systems A, TS, and PSO, performed using the CCaLC2 software (Version 1.1) in accordance with ISO 14040 [8]. This assessment addressed the cultivation phase of the crops and included all materials and inputs involved in plant growth. The functional unit was defined as 1 kg of fresh lettuce, adopting a “cradle-to-gate” system boundary (from raw materials to harvest). In parallel, an LCA of the greenhouse infrastructure, including all associated materials and equipment, was carried out using One Click LCA [17], which applies the EN 15804 A2 methodology [18,19] and uses 1 m2 of constructed surface as the functional unit. This assessment was also limited to cradle-to-gate phases (A1–A5, from raw materials to on-site installation). Both LCAs share consistent system boundaries, the same impact category (Global Warming Potential), and the same temporal assumptions. To make the functional units comparable, the total environmental impact of the greenhouse was scaled to the cultivated lettuce based on cumulative production over the expected service life of the structure (20 years), thereby expressing the infrastructure impact in terms of kilograms of product. The datasets for both are based on Ecoinvent databases [20,21].
The LCA of the greenhouse was conducted using EN 15804, the European standard for Environmental Product Declarations in the construction sector, which defines the rules for life cycle inventory and impact assessment. This methodology is based on the principles and terminology of life cycle assessment as defined by ISO 14040 [8] and ISO 14044 [22], adapted to the construction context, and ensuring methodological consistency with the LCA approach applied to agricultural production via CCaLC2.
The environmental performance evaluation was conducted in accordance with the proposed methodology (Figure 1).
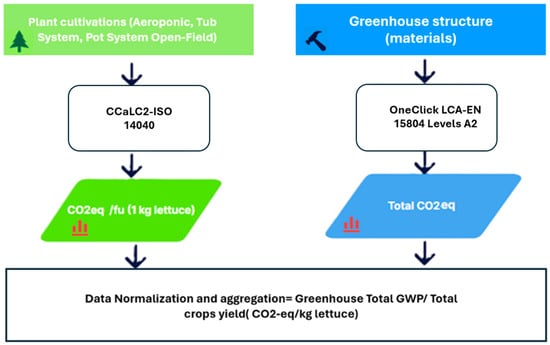
Figure 1.
Life cycle assessment aggregation methodology for greenhouse and plant cultivation.
2.1. Goal and Scope
The purpose of this research is to compare the environmental impact of a soilless greenhouse cultivation system with an outdoor pot system. The LCA of the greenhouse structure is presented in Section 3, whereas the LCA of the cultivation systems is discussed in this section.
2.2. Functional Unit
The functional unit (FU) used in this LCA for the cultivation systems is 1 kg of fresh weight (1 kg/FW) lettuce produced. The greenhouse gas emissions are represented as kilograms of carbon dioxide equivalent (CO2eq) per functional unit (kg CO2eq/f.u).
2.3. System Boundaries of Cultivation Methods and Data Quality
The system boundaries chosen to perform the cultivation LCA are cradle-to-gate. The LCA encompasses the following stages:
- -
- Raw materials stage: production of materials and equipment, seedling production.
- -
- Cultivation stage: resource inputs (water, fertilizers, seedlings, and soil for TS and PSO systems) and operational emissions.
- -
- Harvesting stage: harvesting activity and wastes/losses.
More specifically, the system boundaries for PSO, A, and TS include the production of fertilizers, packaging materials, and cultivation materials, including those required for seedlings prior to the experiments, as well as transport. Transport was considered as a lorry for delivering the greenhouse components to the assembly site and a van for transporting the plants from the sales store to the greenhouse site.
The inputs to all three cultivation systems (PSO, TS, and A) comprise water supply, seedlings, fertilizers, and packaging materials; however, soil is incorporated solely in the PSO and TS systems, as the aeroponic (A) system operates without soil.
During the cultivation phase, for all growing methods, root waste was disposed of in landfill as biodegradable waste. At the raw materials stage, the packaging associated with soil bags, fertilizer bags, transplant trays, and seedling pots was allocated to recycling, specifically polyethylene. The system outputs include root waste, packaging, and recycled materials.
The aeroponic (A) and tub system (TS) greenhouse growth systems differ mainly in energy and equipment inputs. Other differences per kg of fresh weight (FW) arise from variations in crop yield and system configurations. The excluded processes for A and TS are substantially the same as those for PSO, with the addition of equipment maintenance, nutrient solution discharge, and rainfall irrigation. The system boundaries for the three scenarios are represented in Figure 2.
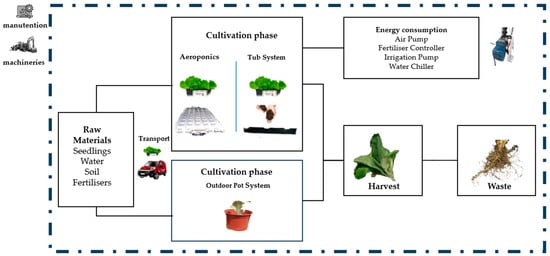
Figure 2.
System boundaries for the LCA of the three lettuce cultivation systems: aeroponics, tub system, and outdoor pot system. The cultivation phase differs among systems, with energy consumption accounted for in the aeroponic and tub systems only. The output stages include harvest and waste management.
Data related to resource use, such as fertilizer dosage, water consumption, crop yield, soil use for the PSO and TS systems, packaging and waste, and energy consumption, were registered over a 21 day experimental period.
Processes excluded from the boundaries include fertilizer losses during application and water losses via runoff irrigation. Fertilizer and water losses (runoff, leaching) were excluded. Both TS and A systems followed identical agronomic management, with the A system operating as a closed-loop recirculating system in which such losses are minimal. Machinery maintenance and equipment are also excluded from the system boundaries. Water use is reported as an inventory flow (m3/kg) and is not included in the GWP calculation in CCaLC2. The diagrams are reported in Supplementary Materials (Figures S2–S4).
2.4. Life Cycle Inventory Assessment for Plant Cultivation
The life cycle inventory (LCI) for the three cultivation systems (PSO, TS, and A) was developed using the measured yields from the 21-day experimental trial and projected over a 20-year operational period. The same procedure was applied to estimate water and fertilizer use. Packaging materials, including transplant trays, pots, fertilizer bags, and soil (for PSO and TS), were quantified using commercially available product data. Material inputs, seedlings, fertilizers, and soil were quantified as primary data and uploaded into the CCaLC2 program, while secondary data on the origin and manufacture of materials were acquired from the EcoInvent database.
The life cycle inventory for A and TS additionally incorporates the structural components of the greenhouse. The yield for greenhouse-based systems was calculated in the same way as for PSO but considering the greenhouse’s maximum capacity (Section 2.4).
Furthermore, an LCA of the greenhouse construction was performed separately to assess its contribution to the environmental impact of greenhouse-based systems. Table 1 shows the life cycle inventory for the PSO, A, and TS systems. The analysis was based on the LCA data inventory for the different cultivation systems (Table 1).

Table 1.
Summary of the inventory data for 1 kg of lettuce produced for different growing systems.
2.4.1. Experimental Extrapolation Data
The extrapolation of experimental data from the 21-day cultivation period to the 20-year reference timeframe was performed using a linear scaling approach based on the number of plants per cultivation cycle and the number of annual cycles. Total lettuce yield over the reference period () was calculated as follows:
where represents the number of plants per cultivation cycle, the average fresh weight per plant measured during the experimental phase, the number of cultivation cycles per year, and the reference time horizon (20 years). Specifically, average fresh weight yield per plant was 52.70 ± 5.89 g for the A system, 40.28 ± 1.78 g for TS, and 25.24 ± 1.29 g for PSO.
For the aeroponic system, yield was defined based on the maximum greenhouse capacity, determined by the tray configuration and surface area.
For the tub system, the number of plants per cycle was determined based on the available cultivation area of the tubs inside the greenhouse, assuming the same number of annual cycles. Both systems, A and TS, assume 12 cultivation cycles per year, with inputs calculated for each 21-day cycle and extrapolated over 12 months.
For the outdoor pot system (PSO), the same number of plants per cycle was determined as for TS, while the number of annual cycles was reduced to 8 to account for seasonal constraints at the study location (from November to February, outdoor conditions are not favorable for lettuce growth). Inputs are calculated per 21 day cycle and extrapolated to the 8 annual cycles. All inputs, including water, fertilizers, and operational energy, were quantified on a per-cycle basis during the experimental phase and subsequently extrapolated to the 20-year reference period using the same temporal scaling approach applied to yield, according to the following relation:
where represents the input measured or estimated per cultivation cycle. Energy consumption per cycle was calculated based on the operating time of the equipment, assuming constant operational conditions throughout the reference period. Full operation is defined as continuous cultivation at maximum system capacity, with each cycle lasting 21 days.
Water Use
For the A system, water use for raw materials is 0.00057 m3/kg FW (fresh weight), whereas manufacturing requires 0.00302 m3/kg FW. The average water use during the cultivation phase is 0.003 m3/kg FW. For TS, water use during production is 0.029 m3/kg FW.
The water consumption rate for PSO was 0.049 m3/kg FW. CCaLC2 does not directly convert water use to CO2eq; therefore, water consumption is reported as a physical flow (m3/kg FW, Table 1) rather than as a GWP contribution.
Energy Consumption
The greenhouse automation system ran for 16 h a day, with the equipment active for about 4 min every hour. Based on these running times, the calculated energy consumption for the A system was 2.77 MJ/kg, while the TS system consumed 22.04 MJ/kg. The energy source used was Italian grid electricity. The results were reported as emissions associated with energy use.
3. Life Cycle Assessment of Greenhouse Structure
3.1. Technological Description of the Greenhouse
The greenhouse structure analyzed is located in Reggio Calabria (Latitude: 38.094833, Longitude: 15.660706, southern Italy) and is constructed with an aluminum frame and tempered glass panels, with dimensions of 6 m × 3 m × 3 m and a volume of 54 m3 (Figure 3). The greenhouse floor area is 18 m2. The interior setup consists of three racks, each equipped with three cultivation shelves, a total of 72 cultivation trays with a substrate blister system, two tanks for the nutrient solution, and an automated irrigation system that includes a water-cooling unit and an irrigation pump. The system also includes an automatic control unit for regulating environmental parameters, a cooling system to chill the water used in the aeroponic setup, irrigation and air pumps, and an LED lighting system (on/off). However, in this study, the LED lighting system was not used in either the A or TS growing systems and was excluded from both the One Click LCA and CCaLC2 analyses. Cultivation trays, tanks, and cultivation shelves were excluded from the system boundaries and were not considered in either One Click LCA or CCaLC2. Automatic systems, such as sensors, air and irrigation pumps, and the water chilling unit, were excluded from the greenhouse system boundaries and considered only for quantifying energy consumption in CCaLC2 (note* Table 1). They were not included in the LCA calculation of the greenhouse structure, as their individual contributions to embodied carbon were out of scope.
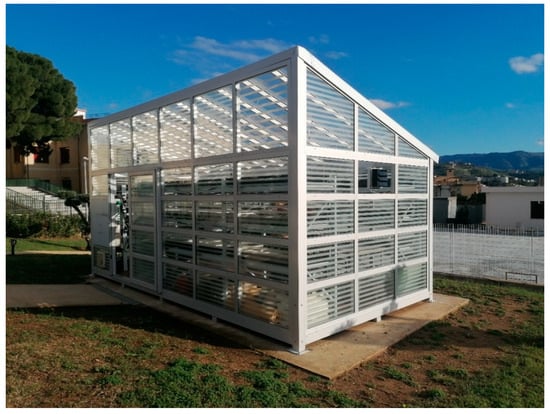
Figure 3.
The greenhouse used for the cultivation of lettuce.
3.2. Functional Unit of Greenhouse Structure
The functional unit of the greenhouse LCA is defined as kg CO2eq/m2, while its lifespan is estimated to be 20 years [23].
3.3. Goal and Scope
The greenhouse structure is rarely or never considered in assessment calculations, since life cycle assessments (LCAs) are often centered on plants, energy, waste, fertilizers, transportation, etc. Thus, the purpose of this research is to determine how the integration of a greenhouse structure footprint might affect the total emissions of a lettuce growth system.
3.4. System Boundaries
A cradle-to-gate assessment was selected as the boundary of the greenhouse LCA. The LCA of the greenhouse structure was carried out by means of One Click LCA, following the EN 15804+A2 standard defined in the program as Level(s) [18]. The study includes the following life stages: material production (A1–A3) and the construction and installation phases (A4–A5). Only the greenhouse structure (aluminum frame, glass panels, and WPC floor) was included in One Click LCA.
Figure 4 shows, in detail, the phases and sub-phases included in the greenhouse LCA.
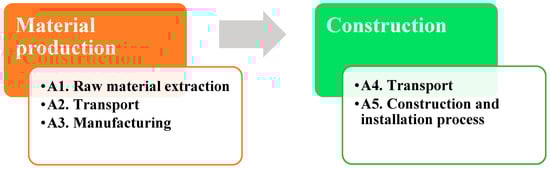
Figure 4.
Greenhouse structure system boundaries.
According to the EN 15804+A2 standard, the greenhouse structure can be evaluated throughout modules A1–A5, which cover material production and construction. The levels B1–B7 and levels C1–C4 were excluded from the life cycle assessment of the greenhouse construction.
3.5. Life Cycle Inventory Assessment (LCIA)
The greenhouse data inventory was compiled using documentation provided by the merchant, which included details on planimetry, area, materials, and dimensions. Additional measurements were taken directly from the greenhouse equipment, such as PVC trays and metal supports. Once all data were collected, the quantities of each component were calculated. Material data were sourced from third-party verified EPDs, based on Ecoinvent inventories [20]. Table 2 summarizes the components and their respective quantities over the greenhouse’s lifespan, along with transportation details from the merchant to the site location.
Table 2.
Data Inventory for greenhouse structure and internal equipment.
Functional Unit–Based Scaling and Aggregation of Greenhouse Impacts
The proposed LCA methodology combines two complementing tools: one for the greenhouse structure (One Click LCA) and one for the assessment of the growing systems (CCaLC2). One Click LCA allows for the calculation of impacts expressed per square meter, from cradle to grave. Using this tool, the greenhouse Global Warming Potential (GWP) of 535 kg CO2eq/m2 was calculated, accounting for a 20-year lifespan per square meter. The total GWP was then obtained by multiplying this value by the greenhouse’s total floor area (18 m2). To maintain cradle-to-gate system boundaries, the impacts corresponding to stages B1 to C4 were subtracted from the overall value, thereby accounting only for emissions from stages A1 to A5. To express the greenhouse structure’s GWP as kg CO2eq per kg of fresh lettuce, the yield over a 20-year period was considered (40,979.5 kg for A systems and 5147 kg for TS systems). The total greenhouse GWP (kg CO2eq) was then divided by the total yield of each system, resulting in the greenhouse impact expressed in kg CO2eq per kg of lettuce. Finally, this value was combined with the LCA results of the cultivation systems, expressed using the same functional unit and considering the same indicator (GWP), to aggregate the overall data.
This approach is consistent with ISO 14040 principles, which require that life cycle assessment results be expressed with respect to a clearly defined functional unit [8]. In the context of protected agriculture, environmental impacts are frequently reported per unit mass of product (e.g., kg CO2eq per kg of crop), as highlighted by Villagrán et al. [24]. The conversion of greenhouse impacts from an area-based metric (kg CO2eq/m2) to a product-based metric (kg CO2eq/kg of lettuce) therefore represents a functional unit–based scaling of the results, in line with the Level(s) framework (Indicator 1.2—Life cycle Global Warming Potential), which promotes the consistent scaling of life-cycle impacts to the selected functional unit [25].These results, expressed per unit of product, were then added to the LCA results of the cultivation systems (kg CO2eq/kg of lettuce) to obtain the environmental impact of the integrated system.
GWP was selected because it is one of the most established and widely used indicators for evaluating the environmental impact of agricultural systems and commercial structures [26].
4. Results
All results are expressed as kg CO2eq/kg FW. For greenhouse-based systems, the carbon footprint of the greenhouse structure, originally calculated per square meter (kg CO2eq/m2), was converted to a product-based functional unit following the scaling procedure described in the Section 3.5, Functional Unit-Based Scaling and Aggregation of Greenhouse Impacts. The scaling to convert the greenhouse GWP/m2 to GWP/kg of lettuce was performed using the following equation:
where is the greenhouse Global Warming Potential per f.u. (CO2eq/m2), is the greenhouse floor area (m2), and is the cumulative lettuce yield over the 20-year reference period (kg).
The outcomes of the cultivation systems are delineated in the following paragraphs, followed by a presentation of the greenhouse structure independently, and concluding with the integrated results combining both contributions.
4.1. Environmental Impact of the Growing Systems Excluding Greenhouse Structure
The environmental impact (GWP) of the PSO system was 1.72 kg CO2eq per kilogram of fresh lettuce (FW).
The raw materials stage, referring to the production and processing of input materials (fertilizers, soil, packaging, seedlings), had the largest influence, contributing 1.35 kg CO2eq/kg FW, followed by the cultivation phase and material transport, which contributed 0.32 and 0.05 kg, respectively.
Fertilizers, packaging (transplant trays, soil packaging, and seedling pots), and soil are all considered raw materials in the PSO system. Within the raw material stage for PSO, packaging had the largest impact with 0.71 kg CO2eq/kg FW; material manufacturing and packaging waste had values of 0.38 and 0.26 kg CO2eq/kg FW, respectively. The cultivation phase refers to all on-site activities required for plant growth, including the application of fertilizers, irrigation, energy use, and other management practices until harvest. The distance from the point of sale to the cultivation site is the same as in systems A and PSO (3.2 km).
For the A system, during the raw materials stage, which includes materials like lettuce seedlings, NPK fertilizers, polyethylene trays for transplanting and packaging, the total GWP per kg of lettuce resulted in 0.13 kg CO2eq/kg FW. Within the same stage, packaging had the highest impact (0.09 kg CO2eq/kg FW) compared to other materials (0.04 kg CO2eq/kg FW). Packaging waste was recycled and had a negligible environmental impact (0.003 kg CO2eq/kg FW).
During the cultivation phase, fertilizer application produced 0.08 kg CO2eq/kg of FW lettuce, and energy consumption alone produced 0.54 kg CO2eq per kilogram of fresh weight lettuce. The total environmental impact (GWP) for the A system was 0.75 kg CO2eq/kg lettuce (raw materials and cultivation stages). The transport inputs from the point of sale to the cultivation site have a minor impact (1.17 × 10⁻³ kg CO2eq/kg FW in terms of GWP) on the A system.
The indoor TS has a total environmental impact in terms of GWP emissions of 6.17 kg CO2eq per kilogram FW. The results are divided as follows:
- In the raw material stage, packaging produced 0.69 kg CO2eq/kg FW, waste from recycled packaging contributed to 0.27 kg CO2eq/kg FW, and material production 0.64 kg CO2eq/kg FW.
- In the cultivation phase, fertilizer application had 0.06 kg CO2eq/kg FW, and energy consumption 4.32 kg CO2eq/kg FW.
- The transport results in a higher impact of 0.19 kg CO2eq/kg FW.
The high contribution of packaging in TS and PSO is mainly attributable to the use of soil and single-use packaging materials, which increase material-related emissions, especially under low-yield conditions.
Energy consumption in the tub system (TS) had the greatest impact throughout production compared to the aeroponic system (A). The high energy-related contribution to the GWP in the TS and A systems, compared to other life cycle stages, is mainly due to two factors. First, electricity was modeled using the Italian national grid, which relies heavily on fossil fuels and therefore has a high emission factor. Secondly, the use of automated systems, such as sensors, control units, fertilizer dosing systems, irrigation pumps, and water chillers (see note below Table 1), is inherently energy-intensive and continuous to maintain optimal growing conditions. Additionally, crop yield strongly affects the GWP per kilogram of product [27], and in TS, the lower yield amplifies the energy impact per f.u.
4.2. Comparison of Carbon Footprint per Functional Unit of Growing Systems Excluding Greenhouse Structure
The aeroponic system (A) has a Global Warming Potential of 0.75 kg CO2eq per kg of lettuce, while the tub system (TS) has a total of 6.17 kg CO2eq per kg of lettuce after accounting for energy usage. Figure 5 depicts an overview of the GWP of the A, TS, and PSO systems. The results of the analysis conducted using CCaLC2 indicate that, among all growing systems, the one with the lowest Global Warming Potential (GWP) is the A system, followed by the PSO, and lastly the TS. These outcomes reflect differences in both resource efficiency and yield performance among the systems, which directly affect the emissions per kilogram of product. Within the raw materials stage, the A system exhibited the lowest GWP, primarily due to the reduced use of resources typical of soilless cultivation. In fact, the initial input materials were limited to seedlings, fertilizers, and the associated packaging. In contrast, for both the TS and PSO, the inclusion of soil—used in tubs and pots, respectively—significantly contributed to higher emissions. Nevertheless, across all three systems, the packaging within the raw materials stage represented the most significant contributor to GWP (0.09, 0.69, and 0.71 kg CO2eq/kg of FW lettuce for A, TS, and PSO, respectively). In TS and PSO, packaging caused higher impacts due to the use of soil bags and pots, and the results are related to the lower yield. Regarding the cultivation phase, among all systems, the PSO shows the lowest GWP, with a value of 0.32 kg CO2eq/kg of fresh weight (FW), followed by the A and TS (0.62 and 4.38 kg CO2eq/kg FW, respectively) (Figure 5). This difference is primarily due to the PSO’s reduced energy demands throughout the cultivation phase, making its energy usage insignificant.
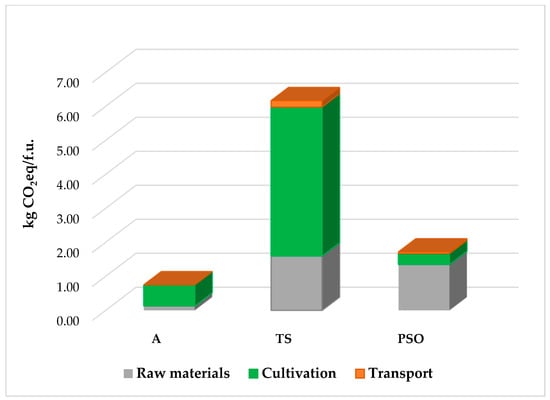
Figure 5.
Breakdown of the Global Warming Potential (GWP) of the cultivation systems (A, TS, and PSO) into raw materials, cultivation, and transport contributions, expressed as kg CO2eq per functional unit (1 kg lettuce).
In terms of energy consumption, the A system requires significantly less energy—2.77 MJ/kg of fresh lettuce—compared to the TS (22.04 MJ/kg FW) (Table 1), as the total yield over the considered period for the A system is approximately eight times higher than that of the TS. In fact, the A system consumed 87.5% less electricity per kilogram of lettuce produced compared to the TS. Energy contributes 72% to the GWP in the A system, while it provides around 70% to the TS.
4.3. Environmental Impact of the Greenhouse Structure
One Click LCA software performed an LCA environmental assessment of the greenhouse structure, providing the following outcomes:
- -
- For materials, the A1–A3 stages provided a total 20-year GWP of 8691.74 kg CO2eq.
- -
- For transport, the A4 stage was 54.48 kg CO2eq.
- -
- For construction, the A5 stage was 611.71 kg CO2eq.
The raw materials (A1–A3) contributed approximately 93% (76% aluminium, glass 13% and WPC 4%) to the total GWP, followed by the A5 (6%) and A4 (1%) stages, and the most impactful material was the aluminum structure (Figure 6).
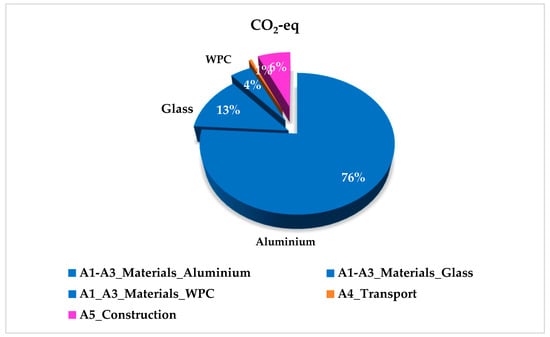
Figure 6.
Percentage distribution of the Global Warming Potential (GWP) across the life cycle stages: materials (A1–A3), broken down by component (aluminum, glass, WPC—Wooden Plastic Composite), transport (A4), and construction (A5). The ‘Materials’ category is the largest contributor to the GWP, with aluminum as the dominant component.
The high contributions are associated with the production of materials with high emission factors such as metals [28]. Moreover, utilizing the One Click LCA methodology, the greenhouse structure exhibits a Global Warming Potential (GWP) of 535 kg CO2eq/m2, based on total surface area.
Based on cradle-to-gate analysis, the greenhouse structure has a total GWP of 9357.93 kg CO2eq. To allow comparison between the A and TS, which both use the structure, this value was divided by the total yield of each system, following Equation (3). The results indicate that the structure contributed 0.23 kg CO2eq/kg FW lettuce to the A system and 1.81 kg CO2eq/kg FW lettuce to the TS.
4.4. Greenhouse Structure and Growing Systems Integrated Results
The total GWP of the cultivation systems was 40,092.5 kg CO2eq for the aeroponic system (A) and 41,115 kg CO2eq for the tub system (TS), including greenhouse structure. The greenhouse structure accounted for a total GWP of 9357.93 kg CO2eq, contributing 23% to the overall emissions for the A system and 22.7% for the TS. Energy-related GWP represented 55.2% for the A system and 54% for the TS of total emissions, mainly due to the use of non-renewable energy sources [29].
The environmental impact of the cultivation systems, expressed as kg CO2eq/kg FW, were 0.75, 6.17, and 1.72 for the A, TS, and PSO systems, respectively. Excluding the PSO, which represents an outdoor cultivation scenario, the GWP values were combined with the contribution of the greenhouse structure discussed in Section 4.3 (0.23 and 1.81 kg CO2eq/kg of lettuce for the A and TS systems, respectively). As a result, the total GWP per f.u. amounted to 0.98 kg CO2eq/kg FW lettuce for the A system and 7.98 kg CO2eq/kg FW for the TS. Figure 7 illustrates the GWP per f.u. of each cultivation system, including the greenhouse structure.
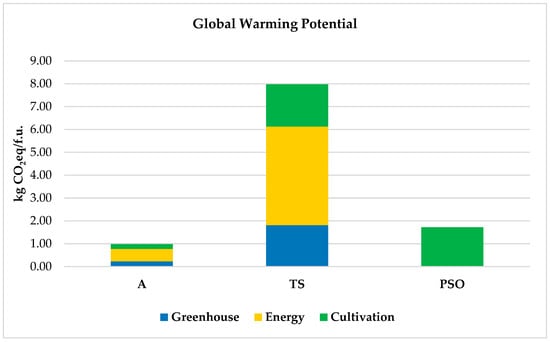
Figure 7.
The Global Warming Potential of each cultivation system, expressed as kg CO2eq/functional unit, is shown as stacked bars with absolute contributions for greenhouse structure, energy, and production in the A and TS systems and for production in the PSO.
4.5. GWP Sensitivity Analysis Based on Yield Variation
As highlighted in [30] for interpreting LCA results, the choice of characterization models can influence final outcomes and hotspot identification. In this study, a yield-based sensitivity analysis was carried out to evaluate how variations in crop productivity affect the GWP per functional unit, providing insight into system robustness and key environmental drivers.
Sensitivity analysis was conducted on the three cultivation systems: aeroponic (A), tub system (TS), and PSO. As mentioned in Section 2.4, yields for the different systems were extrapolated from a previous study and reported as mean values ± standard error. To evaluate how the contributions to GWP from the cultivation phase, greenhouse structure, and energy consumption vary with yield, two scenarios were considered for each system based on calculated statistic yield variability. The first scenario corresponds to an optimistic yield (higher yield), while the second represents the worst-case scenario (lower yield). It was assumed that all input parameters remained constant from the baseline scenario presented in this study, with only the yield varying. Table 3 shows how the GWP per functional unit changes for each system with yield variation. Figure 8 illustrates how the GWP contributions from energy, cultivation, and greenhouse structure phases inversely change with yield: as yield increases, these impacts decrease, and vice versa.
Table 3.
Fresh weight yields per plant, total 20-year yields (), and Global Warming Potential (GWP) per kg of lettuce for the aeroponic (A), the PSO, and the tub system (TS) under baseline, optimistic, and worst-case scenarios. Data are presented as mean ± standard error for baseline yields; optimistic and worst-case scenarios reflect ± standard error variations. GWP values are calculated per functional unit (kg FW).
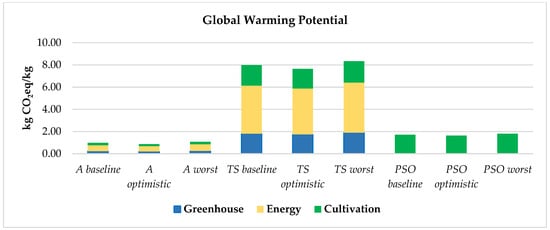
Figure 8.
Sensitivity analysis of GWP per f.u. for the cultivation, energy, and greenhouse structure phases in the aeroponic (A), the PSO, and the tub system (TS) under baseline, optimistic, and worst-case yield scenarios.
From the analysis of the reported data, it clearly emerges that yield variation has a direct impact on the GWP per unit of product in all the systems considered.
In the A system, energy is the main contributor (0.48–0.60 kg CO2eq/kg FW in optimistic and worst-case scenarios), followed by greenhouse structure (0.21–0.25) and cultivation (0.18–0.23), with higher yield reducing all contributions.
In the TS, energy dominates (4.13–4.51), followed by cultivation (1.77–1.93) and greenhouse (1.74–1.90), showing high sensitivity to yield variations.
For the PSO, only cultivation is relevant (1.63–1.81), as energy and greenhouse are not accounted for.
All systems show an inverse relationship between yield and GWP per unit of product: as yield increases, GWP decreases. The TS is the most sensitive to yield variations, while the A system is more robust due to higher productivity and lower relative energy intensity per kilogram of product. The overall GWP per functional unit in the A system is 0.87 and 1.08 kg CO2eq/kg FW for the best- and worst-case scenarios, respectively; for the TS, it is 7.61 and 8.34 kg CO2eq/kg FW; and for the PSO, 1.63 and 1.81 kg CO2eq/kg FW. For this specific case study, the analysis indicates that optimizing yield is one of the key factors for reducing the specific environmental impact of cultivation systems, particularly in those that are more energy-intensive or less productive (TS).
5. Discussion
Overall, when considering the integrated results, including the greenhouse structure, the A system showed the lowest environmental impact (0.98 kg CO2eq/kg FW), mainly due to its higher yield. For the GWP indicator, the PSO had the second-best environmental performance (1.71 kg CO2eq/kg FW), followed by the TS (7.98 kg CO2eq/kg FW). It should be noted that these values refer to the aggregated GWP per kg of lettuce, obtained by combining the impacts of the cultivation systems (A and TS) with the contribution of the greenhouse structure, as discussed in Section 4.1, Section 4.3 and Section 4.4. When the greenhouse is excluded, the A and TS show GWP values of 0.75 and 6.17 kg CO2eq/kg FW, respectively. Rothwell et al. [29] carried out an LCA in Australia on several lettuce production systems, comparing high-tech and low-tech greenhouses with open-field agriculture. Their findings revealed that the open-field system exhibits the lowest environmental impact, whereas greenhouses, particularly high-tech ones supplied by grid electricity, are characterized by substantially higher emissions, largely driven by energy consumption, which accounts for about half of overall emissions. In line with these findings, in the present study, energy contributed to the overall GWP per f.u. (including the greenhouse structure) by 54.1% and 55.2% in the TS and A systems. Although the two systems differ technologically, the similar energy contribution results from comparable operational schedules (12 cultivation cycles per year and working hours) and from the same national electricity grid. Energy-related GWP remains substantially higher in the TS due to its lower yield, as confirmed by sensitivity analysis, which showed a decrease to 4.13 kg CO2eq/kg FW in the optimistic scenario. Overall, differences in environmental impact between the TS, PSO, and A systems are mainly driven by crop yield, energy consumption, and greenhouse materials.
Boneta et al. [31] evaluated the environmental impact of an 18 m2 rooftop urban greenhouse in Barcelona, reporting emissions of 0.6 kg CO2eq per kg of product. Although this value is lower than observed for the A system in the present study (0.97 kg CO2eq/kg), both studies indicate that soilless systems exhibit a lower impact than other cultivation methods. Moreover, in both cases, infrastructure represents a significant contributor to the overall impact, accounting for 31.6% in [26] and approximately one-third of the GWP per f.u. (22.7% and 23% for the TS and A systems), indicating the importance of greenhouse structural components. Indeed, due to the high environmental impacts of greenhouse materials, LCA studies in the construction sector show that wood as a structural material generally has lower impacts than metals [28].
Paturu and Varadarajan [32] investigated different lettuce production systems in India, finding that conventional agriculture has a higher impact, while greenhouse farming produces the lowest emissions; indoor hydroponic and cabinet-based systems have intermediate impacts. Other research has found that improving cultivation practices and using renewable energy can significantly improve the environmental performance of soilless systems [33,34,35]. In our scenario, the PSO has an intermediate environmental impact compared to the TS (conventional greenhouse) and A (soilless) systems. However, LCA results from different regions must be interpreted in the context of local climate, seasonal variations, and energy sources. For example, studies conducted in Mediterranean conditions [27,31,36] generally show lower energy-related GWP emissions than systems investigated in India [32], Sweden [33], the UK [34], or Taiwan [35], where heating, cooling, or artificial lighting increase GWP. Indeed, variables such as production scale, seasonality, and system boundaries can markedly affect outcomes, especially in high-energy-intensity systems [27,36,37]. The literature gives a wide range of results relating soilless and traditional agriculture techniques. In general, soilless systems boost production and resource efficiency, reducing water and nutrient consumption as well as pollution emissions. Thus, it is paramount to consider that their environmental performance is determined by a variety of factors, including greenhouse design, cultivation techniques, plant species, system boundaries, material selection, waste management, transportation logistics, energy consumption, the regional energy mix, and the LCA methodology used [24]. In this study, two complementary LCA methodologies with “cradle-to-gate” boundaries were employed. The cultivation LCA focused on material extraction, production, and cultivation phases, while the greenhouse LCA considered modules A1–A5 (Figure 4), aligned conceptually with the ISO-based cultivation LCA. The main difference between the two approaches is that EN 15804 is specific to the construction sector and is typically used in industrial contexts to compare products within the same category via Environmental Product Declarations (EPDs). Nevertheless, it follows the principles of ISO 14040/14044, and, for research purposes, the methodology can be applied [8,18] by using the scaling approach described above, converting the impacts of the structure to kg CO2eq per kg FW. This allowed the results to be comparable and integrable with those of the cultivation system, providing a comprehensive assessment of the environmental impact of the integrated systems.
The study has some limitations. Cultivation yields were based on our previous research [6] and did not account for variability due to season, climate, management, or cultivar differences. All inputs were assumed to be constant, with only yield varying. Only Global Warming Potential (GWP) was assessed, while other impact categories, such as water use, eutrophication, acidification, and land use, were excluded because their analysis would have required more complex assessments beyond the study’s scope. Greenhouse data relied on standardized values and software modeling, so variations in lifespan, maintenance, or disposal were not considered. Energy-related GWP used the Italian electricity grid, and comparisons between indoor and outdoor systems, such as the PSO, are less direct, since some stages, like climate control energy, do not apply. Despite these limitations, the results highlight the key role of crop yield: highly productive systems, such as the aeroponic (A) system, show significantly lower GWP per kilogram compared to less productive systems, such as the TS or PSO systems. This suggests that optimizing crop yield can substantially reduce the specific environmental impact. The breakdown of GWP into energy, cultivation, and greenhouse structure stages highlights the main contributors and informs targeted mitigation strategies. Energy dominates in indoor systems, while material inputs are more significant in the PSO, emphasizing the need to tailor interventions to the production context by applying, i.e., sensitivity analysis with renewable energy scenarios [38]. These findings provide a comparative reference for more comprehensive future assessments.
The LCA of the cultivation systems conducted using CCaLC2 produced results that were in line with the current literature regarding energy consumption, the contribution of greenhouse structure, and overall GWP, confirming that soilless systems demonstrate a lower environmental impact than conventional agriculture. In contrast, the EN 15804 methodology proved to be useful for evaluating the environmental performance of greenhouse structures used for lettuce growing under various situations. When the EN 15804 methodology is applied via One Click LCA in combination with ISO 14040, it can support a more targeted LCA, providing a detailed evaluation of the environmental impacts of the structure in the protected cultivation sector.
6. Conclusions
This study employed two complementary LCA methodologies: ISO 14040 via CCaLC2 for the cultivation systems, and EN 15804 via One Click LCA for the greenhouse structure. While EN 15804 follows ISO 14040/14044 principles, it is specific to the construction sector and differs substantially in its application compared to agricultural LCA. The aim was to compare the GWP of different cultivation systems by integrating the impact of the greenhouse. The GWP of the structure, originally expressed per m2, was converted to kg CO2eq/kg of fresh lettuce to allow direct comparison with the cultivation systems. This integrated approach addresses gaps in the literature, where greenhouse structures are often neglected, and enables a comparative analysis of soilless systems in a Mediterranean context. Three cultivation systems were analyzed: the tub system (TS), a soilless aeroponic (A) system, and an outdoor pot system (PSO). The A system exhibited the lowest GWP both without the structure (0.75 kg CO2eq/kg) and including it (0.98 kg CO2eq/kg). The TS had the highest GWP (6.17 without and 7.98 kg CO2eq/kg including the greenhouse structure), while the PSO showed intermediate impacts (1.72 kg CO2eq/kg). The greenhouse structure contributed 22.7% to the TS GWP and 23% to that of the A system. This similarity in the GWP percentage is primarily due to the lower yield of the TS compared to the A system, which produced eight times more lettuce. Furthermore, the high impact of the TS is primarily due to its high energy demand and low productivity, whereas the lower impact of the A system reflects its higher yield. The majority of emissions are attributable to energy, which accounted for over 54% in the TS and 55.2% for the A system, largely due to the fossil fuel-based Italian electricity mix and, for TS, also due to its low yield. These results confirm that productivity and energy efficiency are key determinants of environmental performance in the present case study. Strategies such as optimizing crop yield, using low-impact materials (wood), and adopting renewable energy can further reduce the GWP per unit of product [39]. Sensitivity analysis on yield variations highlighted the direct influence of productivity on per-unit emissions. This study provides a comparative reference for Mediterranean protected cultivation systems, and, by applying the EN 15804 methodology, which is specifically designed for the construction sector, it is possible to gain a broader perspective on which stages and materials contribute most to greenhouse emissions. Furthermore, the combination of the two LCA methodologies through the applied scaling procedure makes this integrated approach reproducible and provides a solid starting point for future research on the environmental performance of protected cultivation systems.
Supplementary Materials
The following supporting information can be downloaded at https://www.mdpi.com/article/10.3390/agriengineering8020046/s1. Figure S1. Cultivation systems: (a) tub system, (b) aeroponics, (c) outdoor soil potted lettuce; Figure S2. System boundaries diagram of aeroponic system and of greenhouse structure; Figure S3. System boundaries diagram of the tub system and of the greenhouse structure; Figure S4. System boundaries diagram of the outdoor pot system.
Author Contributions
G.I., conceptualization, methodology, formal analysis, writing—original draft preparation; D.K., data curation, methodology, review and editing; F.B., visualization, supervision, review and editing, funding acquisition. All authors have read and agreed to the published version of the manuscript.
Funding
The research is funded by the PNRR Italian Government within Mission 4 “Instruction and Research”—Innovation Ecosystem TECH4YOU Program, Spoke 3, Goal 1: Technologies for climate change adaptation and quality of life improvement. Innovation ecosystem project (EI-T4Y), identification code ECS00000009.
Institutional Review Board Statement
Not applicable.
Informed Consent Statement
Not applicable.
Data Availability Statement
The original contributions presented in this study are included in the article/Supplementary Materials. Further inquiries can be directed to the corresponding author.
Conflicts of Interest
The authors declare no conflict of interest or personal relationships that could have appeared to influence the work reported in this paper.
References
- Impallomeni, G.; Barreca, F. Agrivoltaic Systems towards the European Green Deal and Agricultural Policies: A Review. J. Agric. Eng. 2024, 56, 1632. [Google Scholar] [CrossRef]
- Jarraud, M.; Steiner, A. Summary for Policymakers. In Managing the Risks of Extreme Events and Disasters to Advance Climate Change Adaptation; Cambridge University Press: Cambridge, UK, 2012; Volume 9781107025, ISBN 9781139177245. [Google Scholar]
- Mbow, C.; Rosenzweig, C.; Barioni, L.G.; Benton, T.G.; Herrero, M.; Krishnapillai, M.; Liwenga, E.; Pradhan, P.; Rivera-Ferre, M.G.; Sapkota, T.; et al. Food Security. In Climate Change and Land; Cambridge University Press: Cambridge, UK, 2022; ISBN 9781009157988. [Google Scholar]
- Benke, K.; Tomkins, B. Future Food-Production Systems: Vertical Farming and Controlled-Environment Agriculture. Sustain. Sci. Pract. Policy 2017, 13, 13–26. [Google Scholar] [CrossRef]
- Ragaveena, S.; Shirly Edward, A.; Surendran, U. Smart Controlled Environment Agriculture Methods: A Holistic Review. Rev. Environ. Sci. Biotechnol. 2021, 20, 887–913. [Google Scholar] [CrossRef]
- Impallomeni, G.; Lupini, A.; Sorgonà, A.; Gattuso, A.; Barreca, F. The Qualitative and Quantitative Relationship of Lettuce Grown in Soilless Systems in a Mediterranean Greenhouse. Int. J. Plant Biol. 2025, 16, 94. [Google Scholar] [CrossRef]
- Barreca, F. Sustainability in Food Production: A High-Efficiency Offshore Greenhouse. Agronomy 2024, 14, 518. [Google Scholar] [CrossRef]
- ISO 14040:2006; Environmental Management—Life Cycle Assessment—Principles and Framework. ISO: Geneva, Switzerland, 2006. Available online: https://www.iso.org/standard/37456.html (accessed on 2 December 2025).
- Zhuang, Y.; Zhang, C.Y.; Lu, N. Environmental Performance of Fruiting Vegetable Production in Vertical Farms. Sustain. Prod. Consum. 2025, 56, 477–489. [Google Scholar] [CrossRef]
- Romero-Gámez, M.; Audsley, E.; Suárez-Rey, E.M. Life Cycle Assessment of Cultivating Lettuce and Escarole in Spain. J. Clean. Prod. 2014, 73, 193–203. [Google Scholar] [CrossRef]
- Banboukian, A.; Chen, Y.; Thomas, V.M. The Challenges of Controlled Environment Hydroponic Farming: A Life Cycle Assessment of Lettuce. Int. J. Life Cycle Assess. 2025, 30, 1691–1704. [Google Scholar] [CrossRef]
- Blom, T.; Jenkins, A.; Pulselli, R.M.; van den Dobbelsteen, A.A.J.F. The Embodied Carbon Emissions of Lettuce Production in Vertical Farming, Greenhouse Horticulture, and Open-Field Farming in the Netherlands. J. Clean. Prod. 2022, 377, 134443. [Google Scholar] [CrossRef]
- Schmidt Rivera, X.; Rodgers, B.; Odanye, T.; Jalil-Vega, F.; Farmer, J. The Role of Aeroponic Container Farms in Sustainable Food Systems—The Environmental Credentials. Sci. Total Environ. 2023, 860, 160420. [Google Scholar] [CrossRef]
- Buchholz, B.; Cerdas, F.; Juraschek, M.; Herrmann, C. Life Cycle Assessment of Circular Symbiotic Indoor Food Production Systems: Challenges in the Scope Definition. Procedia CIRP 2023, 116, 510–515. [Google Scholar] [CrossRef]
- Muñoz-Liesa, J.; Toboso-Chavero, S.; Mendoza Beltran, A.; Cuerva, E.; Gallo, E.; Gassó-Domingo, S.; Josa, A. Building-Integrated Agriculture: Are We Shifting Environmental Impacts? An Environmental Assessment and Structural Improvement of Urban Greenhouses. Resour. Conserv. Recycl. 2021, 169, 105526. [Google Scholar] [CrossRef]
- LCA.no. EPD Basatasu EN 15804. Available online: https://lca.no/it/epd-basata-su-en-15804/ (accessed on 7 July 2025).
- One Click LCA Ltd.©. Available online: https://oneclicklca.com/ (accessed on 7 July 2025).
- EN 15804+A2; Sustainability of Construction Works—Environmental Product Declarations—Core Rules for the Product Category of Construction Products. European Committee for Standardization (CEN): Brussels, Belgium; Swedish Standard Institute (SIS): Stockholm, Sweden, 2019.
- Accredia EPD International—Servizio Accreditato. Available online: https://www.accredia.it/servizio-accreditato/epd-international/?utm_source= (accessed on 15 January 2026).
- LCA, O.C. Database Update: Ecoinvent 3.11 Availability. Available online: https://help.oneclicklca.com/en/articles/415249-database-update-ecoinvent-3-11-availability (accessed on 15 January 2026).
- Azapagic, A. CCaLC2 © for Windows Manual (V1.1); University of Manchester: Manchester, UK, 2016. [Google Scholar]
- ISO 14044:2006; Environmental Management—Life Cycle Assessment—Requirements and Guidelines. ISO: Geneva, Switzerland, 2006. Available online: https://www.iso.org/standard/38498.html (accessed on 15 January 2026).
- Sajid, M.U.; Khan, S.A.; Koc, M.; Al-Ghamdi, S.G.; Bicer, Y. Life Cycle Assessment of Spectra-Managed Greenhouses for Sustainable Agriculture. Clean. Environ. Syst. 2023, 9, 100127. [Google Scholar] [CrossRef]
- Villagrán, E.; Romero-Perdomo, F.; Numa-Vergel, S.; Galindo-Pacheco, J.R.; Salinas-Velandia, D.A. Life Cycle Assessment in Protected Agriculture: Where Are We Now, and Where Should We Go Next? Horticulturae 2024, 10, 15. [Google Scholar] [CrossRef]
- Dodd, N.; Donatello, S.; Cordella, M. Level(s) Indicator 1.2: Life Cycle Global Warming Potential (GWP) User Manual: Overview, Instructions and Guidance; Joint Research Centre: Seville, Spain, 2020; pp. 1–41. [Google Scholar]
- Kazlauskas, M.; Bručienė, I.; Savickas, D.; Naujokienė, V.; Buragienė, S.; Steponavičius, D.; Romaneckas, K.; Šarauskis, E. Life Cycle Assessment of Winter Wheat Production Using Precision and Conventional Seeding Technologies. Sustainability 2023, 15, 14376. [Google Scholar] [CrossRef]
- Bartzas, G.; Zaharaki, D.; Komnitsas, K. Life Cycle Assessment of Open Field and Greenhouse Cultivation of Lettuce and Barley. Inf. Process. Agric. 2015, 2, 191–207. [Google Scholar] [CrossRef]
- Hegeir, O.A.; Kvande, T.; Stamatopoulos, H.; Bohne, R.A. Comparative Life Cycle Analysis of Timber, Steel and Reinforced Concrete Portal Frames: A Theoretical Study on a Norwegian Industrial Building. Buildings 2022, 12, 573. [Google Scholar] [CrossRef]
- Rothwell, A.; Ridoutt, B.; Page, G.; Bellotti, W. Environmental Performance of Local Food: Trade-Offs and Implications for Climate Resilience in a Developed City. J. Clean. Prod. 2016, 114, 420–430. [Google Scholar] [CrossRef]
- Zampori, L.; Saouter, E.; Schau, E.; Castellani, V.; Sala, S. Guide for Interpreting Life Cycle Assessment Result; JRC Technology Report EUR 28266 EN; EU Publications: Luxembourg, 2016. [Google Scholar] [CrossRef]
- Boneta, A.; Rufí-Salís, M.; Ercilla-Montserrat, M.; Gabarrell, X.; Rieradevall, J. Agronomic and Environmental Assessment of a Polyculture Rooftop Soilless Urban Home Garden in a Mediterranean City. Front. Plant Sci. 2019, 10, 341. [Google Scholar] [CrossRef]
- Paturu, P.; Varadarajan, S. Assessing Environmental Sustainability by Combining Product Service Systems and Life Cycle Perspective: A Case Study of Hydroponic Urban Farming Models in India. Sci. Total Environ. 2024, 927, 172232. [Google Scholar] [CrossRef]
- Martin, M.; Bengtsson, E.; Carotti, L.; Orrestig, K.; Orsini, F. Environmental Assessment of Greenhouse Herb Production: A Case of Longitudinal Improvement Options in Sweden. Resour. Conserv. Recycl. 2023, 193, 106948. [Google Scholar] [CrossRef]
- Gargaro, M.; Hastings, A.; Murphy, R.J.; Harris, Z.M. A Cradle-to-Customer Life Cycle Assessment Case Study of UK Vertical Farming. J. Clean. Prod. 2024, 470, 143324. [Google Scholar] [CrossRef]
- Behr, L.M.; Hu, A.H.; Heck, P. Assessing the Environmental Impact and Advantages of a Commercial Aquaponic System in Taiwan through Life Cycle Assessment. Aquaculture 2025, 595, 741589. [Google Scholar] [CrossRef]
- Barla, S.A.; Salachas, G.; Abeliotis, K. Assessment of the Greenhouse Gas Emission from Aeroponic Lettuce Cultivation in Greece. Euro-Mediterr. J. Environ. Integr. 2020, 5, 29. [Google Scholar] [CrossRef]
- Maynard, R.; Burkhardt, J.; Quinn, J.C. Sustainability of Lettuce Production: A Comparison of Local and Centralized Food Production. J. Clean. Prod. 2023, 428, 139224. [Google Scholar] [CrossRef]
- Martin, M.; Salvador Soy, A.; Carotti, L.; Orsini, F. Environmental Life Cycle Assessment of Lettuce Production in a Container-Based Vertical Farm. Eur. J. Hortic. Sci. 2024, 89, 1–12. [Google Scholar] [CrossRef]
- Mousavi, A.; Aghbolaghi, E.A.; Khorramifar, A.; Gancarz, M.; Darvishi, Y.; Stasiak, M.; Miernik, A.; Karami, H. Life Cycle Assessment for Environmental Impact Reduction and Evaluation of the Energy Indices in Lettuce Production. Appl. Sci. 2022, 12, 10348. [Google Scholar] [CrossRef]


Disclaimer/Publisher’s Note: The statements, opinions and data contained in all publications are solely those of the individual author(s) and contributor(s) and not of MDPI and/or the editor(s). MDPI and/or the editor(s) disclaim responsibility for any injury to people or property resulting from any ideas, methods, instructions or products referred to in the content. |
© 2026 by the authors. Licensee MDPI, Basel, Switzerland. This article is an open access article distributed under the terms and conditions of the Creative Commons Attribution (CC BY) license.