


Abstract
Commercial dairy farms are essential to milk production, food security, and rural economies, but they also generate large volumes of manure and wastewater requiring reliable characterization. Measuring solids, organic matter, and dissolved constituents is important for pollution control, nutrient management, and resource recovery. Artificial intelligence may reduce analytical burden, although its usefulness depends on demonstrating that predictions generalize across farms and that model explanations are scientifically credible. This study evaluated 205 lagoon-manure samples collected between May and August 2021, within a four-year project, from 18 commercial dairies in California’s Central Valley. Sample availability varied among measurements and modeling tasks because of missing observations. Gravimetric and chemical measurements were analyzed using polynomial ridge regression, random forest, and XGBoost with farm-held-out cross-validation; validated models were interpreted using SHAP and LIME. All 205 samples had complete gravimetric records, and chemical measurements were available for 155 samples. Samples averaged 96.02% moisture, 3.98% total solids, and 3.06% organic matter. Organic matter was predicted from the combined gravimetric measurements (R2 = 0.975, RMSE = 0.97 percentage points, MAE = 0.39, and RPD = 6.32). Total solids alone produced similar pooled performance (R2 = 0.979; RPD = 6.86), and a linear regression on total solids performed comparably (R2 = 0.980). However, prediction errors were strongly concentration dependent. For the linear benchmark, mean absolute errors represented approximately 56%, 21%, and 11% of mean organic-matter concentrations in samples containing <1%, 1–10%, and >10% total solids, respectively. These findings indicate that strong pooled performance does not establish reliable screening accuracy for highly dilute samples. In contrast, nitrate, sodium, salinity, calcium, and pH could not be predicted reliably (R2 = −0.431 to 0.091; RPD = 0.84–1.05). SHAP identified moisture–solids as the dominant contributor to organic-matter predictions, whereas LIME supported sample-level interpretation. These findings apply to flush-based dairies in California’s Central Valley, and this approach can support low-cost screening of dairy-lagoon manure for organic matter while directing chemically governed properties to laboratory measurement.
Keywords:
dairy manure; lagoon wastewater; total solids; organic matter; machine learning; SHAP; LIME 1. Introduction
The dairy industry is an important contributor to food security, rural economies and the supply of nutrient-rich foods, but intensive milk production also generates substantial quantities of manure and wastewater. Dairy manure contains water, total solids, volatile solids—used as an operational proxy for organic matter—mineral residues and dissolved nutrients whose proportions vary with diet, animal productivity and manure-handling practices [1,2]. During collection and lagoon storage, these materials undergo settling, decomposition and microbial transformation. Dietary nitrogen can increase nitrogen excretion and ammonia losses, while decomposition of the volatile-solids fraction can contribute methane emissions, nutrient release and oxygen-demanding organic loads [3,4]. Storage duration, temperature, dilution and lagoon conditions further influence transformations and losses of nitrogen and organic matter [5,6]. Accurate measurement of moisture, total solids and volatile solids is therefore essential for assessing pollution potential, selecting treatment strategies and identifying opportunities for nutrient, energy and organic-matter recovery.
Laboratory characterization provides reliable compositional information, but repeated sampling and analysis across geographically dispersed commercial farms require substantial time, labor and analytical resources. Spectroscopy and machine-learning studies have shown that manure properties can be estimated when predictor measurements contain chemically relevant information [7,8]. However, spectroscopy requires specialized instrumentation, calibration and data processing, and it remains unclear whether routine gravimetric measurements can provide a simpler basis for prediction across commercial dairies. Agricultural models may also have limited explanatory and predictive power when important farm-level drivers are absent, or predictions are transferred beyond the conditions represented during model development [9]. Evaluating the predictive value and limitations of low-cost gravimetric measurements therefore represents an important practical and scientific need.
A notable increase in the implementation of artificial intelligence (AI) in livestock manure management has been observed over recent years, with studies on the improvement of manure recycling, organic waste treatment, anaerobic digestion, and composting using AI methods like tree-based models, neural networks, and hybrid optimization methods [10,11,12,13]. Moving beyond data analysis, researchers are building spectroscopy with AI capabilities to estimate nitrogen, phosphorus, and dry matter in manure, while other researchers are using aerial imagery to predict nitrogen excretion in dairy cows and estimate methane emissions [14,15,16,17,18]. Despite the huge increase in ML studies, a few have focused on understanding the model’s reliability and limitations. Many models were evaluated using a random data split [15,16,17,19,20,21,22], which can overestimate accuracy and obscure which predictors are most important [23,24].
Different machine-learning models capture different forms of predictor–response structure, making comparative evaluation important for heterogeneous manure data. Ridge regression stabilizes coefficient estimates when predictors are correlated, while polynomial features allow curvature and interactions to be represented [25]. Random Forest combines many regression trees to reduce prediction variance and accommodate nonlinear responses without specifying a fixed functional form [26]. Gradient boosting builds trees sequentially, with each additional tree correcting errors retained by the preceding ensemble [27], whereas XGBoost extends this approach through regularization, shrinkage and computationally efficient tree construction [28]. Because model complexity does not guarantee transferable performance, model families should be compared using identical predictor–response definitions and validation partitions. Cross-validation is particularly important for estimating generalization performance in heterogeneous or relatively small datasets [29]. For multi-farm studies, keeping samples from the same farm together during validation provides a more rigorous test of whether learned relationships extend beyond the management conditions represented during training.
Predictive accuracy alone may not explain why a model generates a particular estimate or whether its apparent relationships are scientifically credible. Explainable artificial intelligence provides tools for examining global model behavior and individual predictions [30,31]. SHAP decomposes a prediction into additive feature contributions and summarizes the direction and relative importance of predictors across a dataset [32]. LIME provides a complementary local explanation by fitting an interpretable surrogate model around an individual observation [33]. These approaches can reveal nonlinear responses, interactions and sample-specific variability that are not evident from aggregate performance metrics. However, explainability cannot correct an unreliable predictive model or establish causality; meaningful scientific interpretation requires that the underlying model first demonstrate adequate generalization [34]. Combining farm-level validation with global and local explanations therefore provides a stronger basis for distinguishing reproducible manure relationships from model-specific artifacts.
To address these needs, we analyzed 205 lagoon-manure samples collected between May and August 2021, within a four-year project, from 18 geographically dispersed commercial dairy farms. The study had three objectives: (1) to characterize the distributions, availability, variability and dependence structure of the measured gravimetric and chemical properties; (2) to develop and compare polynomial ridge regression, Random Forest and XGBoost models using farm-aware cross-validation and complementary performance metrics; and (3) to use SHAP and LIME to examine global and local model behavior and distinguish manure properties suitable for predictive screening from those requiring direct measurement. This study focuses on three contributions: evaluating where gravimetric measurements can predict other measurements and reduce laboratory work; identifying which gravimetric and chemical properties can be reliably predicted; and interpreting model performance by applying explainable AI methods that use validation results to guide model explanations. The contribution of this study lies not in discovering a new relationship between total solids and organic matter or developing a new machine-learning algorithm, but in systematically evaluating predictive reliability across independent dairy farms using statistical benchmarks and explainable AI methods. By integrating predictive performance, farm-held-out validation, and model interpretability, the proposed framework identifies manure properties suitable for preliminary screening and those requiring direct analytical measurement. This approach provides a practical basis for assessing the capabilities and limitations of machine learning in dairy-manure characterization.
2. Materials and Methods
2.1. Sample Collection, Farm Environment, and Analytical Framework
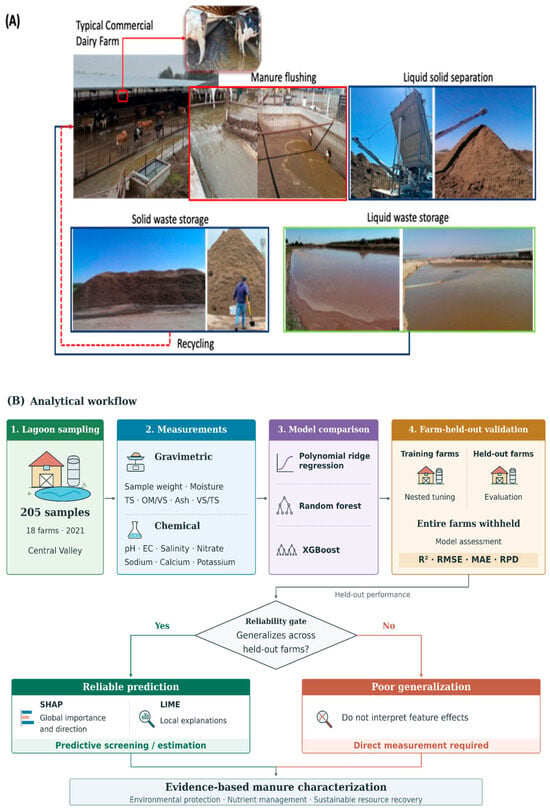
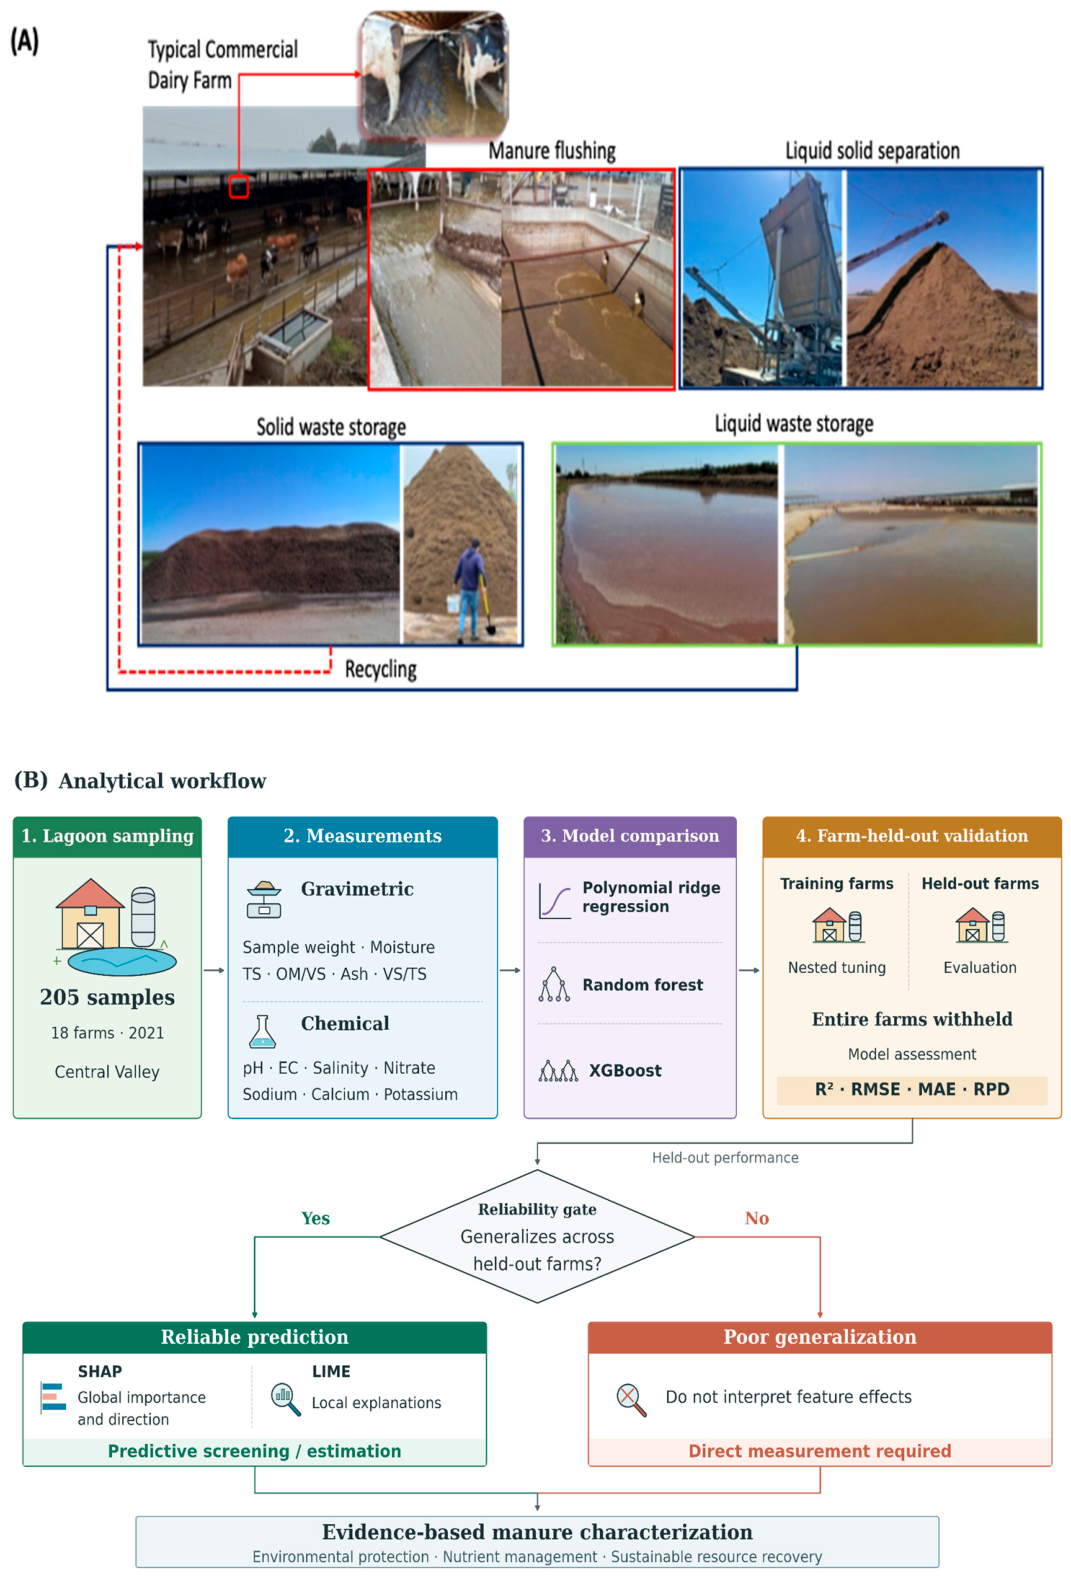
The field study was conducted over four years across 18 geographically dispersed commercial dairy farms in California’s Central Valley (Figure 1A). The present analysis was restricted to 205 lagoon-manure samples collected between 28 May and 26 August 2021, although sampling activities formed part of a broader four-year research program. Following collection, samples were transported to the laboratory on ice and stored under refrigeration at approximately 4 °C before analysis. Laboratory measurements were generally completed within a few days of collection. When analysis was delayed, samples were stored frozen at approximately −20 °C and thawed before measurement.
Figure 1.
Field setting and conceptual workflow for explainable machine-learning analysis of dairy-lagoon manure. (A) Commercial dairy production environment, manure conveyance, and wastewater-storage lagoons sampled in California’s Central Valley. The red dashed line indicates the solids being recycled back into the dairy farm. (B) Analytical workflow connecting 205 samples collected between May and August 2021 from 18 farms with gravimetric and chemical measurements, polynomial ridge regression, random forest, XGBoost, farm-held-out validation, and reliability-gated SHAP and LIME interpretation for predictive screening or direct-measurement decisions. The conceptual workflow diagram was developed with assistance from ChatGPT (OpenAI; GPT-5.6). The exact prompt(s) used were: “based on existing workflow, create a conceptual workflow.” The diagram was subsequently edited, scientifically verified, and approved by the authors.
Each dairy was treated as a farm-level grouping unit for sampling and model validation because individual farms represent complex production systems influenced by herd characteristics, dietary inputs, water use, manure-removal practices, solid–liquid separation, lagoon management, and local environmental conditions. Most participating dairies used flush-based systems to transport manure and wastewater from animal-production areas to storage lagoons. Manure production and composition vary with animal productivity, diet, nutrient intake, and farm-management practices, supporting the use of a geographically distributed, multi-farm sampling design [1,2].
The dataset comprised 205 samples with gravimetric measurements collected from 18 dairy farms. Chemical measurements were available for 155 records from 12 farms. Of these, 144 records could be matched with corresponding gravimetric measurements and were eligible for chemical-property modeling. The remaining 11 chemical records were not included in the matched dataset. Because measurement availability varied among analytes, the final number of observations used for each prediction task depended on the availability of complete predictor and response measurements, as reported in Section 3.3. In this study, dairy lagoons were considered dynamic storage environments rather than homogeneous vessels. Manure entering a lagoon may undergo dilution, settling, decomposition, microbial transformation, and nutrient loss, with the extent of these processes affected by storage duration, temperature, and lagoon-management conditions. Consequently, lagoon conditions can alter the concentrations and distributions of solids, organic matter, nitrogen compounds, dissolved ions, and other manure constituents [4,5,6]. Laboratory characterization included gravimetric and sensor-based measurements. After homogenization, a known wet mass of each manure sample was transferred to a pre-weighed dish. Moisture content, total solids (TS), volatile solids (VS), and fixed solids or ash were determined following U.S. EPA Method 1684. Samples were dried at 103–105 °C until constant mass was achieved. Mass lost during drying was used to calculate moisture content, whereas the remaining dry residue represented TS; both were expressed as percentages of the initial wet sample mass.
The dried residue was subsequently ignited at 550 °C for 2 h in a muffle furnace, cooled in a desiccator, and reweighed. Mass lost during ignition was reported as VS, which was used as the operational measure of organic matter, whereas the residue remaining after ignition represented fixed solids, nonorganic matter, or ash. While total solids are made up of organic matter and ash (OM = TS − ash), moisture content and total solids make up 100% of the sample, meaning the moisture content can be used to calculate total solids (TS = 100 − MC). The VS/TS ratio was calculated from the corresponding gravimetric measurements [35]. Liquid-phase properties were measured using LAQUAtwin pH-11, EC-11, Salt-11, NO3-11, K-11, Na-11, and Ca-11 pocket meters (HORIBA Advanced Techno Co., Ltd., Kyoto, Japan) [36]. These instruments measured pH, electrical conductivity, salinity, nitrate, potassium, sodium, and calcium, respectively. The HORIBA LAQUAtwin meters employ flat-sensor technology that permits rapid measurements using small sample volumes (typically less than 1 mL) with minimal sample preparation. Before each analytical session, the meters were calibrated using the manufacturer-provided standard solutions. Following thorough mixing, a sample aliquot was placed directly onto the cleaned flat sensor, and the reading was recorded after stabilization. Sensors were rinsed with deionized water between measurements. Results were expressed as dimensionless pH, electrical conductivity in mS cm−1, salinity in percent, and ion concentrations in mg L−1. Nitrate concentrations were reported as NO3− rather than NO3-N. This procedure facilitated rapid characterization of dairy-lagoon manure samples using portable analytical instruments.
The analytical framework connecting field sampling, predictive modeling, and explainability is presented in Figure 1B. Predefined predictor–response relationships were evaluated using polynomial ridge regression, Random Forest, and XGBoost regression, representing regularized polynomial, bagged-tree, and boosted-tree model families, respectively [25,26,28]. Farms were maintained as intact groups during cross-validation, ensuring that samples from a withheld farm did not contribute to model training, data preprocessing, or hyperparameter selection. Linear regression and Random Forest were evaluated using farm-held-out cross-validation. Random Forest used five outer folds, with hyperparameters optimized using four inner folds, whereas linear regression was fitted directly to the training data. Performance was calculated from pooled held-out predictions. The initial model comparisons were conducted before hyperparameter tuning, Section 3.3 present the final nested-validation results. Model performance was evaluated using the coefficient of determination (R2), root mean square error (RMSE), mean absolute error (MAE), and residual prediction deviation (RPD). Performance metrics were calculated from pooled held-out predictions across validation folds to assess generalization across participating farms [29,37]. However, these pooled metrics do not establish equivalent predictive accuracy for every individual farm.
Explainability analysis was conditional on demonstrated predictive reliability. Models showing adequate farm-held-out performance were interpreted using SHapley Additive exPlanations (SHAP) to quantify global and sample-level feature contributions and Local Interpretable Model-agnostic Explanations (LIME) to provide complementary local explanations [32,33]. When a manure property could not be predicted reliably across farms, its feature attributions were not considered scientifically dependable, and direct laboratory measurement remained the recommended approach. This validation-gated framework recognizes that SHAP and LIME explain model behavior and statistical associations but do not establish causal relationships [34]. The resulting workflow connects lagoon sampling, predictive modeling, and explainability to support preliminary screening and identify properties requiring direct laboratory measurement.
2.2. Predictive Modeling
2.2.1. Data Processing
For each dairy-lagoon manure sample, indexed by i, the predictor vector was denoted by xi. Depending on the prediction task, xi contained initial sample weight (SWi, g), moisture content (MCi, %), and total solids (TSi, %). The measured response, denoted by yi, represented the manure property being modeled, including gravimetrically determined organic matter or volatile solids (OMi, %), nonorganic matter or ash (NOMi, %), the volatile-to-total-solids ratio [(VS/TS)i], nitrate concentration [(NO3)i], sodium concentration (Nai), calcium concentration (Cai), salinity (Salti), or pHi. Predictor–response combinations were specified before model fitting. Organic matter and nitrate were modeled on the log(1 + y) scale (Section 3.4 and Section 3.5), and predictions were back-transformed (exp(ŷ) − 1) before R2, RMSE, MAE and RPD were calculated on the original measurement scale. No additional statistical bias correction was applied during back-transformation. All model-performance metrics were calculated using the back-transformed predictions and corresponding observed values on the original measurement scale. All data transformations, polynomial-feature construction, predictor scaling, and hyperparameter selection were performed within the training folds to prevent information from the evaluation data from influencing model development.
2.2.2. Polynomial Ridge Regression
Polynomial Ridge Regression was used as a regularized nonlinear baseline. The original manure measurements were expanded into polynomial terms to represent curvature and interactions among the predictors. Model coefficients were estimated by minimizing the residual sum of squares together with an L2 penalty:
where n is the number of manure samples in the training set; yi is the laboratory-measured response for sample i; zi is the polynomial expansion of the original predictor vector xi; β0 is the intercept; is the vector of regression coefficients; P is the number of polynomial and interaction terms; and λR is the Ridge regularization parameter. The predicted manure property was calculated as iPR = 0 + ziᵀ The regularization term reduced coefficient instability and limited overfitting, particularly when moisture content and total solids have exact complements (TS = 100 − MC) so they were included in the same model.
2.2.3. Random Forest Regression
Random Forest Regression was used to represent nonlinear predictor–response relationships without requiring a predetermined functional form. Multiple regression trees were fitted using bootstrap samples of the training data and randomly selected predictor subsets. The Random Forest prediction for manure sample i was calculated as the average of the individual tree predictions:
where is the Random Forest prediction for sample i; B is the total number of regression trees; Tb is the prediction generated by tree b; and xi contains the applicable gravimetric predictors for sample i. The number of trees, maximum tree depth, minimum number of observations required for node splitting, minimum terminal-node size, and number of candidate predictors considered at each split were selected within the model-tuning procedure. Averaging predictions across trees was used to reduce variance and improve prediction stability relative to an individual regression tree.
2.2.4. XGBoost Regression
XGBoost Regression was used as a sequential tree-based model in which each additional tree was fitted to reduce the prediction errors remaining from the preceding ensemble. The final prediction was expressed as:
where is the final XGBoost prediction for manure sample i; is the initial prediction, typically based on the average response in the training data; K is the number of boosting iterations; fk is the regression tree added during iteration k; and η is the learning rate controlling the contribution of each additional tree. Model complexity was controlled through the learning rate, maximum tree depth, minimum child weight, row subsampling, predictor subsampling, and regularization parameters. Hyperparameters were selected using only the training portion of each cross-validation iteration.
Polynomial Ridge Regression, Random Forest Regression, and XGBoost Regression were fitted to the same predefined predictor–response relationships. Their performance was evaluated using predictions generated for observations excluded from model fitting. This common evaluation structure allowed differences among the three model families to be attributed to their modeling characteristics rather than to differences in data partitioning or preprocessing.
2.3. Explainable Artificial Intelligence
2.3.1. SHAP Attribution
After model evaluation, SHapley Additive exPlanations were calculated for the selected model to quantify the contribution of each manure measurement to an individual prediction. For predictor j and manure sample i, the SHAP value was calculated from the predictor’s average marginal contribution across all possible subsets of the remaining predictors:
where F is the complete set of predictors included in the fitted model; S is a subset of predictors that does not contain predictor j; M is the total number of predictors, such that M = |F|; and |S| is the number of predictors in subset S. The term fS(xi) represents the expected model output when the predictors in subset S are fixed at their observed values for sample i and the remaining predictors are represented using the SHAP background distribution. The term fS∪{j}(xi) represents the corresponding expected output after predictor j is added to subset S. The value φij is the SHAP contribution of predictor j to the prediction for sample i, and φ0 is the expected model output over the background data and serves as the baseline prediction. A positive SHAP value indicates that the predictor increases the predicted manure property relative to the baseline, whereas a negative SHAP value indicates that it decreases the prediction.
For tree-based models, SHAP values were obtained using a tree-specific explainer. Global predictor importance was summarized using the mean absolute SHAP value across all evaluated samples, whereas local SHAP decompositions were used to account for individual manure-sample predictions. When a response variable was modeled after logarithmic transformation, SHAP values were calculated on the fitted model’s transformed output scale to preserve the additive relationship defined in Equation 4b. Predictions used for performance evaluation were returned to the original measurement scale. Because moisture content and total solids are deterministically related (TS = 100 − MC), their individual attribution values cannot be interpreted as independent physical effects. Accordingly, these variables were treated as a combined moisture–solids feature group when presenting SHAP and LIME explanations. The resulting grouped attribution represents their joint contribution to model predictions rather than separate causal effects.
2.3.2. LIME Local Explanation
Local Interpretable Model-agnostic Explanations were used as an independent local check of the SHAP interpretation. For a selected manure sample, LIME generated perturbed observations in the neighborhood of that sample, obtained predictions from the fitted model, assigned greater weights to perturbations closer to the original sample, and fitted a simple local surrogate model:
where is the optimal local surrogate model selected for sample i; G is the class of candidate interpretable surrogate models; Zi is the set of perturbed observations generated around the original manure sample i; u represents an individual perturbed observation; f(u) is the prediction generated by the fitted Polynomial Ridge, Random Forest, or XGBoost model; g(u) is the corresponding prediction generated by the local surrogate model; πi(u) is a proximity weight that decreases as u moves farther from sample i; and Ω(g) is a complexity penalty favoring a simple and interpretable local explanation.
Continuous predictors were discretized into quartile-based intervals, and 5000 proximity-weighted perturbations were generated for each selected local explanation. LIME and local SHAP were applied to the same fitted prediction function and predictor set so that the direction and relative importance of the predictors could be compared consistently. Both methods were used to describe model behavior and were not interpreted as establishing causal relationships among manure characteristics.
2.3.3. Applicability-Domain Assessment
An applicability-domain assessment was performed to evaluate the similarity of held-out manure samples to the predictor distributions represented in the training farms. For each outer cross-validation fold, Mahalanobis distances were calculated using two independent physical predictors: log-transformed total solids [ln(1 + TS)] and sample weight. Moisture content was excluded because it is mathematically complementary to total solids. The mean vector and covariance matrix were estimated exclusively from the training-fold samples. A small diagonal regularization term (10−8) was added to the covariance matrix, and its pseudoinverse was used to calculate Mahalanobis distances. The applicability-domain threshold was defined as the 95th percentile of the Mahalanobis distances calculated for the training samples. Each held-out sample’s distance was divided by this threshold to obtain a normalized distance ratio. Ratios ≤ 1 indicated samples within the defined training-data domain, whereas ratios > 1 indicated samples outside this domain. This assessment was performed separately within each outer fold to avoid information leakage. Applicability-domain membership was interpreted as a measure of predictor-space similarity rather than a guarantee of prediction accuracy.
2.4. Materials & Instruments
All chemicals, analytical reagents, calibration standards, and laboratory consumables used in this study were purchased through Thermo Fisher Scientific (Waltham, MA, USA), unless otherwise specified. All analyses were performed in Google Colaboratory using Python (version 3.13.18; Python Software Foundation, Beaverton, OR, USA) and the scikit-learn (version 1.9.1), XGBoost (version 3.4.1), SHAP (version 0.54.1), and LIME (version 0.2.0.1) packages.
3. Results
3.1. Dataset Characteristics and Measurement Availability
3.1.1. Gravimetric Characteristics
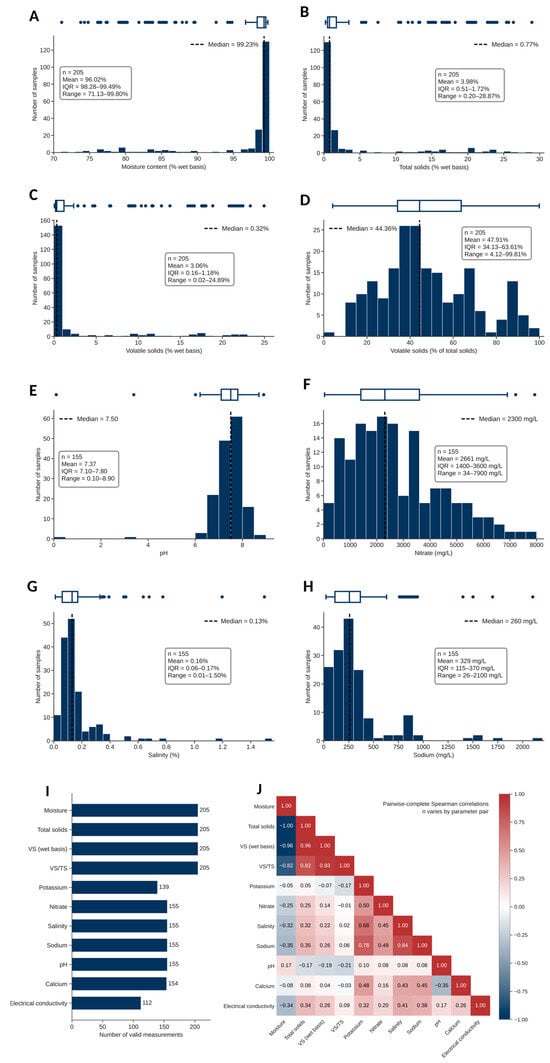
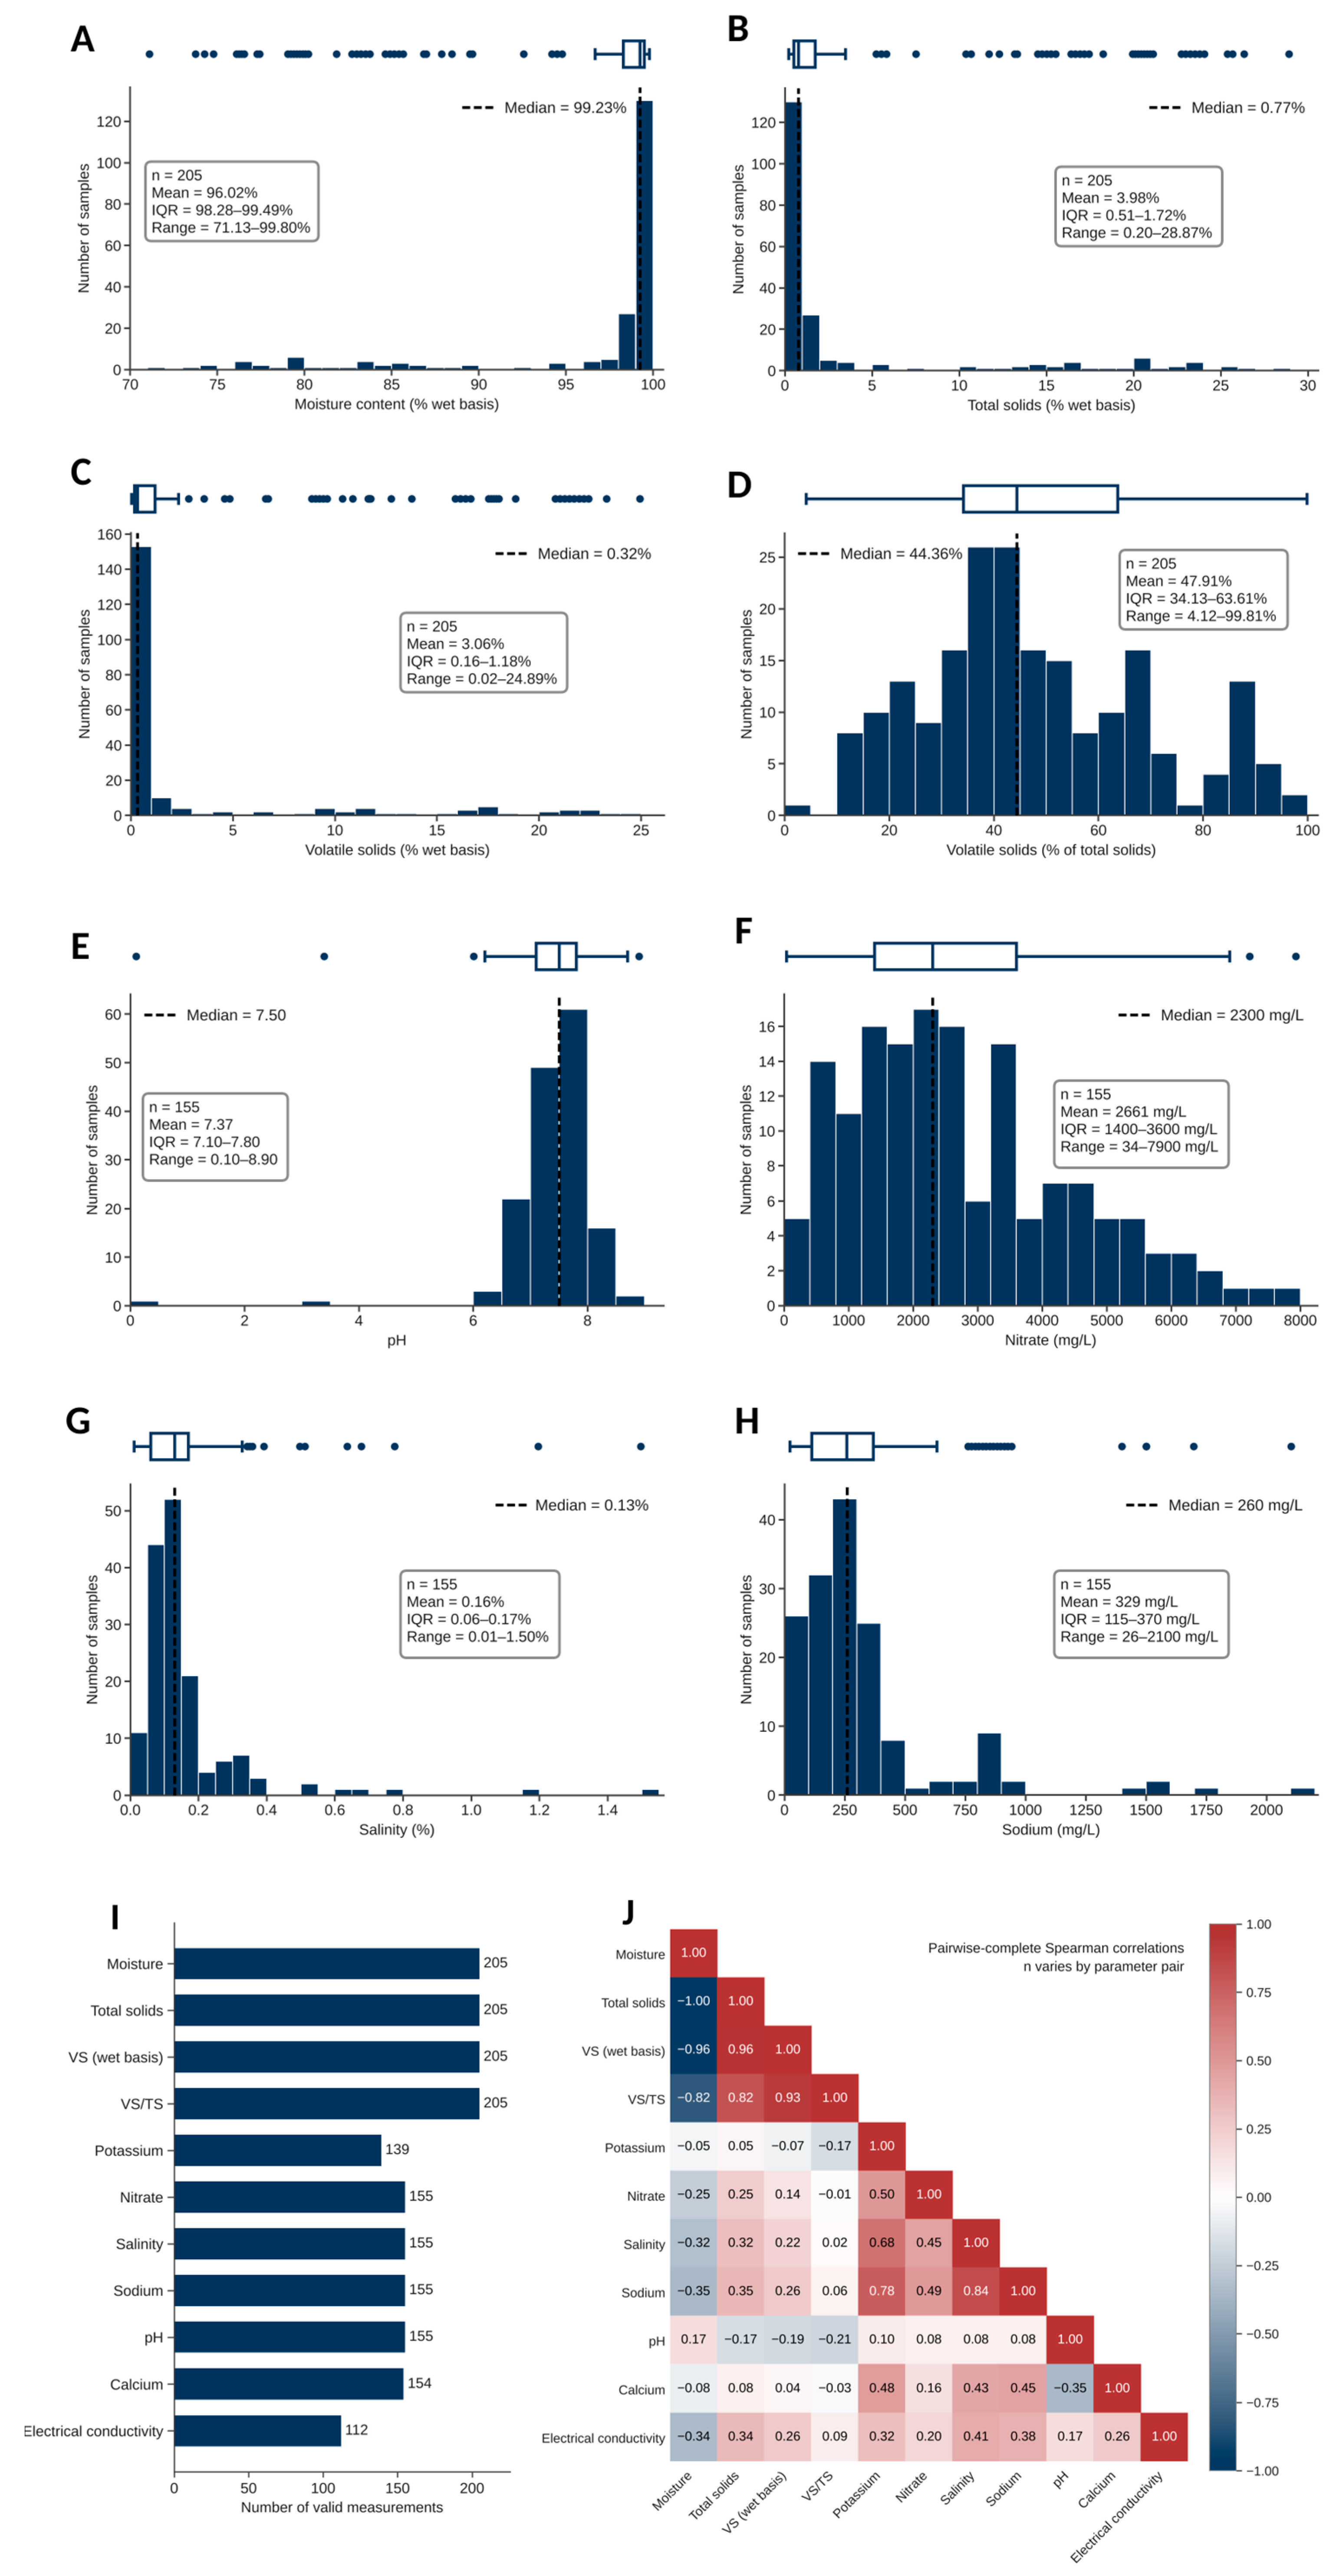
The dataset comprised 205 lagoon-manure samples from 18 farms in California’s Central Valley. Because measurement availability differed among variables, analytical sample sizes were lower for some descriptive and predictive analyses. As shown in Figure 2A,B, the samples were predominantly liquid and characterized by high moisture content, with a median of 99.23% wet mass and a corresponding median total-solids content of 0.77%. Gravimetric organic matter/volatile solids had a median concentration of 0.32% wet mass, whereas the median VS/TS ratio was 44.36%. The mean VS/TS ratio (47.91%) was calculated by averaging the ratios determined for individual samples rather than dividing the overall mean organic matter content (3.06%) by the overall mean total solids content (3.98%); consequently, these two calculations yield different values. The broad and asymmetric distributions of total solids and OM/VS indicate that, although most lagoon samples were highly dilute, a higher concentration of solids and organic matter is seen in some lagoon samples [2,14]. The dataset also included samples with substantially greater solids and organic-matter contents (Table 1; Figure 2B, C) [1,2]. As VS/TS increases with solids content (Figure 2J), the mean of the VS/TS ratios (47.91%) was lower than the ratio of mean organic matter to mean total solids (3.06/3.98 = 76.9%).
Figure 2.
Physicochemical characteristics and measurement availability of dairy-lagoon manure samples collected from Central Valley dairy farms in California. (A) Moisture content, (B) total solids, (C) volatile solids (organic matter), and (D) volatile-solids-to-total-solids ratio (VS/TS), based on 205 samples from 18 farms. (E) pH, (F) nitrate, (G) salinity, and (H) sodium distributions for the chemical measurements (155 records from 12 farms). One anomalously low pH reading (0.10), attributed to probable instrument error, was excluded from the corrected pH analysis (n = 15). (I) Availability of individual physicochemical measurements across the dataset before the pH exclusion. (J) Correlation matrix illustrating relationships among measured physicochemical variables. Together, these panels summarize the variability, measurement coverage, and interrelationships of manure characteristics used to support model development and interpretation.
Table 1.
Dataset composition and descriptive statistics. Measurement availability and descriptive statistics for dairy-lagoon manure samples collected from geographically dispersed commercial dairy farms in California’s Central Valley.
3.1.2. Chemical Characteristics
Overall chemical measurements exhibited distinct distributional patterns (Figure 2E–H). Among the 155 samples with chemical measurements, pH was comparatively constrained around neutral to mildly alkaline conditions, with a median of 7.50. In contrast, nitrate readings were broadly distributed and right-skewed, with a median of 2300 mg L−1 and a relatively small number of substantially higher observations. Salinity had a median of 0.13%, with most values concentrated at the lower end of the measured range, whereas sodium had a median reading of 260 mg L−1 and a pronounced upper tail. These distributions indicate heterogeneity in the dissolved chemical characteristics of dairy-lagoon manure [4,6]. These characteristics can be influenced by on-farm manure management practices, dietary inputs, manure dilution, biological reactions, and manure storage conditions [3,7,8].
3.1.3. Measurement Availability
Measurement availability differed substantially between the gravimetric and chemical variables (Figure 2I). Moisture, total solids, OM/VS, and VS/TS were available for all 205 samples, establishing a complete gravimetric core dataset. In comparison, pH, nitrate, salinity, and sodium were available for 155 samples, calcium for 154, potassium for 139, and electrical conductivity for 112. Figure 2I therefore distinguishes a complete gravimetric dataset from smaller and partially overlapping chemical-measurement subsets. Potassium and electrical conductivity were excluded from predictive modeling because fewer samples and farms were available for these measurements, limiting reliable farm-held-out validation. These differences were treated as variations in analytical coverage. Accordingly, each predictor–response relationship was constructed only from samples containing the required measurements.
3.2. Dependence Among Gravimetric Measurements
The dependence structure (shown in Figure 2D) determined from 144 records further distinguished physically linked measurements from chemically independent properties (Figure 2D). Moisture and total solids were perfectly inversely related (Spearman’s ρ = −1.00) because TS = 100 − MC. Total solids were positively associated with VS/TS (ρ = 0.82), whereas moisture showed the corresponding negative association (ρ = −0.82).
3.3. Cross-Validated Predictive Performance
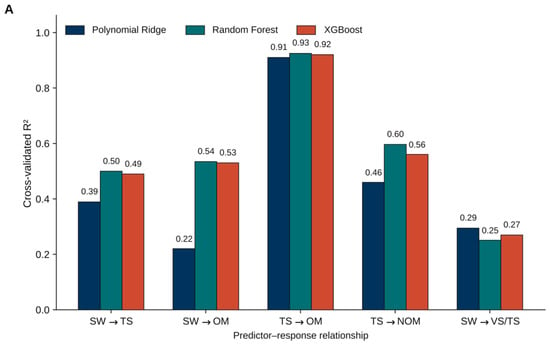
The initial cross-validated comparison revealed substantial differences in predictive performance among the five predictor–response relationships (Figure 3A). Polynomial Ridge Regression, Random Forest, and XGBoost represent regularized regression, tree averaging, and sequential gradient boosting, respectively [25,26,28]. The strongest relationship was obtained when total solids were used to predict organic matter/volatile solids, producing R2 values of 0.911, 0.926, and 0.921 for Polynomial Ridge Regression, Random Forest, and XGBoost, respectively.
Figure 3.
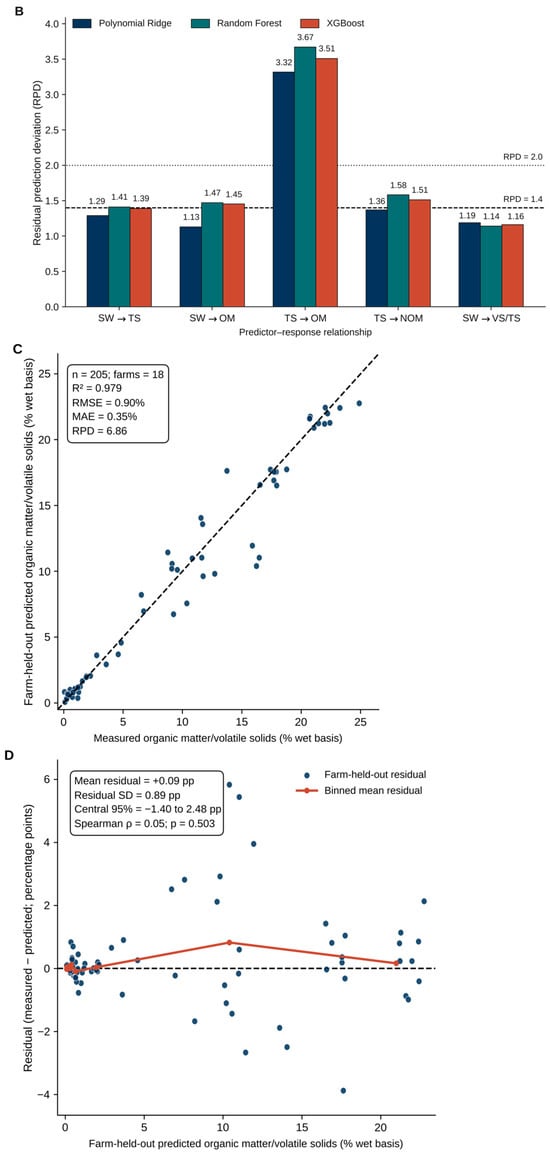
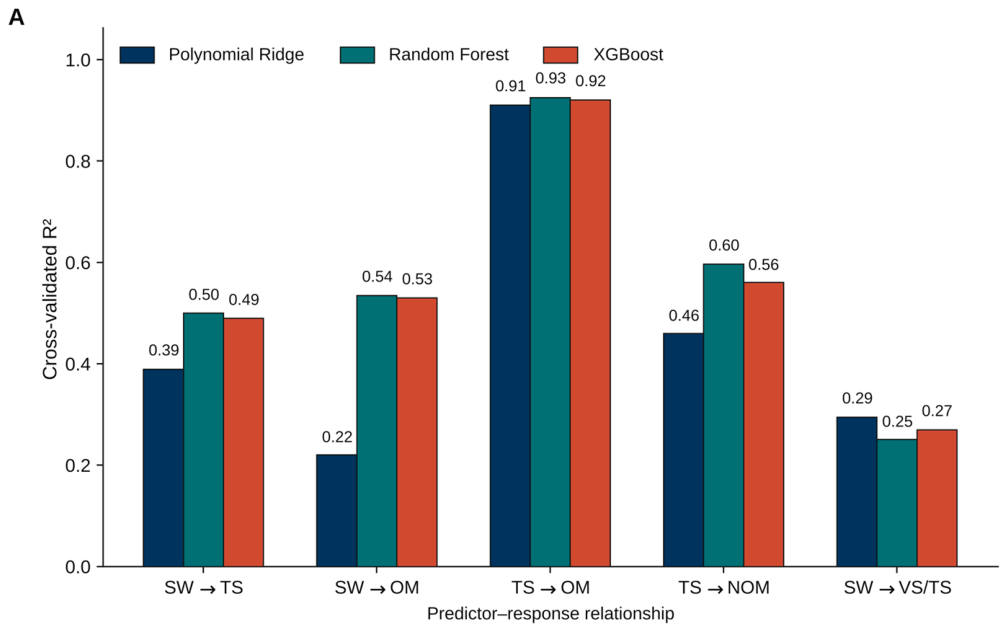
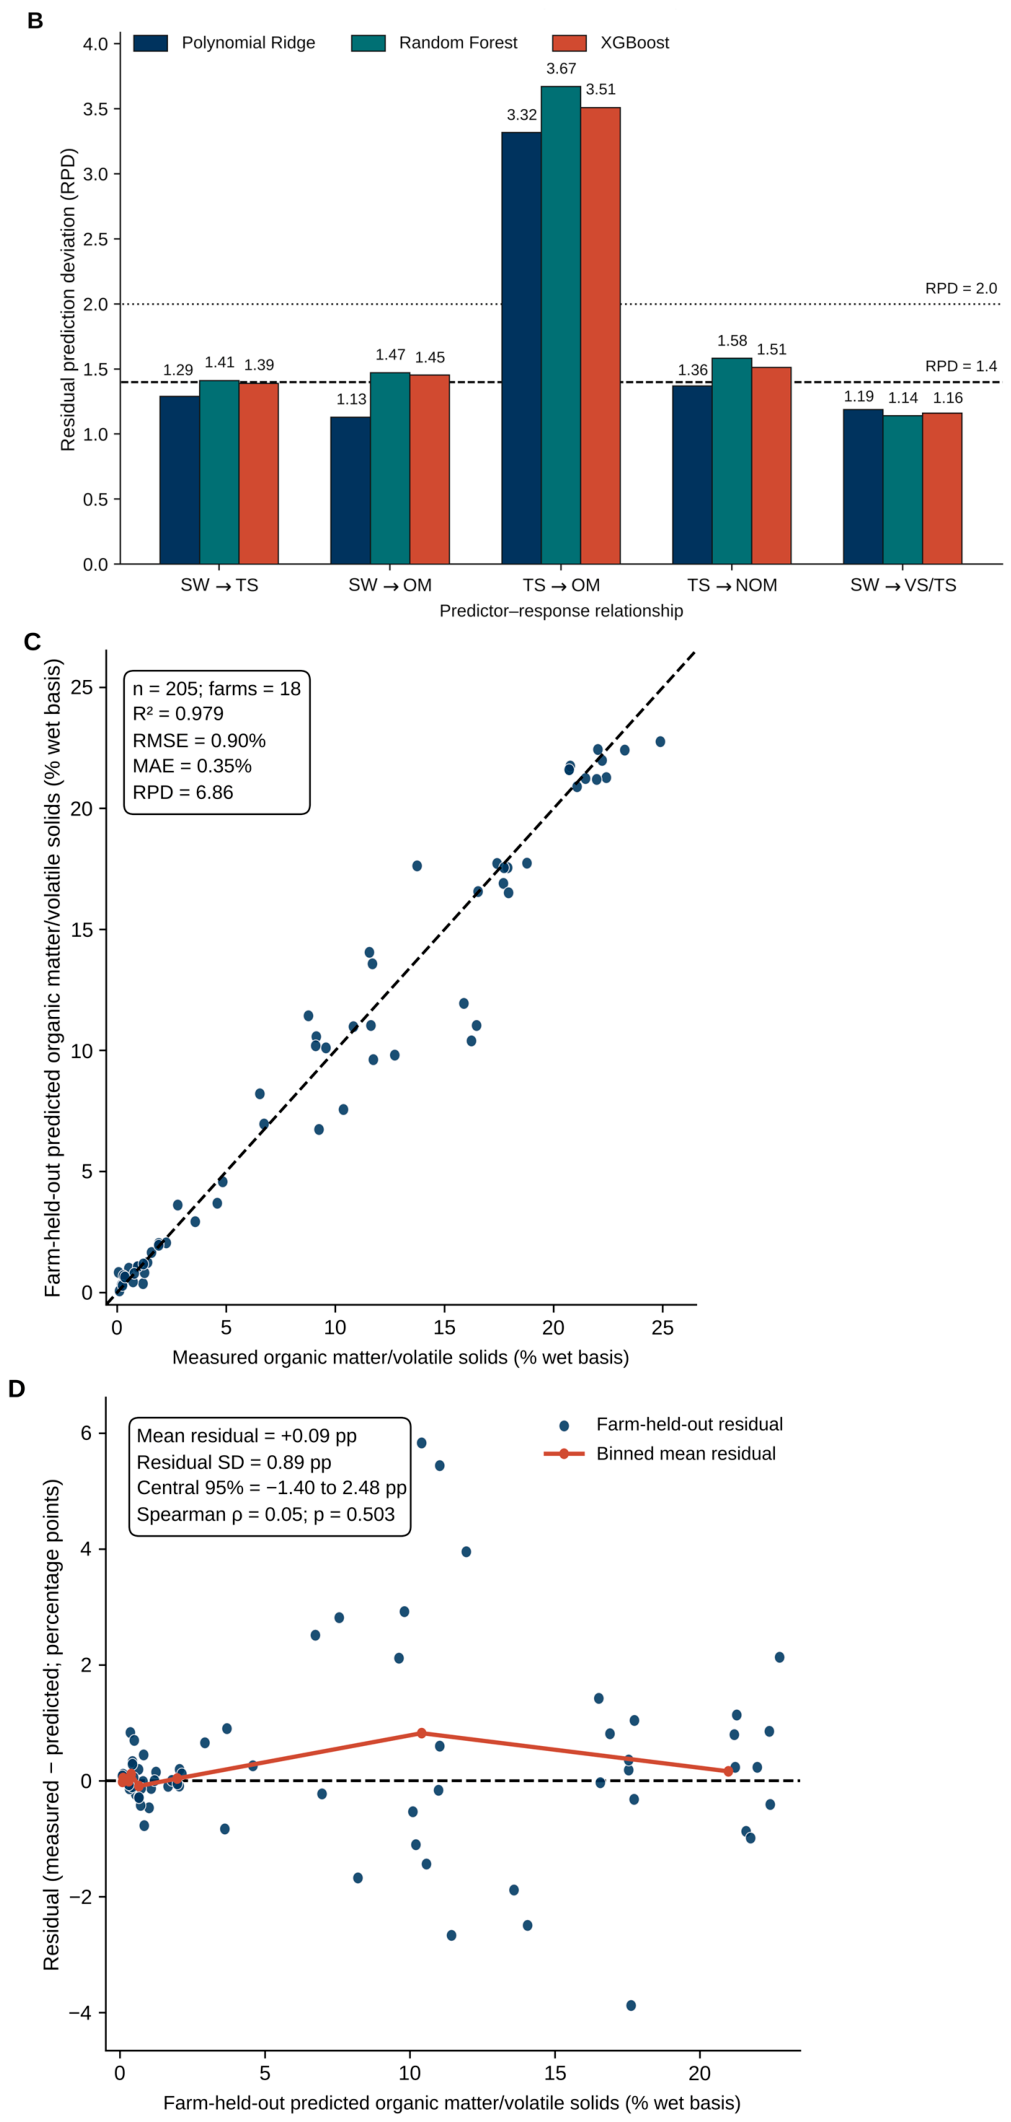
(A,B). Comparative predictive performance of Polynomial Ridge Regression, Random Forest, and XGBoost across five predictor–response relationships. (A) Cross-validated coefficient of determination (R2). (B) Residual prediction deviation (RPD), calculated from the observed response standard deviation and cross-validated root-mean-square error; horizontal lines at RPD = 1.4 and 2.0 provide approximate reference levels for screening and useful quantitative prediction, respectively. SW, initial sample weight; TS, total solids; OM, organic matter/volatile solids; NOM, nonorganic matter or ash; and VS/TS, volatile-solids-to-total-solids ratio. (C,D). Farm-held-out validation of the Random Forest model predicting organic matter/volatile solids from total solids. (C) Laboratory-measured versus farm-held-out predicted organic matter/volatile solids on a wet-mass basis. Predictions were generated through nested grouped cross-validation (Table 2). (D) Farm-held-out residuals calculated as measured minus predicted values. The dashed horizontal line indicates zero residual, and the red line represents binned mean residuals across the prediction range.
The consistently high performance across all three model families indicates that this relationship was structurally strong and was not dependent on a single modeling algorithm. This result is scientifically reasonable because organic matter constitutes a major fraction of total solids and both measurements were expressed relative to the original wet sample mass. Random Forest also produced the highest R2 for sample weight–total solids (0.50), sample weight–organic matter (0.535), and total solids–nonorganic matter (0.597), although its advantage over XGBoost was generally small. Previous studies have similarly shown that successful prediction of manure chemical properties depends on composition-sensitive analytical information rather than nonspecific physical measurements alone [7,8]. The comparable Random Forest and XGBoost performance suggests that sequential boosting provided limited additional benefit over ensemble averaging for these data. Prediction of VS/TS from sample weight remained weak for all three models (R2 = 0.25–0.295), indicating that initial sample weight is a procedural quantity and, by itself, contains insufficient compositional information to characterize the relative organic fraction of the solids.
The stratified error analysis demonstrated that predictive accuracy depended on total-solids concentration. Although absolute errors were smaller for dilute samples, their relative errors were substantially greater because of the low organic-matter concentrations. Conversely, concentrated samples showed larger absolute errors but smaller relative errors. These findings indicate that aggregate model-performance statistics should not be interpreted as uniform accuracy across the full concentration range.
Following the initial model comparison, the total-solids-to-organic-matter relationship was examined using a tuned Random Forest model and nested farm-grouped cross-validation (Figure 3C). Complete farms, rather than individual observations, were withheld during each outer validation fold, ensuring that every prediction was generated for a sample from a farm excluded from model training. Separating complete farms during validation reduced information leakage between training and evaluation data, while nested model tuning limited optimistic performance estimates associated with selecting and evaluating a model on the same observations [37,38]. Across 205 samples from 18 farms, measured and farm-held-out predicted organic matter/volatile solids values showed close agreement, with R2 = 0.979, RMSE = 0.90, MAE = 0.35, and RPD = 6.86. These are the total-solids values in Table 2; Table 2 also shows R2 = 0.975 where sample weight, moisture and total solids are used together. The model retained predictive performance across the broad observed concentration range, although most observations occurred at relatively low organic-matter concentrations. As organic matter was strongly right-skewed, R2 and RPD are dominated by the solids-rich samples and overstate accuracy for the dilute samples that make up most of the dataset. Because organic matter and total solids were both determined gravimetrically and expressed on a wet-mass basis, this strong relationship represents a reproducible compositional association rather than evidence of a causal effect [7,8]. Both the linear-regression benchmark and Random Forest were evaluated using predictions for farms excluded from model training. Although the validation schemes differ, both evaluate predictions for farms excluded from model training. Their similar performance suggests that the more complex Random Forest model provides limited additional predictive benefit for estimating organic matter from total solids. Residual diagnostics provided further evidence regarding the reliability and limitations of the farm-held-out predictions (Figure 3D). Examining residual structure is important because aggregate performance metrics can conceal concentration-dependent errors and poor prediction within sparsely represented regions of the response domain [39]. Similar challenges arising from unmeasured farm-level heterogeneity have been reported in data-driven agricultural modeling [9]. The mean residual, calculated as measured minus predicted organic matter, was +0.09 percentage points, indicating negligible overall underprediction, while the residual standard deviation was 0.89 percentage points. The central 95% of residuals ranged from −1.40 to +2.48 percentage points, and residuals were not significantly associated with predicted values (Spearman ρ = 0.05; p = 0.503), indicating no consistent monotonic prediction bias. Nevertheless, the residual spread increased among samples with higher organic-matter concentrations, where observations were comparatively sparse. The asymmetric residual interval reflects underprediction among sparsely represented, solids-rich samples (Figure 3D); while the Spearman test indicates no overall monotonic trend, it does not rule out heteroscedasticity or larger errors at high concentrations. The model therefore demonstrated strong predictive reliability within the well-represented portion of the dataset, while predictions for unusually high organic-matter samples should be interpreted with greater caution.
Table 2.
Farm-held-out predictive performance of machine-learning models and simple benchmarks for estimating gravimetric and chemical properties of dairy-lagoon manure. Performance metrics include the coefficient of determination (R2), root mean square error (RMSE), mean absolute error (MAE), and residual prediction deviation (RPD). Sample sizes and the number of participating farms are reported separately for each prediction task. Sample sizes differ between Table 1 and Table 2 because Table 2 includes only samples with complete measurements needed for modeling.
While the Random Forest model was able to outperform the entity-based benchmarks (R2 = 0.956 and 0.746), it performed similarly to linear regression on total solids (R2 = 0.980 vs. 0.979; RMSE = 0.87 vs. 0.90 percentage points; Table 2). Linear regression MAE increased from 0.12 (<1% TS) to 0.27 (1–10% TS) and 1.67 (>10% TS), representing 56%, 21%, and 11% of mean organic matter, respectively. These results show that even small absolute prediction errors can be substantial relative to organic-matter concentrations in dilute samples, limiting their use for quantitative screening. The similar results indicate no clear predictive advantage for the more complex model.
3.4. Global Model Explainability
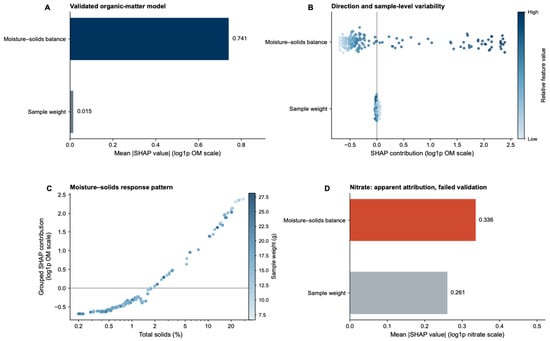
The grouped SHAP analysis demonstrated that predictions from the validated organic-matter model were controlled primarily by the moisture–solids balance (Figure 4A,B). SHAP provides an additive framework for quantifying the contribution of individual predictors to model outputs and for summarizing those contributions globally across observations [31,32]. The model included sample weight, moisture, and total solids and achieved a nested farm-held-out R2 of 0.975 and RMSE of 0.97 percentage points across 205 samples from 18 farms. Because moisture and total solids were mathematically complementary, their contributions were evaluated jointly to avoid assigning misleading importance to two collinear variables. The mean absolute SHAP value of the moisture–solids group was 0.741 on the log(1 + organic matter) scale, approximately 50 times the corresponding value for sample weight (0.015). Across individual samples, moisture–solids contributions ranged from −0.694 to +2.388, whereas sample-weight contributions remained between −0.039 and +0.070. These results indicate that variation in predicted organic matter was driven by manure composition rather than by the quantity of material used for laboratory analysis.
Figure 4.
Global SHAP interpretation of Random Forest predictions. Panels (A–C) show dominance of the moisture–solids balance over sample weight (mean |SHAP| = 0.741 versus 0.015) for validated organic-matter predictions (n = 205; 18 farms; farm-held-out R2 = 0.975). Panel (D) presents nitrate SHAP attributions as a negative example of an unreliable model (n = 144; R2 = −0.32); these attributions should not be interpreted as reliable feature importance.
The SHAP dependence pattern further clarified the direction and nonlinearity of this relationship (Figure 4C). The grouped moisture–solids contribution increased strongly with total solids (Spearman ρ = 0.993), shifting from negative to positive at approximately 1.8–2.0% total solids. Samples containing less than approximately 1% total solids generally decreased predicted organic matter relative to the model baseline, whereas samples containing more than 10% total solids had a mean grouped SHAP contribution of approximately +1.99 on the log-transformed output scale. This pattern is scientifically consistent with organic matter constituting a major component of the solid fraction of dairy-lagoon manure. However, the relationship should be interpreted as a compositional and predictive association because total solids and organic matter share the same wet-mass basis and are not experimentally independent quantities. Previous manure-characterization studies have similarly demonstrated that solids content contains substantial information about manure organic and chemical composition, although storage conditions and decomposition processes can modify these relationships [6,7].
3.5. Explainability Reliability Check and Local Explanations
Figure 4D was used as an explainability reliability check rather than as a conventional feature-importance result. Explainable-AI outputs describe the behavior of the fitted algorithm rather than independently verifying the underlying environmental relationship; consequently, scientific interpretation requires adequate predictive validation [34,40]. Explainable-AI here is applied as a rule that limits interpretation to models validated on unseen farms. This caution is especially relevant in agricultural datasets, where substantial data volume may still provide limited explanatory or predictive power across farms [9]. The nitrate model assigned apparent mean absolute SHAP values of 0.336 to the moisture–solids balance and 0.261 to sample weight; however, nested farm-held-out validation produced R2 = −0.318 and RMSE = 1975 mg/L for 144 samples from 12 farms. The negative R2 indicated that the measured physical properties did not provide a transferable basis for predicting nitrate across farms. Nitrate concentrations may instead reflect unmeasured influences, including feed composition, water inputs, lagoon dilution, storage conditions, residence time, and microbial nitrogen transformations. Accordingly, the SHAP values accurately described the behavior of the fitted algorithm but did not establish stable or scientifically defensible feature–response relationships. Withholding interpretation in this situation demonstrates a validation-gated XAI approach that prevents plausible-looking model explanations from being mistaken for reliable environmental evidence.
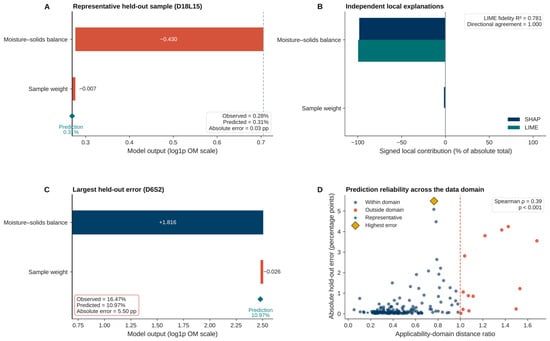
Figure 5 demonstrates how local explanation should be evaluated together with prediction reliability. For the representative farm-held-out sample D18L15, the model closely reproduced the measured organic matter (observed = 0.28%; predicted = 0.31%; absolute error = 0.03 percentage points). SHAP and LIME consistently identified the moisture–solids balance as the dominant negative contribution, while sample weight had little influence; the methods showed complete directional agreement, and the LIME surrogate achieved a local fidelity R2 of 0.781 (Figure 5A,B). In contrast, sample D6S2 had the largest held-out error, with an observed value of 16.47% and a prediction of 10.97%, despite remaining within the defined applicability domain (Figure 5C,D). Across all samples, applicability-domain distance was moderately associated with absolute error (Spearman ρ = 0.39, p < 0.001; Figure 5D). These results show that domain membership alone does not guarantee accuracy and that SHAP or LIME explanations should be interpreted only alongside validation performance, sample-level error, and applicability-domain information.
Figure 5.
Local explanation and reliability of farm-held-out organic-matter predictions. (A) Grouped SHAP attribution for representative sample D18L15 (observed = 0.28%; predicted = 0.31%; absolute error = 0.03 percentage points); the grey dashed line indicates the SHAP baseline. (B) Comparison of signed SHAP and LIME contributions for D18L15 (directional agreement = 1.000; LIME fidelity R2 = 0.781). (C) SHAP attribution for the largest-error sample, D6S2 (observed = 16.47%; predicted = 10.97%; absolute error = 5.50 percentage points). (D) Applicability-domain distance versus absolute prediction error (Spearman ρ = 0.39, p < 0.001); the red dashed line denotes the domain boundary (distance ratio = 1; samples above 1 lie outside the domain of the training farms).
4. Discussion
4.1. Comparison with Previous Studies
Table 2 summarizes where the models provided useful predictions and where their performance was insufficient. The nine predictor–response relationships were divided into two groups using cross-validated R2 and RPD: a capability block for predictable gravimetric properties and a limitation block for chemical properties that still required direct measurement. Cross-validation was used to reduce the overly optimistic results that can occur when a model is evaluated using data involved in its development [29,37]. Gravimetric properties were more predictable because the inputs and responses shared closely related compositional information. In contrast, nitrate, sodium, calcium, salinity, and pH were influenced by farm and lagoon conditions not represented by sample weight, moisture, and total solids. Previous manure studies have likewise shown that reliable prediction depends on using measurements that contain relevant compositional information [7,8]. Thus, the limitation block provides a practical reason to retain direct chemical measurements and highlighting the limitations of machine learning ability to compensate for missing chemical information. In comparison with studies that used spectroscopy to predict multiple properties [14,15,16,22], that require specialized equipment and calibration which makes the gravimetric screening approach with machine learning a more cost-efficient approach with predictive limitations (Table 3).
Table 3.
Contextual comparison of the present farm-validated model with representative machine-learning studies of manure-derived and related organic materials.
Within the capability block, organic matter/volatile solids were the most predictable gravimetric property. Models using total solids alone or the combined gravimetric inputs produced farm-held-out R2 values of approximately 0.97–0.98 and RPD values greater than 6 and adding sample weight and moisture did not improve on total solids alone (R2 = 0.975 versus 0.979; Table 2). This result indicates that total solids carried most of the information used to estimate organic matter, which agrees with the SHAP findings in Figure 4. The strong performance is also scientifically reasonable because organic matter forms part of the total-solid fraction and both measurements were expressed on a wet-mass basis. As OM = TS − ash, the organic-matter and ash models using gravimetric inputs had similar absolute error (RMSE = 0.97 vs. 0.92), while their different R2 values (0.975 vs. 0.472) reflect their different response variances (Table 2).
Because moisture content and total solids are mathematically complementary (MC + TS = 100%), including both variables does not provide independent information. The TS-only Random Forest model achieved R2 = 0.979, compared with R2 = 0.975 for the model using all gravimetric predictors. These findings demonstrate that including moisture content alongside total solids did not improve predictive performance, supporting the use of total solids alone for simplified organic-matter screening. Although the model showed good overall performance, its predictions were less accurate relative to organic-matter concentrations in dilute samples. Therefore, direct laboratory measurement is recommended when accurate results are needed.
Prediction of VS/TS was more moderate (R2 approximately 0.59; RPD approximately 1.57), supporting only screening-level use, whereas ash prediction remained weak to borderline (R2 approximately 0.47; RPD approximately 1.38). For VS/TS, an RMSE of 13.72 percentage points (approximately 29% of the mean) indicates that the model is suitable only for preliminary screening to distinguish broadly low and high organic fractions and prioritize samples for laboratory confirmation, rather than for precise quantitative determination. These properties are more sensitive to feed composition, mineral content, settling, decomposition, and lagoon-storage conditions that cannot be fully described by bulk gravimetric measurements [2,6].
4.2. Practical Implications and Study Limitations
These findings support the use of routinely measured total solids as a preliminary screening variable for estimating organic matter in dairy-lagoon manure and prioritizing samples for detailed laboratory analysis. Because total solids must first be determined by drying, the potential analytical benefit is limited to avoiding the subsequent ignition step at 550 °C for 2 h. The total-solids-only Random Forest model achieved an RMSE of 0.90 percentage points, suggesting that an error of approximately one percentage point may be useful for preliminary identification of solids-rich samples, depending on the intended screening decision. However, this error is not an independently validated acceptance threshold and may be substantial relative to organic-matter concentrations in dilute samples. Actual reductions in analytical time, labor, energy consumption, and cost were not quantified in this study. Therefore, predicted organic matter should not replace direct measurement when precise concentrations are required. Nitrate, sodium, calcium, salinity, and pH should continue to be measured directly because their cross-farm predictive performance was inadequate.
Unlike spectroscopic approaches that require specialized instrumentation and calibration, the proposed screening approach uses total-solids measurements already obtained during routine gravimetric analysis. Its practical benefit is therefore limited to reducing the need for an additional ignition step when approximate organic-matter estimates are sufficient. It does not eliminate sample drying or replace laboratory determination where accurate organic-matter concentrations are required. This distinction is particularly important for dilute samples, where relatively small absolute prediction errors can produce substantial relative uncertainty. The dataset included 205 samples from 18 commercial dairies and provided strong coverage of moisture, total solids, and organic matter, although fewer chemical measurements were available. Although portable sensors offer a practical approach for rapid nutrient characterization, measurements in complex manure matrices may be affected by suspended solids, ionic interference, and other matrix-related effects. Routine calibration improves measurement reliability but does not eliminate these potential sources of uncertainty. Such variability may contribute to the limited predictive performance observed for chemical parameters. Direct comparison with laboratory reference methods, including ion chromatography, would help quantify these uncertainties in future studies. In addition, future research should add diet, water-use, storage-duration and weather data as predictors for the chemical properties. Farm-held-out validation reduced information leakage, but most samples originated from dairies using flush manure-removal systems and lagoon storage; therefore, the findings may not represent other manure-management systems or environmental conditions, a recognized challenge in agricultural modeling [9]. Although farm-held-out validation evaluates predictive performance across independent farms within the study population, it does not establish generalizability to other geographical regions, sampling seasons, or manure-management systems. Furthermore, the absence of detailed information on animal diet, storage duration, and lagoon redox conditions limits the interpretation of chemical variability. Measurement uncertainty associated with portable sensors in complex manure matrices may also have contributed to the poor predictive performance of chemical parameters. Future studies should incorporate these additional variables, compare portable-sensor measurements with laboratory reference methods, and evaluate model performance using independent datasets from different regions and seasons. Moreover, SHAP and LIME describe model behavior and associations rather than causal processes [34]. Although farm-grouped cross-validation evaluated prediction performance on farms excluded from model training, the pooled performance metrics may obscure differences among individual farms. Variation in manure-management practices, lagoon conditions, and sample characteristics may influence farm-specific prediction errors. Future studies should examine farm-level performance using larger and more geographically diverse datasets. Accordingly, this framework should be viewed as a decision-support and measurement-prioritization tool, not as a replacement for laboratory analysis. Its principal contribution is demonstrating when low-cost prediction is defensible and when direct measurement remains essential. Although the broader research program extended over four years, the 205 samples analyzed in this study were collected during a single sampling season (May–August 2021). Consequently, the dataset did not support independent year-to-year temporal validation. Farm-held-out cross-validation was used to evaluate model transferability across participating dairy farms; however, temporal generalizability remains untested. Future investigations incorporating samples collected across multiple years and seasons would help establish model robustness under changing environmental and manure-management conditions.
5. Conclusions
Commercial dairy farms sustain food production and regional economies, yet their lagoon systems contain heterogeneous manure wastewater whose composition must be understood for environmental protection and resource recovery. This study examined whether explainable artificial intelligence could complement laboratory characterization without obscuring the limits of prediction. This study evaluated 205 lagoon-manure samples collected from 18 geographically dispersed commercial dairy farms in California’s Central Valley between May and August 2021. All 205 samples supported the gravimetric analyses, and up to 144 matched samples from 12 farms supported the chemical analyses. The results revealed a clear boundary between properties governed by physical composition and those controlled by chemical and biological processes. Using farm-held-out validation, organic matter was predicted from the combined gravimetric inputs with R2 = 0.975 and RPD = 6.32 and from total solids alone with R2 = 0.979 and RPD = 6.86, but a linear regression on total solids performed equally well (R2 = 0.980), so this result reflects the relation OM = TS − ash rather than the strength of machine learning. The VS/TS ratio (R2 = 0.593; RPD = 1.57) supported only screening-level use, and ash (R2 = 0.472; RPD = 1.38) required direct measurement. Conversely, nitrate (R2 = −0.318), sodium (−0.431), salinity (−0.339), calcium (−0.201) and pH (0.091) could not be predicted across farms (RPD = 0.84–1.05). These results demonstrate that model complexity cannot compensate for predictors lacking the chemical information required to explain ionic and biologically mediated properties.
Explainability strengthened this distinction. SHAP analysis attributed organic-matter predictions mainly to the moisture–solids balance (mean absolute SHAP = 0.741). Local SHAP and LIME explanations showed how these contributions varied among individual manure samples. Nevertheless, these attributions describe model behavior and should not be interpreted as causal mechanisms. The findings apply primarily to Central Valley flush-based dairy systems sampled in one season and require evaluation in other manure-management environments. Overall, the proposed framework can help agricultural laboratories use routine gravimetric measurements for rapid organic-matter screening while reserving direct analysis for nitrate, salts, major ions, and pH.
Author Contributions
Conceptualization, P.P. (Pramod Pandey) and A.A.R.; methodology, A.A.R., P.P. (Prachi Pandey), B.P. and P.P. (Pramod Pandey); software and simulation, A.A.R.; validation, A.A.R., B.P. and P.P. (Pramod Pandey); formal analysis and sample collection, A.A.R. and P.P. (Pramod Pandey); investigation, P.P. (Prachi Pandey), B.P. and P.P. (Pramod Pandey); resources, P.P. (Pramod Pandey); data curation, P.P. (Prachi Pandey), B.P. and A.A.R.; writing—original draft preparation, A.A.R. and P.P. (Pramod Pandey); writing—review and editing, A.A.R., P.P. (Prachi Pandey), B.P. and P.P. (Pramod Pandey); visualization, A.A.R. and P.P. (Pramod Pandey); supervision, P.P. (Pramod Pandey); project administration, P.P. (Pramod Pandey); funding acquisition, P.P. (Pramod Pandey). All authors have read and agreed to the published version of the manuscript.
Funding
This research received no external funding.
Institutional Review Board Statement
Not applicable.
Informed Consent Statement
Not applicable.
Data Availability Statement
The data supporting the findings of this study are available from the corresponding author upon reasonable request. Access to farm-level information may be subject to confidentiality considerations to protect participating commercial dairy operations. Anonymized data may be shared where appropriate, subject to applicable data-sharing restrictions. Declaration of generative AI and AI-assisted technologies in the manuscript preparation process: The conceptual workflow Figure 1B was developed with assistance from ChatGPT (GPT-5.6, OpenAI, San Francisco, CA, USA) and subsequently edited, scientifically verified, and approved by the authors. During the preparation of this manuscript, the authors used ChatGPT (OpenAI; GPT-5.6) to improve sentence structure, conciseness, clarity, and coherence of the written English. The tool was also used to assist in identifying inconsistencies in reported numerical values, including sample sizes, means, and ranges. All AI-assisted suggestions were reviewed and verified by the authors, who take full responsibility for the accuracy, integrity, and content of this publication.
Acknowledgments
The authors gratefully acknowledge the participating dairy producers, farm managers, and farm personnel for providing access to their commercial facilities and supporting sample collection during the four-year project. The authors thank Joe Mello, Tracee DaSilva, Dennis DaSilva for their enormous experience in dairy operations, and assistance with field sampling, sample transportation, laboratory measurements, and data organization. The authors also acknowledge the support of the University of California Agriculture and Natural Resources and the School of Veterinary Medicine Extension, University of California, Davis.
Conflicts of Interest
The authors declare that they have no known competing financial interests or personal relationships that could have appeared to influence the work reported in this paper.
References
- Appuhamy, J.A.D.R.N.; Moraes, L.E.; Wagner-Riddle, C.; Casper, D.P.; Kebreab, E. Predicting manure volatile solid output of lactating dairy cows. J. Dairy Sci. 2018, 101, 820–829. [Google Scholar] [CrossRef] [Scilit] [PubMed]
- Huhtanen, P.; Krizsan, S.J.; Ramin, M. A meta-analysis of faecal output and nutrient composition, and potential methane emission from manure of dairy cows. Anim. Feed Sci. Technol. 2021, 282, 115120. [Google Scholar] [CrossRef] [Scilit]
- James, T.; Meyer, D.; Esparza, E.; DePeters, E.J.; Perez-Monti, H. Effects of dietary nitrogen manipulation on ammonia volatilization from manure from Holstein heifers. J. Dairy Sci. 1999, 82, 2430–2439. [Google Scholar] [CrossRef] [Scilit] [PubMed]
- Külling, D.R.; Menzi, H.; Kröber, T.F.; Neftel, A.; Sutter, F.; Lischer, P.; Kreuzer, M. Emissions of ammonia, nitrous oxide and methane from different types of dairy manure during storage as affected by dietary protein content. J. Agric. Sci. 2001, 137, 235–250. [Google Scholar] [CrossRef] [Scilit]
- Petersen, S.O.; Lind, A.-M.; Sommer, S.G. Nitrogen and organic matter losses during storage of cattle and pig manure. J. Agric. Sci. 1998, 130, 69–79. [Google Scholar] [CrossRef] [Scilit]
- Jóhannesson, G.H.; Lauzon, J.D.; Crolla, A.; Gilroyed, B.H.; VanderZaag, A.C.; Gordon, R. Impact of manure storage conditions and time on decomposition of and losses from liquid dairy manure stored in a temperate climate. Can. J. Soil Sci. 2018, 98, 148–160. [Google Scholar] [CrossRef] [Scilit]
- Chen, L.; Li, X.; Han, L. Review of the application of near-infrared spectroscopy technology to determine the chemical composition of animal manure. J. Environ. Qual. 2013, 42, 1015–1028. [Google Scholar] [CrossRef] [Scilit] [PubMed]
- Cobbinah, E.; Generalao, O.B.; Lageshetty, S.K.; Adrianto, I.; Singh, S. Using near-infrared spectroscopy and stacked regression for simultaneous determination of fresh cattle and poultry manure chemical properties. Chemosensors 2022, 10, 410. [Google Scholar] [CrossRef] [Scilit]
- Silva, J.V.; van Heerwaarden, J.; Reidsma, P.; Laborte, A.G.; Tesfaye, K.; van Ittersum, M.K. Big data, small explanatory and predictive power: Lessons from random forest modeling of on-farm yield variability and implications for data-driven agronomy. Field Crops Res. 2023, 302, 109063. [Google Scholar] [CrossRef] [Scilit] [PubMed]
- Cai, X.; Gu, J.; Feng, K.; Nan, J.; Xing, D. Advances in machine learning for the resource utilization of livestock and poultry manure. Energy Environ. Prot. 2026, 40, 19–35. [Google Scholar] [CrossRef]
- Gupta, R.; Hajabdollahi Ouderji, Z.; Uzma; Yu, Z.; Sloan, W.T.; You, S. Machine learning for sustainable organic waste treatment: A critical review. npj Mater. Sustain. 2024, 2, 5. [Google Scholar] [CrossRef] [Scilit] [PubMed]
- Rutland, H.; You, J.; Liu, H.; Bull, L.; Reynolds, D. A systematic review of machine-learning solutions in anaerobic digestion. Bioengineering 2023, 10, 1410. [Google Scholar] [CrossRef] [Scilit] [PubMed]
- Temel, F.A.; Cağcağ Yolcu, Ö.; Turan, N.G. Artificial intelligence and machine learning approaches in composting process: A review. Bioresour. Technol. 2023, 370, 128539. [Google Scholar] [CrossRef] [Scilit] [PubMed]
- Li, M.; Sun, D.; Liu, S.; Zhang, K.; Zhao, R.; Yang, Z. Dynamic prediction of total N and P contents in slurry from dairy farms under different treatment processes using near-infrared spectroscopy. Sustainability 2024, 16, 5083. [Google Scholar] [CrossRef] [Scilit]
- Liang, H.; Li, J.; Zhang, Q.; Liu, Z.; Han, B.; Lou, X.; Wang, N.; Lin, Y. Enhancing near-infrared estimation of total nitrogen in manure slurry by integrating contextual farm information with MultiScaleSE-GatedCNN. Agriculture 2026, 16, 965. [Google Scholar] [CrossRef] [Scilit]
- Eslamifar, M.; Tavakoli, H.; Thiessen, E.; Kock, R.; Lausen, P.; Hartung, E. Low-cost NIR spectroscopy versus NMR spectroscopy for liquid manure characterization. Sensors 2025, 25, 6745. [Google Scholar] [CrossRef] [Scilit] [PubMed]
- Chen, X.; Zheng, H.; Wang, H.; Yan, T. Can machine learning algorithms perform better than multiple linear regression in predicting nitrogen excretion from lactating dairy cows. Sci. Rep. 2022, 12, 12478. [Google Scholar] [CrossRef] [Scilit] [PubMed]
- Jeong, S.; Fischer, M.L.; Breunig, H.; Marklein, A.R.; Hopkins, F.M.; Biraud, S.C. Artificial intelligence approach for estimating dairy methane emissions. Environ. Sci. Technol. 2022, 56, 4849–4858. [Google Scholar] [CrossRef] [Scilit] [PubMed]
- Xie, S.; Zhang, T.; You, S.; Mukherjee, S.; Pu, M.; Chen, Q.; Wang, Y.; Ali, E.F.; Abdelrahman, H.; Rinklebe, J.; et al. Applied machine learning for predicting the properties and carbon and phosphorus fate of pristine and engineered hydrochar. Biochar 2025, 7, 19. [Google Scholar] [CrossRef] [Scilit]
- Velusamy, P.; Srinivasan, J.; Subramanian, N.; Mahendran, R.K.; Saleem, M.Q.; Ahmad, M.; Shafiq, M.; Choi, J.-G. Optimization-driven machine learning approach for the prediction of hydrochar properties from municipal solid waste. Sustainability 2023, 15, 6088. [Google Scholar] [CrossRef] [Scilit]
- Xu, Q.; Du, L.; Deng, R. Using machine learning to predict biochar yield and carbon content: Enhancing efficiency and sustainability in biomass conversion. BioResources 2024, 19, 6545–6558. [Google Scholar] [CrossRef] [Scilit]
- Towett, E.K.; Drake, L.B.; Acquah, G.E.; Haefele, S.M.; McGrath, S.P.; Shepherd, K.D. Comprehensive nutrient analysis in agricultural organic amendments through non-destructive assays using machine learning. PLoS ONE 2020, 15, e0242821. [Google Scholar] [CrossRef] [Scilit] [PubMed]
- Meyer, H.; Pebesma, E. Machine learning-based global maps of ecological variables and the challenge of assessing them. Nat. Commun. 2022, 13, 2208. [Google Scholar] [CrossRef] [Scilit] [PubMed]
- Sweet, L.; Müller, C.; Anand, M.; Zscheischler, J. Cross-validation strategy impacts the performance and interpretation of machine learning models. Artif. Intell. Earth Syst. 2023, 2, e230026. [Google Scholar] [CrossRef] [Scilit]
- Hoerl, A.E.; Kennard, R.W. Ridge regression: Biased estimation for nonorthogonal problems. Technometrics 1970, 12, 55–67. [Google Scholar] [CrossRef]
- Breiman, L. Random forests. Mach. Learn. 2001, 45, 5–32. [Google Scholar] [CrossRef] [Scilit]
- Friedman, J.H. Greedy function approximation: A gradient boosting machine. Ann. Stat. 2001, 29, 1189–1232. [Google Scholar] [CrossRef] [Scilit]
- Chen, T.; Guestrin, C. XGBoost: A scalable tree boosting system. In Proceedings of the 22nd ACM SIGKDD International Conference on Knowledge Discovery and Data Mining; ACM: New York, NY, USA, 2016; pp. 785–794. [Google Scholar] [CrossRef] [Scilit]
- Arlot, S.; Celisse, A. A survey of cross-validation procedures for model selection. Stat. Surv. 2010, 4, 40–79. [Google Scholar] [CrossRef] [Scilit]
- Adadi, A.; Berrada, M. Peeking inside the black box: A survey on explainable artificial intelligence (XAI). IEEE Access 2018, 6, 52138–52160. [Google Scholar] [CrossRef] [Scilit]
- Barredo Arrieta, A.; Díaz-Rodríguez, N.; Del Ser, J.; Bennetot, A.; Tabik, S.; Barbado, A.; García, S.; Gil-López, S.; Molina, D.; Benjamins, R.; et al. Explainable artificial intelligence (XAI): Concepts, taxonomies, opportunities and challenges toward responsible AI. Inf. Fusion 2020, 58, 82–115. [Google Scholar] [CrossRef] [Scilit]
- Lundberg, S. A unified approach to interpreting model predictions. arXiv 2017, arXiv:1705.07874. [Google Scholar]
- Ribeiro, M.T.; Singh, S.; Guestrin, C. “Why should I trust you?”: Explaining the predictions of any classifier. In Proceedings of the 22nd ACM SIGKDD International Conference on Knowledge Discovery and Data Mining; ACM: New York, NY, USA, 2016; pp. 1135–1144. [Google Scholar] [CrossRef] [Scilit]
- Roscher, R.; Bohn, B.; Duarte, M.F.; Garcke, J. Explainable machine learning for scientific insights and discoveries. IEEE Access 2020, 8, 42200–42216. [Google Scholar] [CrossRef] [Scilit]
- U.S. Environmental Protection Agency. Method 1684: Total, Fixed, and Volatile Solids in Water, Solids, and Biosolids; EPA-821-R-01-015; Office of Water: Washington, DC, USA, 2001.
- HORIBA Advanced Techno Co., Ltd. LAQUAtwin Pocket Meters. Available online: https://www.horiba.com/usa/water-quality/pocket-meters/ (accessed on 21 September 2026).
- Cawley, G.C.; Talbot, N.L.C. On over-fitting in model selection and subsequent selection bias in performance evaluation. J. Mach. Learn. Res. 2010, 11, 2079–2107. [Google Scholar]
- Varma, S.; Simon, R. Bias in error estimation when using cross-validation for model selection. BMC Bioinform. 2006, 7, 91. [Google Scholar] [CrossRef] [Scilit] [PubMed]
- Hastie, T.; Tibshirani, R.; Friedman, J. The Elements of Statistical Learning: Data Mining, Inference, and Prediction, 2nd ed.; Springer: New York, NY, USA, 2009. [Google Scholar] [CrossRef]
- Rudin, C. Stop explaining black box machine learning models for high-stakes decisions and use interpretable models instead. Nat. Mach. Intell. 2019, 1, 206–215. [Google Scholar] [CrossRef] [Scilit] [PubMed]

Disclaimer/Publisher’s Note: The statements, opinions and data contained in all publications are solely those of the individual author(s) and contributor(s) and not of MDPI and/or the editor(s). MDPI and/or the editor(s) disclaim responsibility for any injury to people or property resulting from any ideas, methods, instructions or products referred to in the content. |
© 2026 by the authors. Licensee MDPI, Basel, Switzerland. This article is an open access article distributed under the terms and conditions of the Creative Commons Attribution (CC BY) license.