


Abstract
Ground-mounted photovoltaic structures create contrasting soil environments, but an internal opening within one support is not equivalent to an inter-row corridor. This observational case study monitored ten time-domain reflectometry probes at 20 cm in temperate grassland in Central Bohemia, Czech Republic, from May to October 2025. Two under-panel rows, an internal gap formed during module replacement and one open-position moisture probe, were compared using daily trajectories, twelve rainfall blocks and three rain-free blocks. Two soil-temperature profiles at 5–20 cm were evaluated from 7 June. The daily mean recorded water content in the gap exceeded the six-probe under-panel mean on all 184 days, whereas the open probe recorded lower water content than the under-panel mean on thirteen August days. During a 34.4 mm rainfall block, gap probes increased by 5.3–9.3 percentage points, while changes within one under-panel row ranged from 0.1 to 11.0 percentage points. At 5 cm, mean daily temperature amplitude was lower under panels in all eleven thermally assessable blocks, although mean temperature was higher in eight. These observations describe local moisture and temperature patterns within one structure. Unmeasured soil variability and the lack of site-specific TDR calibration limit attribution of the differences to the PV configuration. Water-flow pathways and causal effects of gap formation or repowering were not established.
1. Introduction
Agrivoltaics links electricity generation with agricultural land use [1], while vegetated solar sites also require assessment of their soil environment. The relevance of this assessment extends beyond electrical performance: soil conditions form part of the environment in which vegetation develops beneath and around photovoltaic (PV) structures. Understanding their spatial and temporal variation is therefore important for interpreting the interaction between solar infrastructure and the land it occupies. Soil monitoring can contribute to this assessment without assuming that all vegetated PV installations provide the same agricultural or environmental benefits.
Several competing processes can shape the resulting soil-water conditions. Inclined modules shelter some positions from direct rainfall and can concentrate water near edges and openings [2]. Water reaching the ground may subsequently infiltrate, redistribute within the soil or drain below the monitored depth, depending on soil properties and antecedent conditions. Field-calibrated hydrological modelling therefore represents arrays as disconnected impervious surfaces above permeable soil rather than a uniformly sealed footprint [3]. Shading may reduce the energy available for evapotranspiration, whereas rainfall interception restricts water input; consequently, panel coverage alone does not determine whether the soil will be wetter or drier [3].
Structural geometry also influences electrical performance. Božiková et al. [4] developed a hybrid framework combining artificial neural networks and transfer-function methods for PV tilt optimization, while Madola et al. [5] used transfer-function and neural-network modelling to investigate tilt-dependent energy balance. These approaches address energy-oriented design but do not establish soil-water or thermal responses beneath a particular configuration. Soil monitoring therefore provides complementary information rather than a direct validation of electrical optimization.
General soil-monitoring research links spatial representativeness to probe placement and soil variability [6,7]. Under PV, covered strips, openings and edge-adjacent positions introduce distinct sampling domains. Field observations illustrate why their moisture ranking should not be assumed: wetter drip lines and drier under-panel soil were reported in Pennsylvania [8], whereas sustained under-panel moisture during summer drying was observed in Oregon [9]. A British grassland study found seasonal thermal differences without significant soil moisture differences [10]. Madej et al. [11] reported lower under-panel moisture at Braize but no significant difference at Marmanhac, with measurements at 20 cm. These contrasting findings indicate that climate, soil, vegetation, measurement depth and antecedent conditions constrain comparisons between sites. Mulla et al. [3] combined multi-site monitoring with measurements of soil texture, bulk density and saturated hydraulic conductivity, illustrating the importance of soil characterization when interpreting spatial moisture contrasts.
Thermal interpretation involves another balance of processes. Interception of shortwave radiation can reduce daytime heating, whereas a reduced view of the sky beneath modules can limit longwave heat loss; these mechanisms can affect temperature levels and daily fluctuations differently [10]. A smaller daily temperature amplitude therefore does not, by itself, establish lower mean or maximum soil temperature. Similarly, seasonal moisture averages can conceal temporary changes in positional ranking and heterogeneous responses among neighbouring probes. Daily trajectories and rainfall and rain-free blocks are consequently useful for distinguishing seasonal contrasts from period-specific responses.
At the study site in Central Bohemia, Czech Republic, replacement modules left an approximately 0.45 m internal opening between two sections of one retained support. This opening is not equivalent to a corridor between separate PV rows. Published observations from under-panel, drip-edge and inter-array positions provide relevant comparisons, but they do not directly establish the moisture dynamics around this particular geometry. A configuration-specific assessment is therefore needed to describe whether local moisture contrasts persist through the season and whether neighbouring covered positions respond consistently during rainfall and rain-free periods.
This observational case study therefore aimed to compare recorded soil moisture at 20 cm among two under-panel probe rows, the internal gap and a single open-position probe; describe changes during rainfall and rain-free blocks and variability among neighbouring probes; and assess whether reduced daily soil-temperature amplitude coincided with lower daily mean temperatures and daily maxima in the under-panel and uncovered soil-temperature profiles at matched depths of 5, 10, 15 and 20 cm. Its contribution is a configuration-specific account combining temporal moisture patterns, local response heterogeneity and separate thermal descriptors. The study characterizes the monitored post-repowering configuration rather than establishing water-flow pathways or causal effects of gap formation or repowering.
2. Materials and Methods
2.1. Site, Structure and Probe Positions
The grass-covered site is at approximately 49.691° N, 14.880° E in Central Bohemia, Czech Republic; coordinates derive from a map point, not a geodetic survey. Terrain was approximately level according to field observations. No mowing or irrigation occurred at the monitored positions. Vegetation composition, cover, biomass and rooting were not quantified. South-facing modules were inclined at 27°, with southern lower and northern upper edges 0.50 and 2.05 m above ground. The internal opening was 0.50 m along the module plane, approximately 0.45 m horizontally. The configuration remained unchanged during monitoring; no pre-replacement observations or equivalent gap-free structure were available.
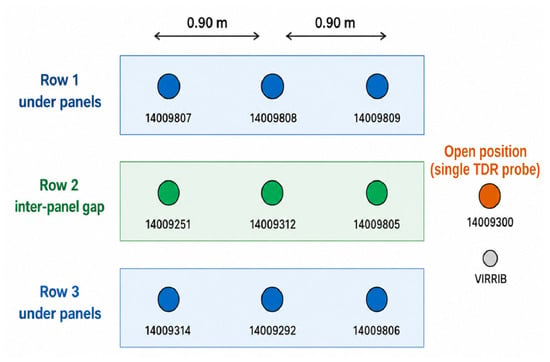
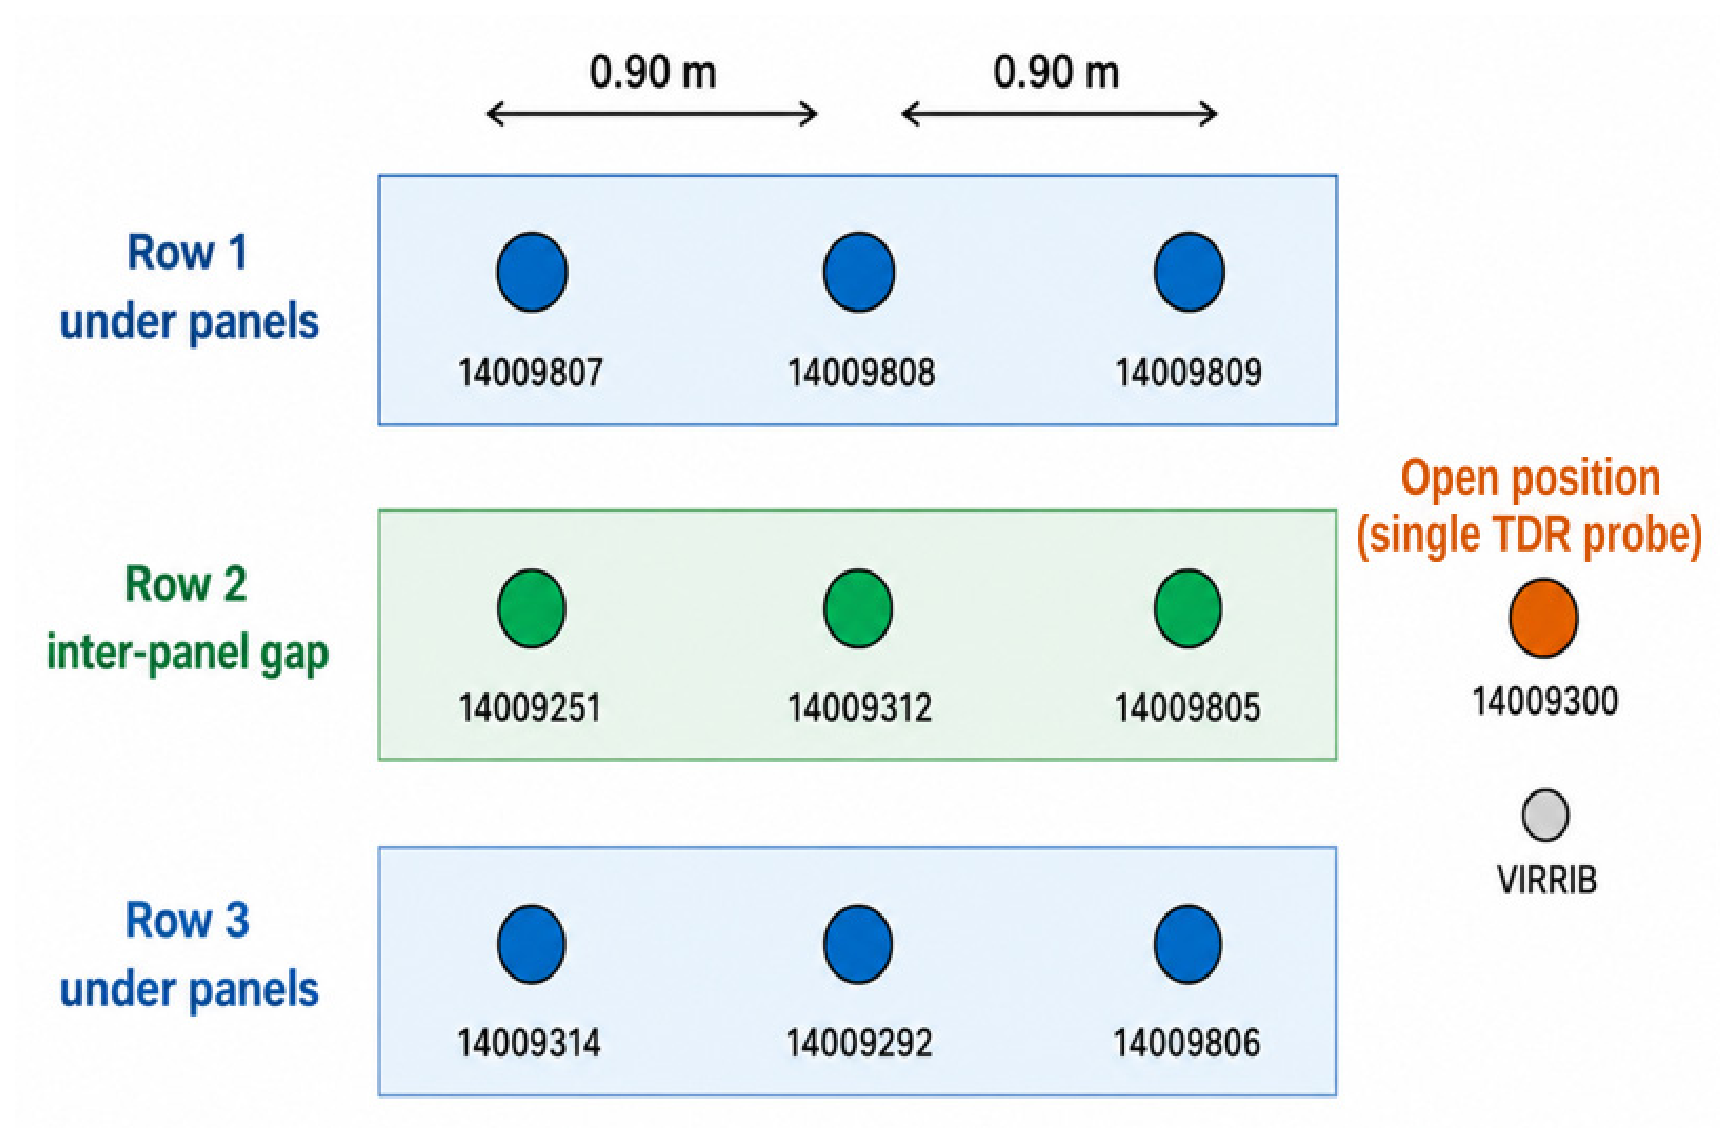
Nine Acclima TDR-310H probes formed three rows of three: R1 and R3 under modules and R2 in the internal gap (Figure 1). Within-row spacing was 0.90 m. A tenth probe monitored one uncovered position, designated Open. All were installed horizontally at 20 cm, with depth checked. A common depth supports position-matched comparison of one soil layer, consistent with 20 cm observations in agrivoltaic grassland [11] and a vegetable study [12]; it does not represent the entire rooting profile.
Figure 1.
Plan-view TDR layout. R2 is the internal gap within one structure; R1 and R3 are covered rows. All probes were at 20 cm. The Open probe location is schematic, not a surveyed distance or a north-referenced map. VIRRIB is shown for installation context only; it is not a calibration standard.
The Open TDR and external temperature profile were approximately 1 m from a lateral module edge and received neither module shadow nor direct drip according to field observations; lateral water movement was not excluded. Open provides a single local moisture comparison. Under6 denotes the equally weighted mean of the six R1/R3 probes. The nine probes within the structure are spatial subsamples, not independent PV treatment replicates; repeated dates do not supply the missing spatial replication [13].
2.2. Instruments and Measurement Periods
The TDR probes used an Acclima DataSnap logger and SDI-12 at nominal 30 min intervals. Analysis used the manufacturer-defined volumetric water-content output, θ (%), without local gravimetric calibration [14]. Other exported readings supported quality screening.
TDR estimates apparent permittivity from pulse travel time and converts it to θ through a calibration relationship. The measurement represents local soil around the rods and can be affected by dielectric losses and sensor–soil contact [15]. Field calibration of the same TDR-310H model has shown that systematic offsets from gravimetric measurements can occur [16].
Daily rainfall totals came from a FIEDLER M4032-G station equipped with an SR03 gauge (500 cm2; nominal 0.1 mm per pulse). Complete subdaily station exports were unavailable; daily totals do not identify storm onset or half-hour response lags.
Eight PT100-XM probes were connected through one TEP08 converter [17,18]. One profile under panels and one outside sampled 20, 15, 10 and 5 cm: channels T1–T4 (K24–K27) and T5–T8 (K28–K31), respectively. In temperature figures and tables, Open denotes the uncovered temperature profile. There was no gap-temperature profile. Burial occurred on 6 June 2025; earlier records from probes bundled in air and the mixed installation day were excluded. Temperature analysis covered 7 June–31 October; the first full day is not a validated equilibration period. Moisture comparisons consistently used 1 May–31 October 2025.
The TDR-310H probes and DataSnap logger were manufactured by Acclima, Inc. (Meridian, ID, USA). The M4032-G station, SR03 rain gauge and PT100-XM probes were FIEDLER AMS s.r.o. products, and the TEP08 converter was a FIEDLER-MÁGR product (both České Budějovice, Czech Republic) [17,18]. According to the PT100-XM datasheet, the probes incorporate Class A Pt100 sensing elements manufactured by Hayashi Denko Co., Ltd. (Tokyo, Japan) [17]. The meteorological station was provided on loan by ENKI, o.p.s. (Třeboň, Czech Republic).
2.3. External Soil Context
No soil samples were collected at the probe positions, and local texture and bulk density were not measured. The 1971 KPP profile ZXXX-029, district 119 SS Ovčiny, lies approximately 100 m west–northwest according to map-scale estimation. Its legacy classification is “typical brown soil (base-saturated)” on paragneiss. Archival values were transcribed from author-saved database screenshots [19] and are distinguished from modelled topsoil estimates in Table 1.
Table 1.
External soil context: neither source represents samples at the installed probes.
VÚMOP estimates were obtained from 20 m topsoil rasters on 14 September 2026 near S-JTSK x = −716,010 m, y = −1,091,113 m; individual query positions differed by several metres. The modelled texture fractions sum to 98% and were retained as reported. These sources provide background context and do not establish soil properties or their equivalence at individual probe positions.
2.4. Data Quality and Nominal Specifications
Overlapping exports were reconciled by probe ID and exported timestamp. Identical records were counted once; conflicting valid θ values and off-grid records were excluded. Broad screening retained θ within 0–100%, temperature within −40 to 60 °C and relative permittivity within 1–100. Missing observations were not imputed and undocumented time-zone conventions were not converted. A sensor-day required at least 44 of 48 nominal observations. Daily sensor means were equally weighted for row trajectories, Under6 and monthly contrasts; individual daily medians were used for episode endpoints.
The TDR-310H specification gives moisture resolution 0.1%, RMS repeatability 0.3% and accuracy ±3% of full scale, nominally ±3 percentage points [24]. These specifications do not quantify site-specific uncertainty. Class-A Pt100 element tolerance is ±(0.15 + 0.002|t|) °C [17], where t is temperature in °C; complete-channel uncertainty, including converter and installation effects, was not determined.
2.5. Descriptive Analysis of Rainfall and Rain-Free Blocks
Rainfall blocks were maximal sequences of days with positive rainfall; blocks totalling ≥10 mm were selected. Rain-free blocks contained at least seven consecutive zero-rain days. The 10 mm threshold is an operational selection for more substantial inputs, not a locally established infiltration threshold. Antecedent rainfall was the preceding seven-day total. All qualifying blocks were retained irrespective of response; blocks were not assumed to represent independent storms.
For each sensor, Δθ was the end-day median minus the baseline-day median. Rainfall baselines were the day before block onset; rain-free baselines were the first block day. Row responses were medians of the three individually paired changes, with minima and maxima describing spatial spread; Open had one probe. A median of paired changes is not generally a change in group medians. Changes are percentage points, not relative percentages, infiltration rates or millimetres of water.
Daily soil-temperature amplitude was the same-day maximum minus minimum. Daily means, minima, maxima and amplitudes were compared at matched depths as values under the panels minus those in the uncovered profile, then averaged separately within each block. Only complete post-burial blocks were evaluated.
3. Results
3.1. Coverage and Episode Context
The reconciled record retained 88,272 of 88,320 nominal TDR slots (99.9%). All 1840 sensor-days were available, each with at least 45 observations. Overlapping exports supplied 1677 archived R1-L records within the previously reported 29 July–2 September gap. Absence from one summary export therefore did not establish continuous hardware failure; the export omission remains unexplained. Availability does not verify calibration.
Rainfall totalled 303.2 mm, with monthly totals of 23.6–74.8 mm and a daily maximum of 18.4 mm on 4 June. Twelve rainfall and three rain-free blocks qualified (Table 2). Nine rainfall and two rain-free blocks occurred wholly after temperature burial. The thermal record contained 147 complete days and 588 depth-matched daily pairs.
Table 2.
All selected blocks in 2025.
3.2. Daily and Monthly Moisture Differences
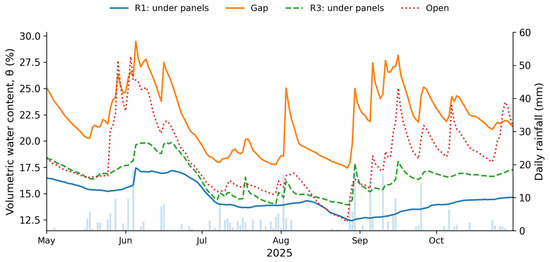
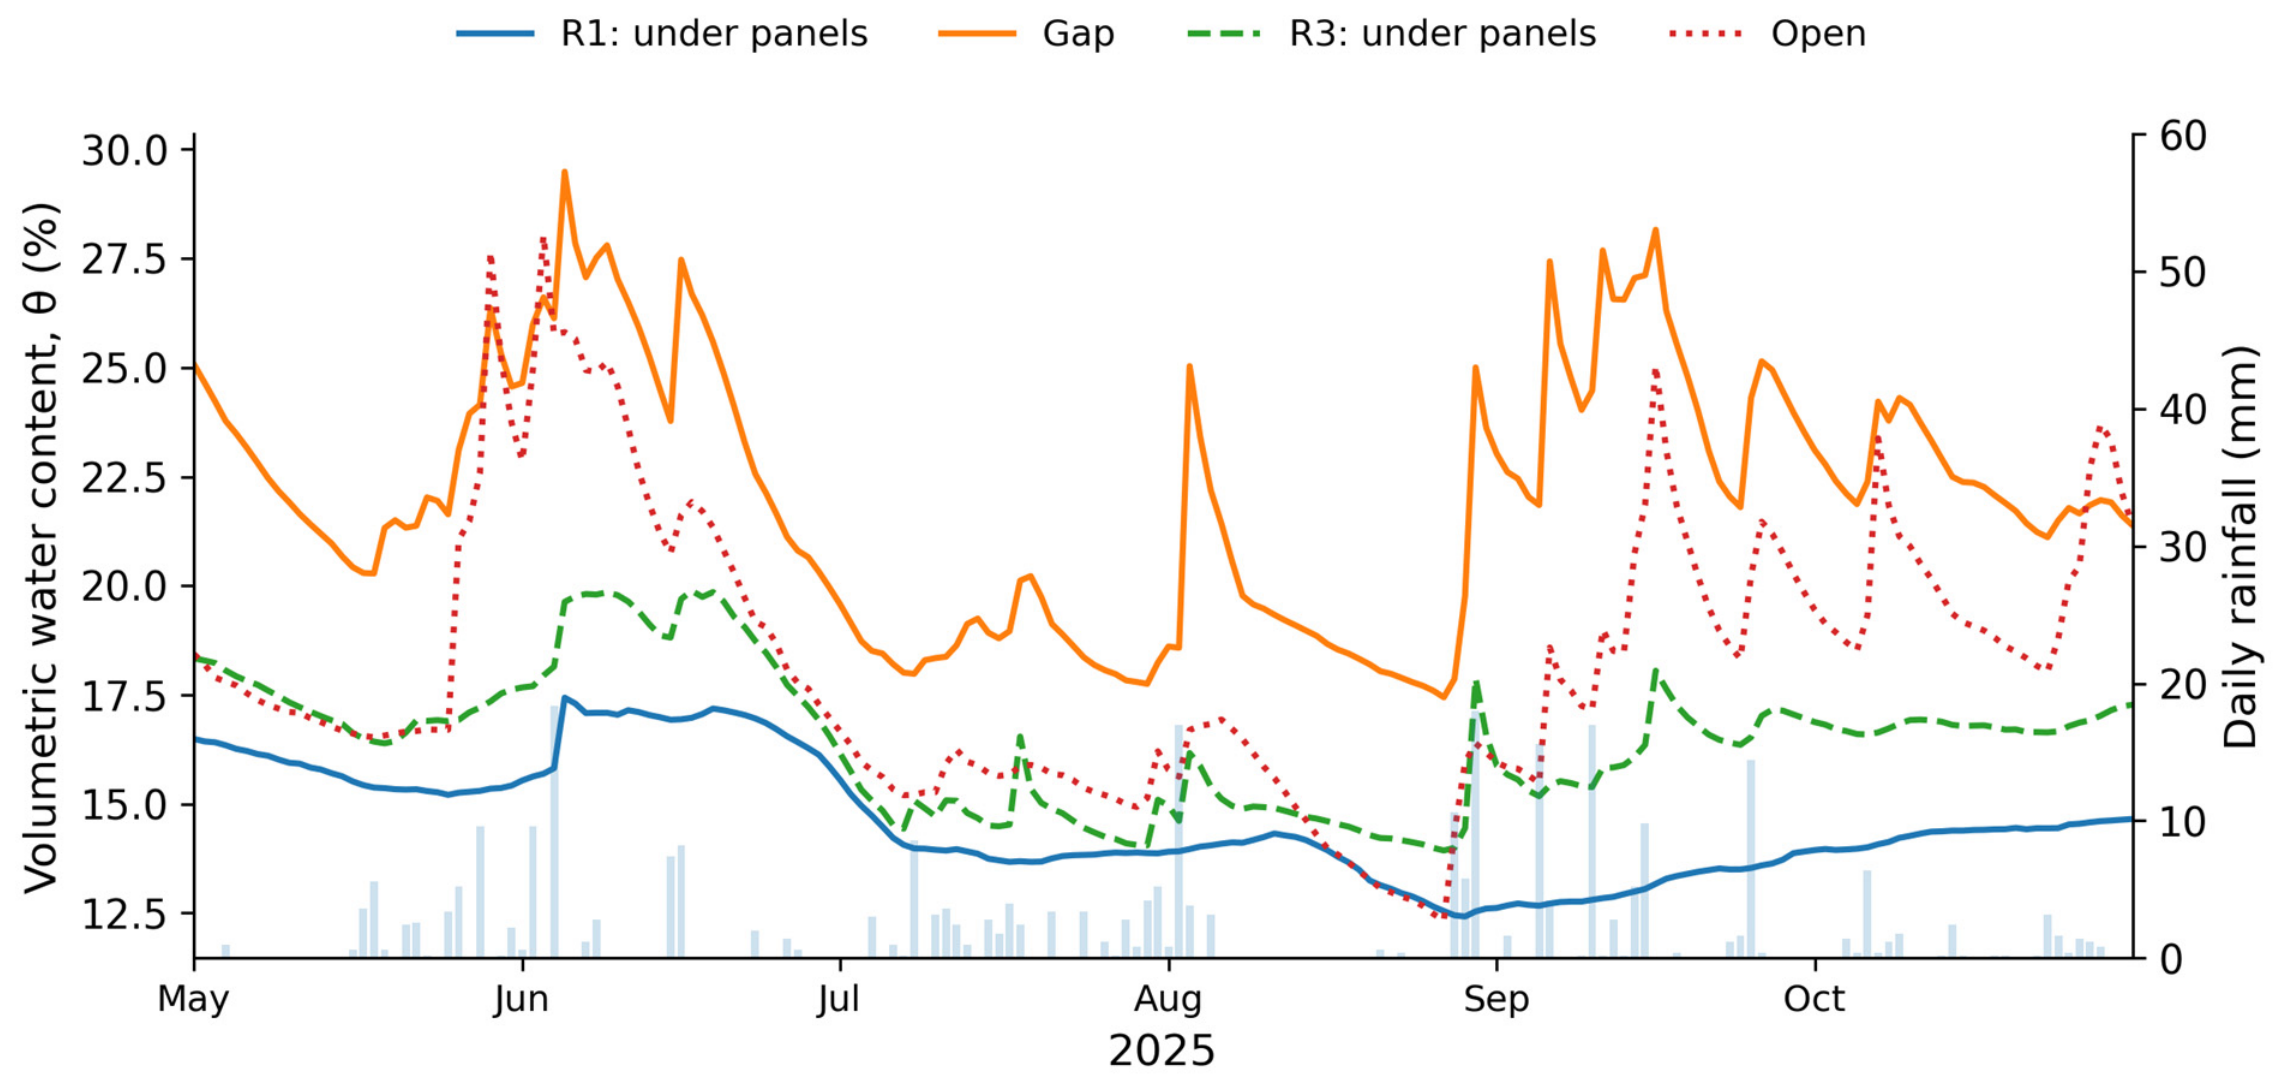
The recorded Gap daily mean moisture exceeded Under6 on all 184 days. However, Gap > Open > Under6 occurred on 165 days, Gap > Under6 > Open on thirteen days (15–27 August), and Open > Gap > Under6 on six days. The full ordering was prevailing, not invariant; R1 and R3 followed distinct trajectories (Figure 2).
Figure 2.
Unsmoothed daily sensor means, equally weighted within each three-probe row; Open denotes the single local open-position probe. Bars show daily rainfall on the right axis. Under6, used in Table 3, pools R1 and R3 with equal probe weights. Means here are distinct from medians used for episode changes.
In August, Open minus Under6 averaged +0.6 percentage points, although Open was lower on thirteen days (Table 3).
Table 3.
Monthly mean differences in recorded soil moisture.
3.3. Rainfall and Rain-Free Responses
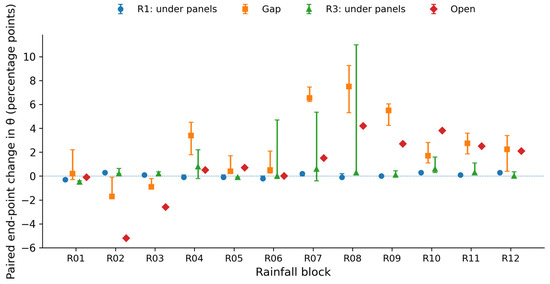
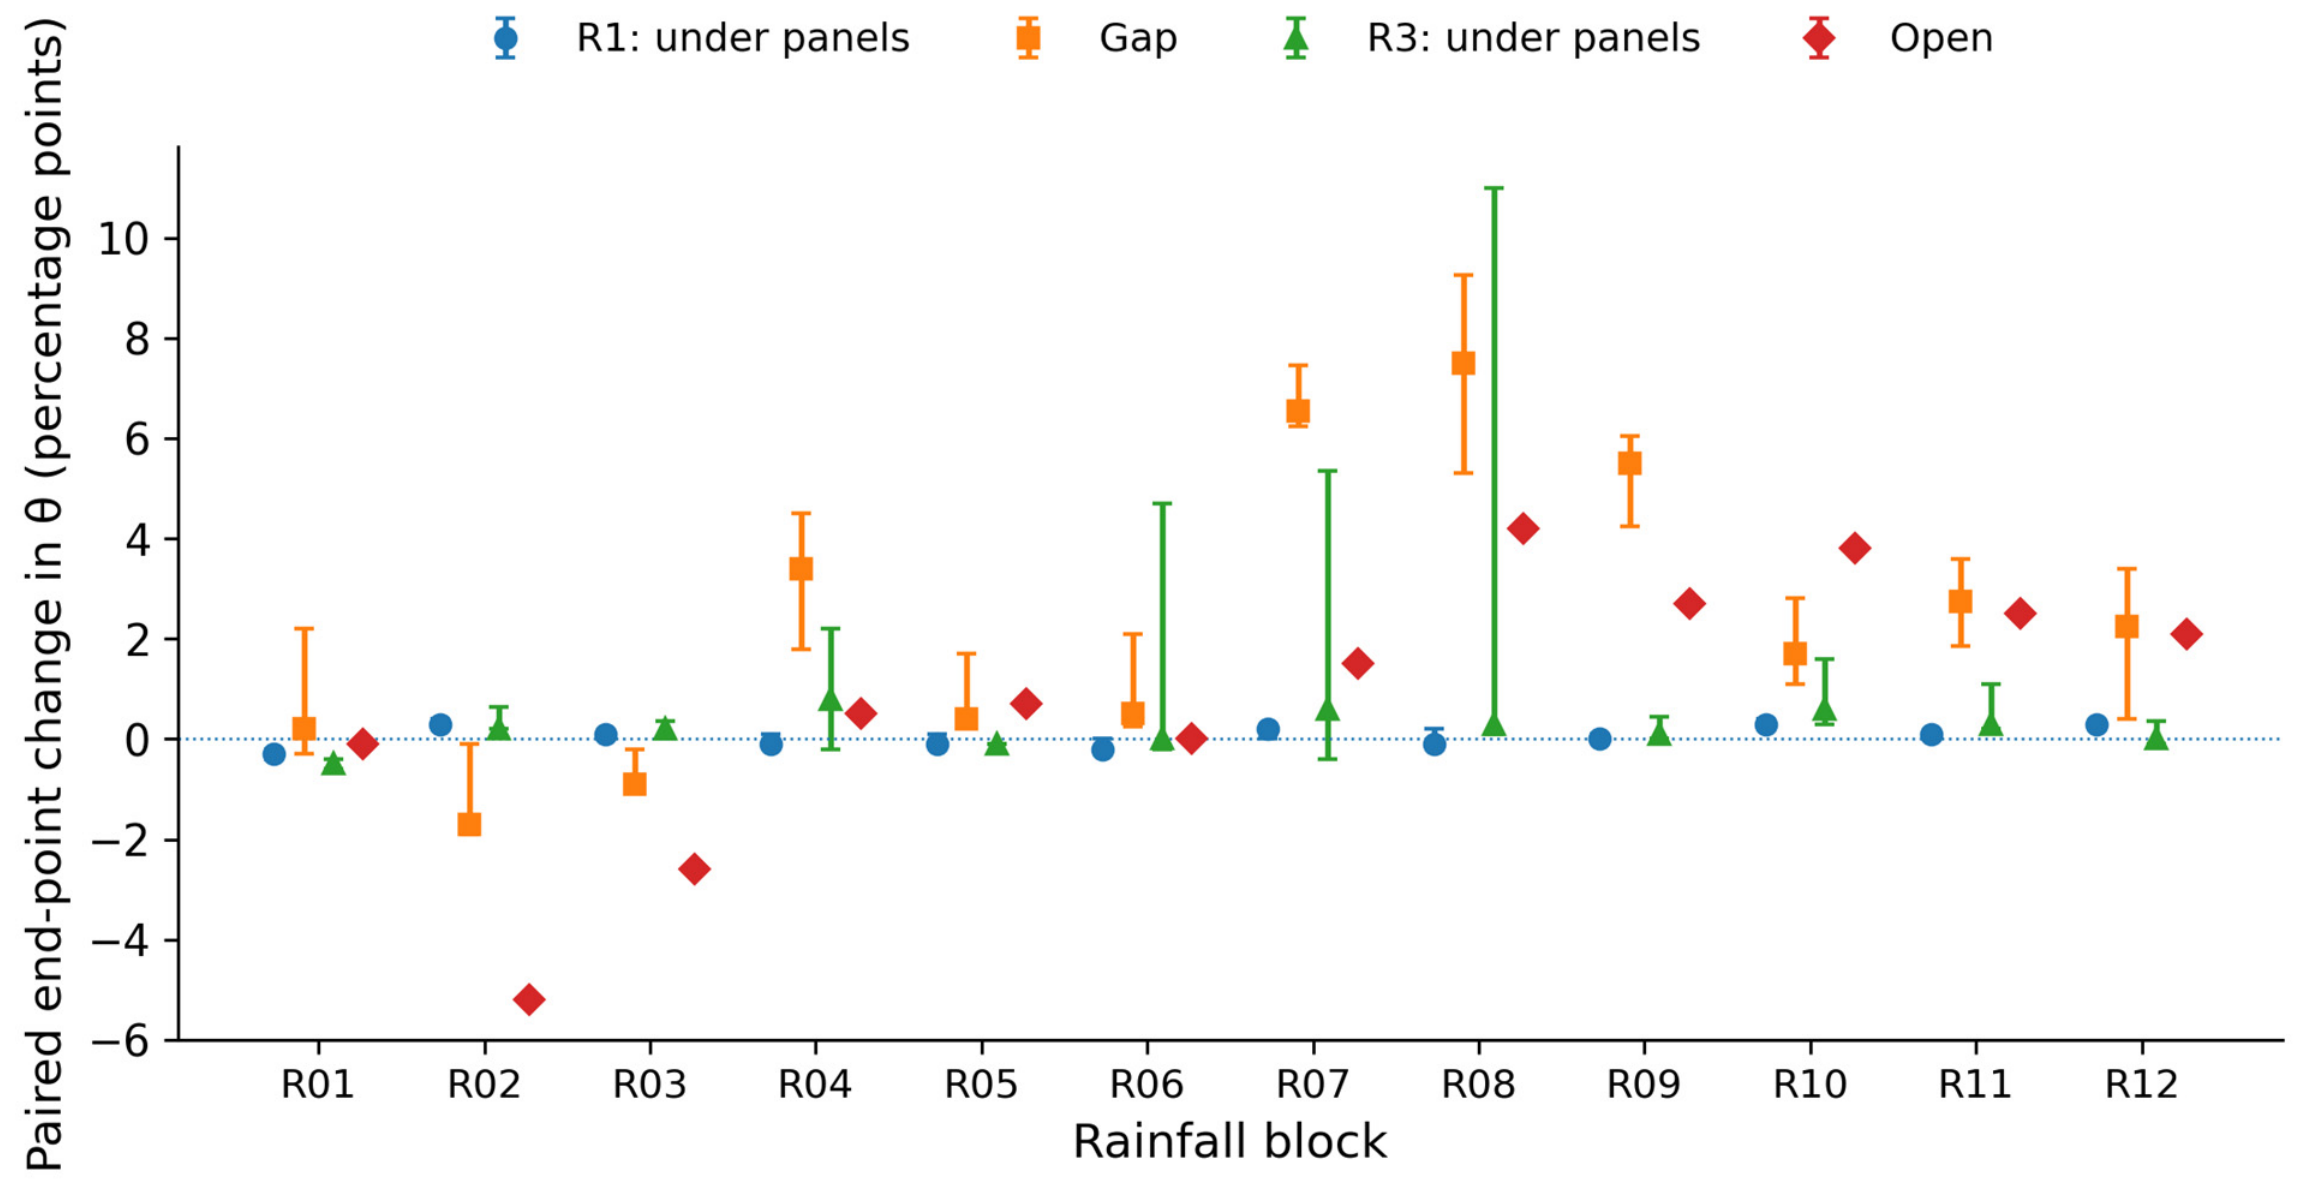
Gap endpoint changes were positive in ten of twelve rainfall blocks and ranged from −1.7 to +7.5 percentage points. Corresponding row-median ranges were −0.3 to +0.3 for R1 and −0.5 to +0.8 for R3; Open ranged from −5.2 to +4.2 (Figure 3). These are descriptive changes at the monitored positions.
Figure 3.
Endpoint changes for all twelve rainfall blocks. Symbols are medians of three paired probe changes in R1, Gap and R3, or the change at the single Open probe. Whiskers are probe minima and maxima, not confidence intervals. Dates and rainfall totals are in Table 2.
During R08 (28–30 August; 34.4 mm), all gap probes increased by 5.3–9.3 percentage points. R3-L (14009314) increased by 11.0 percentage points, while its neighbours increased by 0.3 and 0.1. The R3 paired-change median was therefore +0.3 percentage points. One strong local response did not characterize the row.
Rain-free changes also varied by period. In D01, Gap and Open decreased by 3.0 and 1.0 percentage points, compared with 0.6 and 0.7 in R1/R3. In D02, declines were 3.3 and 3.6 versus 0.3 and 0.6. During autumn D03, Gap/Open declined by 2.8/2.2 while R1/R3 increased by 0.3/0.1. Absence of recorded rainfall did not ensure decline everywhere; these single-depth changes do not quantify evaporation or water savings.
These rainfall-block changes refer to the specified baseline and endpoint dates; different dates can change their magnitude or sign.
3.4. Temperature Levels and Amplitudes
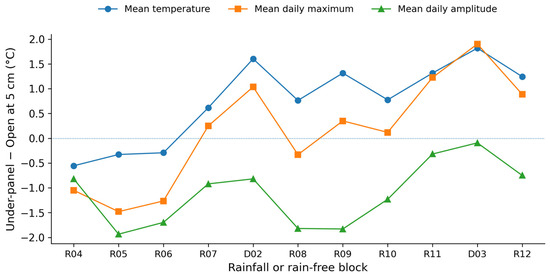
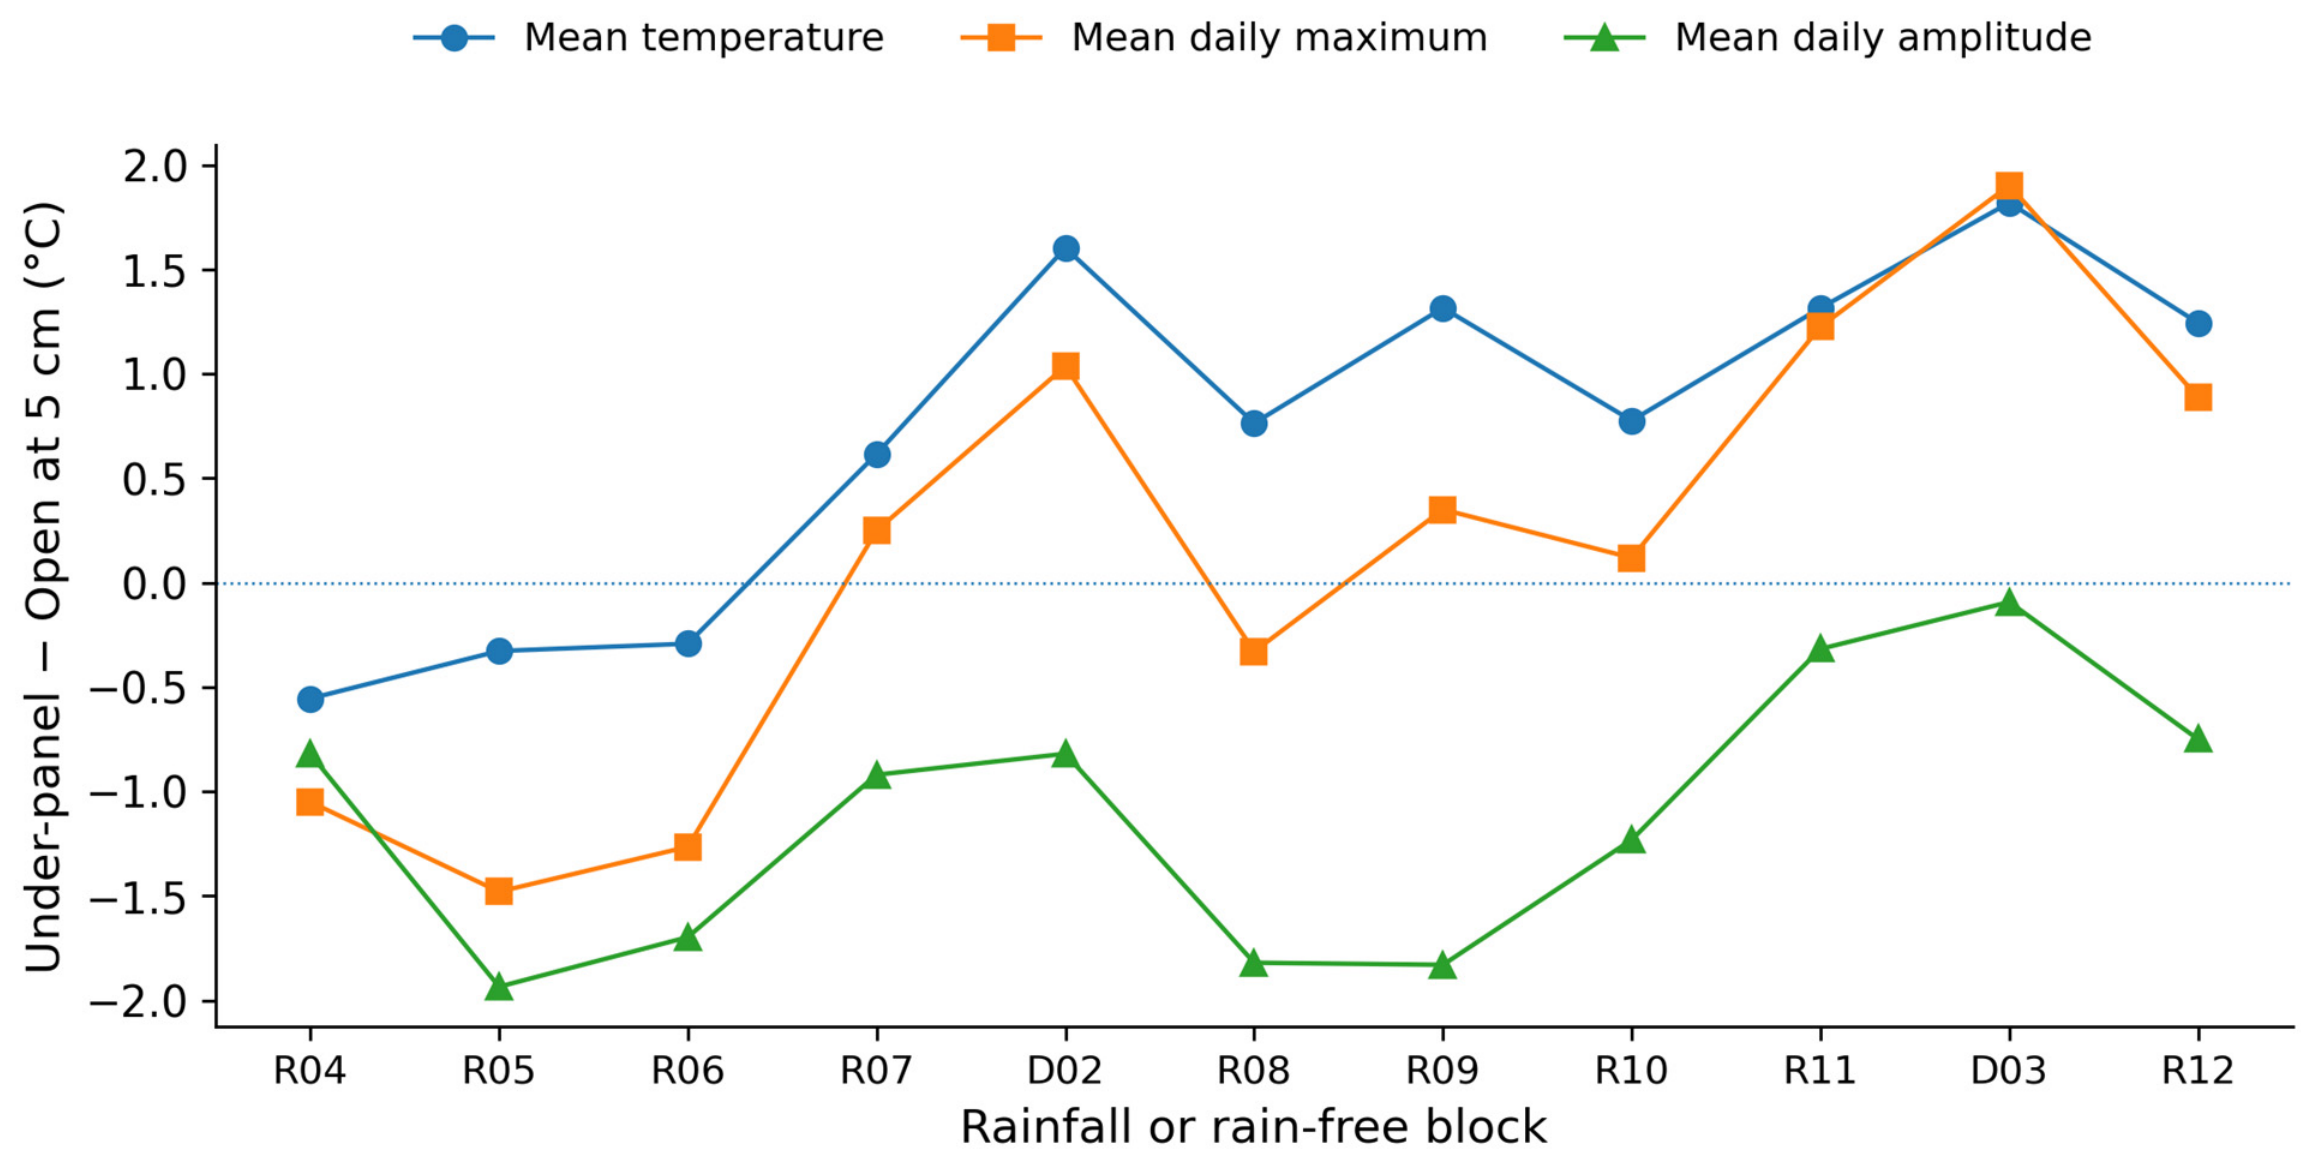
At 5 cm, block-mean daily amplitude was lower under panels in all eleven assessable blocks, but mean temperature was higher in eight and mean daily maxima in seven (Figure 4). Deeper amplitude differences were not uniformly negative (Table 4). These counts describe the two monitored profiles.
Figure 4.
Under-panel minus Open differences at 5 cm. for the two monitored temperature profiles. Daily mean temperature, daily maximum and daily amplitude are averaged separately within each block. Connecting lines link categorical blocks, not continuous temperatures between them. D02 and D03 are rain-free.
Table 4.
Temperature contrasts between the two monitored profiles across all eleven post-burial blocks.
During D02, mean 5 cm temperature was 20.3 °C under panels and 18.7 °C at the local open position, a difference of +1.6 °C; mean daily amplitudes were 8.1 and 8.9 °C, respectively, a difference of −0.8 °C. The under-panel mean daily maximum was nevertheless 1.0 °C higher.
4. Discussion
4.1. Spatial Soil States, Not a Measured Water Balance
The contrasted recorded trajectories and rainfall responses support separate description of the monitored internal gap, covered and open positions. Wetter drip lines and drier under-panel soil at Pennsylvania solar farms [8] offer a relevant comparison, but their terrain and drainage settings differ from those at the study site. Elamri et al. [2] directly collected spatially redistributed rainfall; here, only station rainfall and soil states were quantified. Field observations of rain and drainage entering the gap make concentrated input plausible, not an established dominant mechanism.
Mulla et al. [3] combined monitoring at five vegetated US solar farms with HYDRUS modelling, resolving under-panel, drip-edge and inter-array positions and measuring soil texture, bulk density and saturated hydraulic conductivity. Their simulated runoff depended on rainfall and soil characteristics. This provides a useful comparison for interpreting spatial contrasts, but their inter-array areas are not equivalent to the study site’s 0.45 m internal opening. Their runoff estimates cannot be transferred to this site without local hydraulic measurements and matching boundary conditions.
Temperate grassland findings are not uniform. Madej et al. [11] found lower under-panel moisture at Braize but no significant difference at Marmanhac with 20 cm monitoring; the Oregon pasture retained under-panel moisture during summer drying over a 10–60 cm profile [9]. The thirteen August Open/Under6 reversals at the study site similarly show that the recorded ranking varied at these monitoring positions. Climate, depth, vegetation and antecedent state constrain transfer of effect sizes.
The isolated recorded 11.0-percentage-point R3 response is compatible with local water inputs, preferential movement or soil heterogeneity; sensitivity of TDR measurements to sensor–soil contact [15] provides an additional explanation to test. It proves neither movement from the gap beneath the entire structure nor instrument failure. Smaller rain-free declines likewise do not measure reduced evapotranspiration. Local soil characterization and direct water-flux measurements remain necessary to distinguish mechanisms.
4.2. Thermal Interpretation and Energy-Oriented Design
Reduced amplitude and cooling are different outcomes. The British grassland study reported cooler soil at 10 cm in spring–autumn [10], whereas at the study site, the under-panel profile often had higher means and maxima than the uncovered profile, despite smaller amplitudes. Radiative exchange, soil moisture and vegetation may contribute, but neither a surface-energy balance nor vegetation-stress thresholds were measured. Higher August maxima preclude using amplitude alone as proof of protection from thermal stress.
The tilt-dependent energy models of Božiková et al. [4] and Madola et al. [5] could inform a future design comparison combined with independently calibrated soil and vegetation measurements. The present observations do not identify an optimal inclination or gap width; evaluating these design choices requires measurements of electrical performance, soil-water conditions and vegetation responses.
4.3. Repowering Context and Limits of Inference
Module replacement explains the internal opening, but no pre-replacement observations or comparable gap-free structure were available. Related studies of retained damaged modules and dry/wet insulation testing [25,26,27] provide operational context for repowering. The observations therefore describe the post-repowering configuration without quantifying the effect of repowering itself.
Monitoring covered one PV structure and one growing season, with one open-position moisture probe and one soil-temperature profile at each of two positions. Dates, depths and neighbouring probes do not constitute independent treatment replicates [13]. No soil samples were collected at the probe positions; local texture, bulk density and TDR calibration were therefore unverified. Archival and modelled soil information provides site context but cannot establish equivalent soil properties among monitoring positions. Consequently, persistent between-probe differences cannot be attributed uniquely to panel coverage or the gap, and factory-calibrated water-content values should be interpreted as local sensor estimates. Vegetation was not quantified, and complete-channel temperature uncertainty was not established. Soil and vegetation variation reported across temperate solar farms [28] further limits transferability. Independent structures and open positions, local soil sampling, sensor calibration and direct water-flux measurements are needed to test the mechanisms suggested by these observations.
5. Conclusions
This case study documented contrasting soil moisture and temperature dynamics within a repowered photovoltaic structure on temperate grassland. At 20 cm depth, the internal gap’s recorded daily mean water content exceeded the six-probe under-panel mean throughout May–October 2025. However, the single open-position probe recorded lower water content than the under-panel mean on thirteen August days. The records thus showed a persistent gap–covered contrast, while the ranking involving the open probe varied during the season.
Rainfall and rain-free periods revealed different aspects of this spatial pattern. The median paired moisture change in the gap was positive in ten of twelve rainfall blocks with totals ≥10 mm, reaching 7.5 percentage points under the specified endpoint definition. Under-panel responses were locally heterogeneous: a large increase at one probe did not characterize the entire row. During 6–20 August, recorded row-median declines were 0.3–0.6 percentage points beneath the panels, compared with 3.3 in the gap and 3.6 at the single open-position probe. These changes describe local soil states, not measured water fluxes or water savings.
Reduced daily temperature fluctuations did not necessarily mean cooler soil. At 5 cm, mean daily amplitude was lower beneath the panels in all eleven assessable blocks, whereas mean temperature was higher in eight and mean daily maxima in seven. During the August rain-free period, the under-panel mean was 1.6 °C higher despite a 0.8 °C smaller mean daily amplitude. Amplitude, mean temperature and maxima therefore convey different information and cannot be combined into a single claim of protection from heat stress.
These findings apply to the monitored positions and season. Their contribution is the description of local moisture contrasts and the coexistence of smaller temperature fluctuations with warmer soil. Unverified local soil properties and TDR calibration prevent firm attribution of between-position moisture differences to the PV configuration. The observations provide hypotheses for replicated monitoring with local soil characterization and direct water-flux measurements.
Author Contributions
Conceptualization, M.K. and M.L.; methodology, M.K., T.F. and M.L.; software, M.K.; validation, M.K., J.H. and T.F.; formal analysis, M.K.; investigation, M.K., J.H. and T.F.; resources, J.H., T.F. and M.L.; data curation, M.K.; writing—original draft preparation, M.K.; writing—review and editing, J.H., T.F. and M.L.; visualization, M.K.; supervision, M.L. All authors have read and agreed to the published version of the manuscript.
Funding
This research was funded by the Internal Grant Agency of the Faculty of Engineering, Czech University of Life Sciences Prague (2026:31110/1312/3113).
Institutional Review Board Statement
Not applicable.
Informed Consent Statement
Not applicable.
Data Availability Statement
The raw data supporting the conclusions of this article will be made available by the authors on request.
Acknowledgments
The authors thank the site operator for access and ENKI, o.p.s., for lending the meteorological station. During the preparation of the original manuscript, the authors used DeepL Translator for language translation. The authors have reviewed and edited the output and take full responsibility for the content of this publication.
Conflicts of Interest
The authors declare no conflicts of interest.
References
- Libra, M.; Kozelka, M.; Šafránková, J.; Belza, R.; Poulek, V.; Beránek, V.; Sedláček, J.; Zholobov, M.; Šubrt, T.; Severová, L. Agrivoltaics: Dual usage of agricultural land for sustainable development. Int. Agrophys. 2024, 38, 121–126. [Google Scholar] [CrossRef] [Scilit]
- Elamri, Y.; Cheviron, B.; Mange, A.; Dejean, C.; Liron, F.; Belaud, G. Rain concentration and sheltering effect of solar panels on cultivated plots. Hydrol. Earth Syst. Sci. 2018, 22, 1285–1298. [Google Scholar] [CrossRef] [Scilit]
- Mulla, D.; Galzki, J.; Hanson, A.; Šimůnek, J. Measuring and modeling soil moisture and runoff at solar farms using a disconnected impervious surface approach. Vadose Zone J. 2024, 23, e20335. [Google Scholar] [CrossRef] [Scilit]
- Božiková, M.; Madola, V.; Bilčík, M.; Cviklovič, V. A hybrid ANN-transfer function framework for multi-dimensional PV tilt angle optimization. Energy Convers. Manag. X 2025, 28, 101216. [Google Scholar] [CrossRef] [Scilit]
- Madola, V.; Božiková, M.; Paulovič, S.; Bilčík, M. Investigation of PV System Tilt Angle by Neural Network Modelling of Energy Balance. Acta Technol. Agric. 2026, 29, 1–6. [Google Scholar] [CrossRef] [Scilit]
- Ochsner, T.E.; Cosh, M.H.; Cuenca, R.H.; Dorigo, W.A.; Draper, C.S.; Hagimoto, Y.; Kerr, Y.H.; Njoku, E.G.; Small, E.E.; Zreda, M. State of the art in large-scale soil moisture monitoring. Soil Sci. Soc. Am. J. 2013, 77, 1888–1919. [Google Scholar] [CrossRef] [Scilit]
- Vereecken, H.; Huisman, J.A.; Pachepsky, Y.; Montzka, C.; van der Kruk, J.; Bogena, H.; Weihermüller, L.; Herbst, M.; Martinez, G.; Vanderborght, J. On the spatio-temporal dynamics of soil moisture at the field scale. J. Hydrol. 2014, 516, 76–96. [Google Scholar] [CrossRef] [Scilit]
- Yavari Bajehbaj, R.; Cibin, R.; Duncan, J.M.; McPhillips, L.E. Quantifying soil moisture and evapotranspiration heterogeneity within a solar farm: Implications for stormwater management. J. Hydrol. 2024, 638, 131474. [Google Scholar] [CrossRef] [Scilit]
- Hassanpour Adeh, E.; Selker, J.S.; Higgins, C.W. Remarkable agrivoltaic influence on soil moisture, micrometeorology and water-use efficiency. PLoS ONE 2018, 13, e0203256. [Google Scholar] [CrossRef] [Scilit] [PubMed]
- Armstrong, A.; Ostle, N.J.; Whitaker, J. Solar park microclimate and vegetation management effects on grassland carbon cycling. Environ. Res. Lett. 2016, 11, 074016. [Google Scholar] [CrossRef] [Scilit]
- Madej, L.; Picon-Cochard, C.; Bouhier de l’Ecluse, C.; Cogny, C.; Michaud, L.; Roncoroni, M.; Colosse, D. One Year of Grassland Vegetation Dynamics in Two Sheep-Grazed Agrivoltaic Systems. AgriVoltaics Conf. Proc. 2024, 1, 1–10. [Google Scholar] [CrossRef] [Scilit]
- Moon, H.-W.; Ku, K.-M. Impact of an Agriphotovoltaic System on Metabolites and the Sensorial Quality of Cabbage (Brassica oleracea var. capitata) and Its High-Temperature-Extracted Juice. Foods 2022, 11, 498. [Google Scholar] [CrossRef] [Scilit] [PubMed]
- Hurlbert, S.H. Pseudoreplication and the Design of Ecological Field Experiments. Ecol. Monogr. 1984, 54, 187–211. [Google Scholar] [CrossRef] [Scilit]
- Acclima. TDR Soil Moisture Sensor User Manual. 2024. Available online: https://acclima.com/tdr-soil-moisture-sensor-user-manual/ (accessed on 14 September 2026).
- Robinson, D.A.; Jones, S.B.; Wraith, J.M.; Or, D.; Friedman, S.P. A review of advances in dielectric and electrical conductivity measurement in soils using time domain reflectometry. Vadose Zone J. 2003, 2, 444–475. [Google Scholar] [CrossRef] [Scilit]
- Maisha, R.; Steele, D.D.; Daigh, A.L.M.; Heeren, D.M.; Franz, T. Field Calibration of a Time-Domain Reflectometry Sensor for Water Content Measurement in Soils with Low Content of Coarse Fragments. Water 2025, 17, 1203. [Google Scholar] [CrossRef] [Scilit]
- FIEDLER AMS. Pt100-XM: Class-A Resistance Temperature Probes. Technical Sheet, p. 1. Available online: https://www.fiedler.company/sites/default/files/dokumenty/datasheet_pt100-xm.pdf (accessed on 15 September 2026).
- FIEDLER-MÁGR. Price List 2009; p. 8, TEP08. Available online: https://www.fiedler-magr.cz/sites/default/files/download/cenik2009.pdf (accessed on 15 September 2026).
- VÚMOP. Comprehensive Soil Survey (KPP): Digitalized Outputs. Profile ZXXX-029, Survey District 119 SS Ovčiny, Survey Year 1971. Available online: https://kppwiki.vumop.cz/index.php/Digitalizovan%C3%A9_v%C3%BDstupy_KPP (accessed on 14 September 2026).
- VÚMOP. Sand Content (0.05–2 mm) in the Topsoil of Agricultural Soils of the Czech Republic. Dataset Created. 31 December 2020. Available online: https://metadata.vumop.cz/record/basic/675c2ca7-fd4c-4eee-95e6-78f30a000319 (accessed on 14 September 2026).
- VÚMOP. Silt Content (0.002–0.05 mm) in Agricultural Topsoil. Dataset Created. 31 December 2020. Available online: https://metadata.vumop.cz/record/basic/675c2f0f-299c-41cf-b879-68ca0a000319 (accessed on 14 September 2026).
- VÚMOP. Clay Content (<0.002 mm) in Agricultural Topsoil. Dataset Created 31 December 2020. 31 December 2020. Available online: https://metadata.vumop.cz/record/basic/60895231-3330-4156-a33f-57190a000319 (accessed on 14 September 2026).
- VÚMOP. Dry Bulk Density of Agricultural Topsoil. Dataset Created. 31 December 2020. Available online: https://metadata.vumop.cz/record/basic/675c3c52-a688-4380-97c9-68cc0a000319 (accessed on 14 September 2026).
- Acclima. Digital True TDR-310H Soil Moisture Sensor (SDI-12) Data Sheet. 22 November 2022. Available online: https://acclima.com/digital-true-tdr-310h-sensor-sdi-12-data-sheet/ (accessed on 15 September 2026).
- Kozelka, M.; Poulek, V.; Beránek, V.; Finsterle, T. Repowering Without Removal: Field-Verified Multi-Year Outdoor Storage of Damaged Photovoltaic Modules on Agricultural Land in Czechia. Sustainability 2026, 18, 5632. [Google Scholar] [CrossRef] [Scilit]
- Poulek, V.; Beranek, V.; Finsterle, T.; Kozelka, M. Dry Pass, Wet Fail: Ground Impedance Testing of Field-Aged PV Modules—Implications for Repowering/Revamping Within 5–10 Years and for Environmental Sustainability. Sustainability 2026, 18, 1212. [Google Scholar] [CrossRef] [Scilit]
- Poulek, V.; Kozelka, M. Rapid Five-Year Repowering of Photovoltaic Power Plants in Demanding Climates: Effective Clean Recycling and Disassemblable PDMS Gel Encapsulation to Reduce the Environmental Impact. Sustainability 2026, 18, 3599. [Google Scholar] [CrossRef] [Scilit]
- Carvalho, F.; Montag, H.; Bentley, L.; Šarlej, R.; Broyd, R.C.; Blaydes, H.; Cattin, M.; Burke, M.; Wallwork, A.; Ramanayaka, S.; et al. Plant and soil responses to ground-mounted solar panels in temperate agricultural systems. Environ. Res. Lett. 2025, 20, 024003. [Google Scholar] [CrossRef] [Scilit]

Disclaimer/Publisher’s Note: The statements, opinions and data contained in all publications are solely those of the individual author(s) and contributor(s) and not of MDPI and/or the editor(s). MDPI and/or the editor(s) disclaim responsibility for any injury to people or property resulting from any ideas, methods, instructions or products referred to in the content. |
© 2026 by the authors. Licensee MDPI, Basel, Switzerland. This article is an open access article distributed under the terms and conditions of the Creative Commons Attribution (CC BY) license.