


Abstract
The declining and aging agricultural workforce in Japan has increased the need for labor-saving technologies that can support crop management. In this study, we used an unmanned aerial vehicle (UAV) equipped with a multispectral sensor to acquire NDVI images of paddy rice fields and classified rice growth stages using a Convolutional Neural Network (CNN). For practical UAV-based monitoring, flight altitude is an important factor because it affects both image resolution and field coverage. Therefore, this study evaluated the effect of UAV flight altitude on CNN-based growth-stage classification using NDVI images acquired at altitudes of 30, 60, and 100 m above ground level. Two types of altitude images were evaluated: simulated-altitude images generated by down-sampling 30 m images and actual-altitude images acquired at each flight altitude. When the CNN was trained and tested using simulated-altitude images, the test accuracies were 85.1% at 60 m and 83.6% at 100 m. When the CNN was trained using actual-altitude images, the test accuracies were 86.5% at 60 m and 87.8% at 100 m. Actual-altitude images at 60 and 100 m were available for only 8 of the 25 observation dates. In addition, when the model trained only on simulated-altitude images was applied to actual-altitude images, the accuracy at 100 m decreased to 0.5%, indicating a strong domain shift between simulated and actual high-altitude imagery. These results suggest that higher-altitude UAV imagery can support rice growth-stage classification when training data include images acquired at the actual operational altitude, whereas down-sampled images should not be regarded as a complete substitute for actual high-altitude images. The results should be interpreted with caution because the dataset was imbalanced across growth stages, with only one observation date representing the heading stage, and because the actual-altitude dataset was limited to selected observation dates.
Keywords:
NDVI; CNN; UAV; drone; remote sensing; growth-stage estimation; paddy rice; precision agriculture 1. Introduction
Japan’s agricultural sector faces serious challenges caused by a declining and aging workforce. The number of farmers in Japan has decreased substantially, and the average age of farmers has continued to increase [1]. Because crop management requires labor, field experience, and timely decision-making, labor-saving technologies are needed to support elderly farmers, part-time farmers, and newcomers to agriculture. Information and communication technologies, including remote sensing and artificial intelligence, are expected to help reduce labor requirements and support agricultural decision-making [2]. In this study, we focus on paddy rice, one of the most important crops in Japan.
Precision agriculture aims to improve crop management by observing spatial variability within fields and applying appropriate management practices to specific areas. In Japanese rice production, a single paddy field block is often relatively small, but growth conditions can vary even within the same field. Therefore, high-resolution observation is useful for identifying areas with insufficient growth and for supporting site-specific management, such as fertilization. The normalized difference vegetation index (NDVI) is widely used as an indicator of vegetation condition because it can be calculated from red and near-infrared reflectance. UAV-mounted multispectral sensors can acquire high-resolution NDVI images of paddy fields and are therefore suitable for field-scale rice monitoring.
Satellite remote sensing can observe wide areas and is useful for regional-scale agricultural monitoring. However, its spatial and temporal resolution may be insufficient for detailed management of small and fragmented paddy fields. UAV remote sensing, in contrast, can acquire high-resolution images at flexible timing when weather and flight conditions permit. This makes UAVs suitable for practical field-scale monitoring in Japan, where many paddy fields are relatively small. However, UAV-based monitoring also involves an operational trade-off. Lower flight altitudes provide higher spatial resolution but cover smaller areas and require longer flight time. Higher flight altitudes can increase the observable field area but reduce image resolution, which may affect classification accuracy.
Several previous studies have applied remote sensing and machine learning techniques to rice monitoring, including growth-stage classification, heading-date estimation, yield estimation, and phenology monitoring. Satellite-based studies using LANDSAT, Sentinel, and SAR data have demonstrated the value of broad-area monitoring, while UAV-based studies using multispectral imagery and vegetation indices such as NDVI and NDRE have shown the effectiveness of high-resolution spectral data for rice phenology and growth monitoring. However, relatively few studies have examined how UAV flight altitude and the resulting change in image resolution affect CNN-based rice growth-stage classification, particularly when comparing simulated-altitude images with actual images acquired at higher flight altitudes. This is an important practical issue because higher flight altitudes can increase the observable field area but may reduce the image details required for accurate classification.
In our previous study [3], we evaluated the feasibility of classifying paddy rice growth stages using CNNs and NDVI images. However, that study mainly used images acquired at 30 m and generated lower-resolution images by artificial image processing. Therefore, it did not fully evaluate the difference between simulated-altitude images and images actually acquired at higher flight altitudes. This is an important limitation because actual high-altitude images may include differences in optics, illumination, motion blur, viewing geometry, image registration, and radiometric response that cannot be reproduced by simple down-sampling.
Based on this research gap, the present study addresses the following research question: can CNN-based rice growth-stage classification using NDVI images maintain practical classification accuracy when UAV flight altitude is increased from 30 m to 60 m and 100 m? To answer this question, we acquired NDVI images of paddy rice fields using a UAV-mounted multispectral sensor and compared classification accuracy at different flight altitudes. We evaluated two types of altitude images: simulated-altitude images generated by down-sampling 30 m images and actual-altitude images acquired at 60 m and 100 m. The main contribution of this study is the practical evaluation of UAV flight altitude for CNN-based rice growth-stage classification, with particular attention to the difference between simulated-altitude and actual-altitude images.
The remainder of this paper is organized as follows. Section 2 reviews related work on rice monitoring using satellite, SAR, and UAV remote sensing. Section 3 describes the test field. Section 4 explains the UAV observation system and NDVI image processing. Section 5 describes the CNN-based growth-stage classification method. Section 6 presents the experimental results. Section 7 discusses the findings, Section 8 explains the limitations and practical implications, and Section 9 concludes the paper.
2. Related Work
Several studies have investigated remote sensing approaches for monitoring rice growth stages, canopy structure, phenology, yield, and management status. Satellite-based approaches are useful for wide-area monitoring. Ikasari et al. [4] classified paddy rice growth stages from LANDSAT-8 images using deep learning models with multiple regularization techniques. Fatchurrachman et al. [5] mapped paddy rice extent and growth stages using a fusion of Sentinel-1 and Sentinel-2 time-series data in Google Earth Engine. These studies demonstrated that satellite-based multispectral and SAR observations can be used to monitor rice growth over broad areas. However, the spatial resolution of satellite imagery is relatively coarse for detailed field-scale management, especially in small and fragmented paddy fields. In contrast, UAV-based remote sensing can acquire higher-resolution images and is suitable for field-scale monitoring.
SAR-based methods have also been applied to rice monitoring. Yuzugullu et al. [6] determined rice growth stages using X-band SAR data and a metamodel-based inversion approach. Lee et al. [7] estimated vegetation height in rice fields using single-polarization TanDEM-X Science Phase data. These studies demonstrated the usefulness of microwave remote sensing for retrieving rice growth and structural information. However, these approaches are based on SAR observations and model-based inversion, whereas the present study focuses on optical UAV imagery, NDVI images, and CNN-based classification.
Remote sensing has also been used for rice yield estimation and crop management. Setiyono et al. [8] integrated MODIS data, Sentinel-1 SAR-derived rice area information, and the ORYZA crop growth model to estimate spatial rice yield. Moreno-García et al. [9] evaluated vegetation indices derived from aerial images for nitrogen recommendations in Mediterranean rice systems. These studies show that remote sensing data can support practical decision-making in rice production, including yield estimation and site-specific fertilization. The present study is also motivated by practical agricultural management, but it focuses on growth-stage classification and the operational conditions of UAV image acquisition.
Recent UAV-based studies have further highlighted the potential of high-resolution multispectral imagery for rice phenology monitoring. Liu et al. [10] estimated rice full heading date using UAV-retrieved canopy spectra and vegetation indices, including NDVI and NDRE, combined with a Random Forest model. Their study reported that the model could estimate full heading date with root mean square errors below four days, showing the usefulness of UAV-derived vegetation-index time series for rice phenology estimation. Qiu et al. [11] predicted the growth periods of 327 rice varieties using UAV multispectral remote sensing, deep-learning-based rice contour extraction, and NDVI-based curve fitting. Zhang et al. [12] used UAV observations as spatially continuous ground reference data and linked them with Sentinel-2 imagery to map key rice growth stages over a larger area. These recent studies indicate that UAV imagery is effective for collecting high-resolution phenological information and can also contribute to broader-scale rice monitoring.
Although previous studies have demonstrated the usefulness of satellite, SAR, and UAV observations for rice monitoring, limited attention has been paid to the practical effect of UAV flight altitude on CNN-based rice growth-stage classification. UAV flight altitude is an important operational parameter because it determines the trade-off between image resolution and observable field area. Lower flight altitudes provide finer image detail but require longer flight time and cover smaller areas. Higher flight altitudes can increase field coverage but reduce spatial resolution, which may affect classification accuracy. Some UAV remote-sensing studies have discussed flight parameters and image resolution, but relatively few studies have directly compared CNN-based rice growth-stage classification accuracy using both simulated-altitude images and actual-altitude images acquired at different UAV flight altitudes.
Previous UAV-based agricultural studies have also examined the influence of flight altitude and image resolution on monitoring accuracy. Flight altitude directly affects ground sampling distance, image coverage, and the level of spatial detail available for classification or segmentation [13]. Recent UAV-based rice-monitoring studies have shown that multispectral imagery and vegetation indices are useful for estimating rice phenology, heading date, and growth periods [10,11,12]. However, studies on UAV-based crop and weed monitoring have also shown that the effect of spatial resolution on classification accuracy depends on the target object and monitoring purpose [14]. In addition, domain adaptation studies in remote sensing have shown that models trained on one image domain may fail when applied to another domain because of differences in sensor characteristics, acquisition conditions, spatial resolution, and spectral distributions [15]. This issue is closely related to the present study because down-sampled 30 m images and actual high-altitude images can be regarded as different image domains.
The novelty of the present study lies not in proposing a new CNN architecture, but in evaluating the practical effect of UAV flight altitude on rice growth-stage classification using NDVI images. In particular, this study compares simulated-altitude images generated by down-sampling 30 m images with actual-altitude images acquired at 60 m and 100 m. This comparison is important because down-sampled images mainly reproduce the reduction in spatial resolution, whereas actual high-altitude images may also include differences in optical response, motion blur, illumination, viewing geometry, image registration error, and radiometric response. Therefore, the present study contributes to practical UAV-based rice monitoring by clarifying whether higher flight altitudes can be used while maintaining classification accuracy and by examining the limitations of using down-sampled images as substitutes for actual high-altitude images.
Table 1 compares the present study with previous studies on rice monitoring using satellite, SAR, and UAV remote sensing. Previous studies have demonstrated the usefulness of satellite and UAV data for rice growth-stage classification, phenology monitoring, yield estimation, and growth-period prediction. However, most of these studies did not directly evaluate the practical effect of UAV flight altitude on CNN-based rice growth-stage classification. In contrast, the present study focuses on the operational question of whether UAV flight altitude can be increased from 30 m to 60 m and 100 m while maintaining classification accuracy.
Table 1.
Comparison of related studies on rice monitoring and the present study.
3. Test Field
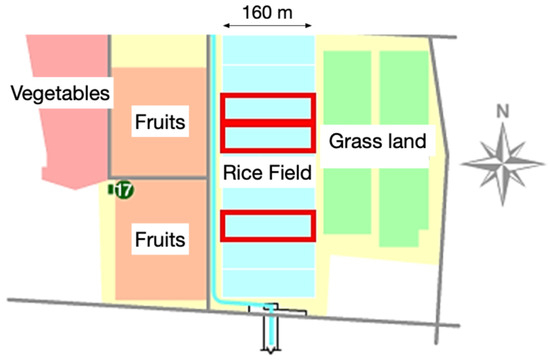
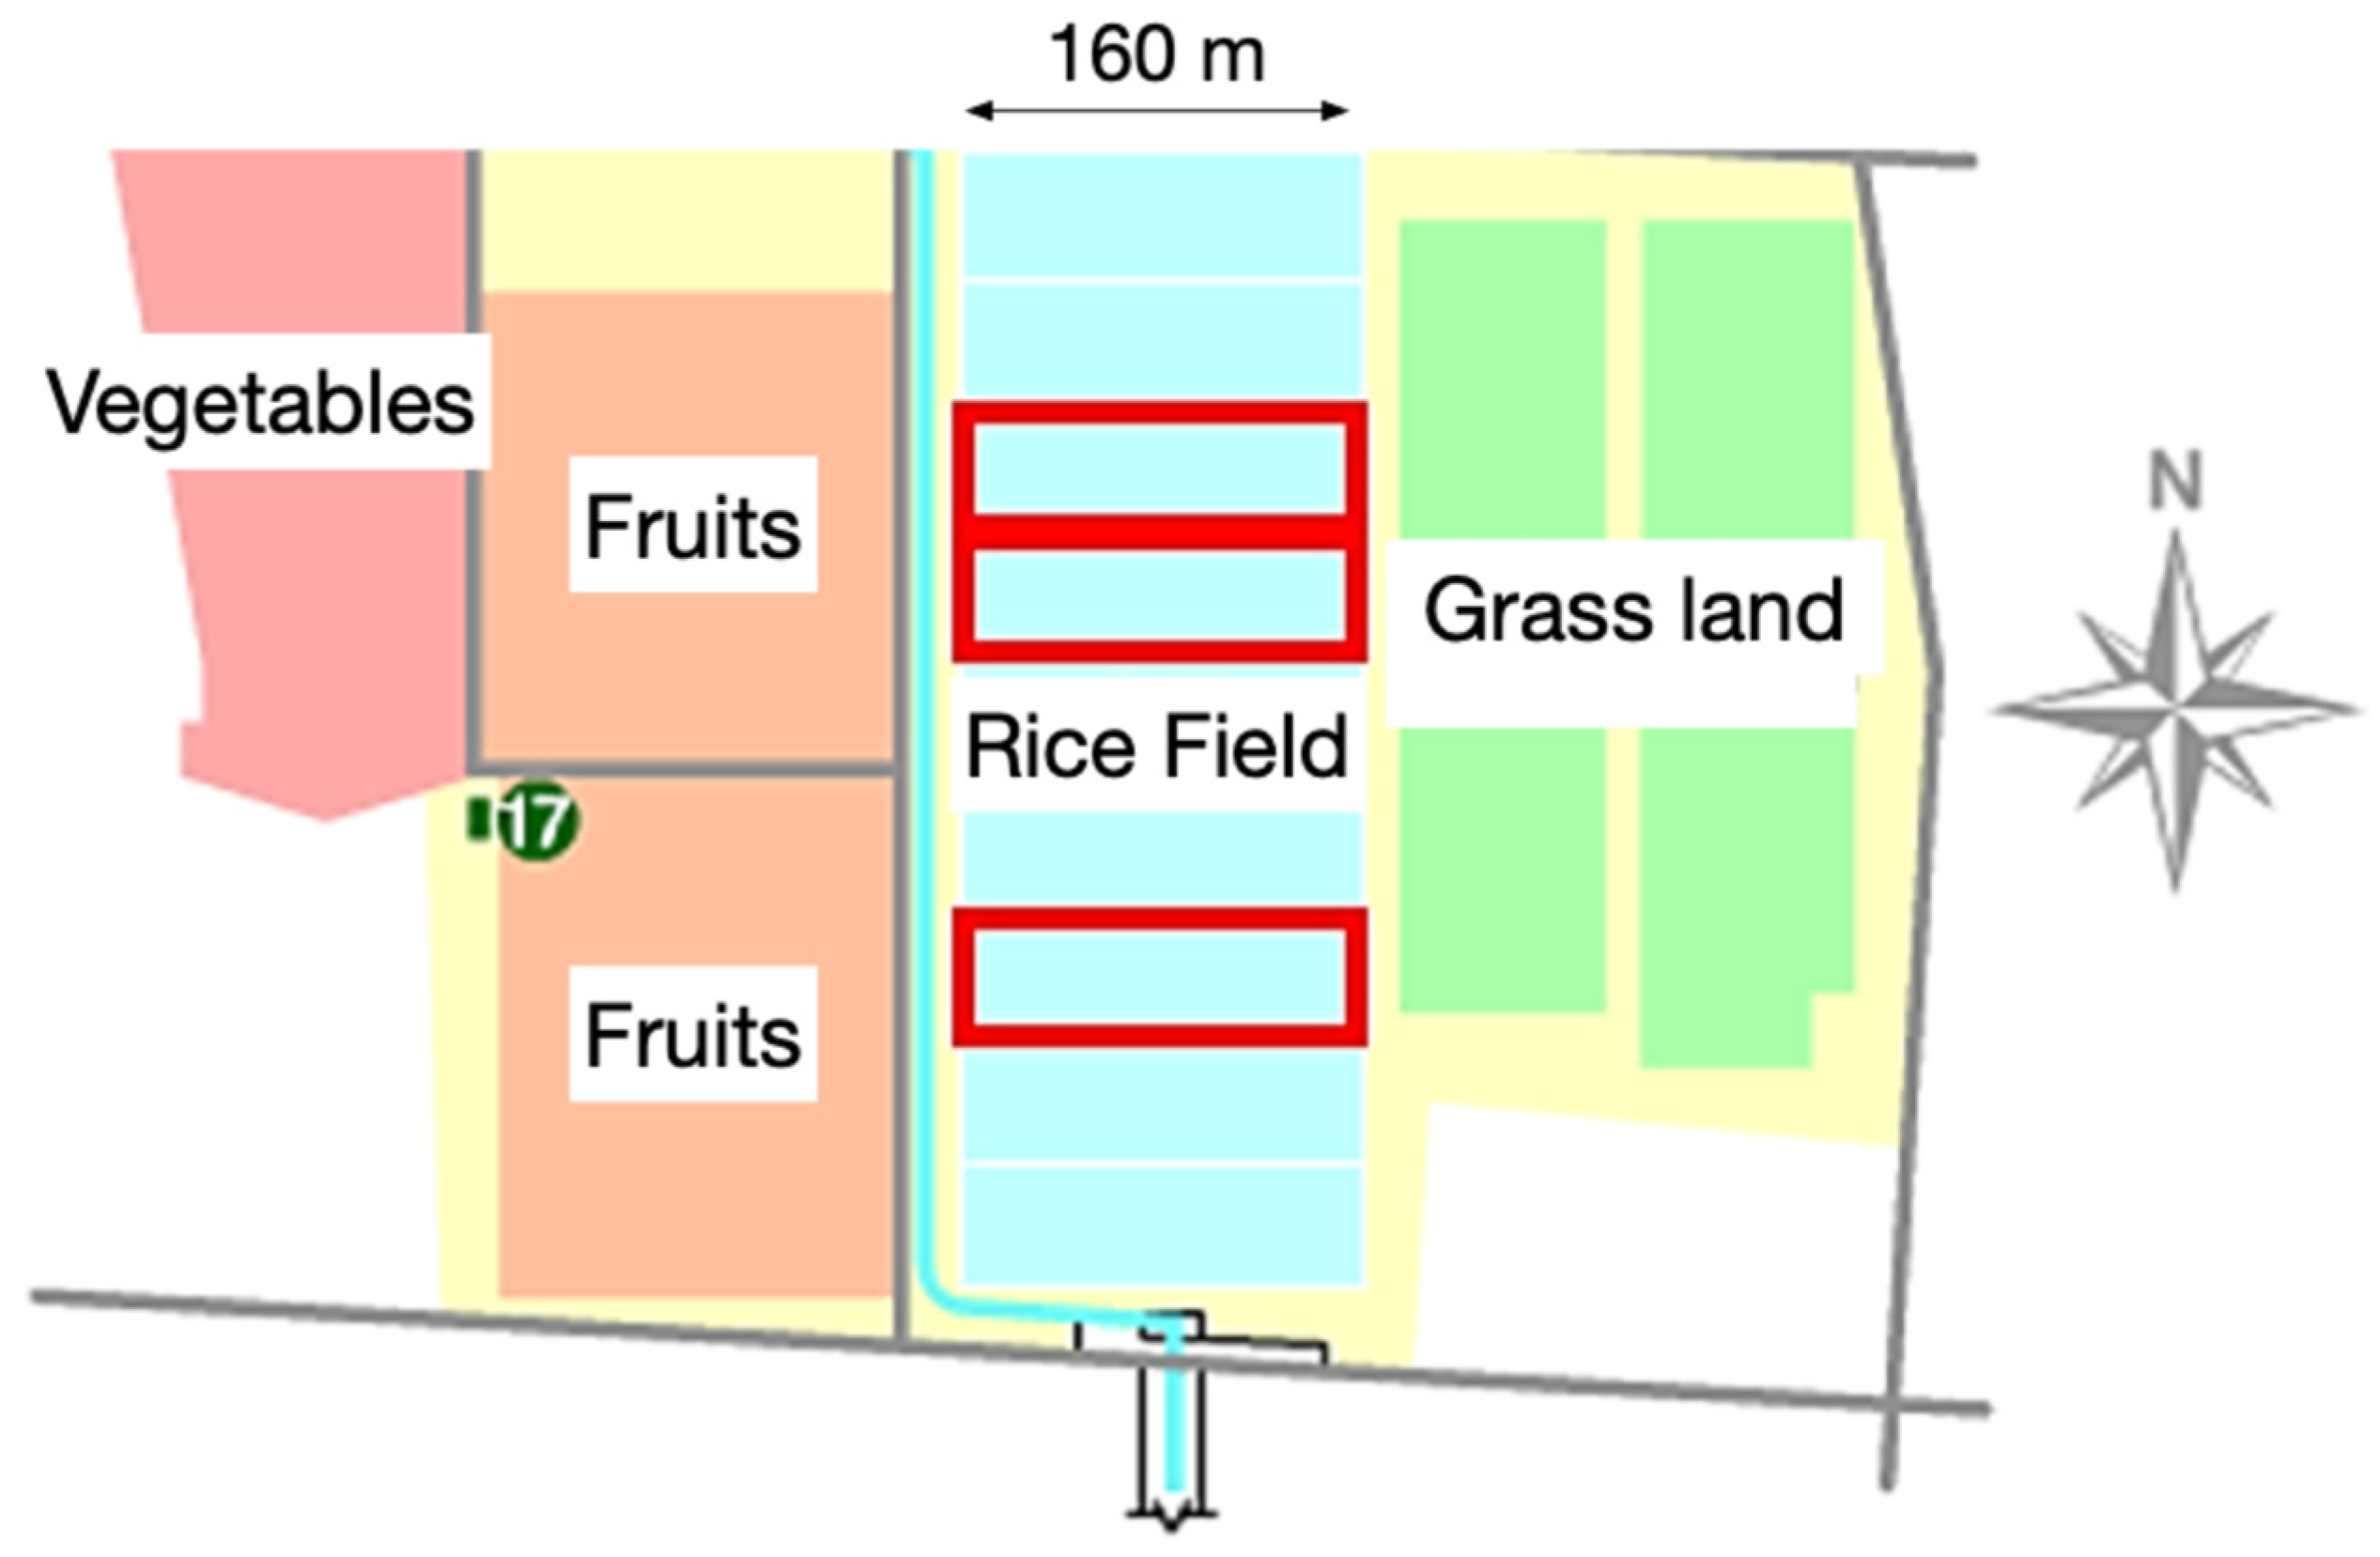
The Faculty of Agriculture farm at Utsunomiya University is used as a test field, with 10 rice-field blocks. Three of the rice fields on the farm were used for this research (Figure 1).
Figure 1.
The rice farm of Utsunomiya University. The three red boxes are the rice fields that we used.
The paddy field is approximately 0.8 ha (50 m × 160 m). The rice is “Yudai 21”, the original rice cultivar that was discovered on this farm. We mainly observed the third field from the north. The rice variety “Yudai 21” was selected because it was developed at Utsunomiya University and was cultivated at the experimental farm used in this study. This is a limitation of this study.
No special experimental treatment was applied. The field was managed according to standard local cultivation practices used at the university farm. Detailed records of fertilization and pesticide application were not fully available, and this is acknowledged as a limitation. The experiments were performed in the morning (10–11 A.M.), and flights were not conducted under rainy conditions or when wind speed exceeded 5 m/s.
The field was managed under standard cultivation practices used at the university farm, and no special experimental treatment was applied. However, detailed records of fertilization and pesticide application were not fully available. This is an important limitation because management practices can affect canopy growth, NDVI values, and growth-stage appearance. Therefore, the results should be interpreted as field- and management-specific. The approximate location of the experimental field was 36.488920° N, 139.985485° E.
4. Methods
In this section, we explain our method for observing rice fields with a drone, particularly the image-processing technique for classifying growth stages using deep learning.
4.1. Research Plan
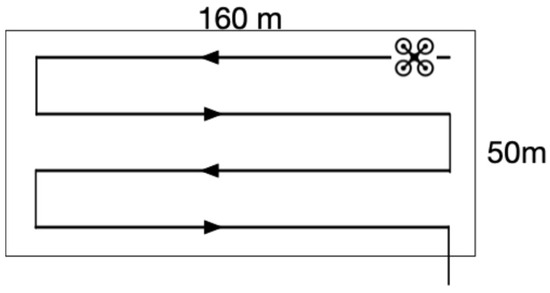
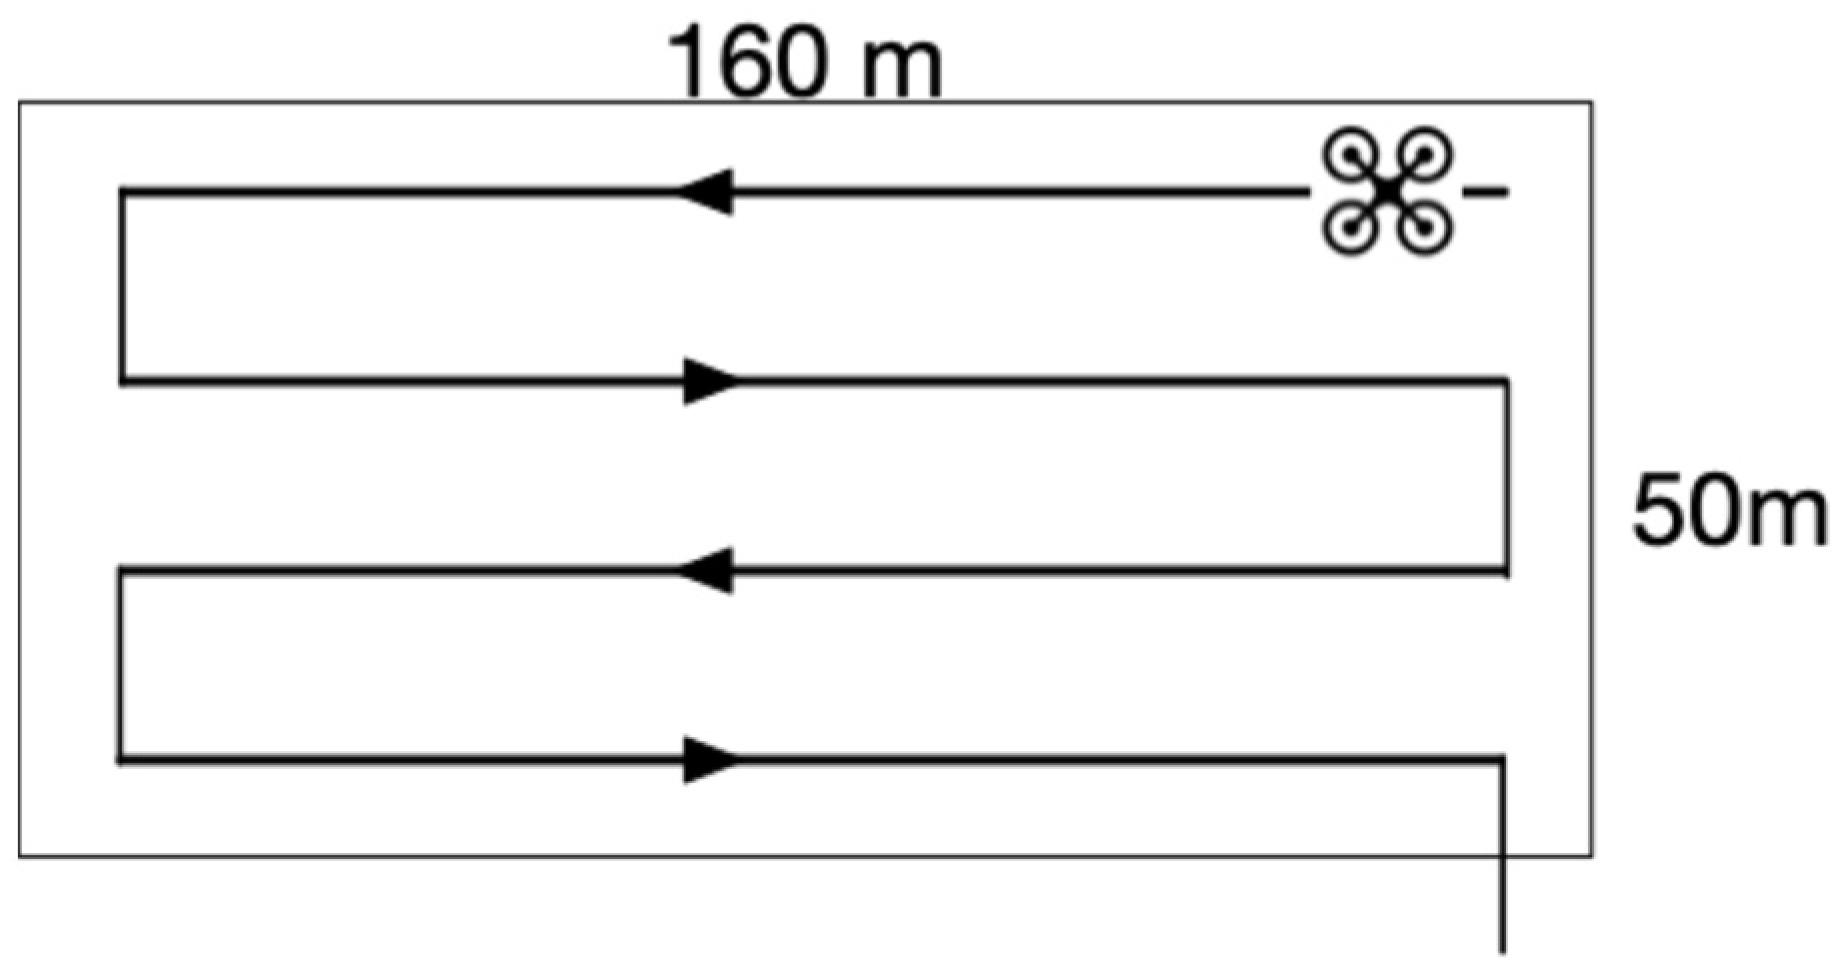
We used a drone as the remote sensing platform. The drone is “Phantom 3 Standard” [16]. The Phantom 3 can fly automatically via waypoint flight. We used an iPad application “DJI GS Pro (v.1.8)” to designate the waypoint [17]. Stable observation is possible by waypoint flight. The image of the flight route is shown in Figure 2.
Figure 2.
Flying route of a drone. The arrow shows the direction. The flying heights were 30 m/60 m/100 m.
We also attached a multispectral sensor “Sequoia” to the drone [18]. The weight is 72 g. It is possible to carry a small drone and take pictures at any time. Sequoia shoots continuous pictures of multiple wavelength bands. Sequoia can also get GPS. Location information is necessary for creating a vegetation index map. We used a typical sponge as a vibration-proof material. It is supposed to reduce deterioration in shot image quality.
A commercially available sponge approximately 3 cm thick was placed between the UAV body and the Sequoia sensor as a vibration-damping material. This sponge-based mounting method was a practical solution used in the original field experiment, but it was not a scientifically validated vibration-isolation system. Before data collection, the captured images were visually checked to confirm that no severe image blur was observed. However, no quantitative vibration test was conducted, and the effect of vibration on image quality was not measured. This is an important limitation because vibration-induced blur may affect image quality and classification accuracy, especially when images are acquired under different flight conditions. Future studies should use a mechanically characterized sensor mount and evaluate vibration using image sharpness metrics or inertial measurements.
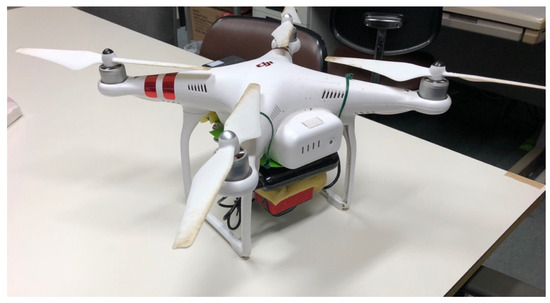
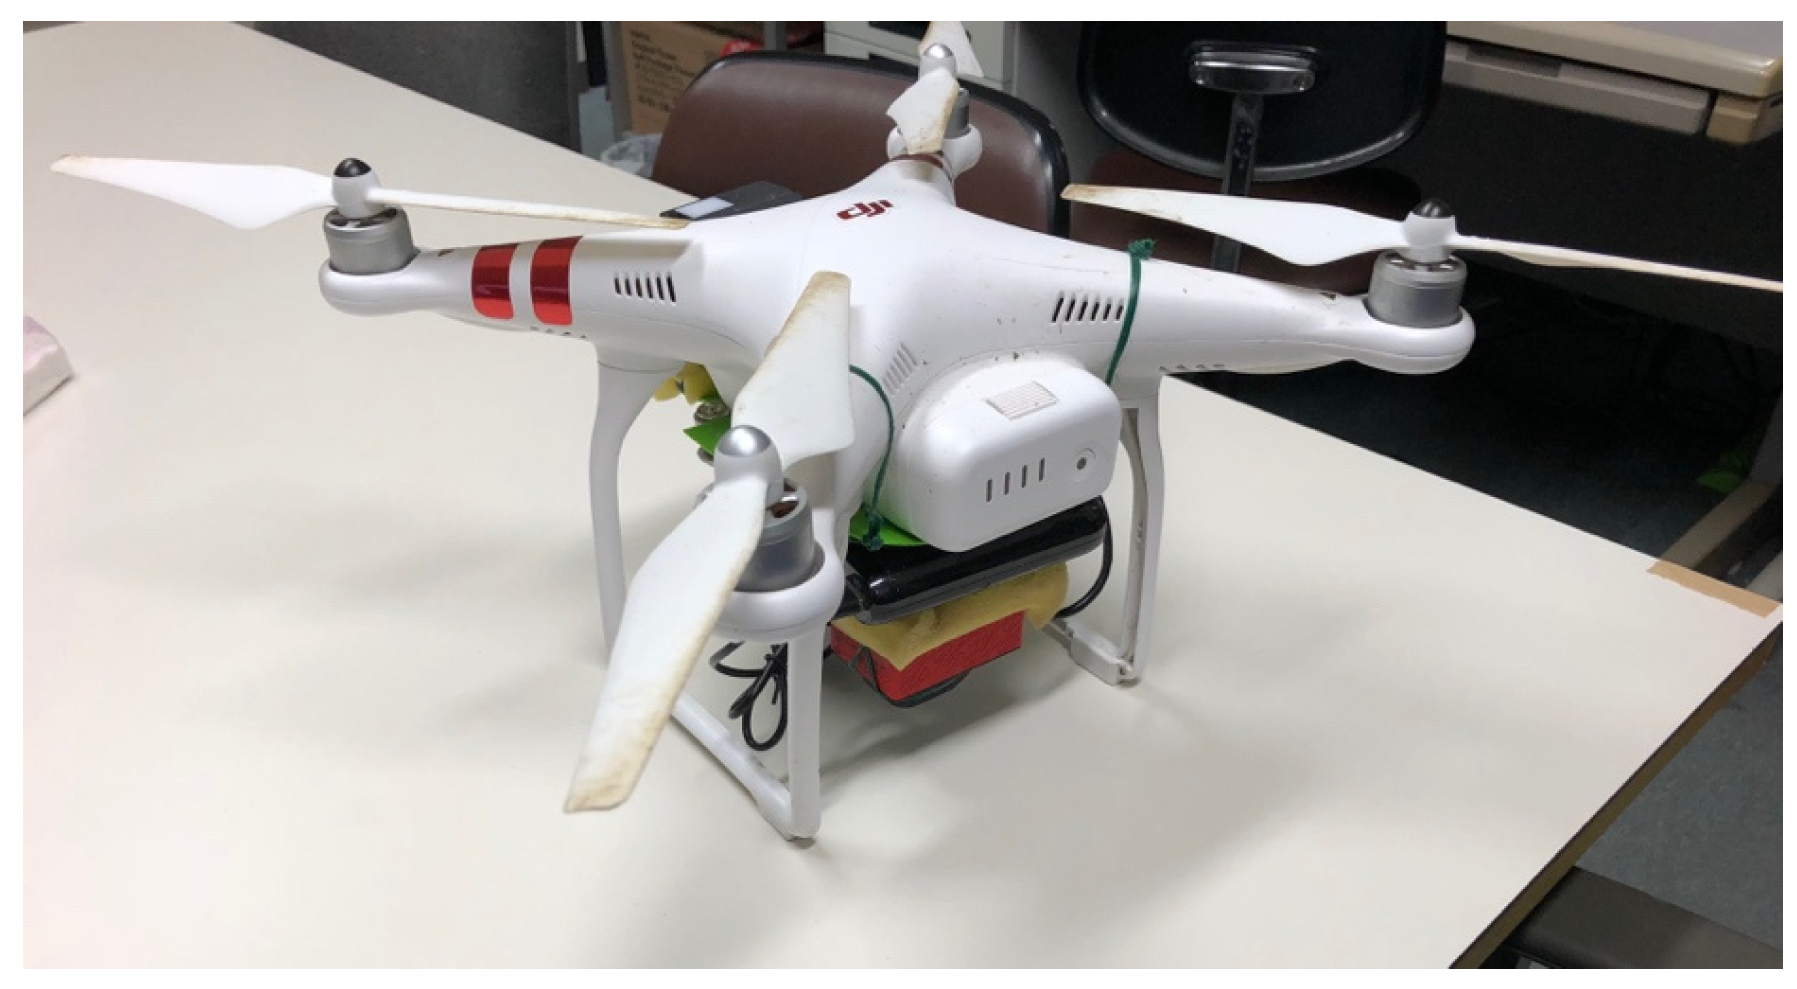
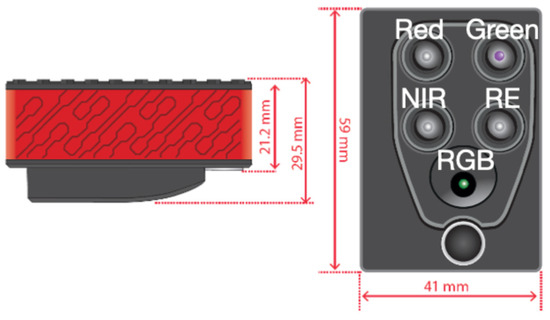
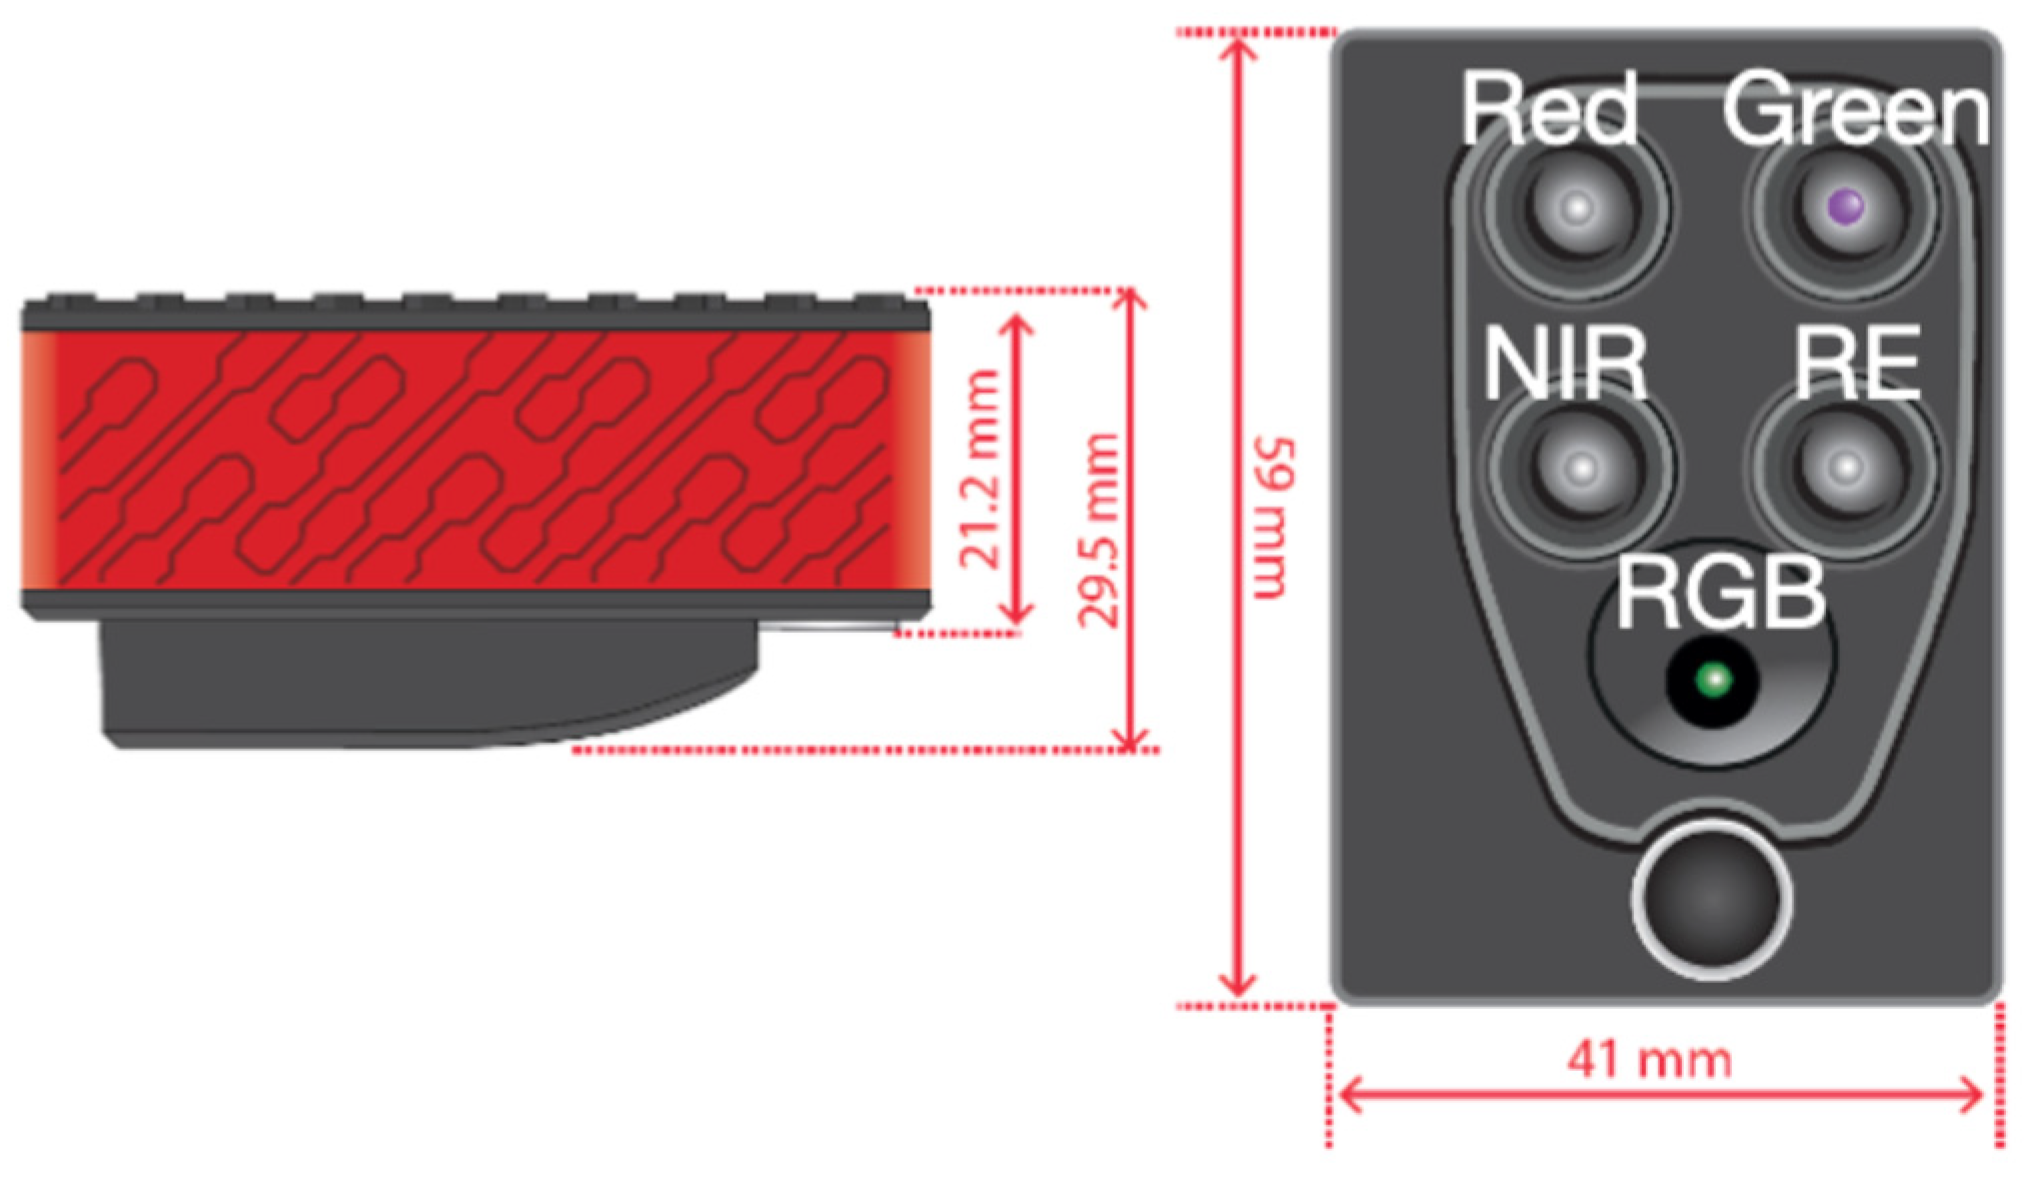
Figure 3 shows Sequoia and Phantom 3. Table 2 shows detectable wavebands of Sequoia. Sequoia can get four wavebands: Green, Red, Red Edge, and Near Infrared. Sequoia’s sunshine sensor observes incident light, and Sequoia’s multispectral sensor observes reflected light. They make it possible to obtain more accurate reflectance. Also, we took a calibration panel with known reflectance before the drone flight.
Figure 3.
Sequoia and Phantom 3.
Table 2.
Detectable wavebands of Sequoia.
The calibration panel images acquired before and after each flight session were used to determine the calibration coefficient for DN-to-reflectance conversion. The Red and NIR reflectance values of the panel were 0.73 and 0.68, respectively. The same calibration procedure was applied to all images. However, detailed logs of illumination changes during each flight and quantitative evaluation of calibration uncertainty were not retained. Therefore, possible residual radiometric errors are acknowledged as a limitation.
We set the following parameters: The horizontal speed of the Phantom 3 was 4 m/s. It flew 30 m, 60 m, and 100 m high above the ground. The shutter interval of Sequoia is 1.5 s. Also, Sequoia’s camera resolution is 1.2 million pixels. A photograph was taken from a height of 30 m, which means 3.7 cm/pixel. These observation parameters meet the image overlap rate of 60–80%, which is necessary for image processing accuracy [13]. Table 3 shows the date and height of the observation in 2018. As shown in the table, we photographed at heights of 60 m and 100 m on 6 August. We mainly observed the rice field 25 times using the drone in the morning.
Table 3.
Date and height of observation, and weather.
The original experimental logs did not retain the exact total number of images acquired during each flight, the flight duration per mission, or detailed battery-use records. Therefore, we cannot reliably reconstruct the exact number of flights per battery. For the image analysis described in Section 5.2, 30 pairs of Red and Near Infrared images were randomly selected from the images acquired on each observation date. These 30 image pairs represent the images selected for analysis and not the total number of images acquired during a flight.
The overlap rate of 60–80% was planned based on the flight speed, shutter interval, flight altitude, and sensor specifications. However, the actual overlap rate was not quantitatively calculated for each flight after data acquisition. Therefore, possible variation in image overlap among flights is acknowledged as a limitation.
The flight altitudes of 30, 60, and 100 m were selected to evaluate the trade-off between image resolution and observable field area. A flight altitude of 30 m was used as the baseline condition because it provides high-resolution images. The altitudes of 60 and 100 m were selected to evaluate whether wider-area observation could be achieved while maintaining classification accuracy. Under ideal conditions, increasing the altitude from 30 m to 100 m increases the observable area by approximately (100/30)2, although the actual observable area is affected by takeoff, landing, turning, and return-to-home time.
4.2. Image Processing for NDVI
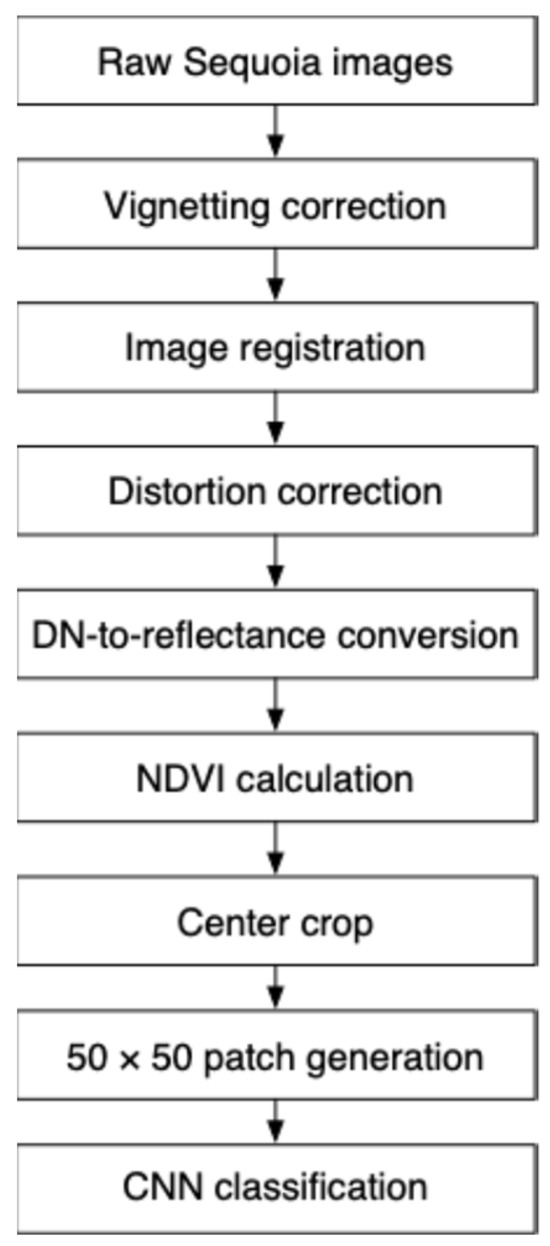
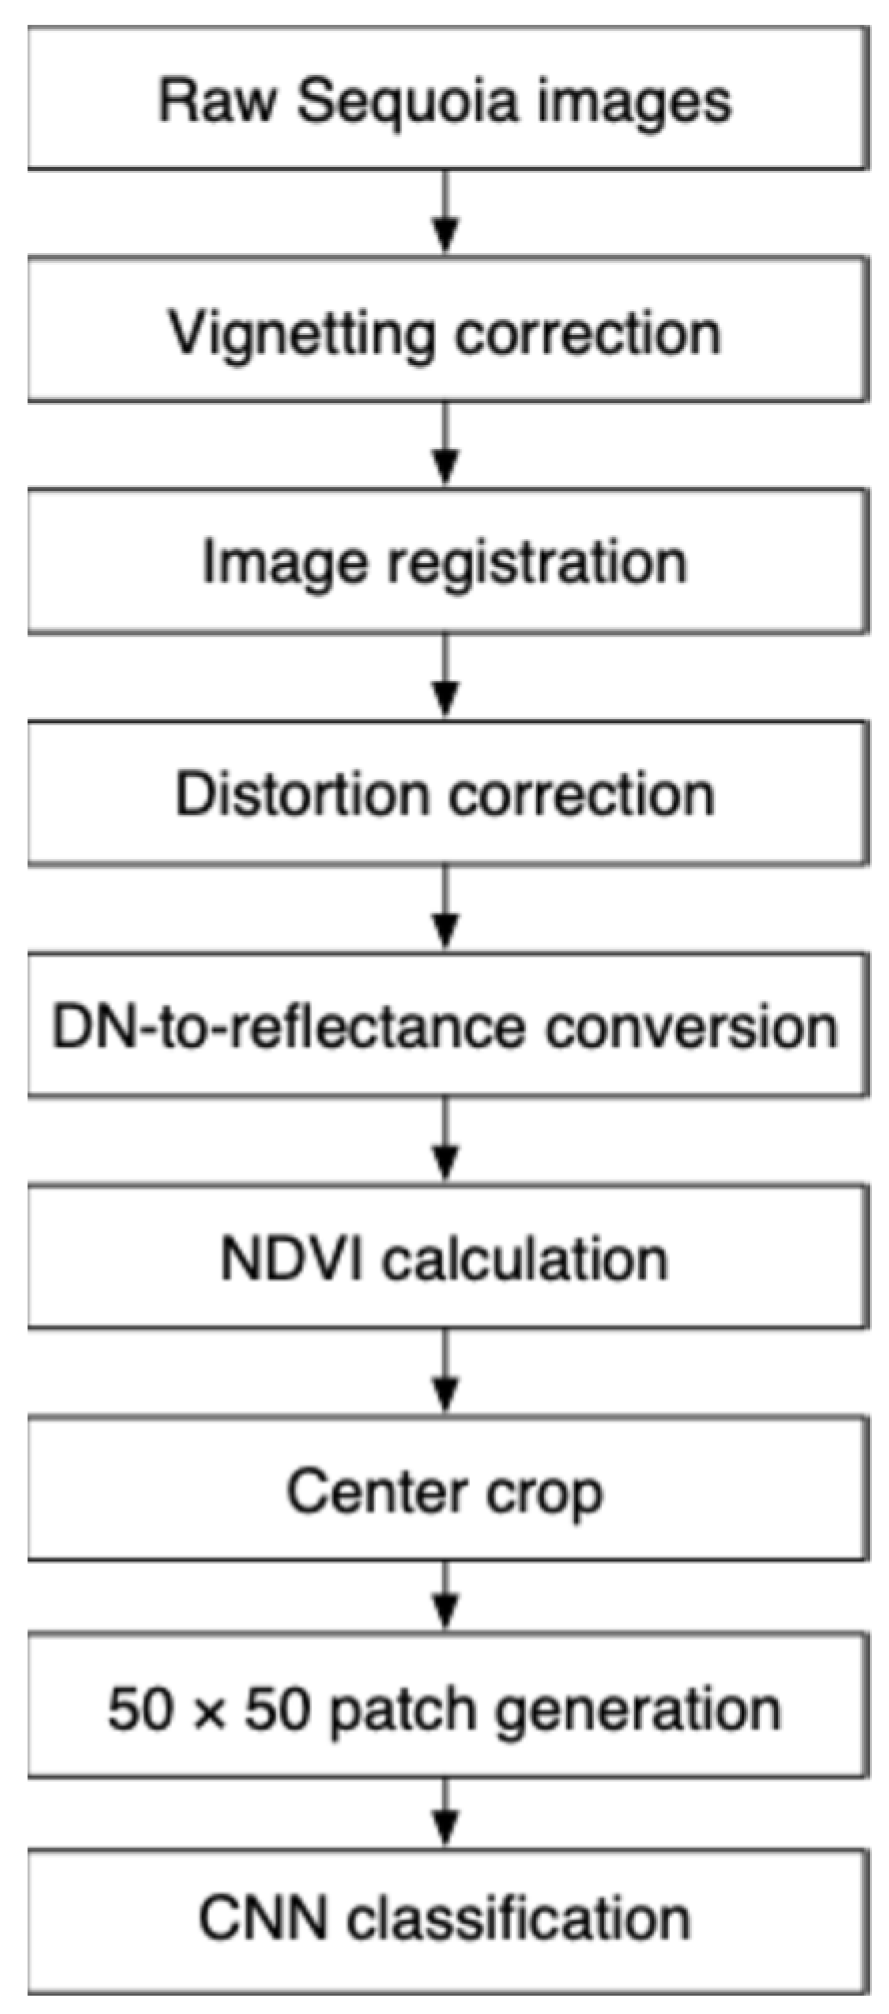
The overall workflow of NDVI image processing and patch generation is shown in Figure 4.
Figure 4.
NDVI image-processing workflow.
Before each flight session, the Phantom 3 Standard and Sequoia sensor were powered on, and the calibration panel with known reflectance values (0.73 for Red and 0.68 for NIR) was photographed. The Sequoia sensor was then set to continuous shooting mode, and UAV flight missions were conducted using DJI GS Pro. After the flight missions, the calibration panel was photographed again before the devices were powered off. The same radiometric correction procedure was applied consistently to all flights. In this study, only the Red and NIR bands were used to calculate NDVI.
The acquired multispectral images were processed through vignetting correction, image registration, distortion correction, DN-to-reflectance conversion, and NDVI calculation. Reflectance values smaller than 0 were clipped to 0, and values larger than 1 were clipped to 1 before calculating NDVI.
As a quality-control step, processed NDVI images were visually checked, and images with obvious processing failures, severe blur, or severe artifacts were not used. However, no quantitative image-quality threshold, such as registration error, blur index, or radiometric uncertainty, was applied. Future studies should introduce quantitative quality-control metrics for UAV multispectral image processing.
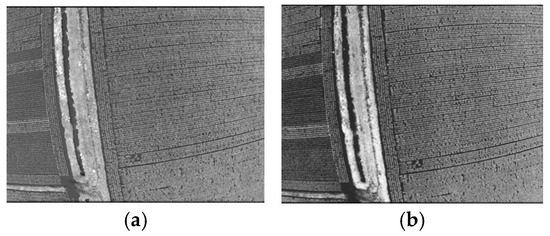
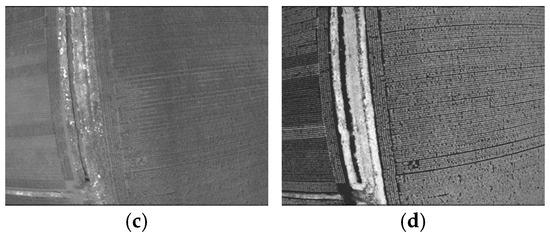
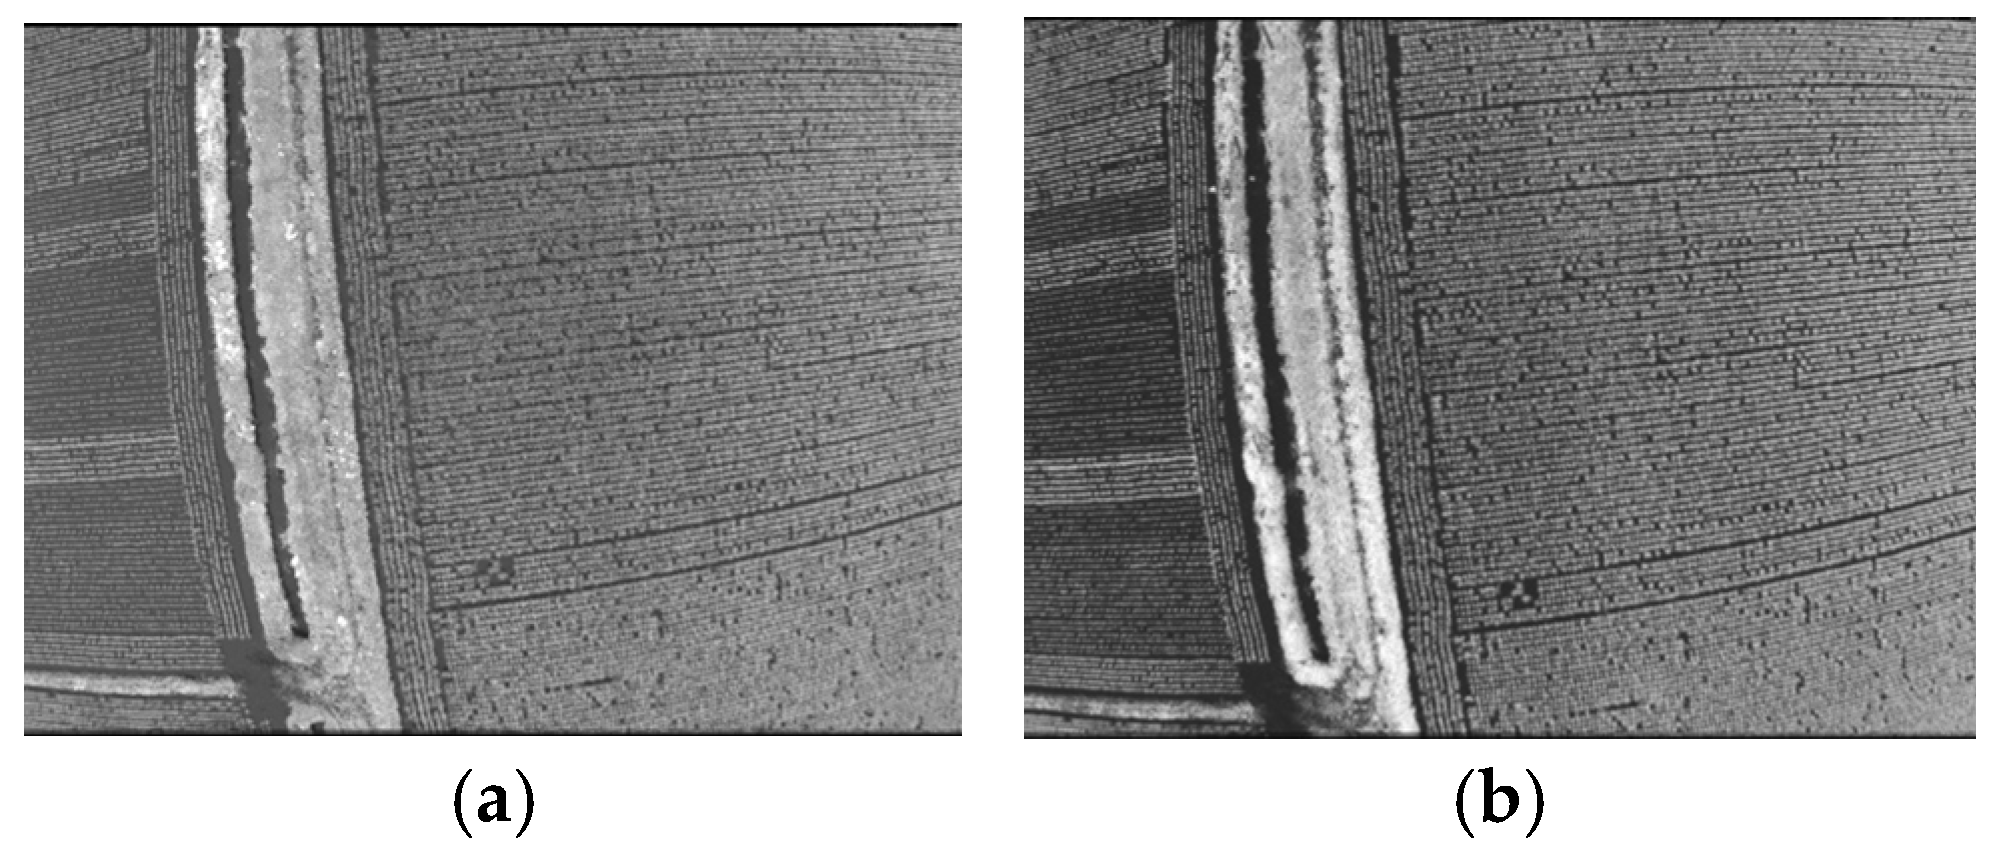
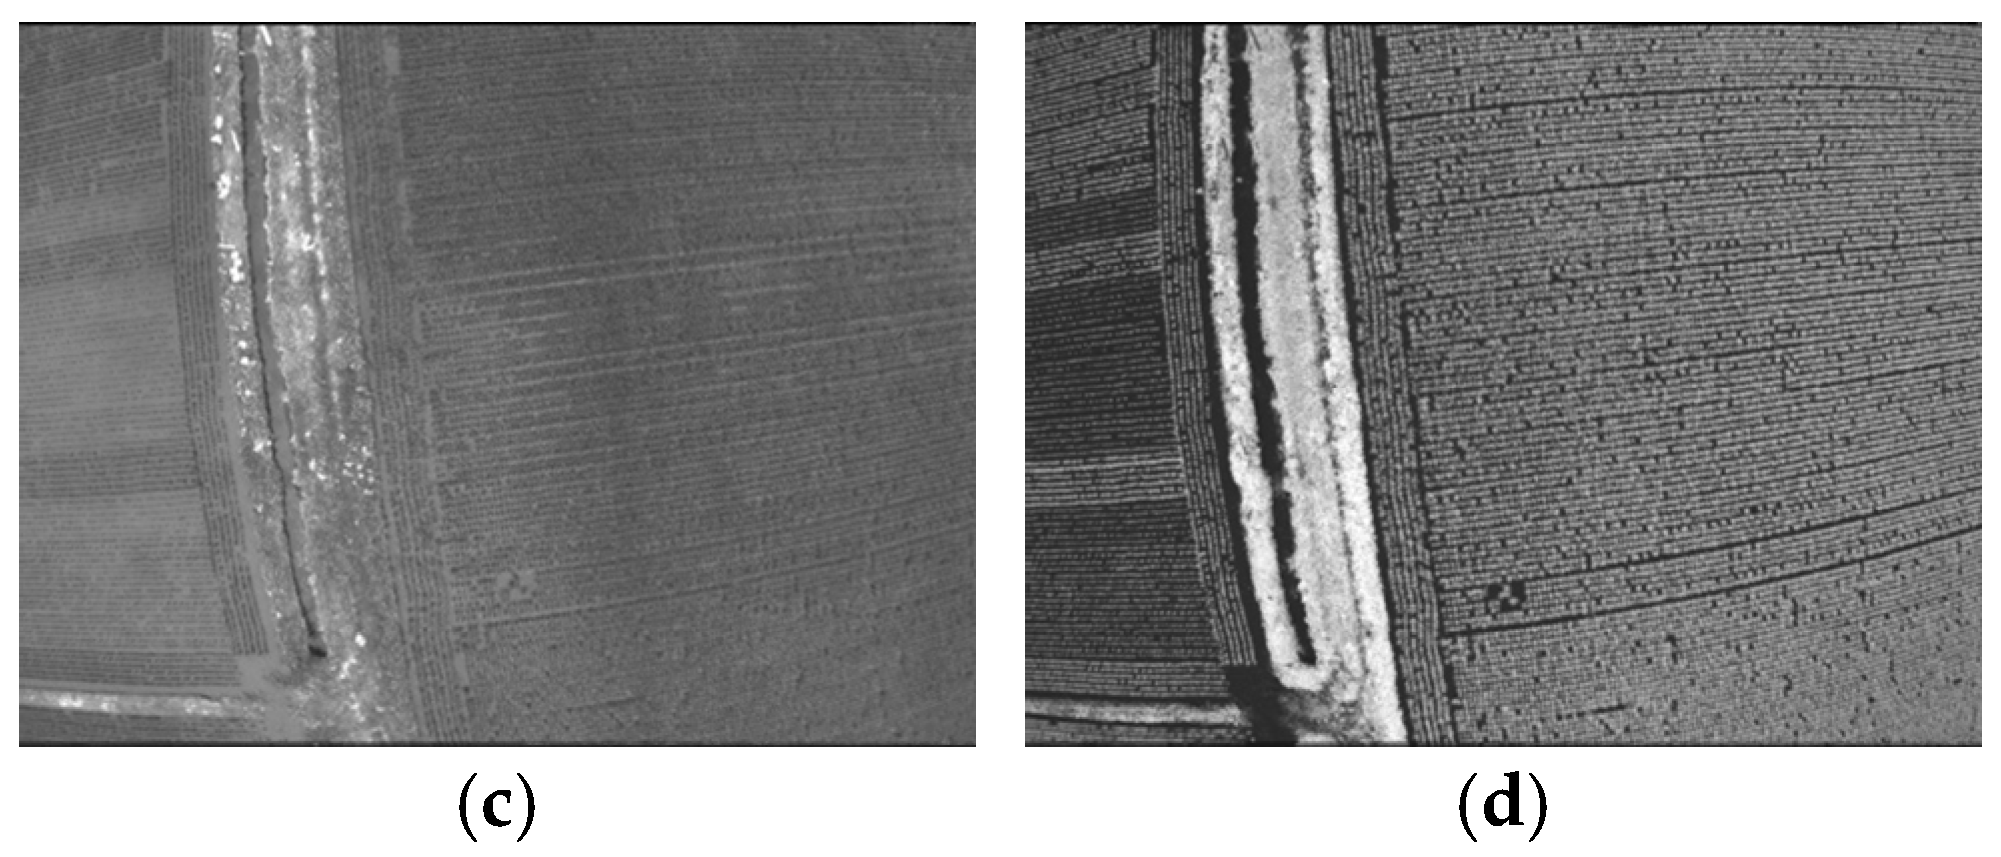
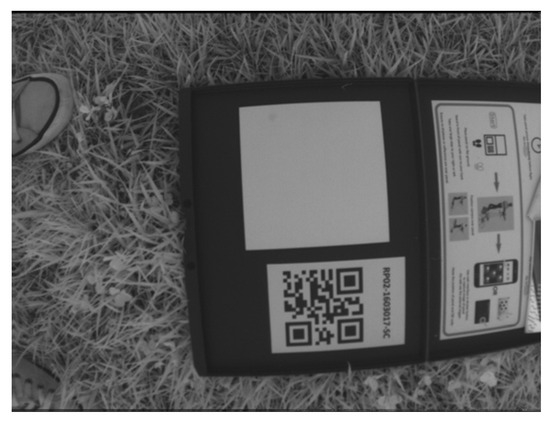
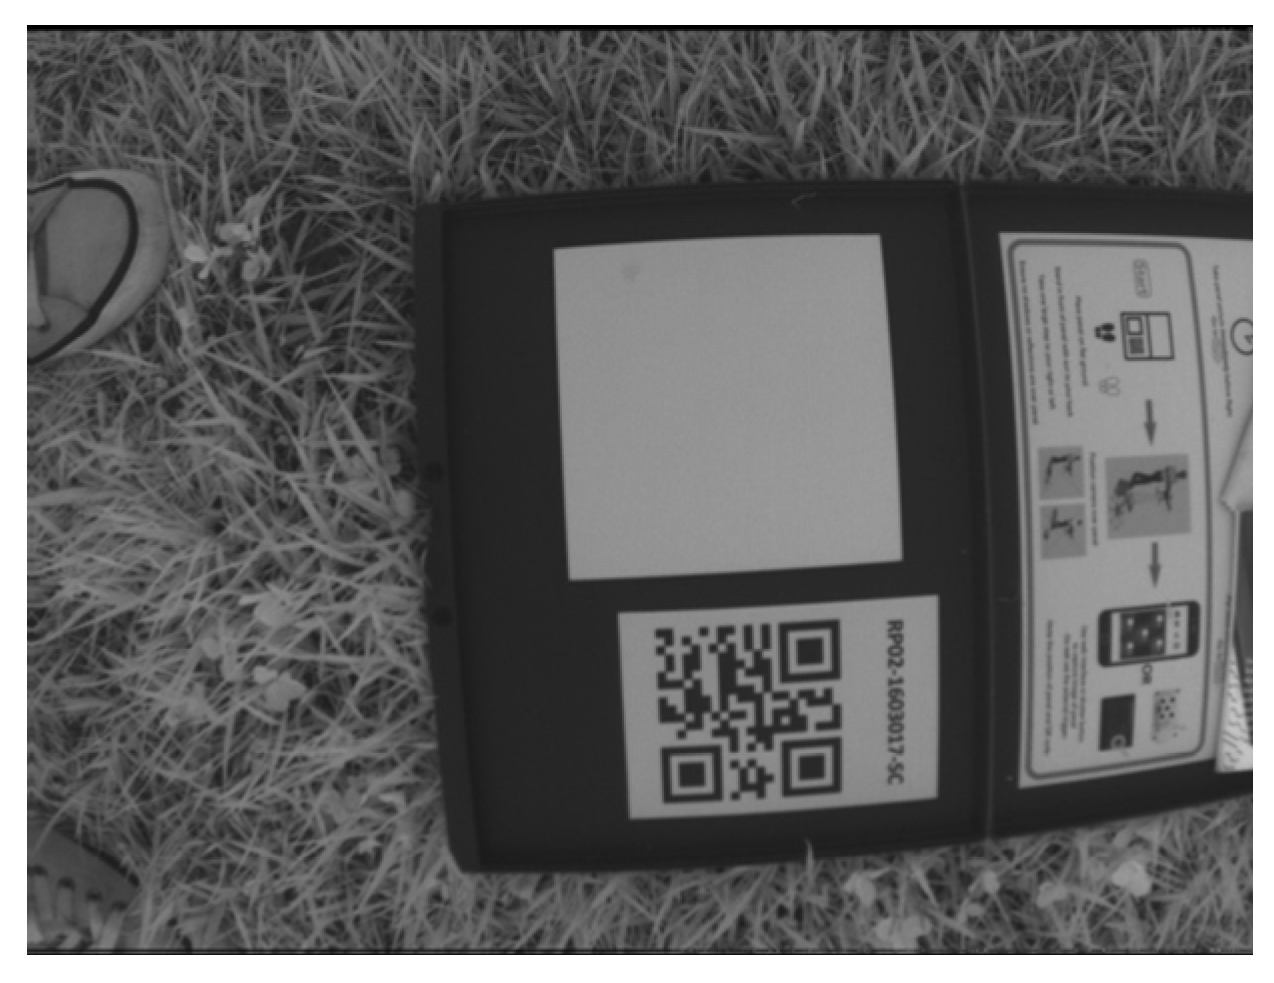
Figure 5 is a part of the images taken by Sequoia on 25 June. Because the captured images are grayscale, they are black-and-white. The DN (Digital Number) of the images does not indicate the reflectance of each waveband. We used Equation (1) to convert DN to reflectance, thereby obtaining the vegetation index [11].
Figure 5.
Images captured by Sequoia on 25 June: Green (a), Near Infrared (b), Red (c), Red Edge (d).
R is the reflectance associated with any pixel value. Isq is the irradiance captured by Sequoia at an observation angle of θ, and Iss is the irradiance captured by the sunshine sensor. K is the calibration coefficient, which must be determined using a calibration methodology before each flight. Figure 6 shows a near-infrared image of the calibration panel. The near-infrared reflectance of the calibration panel is 0.68, and the red reflectance is 0.73.
Figure 6.
Near Infrared image of calibration panel.
The Sequoia camera has a vignetting effect. Inoue has reported that it is necessary to consider vignetting effect as a sensor factor in the image quality [19]. With reference to Parrot application note [20], we used Equation (2) to correct vignetting of the images. p(xp, yp) is a pixel value, v(xp, yp) is a vignetting and i(xp, yp) is an irradiance at coordinate (xp, yp).
p(xp,yp) = v(xp,yp) i(xp,yp)
Sequoia has four sensors: Red, Green, Red Edge, and Near Infrared (Figure 7). Four captured images exhibit positional aberrations depending on the position of each camera. If we do not register images, we calculate the vegetation index using the reflectance of the unpaired coordinate. To solve this problem, we registered Sequoia images, using an application note from Parrot.
Figure 7.
Four sensors of Sequoia.
Image registration was performed according to the Parrot Sequoia application note. However, the exact registration algorithm implemented in the processing workflow and the registration error were not quantitatively recorded in the original experiment. Therefore, residual band misregistration may have affected the calculated NDVI values, especially near field boundaries or areas with sharp spatial changes. This is acknowledged as a limitation.
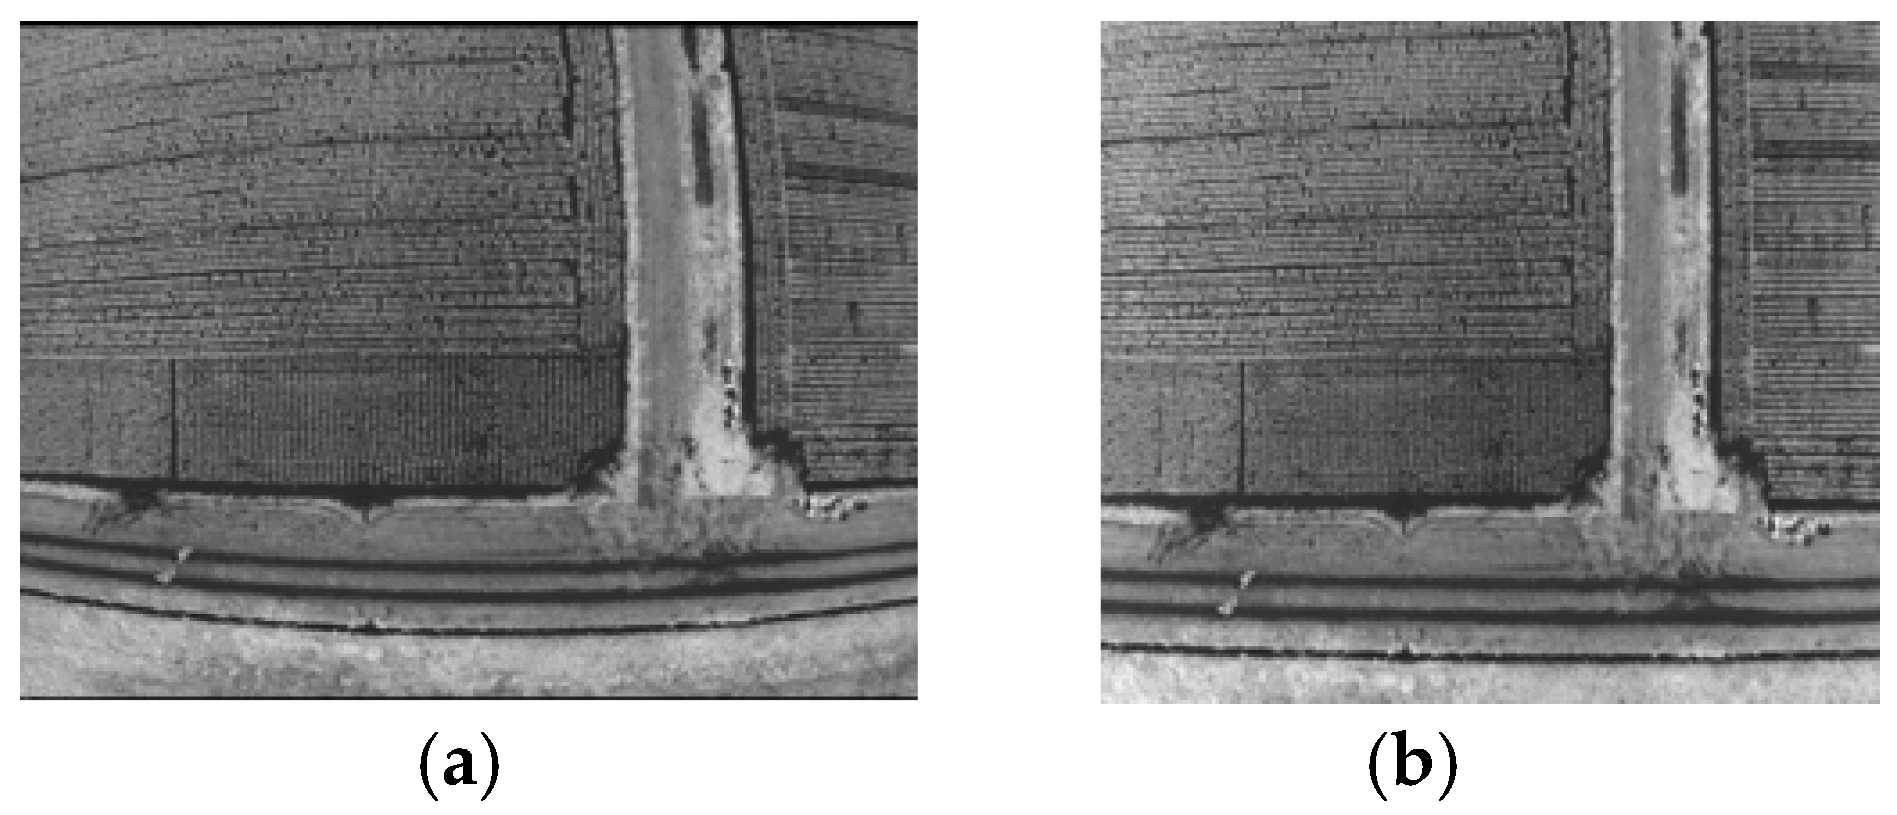
Sequoia images also have fisheye distortion. We corrected the distortion in the images in the Parrot application note [20]. Figure 8 shows an example of distortion correction. Since black pixels remain only after distortion correction, we cut out rectangles to remove them.
Figure 8.
An example of image distortion correction: (a) before correction and (b) after correction.
We used NDVI as the vegetation index. NDVI is one of the most widely used vegetation indices. We create NDVI images with the following flow:
- Vignetting correction
- Image registration
- Distortion correction
- Convert DN to reflectance
- Calculate NDVI from the reflectance of Red and Near Infrared
Equation (3) shows NDVI. NIR is the reflectance of Near Infrared. Because of 0 ≤ Reflectance ≤ 1, we defined the reflectance lower than 0 as 0 and upper than 1 as 1.
5. Growth-Stage Classification
5.1. Growth Stage in This Study
Paddy’s growth stages are categorized into six stages: (a) Transplanting stage (Seedlings grown in nurseries are moved and planted into the main paddy field), (b) Tillering stage (The main stem produces side shoots (tillers), increasing the number of stalks), (c) Panicle-forming stage (The microscopic young panicle (the future head of rice) begins to develop inside the stem), (d) Booting stage (The developing panicle swells inside the uppermost leaf sheath, making the stem look bulged), (e) Heading stage (The panicle emerges from the stem, which is followed immediately by flowering and pollination), (f) Ripening stage (The grains fill with starch, turning milky at first, and then gradually hardening into mature rice). Inoue used the heuristic algorithm for paddy growth-stage detection [18]; however, because it uses a vegetation index that cannot be observed by Sequoia, we asked an expert about the growth stage. Table 3 shows the growth stage and the observation date. Although the transplanting stage is included in the general definition of rice growth stages, no UAV image data from the transplanting stage were used in the classification experiments. Therefore, the classification model did not learn or evaluate the transplanting stage, which is acknowledged as a limitation. The growth stages used in this study are shown in Table 4.
Table 4.
Growth stage and observation date.
The growth stages were confirmed by one of the co-authors, who has extensive experience in rice cultivation and previously worked at an agricultural experiment station.
5.2. Image Processing for CNN-Based Classification
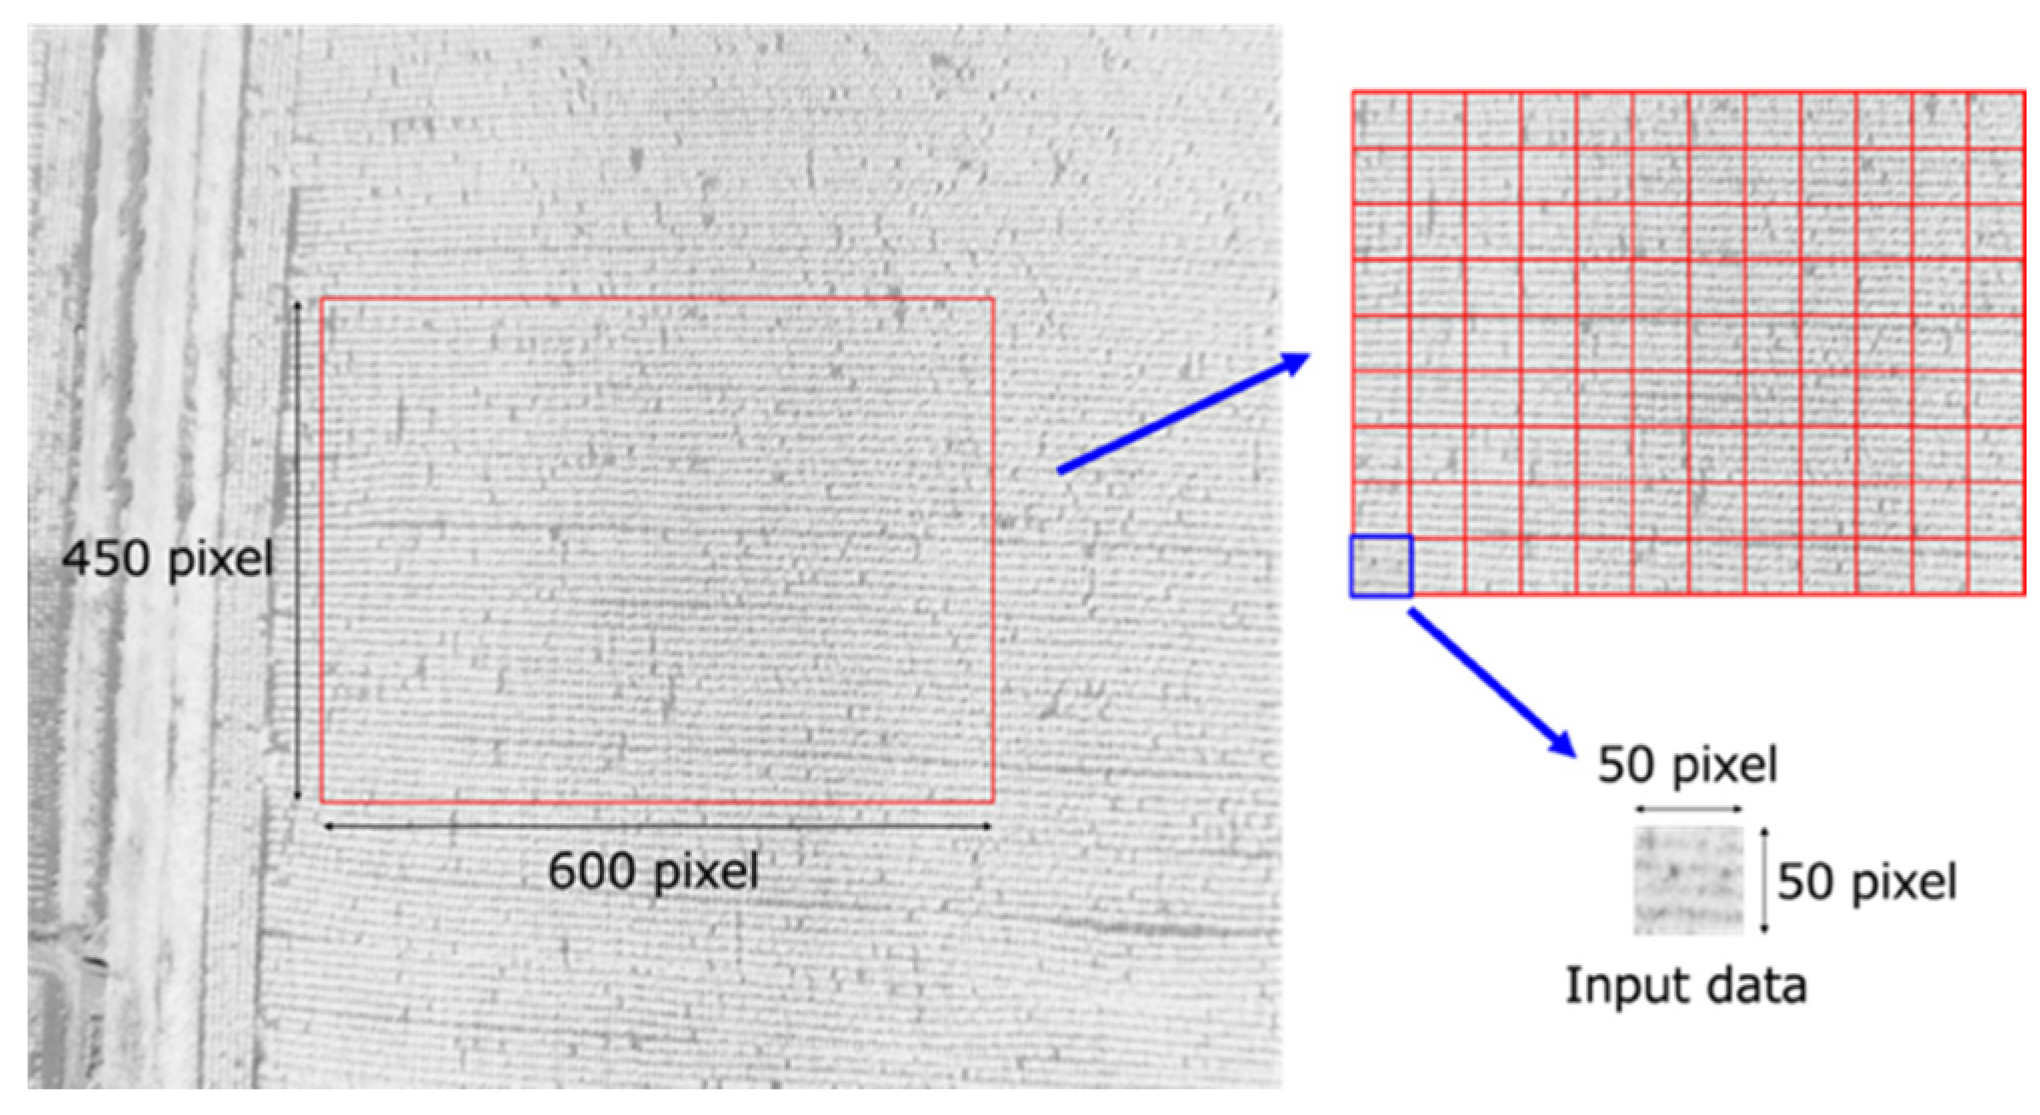
We divided the NDVI images created in Section 4.2 into a rectangular mesh and used them as input to deep learning. For each observation date, 30 pairs of Red and NIR images were randomly selected from the original UAV images acquired on that date. After NDVI image generation, the central 600 × 450 pixel area of each NDVI image was manually selected to include rice plants and to exclude non-rice areas such as footpaths and field boundaries as much as possible. The cropped area was then divided into 12 × 9 non-overlapping 50 × 50 pixel patches (Figure 9). Thus, each NDVI image produced 108 patches, and 30 images produced 3240 patches per observation date. Although the patches did not overlap within an image, patches from the same image and the same observation date may still be spatially correlated.
Figure 9.
Mesh division. 600 x 450 pixel area is divided into 108 (12 × 9) small tiles (50 × 50 pixels).
The random seed used for image selection and train/test splitting was not recorded in the original experimental records. Therefore, the exact data split cannot be reproduced. This is a limitation of the reproducibility of the experiment.
5.3. CNN Training and Evaluation
We conducted experiments in Python (v.3) with Keras (v.2) [21], a deep learning library. We used a CNN (Convolutional Neural Network) as the deep learning model, the cross-entropy function as the error function, Adadelta as the optimizer, accuracy as the metric, and hold-out as the validation method. Training data is 80% of all data, and test data is 20%. We also used Early stopping, monitoring the loss of training data. It reduces the effect of over-fitting.
The details of CNN architecture and training settings are summarized in Table 5.
Table 5.
CNN architecture and training parameters.
The patch-level 80/20 hold-out split is a major limitation of this study. Because patches from the same UAV image, flight, or observation date may be included in both training and test datasets, the reported test accuracies may overestimate generalization performance. Although leave-one-date-out validation was difficult because some growth stages were represented by only one or two dates, other grouped validation strategies, such as leave-one-flight-out validation, should be considered in future studies. The results should therefore be interpreted as patch-level classification performance under the original experimental design, rather than as fully independent field-level generalization performance.
Confusion matrices and class-wise metrics for the 2018 altitude experiments could not be reconstructed because complete patch-level prediction records were not retained. Therefore, this study reports the available accuracy values and uses the 2017 30 m class-wise metrics as supporting evidence for discussing class imbalance. Future studies should record patch-level predictions for all altitude conditions and report confusion matrices, precision, recall, F1-score, and balanced accuracy.
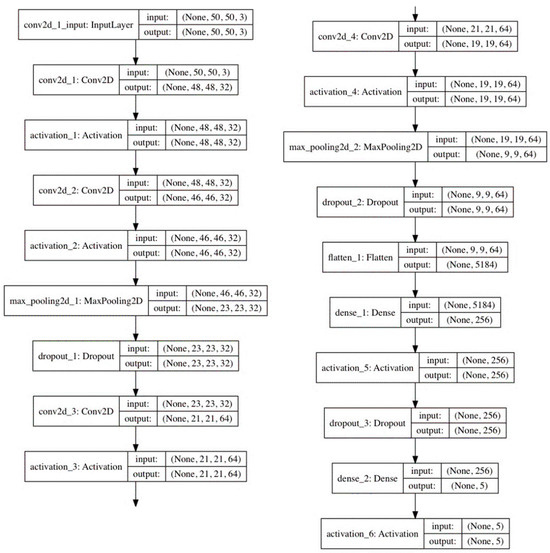
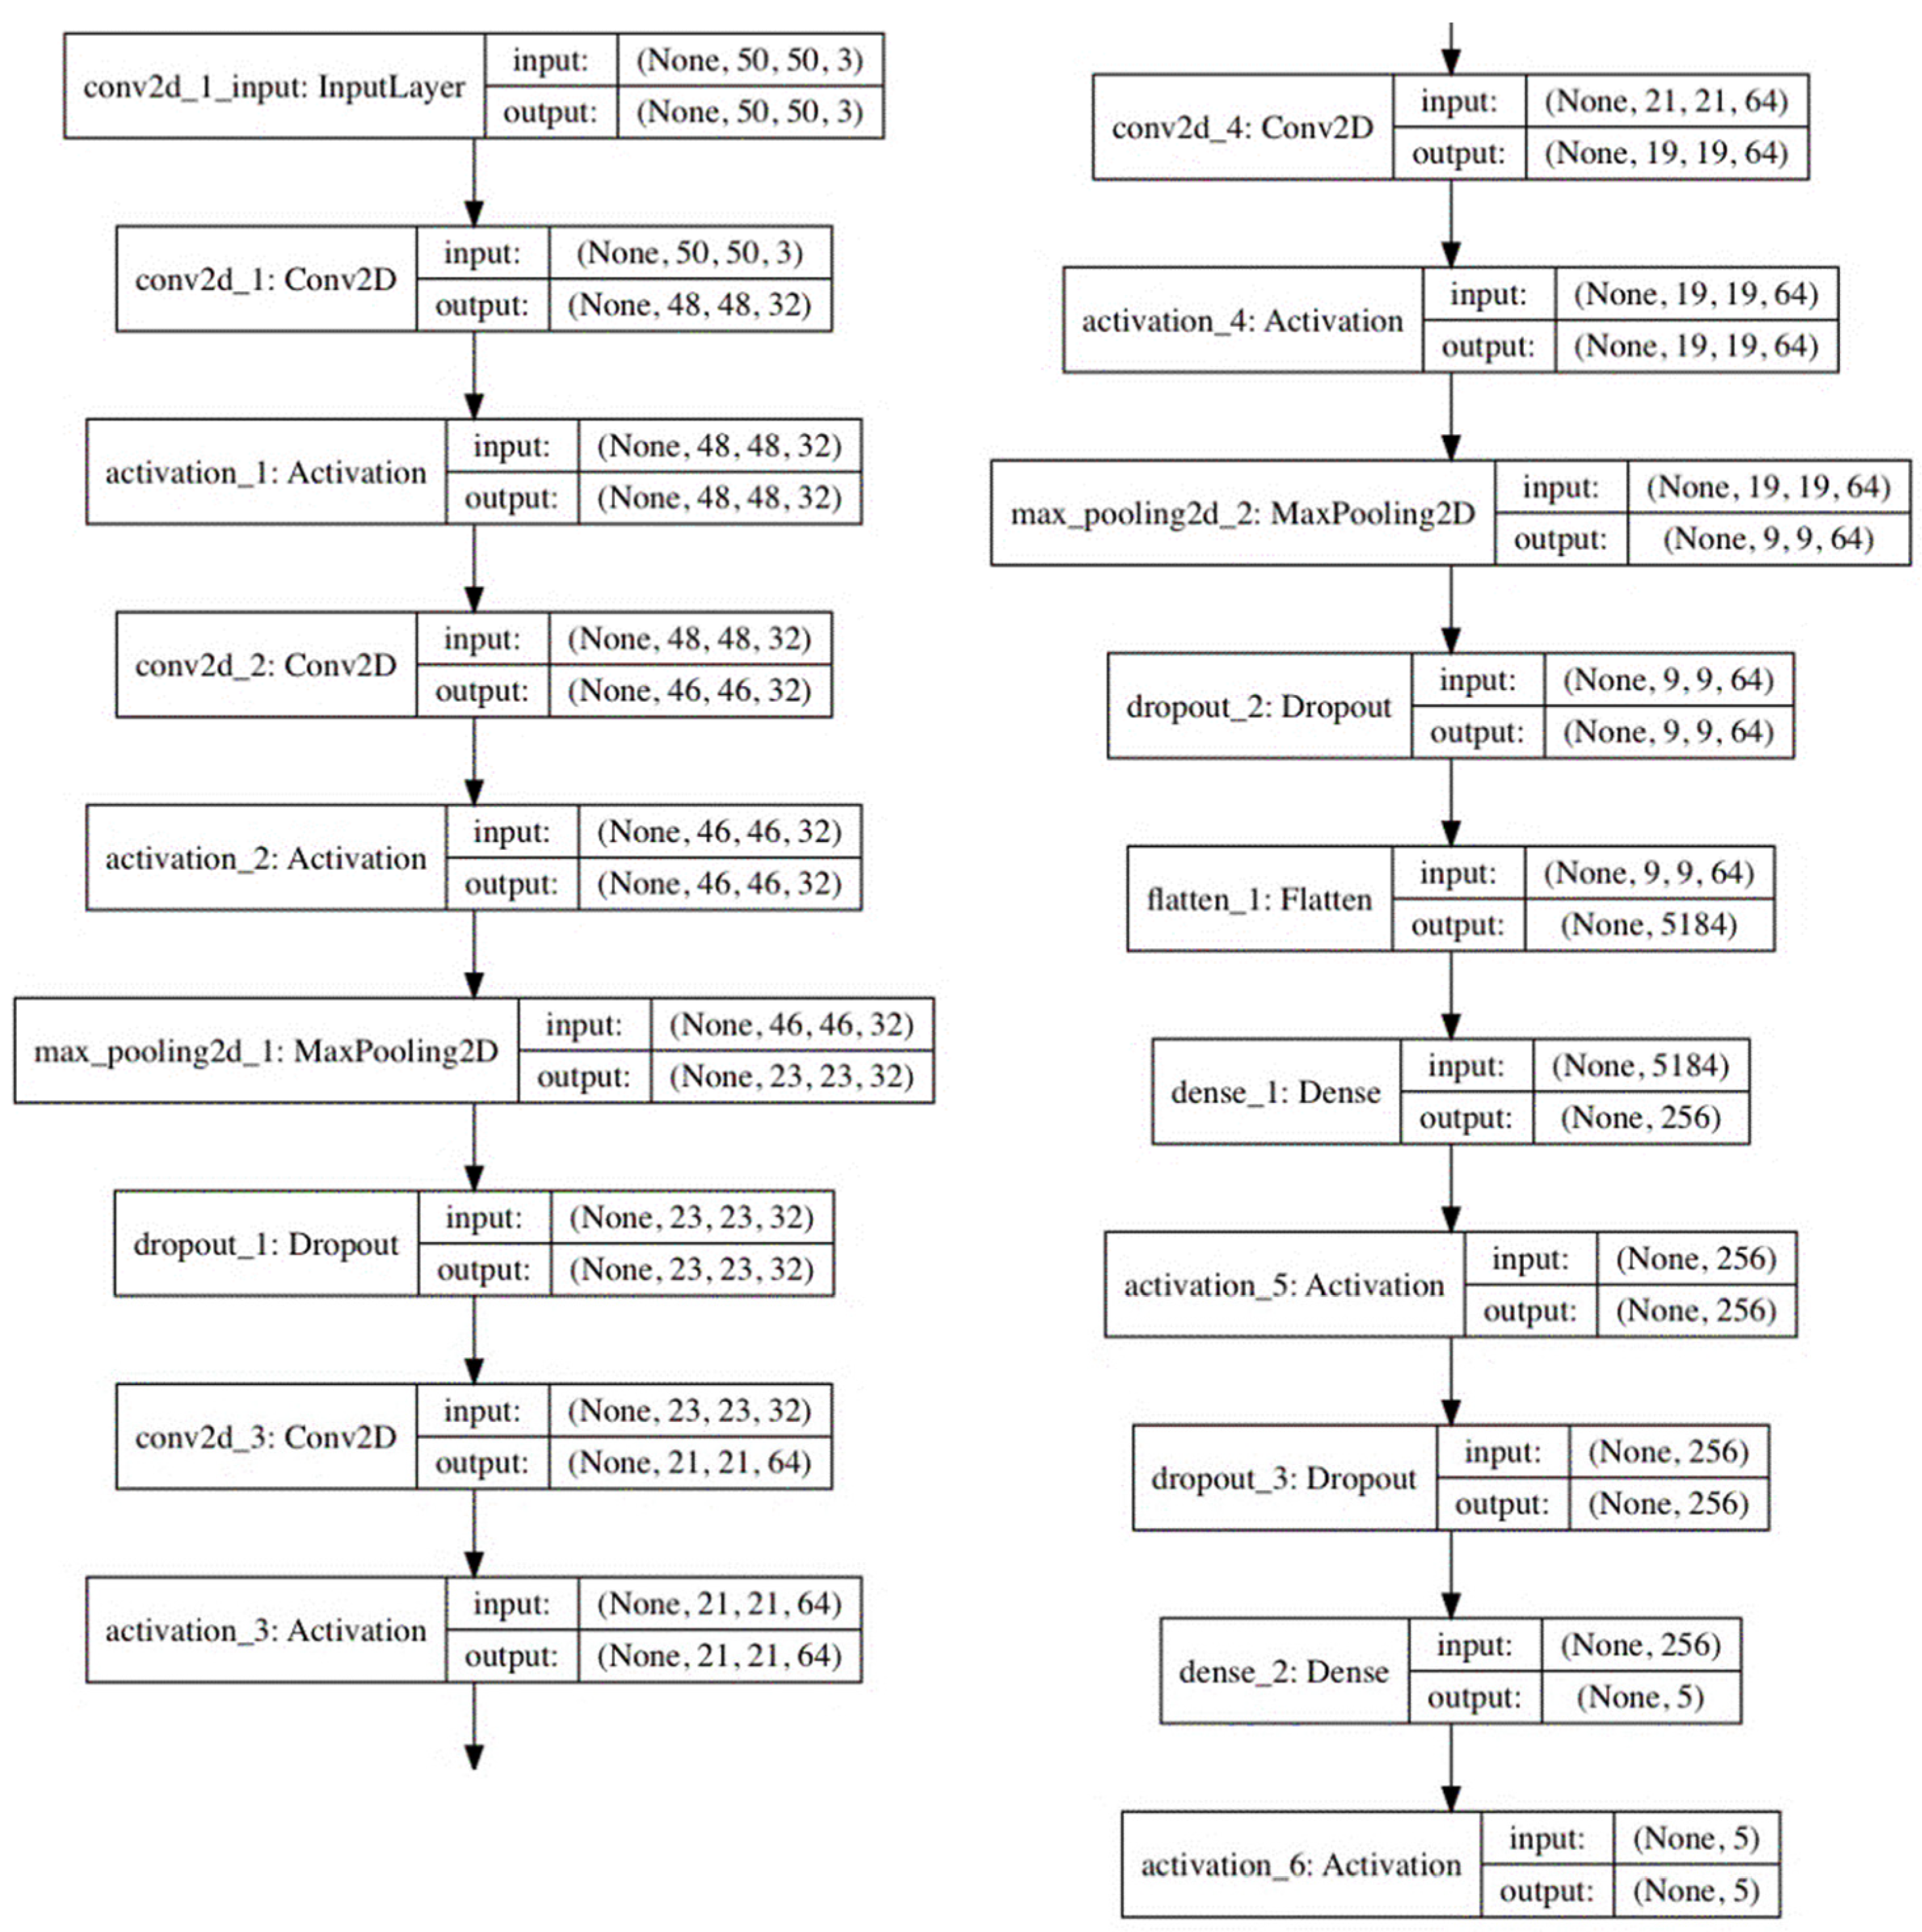
The model consisted of four convolutional layers, two max-pooling layers, three dropout layers, one fully connected layer, and a Softmax output layer. The categorical cross-entropy loss function was used, and the model was trained using the Adadelta optimizer. The mini-batch size was 32, and the maximum number of epochs was 50. The input data were 50 × 50 pixel NDVI patches.
All of the above settings are common in the following three experiments. Figure 10 shows a detail of the CNN. The first two Dropout rates are 0.25, and the last is 0.5. Most activation functions are ReLU (Rectified Linear Unit), and the last is Softmax.
Figure 10.
Details of CNN.
As mentioned in Section 1, we classified the growth stages of paddy rice using a CNN trained on images taken at heights of 60 m and 100 m. In this paper, we refer to images captured at a height of 30 m as simulated-altitude images, with resolutions of 60 m and 100 m. Table 6 shows image resolutions of these heights. Images acquired at actual flight altitudes of 60 m and 100 m are referred to as actual-altitude images. We conducted two classification experiments using simulated-altitude images and actual-altitude images. To confirm the classification accuracy of the growth stage using 2018 data, we conducted a pre-experiment with images taken from a height of 30 m.
Table 6.
Shooting height and image resolution of Sequoia.
In this study, the 50 × 50 pixel patches were used to increase the number of training samples and to capture local NDVI patterns associated with rice growth stages. The train/test split was performed using an 80/20 hold-out procedure. We acknowledge that, when patches from the same original UAV image or the same observation date are included in both training and test datasets, spatially adjacent patches may be correlated and classification accuracy may be overestimated.
A strict leave-one-date-out validation was not adopted in this study because some growth stages were represented by only one or two observation dates, such as the heading and booting stages. Excluding such dates would remove the corresponding growth stage from the training data and would not provide a meaningful evaluation of the trained classifier. In addition, NDVI values can vary among observation dates and years depending on illumination, weather, field condition, and crop status. Therefore, this study focused on evaluating average classification behavior using data collected across multiple observation dates under a consistent experimental framework. More rigorous grouped validation using independent images, flights, fields, and seasons remains an important topic for future work.
To justify the use of CNNs for NDVI image-based growth-stage classification, we added a baseline comparison using the available 2017 NDVI image dataset acquired at 30 m (See Table 7). Three input structures and models were compared: a DNN using the mean NDVI value of each patch as a 1 × 1 input, a DNN using the flattened 1 × 2500 NDVI pixel values, and a CNN using the original 50 × 50 NDVI image patch. The same loss function, optimizer, evaluation metric, and hold-out validation procedure were used for the three experiments.
Table 7.
Comparison of baseline models using the 2017 30 m NDVI image dataset.
The CNN using 50 × 50 NDVI image patches achieved the highest accuracy, with 93.1% for the training data and 93.8% for the test data. In contrast, the DNN using the mean NDVI value achieved 58.4% and 57.9% on the training and test data, respectively, while the DNN using flattened NDVI pixel values achieved 62.9% and 66.6%. These results indicate that using spatial information in NDVI image patches improves growth-stage classification performance and supports the use of CNNs in this study.
It should be noted that this baseline comparison was conducted using the 2017 30 m dataset and was used to justify the model choice. It was not a complete baseline comparison for all 2018 altitude conditions, which remains a topic for future work.
5.4. Pre-Experiment
We created NDVI images acquired at an altitude of 30 m, as described in Section 4.2, and classified growth stages using a CNN. The training and test accuracies were 88.1% and 89.3%, respectively. These values were somewhat lower than those reported in our previous study [3], in which the corresponding CNN achieved a training accuracy of 93.1% and a test accuracy of 93.8%. However, this pre-experiment did not aim to establish approximately 90% accuracy as a universal acceptance threshold, but to confirm that the NDVI image-processing procedure, patch-generation procedure, and CNN implementation produced reasonable classification performance before evaluating the effect of UAV flight altitude.
The lower accuracies in the present pre-experiment may have resulted from differences in the dataset, observation year, image selection, preprocessing conditions, and train/test split. Because we did not retain repeated training results and complete prediction records, we could not perform statistical significance testing. Therefore, the comparison with the previous study [3] should be interpreted only as a qualitative reference.
5.5. Experiment Using Simulated-Altitude Images
We conducted a growth-stage classification using CNNs on simulated-altitude images. The same CNN architecture and training settings as in the pre-experiment were used.
In addition, we confirmed the model’s accuracy when applied to real-world altitude images. As Table 2 shows, actual-altitude images were acquired only on selected observation days, not on all observation days.
Simulated-altitude images were generated by resizing the original 30 m NDVI images to the spatial resolutions corresponding to higher flight altitudes. The relationship between flight altitude and image resolution was derived from the specifications of the Sequoia sensor. In this study, bilinear interpolation was used as the resampling algorithm for resizing the NDVI images. The image resolutions corresponding to 60 m and 100 m were 7.4 cm/pixel and 12.4 cm/pixel, respectively.
For the simulated-altitude experiment, images acquired during the ripening stage were used because actual-altitude images at 60 m and 100 m were available only for selected observation dates in this period. Therefore, this experiment was limited to ripening-stage images and did not evaluate all growth stages under the simulated-altitude conditions. This is a limitation of the experiment because the model could not learn or evaluate altitude-dependent image characteristics for the other growth stages.
From each observation date, 3240 patches were generated from the NDVI images. Therefore, the dataset for this experiment consisted of 3240 patches per day × 8 observation dates = 25,920 patches. This number represents the total number of NDVI image patches, not the number of original UAV images.
Because the simulated-altitude experiment used only ripening-stage images from eight observation dates, it could not evaluate altitude effects across all growth stages. This is a severe limitation. Therefore, the results of this experiment should be interpreted as an evaluation of image-domain differences under ripening-stage conditions, not as a complete evaluation of all rice growth stages. In addition, the down-sampled images were generated to match the nominal spatial resolutions corresponding to 60 m and 100 m. However, spatial-frequency characteristics were not quantitatively compared between down-sampled images and actual-altitude images. Therefore, down-sampled images may not accurately reproduce the texture, blur, and spatial-frequency content of actual high-altitude images.
5.6. Experiment Using Actual-Altitude Images Supplemented with Simulated-Altitude Images
Actual-altitude images at 60 m and 100 m were available only on selected observation dates. Therefore, when actual-altitude images at 60 m or 100 m were not available, simulated-altitude images generated from 30 m images were used to supplement the missing altitude conditions. For this reason, this experiment should not be interpreted as being based exclusively on actual-altitude images. Rather, it evaluates classification performance when actual-altitude images are included in the training data and, where necessary, supplemented with simulated-altitude images.
As shown in Table 3, images at 30 m were acquired on all 25 observation dates, whereas images at 60 m and 100 m were acquired on eight observation dates.
We conducted a growth-stage classification using CNNs on actual-altitude images. The same CNN architecture and training settings as in the previous experiments were used. As Table 2 shows, actual-altitude images were available only for selected observation days, so we used simulated-altitude images instead of actual-altitude images when 60 m and 100 m height data were unavailable.
Also, we confirmed the accuracy when simulated-altitude images were input to the model after learning. Compared with the previous experiment, the input data consisted only of the ripening-stage data, which the model did not learn. Therefore, the number of input data is 3240 × 4 = 12,960.
This experiment should therefore be interpreted as an evaluation using actual-altitude images supplemented with simulated-altitude images, not as an experiment based exclusively on actual-altitude images.
For each altitude condition, the dataset before the 80/20 train/test split consisted of 81,000 patches from 25 observation dates. Of these, 25,920 patches (8 observation dates × 3240 patches) were derived from actual-altitude images, whereas 55,080 patches (17 observation dates × 3240 patches) were derived from simulated-altitude images generated from the 30 m observations. We then randomly divided the complete dataset into 64,800 training patches and 16,200 test patches. Because the random seed and exact split indices were not retained in the original experimental records, the exact numbers of actual-altitude and simulated-altitude patches within the training and test subsets cannot be reconstructed retrospectively.
6. Evaluation of the Effect of the Difference in Height for Growth-Stage Classification
6.1. Experiment Using Simulated-Altitude Images
The simulated-altitude dataset consisted of 25,920 image patches, of which 20,736 were used for training and 5184 for testing, based on the 80/20 hold-out split described in Section 5.3. Thus, we calculated the test accuracies reported in Table 8 using 5184 test patches for each simulated-altitude condition. We could not reconstruct confidence intervals and standard deviations because we did not retain repeated training runs or complete patch-level prediction records. In addition, because multiple patches came from the same UAV images and observation dates, treating all test patches as statistically independent observations would not yield appropriate confidence intervals.
Table 8.
Classification accuracy.
Table 8 shows the classification accuracy for the training and test datasets at each simulated flight altitude. The results indicate that the classification accuracy using the simulated-altitude images was slightly lower than that obtained using the original 30 m images in the pre-experiment.
When the CNN model trained using simulated-altitude images was applied to actual-altitude images, the classification accuracy decreased substantially, especially at 100 m. The accuracy at 100 m was only 0.5%, indicating that the model trained only on down-sampled 30 m images could not generalize to images actually acquired at 100 m. This result suggests a strong domain shift between simulated-altitude images and actual-altitude images.
Table 9 shows the classification accuracy obtained by applying the CNN model trained on the simulated-altitude images to the actual-altitude images. The accuracy was lower than that obtained for the simulated-altitude images, especially at 100 m.
Table 9.
Classification accuracy of actual-altitude images.
6.2. Experiment Using Actual-Altitude Images
Table 10 shows the classification accuracy on the training and test data for each height. The results indicate that the classification accuracy is almost the same as in the previous experiment.
Table 10.
Classification accuracy when we used the actual-altitude images.
Table 11 shows the classification accuracy obtained by applying the CNN model trained on the actual-altitude images to the simulated-altitude images. The results indicate that the model trained on actual-altitude images also achieved high accuracy when applied to simulated-altitude images.
Table 11.
Classification accuracy obtained by applying the CNN model trained on the actual-altitude images to the simulated-altitude images.
The results showed an asymmetric relationship between the two transfer directions. The CNN model trained using simulated-altitude images showed low accuracy when applied to actual-altitude images, especially at 100 m. In contrast, the CNN model trained using actual-altitude images achieved high accuracy when applied to simulated-altitude images. This suggests that actual-altitude images include broader image variability than simulated-altitude images generated by down-sampling 30 m images.
The results in this section are based on overall accuracy values. Because complete patch-level prediction records were not retained, confusion matrices and class-wise metrics for the 2018 altitude experiments could not be reconstructed. Therefore, the results may mask differences in classification performance among specific growth stages.
7. Discussion
- (1)
- In our previous study [3], we used NDVI images acquired in 2017 to classify paddy rice growth stages. In that study, the classification accuracy was highest for images at 60 m altitude, followed by those at 30 m altitude. However, the 60 m images were generated by down-sampling the original 30 m images rather than being acquired at the actual flight altitude. In this study, we acquired NDVI images at actual flight altitudes of 30, 60, and 100 m and generated simulated-altitude images by down-sampling the 30 m images. The accuracy was low when actual-altitude images were input to the simulated-altitude images model. The simulated-altitude images model learned data from only simulated-altitude images. However, the accuracy was very high when simulated-altitude images were input to the actual-altitude images model. These results indicate that there was little difference in classification accuracy between 60 m and 100 m.These findings also have practical implications for UAV-based agricultural monitoring. In actual field operations, images of the same paddy field may be acquired by different operators, using different UAVs, sensors, or flight plans. In general, images captured at different flight altitudes cannot always be mixed directly because their spatial resolutions and image characteristics differ. However, the results of this study suggest that, when the model is trained using actual-altitude images, images acquired at different flight altitudes can still be used for rice growth-stage classification. This flexibility is useful in practical monitoring scenarios. For example, if regular observation cannot be conducted on a given date, images acquired by another operator at a different flight altitude for another purpose may still be usable for growth-stage assessment. This can help reduce missing data in time-series monitoring of paddy rice growth.They also suggest that the model trained on actual-altitude images could classify simulated-altitude images with high accuracy. However, the opposite case showed lower accuracy, especially at 100 m. A detailed analysis of the factors causing this asymmetry remains a topic for future work. In our case, our UAV flies at an altitude of 30 m and can cover 1 ha. However, if it flies at an altitude of 100 m, it can cover (10/3)2 area (nearly about ten times) at the same flight time. However, the appropriate flight altitude depends on the target task. For example, if detailed traits such as the number of rice plants or panicles must be measured, much lower flight altitudes may be required. In contrast, for growth-stage classification, this study’s results suggest that higher flight altitudes can expand the observation area while maintaining classification accuracy.
- (2)
- The growth-stage dataset was class-imbalanced. In particular, the heading stage was represented by only one observation date, whereas the ripening stage was represented by many more dates. Consequently, overall accuracy may be influenced more by the majority stages and may not adequately reflect performance on underrepresented stages.To further examine the effect of class imbalance, we added the available class-wise evaluation results from the 2017 30 m NDVI image dataset. The balanced accuracy was 83.10%. The results showed high F1-scores for the tillering stage and ripening stage, which had relatively large numbers of samples, whereas the booting stage showed a lower recall of 53.30%. This indicates that growth stages with fewer samples may be more difficult to evaluate reliably, and that overall accuracy alone may not fully represent class-wise classification performance (See Table 12).Table 12. Class-wise classification performance for the 2017 30 m NDVI image dataset.It should be noted that these class-wise metrics were calculated from the available 2017 30 m dataset and were not reconstructed for all 2018 altitude experiments, because the patch-level prediction results for all altitude conditions were not fully retained. Therefore, the 2017 30 m class-wise results are used as supporting evidence to discuss the effect of class imbalance, while the altitude comparison results should still be interpreted with this limitation in mind.In particular, the heading-stage performance cannot be evaluated reliably from a single observation date because date-specific conditions may be confounded with growth-stage characteristics.
- (3)
- The results also indicate that down-sampled 30 m images should not be regarded as equivalent to actual images acquired at 60 m or 100 m. Down-sampling mainly reduces spatial resolution, but actual changes in flight altitude introduce additional differences, including optical response, image blur, viewing angle, illumination, registration error, and radiometric response. Therefore, simulated-altitude images are useful for preliminary evaluation of resolution effects, but they cannot fully replace actual-altitude images. This limitation should be considered when designing UAV-based rice monitoring systems.
- (4)
- The baseline comparison using the 2017 30 m dataset showed that the CNN using 50 × 50 NDVI image patches outperformed the DNN models using either mean NDVI values or flattened NDVI vectors. This suggests that spatial patterns in NDVI images are important for growth-stage classification. However, because this comparison was limited to the 2017 30 m dataset, future studies should compare CNNs with additional baseline methods such as SVM, Random Forest, shallow CNNs, and NDVI thresholding under the same multi-altitude experimental conditions.
- (5)
- The extremely low accuracy of 0.5% for the 100 m actual-altitude images suggests a strong domain shift between simulated-altitude images and actual-altitude images. Although simulated-altitude images were generated by down-sampling 30 m images, they do not fully reproduce the characteristics of images actually acquired at higher altitudes. Actual 100 m images may include differences in optical response, motion blur, illumination conditions, viewing geometry, image registration error, and radiometric correction. Therefore, this result does not necessarily indicate that 100 m UAV images are unsuitable for growth-stage classification. Rather, it indicates that models trained only on simulated-altitude images may fail when applied to actual-altitude images. This finding highlights the importance of including actual-altitude images in the training dataset.
- (6)
- One of the key findings of this study is the asymmetric relationship between the two transfer directions. When the CNN model trained using simulated-altitude images was applied to actual-altitude images, the classification accuracy decreased substantially, especially at 100 m. In contrast, when the CNN model trained on actual-altitude images was applied to simulated-altitude images, it achieved high classification accuracy. This asymmetry may be explained by the difference in image variability between the two datasets.Simulated-altitude images were generated by down-sampling 30 m images and therefore mainly reproduce the reduction in spatial resolution. However, actual-altitude images exhibit not only resolution differences but also altitude-dependent variations due to optical response, motion blur, illumination conditions, viewing geometry, image registration errors, and radiometric response. Therefore, a model trained only on simulated-altitude images may not learn the variability present in actual-altitude images. Conversely, a model trained using actual-altitude images may learn broader image variability and can classify simulated-altitude images more successfully.This result indicates that down-sampled images can be useful for preliminary evaluation of resolution effects, but they should not be regarded as a complete substitute for actual-altitude images.At 100 m, the model trained on the dataset that included actual-altitude images achieved higher test accuracy (87.8%) than the model trained on simulated-altitude images (83.6%). This difference should not be interpreted as evidence that actual 100 m imagery is intrinsically easier to classify, because we could not evaluate statistical significance. One possible explanation is that actual-altitude images contain not only reduced spatial resolution but also altitude-dependent variations in optical response, motion blur, illumination, viewing geometry, image registration, and radiometric response. Training with actual-altitude images may therefore expose the CNN to a broader range of image variability, resulting in greater robustness than training with down-sampled images alone.For practical UAV-based rice growth-stage monitoring at higher flight altitudes, training data should include images acquired at the actual flight altitudes used for classification.
- (7)
- From a practical viewpoint, the results suggest that UAV images acquired at 60 m or 100 m can be used for rice growth-stage classification if the model is trained with actual-altitude images acquired under comparable conditions. However, models trained only on down-sampled 30 m images should not be directly applied to actual high-altitude images. For practitioners, 30 m flight altitude suits applications requiring fine spatial detail, whereas 60–100 m may suit wider-area growth-stage monitoring when actual-altitude training data and consistent preprocessing are available.The requirement for actual-altitude training data does not eliminate the operational benefit of higher-altitude monitoring, but it introduces an initial cost for dataset construction. Representative images must first be collected at the intended operational altitude. Once such altitude-specific training data are available, however, higher-altitude flights can provide substantially wider spatial coverage per mission. Therefore, the practical trade-off is between the initial effort required to collect altitude-specific training data and the subsequent benefit of monitoring larger areas with fewer flights.Essential preprocessing steps include radiometric calibration using a calibration panel, vignetting correction, band registration, distortion correction, DN-to-reflectance conversion, NDVI calculation, and image-quality checking. This study cannot determine the amount of training data required, but future practical systems should collect training data across multiple fields, cultivars, seasons, flight altitudes, and growth stages.
8. Limitation
- (1)
- A major limitation of this study is the patch-level 80/20 hold-out split. Because patches from the same UAV image, flight, or observation date may be included in both training and test datasets, the reported test accuracies may overestimate generalization performance. Although this approach is useful for evaluating the classification performance of local NDVI patterns, the results should be interpreted as patch-level classification performance under the original experimental design, rather than as fully independent field-level generalization performance. Future studies should evaluate the model using stricter grouped validation strategies, such as original-image-level, leave-one-flight-out, field-level, or independent-season validation, using larger datasets collected over multiple years and fields.
- (2)
- NDVI values are known to vary among observation dates and years, even at the same observation point, depending on crop phenology, weather, illumination, and field conditions. For example, Suzuki et al. reported multi-year NDVI time-series variations in rice fields using MODIS data, showing that the timing and magnitude of NDVI curves differed among years [22]. Therefore, in growth-stage classification, it is important to use data collected across multiple observation dates to capture the average characteristics of each growth stage. However, we also acknowledge that a patch-level random split may overestimate classification accuracy when spatially correlated patches from the same UAV image are included in both training and test datasets. Future studies should address this limitation using larger multi-year and multi-field datasets with grouped validation strategies. In addition, confusion matrices and class-wise metrics for the 2018 altitude experiments could not be reconstructed because complete patch-level prediction records were not retained. Therefore, the 2017 30 m class-wise metrics are used only as supporting evidence for discussing class imbalance. Future studies should record patch-level predictions for all altitude conditions and report confusion matrices, precision, recall, F1-score, and balanced accuracy.
- (3)
- A significant limitation of this study is that confusion matrices and class-wise performance metrics for the 2018 altitude experiments could not be reconstructed because complete patch-level prediction records were not retained. Consequently, the altitude-comparison results are based mainly on overall accuracy and may mask growth-stage-specific classification errors, particularly for underrepresented stages. This also limits our ability to determine whether the effect of flight altitude differs among individual growth stages. The available class-wise metrics from the 2017 30 m dataset were therefore used only as supporting evidence for discussing class imbalance and should not be regarded as a substitute for class-wise evaluation of the 2018 altitude experiments. Future studies should retain all patch-level prediction records and report confusion matrices, precision, recall, F1-score, balanced accuracy, and other class-wise metrics for each altitude condition.
- (4)
- The results showed an asymmetric relationship between the two transfer directions. When the CNN model trained using simulated-altitude images was applied to actual-altitude images, the classification accuracy decreased substantially, especially at 100 m. In contrast, when the CNN model trained using actual-altitude images was applied to simulated-altitude images, high classification accuracy was obtained. This asymmetry may be explained by the difference in image variability between the two datasets. Simulated-altitude images were generated by down-sampling 30 m images and mainly reproduce the reduction in spatial resolution. In contrast, actual-altitude images include not only resolution differences but also altitude-dependent variations in optical response, motion blur, illumination conditions, viewing geometry, image registration error, and radiometric response. Therefore, a model trained only on simulated-altitude images may not learn the variability present in actual-altitude images, whereas a model trained using actual-altitude images may learn broader image variability and can classify simulated-altitude images more successfully.The extremely low accuracy of 0.5% at 100 m should therefore be interpreted as evidence of a strong domain shift between simulated-altitude images and actual-altitude images. This result does not necessarily indicate that 100 m UAV images are unsuitable for rice growth-stage classification. Rather, it indicates that models trained only on down-sampled 30 m images may fail when applied to images actually acquired at 100 m. This finding highlights the importance of including actual-altitude images in the training dataset when UAV-based monitoring is conducted at higher flight altitudes.The dataset used in this study was imbalanced among growth stages. In particular, the heading stage was represented by only one observation date, whereas the ripening stage included many observation dates. Such imbalance may influence the interpretation of overall accuracy because majority classes can have a stronger effect on the reported accuracy. To further examine this issue, we added the available class-wise evaluation results from the 2017 30 m NDVI image dataset. The balanced accuracy was 83.10%, and the booting stage showed a relatively low recall of 53.30%. This indicates that growth stages with fewer samples may be more difficult to evaluate reliably and that overall accuracy alone may not fully represent class-wise classification performance. However, these class-wise metrics were calculated from the available 2017 30 m dataset and were not reconstructed for all 2018 altitude experiments. Therefore, the altitude comparison results should be interpreted with this limitation in mind.The results of this study should also be interpreted within the limits of the experimental conditions. The dataset was collected from a limited number of fields, one rice variety, and one growing season. Therefore, the generalizability of the results to other fields, cultivars, years, and management conditions is limited. In addition, the validation was based on a patch-level hold-out split, which may overestimate generalization performance because patches from the same UAV image or observation date can be spatially correlated. Future studies should evaluate the model using multi-year and multi-field datasets, multiple rice varieties, and stricter grouped validation strategies, such as original-image-level, flight-level, field-level, and independent-season validation.Compared with previous studies on rice monitoring using satellite, SAR, and UAV remote sensing, the present study focuses specifically on the practical effect of UAV flight altitude on CNN-based rice growth-stage classification. Previous studies have demonstrated the usefulness of satellite and UAV data for rice growth-stage classification, phenology monitoring, heading-date estimation, yield estimation, and growth-period prediction. However, relatively limited attention has been paid to the comparison between simulated-altitude images and actual-altitude images for evaluating UAV flight altitude. Therefore, the main contribution of this study is to show that actual-altitude images are necessary for reliable evaluation and training when UAV flight altitude is increased from 30 m to 60 m and 100 m.
- (5)
- A major limitation is that the experiment referred to as the actual-altitude experiment was not based exclusively on actual-altitude images. Actual images at 60 m and 100 m were available for only 8 of the 25 observation dates, and simulated-altitude images generated from the 30 m observations were used for the remaining dates. Consequently, the reported accuracies of 86.5% at 60 m and 87.8% at 100 m should be interpreted as the performance of datasets that included actual-altitude images but were supplemented with simulated-altitude images, rather than as performance obtained from complete actual-altitude datasets. This mixing of image domains may influence the learned image characteristics and limit the extent to which the results can be attributed solely to actual flight altitude. Future studies should acquire actual-altitude images across all growth stages and observation dates and evaluate models trained and tested exclusively with actual-altitude data.
- (6)
- The random seed used for image selection and train/test splitting was not recorded in the original experimental records. Therefore, the exact composition of the training and test datasets cannot be reproduced, including the precise numbers of actual-altitude and simulated-altitude patches assigned to each subset. This reduces the reproducibility of the reported results. Future experiments should record random seeds, data-split indices, software versions, and model-training logs to ensure full computational reproducibility.
- (7)
- The CNN architecture and training settings used in this study were designed for the experiments conducted in 2017–2018 and do not represent current state-of-the-art deep-learning practices. This study did not aim to identify the best-performing modern architecture, but to evaluate the relative effect of UAV flight altitude within a consistent CNN-based classification framework. Nevertheless, more recent architectures, improved optimization methods, data augmentation, class-balanced learning, and modern validation strategies may achieve different absolute performance. Future studies should therefore repeat the altitude comparison using contemporary deep-learning methods under the same acquisition conditions.
- (8)
- The dataset was collected from a single experimental site and one rice cultivar, Yudai 21, during one growing season. Therefore, the results may not generalize directly to other rice cultivars, fields, years, climates, soil conditions, or management practices. Differences in canopy structure, phenology, cultivation management, and environmental conditions may affect NDVI patterns and classification performance. Future studies should evaluate the proposed approach using multiple fields, cultivars, regions, and growing seasons.
- (9)
- The results were reported as accuracy values without statistical significance tests, confidence intervals, or repeated-run statistics. The original experiments were conducted in 2017–2018, and repeated training results and complete patch-level prediction records were not fully retained. Therefore, statistical significance tests and confidence intervals could not be reconstructed retrospectively. The reported accuracies should be interpreted as results obtained under the original experimental conditions. Future studies should repeat model training under a controlled computational environment and report mean accuracy, standard deviation, confidence intervals, and statistical comparisons where appropriate.
9. Conclusions
This study evaluated the effect of UAV flight altitude on CNN-based rice growth-stage classification using NDVI images acquired from paddy fields. The results showed that, under the experimental conditions of this study, growth-stage classification accuracy was maintained when the CNN was trained using actual-altitude images acquired at higher flight altitudes. Specifically, the test accuracies using actual-altitude images were 86.5% at 60 m and 87.8% at 100 m. These results suggest that UAV flight altitude can be increased for practical rice growth-stage monitoring when training data are collected at the actual flight altitudes used for classification.
However, the results also showed that simulated-altitude images generated by down-sampling 30 m images were not fully equivalent to actual high-altitude images. When the model trained using simulated-altitude images was applied to actual-altitude images, classification accuracy decreased substantially, especially at 100 m. This indicates that down-sampling can reproduce the reduction in spatial resolution, but it cannot fully reproduce other altitude-dependent factors, such as optical response, motion blur, illumination conditions, viewing geometry, image registration error, and radiometric response. Therefore, simulated-altitude images may be useful for preliminary evaluation, but they should not be regarded as a complete substitute for actual-altitude images.
The conclusions of this study should be interpreted within the limits of the experimental conditions. The dataset was collected from a limited number of fields, one rice variety, and one growing season. In addition, the validation was based on patch-level hold-out splitting, which may overestimate generalization performance because patches from the same UAV image or observation date can be spatially correlated. The dataset was also imbalanced among growth stages, and complete class-wise metrics could not be reconstructed for all altitude experiments from the available experimental records.
Future work should move from patch-level, single-field evaluation to multi-field and multi-season validation using complete actual-altitude datasets. Such datasets should include multiple rice varieties, all major growth stages, repeated flights at each altitude, and quantitative image-quality control. More rigorous validation strategies, such as original-image-level, leave-one-flight-out, field-level, and independent-season validation, should be applied to evaluate generalization performance. Future studies should also record patch-level prediction outputs for all altitude conditions and report class-wise metrics, including precision, recall, F1-score, balanced accuracy, and confusion matrices. In addition, CNN-based classification should be compared with simpler baseline methods such as SVM, Random Forest, shallow CNNs, and NDVI thresholding under the same multi-altitude experimental conditions. These steps will be necessary to establish reliable UAV flight-altitude guidelines for practical rice growth-stage monitoring.
Future work should also focus on constructing a multi-domain UAV image dataset by collecting data across different fields, years, regions, cultivars, flight altitudes, sensors, and operators. Because these data are acquired under heterogeneous conditions, domain harmonization, resolution conversion, radiometric normalization, and domain adaptation methods will be required before effective integration. By transforming heterogeneous UAV observations into a common feature space and jointly using them for training, we aim to develop growth-stage classification models that are more accurate, robust, and transferable across different agricultural environments. Such a framework could reduce the need to construct a new training dataset for every field or operator and could ultimately support large-scale, practical UAV-based crop monitoring.
Author Contributions
Y.T. and A.I. conceived and designed the experiments; Y.T. conducted the experiments with his special knowledge of farming rice; Y.T., K.M. and A.I. analyzed the data; K.M. and A.I. contributed to the operation of a drone; Y.T., K.M. and A.I. wrote the paper. All authors have read and agreed to the published version of the manuscript.
Funding
This research received no external funding.
Institutional Review Board Statement
Not applicable.
Informed Consent Statement
Not applicable.
Data Availability Statement
The datasets generated and analyzed in this study are not publicly available due to institutional regulations and confidentiality policies of the previous affiliation where the study was conducted. However, they are available from the corresponding author upon reasonable request with the permission of the co-authors.
Acknowledgments
We would like to express special thanks to Yanagishita, and all staff at Nileworks for their technical guidance on the use of Sequoia and the drone. This research was conducted in collaboration with Nileworks Co., Ltd.
Conflicts of Interest
This study was conducted in collaboration with Nileworks Co., Ltd., which allowed the authors to use a drone (Phantom 3) and a multispectral camera (Sequoia). Nileworks Co., Ltd. was not involved in the study design; collection, analysis, or interpretation of data; writing of the manuscript; or the decision to submit the manuscript for publication. The authors declare no other commercial or financial relationships that could be construed as a potential conflict of interest.
References
- Statistics on the Agricultural Labor Force. Available online: http://www.maff.go.jp/j/tokei/sihyo/data/08.html (accessed on 31 August 2026).
- Japan’s Robot Strategy. Available online: https://www.cas.go.jp/jp/seisaku/seicho/pdf/robot_honbun_150210.pdf (accessed on 31 August 2026).
- Murata, K.; Ito, A.; Takahashi, Y.; Hatano, H. A Study on Growth Stage Classification of Paddy Rice by CNN Using NDVI Images. In Proceedings of the 2019 Cybersecurity and Cyberforensics Conference (CCC), Melbourne, Australia, 8–9 May 2019; pp. 85–90. [Google Scholar] [CrossRef] [Scilit]
- Ikasari, I.H.; Ayumi, V.; Fanany, M.I.; Mulyono, S. Multiple Regularizations Deep Learning for Paddy Growth Stages Classification from LANDSAT-8. In Proceedings of the 2016 International Conference on Advanced Computer Science and Information Systems (ICACSIS), Malang, Indonesia, 15–16 October 2016; IEEE: Piscataway, NJ, USA, 2016; pp. 512–517. [Google Scholar] [CrossRef] [Scilit]
- Fatchurrachman; Rudiyanto; Soh, N.C.; Shah, R.M.; Giap, S.G.E.; Setiawan, B.I.; Minasny, B. High-Resolution Mapping of Paddy Rice Extent and Growth Stages across Peninsular Malaysia Using a Fusion of Sentinel-1 and Sentinel-2 Time Series Data in Google Earth Engine. Remote Sens. 2022, 14, 1875. [Google Scholar] [CrossRef] [Scilit]
- Yuzugullu, O.; Marelli, S.; Erten, E.; Sudret, B.; Hajnsek, I. Determining Rice Growth Stage with X-Band SAR: A Metamodel-Based Inversion. Remote Sens. 2017, 9, 460. [Google Scholar] [CrossRef] [Scilit]
- Lee, S.-K.; Yoon, S.Y.; Won, J.-S. Vegetation Height Estimate in Rice Fields Using Single Polarization TanDEM-X Science Phase Data. Remote Sens. 2018, 10, 1702. [Google Scholar] [CrossRef] [Scilit]
- Setiyono, T.D.; Quicho, E.D.; Gatti, L.; Campos-Taberner, M.; Busetto, L.; Collivignarelli, F.; García-Haro, F.J.; Boschetti, M.; Khan, N.I.; Holecz, F. Spatial Rice Yield Estimation Based on MODIS and Sentinel-1 SAR Data and ORYZA Crop Growth Model. Remote Sens. 2018, 10, 293. [Google Scholar] [CrossRef] [Scilit]
- Moreno-García, B.; Casterad, M.A.; Guillén, M.; Quílez, D. Agronomic and Economic Potential of Vegetation Indices for Rice N Recommendations under Organic and Mineral Fertilization in Mediterranean Regions. Remote Sens. 2018, 10, 1908. [Google Scholar] [CrossRef] [Scilit]
- Liu, X.; Wu, X.; Peng, Y.; Mo, J.; Fang, S.; Gong, Y.; Zhu, R.; Wang, J.; Zhang, C. Application of UAV-Retrieved Canopy Spectra for Remote Evaluation of Rice Full Heading Date. Sci. Remote Sens. 2023, 7, 100090. [Google Scholar] [CrossRef] [Scilit]
- Qiu, Z.; Liu, H.; Wang, L.; Shao, S.; Chen, C.; Liu, Z.; Liang, S.; Wang, C.; Cao, B. Accurate Prediction of 327 Rice Variety Growth Period Based on Unmanned Aerial Vehicle Multispectral Remote Sensing. Drones 2024, 8, 665. [Google Scholar] [CrossRef] [Scilit]
- Zhang, J.; Zhang, R.; Meng, Q.; Chen, Y.; Deng, J.; Chen, B. UAV as a Bridge: Mapping Key Rice Growth Stage with Sentinel-2 Imagery and Novel Vegetation Indices. Remote Sens. 2025, 17, 2180. [Google Scholar] [CrossRef] [Scilit]
- Mesas-Carrascosa, F.J.; Torres-Sánchez, J.; Clavero-Rumbao, I.; García-Ferrer, A.; Peña, J.M.; Borra-Serrano, I.; López-Granados, F. Assessing Optimal Flight Parameters for Generating Accurate Multispectral Orthomosaicks by UAV to Support Site-Specific Crop Management. Remote Sens. 2015, 7, 12793–12814. [Google Scholar] [CrossRef] [Scilit]
- Tuia, D.; Persello, C.; Bruzzone, L. Domain Adaptation for the Classification of Remote Sensing Data: An Overview of Recent Advances. IEEE Geosci. Remote Sens. Mag. 2016, 4, 41–57. [Google Scholar] [CrossRef] [Scilit]
- Ubben, N.; Pukrop, M.; Jarmer, T. Spatial Resolution as a Factor for Efficient UAV-Based Weed Mapping—A Soybean Field Case Study. Remote Sens. 2024, 16, 1778. [Google Scholar] [CrossRef] [Scilit]
- Phantom 3 Standard. Available online: https://www.dji.com/jp/phantom-3-standard (accessed on 31 August 2026).
- DJI GS Pro. Available online: https://www.dji.com/jp/ground-station-pro (accessed on 31 August 2026).
- Parrot SEQUOIA. Available online: https://www.parrot.com/en/support/documentation/sequoia (accessed on 31 August 2026).
- Inoue, Y.; Yokoyama, M. Drone-Based Remote Sensing of Crops and Soils and Its Application to Smart Agriculture. J. Remote Sens. Soc. Jpn. 2017, 37, 224–235. [Google Scholar] [CrossRef]
- Repositories of MicaSense, Inc. Available online: https://github.com/micasense/imageprocessing/blob/master/micasense/image.py (accessed on 31 August 2026).
- Keras. Available online: https://keras.io/ (accessed on 31 August 2026).
- Suzuki, M.; Wakamori, K.; Ichikawa, D. A Study on Rice Growing Monitoring Using MODIS Image Data: Case Study of the Yoshijima Area in Kawanishi Machi, Yamagata Prefecture. J. Agric. Sci. Tokyo Univ. Agric. 2012, 57, 154–159. Available online: https://agriknowledge.affrc.go.jp/RN/2010835370 (accessed on 31 August 2026).

Disclaimer/Publisher’s Note: The statements, opinions and data contained in all publications are solely those of the individual author(s) and contributor(s) and not of MDPI and/or the editor(s). MDPI and/or the editor(s) disclaim responsibility for any injury to people or property resulting from any ideas, methods, instructions or products referred to in the content. |
© 2026 by the authors. Licensee MDPI, Basel, Switzerland. This article is an open access article distributed under the terms and conditions of the Creative Commons Attribution (CC BY) license.