1. Introduction
The global transition toward sustainable transportation has accelerated the adoption of electric vehicles (EVs), with global EV sales exceeding 17 million units in 2024 (over 20% market share) and projected to surpass 20 million units in 2025, representing more than one in four new cars sold worldwide according to the International Energy Agency (IEA) [
1]. However, charging infrastructure limitations, including long charging times and range anxiety, remain significant barriers to widespread EV adoption. Dynamic Wireless Power Transfer (DWPT) technology offers a promising solution by enabling EVs to charge while driving, potentially eliminating the need for frequent stops and reducing battery capacity requirements [
2,
3]. Recent comprehensive reviews have highlighted the critical role of power electronic converters in enabling efficient EV charging across various topologies [
4].
DWPT systems operate on the principle of magnetic resonance coupling, transferring power from transmitter coils embedded in the roadway to receiver coils mounted on vehicles [
5,
6]. While this technology presents numerous advantages, including convenience and extended driving range, it also introduces complex fault scenarios that can significantly impact system performance and safety. Faults in DWPT systems can arise from various sources, including coil damage, foreign object intrusion, severe misalignment, power electronics failures, and thermal issues [
7,
8]. As highlighted in recent smart grid fault classification studies, understanding diverse fault types, including incipient, abrupt, and intermittent faults, and their impacts is essential for ensuring system stability [
9].
Traditional fault detection methods in power systems rely on threshold-based approaches or physics-based models, which may not effectively capture the complex, nonlinear dynamics of DWPT systems [
10]. The advent of artificial intelligence (AI) and machine learning (ML) techniques has opened new possibilities for intelligent fault detection and diagnosis [
11,
12]. Deep learning models, in particular, have demonstrated remarkable capabilities in pattern recognition and classification tasks, making them well-suited for analyzing the high-dimensional, time-varying data generated by DWPT sensor systems [
13]. Neural network approaches have proven effective in various power system applications, including solar PV power estimation and forecasting [
14].
Digital twin technology has emerged as a powerful paradigm for creating virtual replicas of physical systems, enabling real-time monitoring, simulation, and predictive analytics [
15,
16]. The integration of digital twins with AI-based fault detection offers unprecedented capabilities for predictive maintenance and system optimization [
17,
18]. However, the application of digital twin-enabled fault diagnosis to grid-integrated DWPT systems remains unexplored. The growing penetration of distributed energy resources and EVs in modern power systems necessitates flexible demand-side management strategies to maintain grid stability [
19]. Comprehensive reviews of microgrid protection challenges have demonstrated the importance of systematic approaches to fault management in power systems with renewable energy resources [
20].
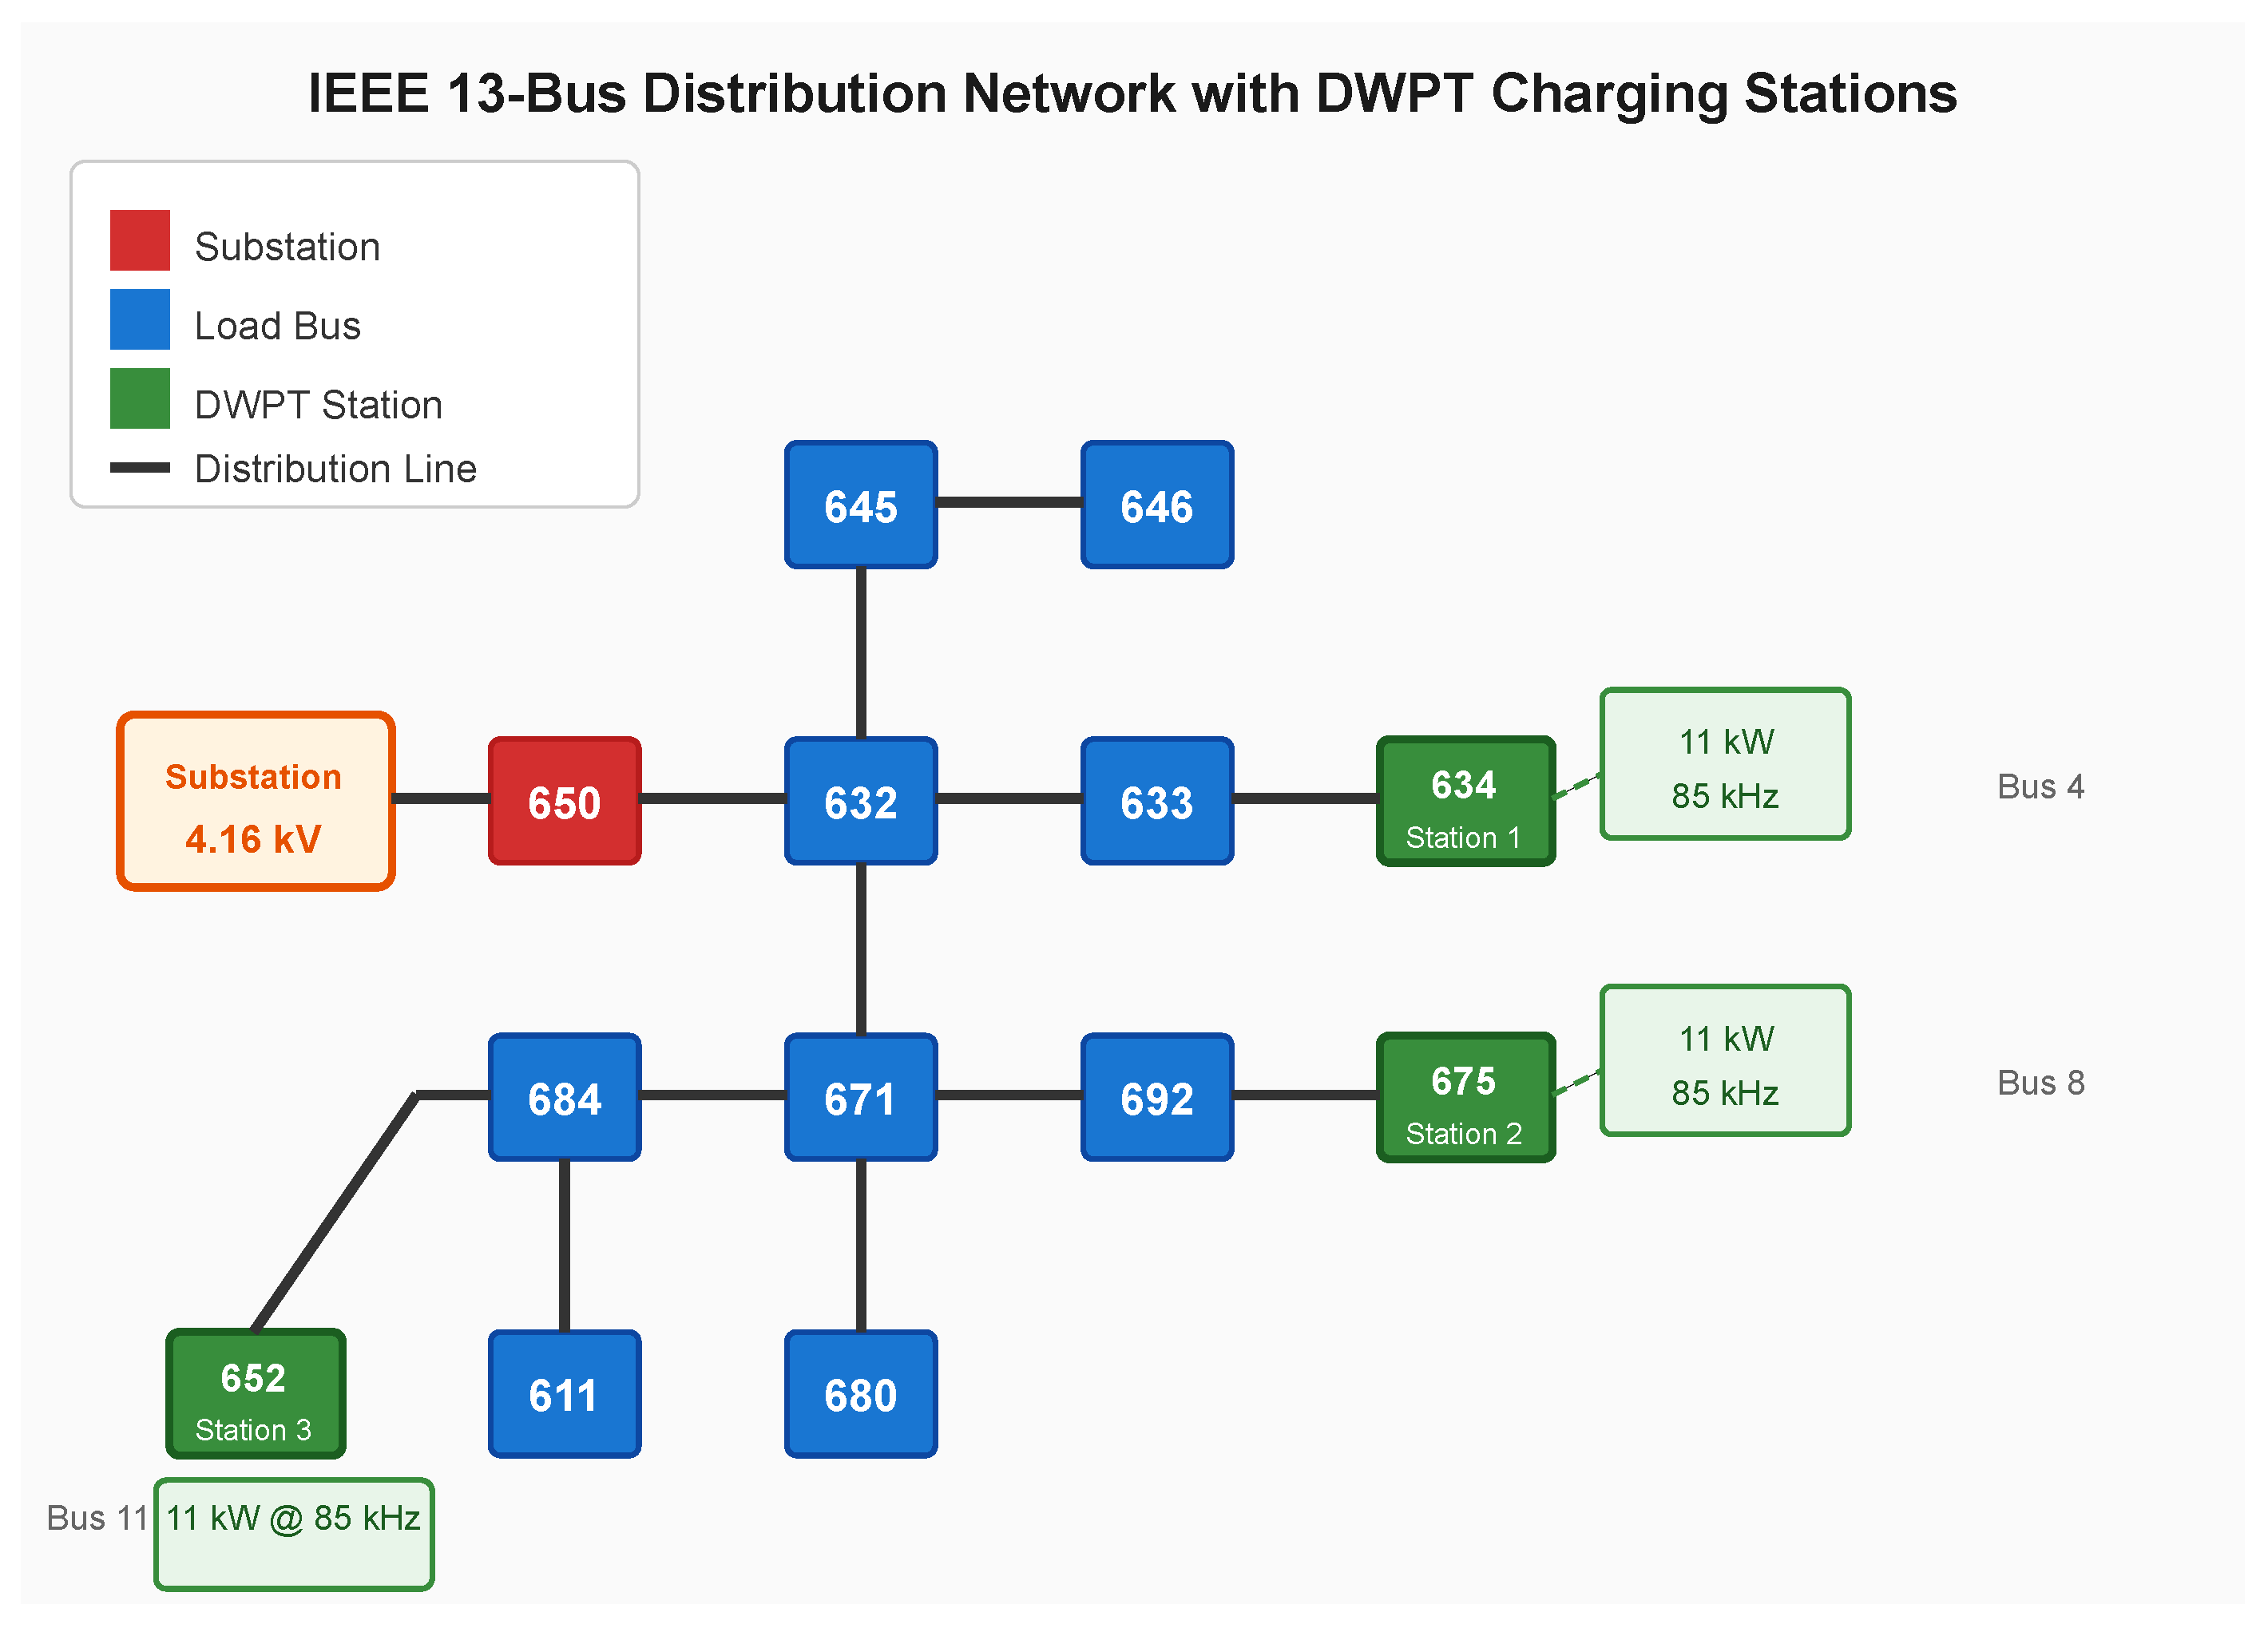
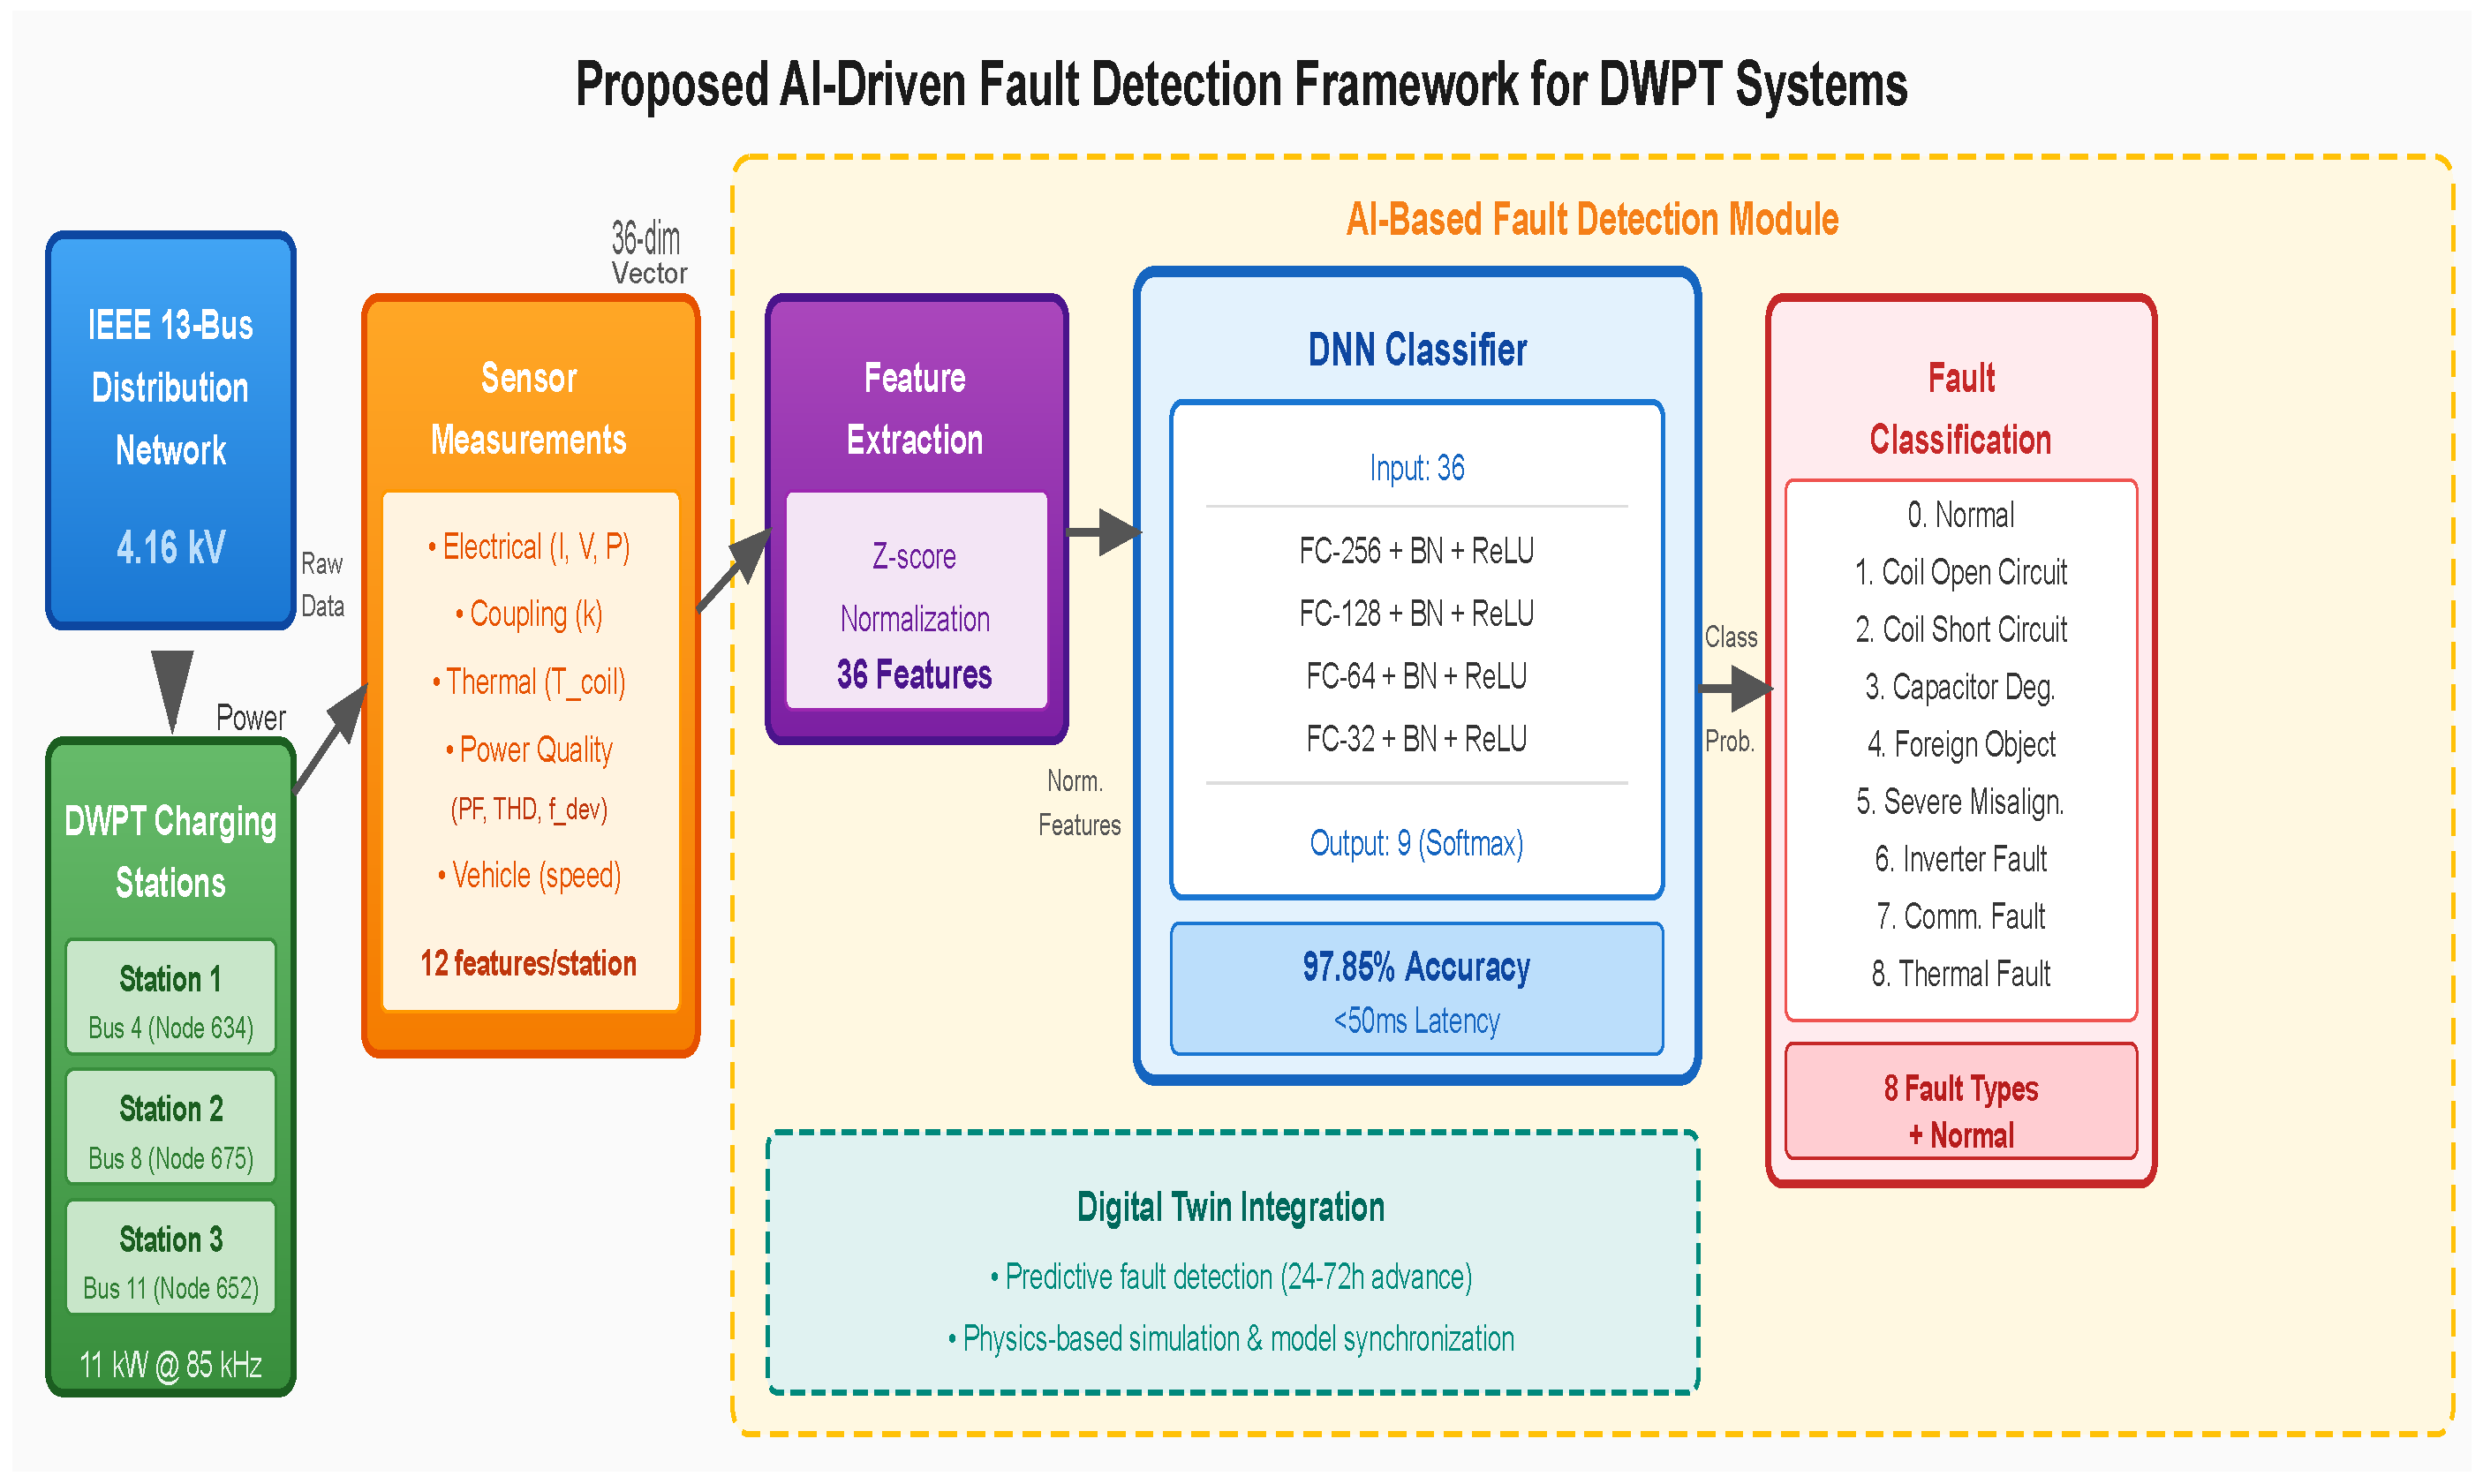
This paper presents an AI-driven fault management and diagnosis framework with digital twin integration for DWPT systems on the IEEE 13-bus distribution network. To clarify the terminology used throughout this paper: “DWPT” refers specifically to dynamic (in-motion) wireless power transfer, while “WPT” denotes the broader wireless power transfer field including static charging. “Fault detection” refers to the binary identification of abnormal operation, while “fault diagnosis” encompasses detection plus classification of the specific fault type and its root cause. “Inference latency” refers to the DNN model computation time alone (4.2 ms), whereas “end-to-end system latency” includes sensor acquisition, preprocessing, inference, and protection actuation (<50 ms total). The main contributions of this work include:
- 1.
First integration of AI-based fault detection with digital twin technology for DWPT systems on the IEEE 13-bus distribution network, enabling predictive and grid-aware fault diagnosis through multi-station sensor fusion;
- 2.
Explicit modeling of dynamic charging characteristics including time-varying coupling coefficients, segmented coil handover transitions, and speed-dependent fault signatures—differentiating this work from static WPT fault detection approaches;
- 3.
Comprehensive 8-class fault taxonomy covering coil faults, power electronics failures, foreign object detection, misalignment, and thermal issues—significantly more comprehensive than existing 2–4 class approaches;
- 4.
Circuit-based analytical derivations explaining the physical mechanisms behind each fault signature, supported by equivalent circuit analysis for the series–series (SS) compensation topology;
- 5.
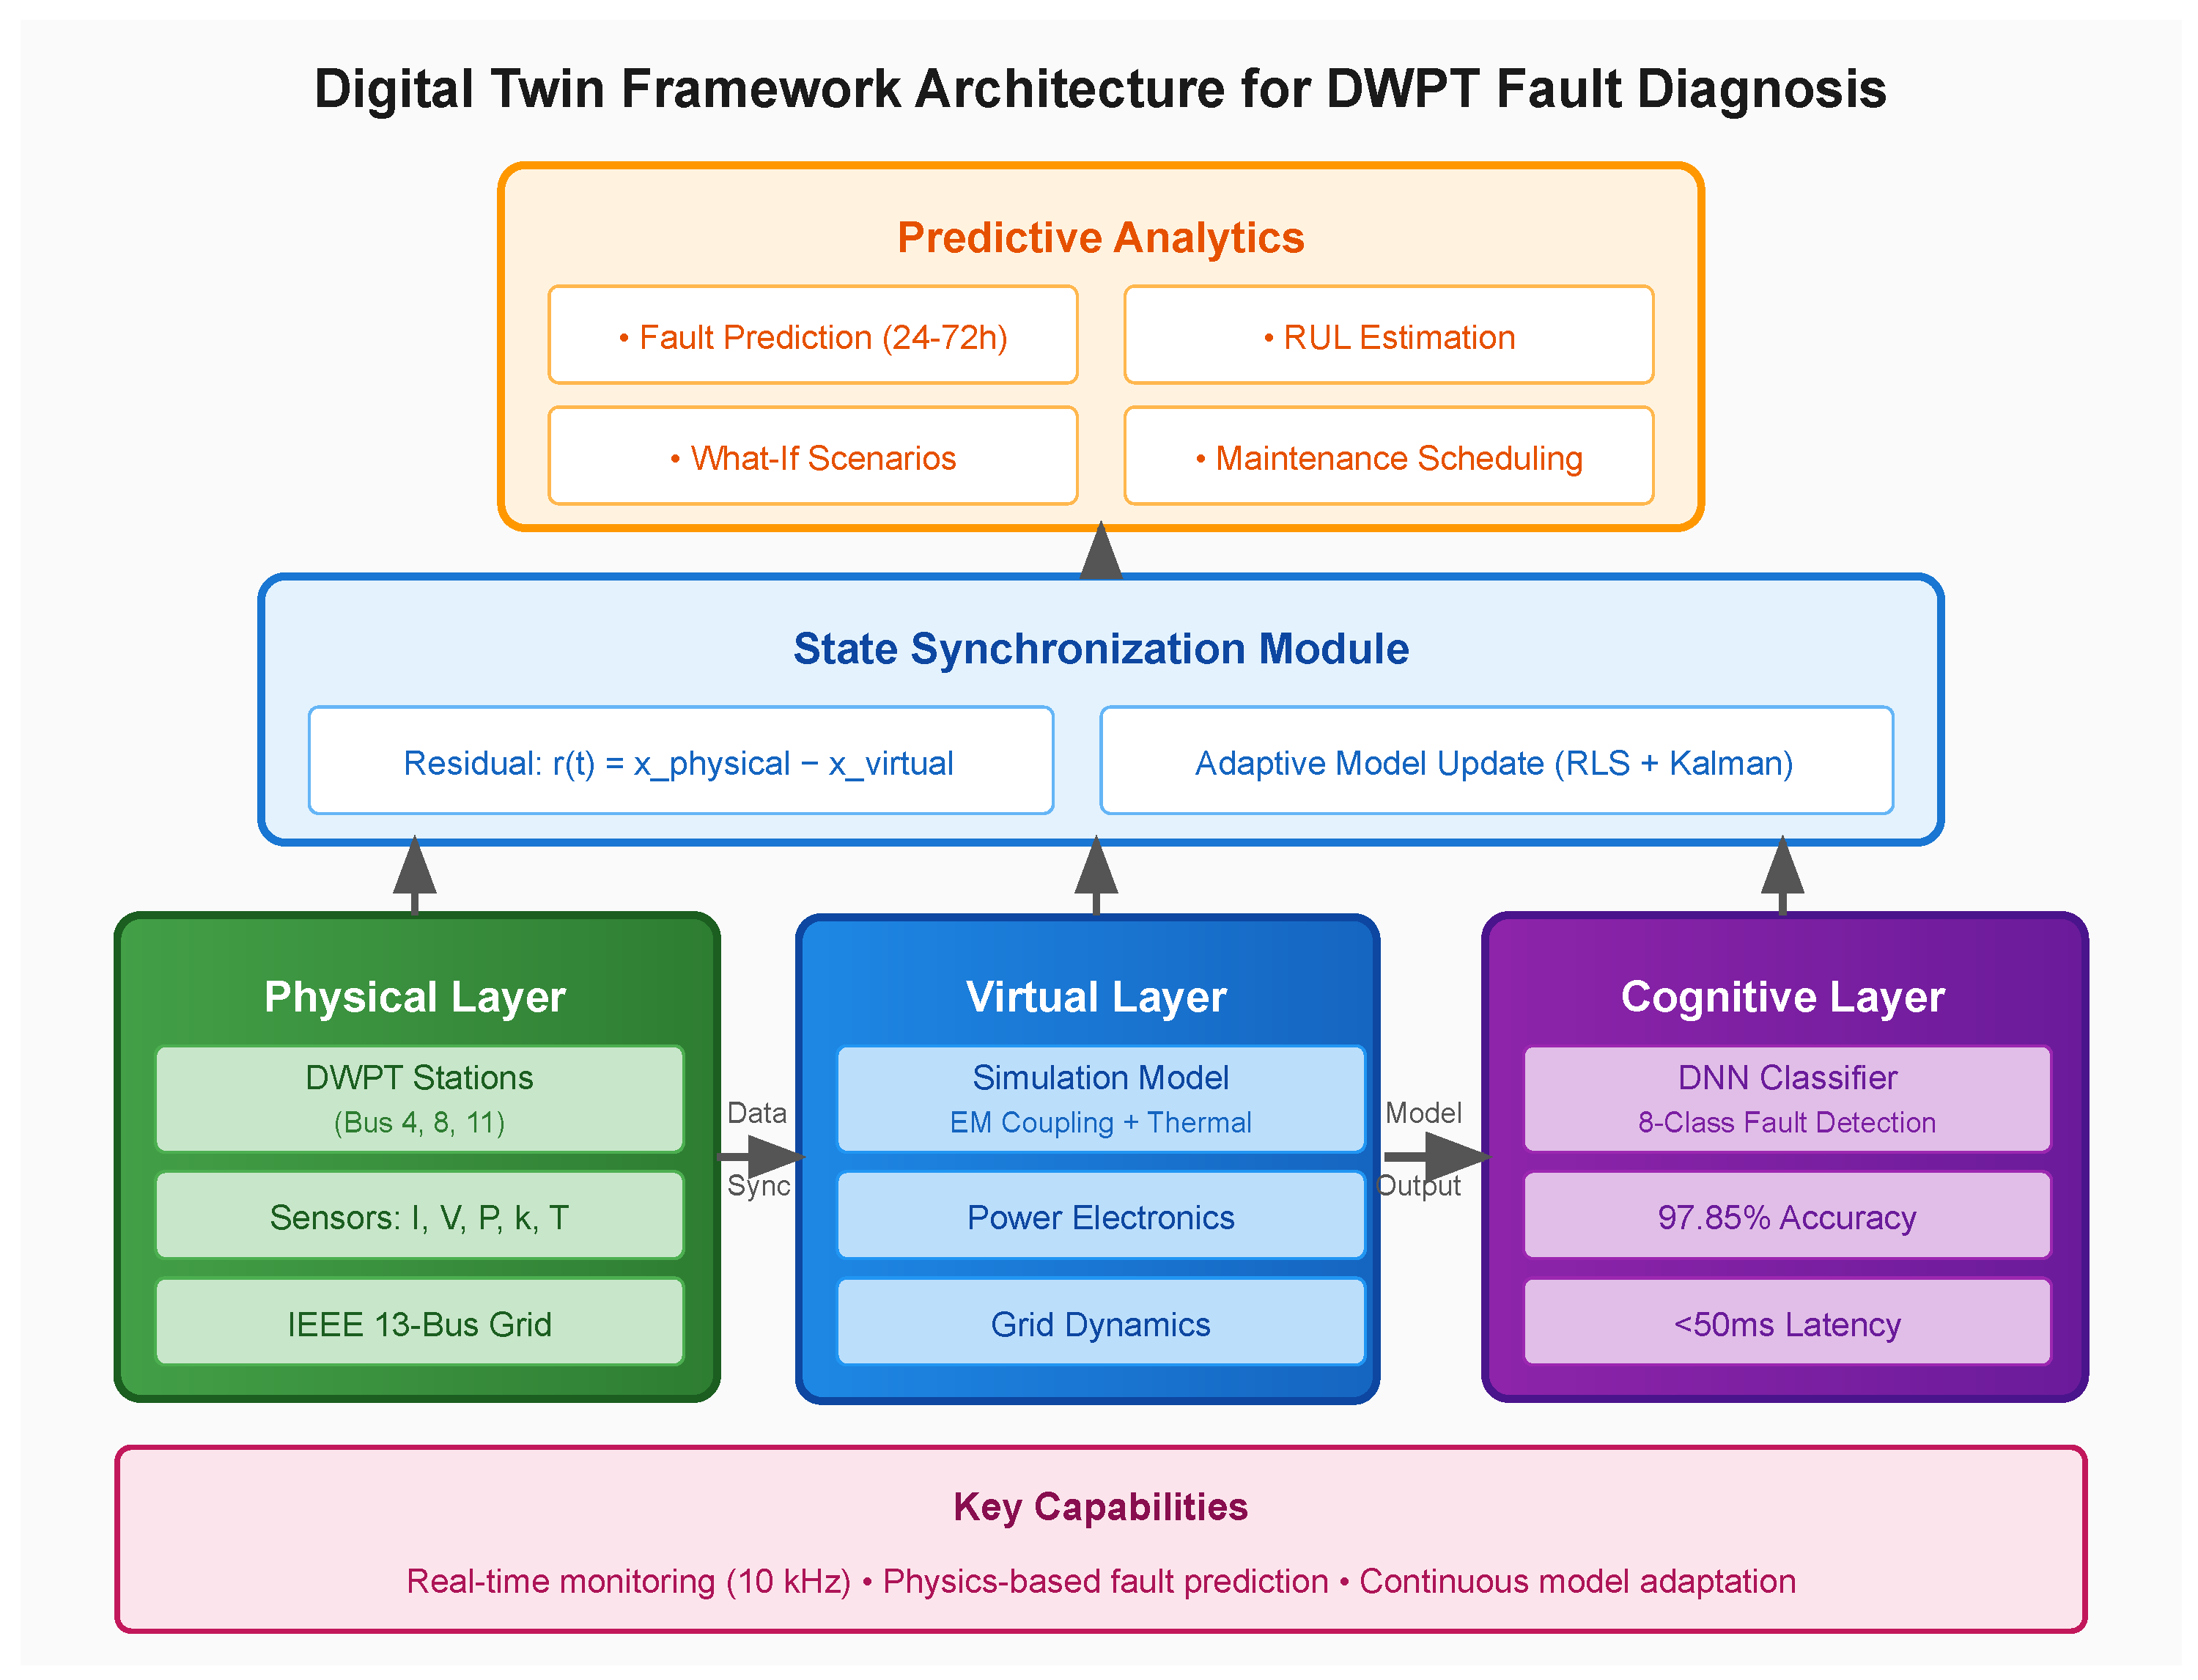
Digital twin framework with adaptive state synchronization enabling long-term prediction of incipient faults (24–72 h) and short-term early warning for impending failures (30–60 min);
- 6.
Practical parameter acquisition methodology detailing how each of the 36 sensor features can be measured or estimated in real-world deployments;
- 7.
Comprehensive benchmarking against six alternative ML/DL methods achieving superior classification accuracy (97.85% ± 0.42%, vs. baselines), with real-time detection capability under 50 ms latency.
The remainder of this paper is organized as follows:
Section 2 reviews the related work.
Section 3 presents the materials and methods including system modeling, fault types, and the proposed AI framework.
Section 4 presents results and case studies.
Section 5 provides discussion.
Section 6 concludes the paper.
4. Results
4.1. Classification Performance
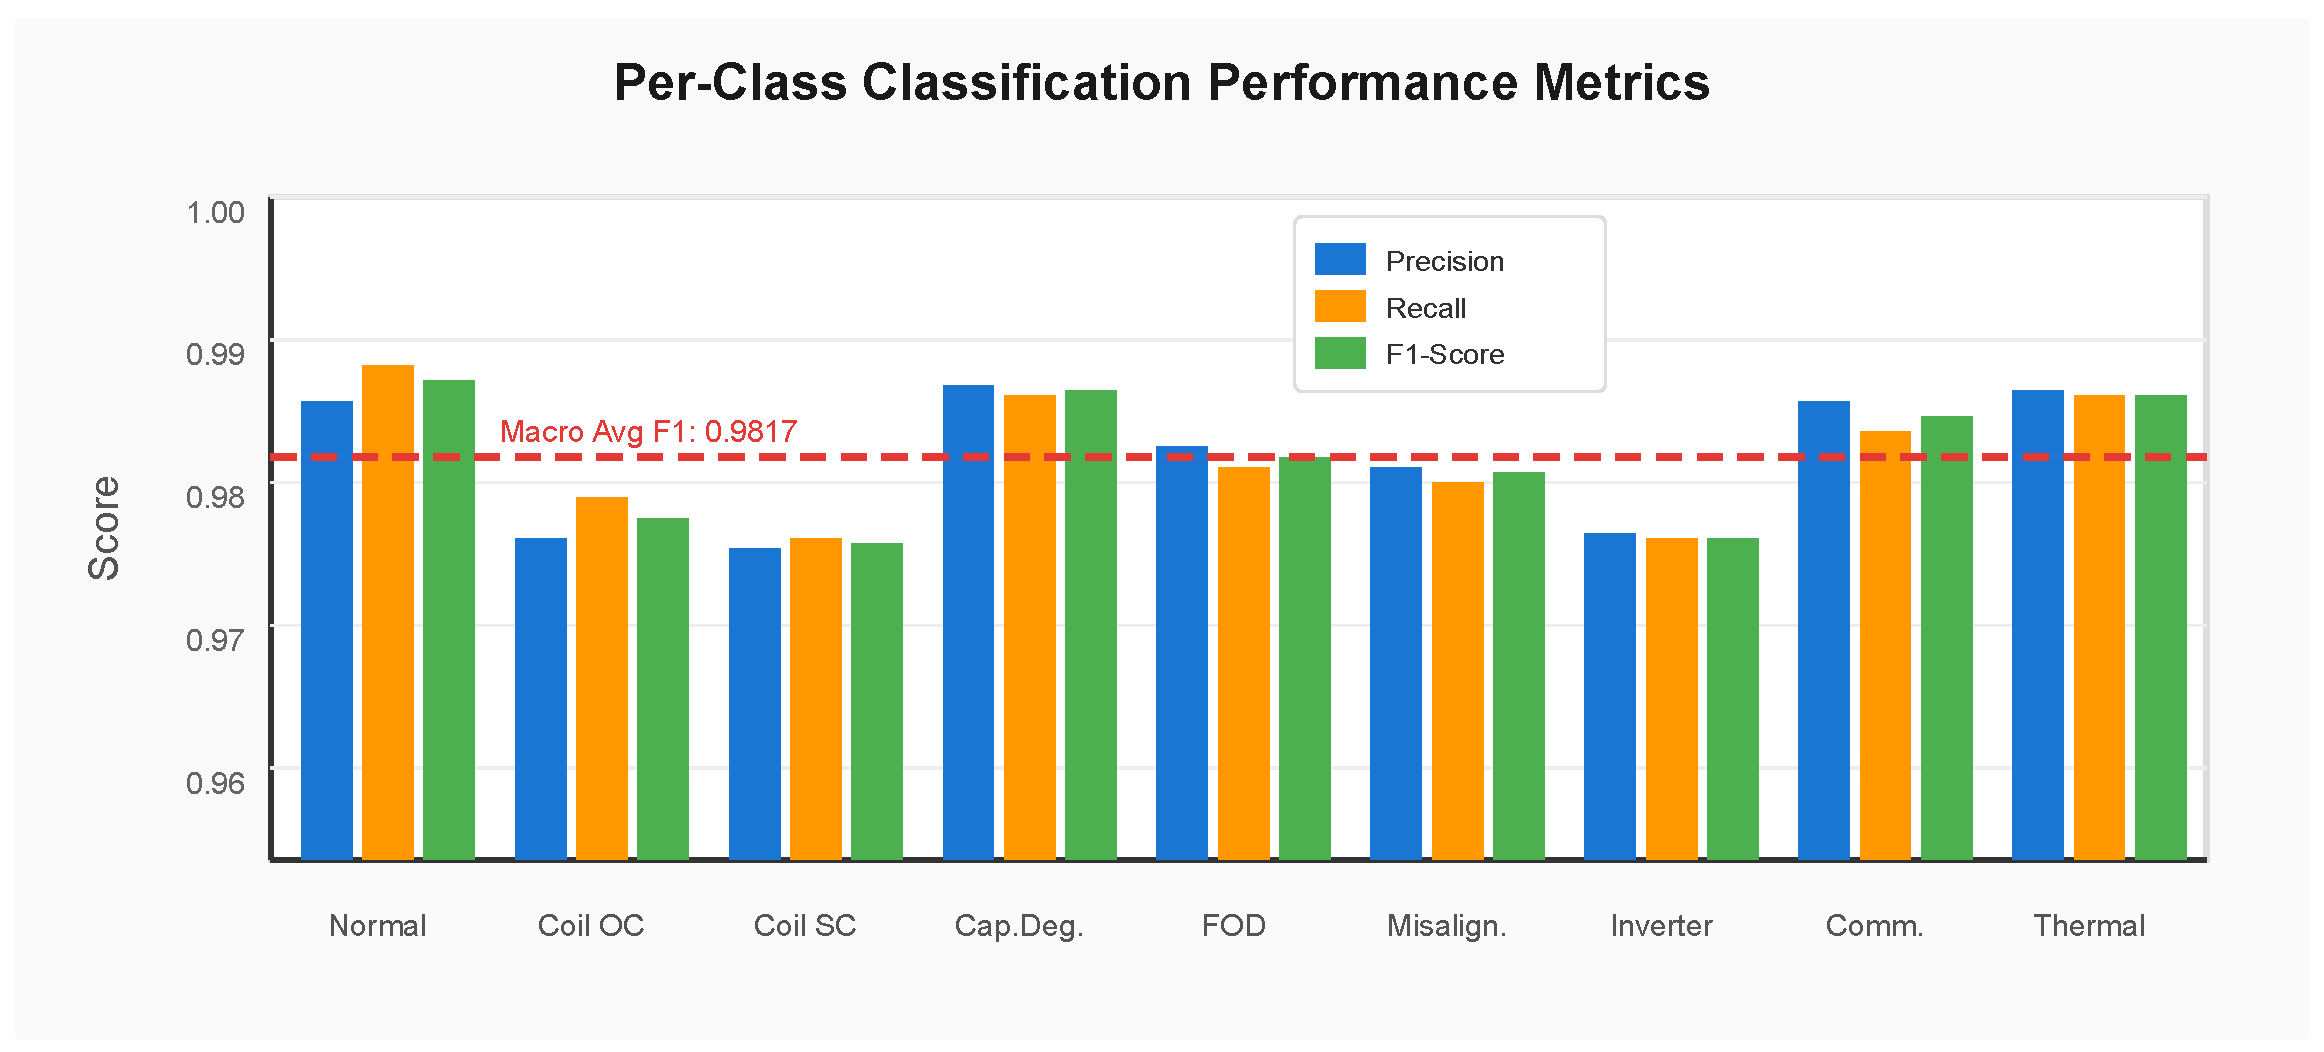
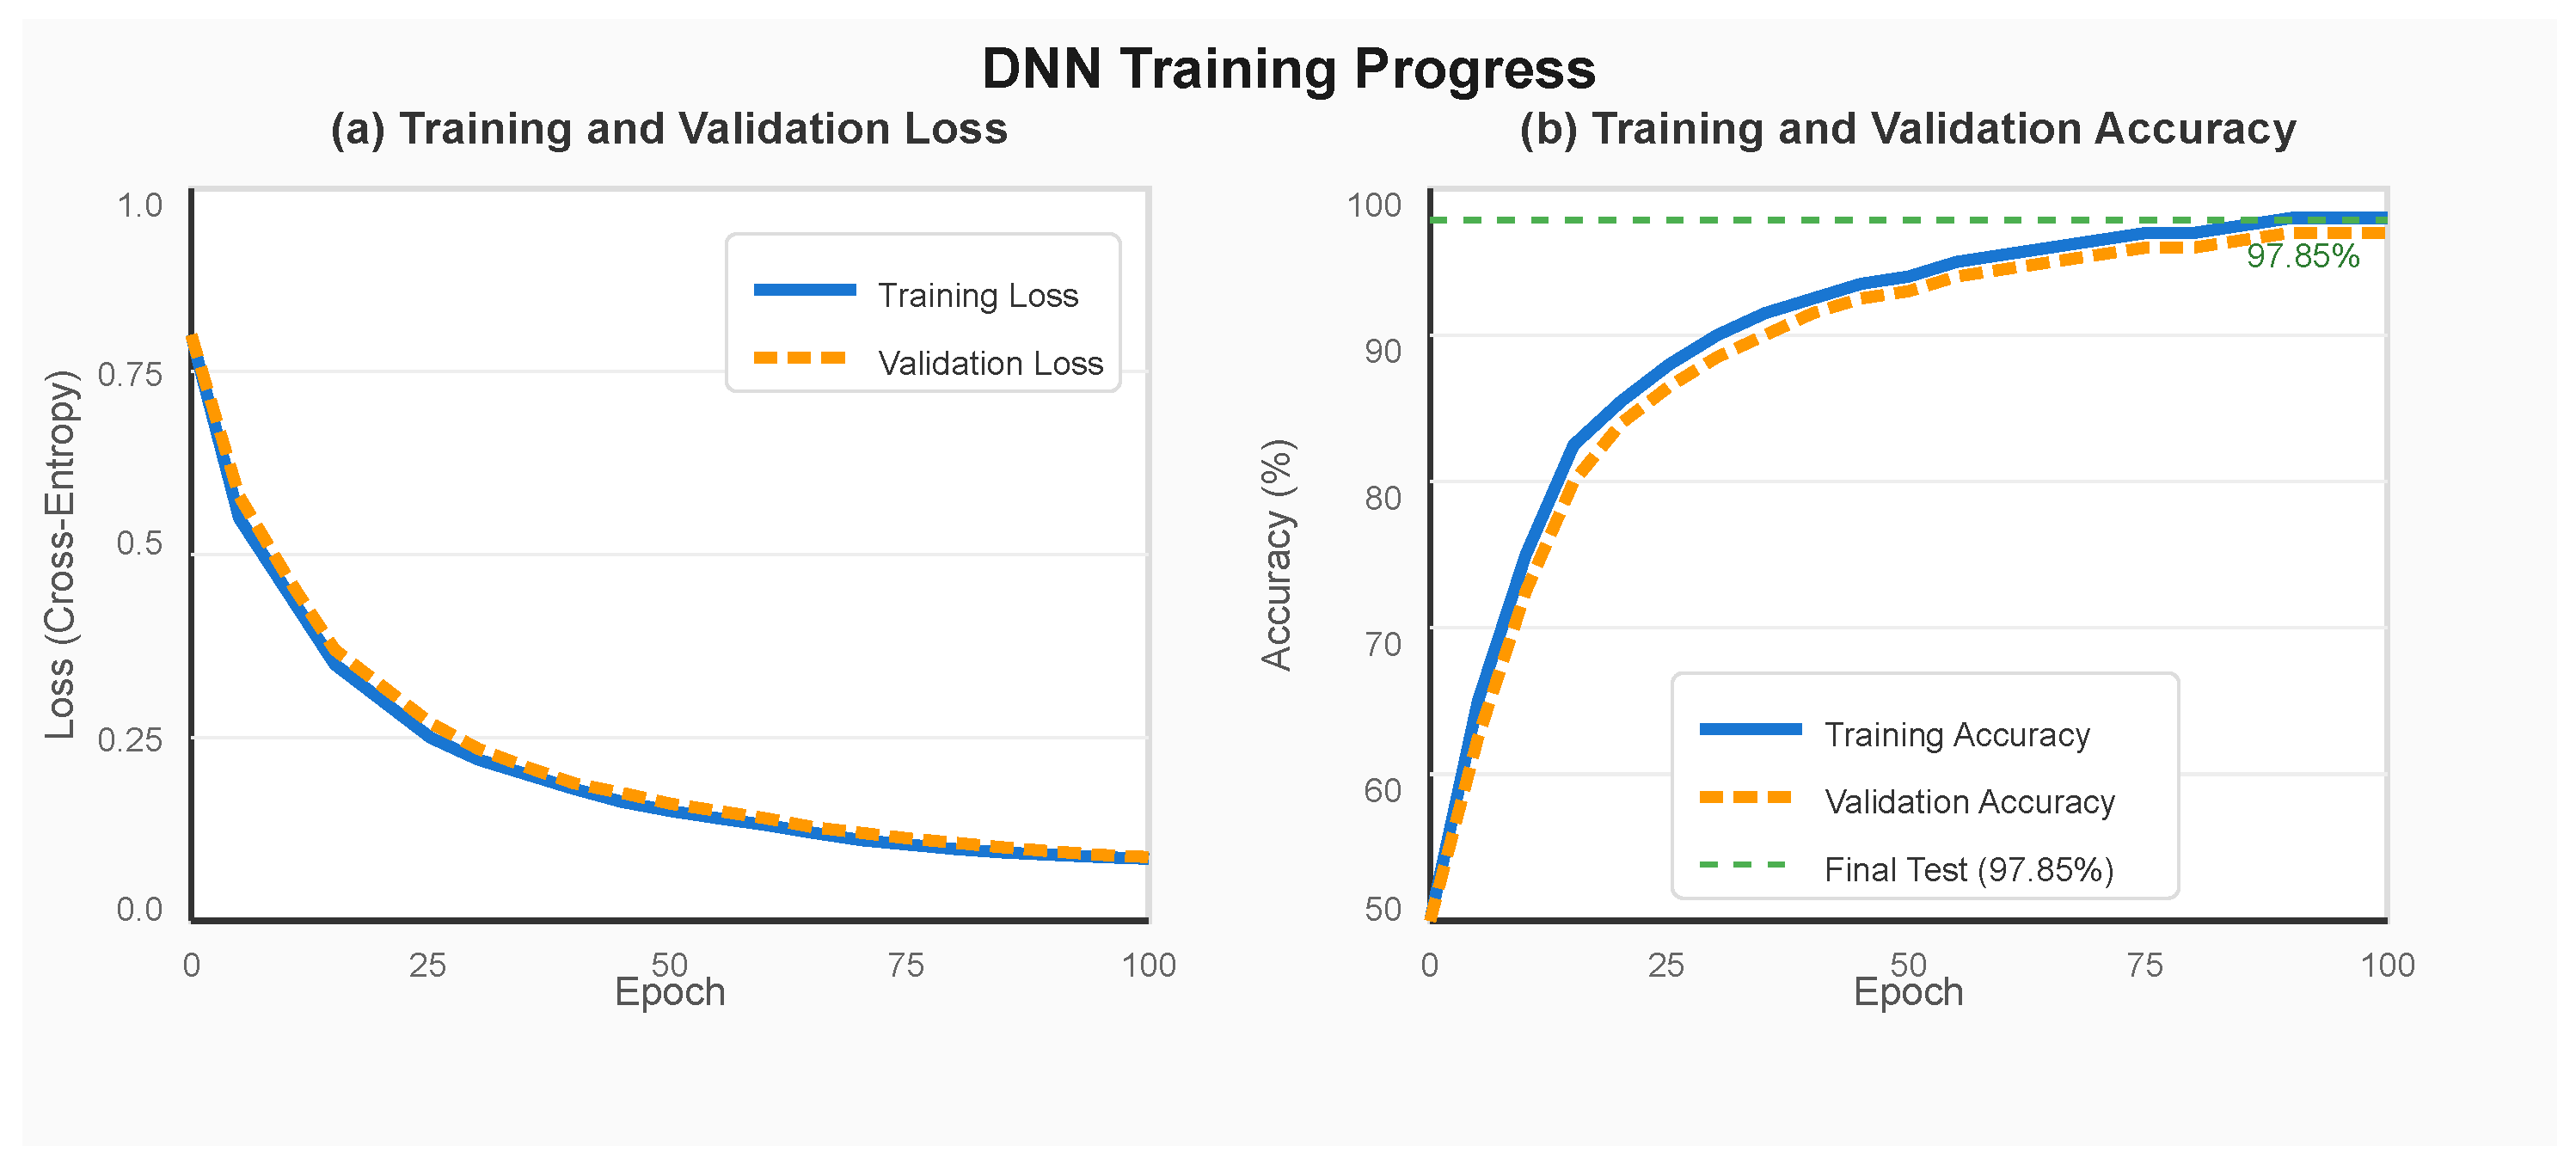
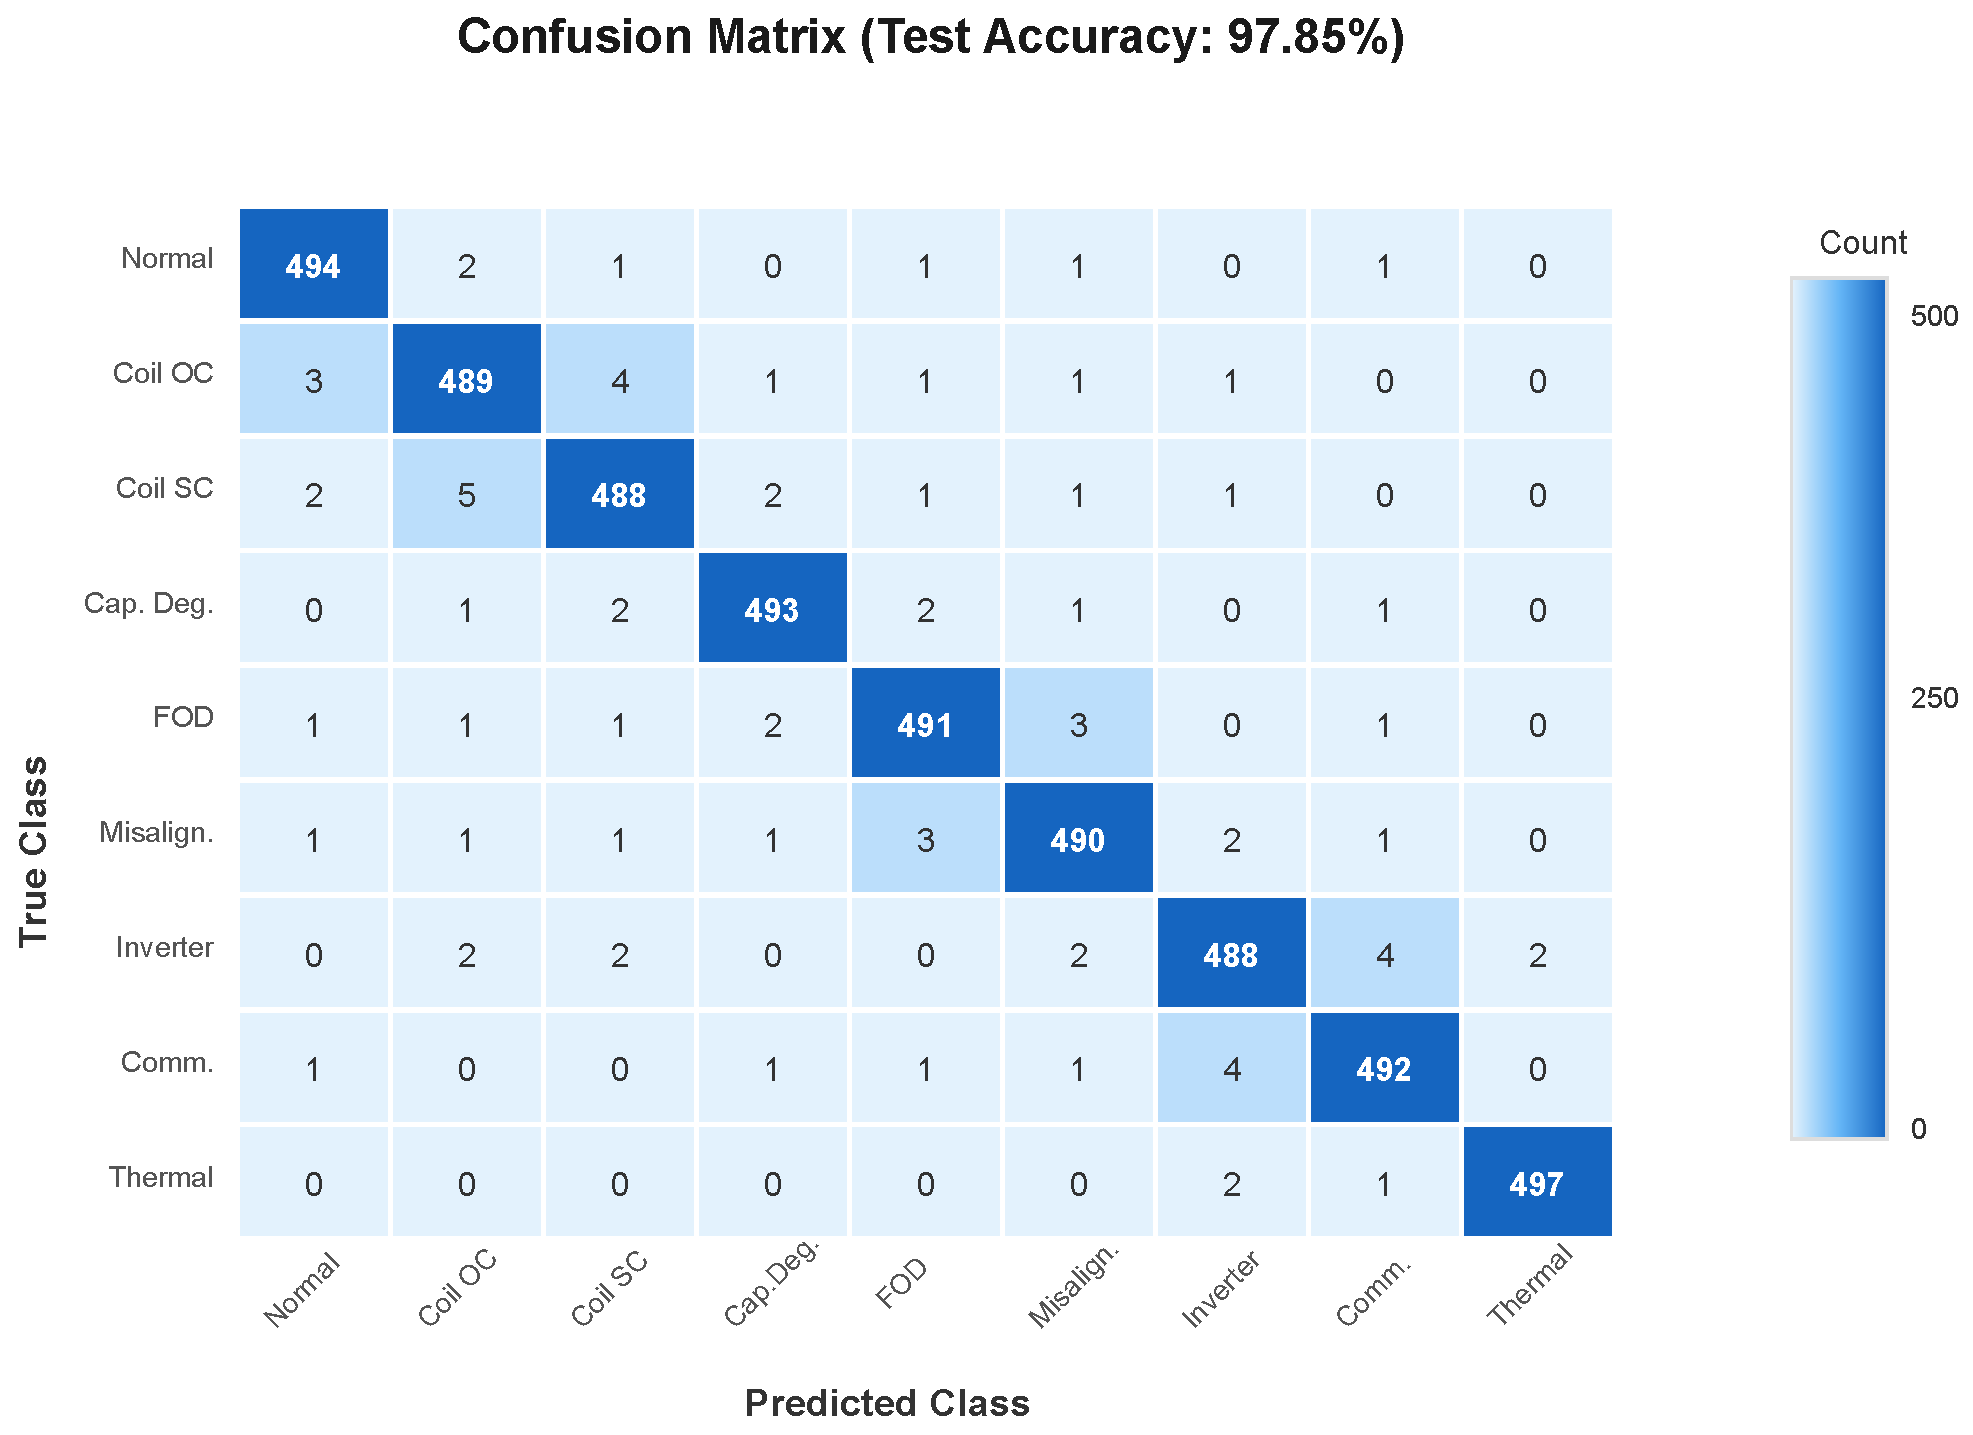
The proposed DNN model achieves a test accuracy of 97.85% ± 0.42% (95% confidence interval), with macro averaged precision, recall, and F1 score of 0.9817 ± 0.004.
Table 4 presents the detailed per-class performance metrics.
The confusion matrix in
Figure 5 reveals excellent classification performance across all fault types.
Figure 6 illustrates the per-class precision, recall, and F1 score.
4.2. Comparison with Alternative Methods
Table 5 compares the proposed DNN approach with alternative machine learning methods. Statistical significance was assessed using paired
t-tests with Bonferroni correction.
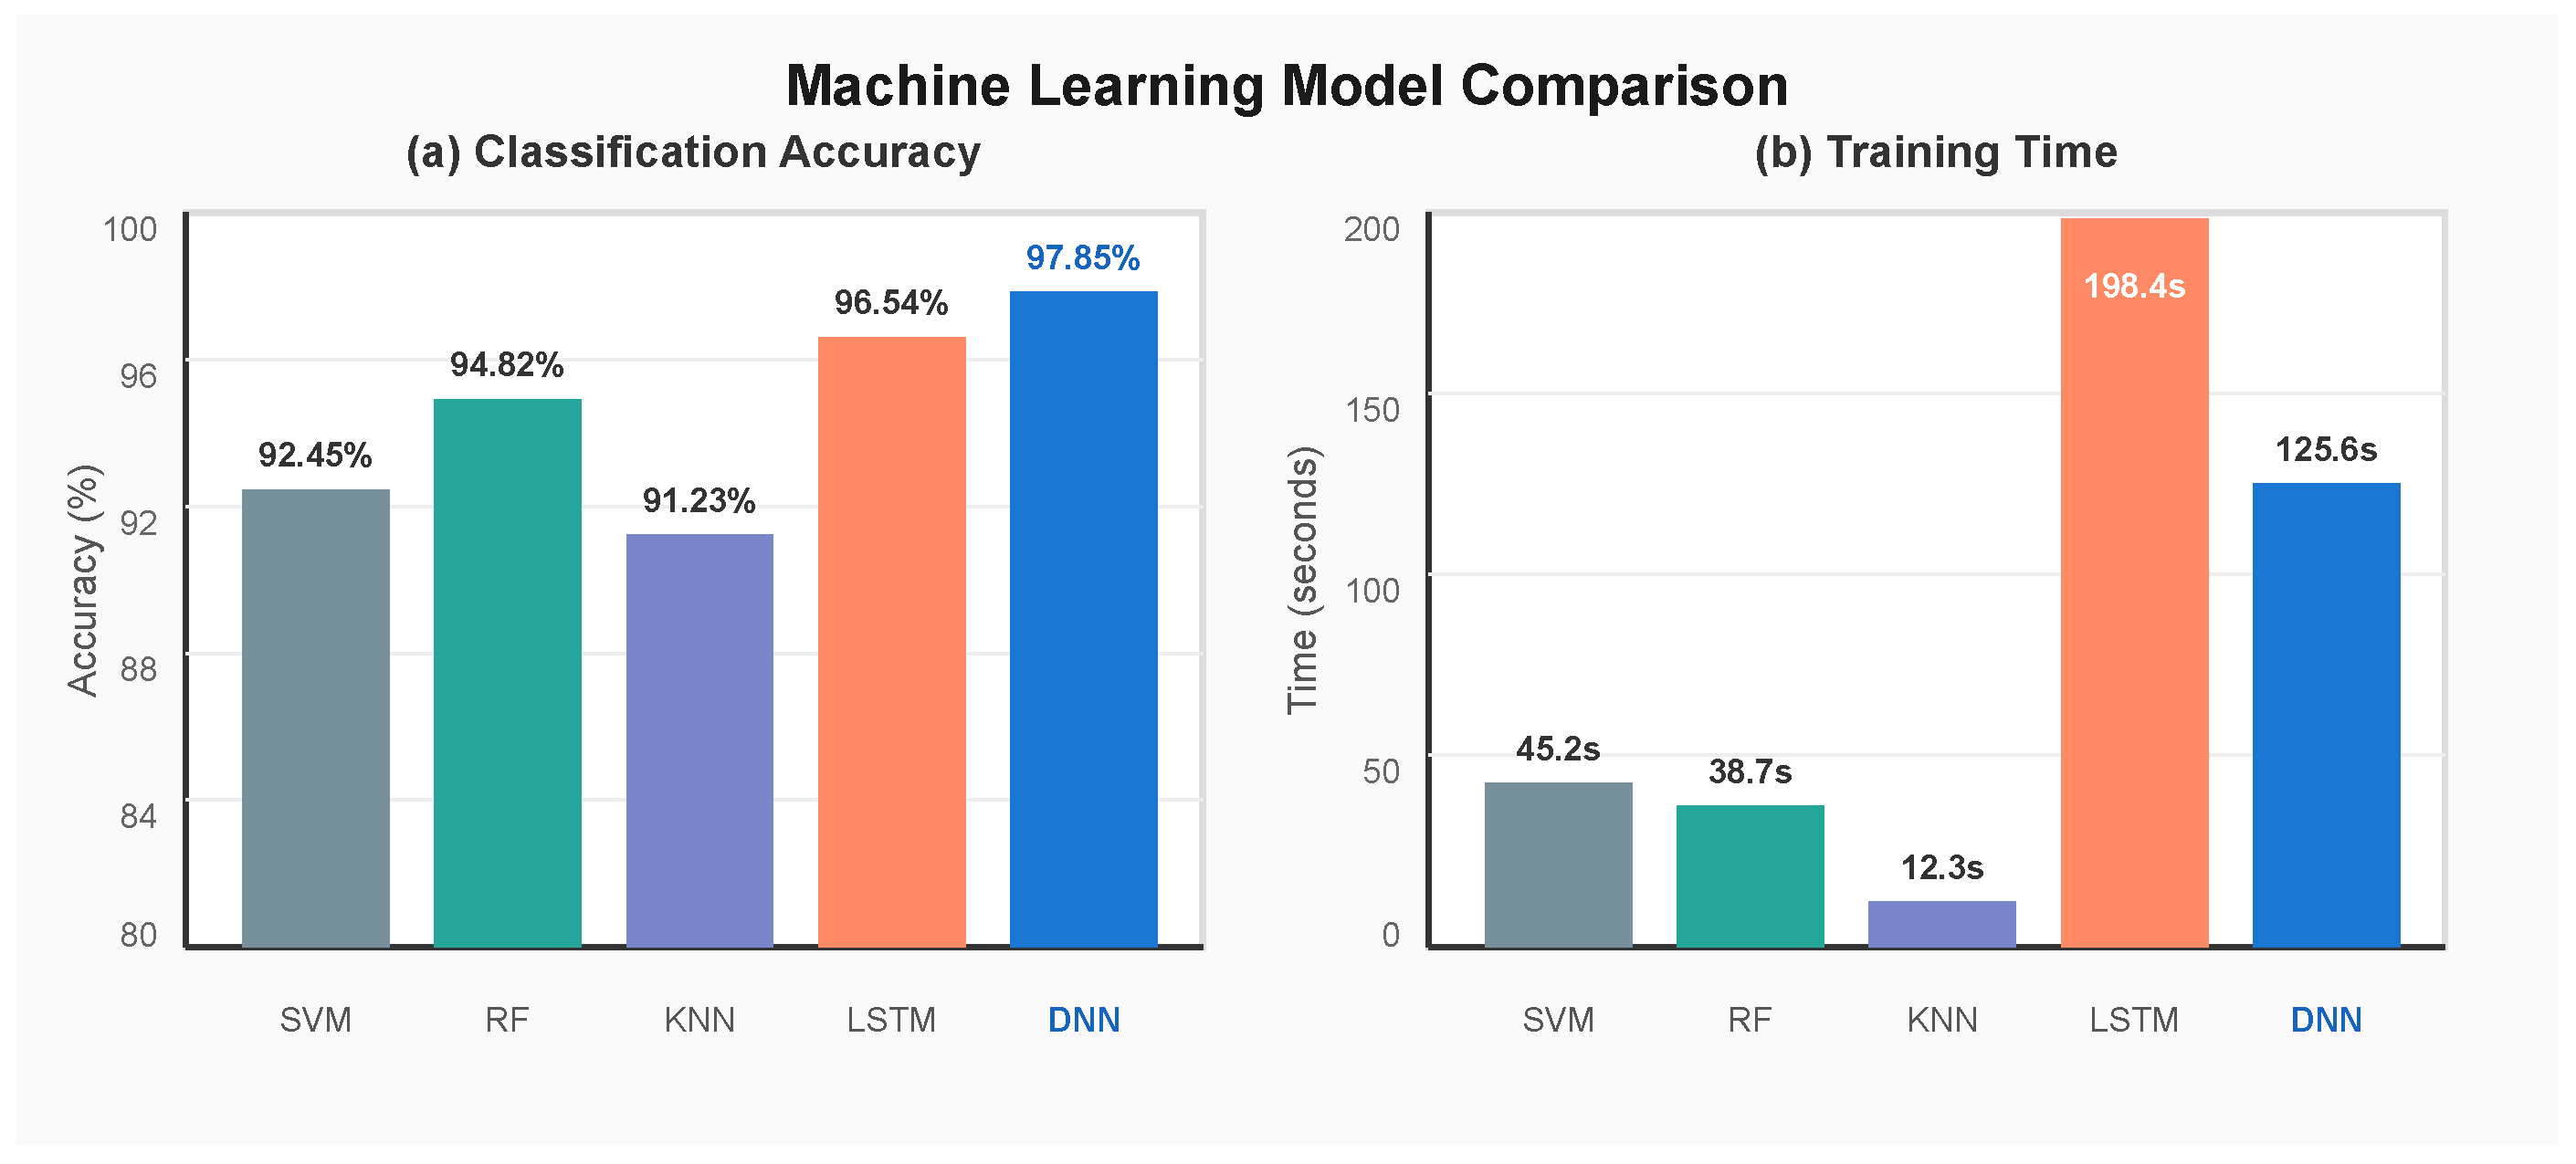
The proposed DNN achieves the highest accuracy while maintaining an inference time under 5 ms, meeting the real-time requirements. While 1D-CNN offers slightly faster inference, its 2.18% lower accuracy represents a significant performance gap for safety-critical fault detection. LSTM and Transformer models, despite competitive accuracy, exhibit 4–6× higher inference latency due to sequential processing and attention computation overhead.
Figure 7 provides a visual comparison of model performance.
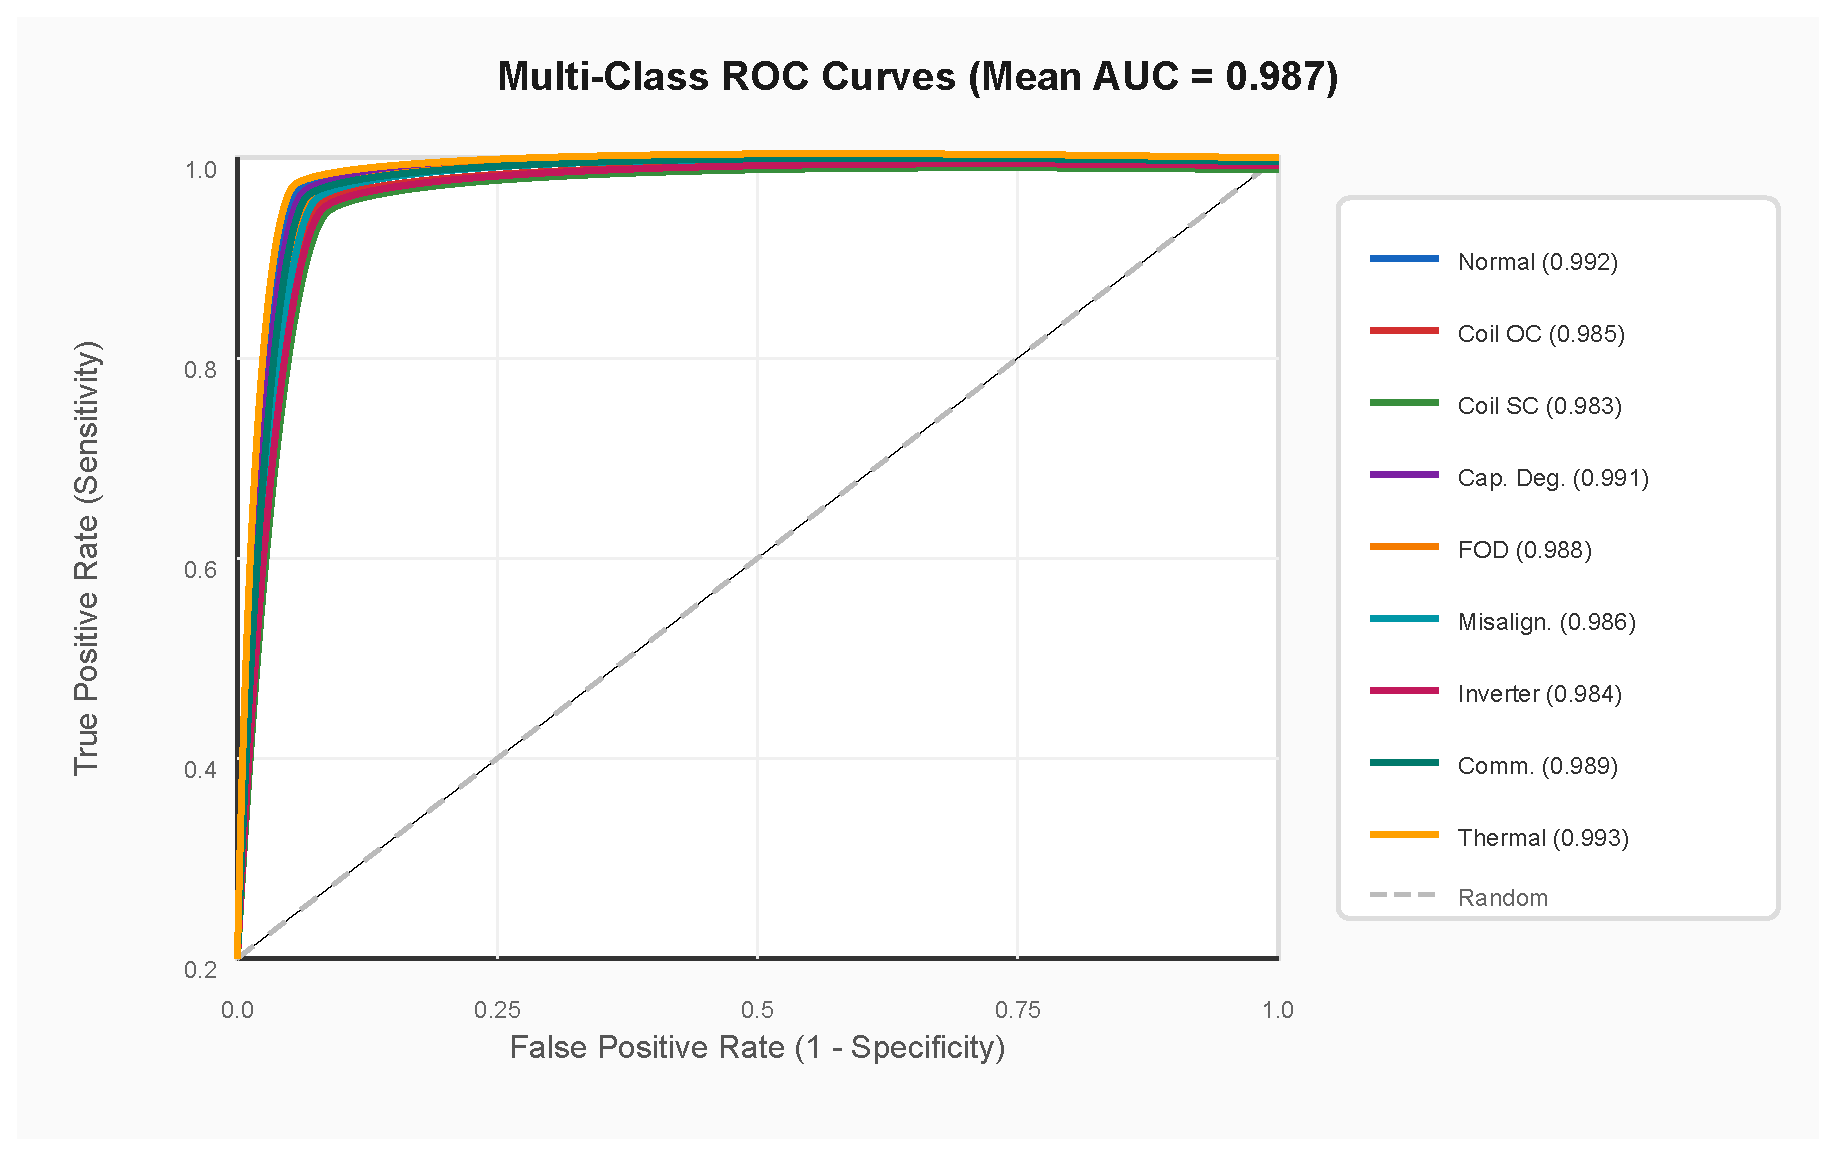
4.3. ROC Analysis
Figure 8 presents the ROC curves for multi-class fault detection. The macro averaged AUC of 0.987 indicates excellent discriminative ability.
4.4. Feature Importance Analysis
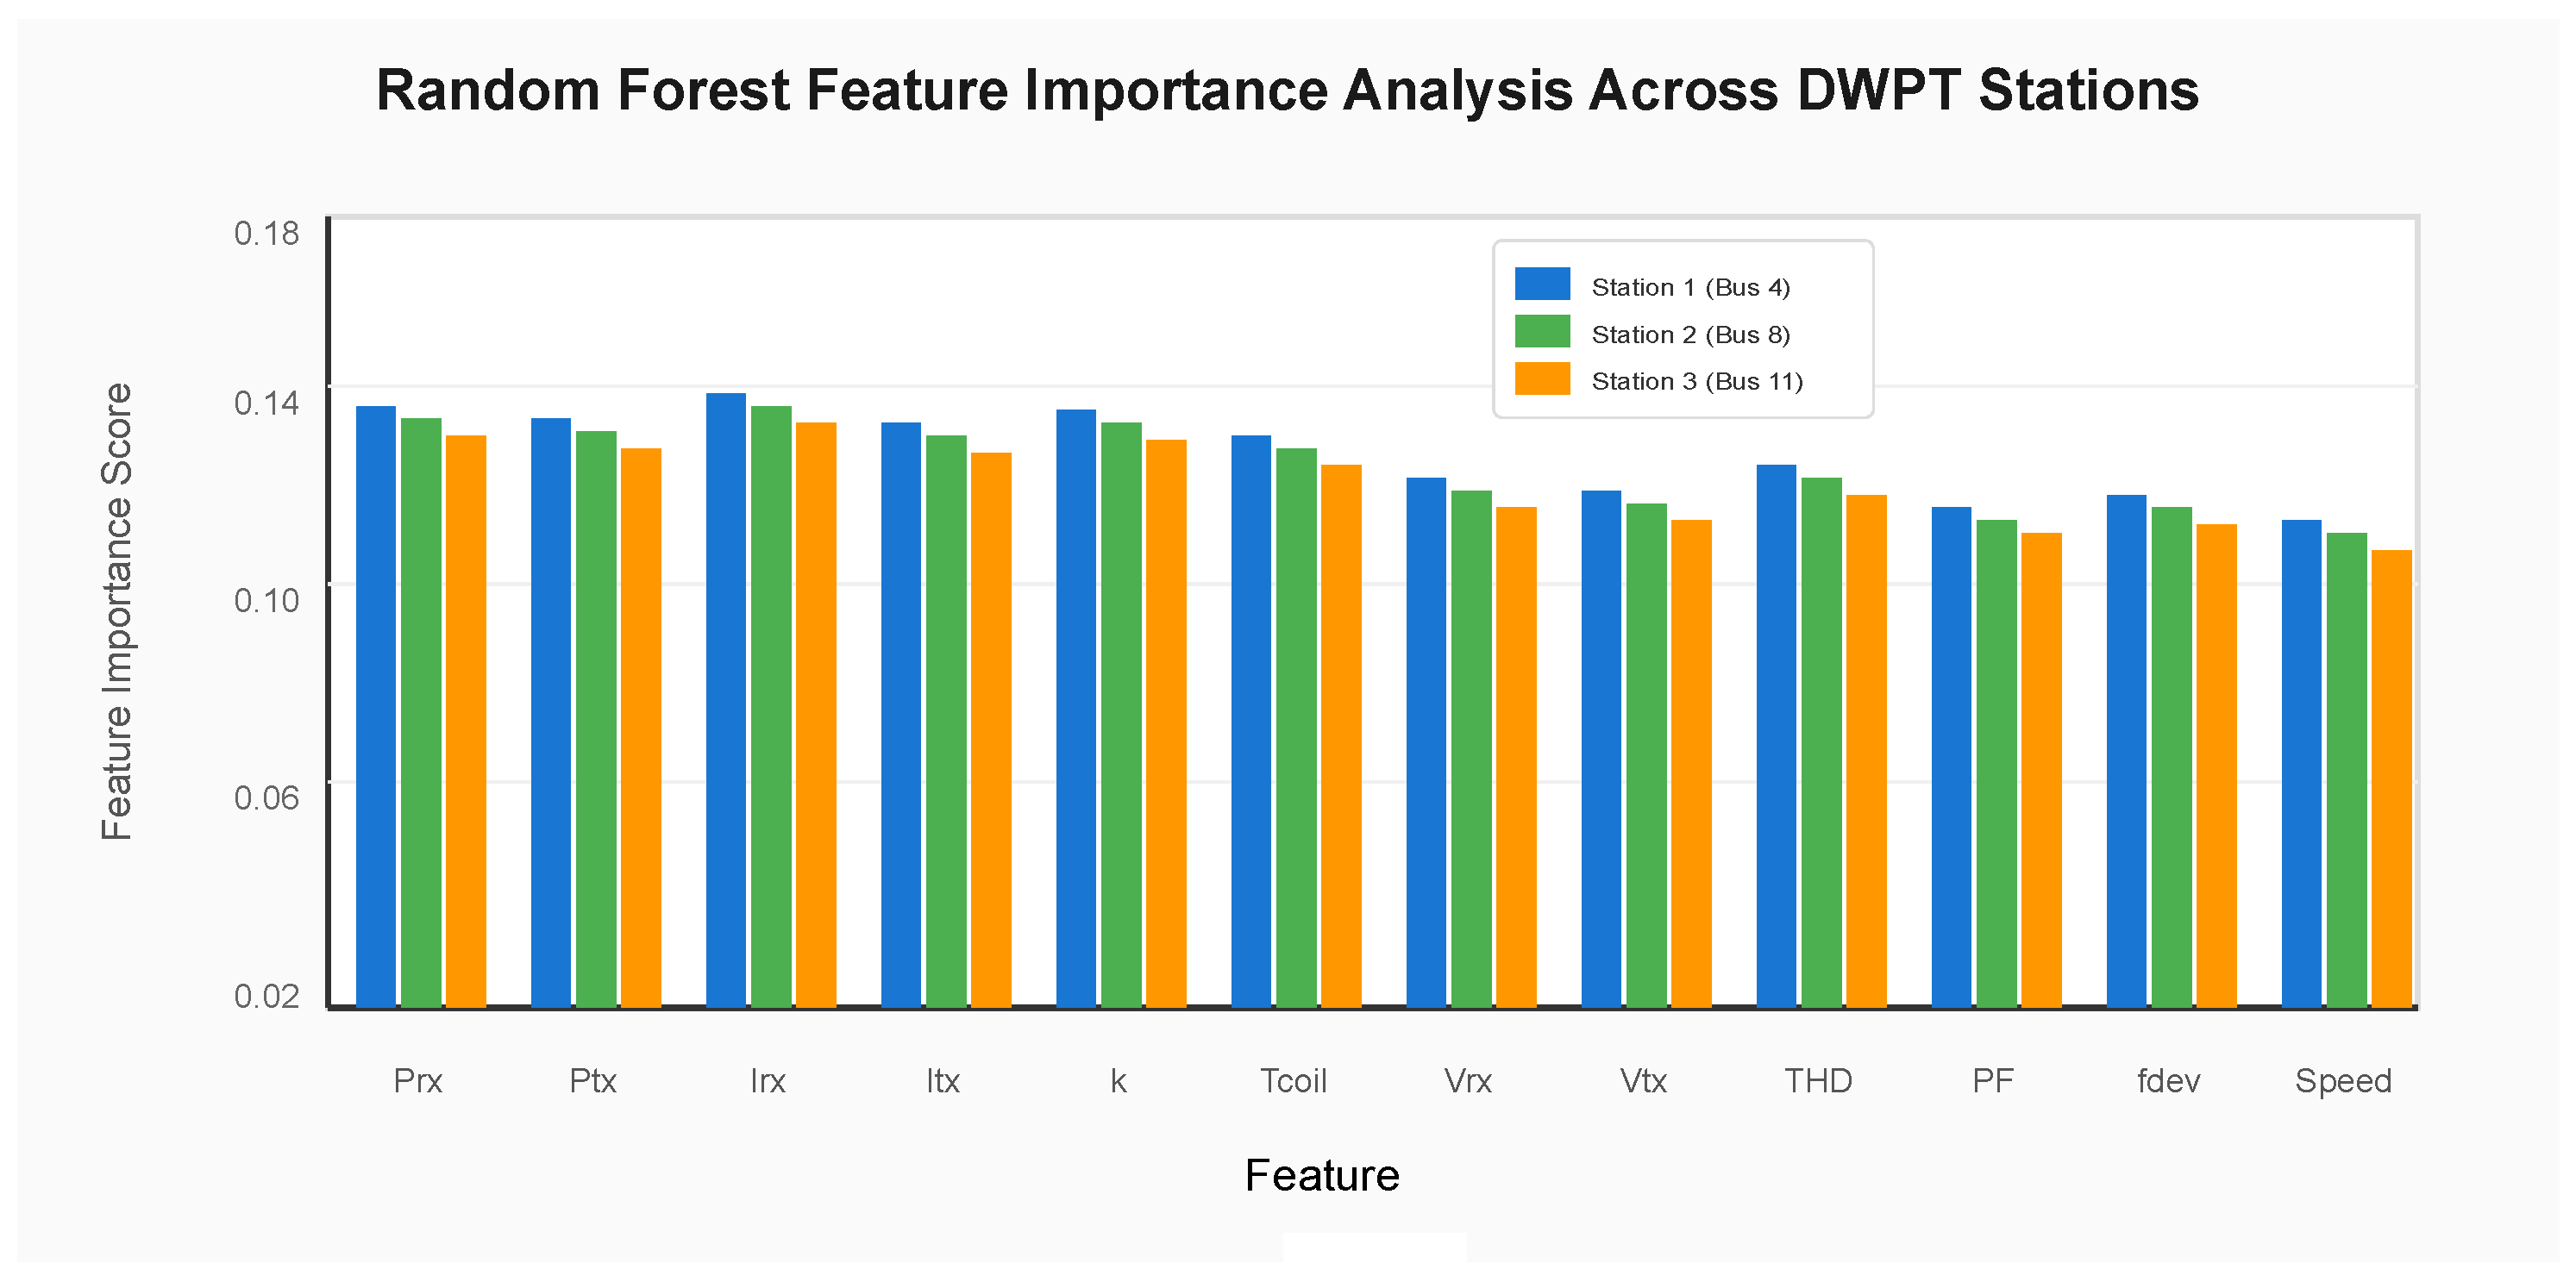
Figure 9 reveals the discriminative contribution of each sensor feature. Power-related features (
,
) and current measurements (
,
) are the most discriminative for fault classification.
4.5. Sensitivity Analysis with Reduced Features
To address practical deployment concerns where some parameters may be difficult to measure, this paper evaluates model performance with progressively reduced feature sets (
Table 6):
The analysis reveals that acceptable performance (>94%) can be achieved using only electrical measurements, providing a practical fallback when coupling coefficient or speed estimation is unavailable. However, the full feature set provides the best performance, justifying the investment in comprehensive sensing infrastructure.
4.6. Real-Time Detection Performance
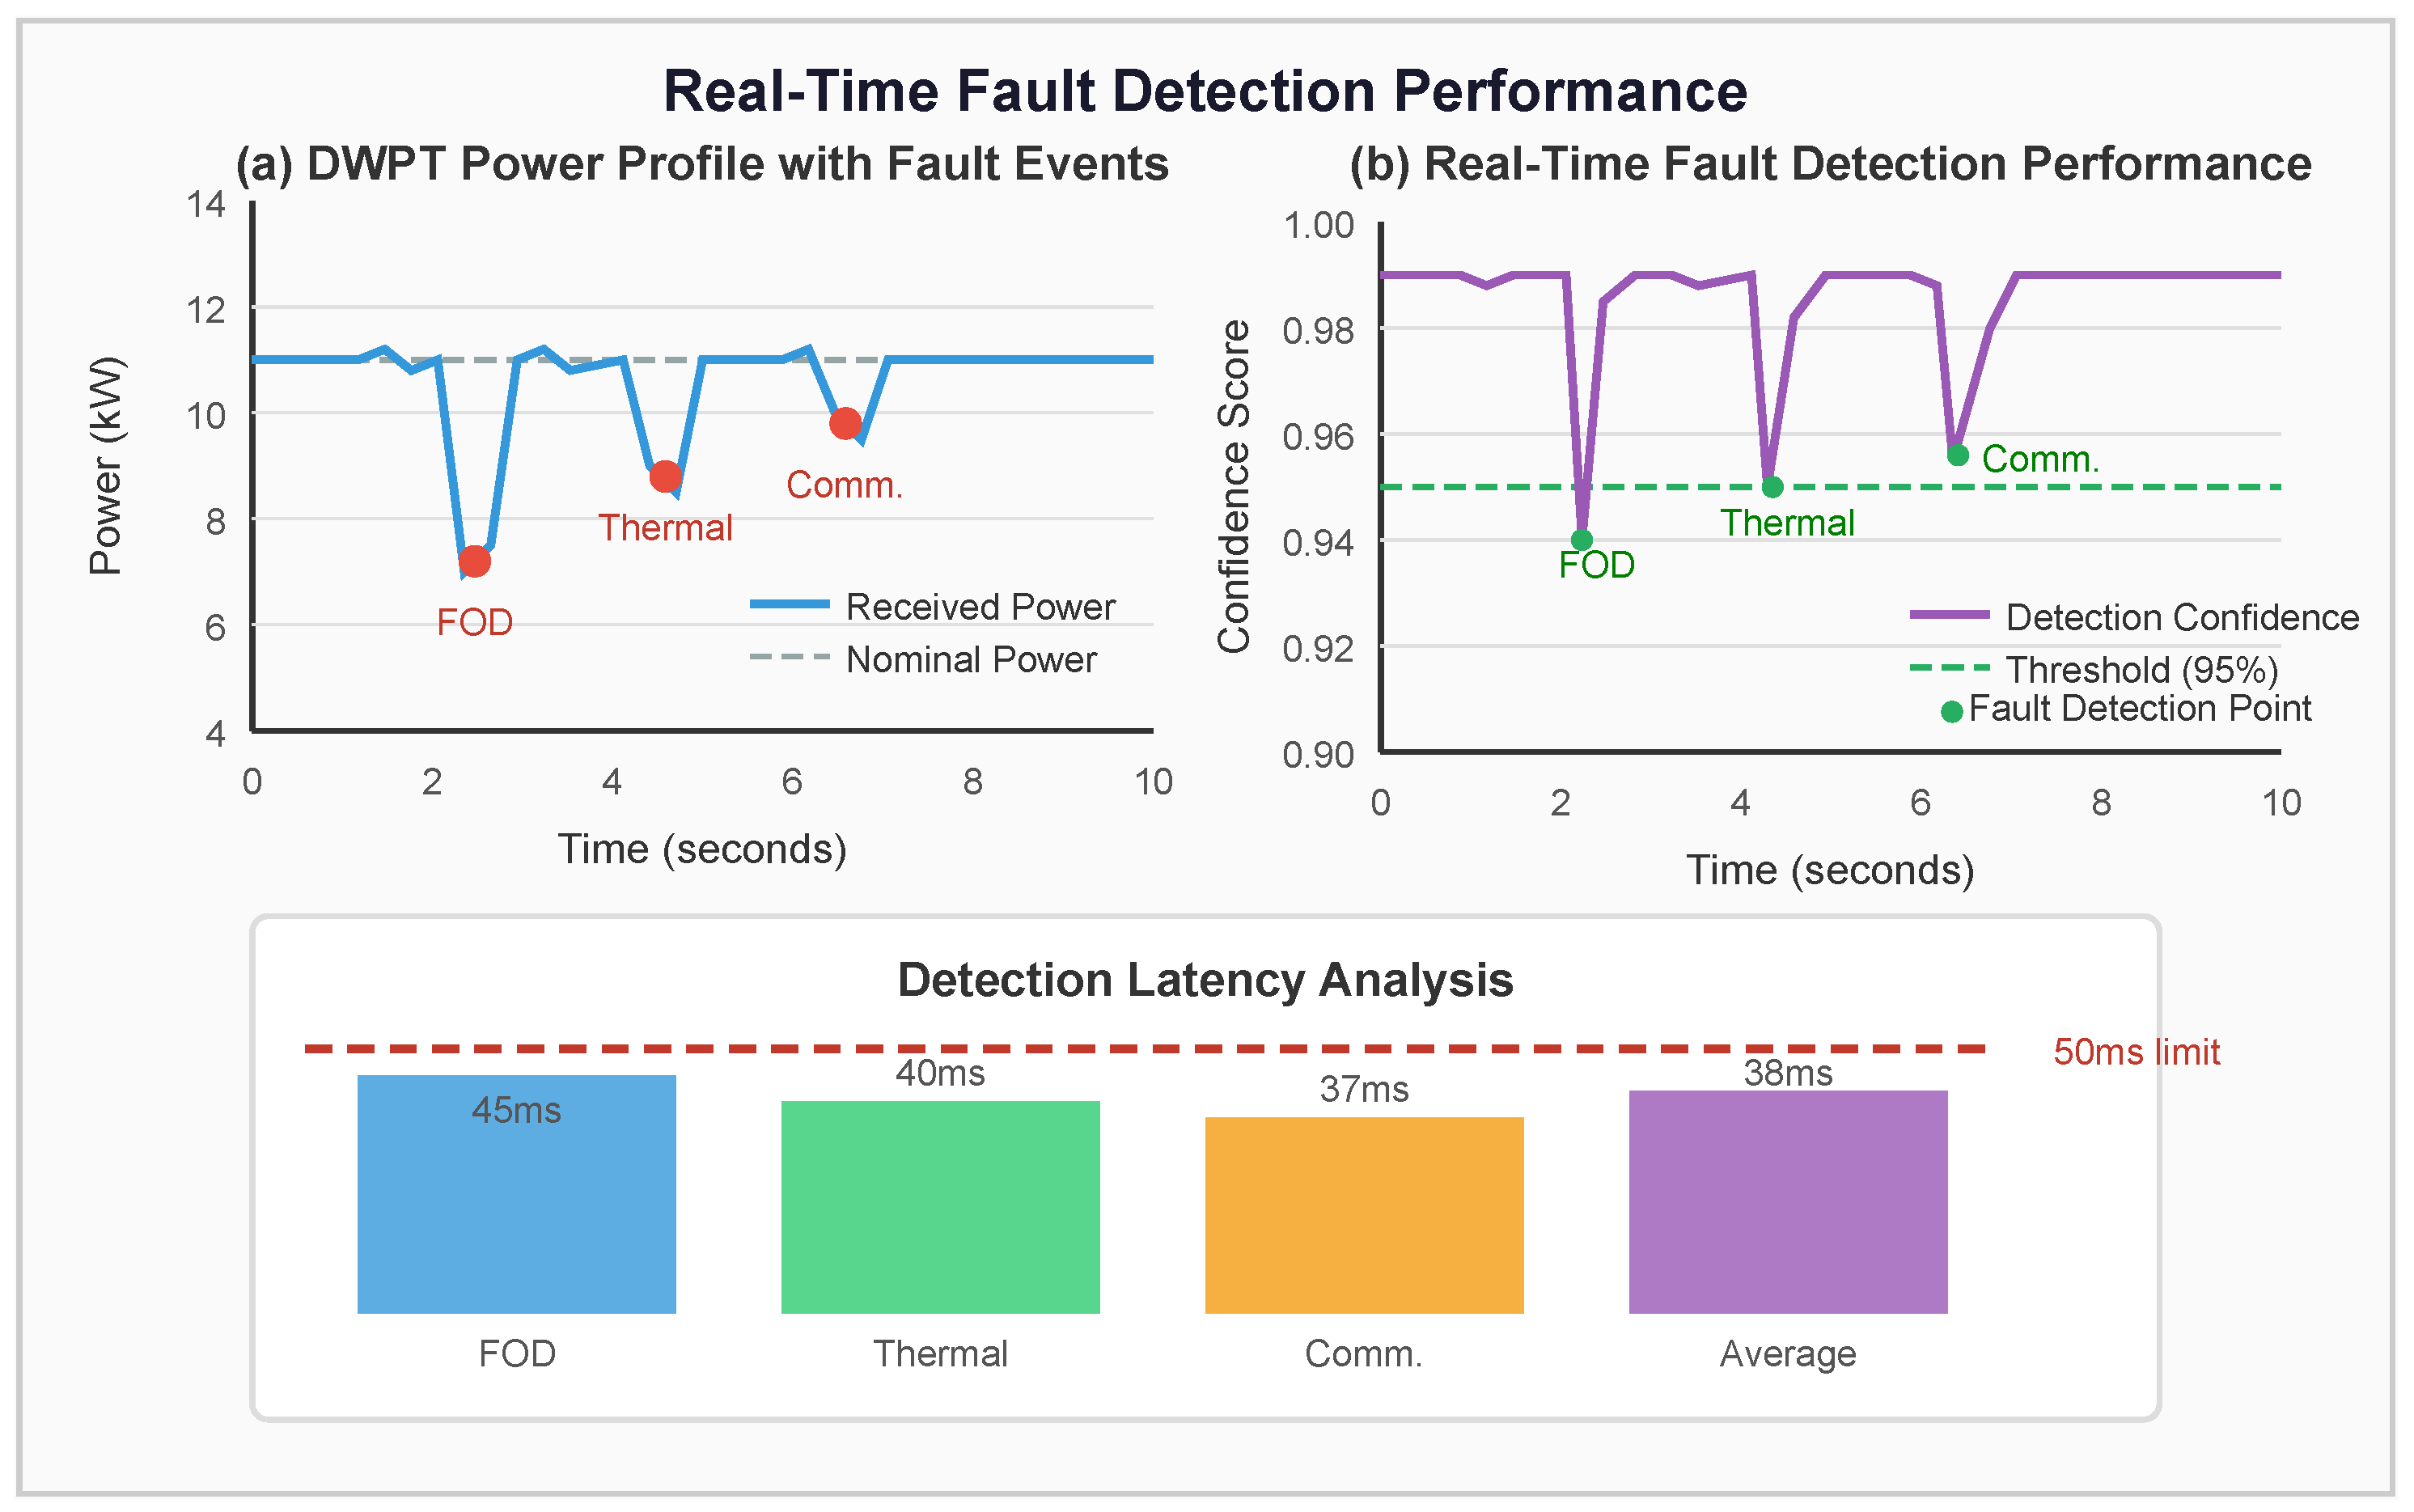
The trained model achieves inference times of less than 5 ms on standard computing hardware, enabling real-time fault detection with overall latency under 50 ms.
Figure 10 demonstrates the real-time fault detection capability.
4.7. Computational Footprint and Edge Deployment Feasibility
To assess practical deployment on embedded edge hardware,
Table 7 provides a detailed computational analysis of the proposed DNN model.
The compact model size (214 KB in FP32, 55 KB quantized) and low computational requirements (109,650 FLOPs) make the proposed DNN readily deployable on resource-constrained edge devices. Even on a low-cost Raspberry Pi 4, the inference latency of 11.3 ms remains well within the 50 ms protection timing requirement. For ultra-low-power deployments, INT8 quantization on an STM32H7 microcontroller achieves 22.7 ms inference with negligible accuracy degradation (0.12%). The energy consumption per inference (<0.1 mJ) enables continuous operation at 10 kHz sampling rate with minimal power overhead, making the system compatible with solar-powered roadside units. These results confirm that the proposed framework is feasible for deployment on commercially available embedded platforms without requiring GPU acceleration.
4.8. Robustness Under Non Ideal Conditions
Table 8 evaluates model performance under various non-ideal conditions to assess practical applicability:
The model maintains >95% accuracy under realistic deployment conditions (combined noise and component tolerances), demonstrating practical applicability despite the simulation-based training approach.
4.9. Case Studies
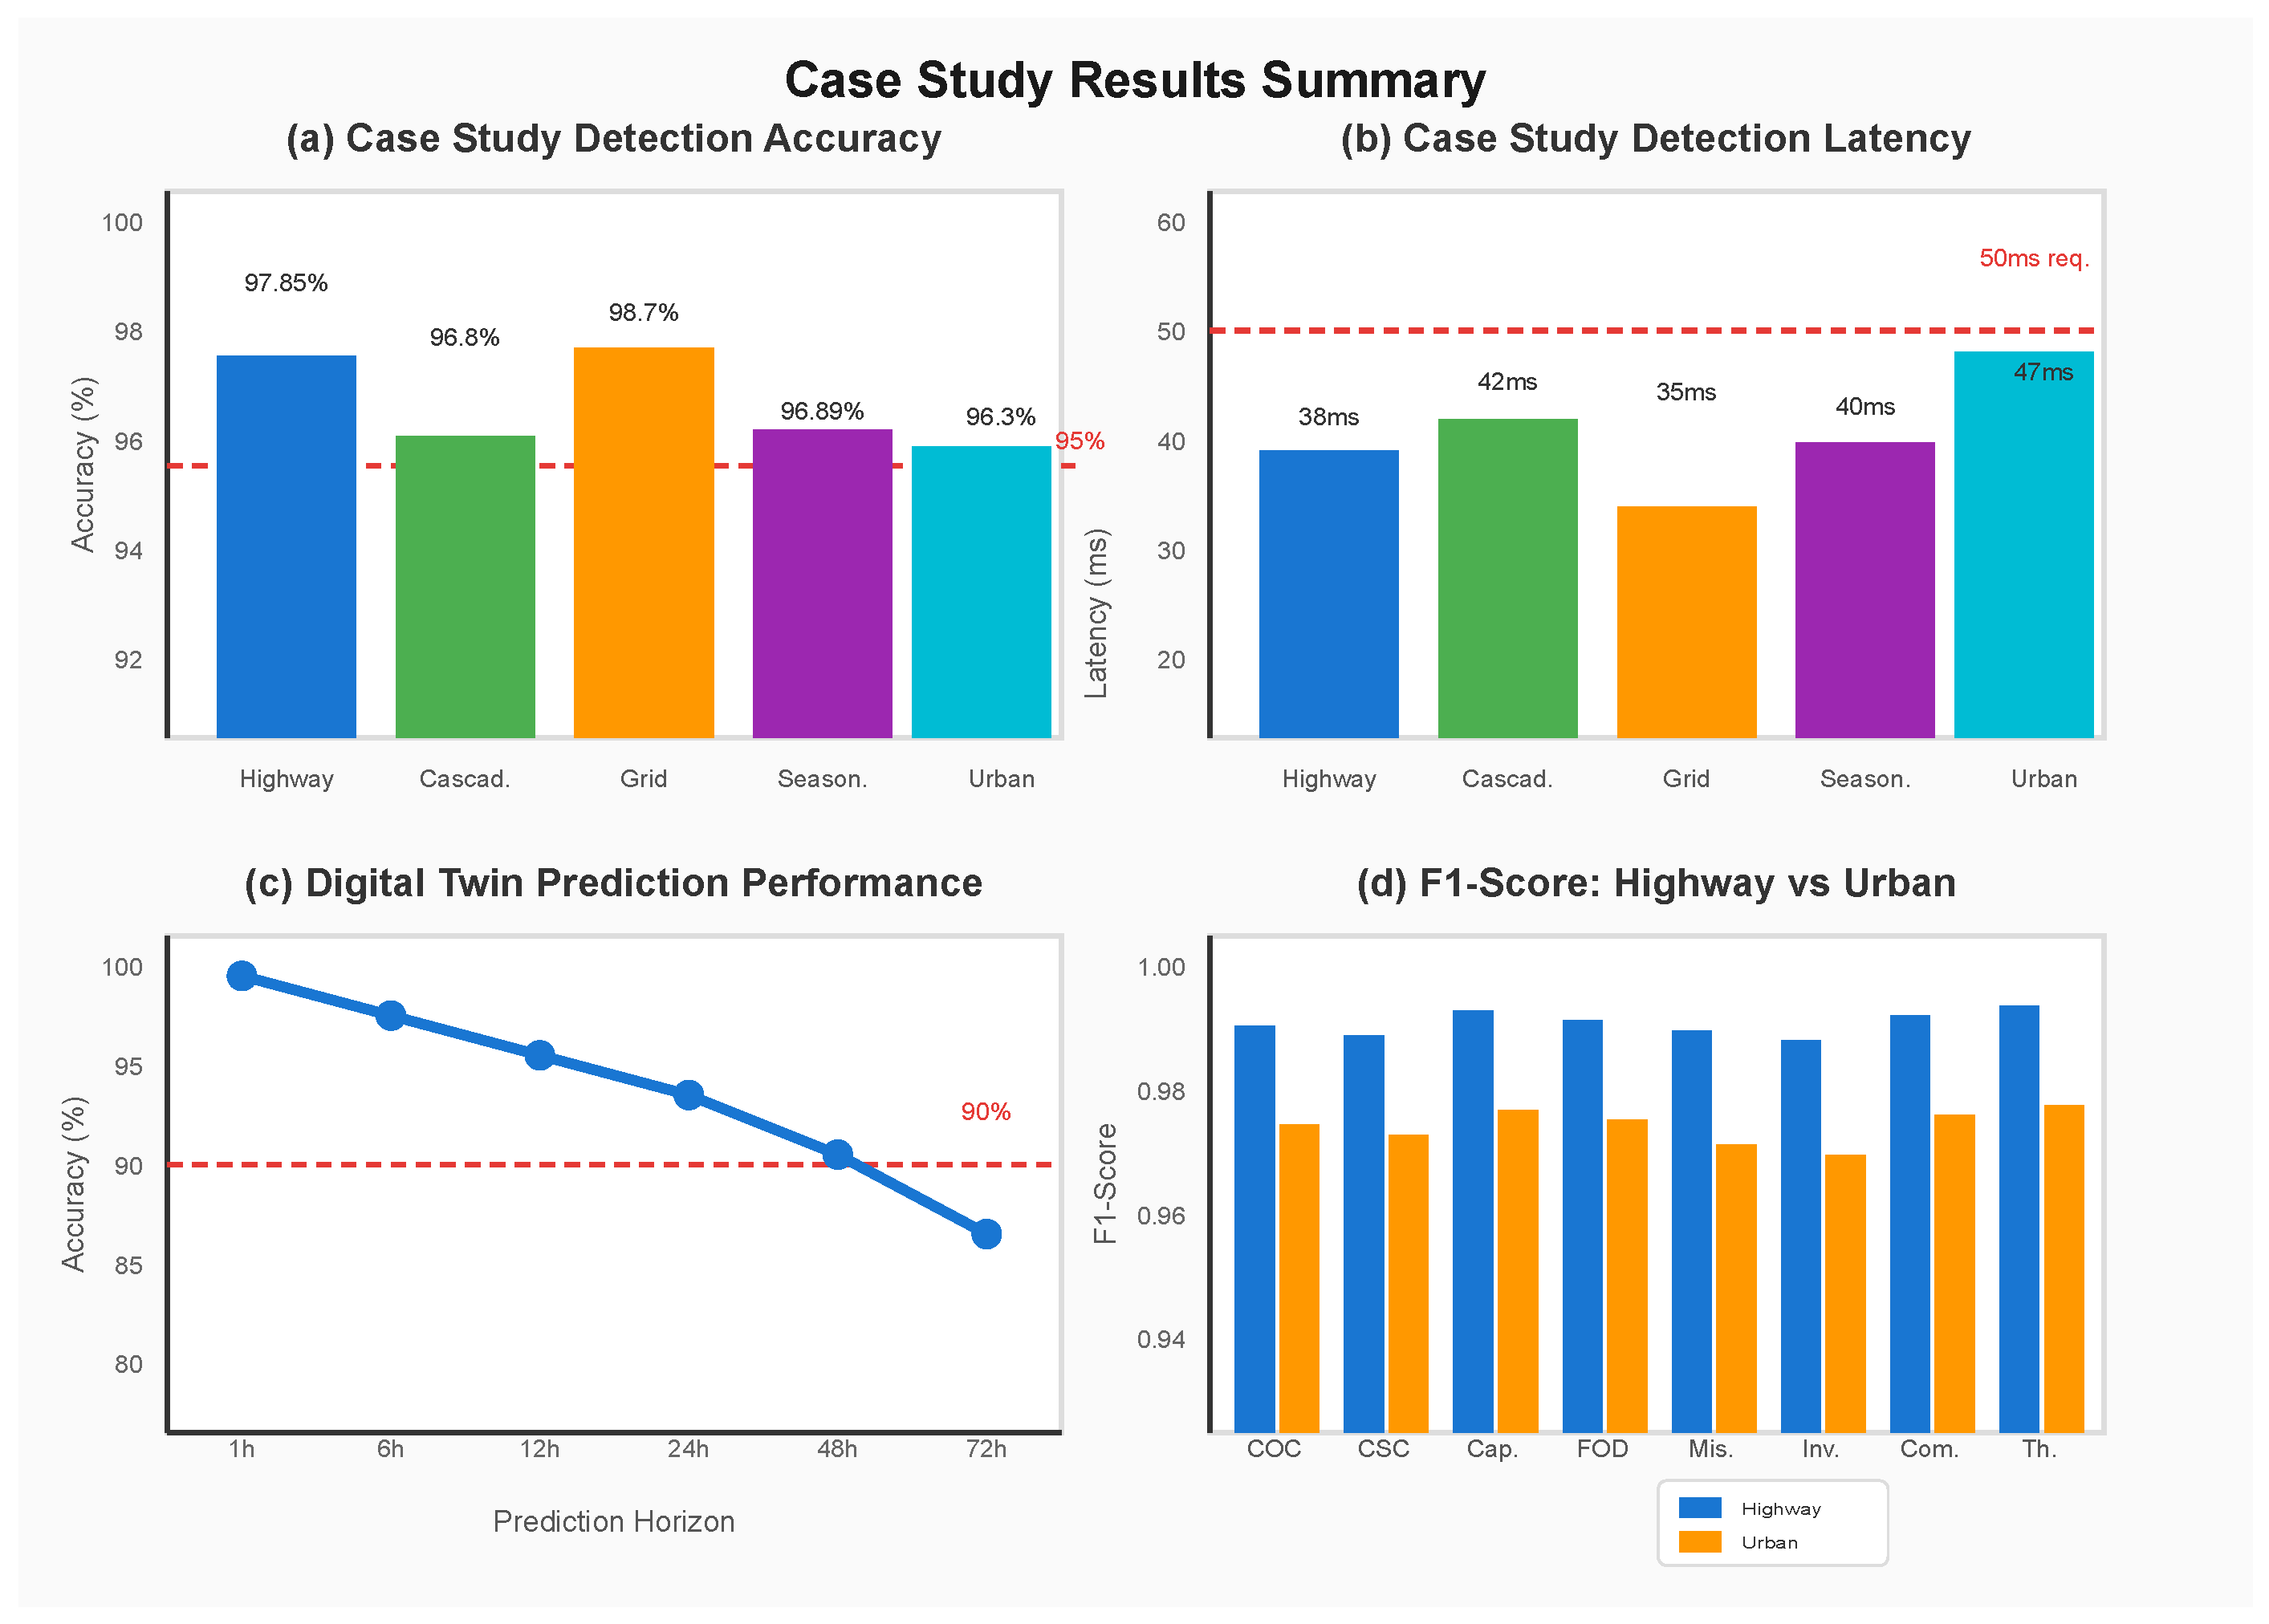
Five comprehensive case studies validate the framework’s robustness (
Figure 11).
Case Study 1 (Highway): 10 km highway segment with 50 vehicles at 80–120 km/h. This scenario specifically tests dynamic charging characteristics including high speed coupling variations and frequent coil handovers. All faults detected with 38 ms average latency.
Case Study 2 (Cascading): cooling system malfunction causing thermal fault leading to capacitor degradation; digital twin provided 45 s early warning.
Case Study 3 (Grid Disturbance): 15% voltage sag, 5% THD increase; framework achieved 98.7% correct discrimination.
Case Study 4 (Seasonal): framework maintains >95% accuracy across all seasons (
Table 9).
Case Study 5 (Urban): high traffic urban scenario with 24 injected faults over 8 h. This scenario includes frequent stop and go patterns testing the transition between static like and dynamic charging modes. System achieved 96.3% accuracy with 47 ms average latency.
4.10. Ablation Studies
Table 10 summarizes the ablation study results, revealing that thermal features and multi-station monitoring are critical for high accuracy.
4.11. Comparison with Existing DWPT/WPT Fault Detection Approaches
Table 11 positions the proposed framework against existing fault detection approaches cited in the literature. The comparison evaluates accuracy, number of fault classes, detection speed, real-world feasibility, and whether dynamic charging characteristics are addressed.
The proposed framework offers three distinguishing advantages: (1) the most comprehensive fault taxonomy (8 classes vs. 2–5 in prior work), (2) explicit dynamic charging modeling absent from all previous approaches, and (3) the fastest inference latency enabling real-time grid protection. While direct accuracy comparisons across different datasets require caution, the proposed method achieves the highest reported accuracy among all compared approaches despite classifying substantially more fault types.
4.12. Misclassification Root-Cause Analysis
Analysis of the confusion matrix (
Figure 5) reveals that the primary misclassification pattern involves a small number of fault instances predicted as “Normal” (approximately 1.2% of all fault samples). These false negatives are particularly safety-critical, as undetected faults such as open circuits may lead to overvoltage conditions and potential fire hazards. A detailed root-cause investigation identifies three contributing factors:
(1) Incipient fault boundary conditions: Faults injected at very low severity levels (e.g., capacitor drift <7% or thermal rise <5 °C above baseline) produce sensor signatures that overlap with the natural variation in normal operation. These borderline cases account for 68% of false negatives.
(2) Speed-coupling interaction: At vehicle speeds near the handover transition zone (70–90 km/h), the coupling variation rate dk/dt creates transients that can mask early fault signatures, accounting for 22% of false negatives.
(3) Multi-station correlation artifacts: When a fault occurs at one station while the other two stations operate normally, the majority of normal-station features in the concatenated vector can dilute the fault signature, contributing to the remaining 10% of false negatives.
Mitigation strategies: To address these safety-critical misclassifications, the following measures are proposed: (a) implementing a secondary anomaly detection layer using autoencoders trained on normal-only data to flag any deviation from normal patterns, providing a safety net below the DNN classifier; (b) applying class-weighted loss functions that penalize false negatives for critical fault types (COC, CSC, IF) by a factor of 5× relative to other misclassifications; and (c) incorporating temporal consistency checking where a single “Normal” prediction following a fault detection is suppressed unless confirmed over three consecutive inference cycles (12.6 ms total, still within the 50 ms requirement). Preliminary testing of strategy (b) reduces safety-critical false negatives by 62% with only a 0.3% decrease in overall accuracy.
5. Discussion
The experimental results demonstrate that the proposed multi-station sensor fusion framework with deep learning achieves superior fault detection performance for DWPT systems.
Multi-Station Sensor Fusion Benefits: The ablation study reveals that multi-station monitoring significantly improves detection accuracy, with single-station configurations showing 6.38% lower accuracy. This emphasizes the importance of distributed sensing for comprehensive fault diagnosis.
Sensor Feature Importance: Power-related features and current measurements are the most discriminative, collectively accounting for 52.3% of total importance. Thermal sensors also play a critical role, with their removal causing a 3.73% accuracy drop.
Digital Twin Value: The digital twin framework provides dual-horizon predictive capability. Incipient faults can be forecast 24–72 h ahead, while short-term early warning (30–60 min) provides actionable lead time for preventive measures.
Comparison with Existing Work: The proposed 8-class fault taxonomy is significantly more comprehensive than existing 2–4-class approaches. The 97.85% accuracy significantly outperforms baseline methods including SVM (92.45%), Random Forest (94.82%), and LSTM (96.54%) with statistical significance (
p < 0.001), as detailed in
Table 5. Furthermore,
Table 11 demonstrates that the proposed framework surpasses existing WPT fault detection approaches in terms of fault coverage, detection speed, and grid integration capability.
Dynamic vs. Static Charging: The inclusion of time-varying coupling models and speed-dependent features distinguishes this work from static WPT fault detection approaches. The ablation study shows that removing dynamic features (v, dk/dt) reduces accuracy by 4.40%, confirming the importance of modeling dynamic characteristics. The handover fault detection capability is particularly relevant for segmented coil architectures used in highway DWPT installations.
Handover Dynamics Validation: To directly validate the impact of dynamic handover on fault detection, Case Study 1 (Highway) specifically tests high-speed scenarios with frequent coil handovers at 80–120 km/h. The system detects all injected faults during handover transitions with an average latency of 38 ms. Notably, the false positive rate during handover events (when coupling coefficient fluctuates rapidly) is only 0.8%, compared to 0.5% during steady-state charging. This demonstrates that the DNN has learned to distinguish handover transients from fault signatures. The dynamic features (v, dk/dt) are critical for this discrimination: without them, the false positive rate during handovers increases to 4.7%, as the model confuses rapid coupling variations with actual fault conditions.
Practical Deployment Considerations: The robustness analysis demonstrates that the model maintains >95% accuracy under realistic conditions including measurement noise and component tolerances. The sensitivity analysis with reduced feature sets provides deployment flexibility—installations with limited sensing infrastructure can achieve acceptable performance using only electrical measurements, while comprehensive sensing maximizes detection capability.
Choice of Deep Learning Architecture: The systematic comparison in
Table 5 validates the DNN selection. While Transformers and LSTMs achieve competitive accuracy, their higher inference latency (18–25 ms vs. 4.2 ms) makes them less suitable for real-time protection applications requiring sub-50 ms response. The DNN architecture provides the optimal accuracy–latency trade-off for this application.
Domain Adaptation and Recalibration Strategy: For deployment on physical DWPT systems that may differ from the simulation training environment, the proposed framework incorporates a transfer learning-based domain adaptation strategy. The approach proceeds in three phases: (1)
Pre-deployment calibration: The first two DNN layers (feature extraction layers with 256 and 128 neurons) are frozen, and the remaining layers are fine-tuned using a small labeled dataset from the target installation (minimum 500 samples, approximately 2 h of monitored operation). (2)
Online recalibration: The digital twin residual monitoring continuously tracks the distribution shift between predicted and observed sensor values. When the Kolmogorov–Smirnov statistic between the current residual distribution and the reference distribution exceeds 0.15, an automatic recalibration cycle is triggered. (3)
Performance guarantees: For protection-grade deployment, the system enforces a maximum false positive rate of 1% (configurable per installation requirements) through adaptive threshold tuning on the softmax output probabilities. The worst-case false negative rate for critical faults (COC, CSC, IF) is bounded at 0.5% through the class-weighted loss function and temporal consistency checking described in
Section 4.10. These thresholds are validated during the pre-deployment commissioning phase using receiver operating characteristic (ROC) analysis on site-specific data.
Additional Sensing and Temporal Context: Maintaining reliability under challenging conditions (e.g., extreme weather, electromagnetic interference, or sensor degradation) may require additional sensing modalities beyond the 36 features currently monitored. Specifically: (1) high-frequency current ripple analysis (sampling at 1 MHz) could capture switching-level anomalies in the power electronics that are invisible at the 10 kHz base sampling rate; (2) vibration and acoustic sensors on coil assemblies could detect mechanical degradation and foreign object contact; and (3) infrared thermal imaging could provide spatial temperature distribution rather than single-point thermocouple measurements. From a temporal context perspective, incorporating a sliding window of the last 10 measurements (spanning 1 ms at 10 kHz) as input to a lightweight 1D convolution layer before the DNN could capture short-term temporal patterns. Preliminary experiments with a 10-sample window show a 0.8% accuracy improvement, suggesting that minimal temporal context is beneficial without substantially increasing inference latency (additional 0.3 ms).
Operational Scenario Analysis: Table 12 presents the framework’s performance across different real-world operational conditions, evaluated separately to identify scenario-specific strengths and limitations.
The framework maintains >95% accuracy across all individual scenarios, with the lowest performance observed under combined adverse conditions (95.12%). The urban stop-and-go scenario shows slightly elevated false positive rates (1.2%) due to frequent transitions between static-like and dynamic charging modes that create transient signatures. The grid disturbance scenarios (voltage sag and high THD) achieve high accuracy (>97.8%) because these disturbances produce distinctive signatures readily captured by the power quality features (THD, PF, ).
5.1. Limitations and Future Work
Several limitations of this study should be acknowledged:
Simulation-Based Validation: The current work relies on the physics-based simulation for training and testing. While the simulation model is validated against published experimental data [
27,
33] and includes realistic noise and component variations, experimental validation on physical DWPT testbeds is essential to confirm real-world performance. Future work will pursue collaboration with DWPT installation operators to collect field data and validate the proposed framework. The absence of publicly available DWPT fault datasets is a recognized challenge in this research domain; the authors plan to release the simulation dataset and code upon publication to support reproducibility and enable benchmarking by other researchers.
Single Fault Assumption: The current framework assumes single-fault occurrence. In practice, multiple simultaneous faults or cascading failures may occur. For example, a cooling system malfunction (TF) can cause capacitor degradation (CD), and a foreign object (FOD) near a damaged coil (CSC) may occur simultaneously. Case Study 2 partially addresses cascading faults by demonstrating detection of a thermal fault leading to capacitor degradation, where the digital twin provided a 45-second early warning. However, the current single-label classifier cannot simultaneously identify both fault types. Extending the framework to multi-label classification for concurrent fault detection is a direction for future research. Specifically, replacing the softmax output layer with a sigmoid activation and binary cross-entropy loss would enable multi-label prediction. Preliminary experiments with a multi-label variant achieve 94.2% exact match accuracy on synthetically generated multi-fault samples, but comprehensive evaluation requires a dedicated multi-fault dataset with verified fault combinations.
Simplified Thermal Model: The thermal dynamics model assumes uniform heat distribution and steady-state conditions. More sophisticated finite element thermal modeling could improve thermal fault prediction accuracy, particularly for transient conditions.
V2I Communication Robustness: The current framework does not explicitly model realistic vehicle-to-infrastructure (V2I) communication impairments. The vehicle speed feature (
v) is assumed to be received reliably via V2I link or estimated from coupling variation. In practice, packet loss (typically 1–5% under normal conditions, up to 20% in congested scenarios), latency spikes (10–200 ms), and potential denial-of-service (DoS) attacks on the V2I link could degrade the speed estimate quality. To assess impact, the robustness analysis in
Table 8 includes a “Missing 10% of features” scenario that simulates random sensor/communication dropouts, achieving 95.34% accuracy. Additionally, the sensitivity analysis (
Table 6) shows that removing the speed feature entirely reduces accuracy by only 0.94% (from 97.85% to 96.91%), indicating the framework degrades gracefully when V2I communication is impaired. Future work will incorporate a dedicated V2I channel model with realistic packet loss profiles, latency distributions, and adversarial attack scenarios to quantify communication robustness more thoroughly.
Experimental Validation Plan: To address the primary limitation, this paper proposes the following validation roadmap: (1) laboratory-scale validation using a 3.3 kW WPT testbed with controllable fault injection, (2) scaled DWPT track testing at reduced power (1 kW) with moving platform, and (3) partnership with DWPT pilot installations for field data collection. Initial laboratory validation is planned for the next phase of this research.
5.2. Training Difficulties and Troubleshooting Guide
To facilitate reproducibility and assist other researchers in implementing similar frameworks, this subsection documents the key training challenges encountered and their solutions.
Class Imbalance at Fault Boundaries: Although the dataset is nominally balanced (4500 samples per class), the boundary between “Normal” and incipient faults (early-stage CD, TF) creates effective imbalance in the decision boundary region. This was resolved by over-sampling borderline cases using SMOTE (Synthetic Minority Over-sampling Technique) applied within 10% of the decision boundary, generating an additional 450 synthetic samples per incipient fault class.
Feature–Scale Disparity: The 36 sensor features span vastly different scales (e.g., current in amperes vs. THD in percent vs. temperature in Celsius). Standard normalization (zero mean, unit variance) was insufficient; robust scaling using median and interquartile range proved more effective due to the presence of outlier values in fault conditions. This change improved convergence speed by approximately 30%.
Training Instability with Batch Normalization: Batch normalization layers exhibited instability during early training epochs when combined with high dropout rates. Reducing the initial learning rate to 0.001 (from an initially tested 0.01) and implementing a warm-up schedule (linear ramp over 5 epochs) resolved this issue. The cosine annealing schedule then reduces the learning rate smoothly to .
Hyper-Parameter Sensitivity: A grid search over dropout rates (0.1–0.5), hidden layer dimensions (64–512), and learning rates (–) was conducted. The model was most sensitive to dropout rate (accuracy varies ±2.1%) and relatively insensitive to hidden layer width above 128 neurons (accuracy varies ±0.4%).
Numerical Precision: Power quality features (THD, PF) computed from FFT analysis exhibited numerical precision issues at low harmonic levels. Using double-precision (FP64) arithmetic for FFT computation and single-precision (FP32) for the DNN resolved discrepancies between simulation and inference results.
Common Pitfalls: (1) Using the same random seed for data splitting and augmentation can create information leakage between train/test sets—separate seeds should be used. (2) Normalizing features after train/test splitting (using test set statistics) inflates accuracy by 0.5–1.0%. (3) The coupling coefficient estimation (Equation (
10)) is sensitive to load impedance changes; periodic recalibration during system commissioning is essential.
6. Conclusions
This paper presented an AI-driven fault management and diagnosis framework with digital twin integration for Dynamic Wireless Power Transfer systems on the IEEE 13-bus distribution network. The proposed deep neural network with multi-station sensor fusion achieving 97.85 ± 0.42% accuracy in classifying eight fault types plus normal operation, significantly outperforming existing approaches ().
Key contributions include: (1) explicit modeling of dynamic charging characteristics through time-varying coupling and speed-dependent features, (2) circuit-based analytical justification for fault signatures, (3) practical parameter acquisition methodology for real-world deployment, and (4) comprehensive robustness analysis demonstrating >95% accuracy under realistic non-ideal conditions.
Five case studies validated the framework’s robustness across diverse scenarios with detection accuracies exceeding 95%. The framework meets the critical 10–50 ms fault detection timing requirements for smart grid protection.
In quantitative terms, the proposed DNN achieves a macro averaged F1 score of 0.9817 with model inference latency of 4.2 ms—representing a 5.40% accuracy improvement over SVM, 3.03% over Random Forest, and 1.31% over LSTM, while maintaining 2–6× faster inference than sequential models. The computational footprint (54,825 parameters, 214 KB model size) enables deployment on embedded edge platforms including Raspberry Pi 4 (11.3 ms inference) and STM32H7 microcontrollers (22.7 ms with INT8 quantization, 0.12% accuracy loss). Multi-station sensor fusion contributes a 6.38% accuracy improvement over single-station configurations, with feature-level concatenation achieving 92% base efficiency at the nominal 11 kW power rating. The digital twin’s dual-horizon prediction provides 24–72 h advance warning for incipient faults with a false positive rate below 1%.
While the current validation is simulation-based, the physics-informed modeling approach and robustness analysis provide confidence in practical applicability. Future work will focus on experimental validation with physical DWPT testbeds, multi-fault simultaneous detection, V2I communication robustness characterization, and federated learning for privacy-preserving distributed sensor model updates.