


Highlights
What are the main findings?
- Integrating planning knowledge into evolutionary search as natural-language qualitative objectives evaluated by an LLM expanded the set of planning-relevant urban development scenarios while preserving competitive economic outcomes.
- After three independent evaluations per solution for both methods, LLM-NSGA-II achieved larger three-dimensional hypervolume in 27 of 50 matched-seed comparisons, with positive median differences for two of five criteria. Fronts pooled across seeds showed an advantage for all five criteria, while the planning comfort proxy improved for the tested active-urban-life criterion. Performance in individual runs remained dependent on the criterion and initialization.
What is the implication of the main findings?
- Representing planning knowledge as LLM-evaluated qualitative objectives allows weakly formalized planning priorities to participate directly in scenario generation, broadening the set of alternatives available for expert review and making trade-offs between qualitative and economic objectives more explicit.
- The approach is intended to support, rather than replace, professional assessment and stakeholder participation. Practical use requires transparent definition of qualitative criteria and validation of LLM evaluations by experts and the public.
Abstract
Multi-objective urban development optimization predominantly relies on quantitative indicators, limiting the inclusion of weakly formalized urban qualities. This study aims to incorporate qualitative planning priorities directly into scenario generation. The proposed approach uses a large language model to score criteria expressed in natural language, integrating these scores as an objective in evolutionary optimization alongside investor net present value and predicted land-value gain. Its methodological novelty lies in embedding language-based evaluation within solution generation and selection. Its conceptual contribution is to extend objective formulation in multi-objective search to weakly formalized planning priorities. The approach was tested on development scenarios for Gatchina, Russia, using five qualitative criteria. Intraclass correlations for means of five repeated evaluations reached 0.92–0.93. After three independent evaluations per solution for both methods, direct integration achieved a larger three-dimensional hypervolume in 27 of 50 matched-seed comparisons, with positive median differences for two of five criteria. Fronts pooled across seeds achieved larger three-dimensional hypervolume for all five criteria, indicating broader aggregate coverage despite variable performance in individual runs. These findings demonstrate the potential to expand planning alternatives and reveal additional trade-offs between economic and qualitative objectives. Practically, the approach enables qualitative urban priorities to guide automated scenario search and supports assessment of the economic trade-offs associated with pursuing them.
1. Introduction
Urban planning is a multi-objective problem in which economic performance, public interests, quality of the urban environment, and long-term sustainability frequently conflict. A single optimal solution can therefore rarely be defined. Instead, planning requires a set of alternatives that exposes different trade-offs among the interests of investors, public authorities, residents, and other stakeholders [1]. Multi-objective evolutionary algorithms are well suited to this task because they can explore complex design spaces and generate Pareto-optimal alternatives without first reducing all objectives to a single aggregate measure [2,3].
Most existing optimization models, however, rely on explicitly defined quantitative objectives such as project value, accessibility, density, environmental indicators, or land-use allocation. These objectives provide computational transparency but do not capture every consideration used in planning practice. Social inclusiveness, alignment with long-term strategy, support for active urban life, conflict among user groups, and capacity for future adaptation are substantively important but weakly formalized criteria. They are difficult to express as analytical functions that can be evaluated repeatedly during optimization.
Human-in-the-loop optimization offers one way to incorporate such criteria by asking experts to evaluate intermediate solutions or iteratively refine their preferences. Although this preserves professional oversight, it scales poorly to thousands of candidate scenarios and many generations of evolutionary search. Expert assessment is time-consuming and can vary among evaluators and across repeated measurements. Consequently, qualitative criteria are often applied only after optimization, when potentially valuable alternatives may already have been discarded on the basis of quantitative performance.
Large language models offer a means of scaling this type of assessment. Under the LLM-as-a-Judge paradigm, a model receives an object description, an evaluation rubric, and a scoring scale, and then produces a structured assessment without requiring a reference answer [4,5]. In urban planning, LLMs are already being explored for document analysis, scenario interpretation, stakeholder simulation, and professional decision support [6,7]. Existing applications, however, predominantly position the language model outside the optimization loop, as an assistant or an evaluator applied after the search. Directly incorporating LLM-based assessment into evolutionary search as an independent objective remains underexplored.
This study proposes an LLM-augmented multi-objective evolutionary framework for generating urban transformation scenarios. In the baseline formulation, NSGA-II maximizes investor net present value and predicted land-value gain. The extended formulation adds an LLM-based qualitative objective instantiated by one of five planning criteria: social inclusiveness, strategic relevance, active urban life, alignment of user interests, or environmental and infrastructure sustainability. Unlike evaluation of a Pareto front after optimization, the qualitative criterion participates directly in evolutionary selection and can preserve alternatives that represent new trade-offs between qualitative and economic criteria.
The framework is evaluated using urban transformation scenarios for Gatchina, Russia. The reliability of the LLM scores is examined through repeated measurements and intraclass correlation coefficients, while their relationship to observable urban characteristics is investigated using surrogate models, SHAP, and spatial-autocorrelation analysis. The effect of the qualitative objective is assessed by comparing LLM-NSGA-II with conventional two-objective NSGA-II across five prompts and ten matched random seeds. The primary measure is normalized hypervolume in the joint space of NPV, land-value gain, and LLM score, supplemented by pairwise projections and decision-space diversity measures.
The experiments show good repeatability within a fixed criterion: single-measure ICC values range from 0.69 to 0.74, while aggregated estimates reach 0.92–0.93. Incorporating the qualitative objective also changes the structure of the final Pareto set. LLM-NSGA-II achieves a larger three-dimensional hypervolume in 27 of 50 matched comparisons after three independent evaluations per solution for both methods, with positive median differences for two of the five prompts. Fronts pooled across seeds show larger three-dimensional hypervolume for all five prompts, although the paired results indicate variable performance in individual runs. Reduced coverage in the purely economic space shows that the method does not remove objective conflict. Instead, it reveals additional compromises between qualitative and economic criteria available for consideration.
The contributions of this study are threefold:
- We formulate a weakly formalized planning criterion as an LLM-based objective integrated directly into multi-objective evolutionary optimization.
- We develop an evaluation procedure for examining the repeatability, interpretability, and spatial structure of LLM scores, together with their effect on the resulting Pareto front.
- We demonstrate experimentally that including the LLM within the optimization loop expands the joint qualitative and economic coverage of fronts pooled across seeds, while showing criterion-dependent benefits in individual runs compared with post-optimization assessment of conventional Pareto fronts.
The proposed approach is not intended to automate professional judgment. Its purpose is to produce a broader and more interpretable set of alternatives that experts and stakeholders can examine using decision support for urban planning processes.
2. Related Work
2.1. Urban Planning as a Multi-Objective Decision Problem
Urban planning is widely recognized as a decision-making domain characterized by fundamental conflicts between planning objectives. Rittel and Webber [1] argue that urban planning problems are inherently wicked, meaning that they lack a unique optimal solution and require evaluation from multiple perspectives reflecting different stakeholder values. These stakeholders are often represented through simplified categories such as government, businesses, and residents. However, in practice, the landscape of interests is much more diverse and includes multiple subgroups with competing priorities [1]. Thus, urban planning decisions are better formulated as multi-objective decision problems, in which alternative scenarios are evaluated according to multiple, often conflicting, objectives rather than a single aggregated criterion.
The conflict between objectives is reflected in contemporary urban planning research. Sustainable land use planning requires balancing social, economic, and environmental dimensions that frequently compete with one another [8]. Similarly, limited urban space creates unavoidable trade-offs between development intensity, environmental quality, and climate resilience, making Pareto-efficient compromises more appropriate than single-objective optima [9]. Empirical studies further demonstrate that conflicts between planning objectives are often asymmetric rather than uniform. For example, increasing green space coverage primarily requires sacrificing land available for economic development, while economic growth remains strongly coupled with carbon emissions [10].
The diversity of stakeholders further increases the complexity of urban decision-making, as planning alternatives must account for heterogeneous preferences and competing performance criteria. Recent studies identify multi-stakeholder trade-offs as an ongoing challenge in urban decision-making, where conflicting stakeholder preferences complicate the interpretation and selection of planning alternatives [11].
This has led to the use of multi-objective optimization (MOO) as a standard computational framework for modeling urban planning problems.
2.2. Multi-Objective Optimization Applications in Urban Planning
Given the multi-objective nature of urban planning, MOO has become an established framework for exploring trade-offs among competing planning goals. Recent studies demonstrate the application of MOO approaches across various urban planning tasks, particularly in land use allocation (LUA) and infrastructure planning.
Land use allocation and urban renewal problems represent important application domains for MOO, where optimization methods are used to balance multiple aspects of urban development [3]. For example, Li et al. [10] applied NSGA-II to optimize land use allocation by simultaneously considering economic productivity, functional compactness, green-space coverage, and carbon emissions. The resulting Pareto-optimal solutions were further evaluated using the TOPSIS method to identify the most preferable planning scenario. Similarly, Sicuaio et al. [8] proposed an enhanced NSGA-III framework for sustainable land use planning, balancing economic, environmental, accessibility, and spatial objectives. The proposed enhancements modify the crossover and mutation operators by incorporating domain-specific knowledge, guiding the search process toward more feasible and coherent land use configurations. Compared with the standard NSGA-III, the approach achieves improved performance in generating Pareto-optimal solutions. Recent studies have further explored hybrid evolutionary approaches to improve the efficiency and applicability of MOO in urban planning. Wang et al. [12] proposed a framework combining NSGA-III with Differential Evolution for land use optimization aimed at enhancing urban livability. The method integrates additional livability-related objectives and a dynamic FAR mechanism to jointly optimize land use type and development intensity, generating Pareto-optimal alternatives across thousands of land parcels.
Beyond land use allocation, MOO approaches have also been applied to broader urban performance optimization problems. Reitberger et al. [9] proposed a surrogate-assisted MOO workflow that combines Latin Hypercube Sampling, Gaussian Process Regression, and NSGA-II to support urban design exploration under computationally expensive simulations. By approximating the underlying simulation model, the framework reduces the number of required evaluations while enabling planners to explore a wide range of Pareto-optimal alternatives and understand trade-offs between competing objectives. Churiakova et al. [13] addressed metropolitan service placement problems under spatial and computational constraints. Although the problem involves multiple planning criteria, the authors formulate the task through scalarized optimization, combining normalized criteria into a single objective function with predefined weights.
Recent research has also explored extensions of classical MOO frameworks to incorporate uncertainty and decision preferences. Fuzzy decision-making approaches, preference-based optimization, and hybrid intelligent systems have been proposed to better represent stakeholder priorities and incomplete information. Wang and Ren [14] integrated fuzzy decision-making mechanisms into urban evaluation to represent uncertainty in planning assessment. Hybrid frameworks combining optimization with large language models have also been explored to provide adaptive planning recommendations [15]. Beyond urban applications, preference-based optimization approaches have been proposed to incorporate decision-maker preferences into multi-objective learning problems [16].
Evolutionary algorithms remain among the most frequently used optimization methods in urban planning due to their ability to explore complex design spaces and identify Pareto-optimal solutions without requiring explicit analytical formulations of objective interactions. Approaches based on NSGA-II [2], NSGA-III [17], and related evolutionary frameworks have therefore become common tools for generating alternative urban scenarios under competing planning requirements [11].
Despite these advances, most existing MOO-based urban planning approaches rely on predefined quantitative objectives that can be explicitly modeled and optimized. In urban planning, MOO therefore serves not only as an optimization technique but also as a framework that supports decisions by exposing complex design spaces and trade-offs among competing objectives. This is particularly important for high-dimensional planning problems where evaluating numerous alternative scenarios is computationally expensive.
However, many aspects of urban planning decisions rely on qualitative judgments that are difficult to represent as explicit optimization objectives.
2.3. Human-in-the-Loop Approach
As discussed in the previous subsection, many aspects of urban planning decisions cannot be easily represented as explicit quantitative objectives. One common approach to incorporate such information into optimization is the human-in-the-loop paradigm. This approach remains relatively underexplored in the urban planning domain and is considered a promising direction for future research aimed at incorporating expert and resident feedback [11].
Instead of directly scoring solutions, interactive approaches often elicit preferences from decision-makers. Cajot [18] introduced an interactive multi-objective optimization framework for urban and energy planning that keeps humans in the decision loop by allowing decision-makers to explore Pareto-optimal solutions and iteratively refine their preferences. IK-EMO [19] proposes a human-in-the-loop evolutionary optimization framework that discovers hidden variable relationships from candidate solutions, enables experts to validate the extracted knowledge, and uses it to guide further search. Unlike preference-based approaches, it focuses on incorporating structural domain knowledge into the optimization process.
However, human involvement introduces scalability limitations, as repeated expert evaluations become costly and difficult to maintain during large-scale optimization. Additionally, human judgments may vary across experts and over time. To address this issue, ref. [20] proposes two approaches for integrating LLMs into the reinforcement learning (RL) loop: (i) using an LLM as a direct replacement for an expert and (ii) using an LLM to adjust expert evaluations in order to mitigate biases. More broadly, it has been shown that reinforcement learning from AI feedback (RLAIF) [21] can achieve alignment performance comparable to reinforcement learning from human feedback (RLHF) while reducing the cost of preference data collection [22].
In [6], the possibility of replacing humans with large language models is explored in tasks involving interaction with virtual urban environments. Despite their significant potential, stemming from (i) access to common knowledge, (ii) the ability to provide subjective evaluations, and (iii) the capability to describe their perception, such LLM-based agents lack embodiment and cannot physically interact with the urban environment. Nevertheless, this approach can be valuable when its limitations are clearly understood.
Overall, the application of large language models appears promising for tasks involving a large number of iterations, where involving human experts is infeasible or prohibitively expensive in terms of time and resources. However, this raises a fundamental question: whether LLM-based evaluation can provide a reliable proxy for expert judgment in complex planning tasks.
2.4. Large Language Models as Expert Evaluators
Large language models possess broad knowledge spanning multiple domains, including economics, ecology, and other expert areas [7]. Their ability to integrate information from heterogeneous sources and identify complex patterns enables their application in tasks requiring contextual reasoning and evaluation [23].
The use of LLMs for evaluation has led to the emergence of the LLM-as-a-Judge (LLMaJ) paradigm, where language models act not as content generators but as evaluators of existing solutions. Within this paradigm, an LLM assigns scores, rankings, or preferences according to predefined evaluation criteria. Recent studies demonstrate substantial agreement between LLM-based judges and human evaluators across various tasks, including response ranking, factuality assessment, and rubric-based evaluation, while providing a scalable alternative to manual assessment [4,5,24,25]. This capability makes LLM-based evaluation a promising approach for optimization problems where certain objectives are difficult to express through explicit analytical formulations.
Beyond general-purpose evaluation, recent research has explored the application of LLMs as expert-like systems capable of approximating domain-specific reasoning. Such approaches have been investigated in medicine, education, software engineering, legal analysis, and scientific assistance, where language models provide assessments based on complex textual and contextual information [26,27]. Although LLM-based evaluations cannot replace professional expertise, they provide a scalable mechanism for approximating expert judgments in scenarios requiring a large number of repeated assessments.
The urban planning domain has also attracted increasing interest in applying LLMs to support planning decisions. Existing studies employ language models for planning assistance, policy analysis, urban scenario interpretation, stakeholder simulation, and interactive decision support [6,7]. These studies indicate that LLMs can process complex descriptions of urban environments and provide contextual evaluations by combining general planning knowledge with scenario-specific information.
However, existing applications primarily consider LLMs outside the optimization loop, where they are used as assistants for planners or as additional tools for evaluating already generated alternatives. The integration of LLMs directly into multi-objective optimization as qualitative objective functions remains insufficiently explored. Such an approach would allow weakly formalized planning criteria to participate directly in the generation and selection of Pareto-optimal urban development scenarios rather than being considered only during post-optimization decision making.
2.5. Research Gap and Positioning of This Work
Existing urban development optimization approaches have demonstrated the ability to generate and evaluate alternative spatial configurations using multi-objective evolutionary algorithms. However, these approaches predominantly rely on explicitly formulated quantitative objectives, such as economic efficiency, accessibility, environmental performance, or spatial indicators. While such objectives are essential for computational optimization, they cannot fully represent the diversity of qualitative considerations involved in real-world urban decision-making.
Human-in-the-loop approaches provide a possible mechanism for incorporating such non-formalized preferences into optimization processes. However, their application in large-scale scenario generation is limited by the cost of repeated expert evaluations, subjectivity of individual judgments, and difficulties associated with maintaining consistent assessments over numerous optimization iterations.
Recent advances in large language models suggest a potential alternative for scalable qualitative evaluation. Although LLMs have demonstrated the ability to perform expert-like assessments in various domains, existing urban planning applications primarily use them as planning assistants, scenario analysis tools, or evaluators applied after optimization. The integration of LLM-based evaluation directly into a multi-objective optimization framework as an objective function remains insufficiently explored. These research directions are summarized in Figure 1.
Figure 1.
Summary of existing research directions.
Therefore, a methodological gap remains in connecting quantitative multi-objective optimization with scalable qualitative assessment of urban development scenarios. We address this gap by investigating the use of an LLM-based qualitative evaluation function as an additional objective within a multi-objective evolutionary optimization framework for urban transformation scenarios. The study addresses the following research questions:
- RQ1: Can large language models provide consistent qualitative evaluations of urban transformation scenarios when used as an optimization objective function?
- RQ2: How does the integration of an LLM-based qualitative objective influence the structure and composition of Pareto-optimal urban development alternatives?
3. Methodology
3.1. Problem Formulation
Redeveloping an urban block is a constrained design problem. Changes to building density and land-use composition must remain physically feasible while producing acceptable economic and planning outcomes. These outcomes may conflict: a configuration that increases predicted land value or investor returns does not necessarily perform well in terms of social inclusion, urban vitality, stakeholder balance, strategic relevance, or environmental sustainability. Because defensible trade-off weights are not known in advance, the aim is not to obtain a single scalar optimum but to identify a set of alternatives representing different compromises among the objectives.
Accordingly, the optimization searches for non-dominated redevelopment scenarios for a selected urban block q. Each scenario specifies the proposed building footprint, average floor count, and distribution of land-use shares. The decision vector and its feasible set are
where:
- x—one candidate redevelopment scenario.
- —the set of feasible scenarios.
- q—the selected block.
- and —the proposed building footprint and site area.
- —the maximum building-coverage fraction.
- —the proposed average floor count.
- —the admissible floor-count bounds.
- —the share assigned to land-use category k.
- K—the set of residential, business, recreation, industrial, transport, special, and agriculture land-use categories.
The initial urban state and the fixed block-to-block accessibility matrix A are inputs to all scenario evaluations. Applying x replaces the decision-dependent attributes of block q in and produces the updated state . All derived characteristics, including the spatial features used by the land-value model, are then recomputed deterministically.
The conventional baseline maximizes the two quantitative objectives:
For a fixed qualitative prompt p, the LLM-assisted formulation introduces a third, stochastic objective:
where:
- —the baseline objective vector.
- —the LLM-assisted objective vector.
- —aggregate predicted land-value gain.
- —investor net present value.
- p—the qualitative prompt fixed within one optimization run.
- —one realization of the language model’s stochastic output.
- —the qualitative score returned for scenario x.
During optimization, each LLM call produces one realized score . Repeated evaluations are used separately to assess reliability. No weighted aggregation is applied.
For either objective vector F, Pareto dominance is defined as
where:
- —feasible scenarios in .
- F—either or the realized .
- m—the number of objectives in F.
- —objective j of scenario x.
- —the statement that y dominates x under F.
The Pareto set and its image in objective space are, respectively,
where:
- —the Pareto set in the decision space.
- —the corresponding Pareto front in objective space.
For the two formulations, these definitions give
where:
- and —the baseline Pareto set and Pareto front.
- and —the LLM-assisted Pareto set and Pareto front for prompt p, conditioned on the scores realized in the run.
Because is not enumerated exhaustively, NSGA-II returns finite approximations and . The two formulations use identical decision variables, constraints, and variation operators. They differ only in whether the realized qualitative score participates in non-dominated sorting.
3.2. Land Value Objective
The first quantitative objective measures the change in model-predicted land value across the study area between a transformation scenario and the baseline state. Land value is approximated using the CatBoost regression model proposed in [28]. For each urban block i, the model receives a feature vector containing its land-use, morphological, development-intensity, population, and accessibility characteristics. To represent spatial context, the vector is extended with spatial lags of numerical features and the number of neighboring blocks within 500, 1000, 2000, and 3000 m.
Because the model was trained on , its prediction is transformed back to the original monetary scale as follows:
where:
- —the observed value of block i on the original scale.
- —the predicted value of block i.
- —the complete feature vector for block i.
- —the fitted CatBoost regressor.
- —the fitted model-parameter vector.
- —the urban state and accessibility matrix.
Changing one block also modifies the spatial-lag features of neighboring blocks. The objective therefore includes changes in predicted land value for both the transformed block and its neighbors. It is defined as the difference in total model-predicted land value between the scenario and baseline urban states:
where:
- —the aggregate difference in predicted land value between scenario x and the baseline state.
- n—the number of urban blocks.
- —the updated and initial urban states.
The baseline term is constant for all candidate scenarios. Consequently, maximizing the predicted land-value gain is equivalent to maximizing the total predicted land value under the scenario.
3.3. Net Present Value
The second quantitative objective represents the financial performance of the development project on the transformed block q. A separate cash-flow sequence is generated for every land-use component k included in the scenario. Its parameters are taken from the corresponding benchmark profile and include construction cost, construction duration, operating expenditure, and either a sale price and sales period or an annual rent, rental period, and occupied share.
For each component, the gross floor area is allocated according to the proposed land-use shares. Land acquisition and construction form the initial negative cash flows, while sales or rental income net of operating expenditure forms the subsequent positive flows. Component-level flows are then aggregated by period:
where:
- —the aggregate cash flow of block q in period t.
- —sales or rental revenue.
- —operating expenditure.
- —construction expenditure.
- —land-acquisition expenditure.
- k—the index of a land-use component in K.
The investor’s net present value is calculated as
where:
- —the financial objective for scenario x.
- —the investor net present value for block q.
- T—the project horizon.
- —the non-negative discount rate.
The experiments use a default annual discount rate of . If land-use-specific rates are provided, they are combined using the corresponding land-use areas as weights. Maximizing favors scenarios whose discounted revenues exceed their development and operating costs while retaining the trade-off with the broader land-value objective.
3.4. Qualitative Objective
The qualitative objective is implemented as the following structured language-model evaluation:
where:
- c—the deterministic serializer of the updated scenario.
- p—the fixed qualitative evaluation prompt.
- m—the selected language model.
- —the fixed inference settings other than temperature.
- T—the decoding temperature.
- —the resulting response distribution.
- —one realization of the language model’s stochastic output.
- —the response generated for scenario x, prompt p, and realization .
- —the deterministic score-extraction function.
- —the resulting normalized qualitative score.
Equation (11) separates the stochastic model response from deterministic score extraction and makes explicit that repeated evaluations of the same scenario can produce different scores.
During optimization, the LLM receives the repaired scenario parameters, derived morphological and population attributes, and the two economic objective values. The accessibility indicator, block geometries, and neighboring-block attributes are not supplied directly. The complete payload is documented in the Supplementary Materials (Candidate Payload).
The five qualitative criteria were selected through the authors’ expert judgment in urban planning. The selection was guided by their relevance to redevelopment decisions and their ability to capture considerations not explicitly represented by NPV and land-value gain. Each criterion was translated into an evaluation prompt specifying the planning aspects to be considered. Table 1 provides each prompt and its justification. One fixed prompt is used throughout each optimization run. The full message templates, output-format instructions, and application-level system-message configuration are provided in the Supplementary Materials (Full LLM Evaluation Prompts).
Table 1.
Prompts and rationale for qualitative LLM evaluation.
The prompt is part of the objective definition, so different criteria can change scenario rankings, the Pareto front, and the magnitude or direction of the comparison between methods. The experiments test five distinct planning priorities. They do not establish invariance to alternative wordings of the same criterion. Conclusions therefore apply to the tested prompts, with wording sensitivity remaining a subject for further evaluation.
3.5. Choice of NSGA-II and Integration of the LLM Objective
3.5.1. Rationale for Selecting NSGA-II
NSGA-II was selected because the redevelopment problem combines several conflicting objectives whose relative importance cannot be specified reliably in advance. A weighted-sum formulation would require fixed trade-off coefficients and could conceal non-convex parts of the attainable objective space. By contrast, NSGA-II returns a set of non-dominated alternatives in a single run, allowing economic and qualitative trade-offs to remain explicit for subsequent expert review. Its elitist non-dominated sorting preserves high-performing solutions, while crowding-distance selection maintains diversity along the estimated Pareto front [2].
The method is also suitable for the present problem because the objective functions are heterogeneous and derivative-free. Investor NPV is calculated analytically, land-value gain is produced by a predictive model with spatial dependencies, and the qualitative score is obtained from an LLM. NSGA-II only requires objective values and feasibility checks. It does not require gradients, a common physical scale, or an analytical expression for every objective. Moreover, using the established NSGA-II framework makes it possible to isolate the effect of the LLM objective by comparing two- and three-objective variants under matched random initializations and otherwise identical search logic.
3.5.2. Integration of the LLM Score into Evolutionary Selection
Each individual in the population encodes a feasible redevelopment decision vector x. After decoding the individual, the urban state and all derived features are recomputed. The two quantitative objectives, land-value gain and investor NPV , are then evaluated. For an LLM-assisted run, the same updated state is converted into the structured description and evaluated using one fixed prompt p and fixed inference settings. The parsed response provides the qualitative score . The baseline and extended searches therefore use, respectively, the objective vectors and defined in Equations (2) and (3). The overall workflow is illustrated in Figure 2.
Figure 2.
Overview of the proposed method. Green highlights the proposed integration of LLM-based qualitative evaluation into multi-objective optimization.
No weighted aggregation is applied. Parent and offspring populations are ranked directly in the three-dimensional objective space using non-dominated sorting. When a front cannot be retained in full, crowding distance determines which solutions survive. Consequently, the LLM score participates in environmental selection at every generation. A candidate with a strong qualitative evaluation can remain in the population even when it is weaker in one economic objective, provided that it represents a non-dominated trade-off between the economic and qualitative objectives. The LLM does not alter the variation operators, feasibility constraints, or the definitions of the two quantitative objectives. It affects the search only through the additional component of .
For the conventional baseline, the same candidate representation and search procedure are retained, but selection uses only . The qualitative score is calculated for baseline solutions only after optimization to enable matched comparison with the LLM-assisted solutions. This distinction separates the effect of using the LLM as an active search objective from using it merely as a later evaluator of solutions discovered by economic optimization.
3.6. Evaluation Metrics
3.6.1. Reliability and Validation Procedure for LLM-Assisted Optimization
The procedure evaluates the repeatability and construct-related behavior of the LLM objective using the 333 urban blocks described in Section 4.1 and the five prompts in Table 1. Each combination of a block and a prompt is evaluated five times with identical structured input, prompt wording, and inference settings, producing 8325 evaluations. Individual repetitions are used for reliability estimation. Their mean provides one block-level score per prompt for the distribution summaries, Moran’s I, and maps. Surrogate modeling, SHAP analysis, and the inter-prompt correlation matrix use a separate block-scoring dataset described in Section 4.2, with scores averaged over the available responses for each block–prompt pair.
Within-prompt repeatability is measured using the single-measure coefficients ICC(1,1), ICC(A,1), and ICC(C,1), together with the average-measure coefficients ICC(1,k) and ICC(C,k), where . Prompt-specific score distributions are summarized by the mean, standard deviation, minimum, maximum, median, and quartiles. Pairwise Pearson correlations between block-level mean scores are used to compare the rankings produced by different prompts.
Surrogate modeling tests the association between mean LLM scores and urban attributes. Predictive performance is assessed on held-out observations using , MAE, and RMSE. SHAP values characterize feature contributions to the surrogate predictions rather than the internal reasoning of the LLM.
Finally, global Moran’s I is calculated separately for each prompt from the block-level mean scores and the common spatial relationship between blocks. Maps of the mean scores are used for descriptive spatial comparison. This protocol jointly assesses repeatability, prompt differentiation, association with observed urban attributes, and spatial structure.
3.6.2. Matched Pareto-Front Comparison
To determine whether direct inclusion of the qualitative score changes the composition and coverage of the final solution set, the two optimization formulations are compared in matched runs. The LLM-assisted Pareto set defined in Equation (6) is approximated by the final solution set . It is compared with the final baseline set . Each pair uses the same random initialization and algorithmic settings, and replication across runs is used to assess variability.
The evaluation comprises matched-seed comparisons and pooled-front comparisons. For both methods, each final scenario is evaluated three times under the same qualitative prompt and inference settings, independently of the scores used during optimization. The mean of these three evaluations defines . The non-dominated fronts are reconstructed using these mean scores before hypervolume is calculated. Matched-seed comparisons assess variability across random initializations, while pooled-front comparisons describe aggregate coverage across seeds. The comparison vector is
The main comparison uses normalized hypervolume in the joint space of , , and . Hypervolume measures the portion of objective space dominated by a Pareto set relative to a common reference point. A larger value therefore indicates broader coverage of the three objectives. It is defined as
where:
- —the hypervolume of final solution set P.
- P—either or .
- —normalized component j of the final evaluation vector under prompt p.
- j—the index of one of the three objectives.
- —coordinate j of the common dominated reference point .
- ∏—the Cartesian product of the three intervals.
- vol—three-dimensional volume.
The same measure is also calculated for the pairs , , and to show whether a difference arises from the economic objectives, the qualitative objective, or both.
In the matched-seed analysis, objective values are normalized using their pooled minimum and maximum across the compared methods, prompts, and seeds. For each objective, the common reference coordinate is placed below the pooled minimum by 1% of its observed range, with a minimum offset of 0.01. The same normalization and reference point are used for both methods. For every matched pair, the hypervolume of is subtracted from that of . The difference is also reported as a percentage of the value. Positive values favor LLM-NSGA-II.
For each prompt, paired differences across seeds are summarized by their median, interquartile range, mean, standard deviation, and number of positive values. Fronts pooled across seeds are used for descriptive comparisons and are not treated as additional replicates. Cumulative hypervolume after each generation is used to describe convergence, while the final matched fronts remain the main comparison.
Decision-space diversity is assessed only among solutions that are non-dominated with respect to and . This ensures that both methods are compared on the same economic basis. Diversity is described by the mean pairwise Gower distance, numerical range coverage, and normalized Shannon entropy of categorical variables. For each measure, the conventional value is subtracted from the LLM-assisted value within the same prompt and seed.
For pooled-front comparisons, final solutions from each method are assigned the mean of three independent qualitative evaluations, combined across seeds within that method, and filtered to obtain the non-dominated front for each prompt. The same evaluation protocol is applied to both methods. Hypervolume is calculated using common normalization and reference points within this comparison. The pooled results describe aggregate coverage of the objective space, while matched-seed comparisons assess between-run variability.
3.6.3. Noise-Control Experiment
To examine whether the observed advantage arises from criterion-specific LLM guidance or from adding an uninformative third objective, we introduced random-score and shuffled-score controls. Random scores were sampled from Uniform(0,1) and retained for repeated occurrences of the same scenario within a run. Shuffled scores were assigned without using scenario attributes, from permuted pools of deduplicated archived LLM scores from other seeds. The pools were reshuffled when exhausted. A separate deterministic LLM control was not evaluated.
Final solutions from all compared methods, including the baseline, LLM-assisted optimization, and both noise controls, were re-evaluated using multiple fresh LLM calls per solution under the corresponding substantive LLM criterion. Search-time scores were not reused. The mean of the fresh scores was used to reconstruct the non-dominated fronts and calculate hypervolume. Hypervolume was calculated using a common economic normalization and reference point across methods and seeds within each criterion, with the qualitative scale fixed to [0, 1].
3.6.4. Planning Comfort Direction Analysis
Hypervolume shows how broadly a method covers the objective space, but it does not show whether the generated scenarios move toward recognizable planning characteristics. This analysis therefore uses a transparent planning comfort proxy that is calculated independently of the LLM score. Matched LLM-assisted and conventional runs are compared using all evaluated scenarios, not only their final Pareto sets.
The proxy combines four quantities derived from the decision variables:
- Functional mix, measured by normalized Shannon entropy of the seven land-use shares .
- Active-use potential, measured as the sum of the business and recreation shares.
- Open-ground potential, measured from the inverse normalized building coverage ratio .
- Human-scale massing potential, measured from the inverse normalized floor count .
The building coverage ratio and floor count are normalized once using their pooled minimum and maximum across both methods. The inverse scale assigns larger values to lower coverage and fewer floors. The four components are then averaged with equal weights to obtain one proxy value between 0 and 1.
The comfort threshold is the 75th percentile of proxy values produced by the conventional baseline. Each run is summarized by its mean proxy, the number and share of scenarios above this threshold, and the number of distinct land use and morphotype combinations among those scenarios. Component means are also retained to show which planning characteristics drive an aggregate difference.
Search direction over time is described by the mean proxy of the 20 highest-scoring scenarios observed up to each generation. The trajectory is summarized across matched seeds by its mean and standard deviation. For every reported measure, the conventional value is subtracted from the LLM-assisted value for the same seed, and directional consistency is assessed with a one-sided exact sign test.
The proxy is a diagnostic measure rather than a direct assessment of experienced urban comfort. It does not measure daylight, noise, pedestrian connectivity, service accessibility, public-space quality, or resident experience.
4. Results
4.1. Study Area
The case study is Gatchina, a city of approximately 96,000 residents covering 28.8 km2 in the Leningrad Oblast, Russia. The spatial database combined OpenStreetMap with official administrative and land-use data. Road, rail, and water geometries were processed with BlocksNet following [29], producing 351 urban blocks. An intermodal graph and block-to-block travel-time matrix were generated with IduEdu, following ref. [30]. After integrating the required attributes, 333 blocks were retained for LLM reliability and validation analyses.
Functional zoning was aggregated to each block as land-use shares. Building geometries and administrative records supplied footprint, floor area, residential area, and population. Where values were missing, the footprint area was calculated from geometry, with total floor area as footprint multiplied by floor count, residential area as 90% of the total floor area for residential buildings, and population using 20 m2 of the residential area per person. Building attributes were assigned by centroid and summed by block.
Table 2 lists all 21 attributes in the block-level GeoJSON dataset. Field names are retained to make the data definitions traceable to the accompanying dataset. The GeoJSON additionally stores block boundary geometries in longitude and latitude (CRS84).
Table 2.
Block-level attributes, definitions, and units.
During optimization, the LLM receives the repaired scenario attributes together with predicted land-value gain and investor NPV. The exact fields supplied to the model are listed in the Supplementary Materials (Candidate Payload).
Optimization experiments used block 86 in central Gatchina (Figure 3). The map places the selected block among the study blocks and locates Gatchina within Russia. The block’s heterogeneous mix of multi-storey housing, public green space, special-purpose areas, and business land supports multiple plausible redevelopment scenarios. The block covers approximately 1.02 km2, with a building footprint of 47,097 m2, total floor area of 107,108 m2, and an estimated population of 1389.
Figure 3.
Location of the study block in Gatchina, Russia.
4.2. Experimental Setup
4.2.1. NSGA-II
The implementation uses pymoo, with version 0.6.2 recorded in the extended-run configuration. The baseline and LLM-assisted searches used matched random initializations and identical search settings, with the qualitative objective added only in the latter. Table 3 lists the search budgets, random seeds, and model settings. The common budget of 600 candidate evaluations per run permits a matched comparison. A small population keeps repeated LLM evaluation tractable while allowing replication across seeds and criteria within this budget. This is a budget-based design, not an empirically optimized population size or a convergence-based stopping rule. The extended experiment increased the generation budget while retaining the population size and covering all five prompts. Its restriction to one seed reflects the available computational resources.
Table 3.
Settings for optimization, LLM evaluation, and surrogate modeling.
The runs retain the library’s default real-valued variation operators: simulated binary crossover (SBX) and polynomial mutation (PM). Initialization samples uniformly within the variable bounds. Binary tournament selection uses dominance and crowding distance, and survival uses non-dominated sorting and crowding distance. The implementation encodes ten real-valued coordinates: footprint area, floor count, MXI, and seven land-use shares. Footprint is bounded by , floor count by , MXI by , and each land-use share by . Before evaluation, land-use shares are normalized and dependent building attributes, including MXI, are recomputed. Thus, the encoded MXI coordinate is overwritten during repair. Constraints are enforced through variable bounds and this deterministic repair rather than penalty objectives. Duplicate elimination operates on the encoded decision vectors.
4.2.2. LLM
DeepSeek-V4-Flash was selected as a compromise between reasoning capabilities and the low cost of repeated scenario assessment. This is particularly relevant to evolutionary optimization, which requires numerous LLM calls. No comparative study of language models was conducted, so this choice does not imply superiority over alternative models. One fixed prompt from Table 1 was used throughout each optimization run, with the remaining inference settings held constant. The client explicitly sets the model and temperature. Token limits, top-p, and sampling seed are not explicitly overridden. Each uncached scenario is evaluated once during search, and its score is reused when the same evaluation payload recurs. Responses are parsed as JSON and validated against a schema requiring a numeric score in . Parsing or validation failures raise an error rather than being assigned a substitute score. The reliability analysis used five evaluations per block–prompt pair. The surrogate analysis used a separate set of block-level evaluations, described below. The matched-seed and pooled-front analyses, as well as comparisons at selected generations in the extended experiment, used the mean of three fresh, independent evaluations per scenario–prompt pair for each method.
4.2.3. Surrogate Models and SHAP
Prompt-specific surrogates were fitted to reproduce LLM scores from the 21 land-use, morphological, development-intensity, population, and accessibility attributes listed in Table 2. Their purpose was to support SHAP analysis of the relationships between block attributes and LLM scores. Predictive performance was assessed to establish how closely each surrogate reproduced the scores being interpreted.
The analysis covered 333 blocks and five prompts. Targets were the means of the available responses from a separate block-scoring experiment: 1345 block–prompt pairs had one response, 264 had two, 54 had three, and two had four. Thus, the precision of the target means was not uniform. These targets were distinct from the five-response means used in the reliability analysis. The block-scoring requests supplied the attributes as JSON together with the block identifier and requested a JSON score, whereas the reliability requests used a Python 3.10 representation of the attributes and requested a numeric answer. Block identifiers, geometries, and predicted land values were excluded from the surrogate predictors.
Nested cross-validation separated hyperparameter tuning from evaluation on held-out blocks. The random and spatial splits allowed sensitivity to spatial separation to be examined. For spatial grouping, block centroids were projected to UTM zone 36N, with seed 36 and ten k-means initializations used for clustering. No spatial buffer was imposed between groups. Tuning used only the training portion of each outer fold, with spatial groups also preserved in the inner folds. The model families, fold counts, hyperparameter grid, and selection criteria are specified in Table 3. Selecting the SHAP surrogate from these validation results is descriptive and does not constitute an independent test of the selected model. SHAP values were computed for the held-out blocks and explain the surrogate predictions, not the internal reasoning of the LLM or causal effects of the attributes.
4.3. Reliability and Construct-Related Validity of LLM-Assisted Optimization
The reliability analysis examined both the repeatability of LLM scores and their variation across criteria and blocks. As shown in Table 4, mean scores differed across prompts. Despite these differences, single-measure ICC values occupied a relatively narrow range of 0.69–0.74, indicating moderate-to-good repeatability across the five prompts. Reliability was higher for the mean of five evaluations per block–prompt pair (ICC(C,k) = 0.92–0.93, ). These latter estimates describe averaged scores and do not represent the reliability of a single online evaluation.
Table 4.
Repeatability and spatial autocorrelation of LLM scores.
The same dataset also showed variation in the spatial distribution of scores (Supplementary Figure S1). Positive Moran’s I values indicated spatial autocorrelation of varying strength, weakest for Prompt 1 and strongest for Prompt 5. Their statistical significance was not assessed using permutation tests.
To examine the relationship between LLM scores and observable block attributes, a separate set of block-level evaluations was analyzed using the surrogate models and nested cross-validation described in Section 4.2. Table 5 reports predictive performance for the models selected for SHAP interpretation. These metrics assess how closely the surrogates reproduce the LLM scores, rather than the planning quality of those scores.
Table 5.
Spatial cross-validation of surrogates used for SHAP interpretation.
The models reproduced the scores with differing accuracy across criteria. Prompt 5 had the highest explained variance, while Prompt 3 had the lowest absolute prediction errors. Prompt 4 stood out for its low (0.043) and the largest errors. Its low predictive fidelity limits the extent to which SHAP can be used to interpret the underlying LLM scores through this surrogate.
With these differences in predictive fidelity in mind, Figure 4a illustrates the feature contributions for Prompt 2. Business share, dominant land-use share, living area, and FSI were among the most prominent attributes in the surrogate. Higher business shares generally contributed positively to its predictions in the displayed sample. Corresponding SHAP plots for Prompts 1 and 3–5 are provided in Supplementary Figure S2. These associations characterize the fitted surrogates. They do not reveal the internal reasoning of the LLM or establish causal effects on planning quality.
Figure 4.
SHAP interpretation for Prompt 2 and correlations between LLM scores.
The correlation matrix in Figure 4b complements the feature-level analysis by comparing the prompt scores in the same block-scoring dataset. The strongest positive correlation was between Prompts 2 and 3 (), with smaller positive associations linking Prompt 1 to both. The remaining pairwise correlations were weak (). The scores therefore showed partial overlap, particularly for Prompts 2 and 3, while most prompt pairs exhibited weak linear associations. Taken together, the analyses document repeatability and criterion-dependent relationships between LLM scores and block attributes. They provide indirect construct-related evidence, with the strength of the surrogate-based interpretation limited by predictive fidelity.
4.4. Comparative Analysis of Pareto Fronts
The comparison of final fronts addresses RQ2 across ten matched random seeds (32–41) and five evaluation prompts (Table 1), yielding 50 paired comparisons between LLM-NSGA-II and conventional two-objective NSGA-II. The primary outcome was the normalized hypervolume difference in the joint space of NPV, land-value gain, and LLM score, with pairwise projections showing the associated trade-offs. Pooled fronts describe aggregate coverage, while matched-seed comparisons show between-run variability. Both analyses used the mean of three independent LLM evaluations per solution for both methods.
4.4.1. Aggregated Fronts After Repeated Evaluation
The pooled-front evaluation included 50 final LLM sets from ten seeds and five prompts, comprising 933 unique scenario–prompt pairs. Figure 5 shows the pooled front for Prompt 2 after averaging the new scores and rebuilding the three-objective front, compared with the pooled baseline. Prompt 2 was selected as the representative example based on its consistent performance in the matched-seed analysis. Corresponding plots for Prompts 1 and 3–5 are provided in Supplementary Figures S4–S7. These pooled comparisons describe aggregate objective-space coverage after repeated scoring of both methods and are not additional independent replicates. In the plots, shading connects front points, and HV denotes dominated volume.
Figure 5.
Pooled Pareto-front comparison for Prompt 2.
Figure 6 summarizes relative hypervolume differences across all five prompts and four objective spaces. Differences are calculated as , with positive values favoring LLM-NSGA-II. LLM-NSGA-II achieved higher pooled hypervolume in every space containing the qualitative score, including a – increase in three dimensions, while economic hypervolume decreased by –. This pattern indicates a trade-off between economic performance and the qualitative criterion rather than a uniform improvement across objectives. These pooled-front differences are descriptive and do not constitute a significance test across seeds.
Figure 6.
Relative pooled-front hypervolume differences across five prompts.
4.4.2. Paired Hypervolume Comparison Across Random Seeds
LLM-NSGA-II achieved higher three-dimensional hypervolume in 27 of the 50 matched comparisons (54%). Median relative differences were positive for Prompts 1 and 2 and negative for Prompts 3–5. Prompt 2 showed the most consistent advantage, with improvements in eight of ten seeds.
Figure 7 shows the distribution of relative hypervolume differences across matched seeds, with non-dominated fronts reconstructed after repeated scoring. Table 6 reports the primary outcome in the joint space of NPV, land-value gain, and LLM score. IQR and SD are calculated across ten seeds and expressed in percentage points (pp). In the figure, filled blue circles denote seeds with , while orange crosses denote seeds favoring the baseline.
Figure 7.
Relative hypervolume differences across ten matched seeds.
Table 6.
Paired relative hypervolume differences in the three-objective space.
The large IQR and standard deviation for Prompt 1 indicate substantial variability across random initializations. Mean relative differences were positive for all five prompts, but exceeded the corresponding medians, indicating that larger gains in some seeds raised the averages. Positive means therefore do not imply a consistent advantage across runs. The pairwise projections in Figure 7 provide complementary views of the trade-offs involving each economic objective and the qualitative score. Overall, the paired three-objective comparison indicates that the benefit of LLM guidance depends on both the criterion and random initialization.
4.4.3. Comparison with Noise Controls
Across five criteria and three matched seeds, LLM-assisted optimization achieved higher three-objective hypervolume than the random-score and shuffled-score controls in 12 of 15 and 10 of 15 comparisons, respectively. It also exceeded the conventional baseline in 9 of 15 comparisons.
Table 7 reports median differences in normalized three-objective hypervolume after independent repeated re-evaluation of all final solution sets (Section 3.6.3). Differences are calculated as LLM minus comparator and reported in normalized hypervolume units rather than percentages.
Table 7.
Median hypervolume differences between LLM-assisted optimization and the controls. Positive values are highlighted in bold.
The fronts and hypervolume were calculated using the mean of fresh LLM scores for each solution. LLM wins counts the matched seeds in which LLM-assisted optimization achieved higher hypervolume than the comparator. Positive median differences are shown in bold, which does not indicate statistical significance.
The clearest pattern was observed for , which outperformed both noise controls in all three seeds. Results for the other criteria were less consistent, with negative median differences against the random control for and against the baseline and shuffled control for .
The noise-control experiment provides criterion-dependent evidence that meaningful LLM scores can guide search beyond the effect of adding an uninformative third objective. However, the mixed results across criteria and the limited number of seeds do not establish a general advantage of semantic guidance.
4.4.4. Decision-Space Diversity
Median matched-seed changes in mean pairwise Gower distance and numerical parameter coverage were positive for every prompt (Table 8). These secondary diversity measures were calculated only among solutions non-dominated with respect to investor NPV and land-value gain, so both methods were compared on the same economic basis. The largest median increase in pairwise parameter distance occurred for Prompt 5, whereas Prompt 1 produced only a small increase and was more diverse in only half of the matched seeds. Categorical entropy increased for Prompts 2–5 but decreased slightly for Prompt 1. Therefore, the diversity results support a change toward a broader range of configurations for Prompts 2–5 but do not indicate a uniform improvement for every qualitative criterion. Positive differences in Table 8 favor LLM-NSGA-II.
Table 8.
Median matched-seed changes in decision-space diversity.
4.4.5. Direction Toward Candidates with Higher Planning Comfort
Under Prompt 3, LLM-guided search increased both the mean planning comfort proxy and the number of candidates above the comfort threshold in all ten matched seeds. The proxy, defined in Section 3.6.4, captures planning characteristics independently of the LLM score. The fixed 75th-percentile threshold calculated from the pooled no-LLM proxy distribution was 0.370852.
Table 9 reports paired differences between the LLM-guided and no-LLM runs. Positive differences favor LLM-NSGA-II. The yield difference counts additional candidates above the comfort threshold among 600 evaluations per seed. The median yield gain of 157 scenarios corresponds to 26.2 percentage points of the evaluation budget. Both prespecified primary outcomes met the decision rule of improvement in at least eight seeds with under the one-sided exact sign test.
Table 9.
Matched-seed changes in the planning comfort proxy for Prompt 3.
Figure 8 summarizes the ten matched seeds. The left panel shows the mean cumulative planning comfort proxy for the top 20 candidates, with shaded standard deviation bands. The center panel shows the share of evaluated scenarios above the fixed 75th-percentile threshold from the no-LLM baseline. The right panel reports the number of distinct land-use and morphotype combinations above that threshold. The cumulative quality of the top 20 candidates separated during the first generations and remained higher for LLM-NSGA-II through generation 30, although the standard-deviation bands overlap. The seed-level panels explain this aggregate pattern, showing that higher candidate yield was often accompanied by greater typological richness. However, this supporting endpoint did not reach the 0.05 significance threshold.
Figure 8.
Planning comfort proxy and candidate diversity under Prompt 3.
The component-level results indicate that the shift was driven primarily by higher active-use shares, greater unbuilt-ground potential, and more human-scale massing. The change in functional-mix entropy was not statistically consistent. Consequently, the experiment supports the claim that Prompt 3 directed the evolutionary search toward a larger set of scenarios with planning characteristics associated with urban comfort. This interpretation is limited to the diagnostic proxy: it does not constitute a direct assessment of daylight, noise, pedestrian connectivity, service accessibility, public-space quality, or residents’ experienced comfort.
Taken together, the results show that including the qualitative objective changes the trade-offs represented by the final decision sets. After independent repeated evaluation, the pooled fronts covered a larger three-objective volume for all five prompts. This aggregate advantage does not imply consistent superiority in individual runs: pooling combines complementary solutions discovered across seeds. The noise-control results likewise showed criterion-dependent advantages. Thus, the evidence supports broader aggregate coverage and changes in planning direction within the tested setting, while the benefit in an individual run remains sensitive to the criterion and initialization.
4.5. Effect of the Generation Budget
This experiment examined whether increasing the number of generations from 30 to 150 improved solution quality and changed the relative performance of LLM-NSGA-II and the no-LLM baseline. The methods were compared using a population of 20, seed 36, and Prompts 1–5. Hypervolume was calculated using common reference points and normalization across methods and generations within each prompt comparison.
At generations 30, 75, 100, and 150, each compared solution from both methods received three fresh, independent LLM evaluations under the corresponding prompt and the same inference settings. As in the main final-front comparison (Section 3.6.2), the scores were averaged and the non-dominated fronts were reconstructed before calculating three-objective hypervolume.
Figure 9 shows the resulting normalized hypervolume for each prompt. Solid lines denote LLM-NSGA-II, and dashed lines denote conventional NSGA-II. Annotations show the percentage advantage of the method with higher hypervolume relative to the other method. Lines between the evaluated generations serve as visual guides.
Figure 9.
Normalized three-objective hypervolume across generations.
For Prompts 1, 3, 4, and 5, LLM-NSGA-II achieved higher hypervolume at all compared generations. For Prompt 2, conventional NSGA-II had higher hypervolume at generation 30, whereas LLM-NSGA-II had higher hypervolume at generations 75, 100, and 150. At generation 150, LLM-NSGA-II exceeded conventional NSGA-II by , , , , and for Prompts 1–5, respectively. Thus, its advantage persisted under the larger search budget in this run; consistency across runs and algorithmic convergence require further study.
4.6. Computational Cost
Main optimization across five prompts and ten seeds has an estimated LLM API cost of USD 13.32 and requires approximately 16.7 h of sequential API time (Table 10). API charges are modest at the studied scale, whereas sequential request time becomes substantial.
Table 10.
Estimated LLM API costs by experimental stage.
These estimates were derived from the mean token usage recorded in the API activity export: 359.5 input tokens and 429.7 output tokens per request. The estimated mean cost was USD 0.000444 per request. Sequential API time was calculated assuming 2 s per request. For optimization, the request budget was calculated as the product of population size, generation count, number of prompts, and number of random seeds, without a cache discount. Final-front rescoring and baseline post-hoc scoring were accounted for separately. The estimates use a population of 20, with 30 generations for main optimization and 150 generations for extended optimization.
Increasing the generation budget from 30 to 150 raises the estimated cost and sequential API time fivefold. Thus, the improvements associated with a larger search budget must be weighed against the additional execution time. Caching repeated evaluations can reduce request counts, and parallel requests can reduce elapsed time, although these savings were not quantified in this estimate.
4.7. Urban Planning Demonstration on an Economically Matched Case
The hypervolume analysis establishes whether the LLM changes the final decision set, but it does not show what this change means for an individual planning proposal. We therefore examine a concrete pair under Prompt 3, which assesses the ability of a scenario to support active urban life (Table 1). The pair was selected from the complete final fronts for seeds 32–41 using the procedure described below. Within each seed, solutions were considered economically comparable when their Euclidean distance in the plane of normalized NPV and land-value gain did not exceed 0.10. For each eligible LLM solution, the compatible conventional solution with the highest Prompt 3 score after optimization was retained, making the qualitative comparison conservative.
Seed 36 provides the clearest matched case: both solutions redevelop block 86, both assign it a residential primary use, and their normalized economic distance is 0.097. The alternatives therefore differ mainly in the internal development program and morphology, rather than in location or nominal land-use category. Table 11 shows the resulting trade-off. The LLM-guided solution raises the qualitative score from 0.25 to 0.70, increases the combined business and recreation share, and shifts the proposed morphology from a high-rise Soviet microdistrict to a mid-rise block. These changes come with lower NPV and aggregate land-value gain, so the LLM solution is not economically dominant. It represents a different and explicitly planning-oriented compromise. In Table 11, percentage changes are relative to conventional NSGA-II. Changes in land-use shares and the qualitative score are absolute percentage-point and score-point differences, respectively.
Table 11.
Economically matched alternatives for block 86 under Prompt 3.
Figure 10 makes the programmatic difference visible: LLM guidance shifts allocation away from industrial and transport uses toward business, recreation, and housing. The fourfold increase in recreation and the larger business component are consistent with the Prompt 3 emphasis on active ground floors, public-space use, and activity throughout the day. These variables are planning-oriented descriptors, however, and should not be interpreted as direct measurements of pedestrian accessibility or public-space quality.
Figure 10.
Land-use composition of the matched redevelopment alternatives.
The spatial comparison in Figure 11 shows that the planning-oriented shift does not eliminate the modeled economic benefit to the surrounding area. The land-value model predicts a positive change for 329 of 333 blocks under LLM-NSGA-II, compared with 327 under conventional NSGA-II. The corresponding numbers of negative changes are four and six. Both maps use a fixed to scale and the same 4 km context around block 86. Conventional NSGA-II is shown on the left and LLM-NSGA-II on the right. The target block is outlined in red, and the relative aggregate land-value comparison across all blocks is reported between the panels. The predicted increase for the target block itself is 29.7% with LLM guidance, compared with 22.7% without it. Thus, the lower aggregate land-value gain coexists with a spatially widespread positive model response and a larger predicted increase in the target block.
Figure 11.
Predicted land-value changes around block 86.
To place the selected example in context, the fixed 0.10 caliper produced valid pairs for five of the ten seeds. Unmatched seeds were not forced into the comparison. Table 12 reports the matched-seed medians, with positive values favoring LLM-NSGA-II. Qualitative gains were not uniform across the matched pairs, and the conventional solution usually retained an economic advantage. Accordingly, the case study illustrates how the LLM objective changes a planning proposal, whereas the multi-seed hypervolume analysis in Section 4.4 remains the primary evidence for systematic objective-space improvement.
Table 12.
Comparison of five economically matched pairs under Prompt 3.
This example clarifies the substantive advantage of placing the LLM inside the optimization loop. A conventional economic front can be scored after generation, but it cannot recover alternatives that were discarded because their value lies in a qualitative planning trade-off. Direct LLM guidance keeps such alternatives available: in the demonstrated case, a modest economic opportunity cost buys a substantially higher score for active urban life and a materially different functional and morphological program.
5. Discussion
5.1. Interpretation of the Main Findings
The study demonstrates that qualitative planning priorities expressed in natural language can participate directly in evolutionary scenario search. Integrating LLM scores into NSGA-II changed the alternatives retained during selection and expanded the aggregate coverage of economic and qualitative objectives in the Gatchina case study. This gives planners a computational way to explore how an explicit qualitative priority changes the available development options.
The clearest aggregate result was the increase in three-objective hypervolume of fronts pooled across seeds, which reached – across all five prompts after three independent evaluations per solution for both methods. Pooling brings together complementary alternatives discovered in different runs. The resulting coverage shows the value of repeated searches for building a set of options for subsequent review. In individual runs, LLM-NSGA-II achieved larger hypervolume in 27 of 50 matched comparisons, with positive median differences for Prompts 1 and 2. Prompt 2 showed the most consistent advantage, winning in eight of ten seeds. Thus, the aggregate expansion coexists with criterion-dependent and seed-dependent performance in a single run. The reduction in economic hypervolume of – identifies the economic trade-offs associated with pursuing the qualitative objective.
The decision-space and planning-direction analyses help explain what this expansion means for the generated scenarios. Median changes in parameter distance and numerical coverage were positive for every prompt, while categorical diversity also increased for Prompts 2–5. Under Prompt 3, both the mean planning comfort proxy and the number of candidates above its fixed threshold increased in all ten seeds. The median gain was 157 candidates within the budget of 600 evaluations. These changes were associated mainly with active-use shares, unbuilt-ground potential, and human-scale massing. The economically matched example made one such trade-off concrete through a different land-use composition and building morphology. These results connect changes in objective-space coverage to observable scenario attributes.
The noise controls provide further evidence about the contribution of the qualitative criterion. Prompt 3 achieved higher hypervolume than both random and shuffled objectives in all three tested seeds. Together with the proxy results, this supports the potential of criterion-specific guidance to direct search toward a recognizable planning priority. Results for the other prompts were mixed, indicating that the benefit of substantive guidance depends on the selected criterion within the tested setting.
The extended experiment also showed that the approach can produce advantages under a larger search budget. At generation 150, LLM-NSGA-II achieved higher three-objective hypervolume for all five tested prompts in seed 36. The change from a deficit to an advantage for Prompt 2 between generations 30 and 75 illustrates how the search budget can affect the comparison. This experiment extends the evidence beyond the main 30-generation budget, while leaving convergence and consistency across longer runs open for further study.
Differences across prompts are substantively meaningful because each prompt defines a distinct planning priority. The experiments show that this choice affects score distributions and the alternatives retained by the search. Explicit prompt definitions therefore make the qualitative objective visible and open to discussion. The five criteria represent different objectives, with sensitivity to alternative wordings of the same objective remaining a separate question.
5.2. Theoretical and Practical Significance
The methodological contribution is to make a weakly formalized planning priority a computable objective within multi-objective optimization. Its evaluation can then influence which scenarios survive and contribute to subsequent generations. This extends the range of priorities that can be represented during search and allows their relationships with economic objectives to be examined through explicit trade-offs.
The proposed workflow gives planners and stakeholders a clear role in defining and using these objectives. They would formulate the planning priority, document the evaluation prompt, and review example scores against their judgments. Mandatory planning requirements would be encoded as constraints. After optimization, planners would examine the Pareto alternatives, compare their economic and qualitative characteristics, and shortlist scenarios for further development and deliberation. Refining the priority or its formulation would provide a basis for another search.
The LLM supplies repeated assessments within this workflow, while people retain responsibility for defining criteria, reviewing alternatives, and making decisions. The demonstrated expansion of aggregate coverage and changes in scenario composition provide a computational basis for such decision support. Evaluating its effects on professional workload and real planning decisions is a next step for applied research.
5.3. Reliability and Scope of Interpretation
Repeated block assessments showed moderate-to-good single-measure reliability, with ICC values of –. Averaging five assessments increased reliability to –. This establishes repeatability within the tested block-evaluation protocol and supports repeated scoring as a way to obtain more stable aggregate assessments. The separate surrogate analysis complements this result by examining relationships between block attributes and LLM scores under spatial cross-validation.
Surrogate fidelity varied across criteria. Prompts 3 and 5 had spatial values of and , respectively, indicating that a substantial part of the variation in their scores could be reproduced from the available attributes. For Prompt 2, SHAP highlighted associations with land-use composition, living area, and development intensity. Positive Moran’s I values in the reliability dataset additionally described spatial structure in the scores. Together, these analyses provide complementary evidence about repeatability and relationships with urban characteristics. SHAP interprets the surrogate predictions, with the low fidelity for Prompt 4 limiting its use for interpreting that criterion.
5.4. Limitations
The findings should be interpreted within the following limits:
- Geographical and decision scope. Optimization was evaluated for one redevelopment block in Gatchina. Replication across random seeds characterizes search variability within this setting, but does not establish transferability to other cities, urban forms, or planning contexts. The economically matched case illustrates the mechanism rather than a realized development outcome.
- Dependence on the LLM and prompts. The experiments used one LLM configuration and five fixed qualitative criteria. The magnitude and consistency of the advantage varied across prompts and seeds. Performance with other model families, temperatures, or semantically equivalent prompt formulations was not assessed.
- Search budget and computational scope. The multi-seed experiments used 30 generations. The 150-generation experiment covered all five prompts but was restricted to one seed because of resource constraints. It showed an advantage in three-objective hypervolume for all five prompts at generation 150 but did not establish convergence or consistency across runs. Equal objective-evaluation budgets do not imply equal computational cost, and performance for simultaneous optimization of multiple blocks was not established.
- Validation of planning quality. ICC measures repeatability, while surrogate models, SHAP, and the planning comfort proxy provide indirect evidence of planning relevance. They do not establish agreement with experts or residents, nor measure realized social or environmental outcomes. Surrogate validation held out spatial groups of blocks within one city, but imposed no buffer between groups. Dependence across group boundaries may therefore remain. Cross-city transfer was not tested. Unequal numbers of responses per block–prompt pair also resulted in unequal precision of the surrogate targets. SHAP explains the surrogate predictions, not the reasoning of the LLM, and its relevance to the LLM scores is limited by surrogate fidelity, particularly for Prompt 4.
- Data and representation. Scenario evaluation depends on block-level attributes and modeled economic outcomes. Missing building attributes were estimated using fixed assumptions, and aggregation cannot fully represent local design and public-space conditions. Applying the approach to another city requires preparation and verification of the block dataset, accessibility network, and economic-model inputs.
5.5. Conditions for Practical Use and Future Work
Practical use would combine a documented evaluation rubric with expert review of example scores and transparent presentation of the resulting alternatives. Recording the prompt and model configuration would make the qualitative objective auditable. This emphasis on explicit evaluation criteria and review is consistent with the broader LLM-evaluation literature [4,5].
The next research steps are replication across cities and LLMs, comparison with expert and public assessments, and longer replicated searches. Controlled tests of equivalent prompt formulations would help distinguish sensitivity to wording from changes in the planning priority itself. Representing several stakeholder perspectives as explicit objectives is a further direction for extending the framework. These developments would build on the demonstrated ability to incorporate qualitative priorities into scenario generation and make their economic trade-offs available for review.
6. Conclusions
This study developed and evaluated a framework that integrates LLM-based qualitative objectives into multi-objective evolutionary optimization of urban development scenarios. A planning priority expressed in natural language participates directly in scenario generation and selection alongside investor net present value and predicted land-value gain. The framework thereby extends the range of planning considerations that can guide automated search.
Regarding the first research question, repeated block assessments demonstrated moderate-to-good repeatability, with single-measure ICC values of – and reliability of five-evaluation means of –. Spatially validated surrogates and spatial-autocorrelation analysis provided complementary evidence of relationships between the scores and observable urban characteristics. Together, these results characterize the repeatability and criterion-dependent structure of the qualitative assessments.
Regarding the second research question, LLM guidance expanded the aggregate coverage of economic and qualitative objectives. After three independent evaluations per solution for both methods, fronts pooled across seeds achieved a three-objective hypervolume advantage of – for all five criteria. Individual-run advantages occurred in 27 of 50 matched comparisons, with positive median differences for two criteria and the most consistent performance under Prompt 2. This distinguishes broader aggregate coverage from criterion-dependent gains in individual runs. The accompanying reduction in economic hypervolume makes the economic trade-offs associated with pursuing qualitative priorities explicit.
The scenario-level analyses give these results a planning interpretation. Under Prompt 3, the mean comfort proxy and the number of candidates above its threshold increased in all ten seeds. The matched example illustrated a different functional and morphological program with a higher qualitative score and lower economic returns. Together with the criterion-dependent noise-control results, these findings support the use of LLM objectives to explore additional planning alternatives within the studied setting.
The principal contribution is a demonstrated computational approach for bringing weakly formalized priorities into the generation of urban development options. It provides a basis for early-stage scenario exploration in which planners and stakeholders define priorities, examine alternatives, and assess the associated trade-offs. Further validation across cities, models, and human judgments will establish the scope of its practical application. The framework already shows how qualitative criteria can shape the search and broaden the set of economic and planning compromises available for informed review.
Supplementary Materials
The following supporting information can be downloaded at: https://www.mdpi.com/article/10.3390/smartcities9100168/s1, Figure S1: Spatial distribution of mean LLM scores for Prompts 1–5; Figure S2: SHAP summaries for Prompts 1 and 3–5 under spatial validation; Figure S3: SHAP feature importance across five prompts; Table S1: Mean absolute SHAP values for the leading features; Figure S4: Pooled Pareto-front comparison for Prompt 1; Figure S5: Pooled Pareto-front comparison for Prompt 3; Figure S6: Pooled Pareto-front comparison for Prompt 4; Figure S7: Pooled Pareto-front comparison for Prompt 5; Section S2: Full LLM Evaluation Prompt; Table S2: Fields of params_repaired in the optimization payload.
Author Contributions
Conceptualization, M.N., V.S. and S.M. Methodology, M.N. and V.S. Software, M.N. Validation, M.N., V.S. and A.F. Formal analysis, M.N., V.S. and A.F. Investigation, M.N., V.S. and A.F. Resources, S.M. Data curation, M.N. and A.F. Writing—original draft preparation, M.N., V.S. and A.F. Writing—review and editing, M.N., V.S., A.F. and S.M. Visualization, M.N. and V.S. Supervision, S.M. Project administration, M.N. and S.M. Funding acquisition, S.M. All authors have read and agreed to the published version of the manuscript.
Funding
This work was supported by the Ministry of Economic Development of the Russian Federation (IGK 000000C313925P4C0002), Agreement No. 139-15-2025-010.
Institutional Review Board Statement
Not applicable.
Informed Consent Statement
Not applicable.
Data Availability Statement
The data and code supporting the findings of this study are openly available in the project repository at https://github.com/Mvin8/LLM-Based-Qualitative-Objectives-for-Multi-Objective-Evolutionary-Optimization-of-Urban-Development (accessed on 27 July 2026).
Acknowledgments
During the preparation of this manuscript, the authors used generative AI for (i) assistance with English language translation and polishing of the text (OpenAI ChatGPT GPT-5.5, DeepSeek-V4 Preview) and (ii) assistance with software implementation and code development (OpenAI ChatGPT GPT-5.5, OpenAI GPT-5.3-Codex). The authors have reviewed and edited the output and take full responsibility for the content of this publication.
Conflicts of Interest
The authors declare no conflicts of interest. The funders had no role in the design of the study, in the collection, analyses, or interpretation of data, in the writing of the manuscript, or in the decision to publish the results.
Abbreviations
Key abbreviations used in this manuscript:
| CV | Cross-validation |
| FSI | Floor space index |
| GSI | Ground space index |
| HV | Hypervolume |
| ICC | Intraclass correlation coefficient |
| IQR | Interquartile range |
| LLM | Large language model |
| MAE | Mean absolute error |
| MOO | Multi-objective optimization |
| MXI | Mixed-use index |
| NPV | Net present value |
| NSGA-II | Non-dominated sorting genetic algorithm II |
| RMSE | Root mean square error |
| SD | Standard deviation |
| SHAP | SHapley Additive exPlanations |
References
- Rittel, H.W.; Webber, M.M. Dilemmas in a general theory of planning. Policy Sci. 1973, 4, 155–169. [Google Scholar] [CrossRef] [Scilit]
- Deb, K.; Pratap, A.; Agarwal, S.; Meyarivan, T. A fast and elitist multiobjective genetic algorithm: NSGA-II. IEEE Trans. Evol. Comput. 2002, 6, 182–197. [Google Scholar] [CrossRef] [Scilit]
- Rahman, M.M.; Szabó, G. Multi-objective urban land use optimization using spatial data: A systematic review. Sustain. Cities Soc. 2021, 74, 103214. [Google Scholar] [CrossRef] [Scilit]
- Liu, Y.; Iter, D.; Xu, Y.; Wang, S.; Xu, R.; Zhu, C. G-eval: NLG evaluation using gpt-4 with better human alignment. In Proceedings of the 2023 Conference on Empirical Methods in Natural Language Processing; Association for Computational Linguistics: Singapore, 2023; pp. 2511–2522. [Google Scholar]
- Zheng, L.; Chiang, W.L.; Sheng, Y.; Zhuang, S.; Wu, Z.; Zhuang, Y.; Lin, Z.; Li, Z.; Li, D.; Xing, E.; et al. Judging llm-as-a-judge with mt-bench and chatbot arena. In Advances in Neural Information Processing Systems; Curran Associates, Inc.: Red Hook, NY, USA, 2023; Volume 36, pp. 46595–46623. [Google Scholar]
- Verma, D. Is Generative AI a successor to human-in-the-loop perception and cognition experiments in urban design and planning? J. Urban Des. 2025, 1–12. [Google Scholar] [CrossRef] [Scilit]
- Zheng, Y.; Xu, F.; Lin, Y.; Santi, P.; Ratti, C.; Wang, Q.R.; Li, Y. Urban planning in the era of large language models. Nat. Comput. Sci. 2025, 5, 727–736. [Google Scholar] [CrossRef] [Scilit] [PubMed]
- Sicuaio, T.; Zhao, P.; Pilesjo, P.; Shindyapin, A.; Mansourian, A. Sustainable and resilient land use planning: A multi-objective optimization approach. ISPRS Int. J. Geo-Inf. 2024, 13, 99. [Google Scholar] [CrossRef] [Scilit]
- Reitberger, R.; Palm, N.; Palm, H.; Lang, W. Urban systems exploration: A generic process for multi-objective urban planning to support decision making in early design phases. Build. Environ. 2024, 254, 111360. [Google Scholar] [CrossRef] [Scilit]
- Li, Q.; Wu, X.; Yang, Z.; Li, Z.; Li, W.; Liu, Y.; Jia, L. Multi-Objective Optimization of Urban Land Use Under Sustainable Development Orientation. Land 2026, 15, 815. [Google Scholar] [CrossRef] [Scilit]
- Chen, Y.; Chan, W.H.; Su, E.L.M.; Diao, Q. Multi-objective optimization for smart cities: A systematic review of algorithms, challenges, and future directions. PeerJ Comput. Sci. 2025, 11, e3042. [Google Scholar] [CrossRef] [Scilit] [PubMed]
- Wang, Y.; Zhou, X.; Cao, K. Multi-objective land use optimization for enhanced urban livability using a NSGA-III-differential evolution algorithm. Land Use Policy 2026, 161, 107880. [Google Scholar] [CrossRef] [Scilit]
- Churiakova, T.; Platonov, I.; Bezmaslov, M.; Bikbulatov, V.; Petrosian, O.; Starikov, V.; Mityagin, S.A. Constrained Metropolitan Service Placement: Integrating Bayesian Optimization with Spatial Heuristics. Smart Cities 2025, 9, 6. [Google Scholar] [CrossRef] [Scilit]
- Wang, Z.; Ren, F. Developing a decision support system for sustainable urban planning using machine learning-based scenario modeling. Sci. Rep. 2025, 15, 13210. [Google Scholar] [CrossRef] [Scilit] [PubMed]
- Singla, P.; Singh, A.; Gupta, A.; Garg, S. Adaptive urban planning: A hybrid framework for balanced city development. arXiv 2024, arXiv:2412.15349. [Google Scholar]
- Mu, N.; Luan, Y.; Jia, Q.S. Preference-based multi-objective reinforcement learning. IEEE Trans. Autom. Sci. Eng. 2025, 22, 18737–18749. [Google Scholar] [CrossRef] [Scilit]
- Deb, K.; Jain, H. An evolutionary many-objective optimization algorithm using reference-point-based nondominated sorting approach, part I: Solving problems with box constraints. IEEE Trans. Evol. Comput. 2013, 18, 577–601. [Google Scholar] [CrossRef] [Scilit]
- Cajot, S. Interactive Optimization for Supporting Multicriteria Decisions in Urban and Energy System Planning. Ph.D. Thesis, EPFL, Lausanne, Switzerland, 2018. [Google Scholar]
- Ghosh, A.; Deb, K.; Goodman, E.; Averill, R. An interactive knowledge-based multiobjective evolutionary algorithm framework for practical optimization problems. IEEE Trans. Evol. Comput. 2023, 28, 223–237. [Google Scholar] [CrossRef] [Scilit]
- Nazir, M.S.; Banerjee, C. Zero-Shot LLMs in Human-in-the-Loop RL: Replacing Human Feedback for Reward Shaping. arXiv 2025, arXiv:2503.22723. [Google Scholar]
- Bai, Y.; Kadavath, S.; Kundu, S.; Askell, A.; Kernion, J.; Jones, A.; Chen, A.; Goldie, A.; Mirhoseini, A.; McKinnon, C.; et al. Constitutional ai: Harmlessness from ai feedback. arXiv 2022, arXiv:2212.08073. [Google Scholar]
- Lee, H.; Phatale, S.; Mansoor, H.; Mesnard, T.; Ferret, J.; Lu, K.; Bishop, C.; Hall, E.; Carbune, V.; Rastogi, A.; et al. Rlaif vs. rlhf: Scaling reinforcement learning from human feedback with ai feedback. arXiv 2023, arXiv:2309.00267. [Google Scholar]
- Eduardo, R.C.; Huang, S.Y.; Guanhong, L. LLM Planning Agents: Exploring the potential and challenges of large language model agents in urban design and planning. In Proceedings of the 30th Annual Conference for Computer-Aided Architectural Design Research in Asia (CAADRIA); Association for Computer-Aided Architectural Design Research in Asia (CAADRIA): Tokyo, Japan, 2025; Volume 1, pp. 223–232. [Google Scholar]
- Gu, J.; Jiang, X.; Shi, Z.; Tan, H.; Zhai, X.; Xu, C.; Li, W.; Shen, Y.; Ma, S.; Liu, H.; et al. A survey on llm-as-a-judge. Innovation 2026, 7, 101253. [Google Scholar] [CrossRef] [Scilit] [PubMed]
- Li, H.; Dong, Q.; Chen, J.; Su, H.; Zhou, Y.; Ai, Q.; Ye, Z.; Liu, Y. Llms-as-judges: A comprehensive survey on llm-based evaluation methods. arXiv 2024, arXiv:2412.05579. [Google Scholar]
- Singhal, K.; Azizi, S.; Tu, T.; Mahdavi, S.S.; Wei, J.; Chung, H.W.; Scales, N.; Tanwani, A.; Cole-Lewis, H.; Pfohl, S.; et al. Large language models encode clinical knowledge. Nature 2023, 620, 172–180. [Google Scholar] [CrossRef] [Scilit] [PubMed]
- Liang, P.; Bommasani, R.; Lee, T.; Tsipras, D.; Soylu, D.; Yasunaga, M.; Zhang, Y.; Narayanan, D.; Wu, Y.; Kumar, A.; et al. Holistic evaluation of language models. arXiv 2022, arXiv:2211.09110. [Google Scholar]
- Natykin, M.V.; Mityagin, S.A. Comparative Analysis of Neural Network and Ensemble Machine Learning Models for Predictive Cadastral Land Valuation under Incomplete Spatial Data. Econ. Law Innov. 2026, 14, 72–88. [Google Scholar] [CrossRef] [Scilit]
- Kontsevik, G.I.; Churiakova, T.A.; Markovskiy, V.A.; Antonov, A.; Mityagin, S.A. Urban blocks modelling method. Procedia Comput. Sci. 2023, 229, 119–127. [Google Scholar] [CrossRef] [Scilit]
- Mishina, M.; Khrulkov, A.; Solovieva, V.; Tupikina, L.; Mityagin, S. Method of intermodal accessibility graph construction. Procedia Comput. Sci. 2022, 212, 42–50. [Google Scholar] [CrossRef] [Scilit]
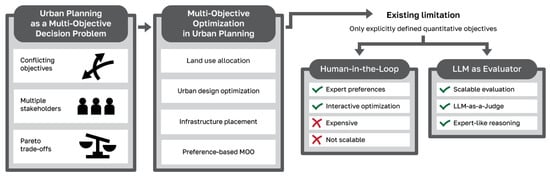
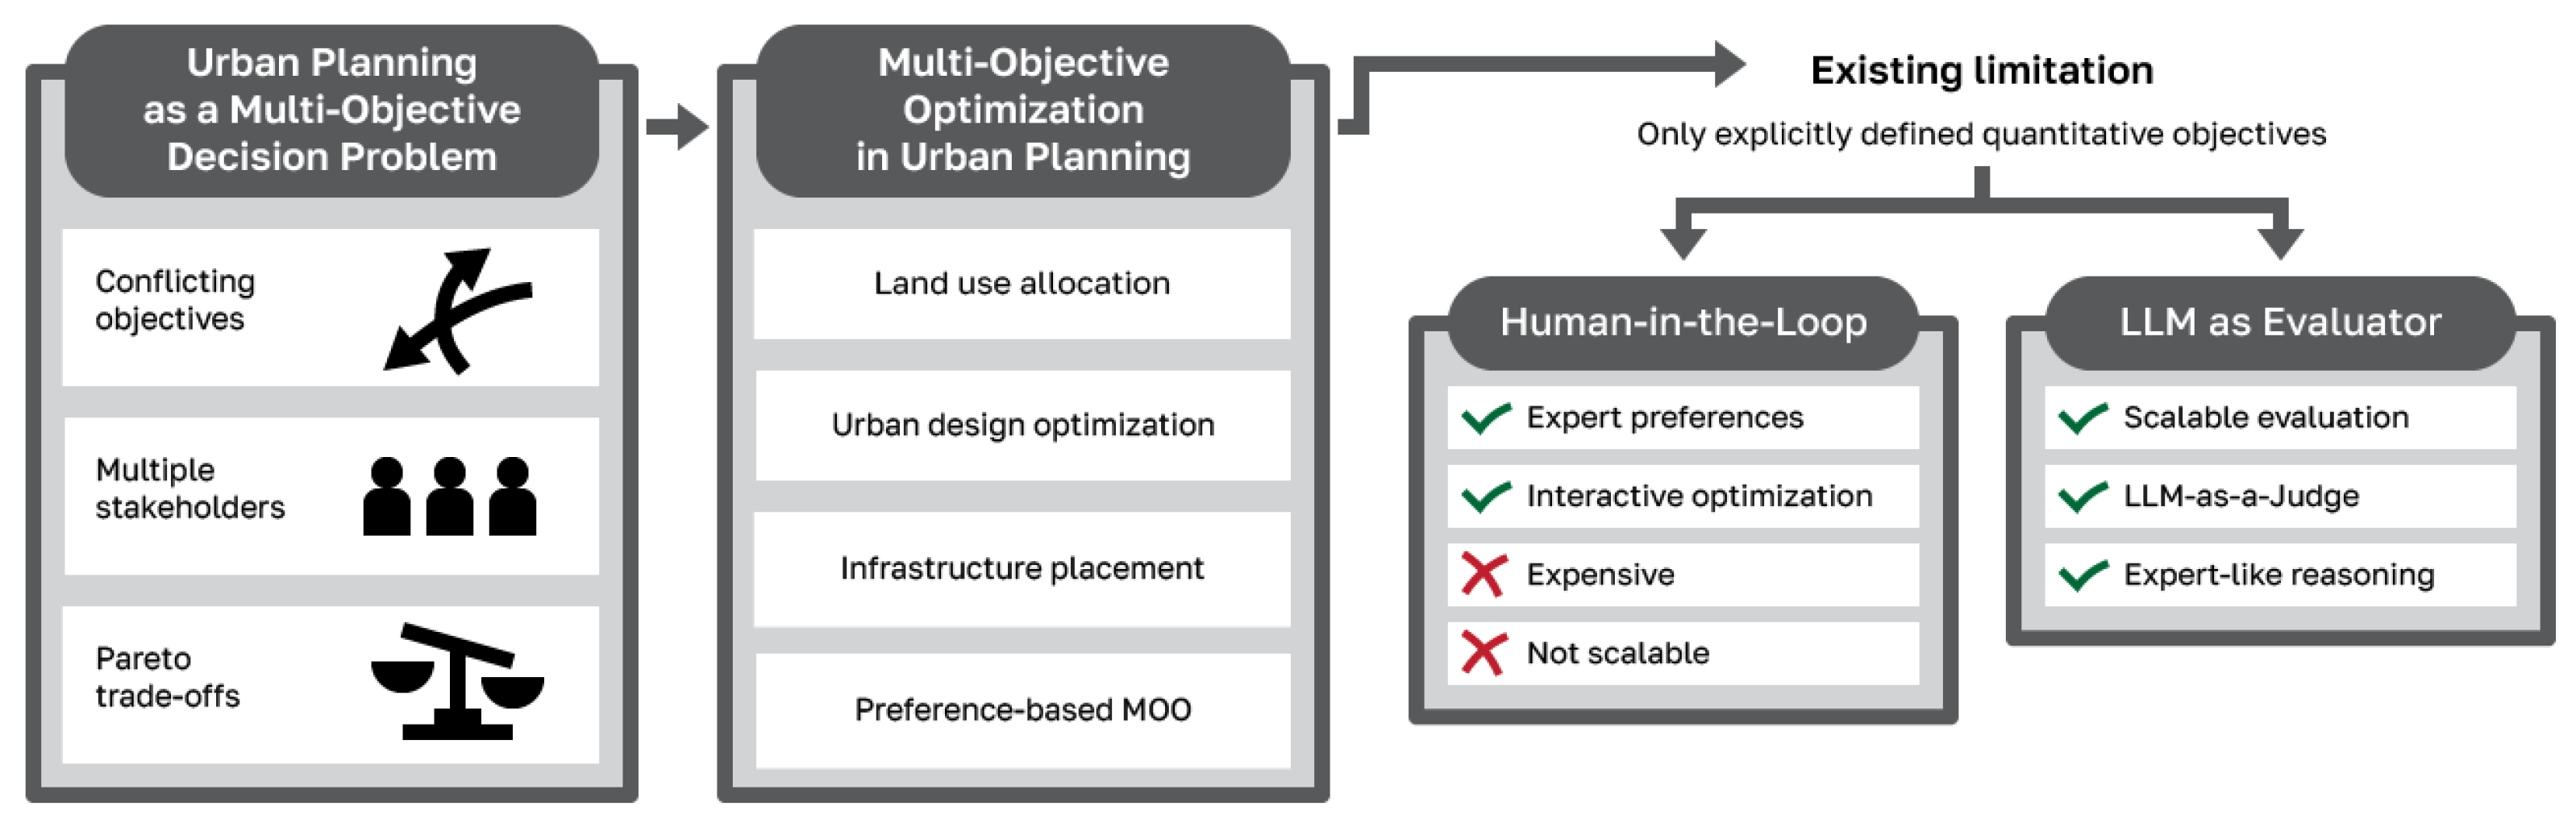
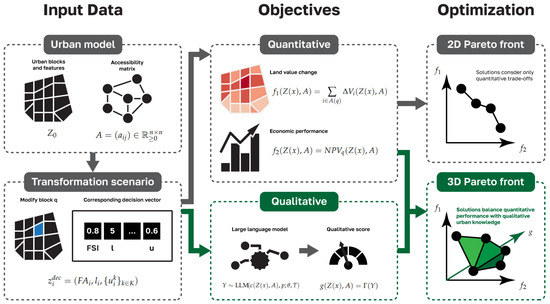
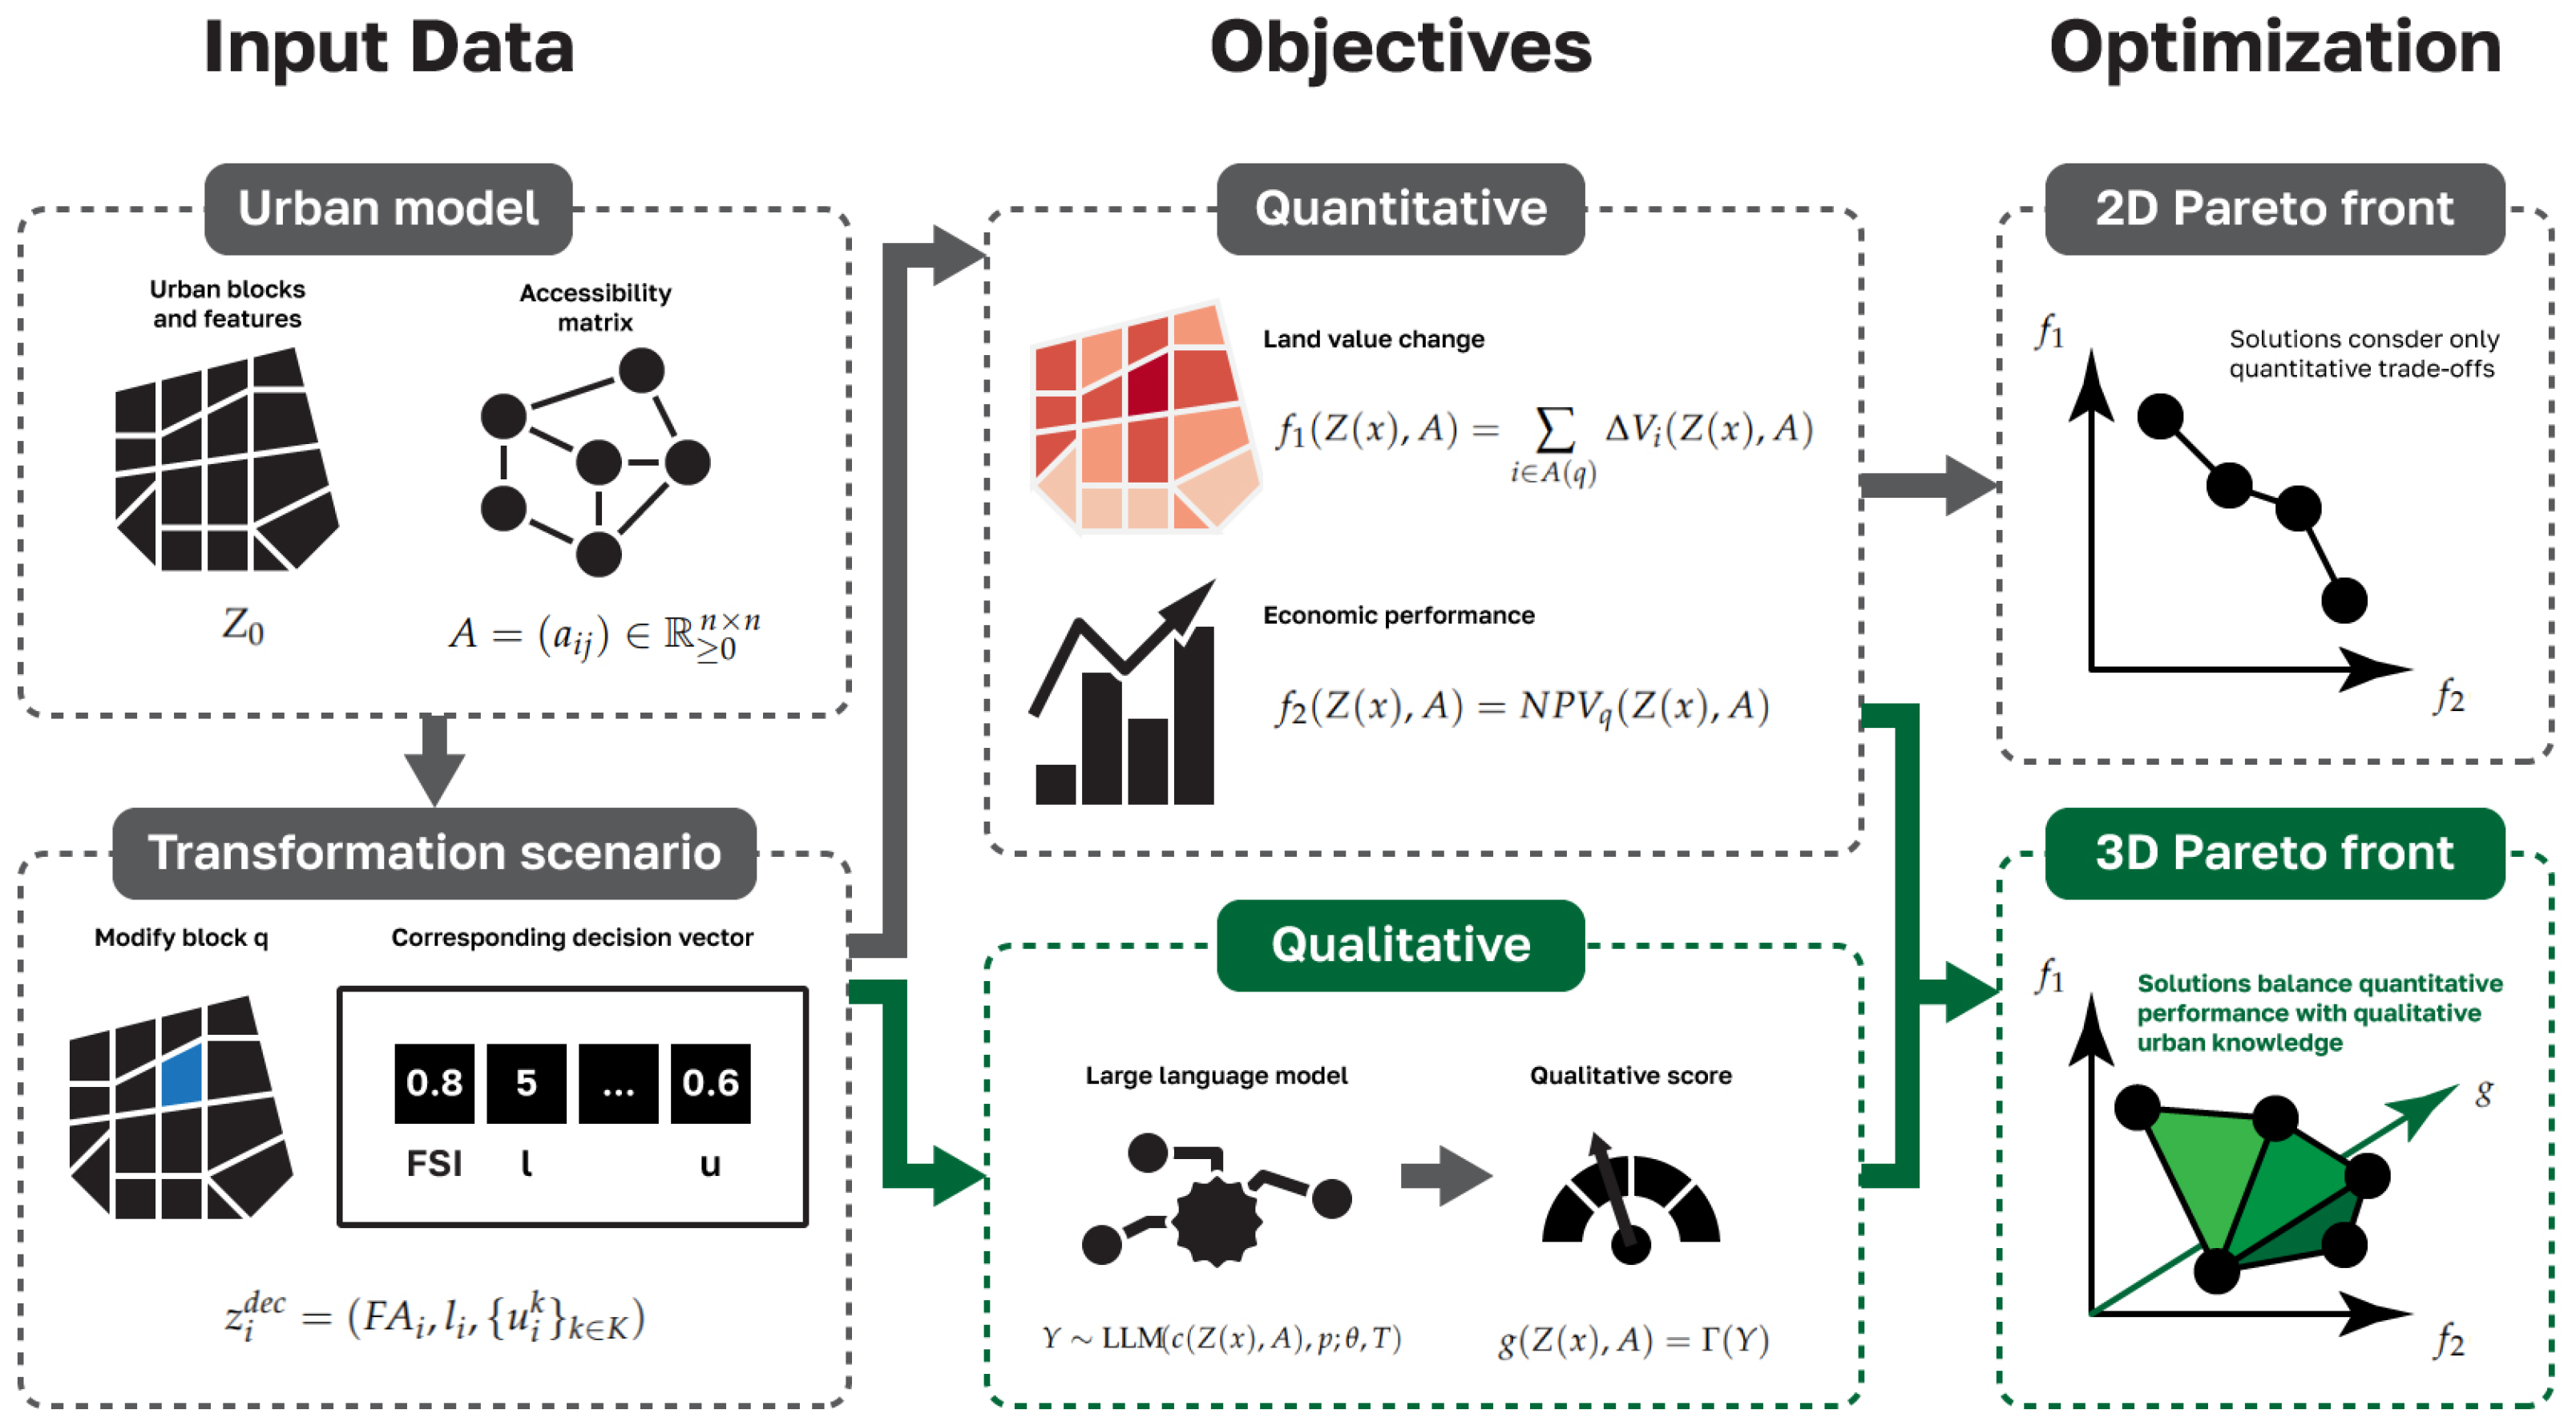
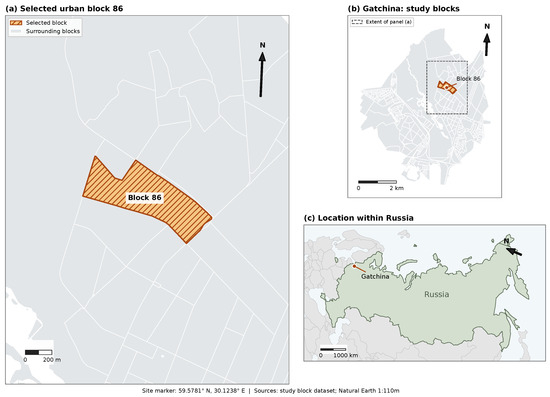
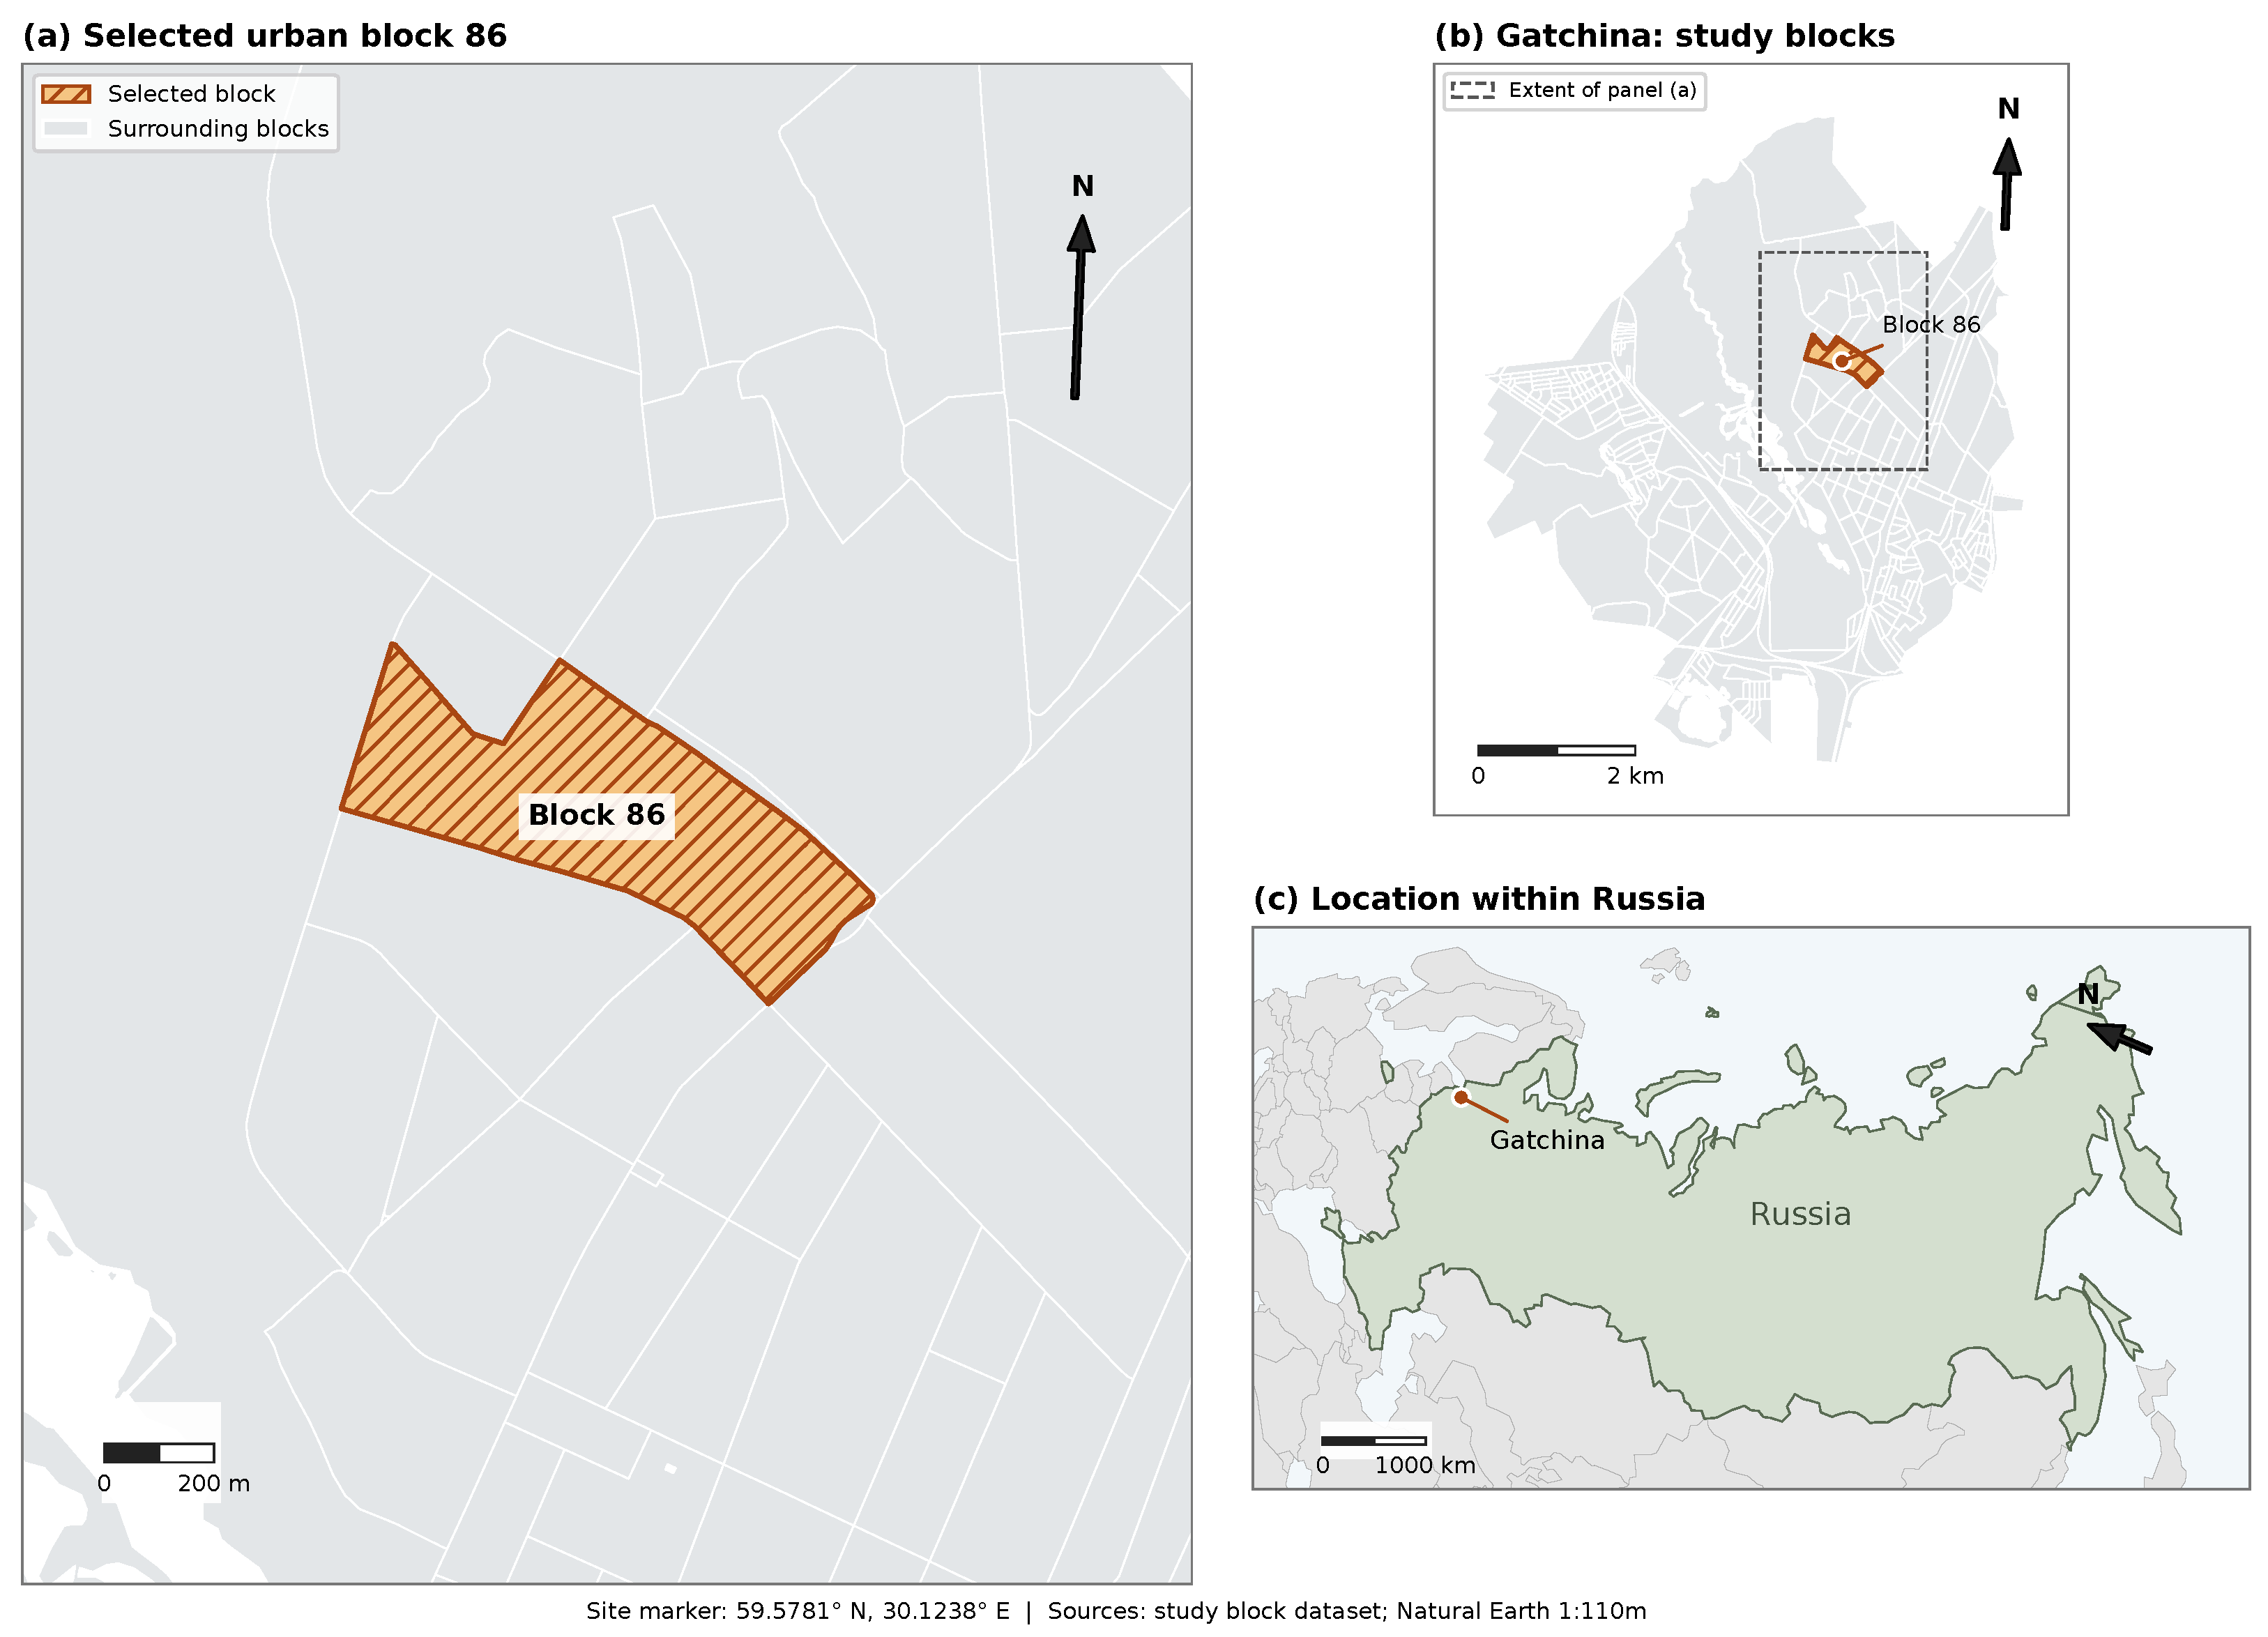
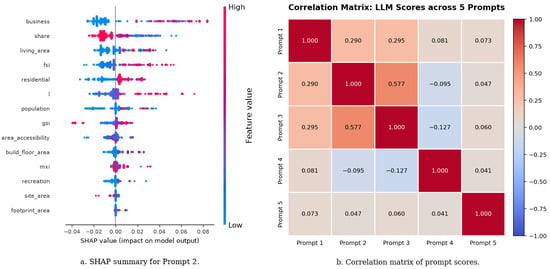
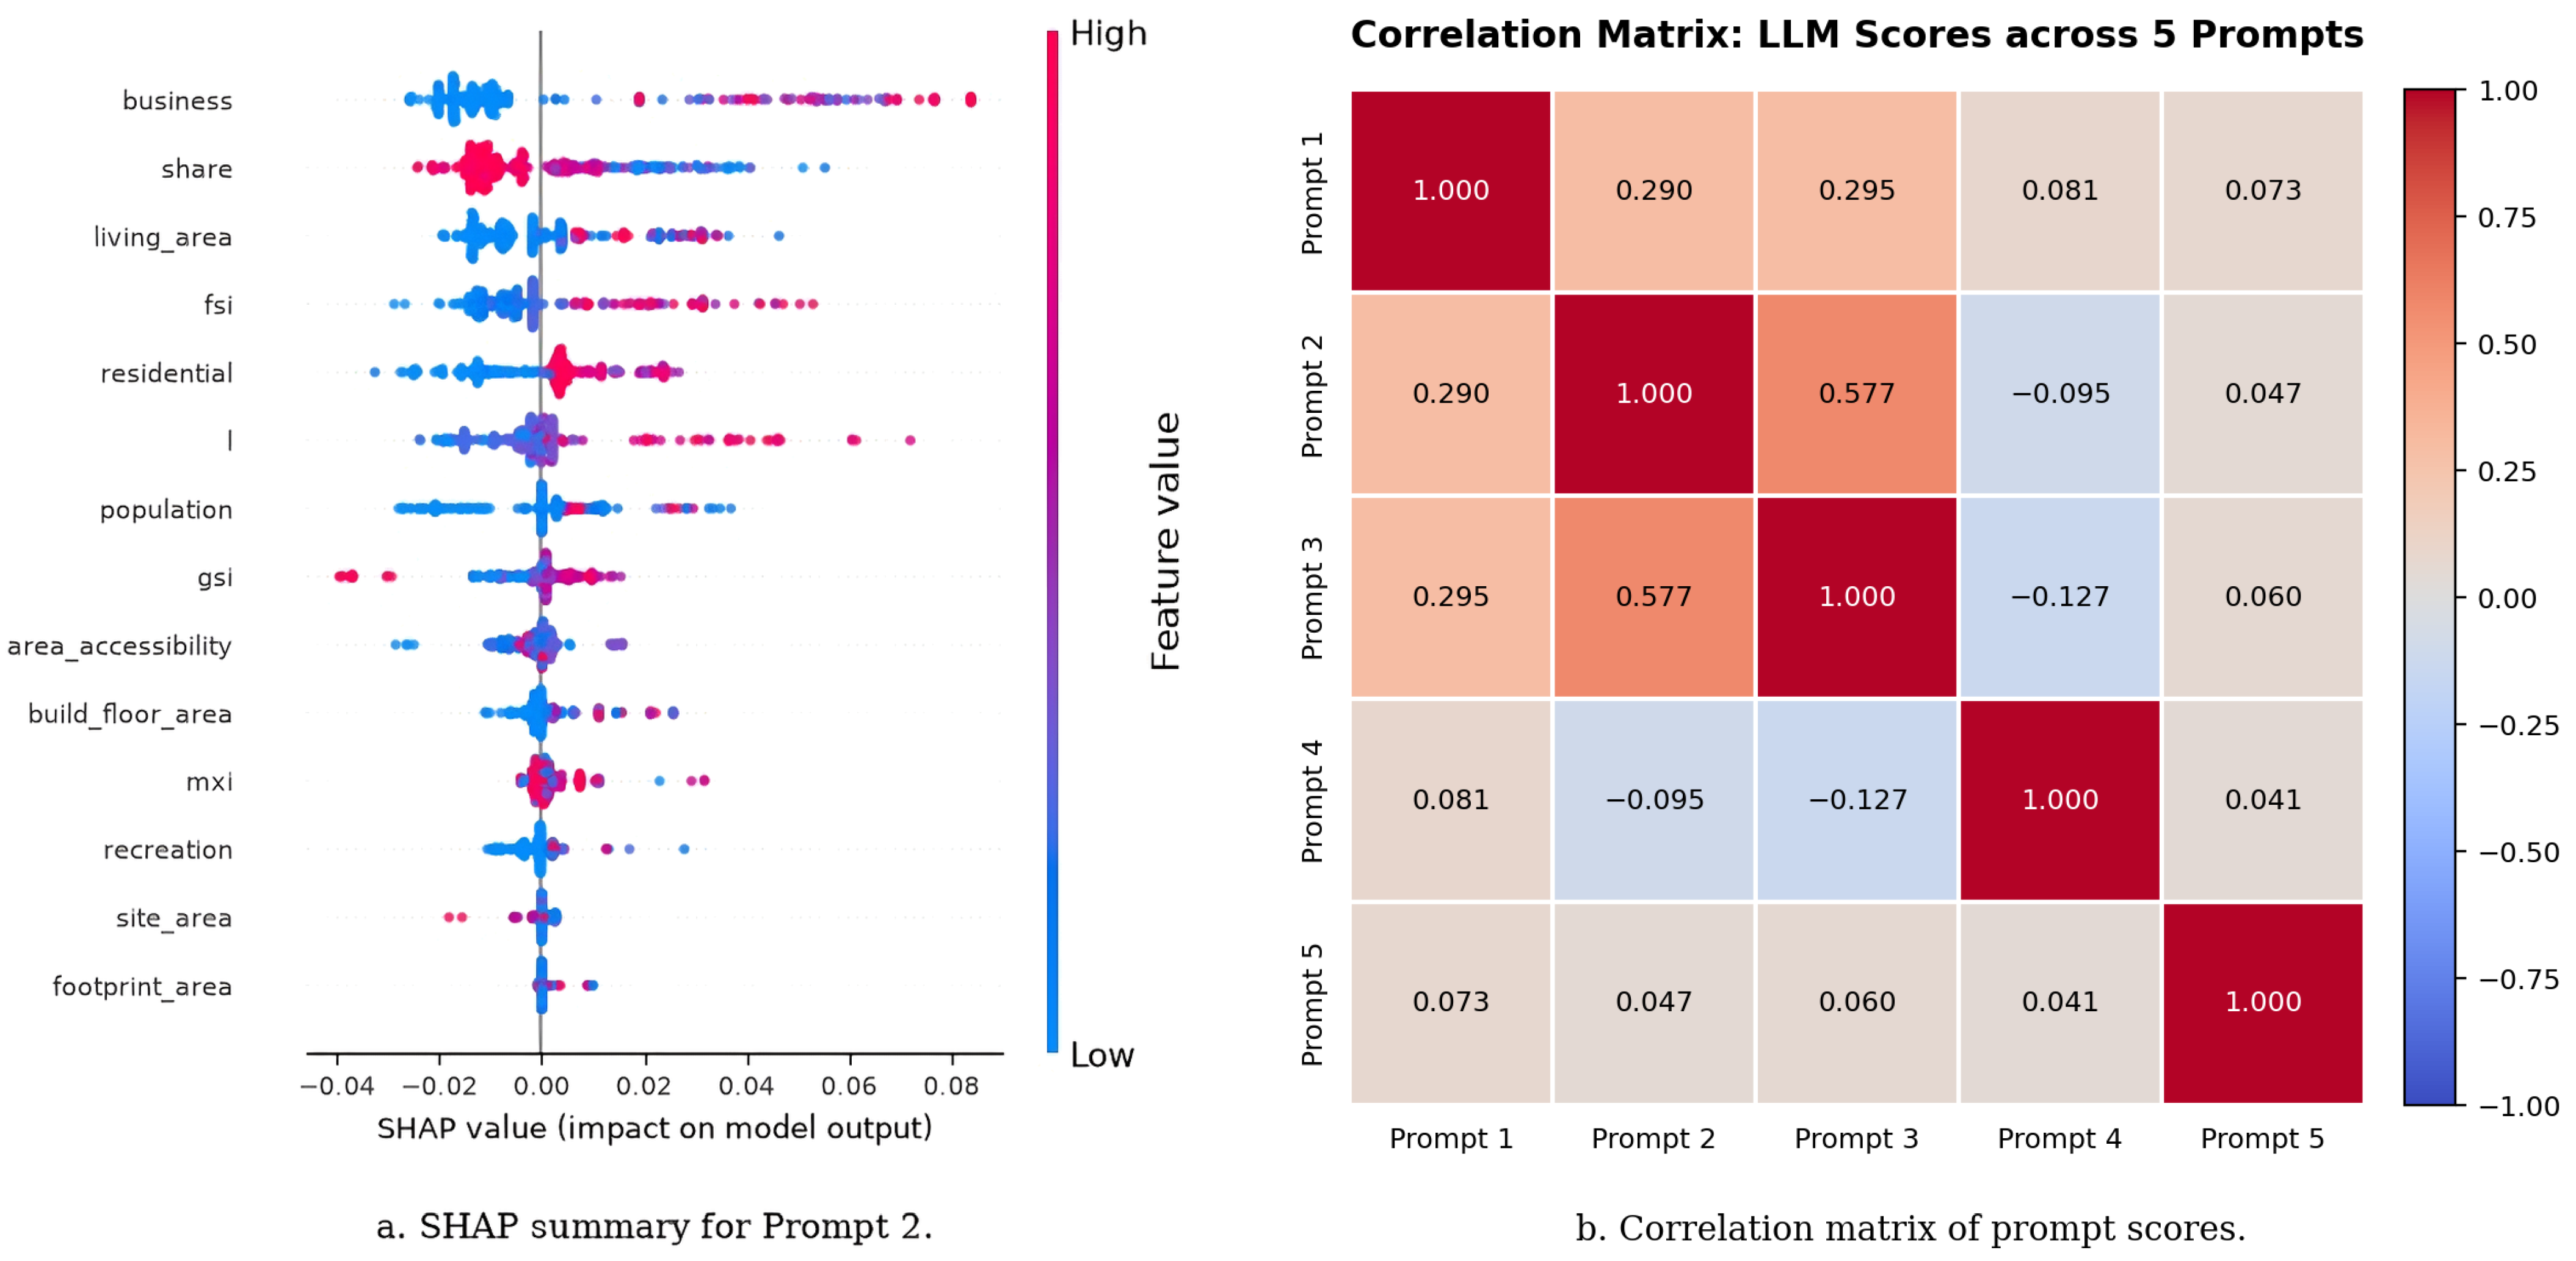
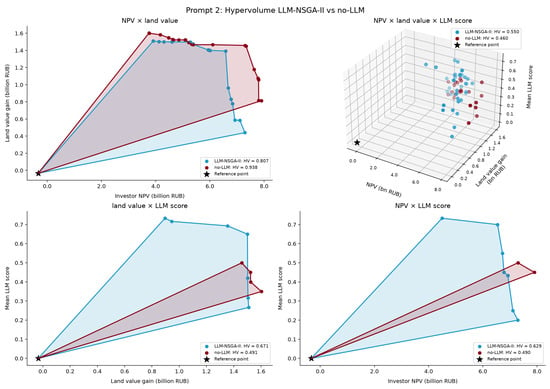
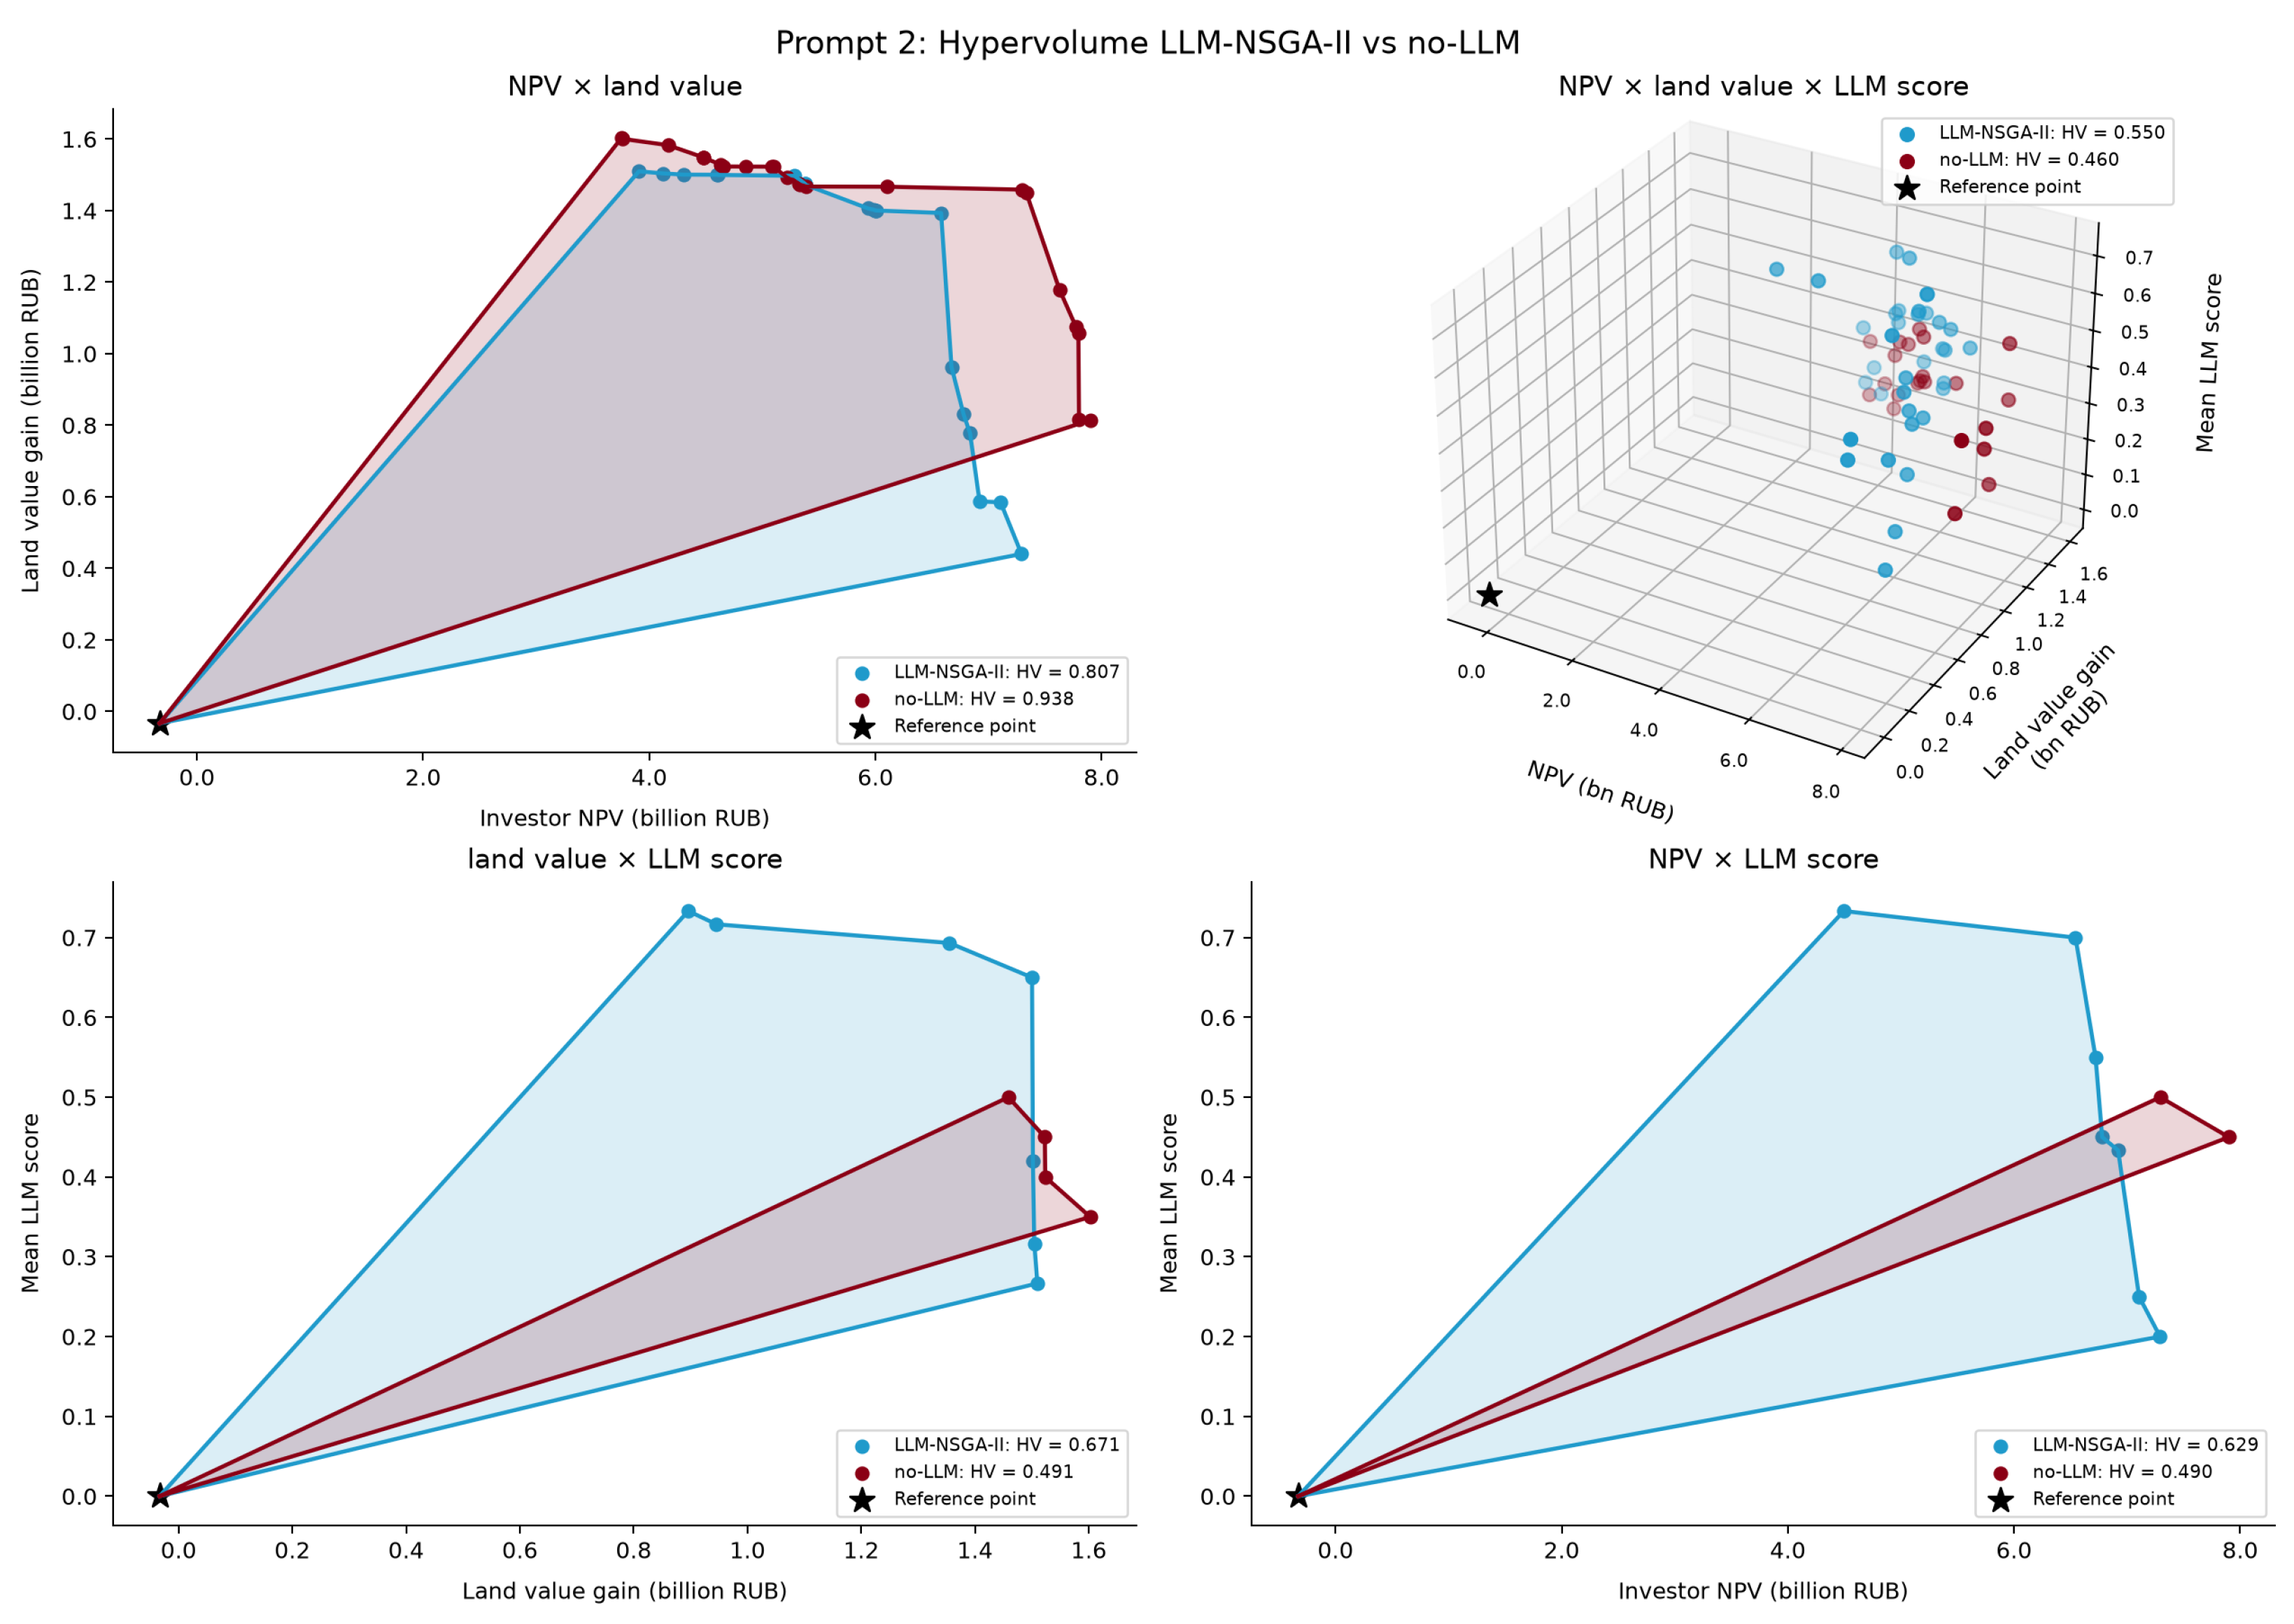
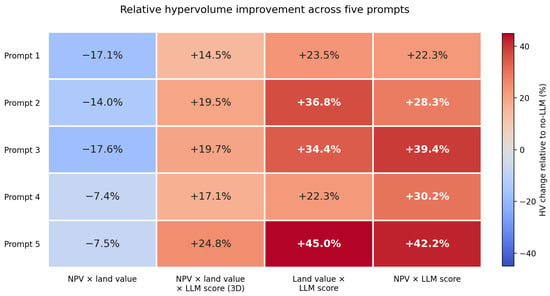
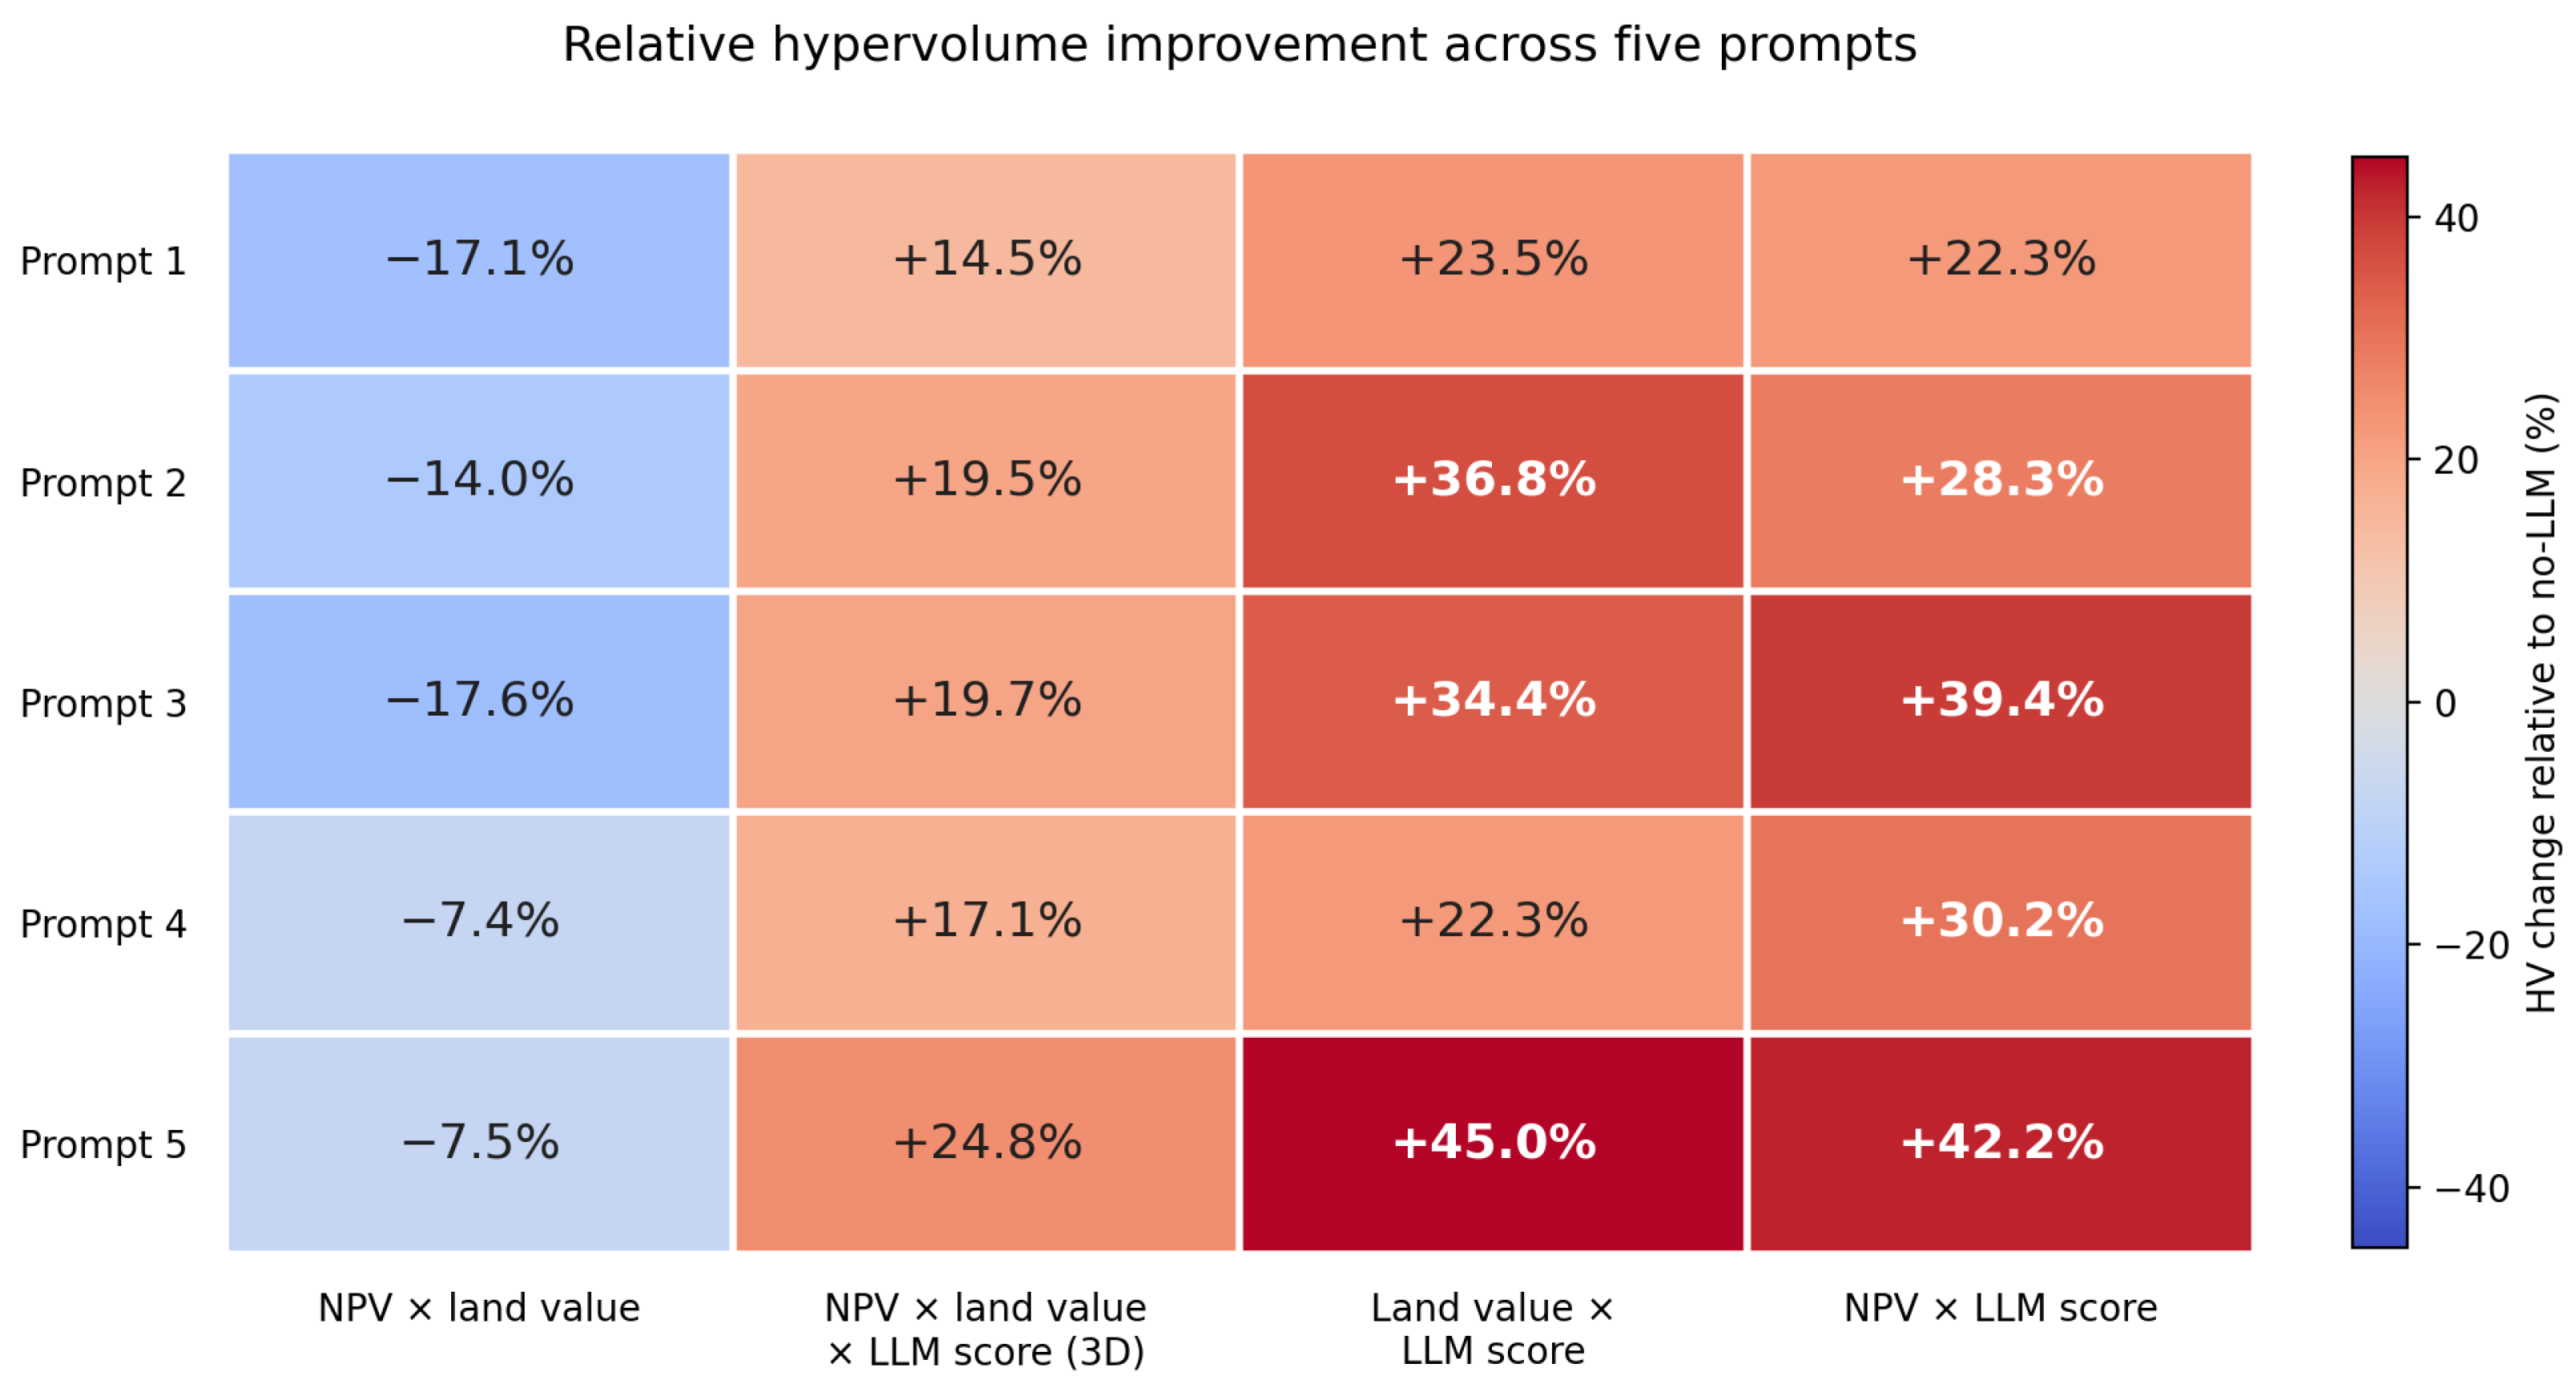
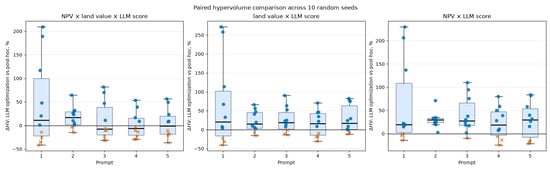
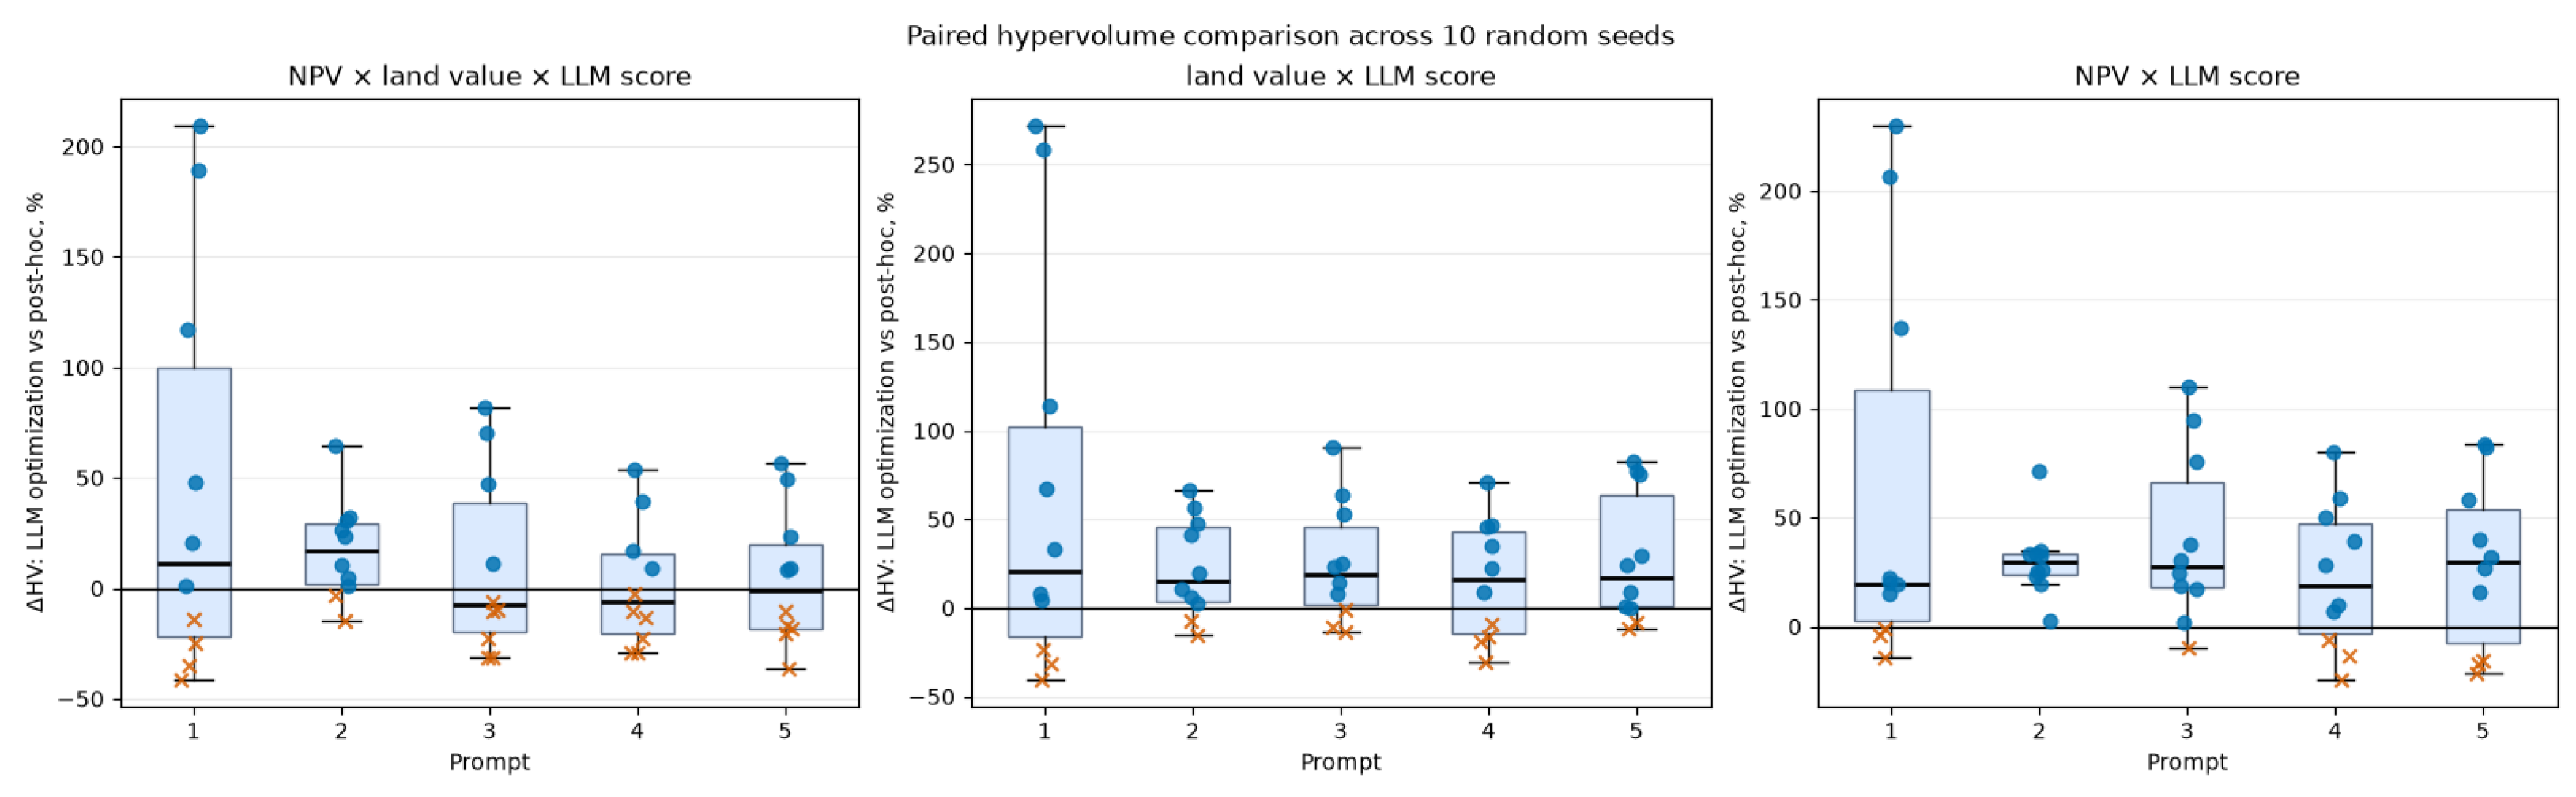
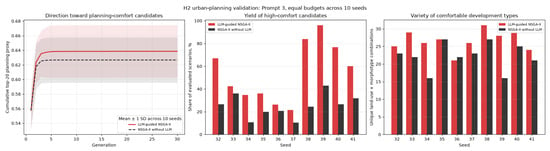
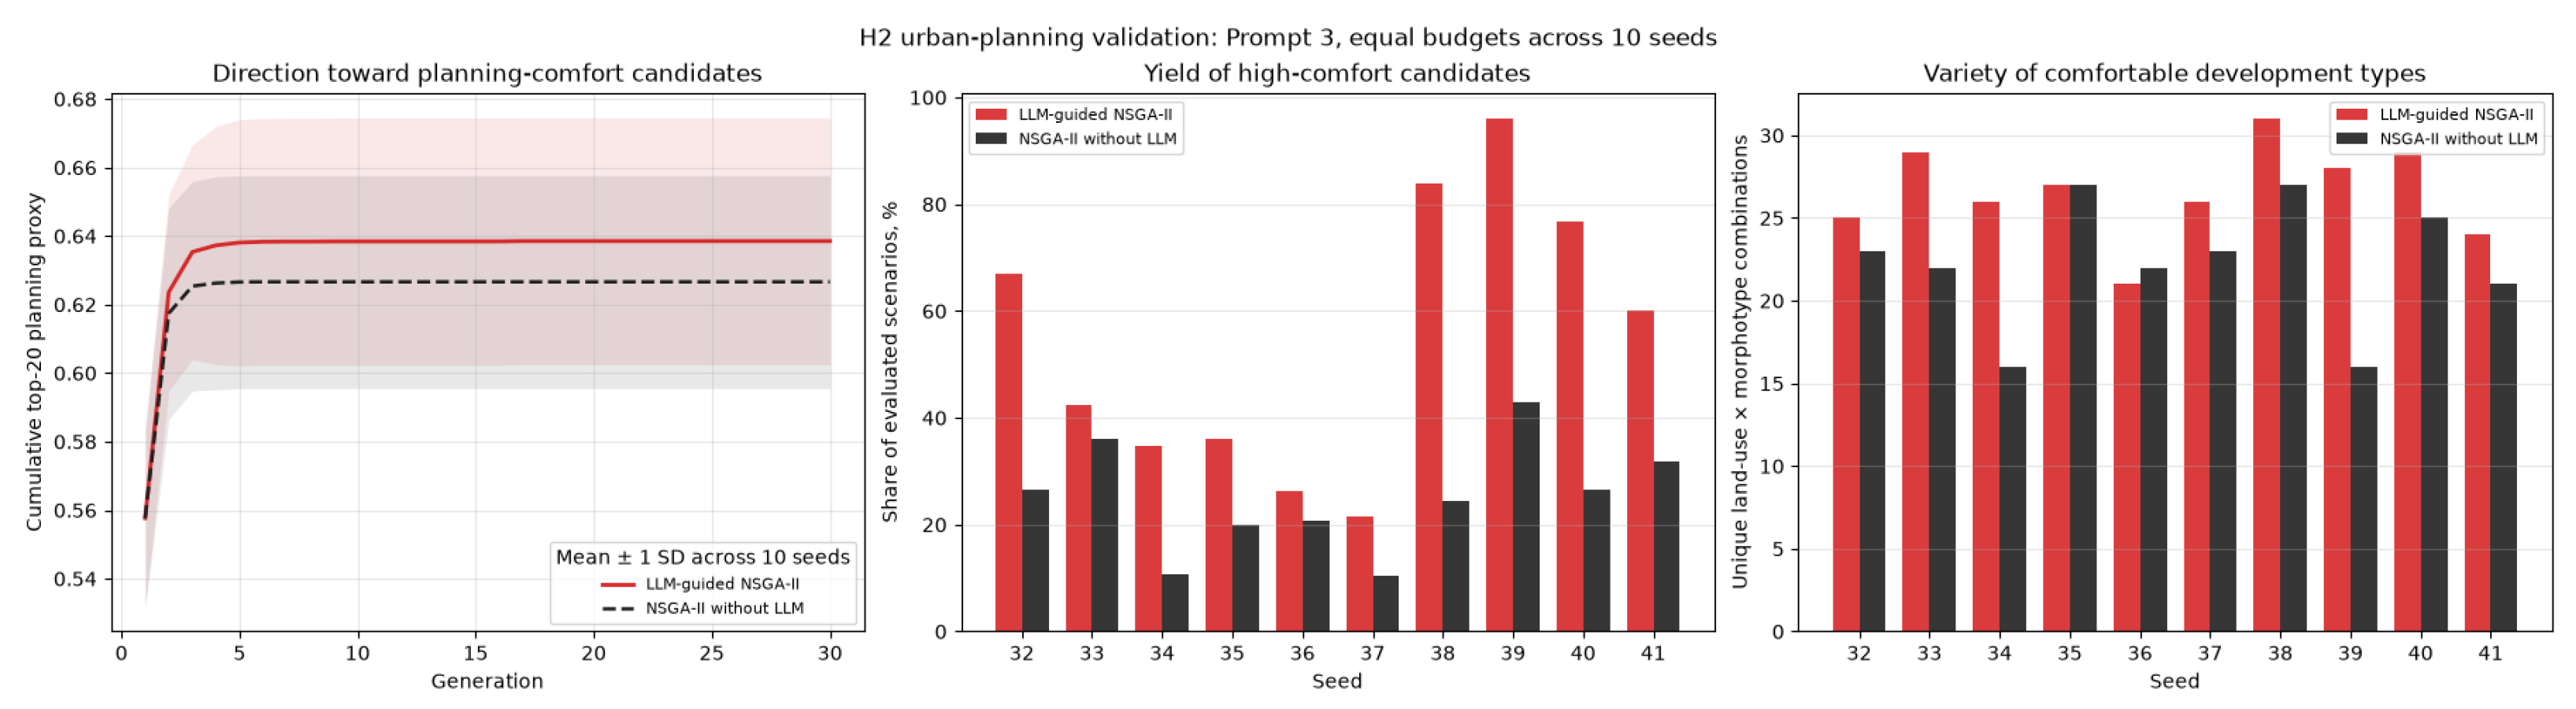
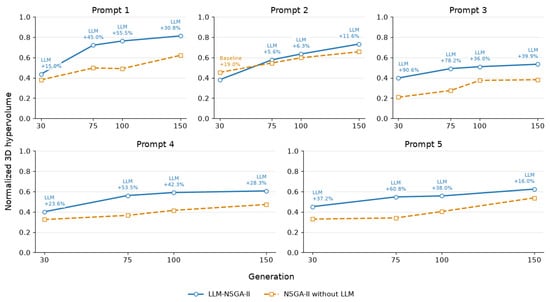
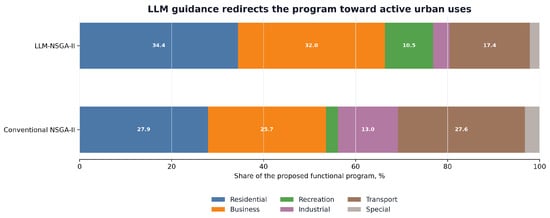
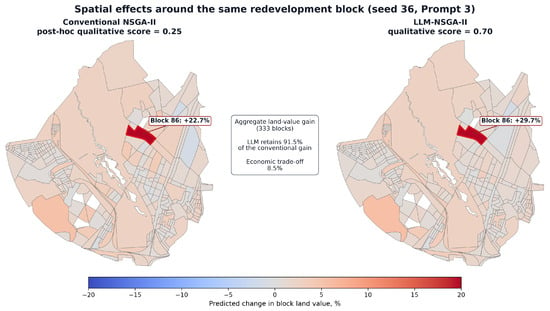
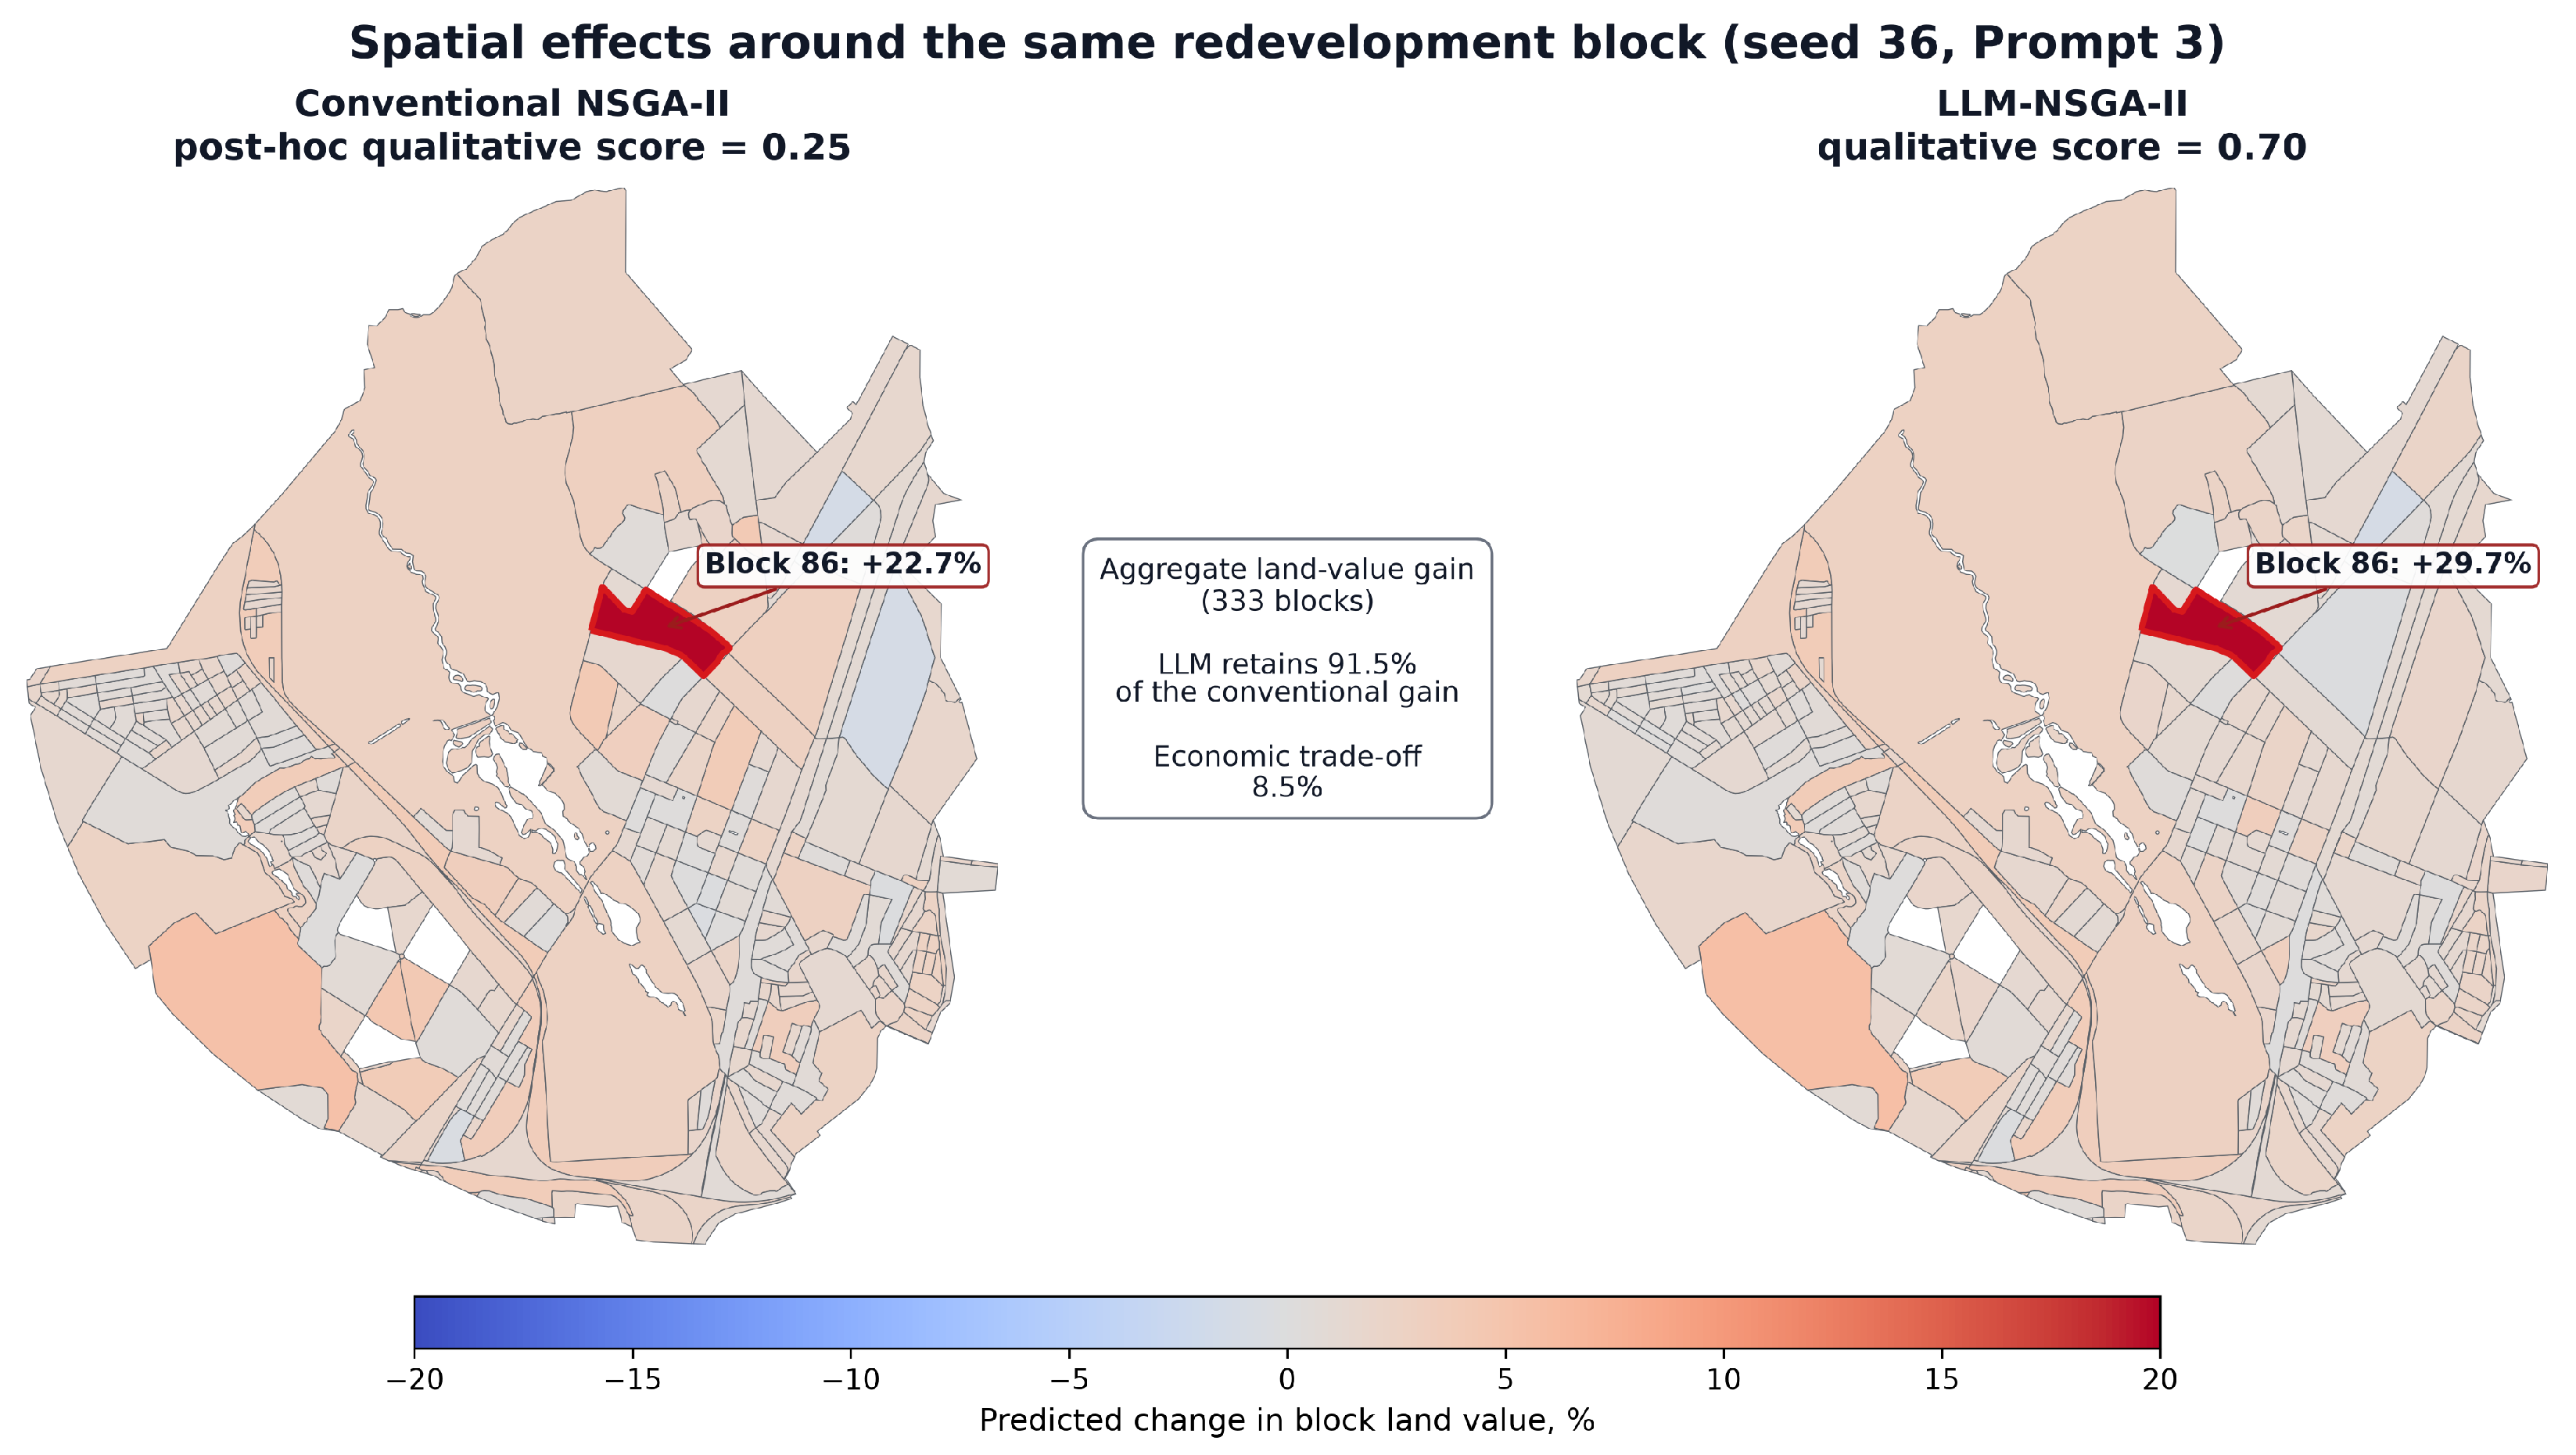

Disclaimer/Publisher’s Note: The statements, opinions and data contained in all publications are solely those of the individual author(s) and contributor(s) and not of MDPI and/or the editor(s). MDPI and/or the editor(s) disclaim responsibility for any injury to people or property resulting from any ideas, methods, instructions or products referred to in the content. |
© 2026 by the authors. Licensee MDPI, Basel, Switzerland. This article is an open access article distributed under the terms and conditions of the Creative Commons Attribution (CC BY) license.