


Abstract
With the advancement in voice-communication-based human–machine interface technology in smart home devices, the ability to decompose the received speech signal into a signal of interest and an interference component has emerged as a key requirement for their successful operation. These devices perform their tasks in real time based on the received commands, and their effectiveness is limited when there is a lot of ambient noise in the area in which they operate. Most real-time speech enhancement algorithms do not perform adequately well in the presence of high amounts of noise (i.e., low input-signal-to-noise ratio). In this manuscript, we propose a speech enhancement framework to help these algorithms in situations when the noise level in the received signal is high. The proposed framework performs noise suppression in the frequency domain by generating an approximation of the noisy signals’ short-time Fourier transform, which is then used by the speech enhancement algorithms to recover the underlying clean signal. This approximation is performed by using the proposed block principal component analysis (Block-PCA) algorithm. To illustrate efficacy of the proposed framework, we present a detailed performance evaluation under different noise levels and noise types, highlighting the effectiveness of the proposed framework. Moreover, the proposed method can be used in conjunction with any speech enhancement algorithm to improve its performance under moderate to high noise scenarios.
1. Introduction
With the widespread acceptance of smart home devices and wireless networks enabled by voice-communication-based human–machine interface technologies, the need to improve the intelligibility and overall quality of the speech signal has become indispensable. The very first step in such voice-communication-based devices is to extract the signal/voice of interest from the noise-contaminated received signal [1]. The contamination could consist of background noise, echoes, acoustic reverberation, or speech-like interference [1]. This is where speech enhancement algorithms can help. The goal of such algorithms is to reduce the noise or distortion present in the speech signal, thus improving its overall quality.
The use of multiple recording microphones can help ease the difficulty of speech enhancement. However, in the case of small-scale devices, such as hearing aids, size and cost limitations can hinder the inclusion of multiple microphones. Similarly, pre-recorded single-channel audio streams cannot benefit from these techniques either. As a result, single-channel speech enhancement techniques are employed in the pre-processing step in low-cost and small-scale devices. These techniques perform either noise estimation or signal estimation (or both) to infer the clean signal from a noisy observation. In [2,3], voice activity detectors (VAD) are used to approximate frames of signal where the speaker is silent, and these frames are then used to estimate the noise spectrum. Once the noise estimate is obtained, its spectrum is subtracted from the noisy spectrum, thus reducing the overall noise level. These techniques, however, inherit the shortcomings associated with VAD usage, that is, they may fail if the frame size of the input signal is large or if the signal-to-noise ratio (SNR) is low. Authors in [4] have proposed a backward blind source separation structure implemented in subband domain using a least mean square algorithm, which leads to a reduction in speech distortion while maintaining speech intelligibility. In [5], the authors have proposed a hybrid technique with the combination of two-step, harmonic regeneration noise reduction and a comb filter. The proposed technique is shown to achieve better speech enhancement results in terms of general performance metrics such as mean opinion score (MOS), mean square error (MSE), average segmental SNR (ASSNR), perceptual evaluation of speech quality (PESQ), and diagnostic rhyme test (DRT). The authors in [6] propose a semisoft threshold-based speech enhancement algorithm based on noise coefficients determined by Teager energy-operated wavelet packets. In their simulation results, they have been shown to achieve better performance in terms of standard performance metrics such as MOS, MSE, ASSNR, PESQ, and so on.
Similarly, many signal estimation techniques, such as spectral subtraction [7,8,9,10,11], weiner filtering [12,13,14], and minimum mean square error (MMSE) estimation-based methods [15,16,17,18,19,20], have been proposed. Out of these, the spectral subtraction methods are the most computationally efficient. They operate by estimating the noise spectrum from the noisy speech signal and then recovering the clean signal by subtracting the estimated noise spectrum from the noisy one. These methods generally perform well; however, so-called musical noise might appear in their recovered signal. On the other hand, the MMSE-based methods are free from the issue of musical noise. The authors in [15] derive and use a filter using the minimum mean square error–short-time spectral amplitude (MMSE-STSA) estimator based on the cost function minimizing the mean squared error of the short-time amplitude of the spectrum. The authors in [16] use a perceptually motivated cost function minimizing the mean squared error between the logarithmic spectral amplitude of the clean and enhanced speech signal, whereas [17] proposes an adaptive -order MMSE estimator to design a filter. The designed filter is then used to enhance the signal frequencies, leading to a clean speech signal.
Based on our literature review, one key issue with most speech enhancement algorithms is their susceptibility to the input SNR levels. Under moderate to high SNR, their enhancement results are objectively better; however, under low to poor SNR conditions, these methods fail altogether. Here, we consider SNR levels ≤ zero as low and those above zero as medium. For example, most of the papers have reported their experimental results over the input SNR range of −5 dB onwards, as shown in Table 1. The method in [6] does evaluate from −15 dB SNR and show slight improvement as the SNR is improved. However, they only report results on the ‘Car’ noise case from NOIZEUS [21], which is an easy-to-use dataset for speech quality improvement. In this manuscript, we aim to remedy this situation by introducing a pre-processing step implemented in the frequency domain that reduces the overall noise level of the signal, resulting in improvement of SNR. This pre-processed signal can then be passed to any other speech enhancement algorithms as usual, leading to superior results. The pre-processing step involves a variation of the principal component analysis (PCA) technique, termed Block-PCA, which operates on blocks of the short-time Fourier transform (STFT) of the noisy signal to generate an STFT approximation by suppressing the noise level present in the signal.
Table 1.
Publications with performance evaluations on input SNR.
Principal component analysis (PCA) is one of the most utilized feature extraction and dimensionality reduction techniques in all of data science and engineering, particularly in image and signal processing, pattern extraction and recognition, and machine learning, as well as other exploratory data analysis [26,27]. It has been extensively used in various applications, for example, image noise estimation [28], denoising [29], speech enhancement [25,30,31], video watermarking [32], video and image classification [33], analysis of functional magnetic resonance imaging data [34,35], analysis of local growth policy in the perspective of institutional governance [36], and face recognition [37].
Consider a dataset consisting of p-dimensional variables sampled from an unknown p-dimensional subspace. For such a dataset, PCA can be used to generate an orthogonal projection onto a lower-dimensional subspace, typically named principal subspace [38], which can explain most of the variance (statistical information) of the data. These orthogonal basis vectors spanning the principal subspace are called principal loading vectors. Similarly, the data projection onto these principal loading vectors are called principal components (PC).
The basis of PCA-based dimensionality reduction is that the first few principal components tend to capture most of the variability of the data. Thus, unless the data is sampled from a homoscedastic multivariate distribution, the principal components spanning the subspace where the data variance is minimal can be discarded from the overall basis without much loss of information. A similar methodology can also be used for noise suppression [29], that is, noise contamination dominates the signals coming from the subspace with low variance as compared to signals spanned by the principal components explaining high variance. Thus, by removing those principal components which span low-variance-signal subspace, we can essentially suppress the overall noise level present in the data.
The novelty of the proposed method stems from its use case, that is, we have proposed a pre-processing method using Block-PCA that can be used to improve the input SNR by reducing the noise floor present in the signal of interest. The noise-suppressed signal can then be forwarded to any speech enhancement algorithms as usual, without having to modify these algorithms. By doing so, our method essentially enables these algorithms to perform well even in high-noise scenarios, as compared to the baseline (i.e., using these algorithms without our proposed pre-processing step).
The rest of the manuscript is organized as follows. In Section 2, we provide a brief overview of PCA and discuss our motivation behind using PCA as our noise suppression technique. A variant of PCA, termed Block-PCA, is introduced in Section 3, followed by an outline of the proposed speech enhancement framework in Section 4. The performance analysis is presented in Section 5, with the concluding remarks following in Section 6.
2. Background and Motivation
2.1. Principal Component Analysis
Consider a signal matrix of rank , with n observations and p variables. Let denote the th row of Y, for with zero mean, and let be the positive definite covariance matrix of size estimated from the data itself. Eigen-value decomposition of the matrix (Gram matrix) is given by:
where are the eigenvalues, and for are the corresponding eigenvectors of . The dimensionality of the data can then be reduced by replacing the original data with , where . The matrix V is an orthonormal matrix, and each column vector is the respective principal component. The vectors are obtained by solving the following optimization problem:
The vector , here, is the jth principal loading vector, the data projection is the jth principal component, and the operator var(.) computes the variance. Each principal component captures percent of the total variance [38]. The strength of PCA lies in its ability to provide a relatively simple explanation of the underlying data structure if a small number of PCs can be used to explain most of the data variance.
A simple, yet effective, way to compute PCA is to use the singular value decomposition (SVD) method. The SVD algorithm can be used to decompose a data matrix Y into three factor matrices given by:
where , , and . In the above decomposition, matrix V contains the right singular vectors (the PC loadings), contains left singular vectors, and is a diagonal matrix with ordered singular values . The PC vectors of are present in the matrix . Moreover, U and V are unitary, that is, . The SVD of a matrix Y provides its closest rank-q matrix approximation , where the closeness between Y and is quantified by the squared Frobenius norm of their difference, that is, .
2.2. Motivation
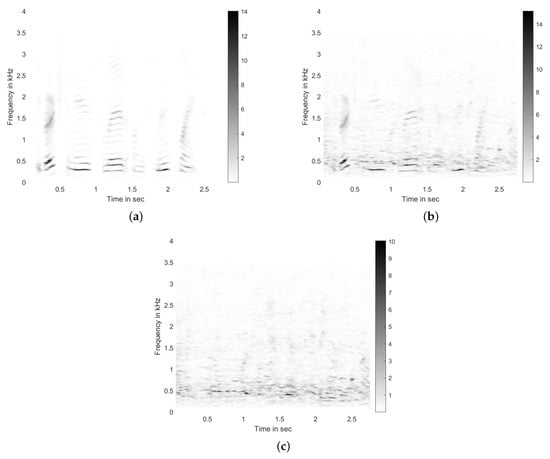
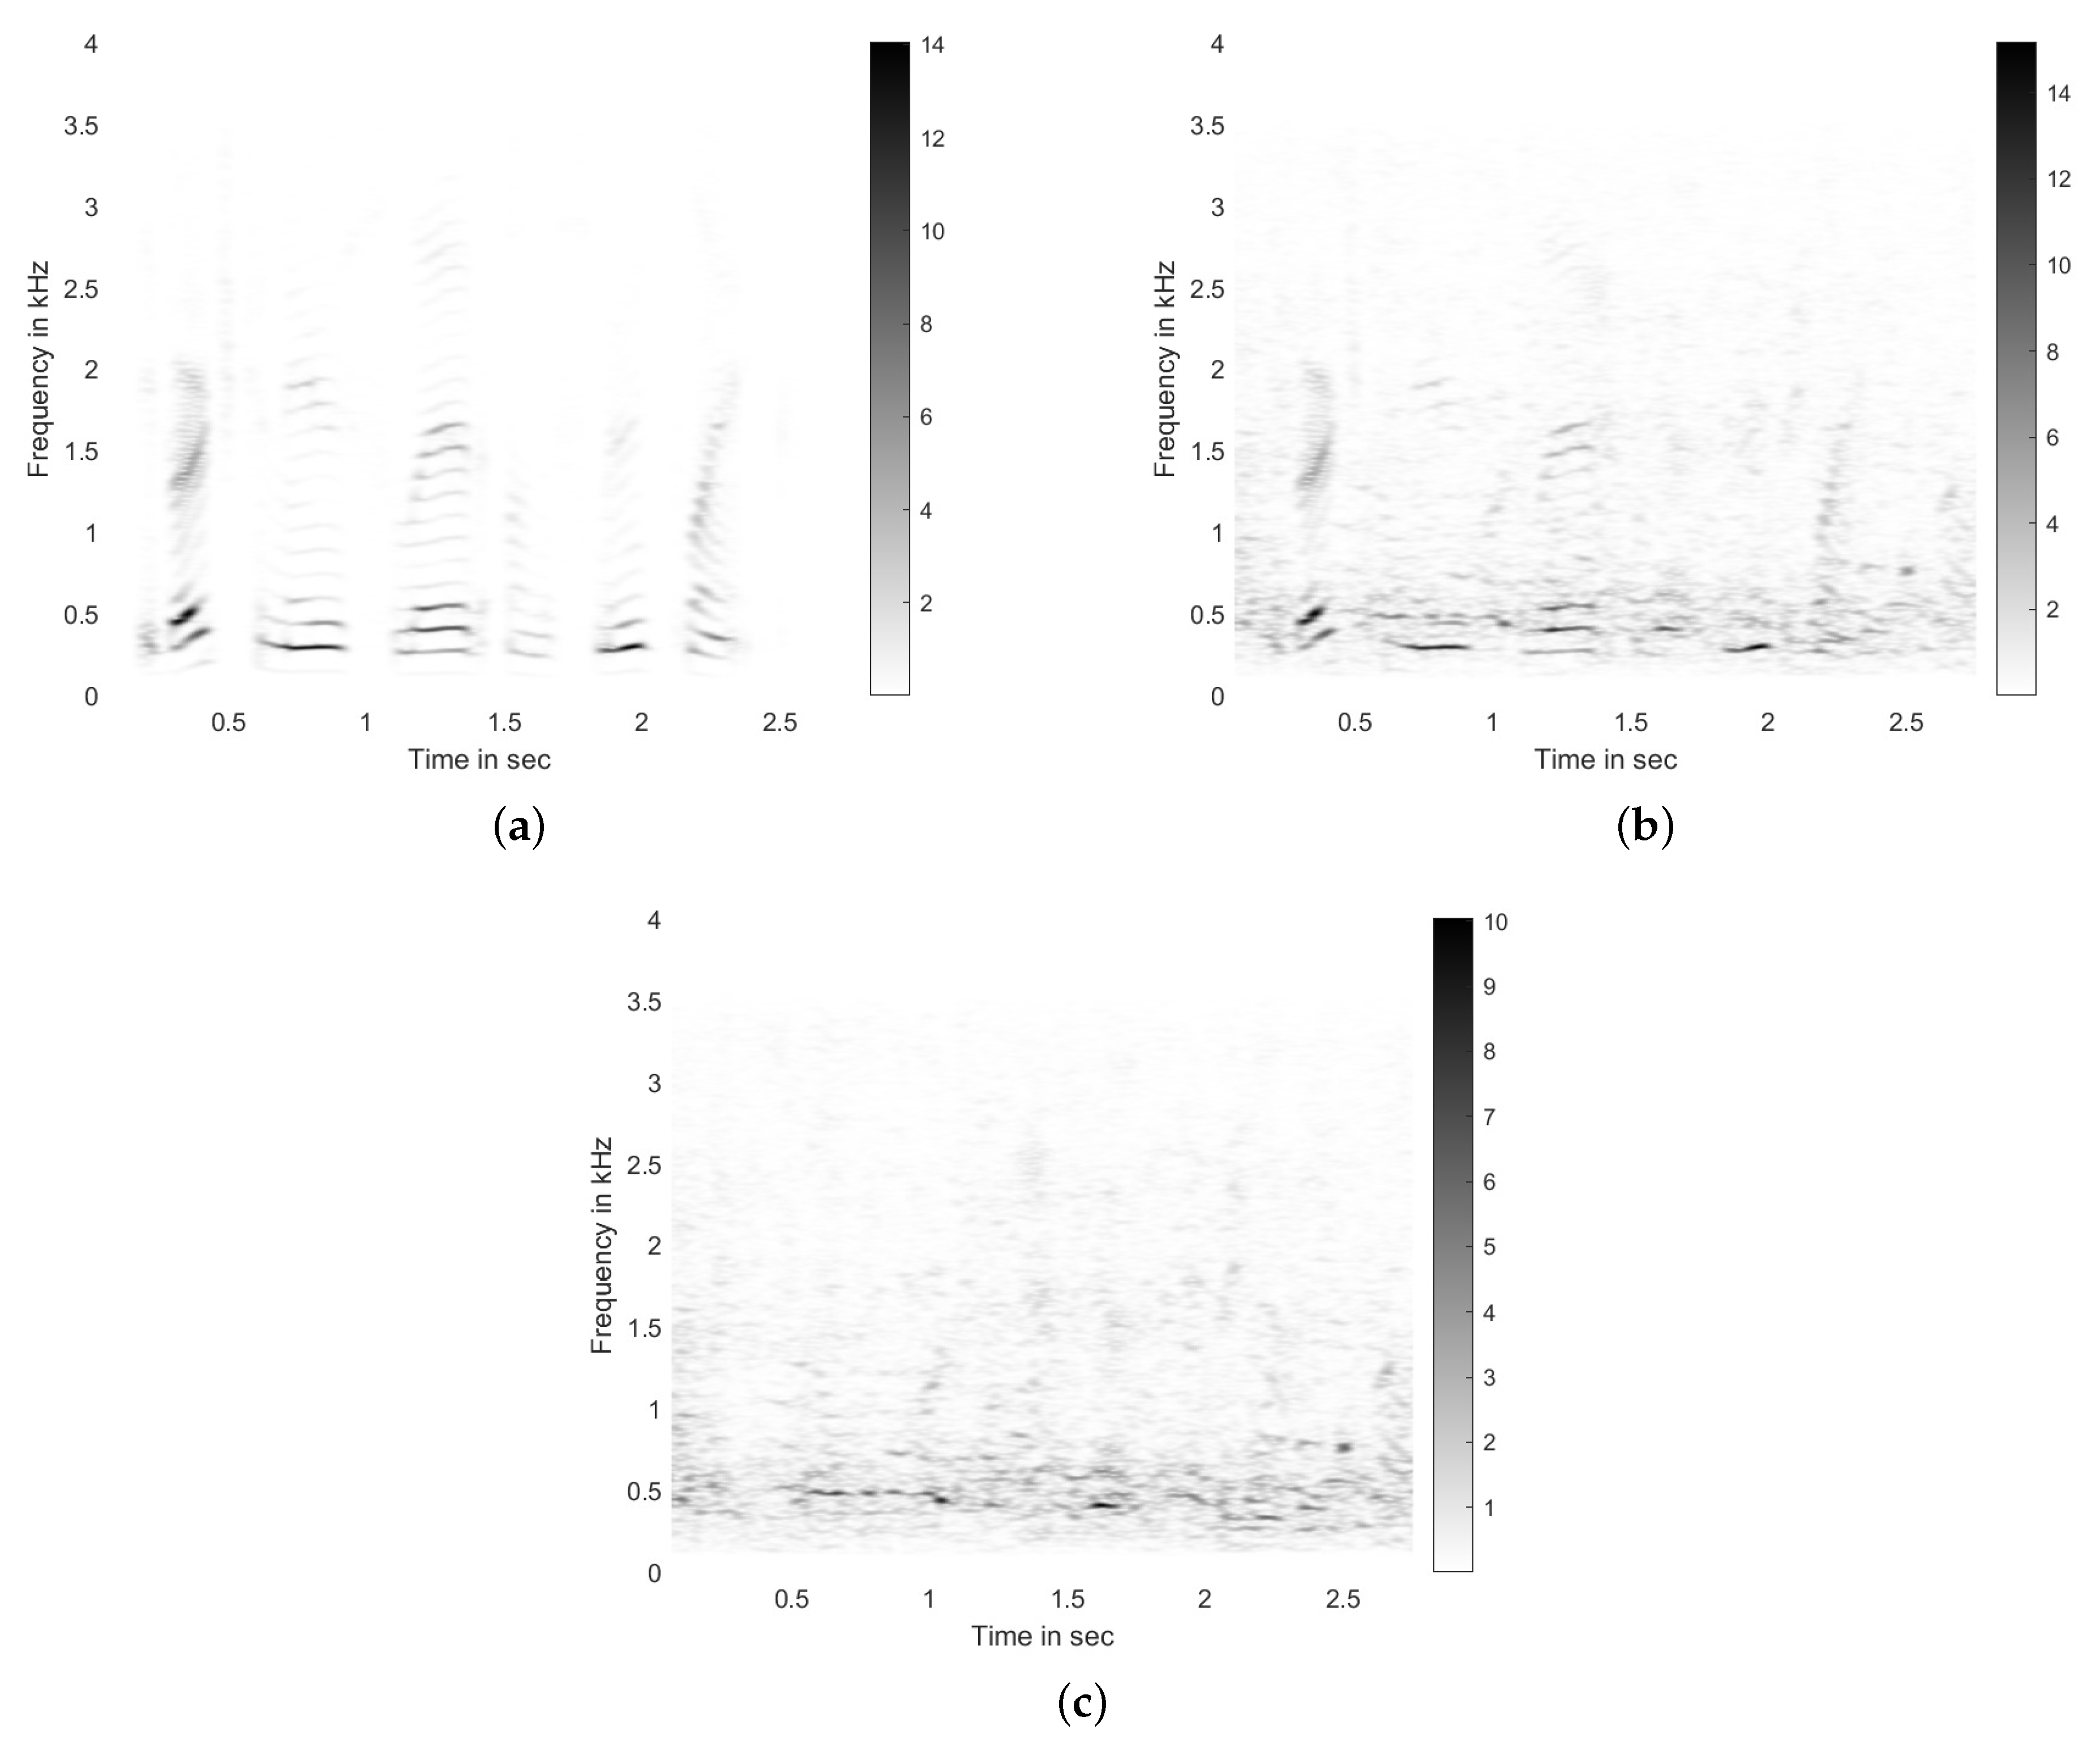
In this section, we discuss our motivation for using the PCA method for noise suppression. The idea becomes very intuitive if we can visualize the learned principal components, the singular values, and their respective PC loadings. Thus, to do this, let s(n) be a single-channel clean time-domain speech signal, y(n) be the noise-contaminated signal with a specific signal-to-noise ratio, and r(n) be the corresponding noisy signal. Further assume that S(k,m), Y(k,m), and R(k,m) are their respective short-time Fourier transform (STFT) matrices with size . The magnitude of these STFTs are shown in Figure 1. To generate these STFTs, we used Hamming window of size 1024, signal overlap of 64 samples (to obtain a dense matrix for visualization), and fast Fourier transform of size 2048. The sampling rate of the time-domain signal was samples/s, leading to Hz. The signal-to-noise ratio was kept at 0 dB. The speech signal contained the voice of a male speaker saying “The birch canoe slid on the smooth planks”, acquired from the NOIZEUS corpus [21]. The noise (interference) signal used here was ‘Babble’ noise, also from the NOIZEUS corpus. We show these STFTs in Figure 1.
Figure 1.
Magnitudes of short-time Fourier transforms of (a) clean signal s(n), (b) noise-contaminated signal y(n) with 0 dB signal-to-noise ratio, and (c) noise r(n).
By inspecting the STFT of the clean signal (shown in Figure 1a), we can infer that most of the signal energy is concentrated in the 300–600 Hz range, and silence blocks are clearly visible as well. On the other hand, the noise energy (shown in Figure 1c) has a good spread over the range of 300–3500 Hz, with significant energy between 300–600 Hz range as well. Moreover, its presence is consistent over the entire duration of the signal. The noisy signal is generated by combining the clean and noise signals in such a way as to keep SNR at 0 dB. The STFT corresponding to this noisy signal is given in Figure 1b.
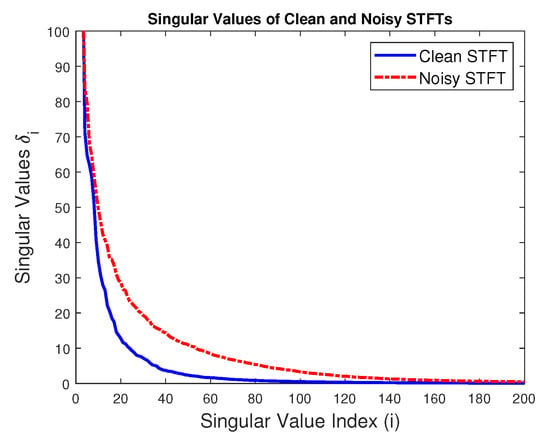
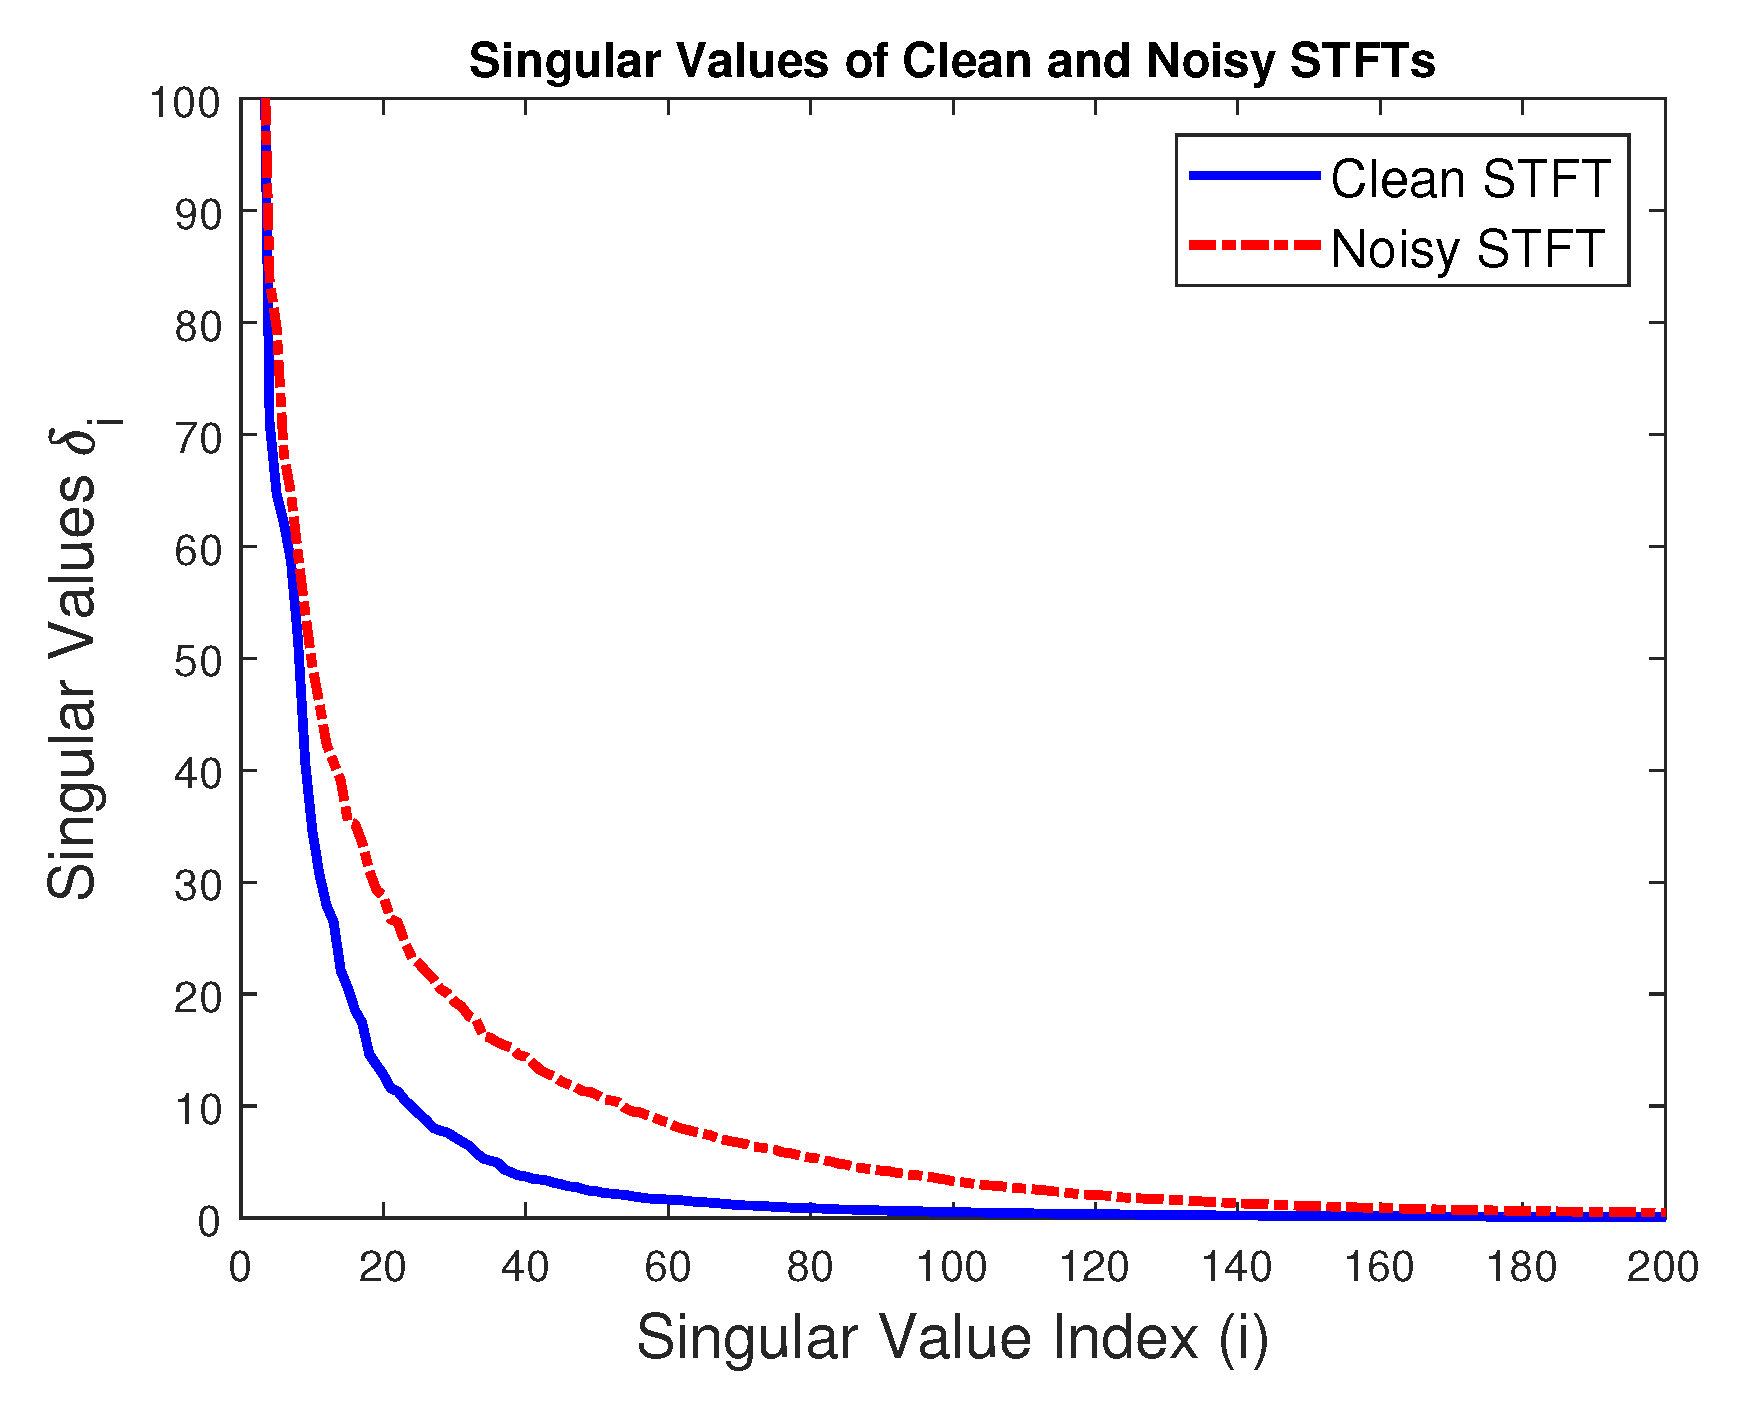
Now let X be the magnitude of an STFT of interest (S or Y). We take the SVD of X according to (3). The resulting singular values are , principal components are , and PC loadings are . To visualize the spread of variance over various PCs, we show the first 200 (out of 337) singular values in Figure 2. From the slope of both curves, we can see that most of the data variance is captured by the few initial PCs. For the noise-free case, 20–40, and for the noisy case, 60–80 PCs are capturing most of the variance. Moreover, higher PCs (20 onwards) are more affected by the noise compared to lower ones; thus, ideally, getting rid of such noisy components should lead to reduction in the overall noise level.
Figure 2.
The initial 200 singular values corresponding to the STFTs of clean (in solid blue) and noisy (in dash-dotted red) signals.
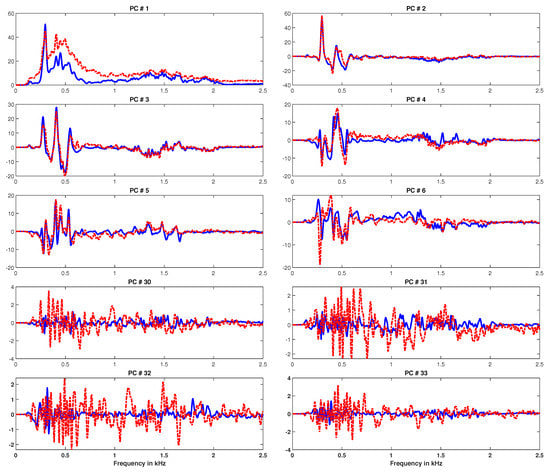
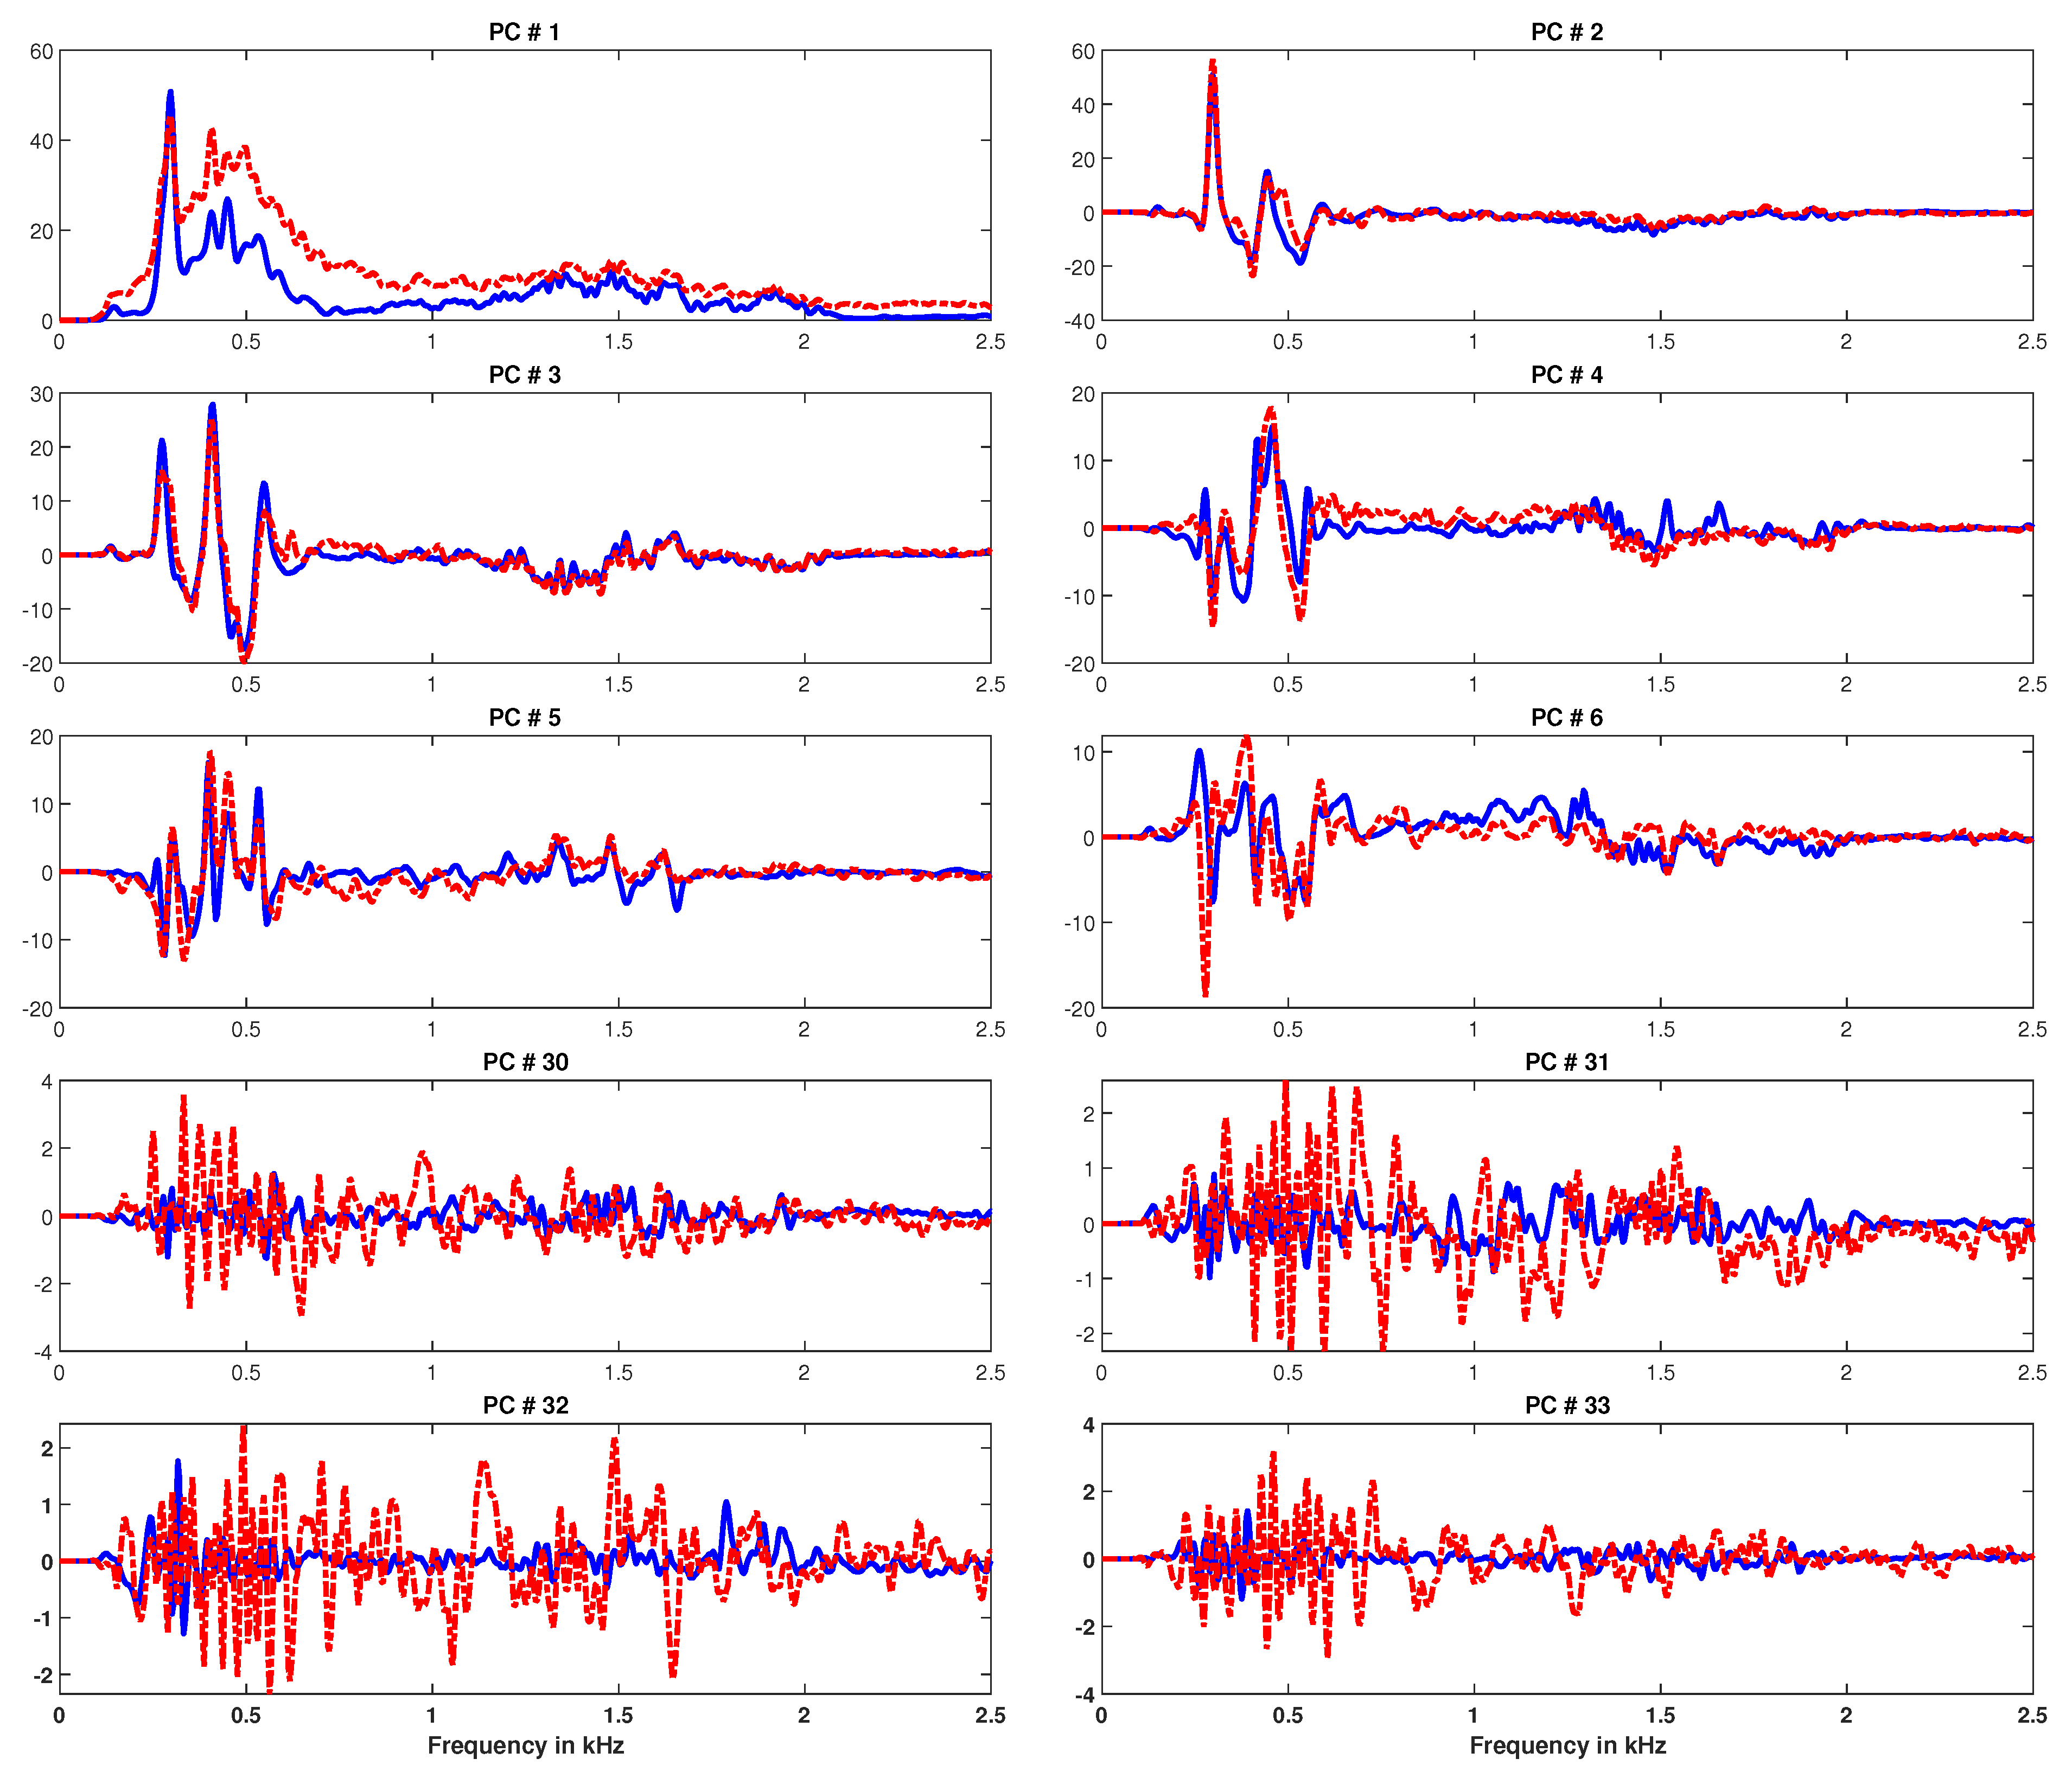
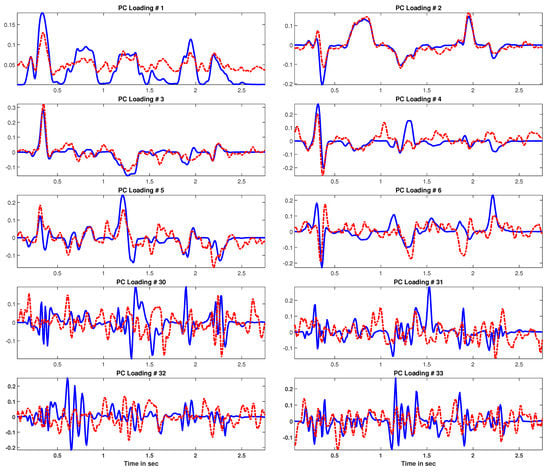
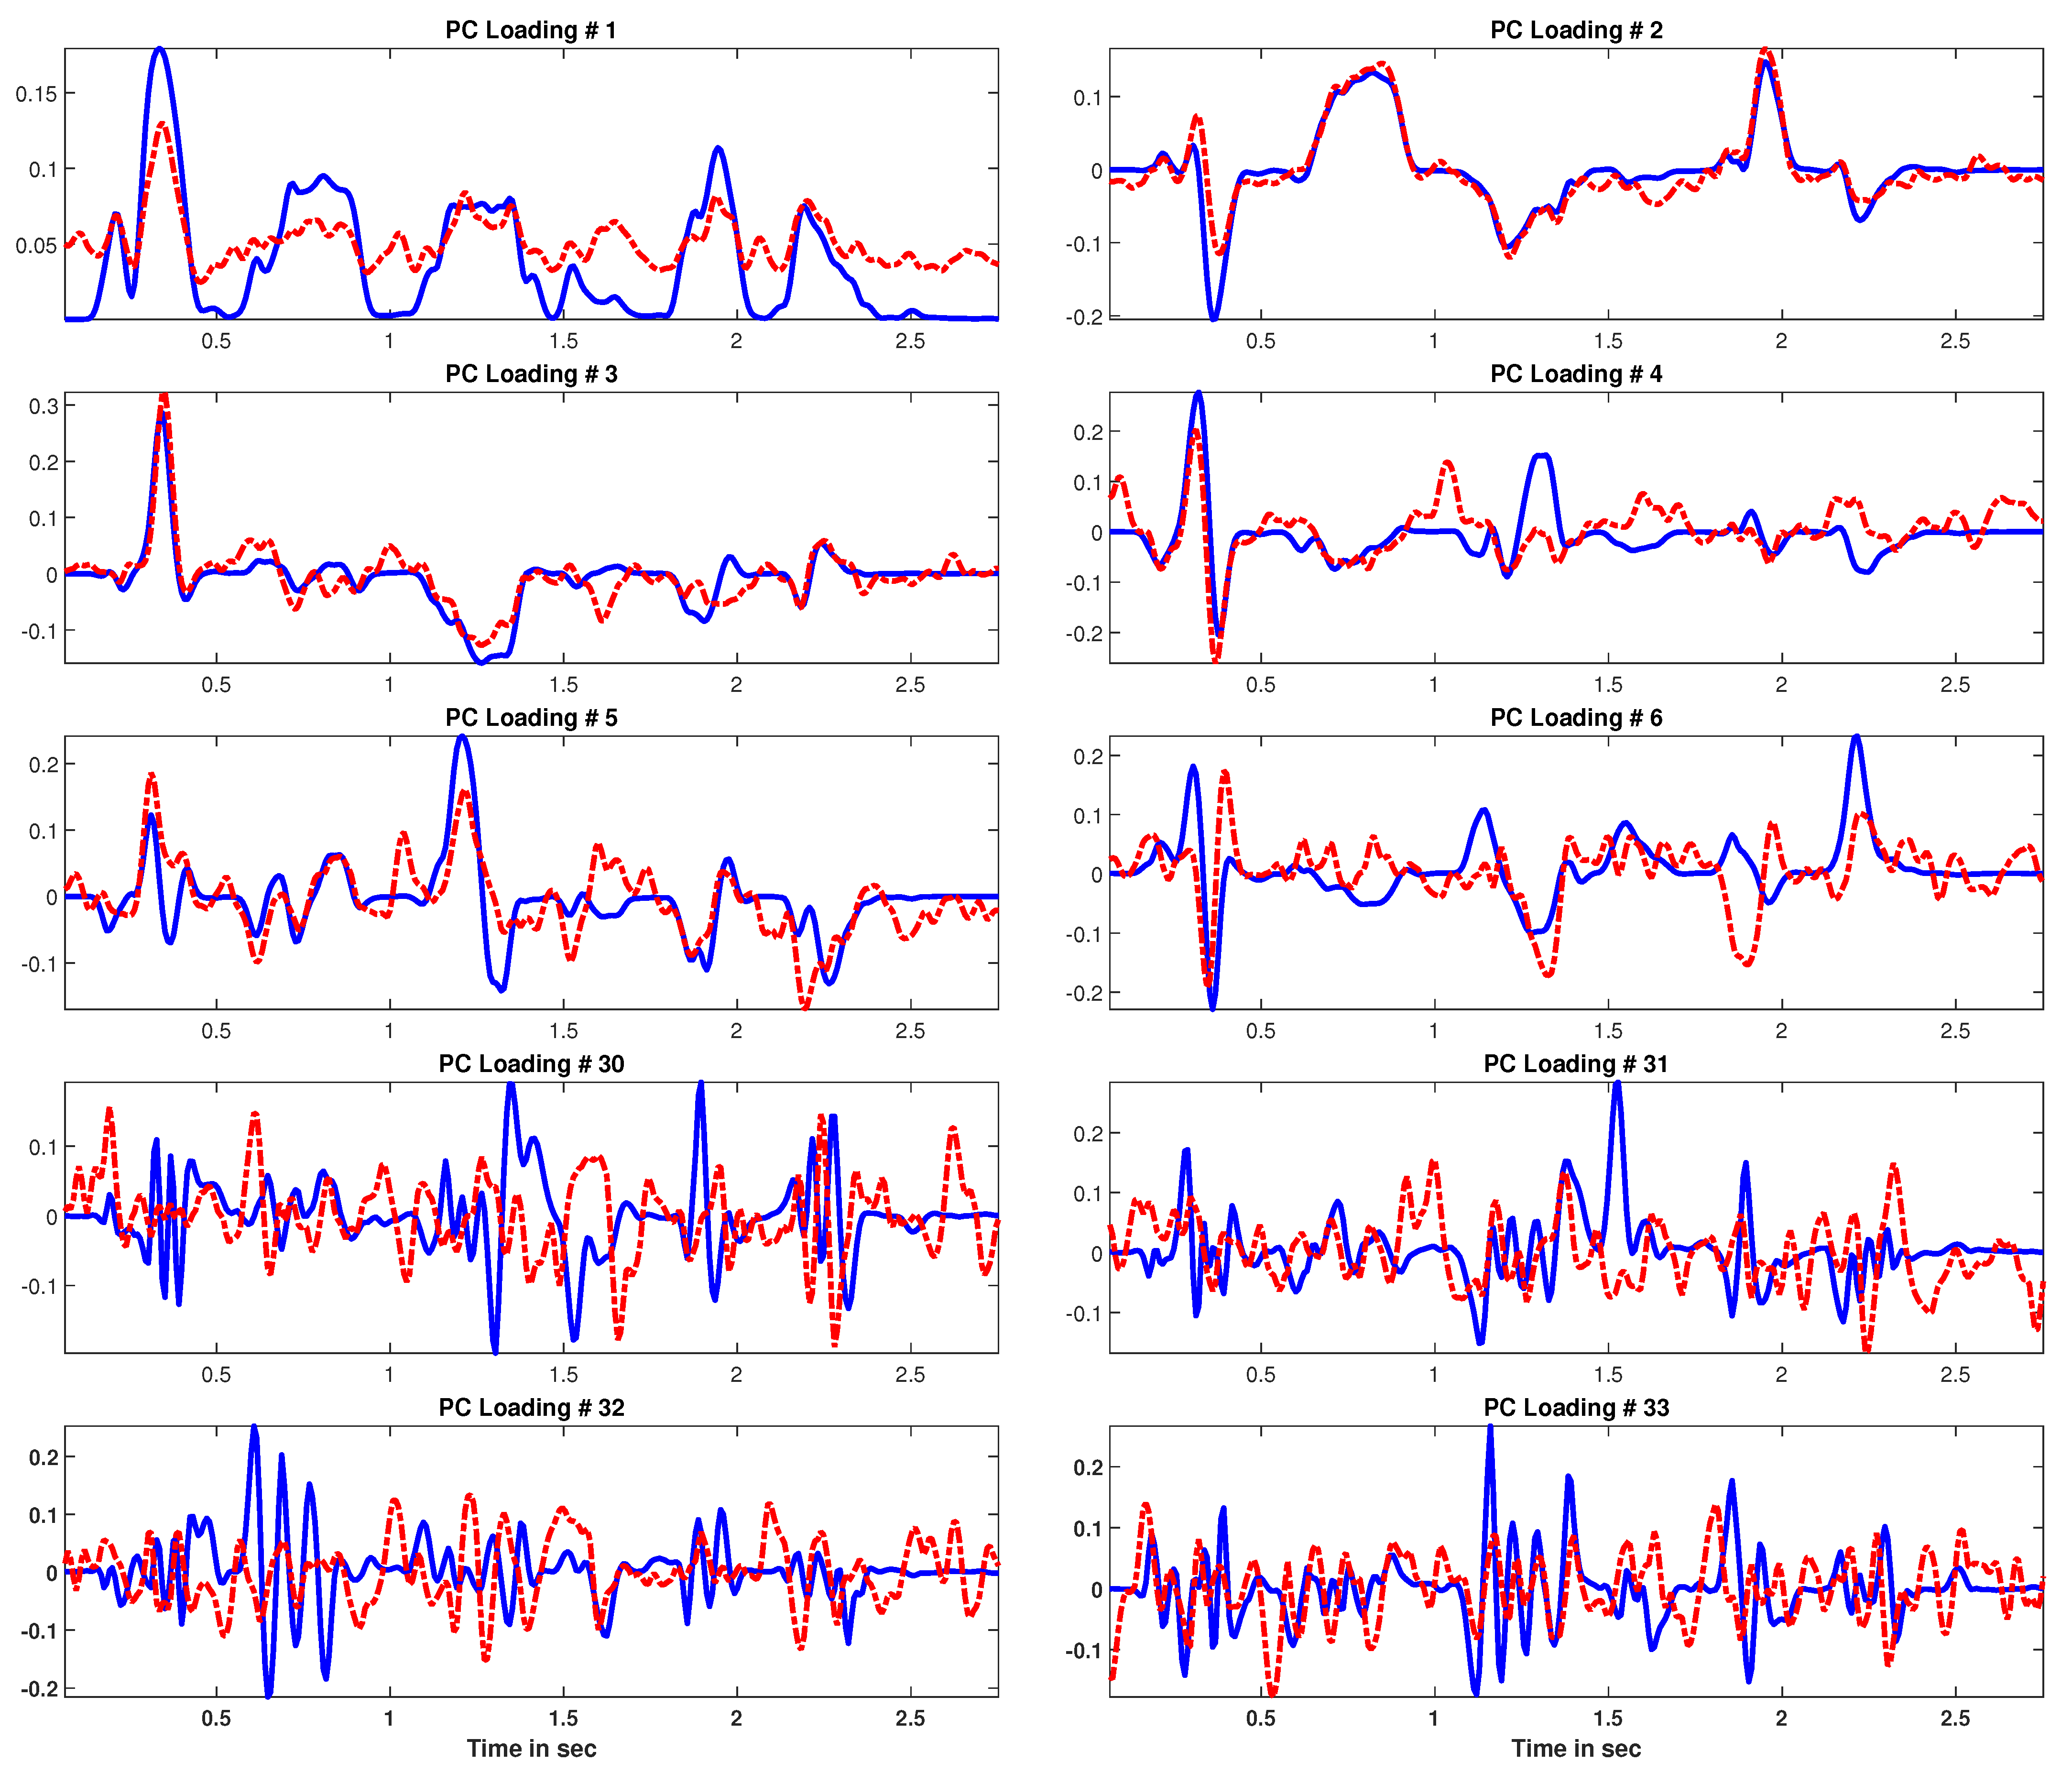
Additionally, for visualization, the initial 6 and 30–33 PCs and their respective loadings are shown in Figure 3 and Figure 4, respectively. From Figure 3, we can see that the initial 6 PCs learned from the clean STFT and noisy STFT show similar trends, showing less noise disturbance, whereas the noisy estimates of components 30–33, shown in Figure 3, have clearly diverged from the clean ones. Figure 4 shows similar trends with the PC loadings as well. Thus, in order to suppress noise, we can perform the signal approximation as:
where is the ith PC, is the ith PC loading vector, and .
Figure 3.
The principal components of the STFTs of clean (in solid blue) and noisy (in dash-dotted red) signals.
Figure 4.
The PC loadings of the STFTs of clean (in solid blue) and noisy (in dash-dotted red) signals.
Here, we would like to highlight two key issues with the aforementioned framework (i.e., PCA performed over the entire signal STFT). Firstly, in the signal under consideration, the noise component is present for the entire signal duration (see Figure 1c), whereas the signal of interest, the speech signal, contains periods of silence corresponding to almost 20–30% of the entire signal duration (see Figure 1a). Therefore, we can expect that the PCA computation might get biased towards learning such PCs and PC loadings, which can explain the entire duration of the signal. This is indeed the case, as this effect is clearly visible in PC 1 in Figure 3 and PC loading 1 in Figure 4. The first PC loading from the clean STFT (blue) clearly shows that the corresponding PC component has been able to capture the signal variance during the time periods of voice activity. This, however, is not the case with the first components learned from the noisy STFT, where these estimated components have ended up capturing a significant noise contribution as well.
Secondly, if at anytime during the signal recording, the energy of a few noisy frequencies gets higher than usual, then the PC and PC loading entries corresponding to these frequencies will become large (i.e., the corresponding singular value will get large). As a result, these otherwise noisy components might get picked up for the STFT approximation, leading to a reduction in the effectiveness of the noise suppression.
In order to circumvent these issues, we propose performing noise suppression using PCA on small subsets of STFT, instead of the complete STFT. The idea is to look at a small number of time frames at a time and approximate them one by one, instead of looking at the whole STFT. The advantage is that the SNR in each of these frames will be relatively higher than the SNR of the entire STFT; thus, the very few initial PCs will be able to capture most of the data variance effectively. Additionally, the noise increase in a specific window of time will be contained within that frame window and will not affect components in other adjacent frames. The details of this framework are provided in the next section.
3. Block Principal Component Analysis
In this section, we formalize the block principal component analysis (termed Block-PCA) technique. Let be the STFT signal that we want to approximate with a low-noise version . Here, k is the number of frequency points, and m is the number of time frames. Let be a scalar denoting the block-size, denote the number of blocks, and frame-block assignment vector . Here, denotes a vector of size b containing z, where . Let be the matrix containing the ith block of X, with indices coming from b. Then, we approximate by first taking its SVD, , and doing the following:
where is the jth PC, is the jth PC loading vector, and . Thus, in this approximation, we keep q most dominant components and discard the rest . We do this for all blocks, and recreate the complete approximation matrix by concatenating all block approximations.
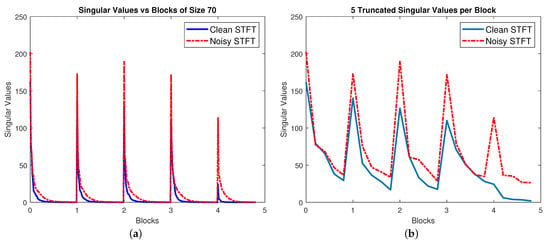
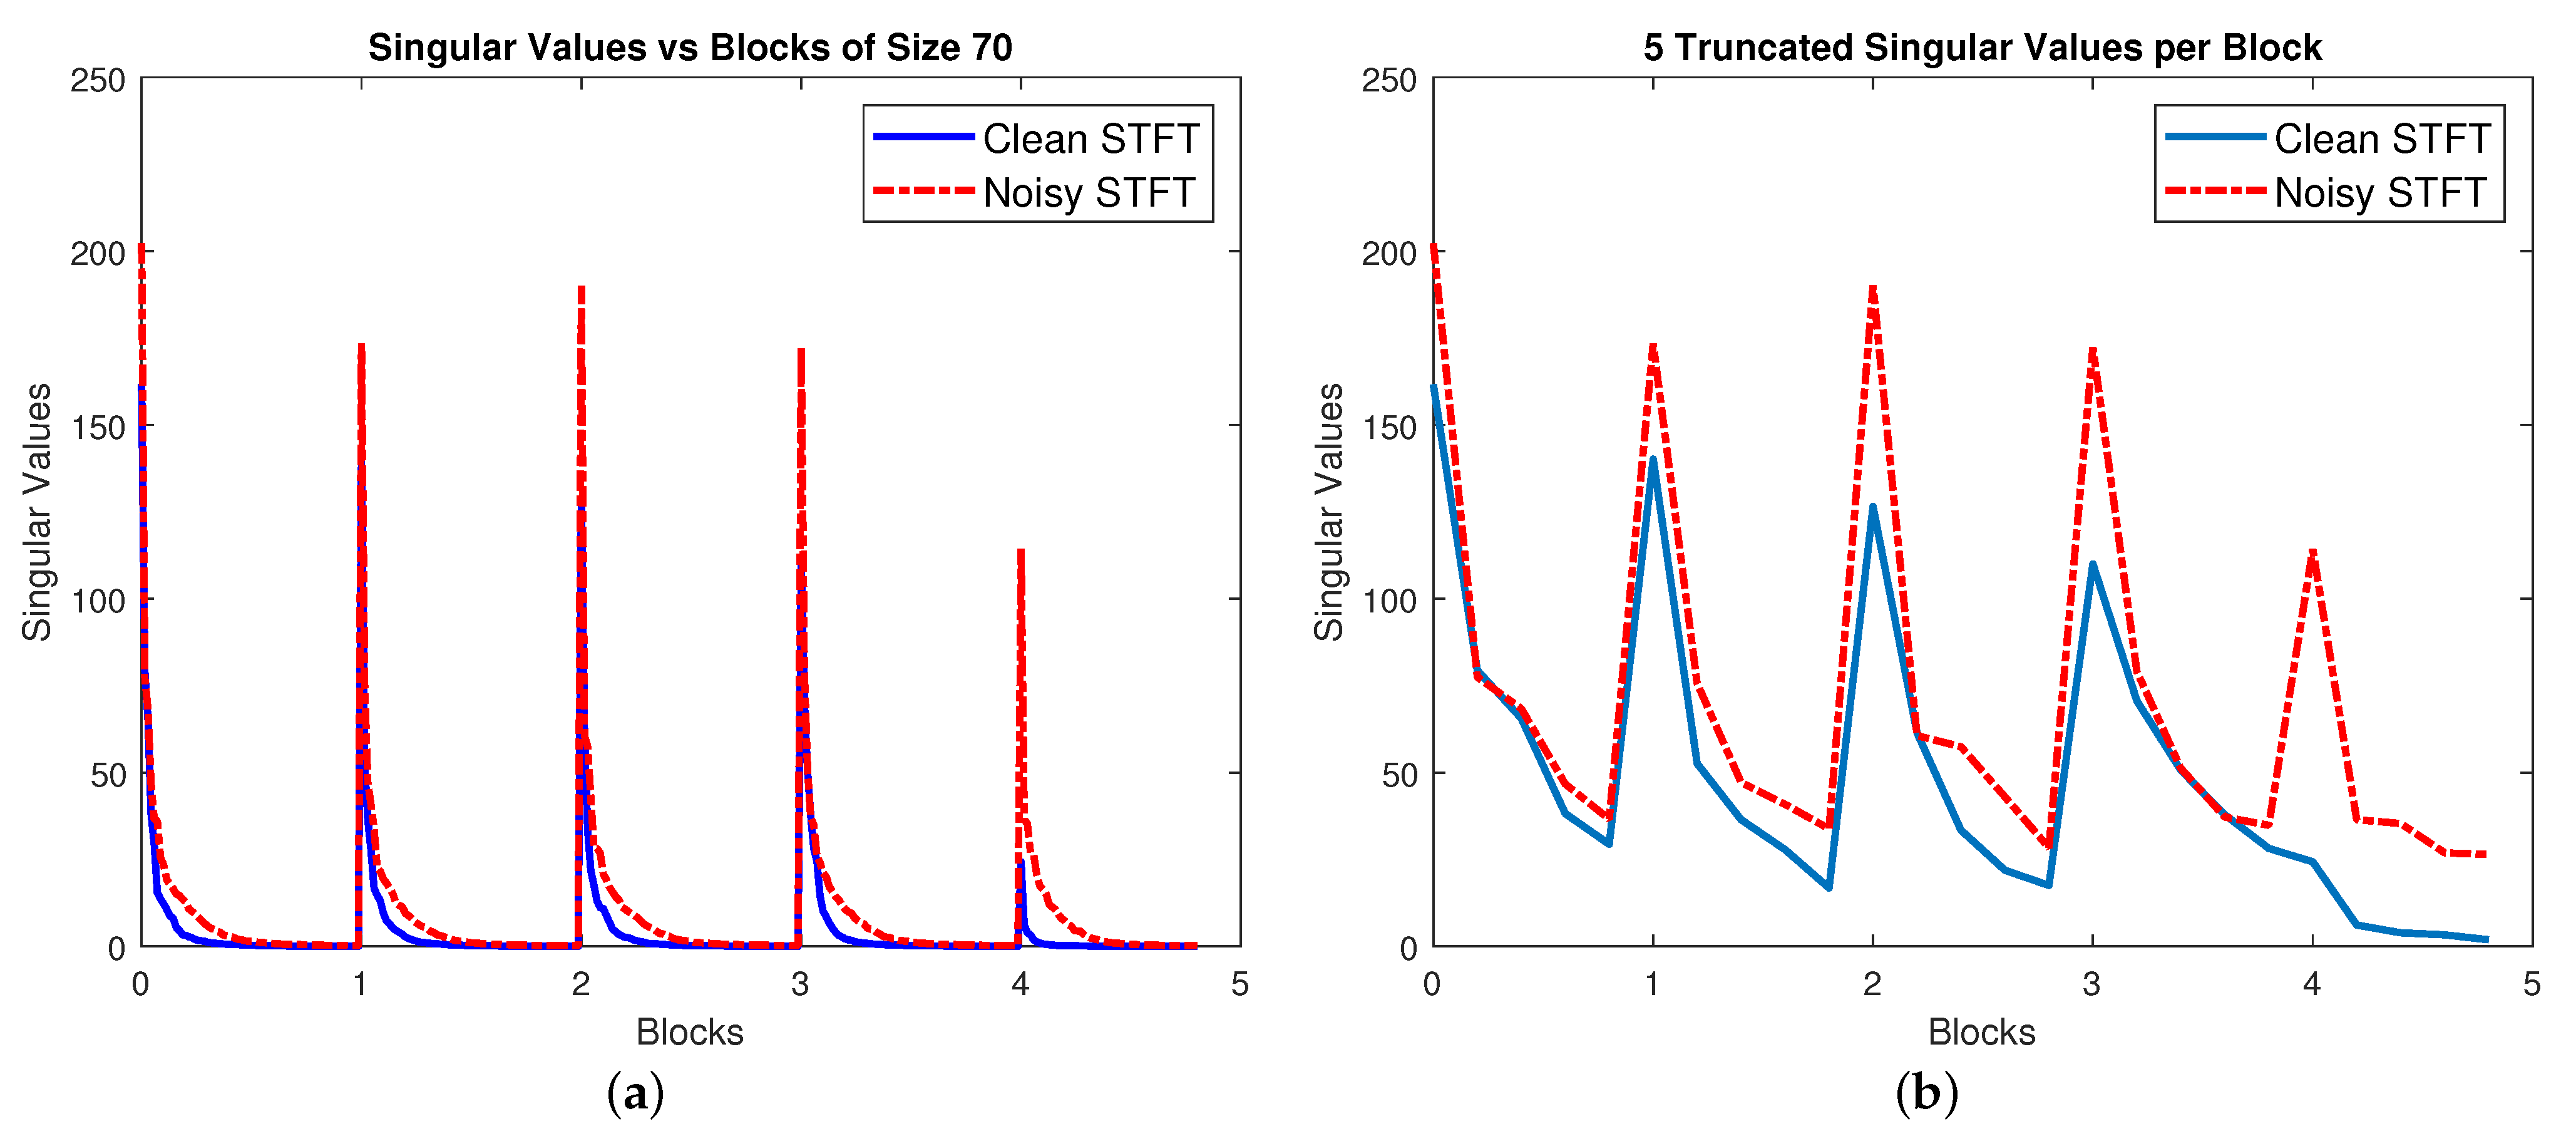
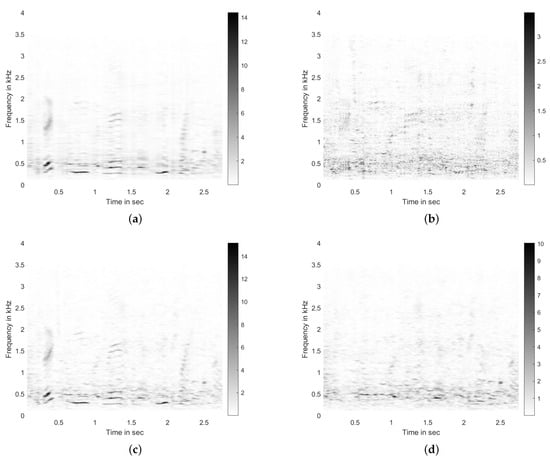
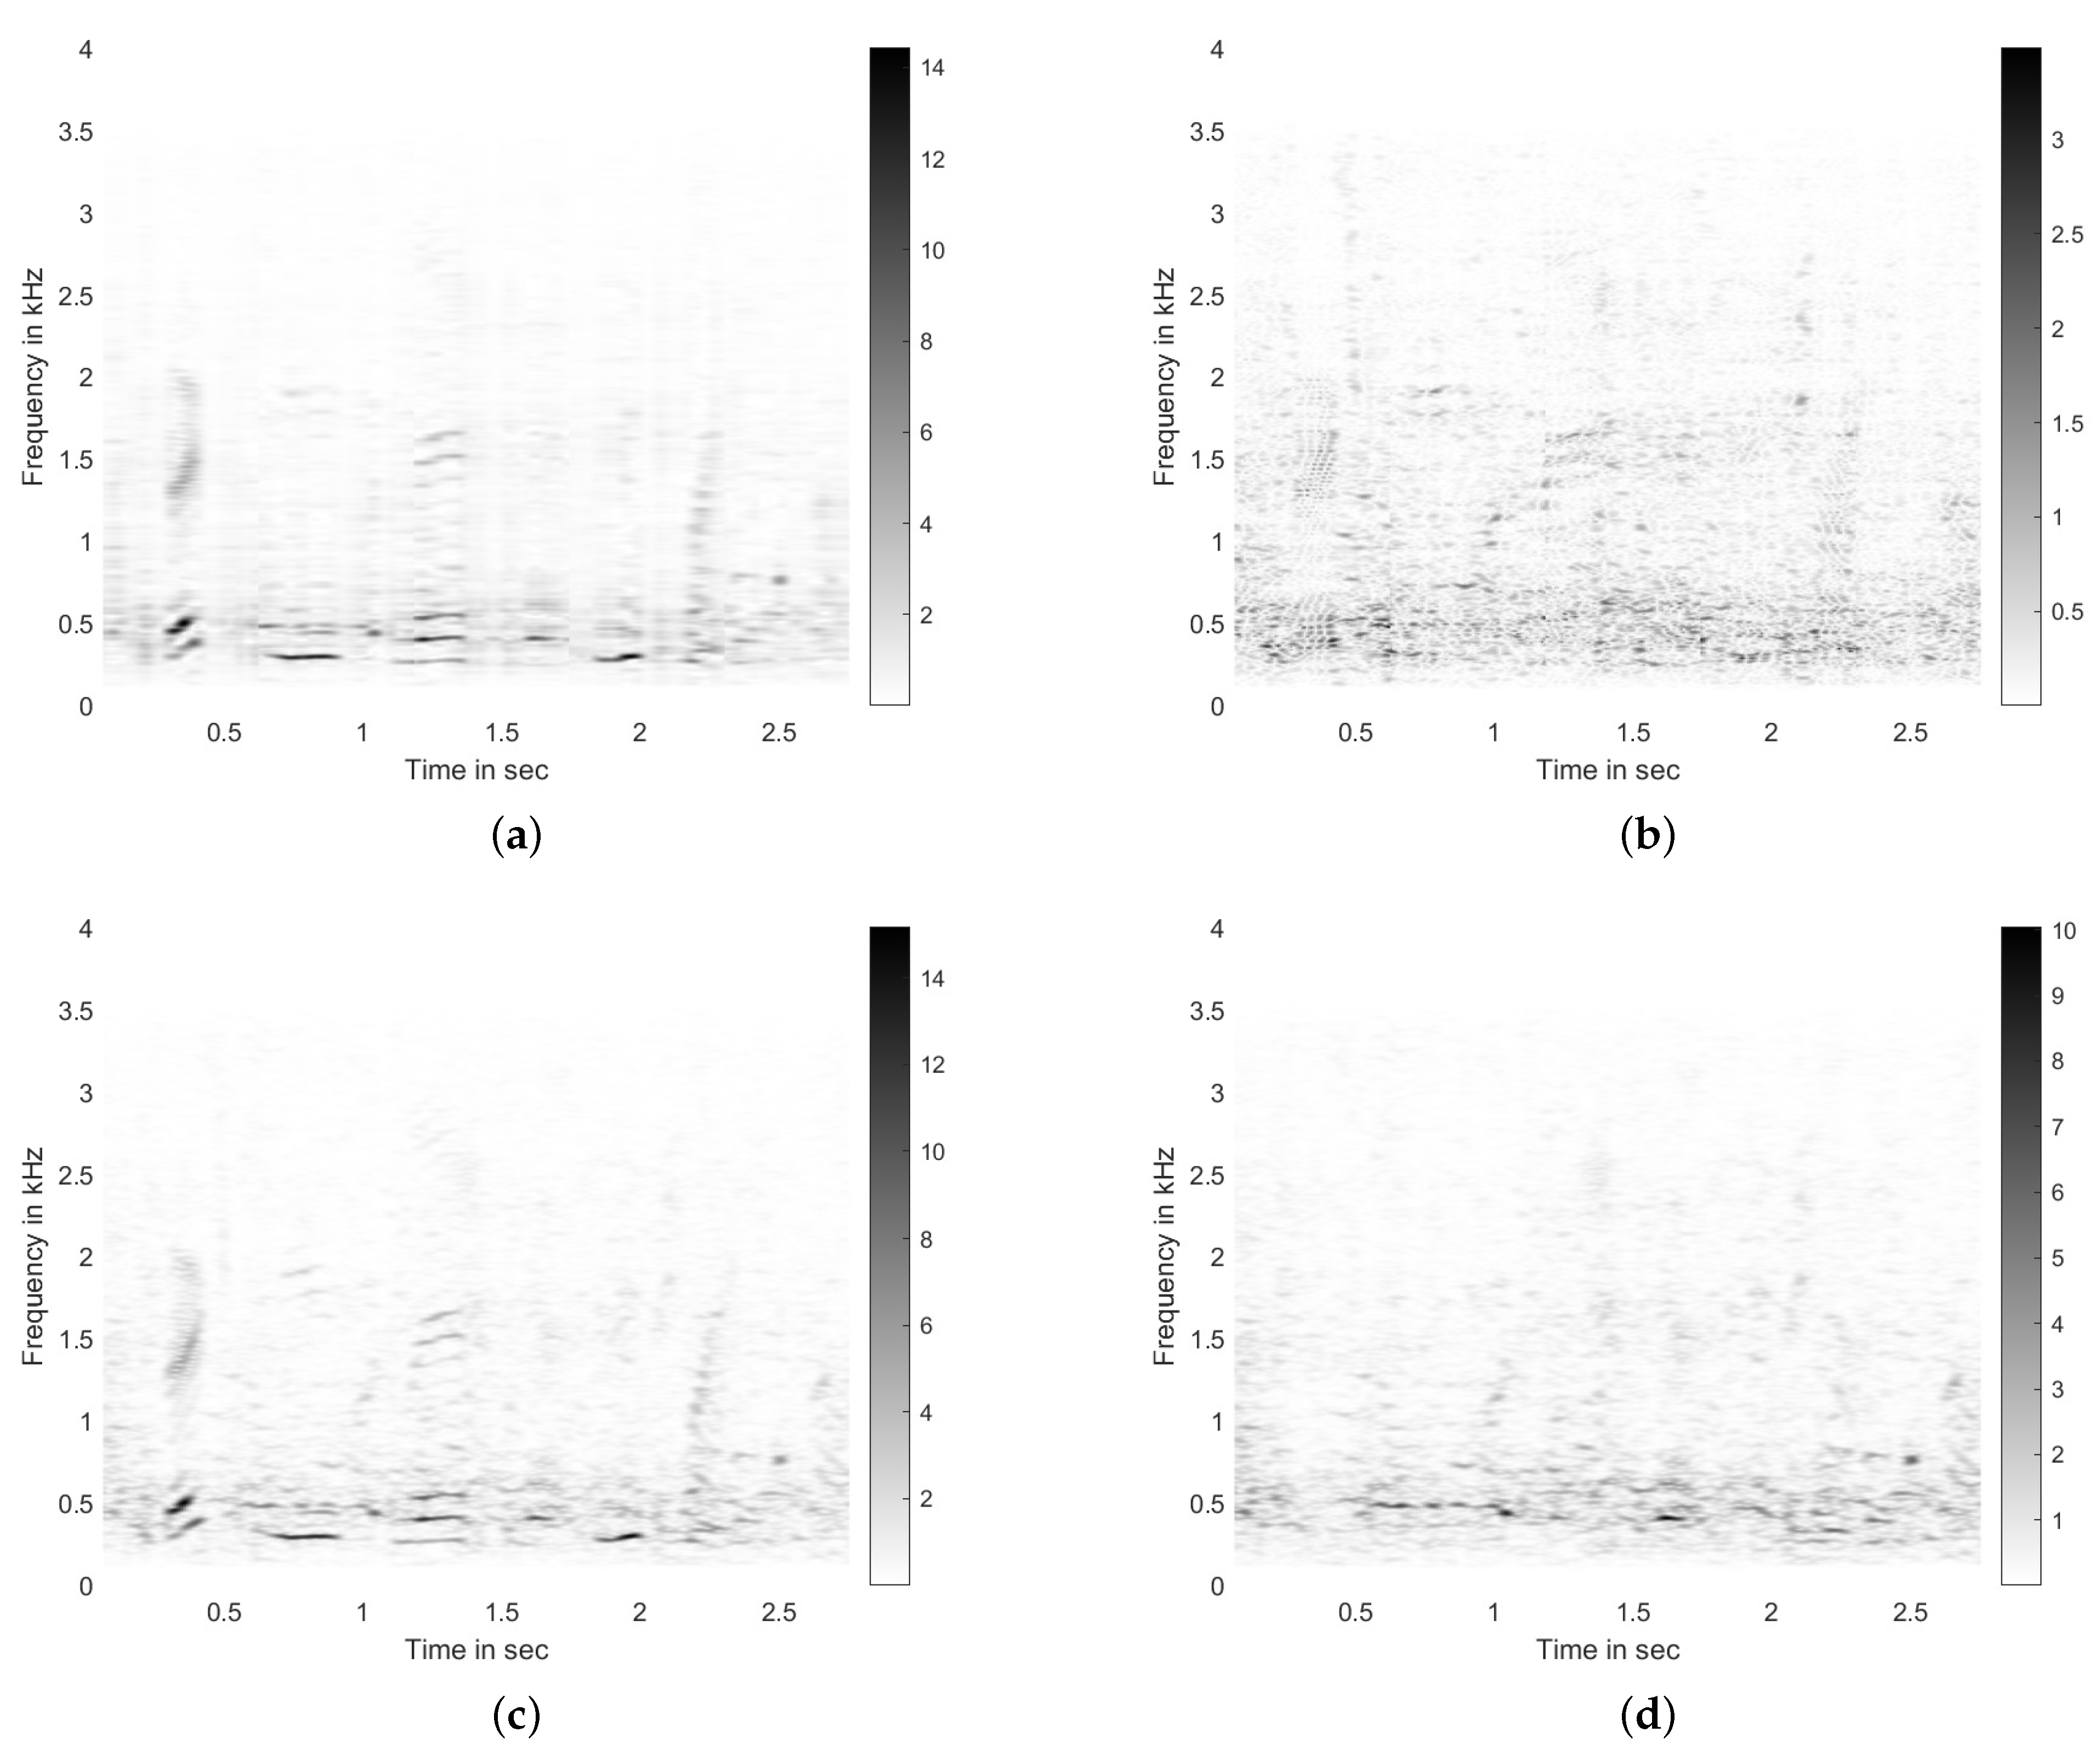
To visualize the effects of such approximation using Block-PCA, we applied our Block-PCA technique with block size and on the clean and noisy STFTs given in Figure 1a,b. Let us call the STFT under consideration X (taking on (S or Y)). The singular values computed for each block are shown in Figure 5a. Here, we can see that compared to Figure 2, the singular values in each block drop much more quickly; thus, keeping only a few components can lead to a better approximation. Here, we take components per block to generate . For completeness, these singular values are also shown in Figure 5b. The approximated complete is shown in Figure 6a, and the residual is shown in Figure 6b. By comparing the noisy STFT X (given in Figure 6c) and the approximated , we can see that the dominant features of our signal of interest (Figure 1a) are still present in the approximation, whereas most of the noise present in the 300–600 Hz range has been removed from the approximation and is delegated to the residual STFT. For comparison, the STFT of the noise-only signal is also shown in Figure 6d, and it is very close to our residual STFT.
Figure 5.
(a) Singular values corresponding to every block, and (b) the truncated singular values per block used for the approximated STFT shown in Figure 6a.
Figure 6.
The approximated STFT of noisy STFT (a) and the residual (b). For comparison, the noisy STFT X=Y and noise-only STFT from Figure 1 are reproduced in (c,d), respectively.
The overall speech enhancement framework incorporating our noise suppression technique is outlined next.
4. Speech Enhancement Framework
In this section, we outline the steps performed to recover the clean speech signal from the noisy one .
- Let denote the time-domain noisy signal vector, be the clean speech signal, and represent noise. All signals at this step are real-valued and are related by:
- Using Hamming window of appropriate size, segment vector into multiple frames with appropriate level of overlap. The resulting segmented noisy signal is given by:where n represents the time point, and m represents the segment/frame number.
- Take the Fourier transform of the segmented noisy time-domain signal to get:where is the complex-valued truncated noisy spectrum with . Save , the phase of the noisy spectrum.
- Perform noise suppression on via Block-PCA with block size b, retaining q components per block, according to the steps provided in Section 3, to get:where the resulting is the real-valued magnitude of the approximated STFT.
- Apply speech enhancement algorithm to the noise-suppressed magnitude spectra to obtain the enhanced magnitude spectra .
- Generate the complex-valued spectra by combining the enhanced magnitude spectra with the phase of the noisy spectrum as follows:
- Take the inverse Fourier transform of to get , apply the general overlap, and add the (OLA) method to obtain the enhanced time-domain signal .
5. Experimental Evaluation
The aim of this study is to investigate the noise suppression performance of the proposed block principal component analysis (Block-PCA) algorithm in the overall speech enhancement pipeline discussed in Section 4, especially when the signal-to-noise ratio (SNR) is very low. The speech enhancement algorithms used here are the minimum mean square error–short-time spectral amplitude (MMSE-STSA) estimator [15], the multi-band spectral subtraction (SSMB) method [8], and the method outlined in [25], based on adaptive low-rank matrix decomposition (ALMD). Moreover, the MMSE-STSA and SSMB methods operate in frequency domain on the generated STFTs, and the ALMD method works in the time domain. These algorithms have low computational costs and require no learning; thus, they can be directly applied on the received signal, and have been shown to perform very well on speech signals with medium to high SNR. These algorithms, however, see severe performance degradation under low SNR levels. Thus, our aim is to show that under low SNR levels, applying these methods on a noise-suppressed signal generated by our method, instead of the regular noisy signal, can lead to significant improvement. This is indeed the case, as we will show next.
The dataset used for the experiments is the NOIZEUS [21] database, which contains 30 different sentences spoken by 6 different speakers. Out of the 30 sentences, half are spoken by male speakers and the remaining half by female speakers. We used the five noise types available in the NOIZEUS database, namely ‘Airport’, ‘Babble’, ‘Car’, ‘Exhibition’, and ‘Restaurant’, to contaminate the clean speech signals corresponding to 6 SNRs dB levels.
The metrics used to evaluate the enhanced speech quality are segmental SNR (SSNR) [39] and the perceptual evaluation of speech quality (PESQ) [40]. In addition, we have used the composite measures , , and [40] to rate the speech distortion, noise distortion, and the overall quality, respectively, of the enhanced speech signal. These composite measures are the linear combinations of PESQ, log likelihood ratio (LLR) [41], and weighted-slope spectral (WSS) distance [42] scores.
In all the experiments discussed next, the sampling rate of the speech signals was fixed at Hz, and we used Hamming window of size 200 samples (25 ms duration), with overlap of 80 samples (10 ms) to compute the short-time Fourier transform of the signal under analysis. The FFT size was set equal to the chosen window size. Let be the clean speech signal, and be the noise signal of a specific type. We generate the noise-contaminated signal with a specific SNR level by adding with specific energy to . We perform speech enhancement using the framework outlined in Section 4 with and without performing noise suppression via Block-PCA to analyze its effectiveness. As the ALMD algorithm operates in the time domain, after performing STFT approximation of the noisy signal using Block-PCA, we recreate the noise-suppressed time-domain signal using inverse Fourier transform and the overlap and add method. This signal is then passed to the ALMD algorithm for enhancement. We store the performance scores for the noisy input signal, MMSE-STSA only, MMSE-STSA with Block-PCA, SSMB only, SSMB with Block-PCA, ALMD only, and ALMD with Block-PCA. We repeat this process for all 30 speech signals, all 6 SNR levels, and for all noise types, as discussed earlier. The block size (b) and components to retain (q) are selected by performing a 2-D grid search over and and choosing the combination that leads to highest performance. These results are presented and analyzed next.
5.1. PESQ and SSNR Performance for Male and Female Speakers under Babble Noise Contamination
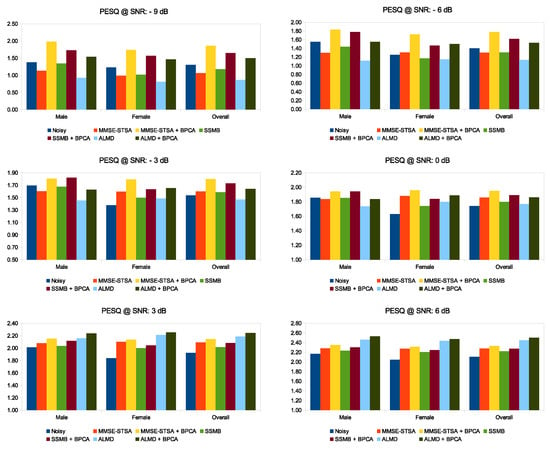
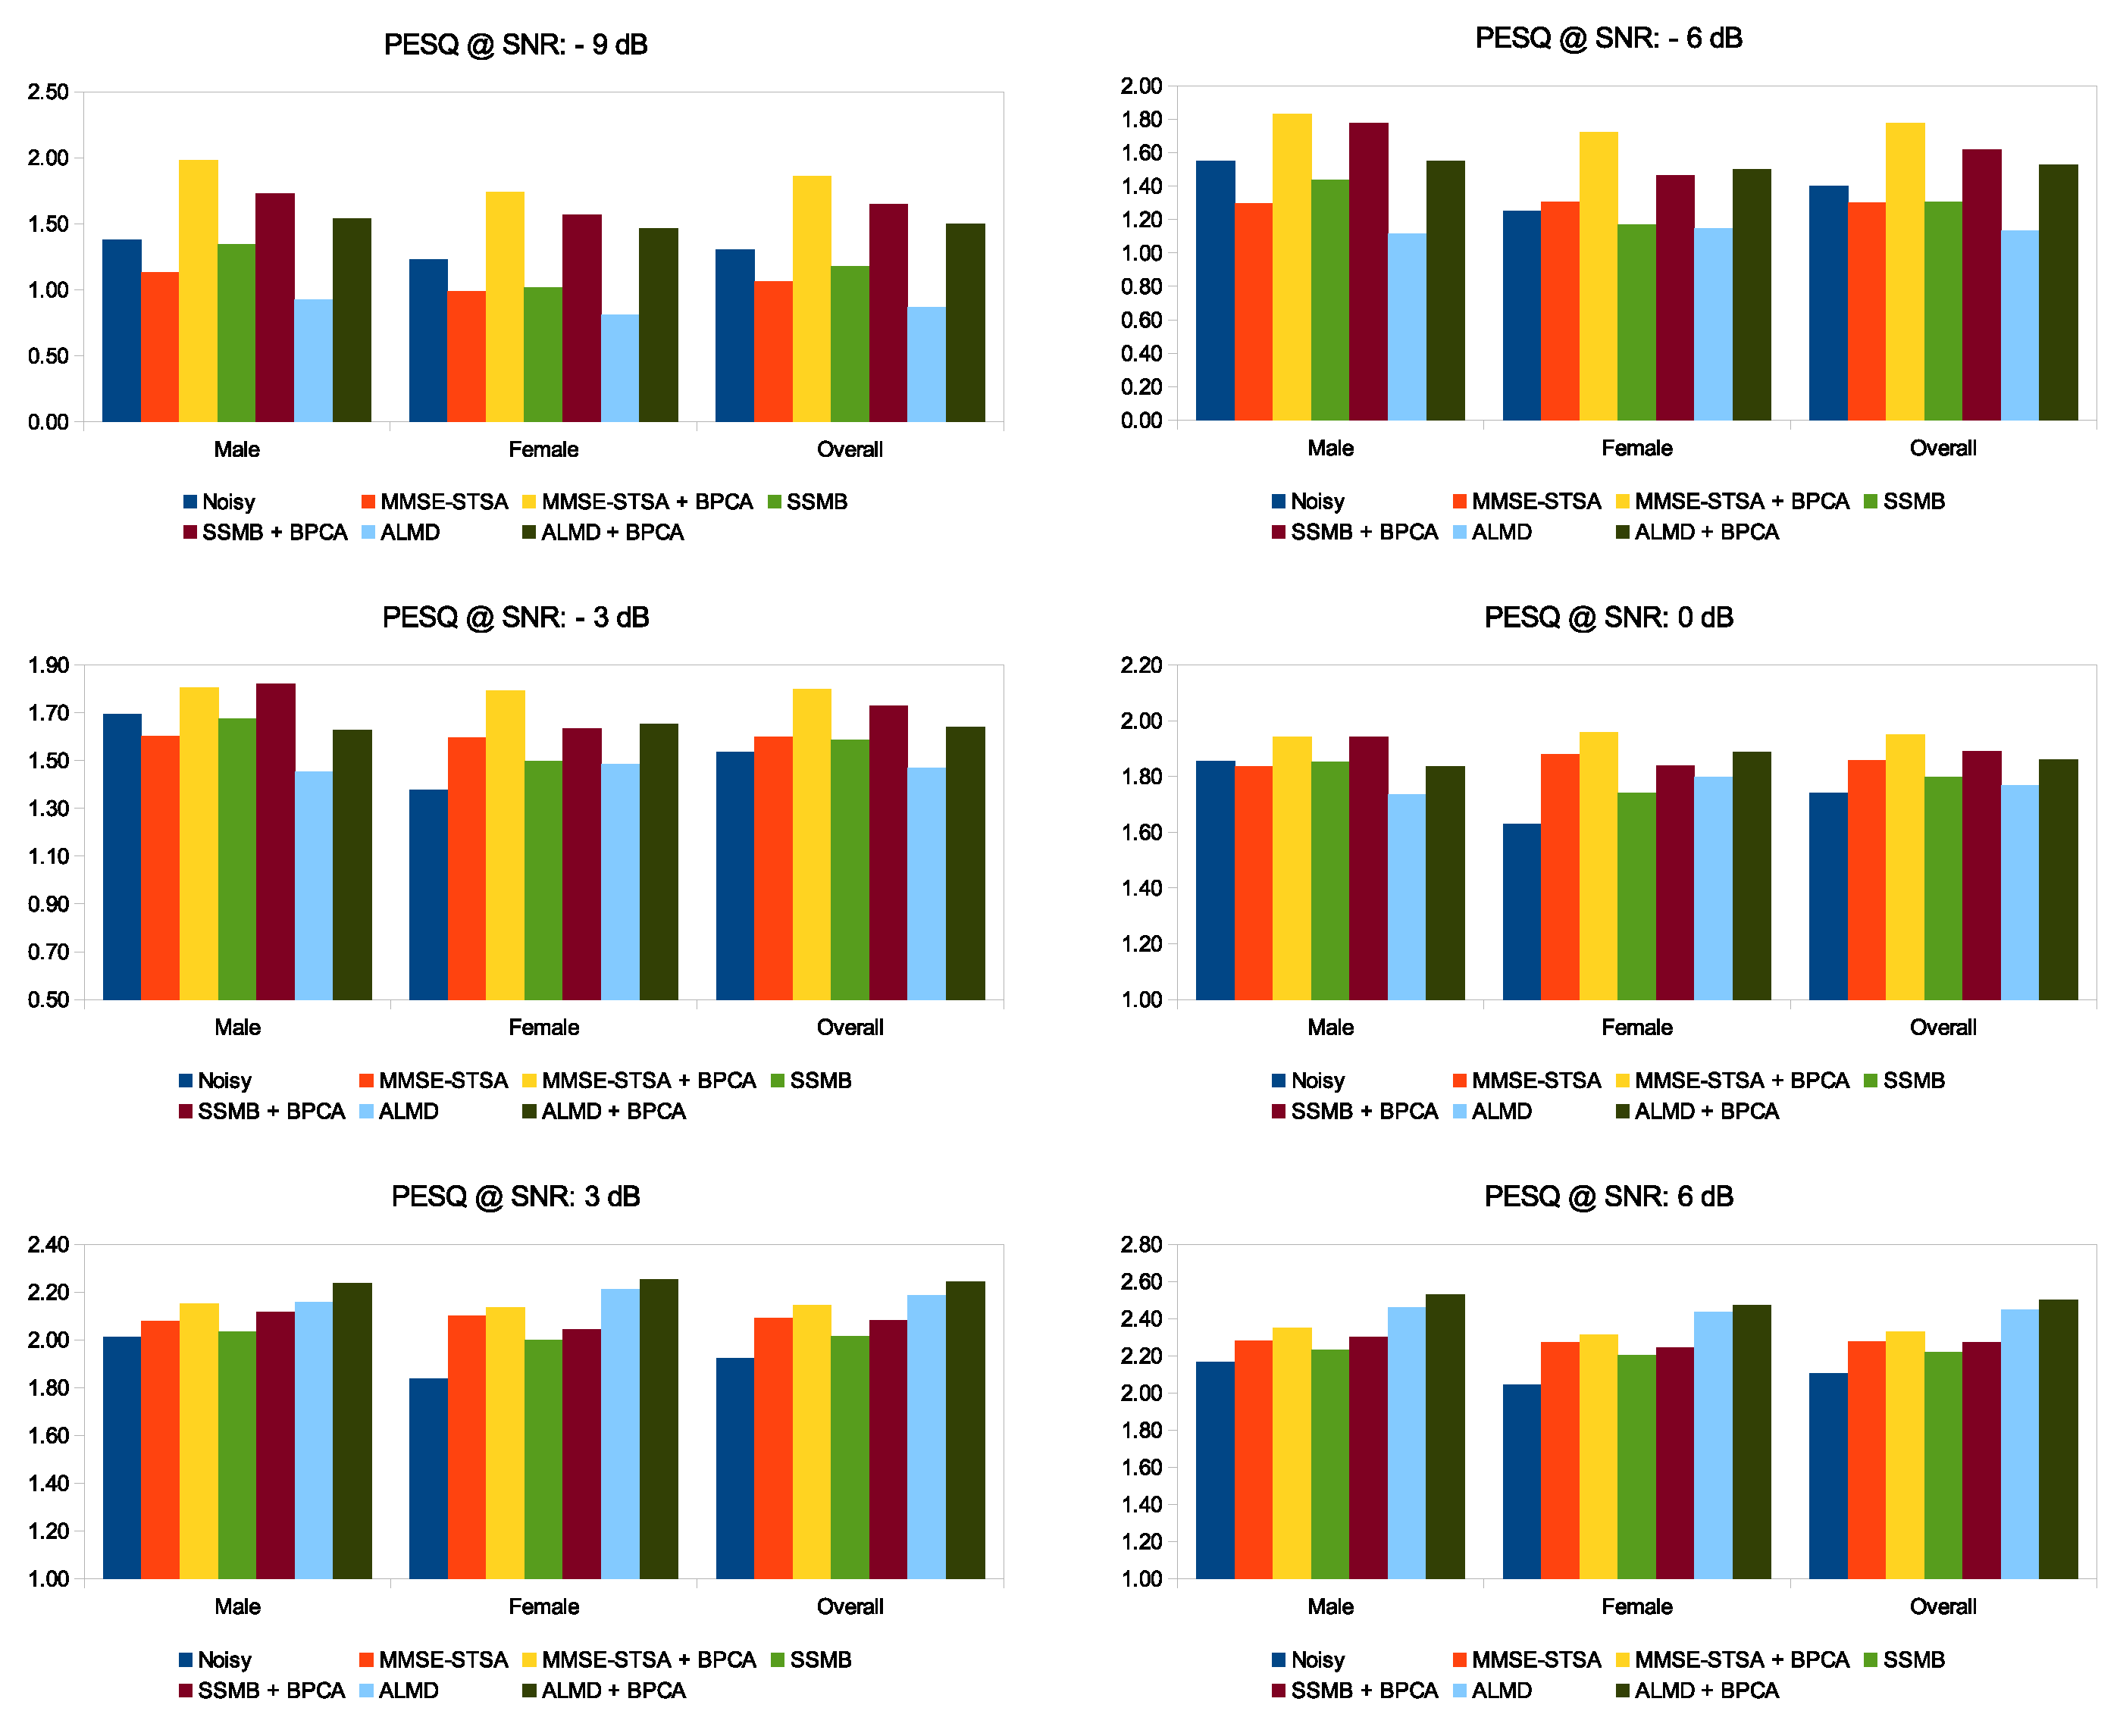
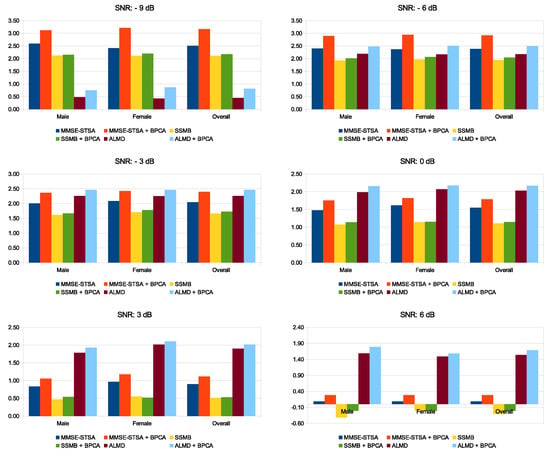
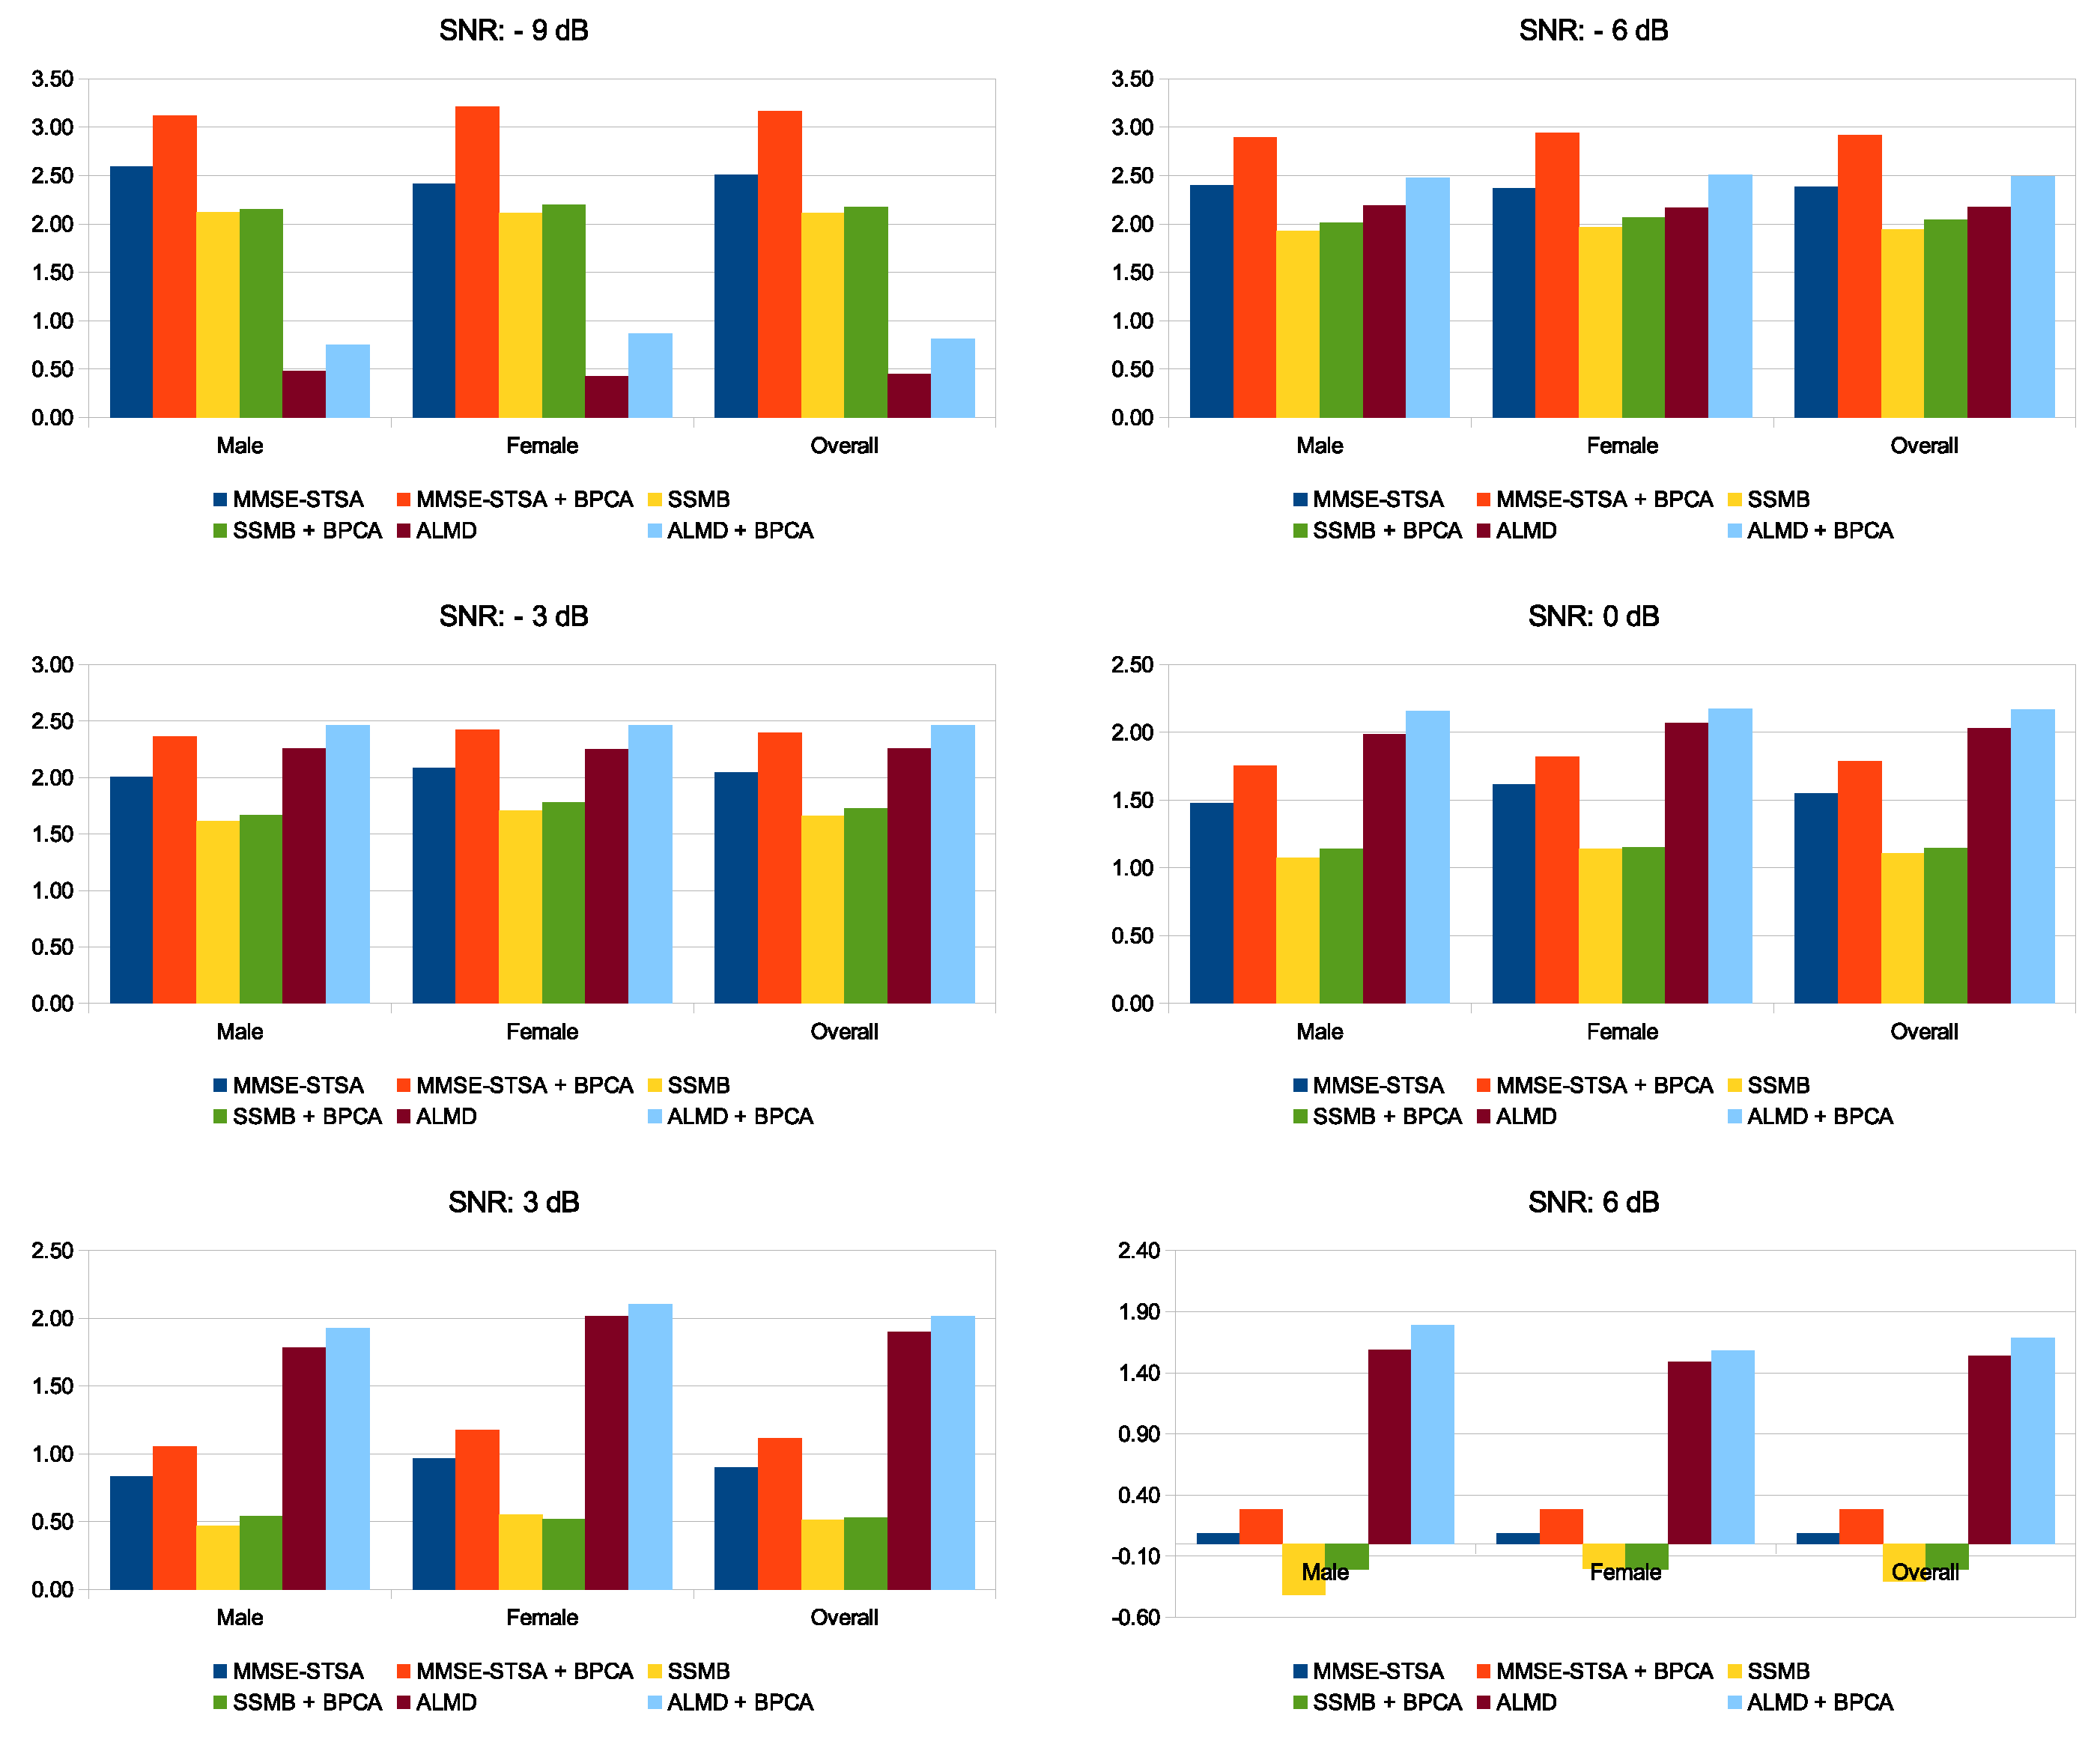
As we know that the frequency characteristics of male and female speakers are different, to look at the performance separately, we have presented the two speech enhancement performance metrics PESQ and SSNR with regard to the noise floor for male and female speakers separately in Figure 7 and Figure 8, respectively. The scores given here, as well as those discussed later, are all average results. Considering the PESQ scores for both male and female speakers under severe noise contamination of and dB SNR, we can see that the enhanced speech signal recovered by the MMSE-STSA, SSMB, and ALMD methods have scores below that of the input noisy speech signal itself. However, when combined with the noise-suppressing Block-PCA algorithm, all of the methods recover speech signals with higher PESQ scores, highlighting that operating on the noise-suppressed signals did lead to better performance compared to using the original noisy signals. The PESQ gains with regard to the regular MMSE-STSA seen here are significant, with 0.80 and 0.47 for and dB SNR, respectively. The same trend improvement can be seen over SSNR metric for and dB SNRs as well. The PESQ scores for ALMD suffer the most under low SNR scenarios and stay below MMSE-STSA, only to surpass it once SNR is increased from 0 dB. The same is true for the SSNR scores shown in Figure 8, where ALMD beats the others at SNRs of dB and above. This is consistent with the results presented in [25]. The performance boost offered by the proposed algorithm for all methods is significantly high under (and including) 0 dB SNR. For SNRs above 0 dB, it still offers improvement; however, the improvement offered gets smaller as the SNR increases. Overall, for lower SNRs, the MMSE-STSA + Block-PCA methods performs best, and for SNRs above 0 dB, ALMD + Block-PCA takes the lead.
Figure 7.
Average PESQ scores for male and female speakers under ‘Babble’ noise contamination over multiple SNR levels. (For interpretation of the bar colors, the reader is referred to the web version of this article).
Figure 8.
Average SSNR improvement in dB with regard to the noise floor scores for male and female speakers under ‘Babble’ noise contamination over multiple SNR levels. (For interpretation of the bar colors, the reader is referred to the web version of this article).
5.2. Performance Analysis under Different Noise Types Contamination with −6 dB SNR
Due to the space constraint of the manuscript, in Table 2, we have presented the average performance metrics (over 30 signals) for dB SNR and the noise types of ‘Babble’, ‘Exhibition’, and ‘Car’ only. The results shown here further highlight the efficacy of the proposed noise suppression algorithm under different noise types. Out of the three noise types shown here, PESQ scores for the ‘Car’ noise type show the highest gain in performance due to the inclusion of Block-PCA in all methods. Moreover, for all noise types, the enhancement scores for the techniques with Block-PCA are higher than the other methods, emphasizing the effectiveness of the proposed methodology.
Table 2.
Performance analysis for noise types ‘Babble’, ‘Exhibition’, and ‘Car’ with −6 dB SNR level. Best results are highlighted in bold.
5.3. Performance Comparison for PESQ and SSNR over Multiple Noise Types and SNR Levels
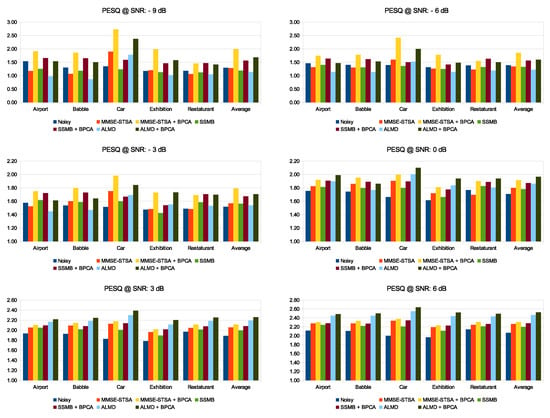
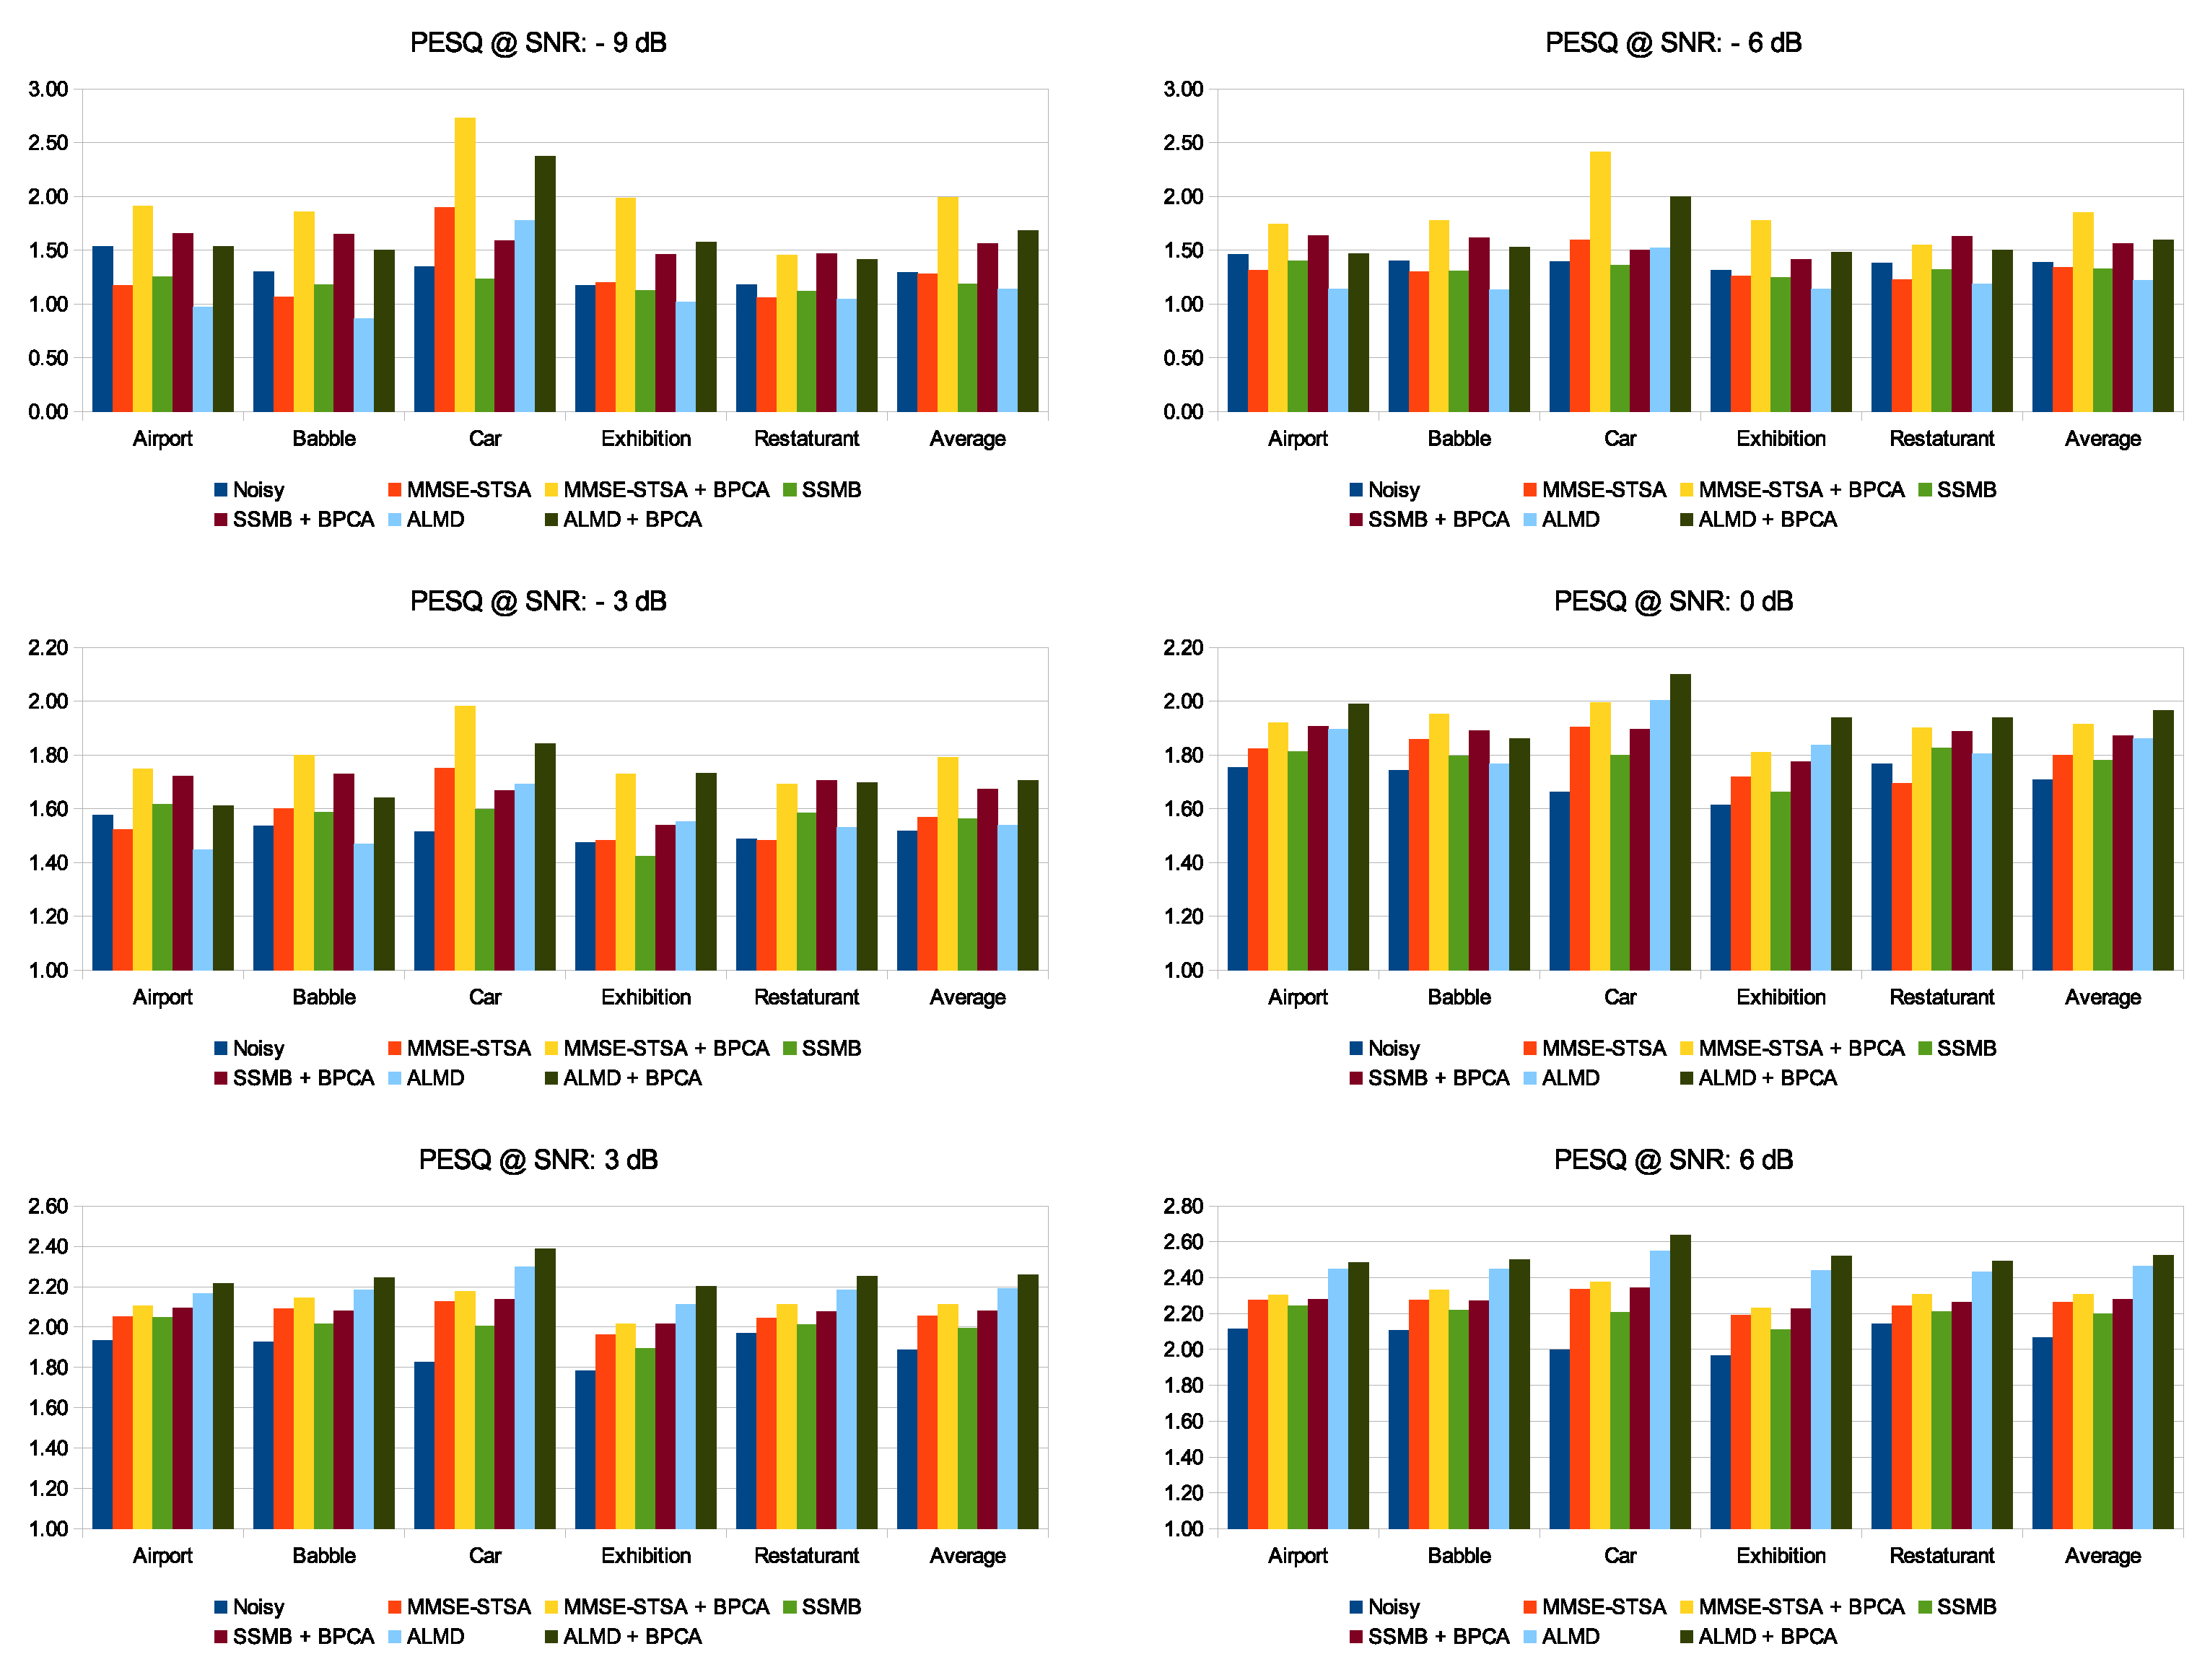
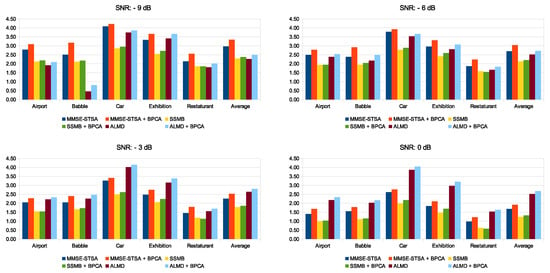
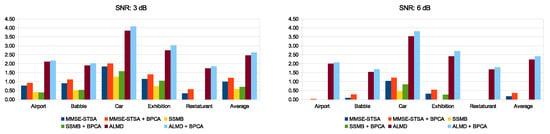
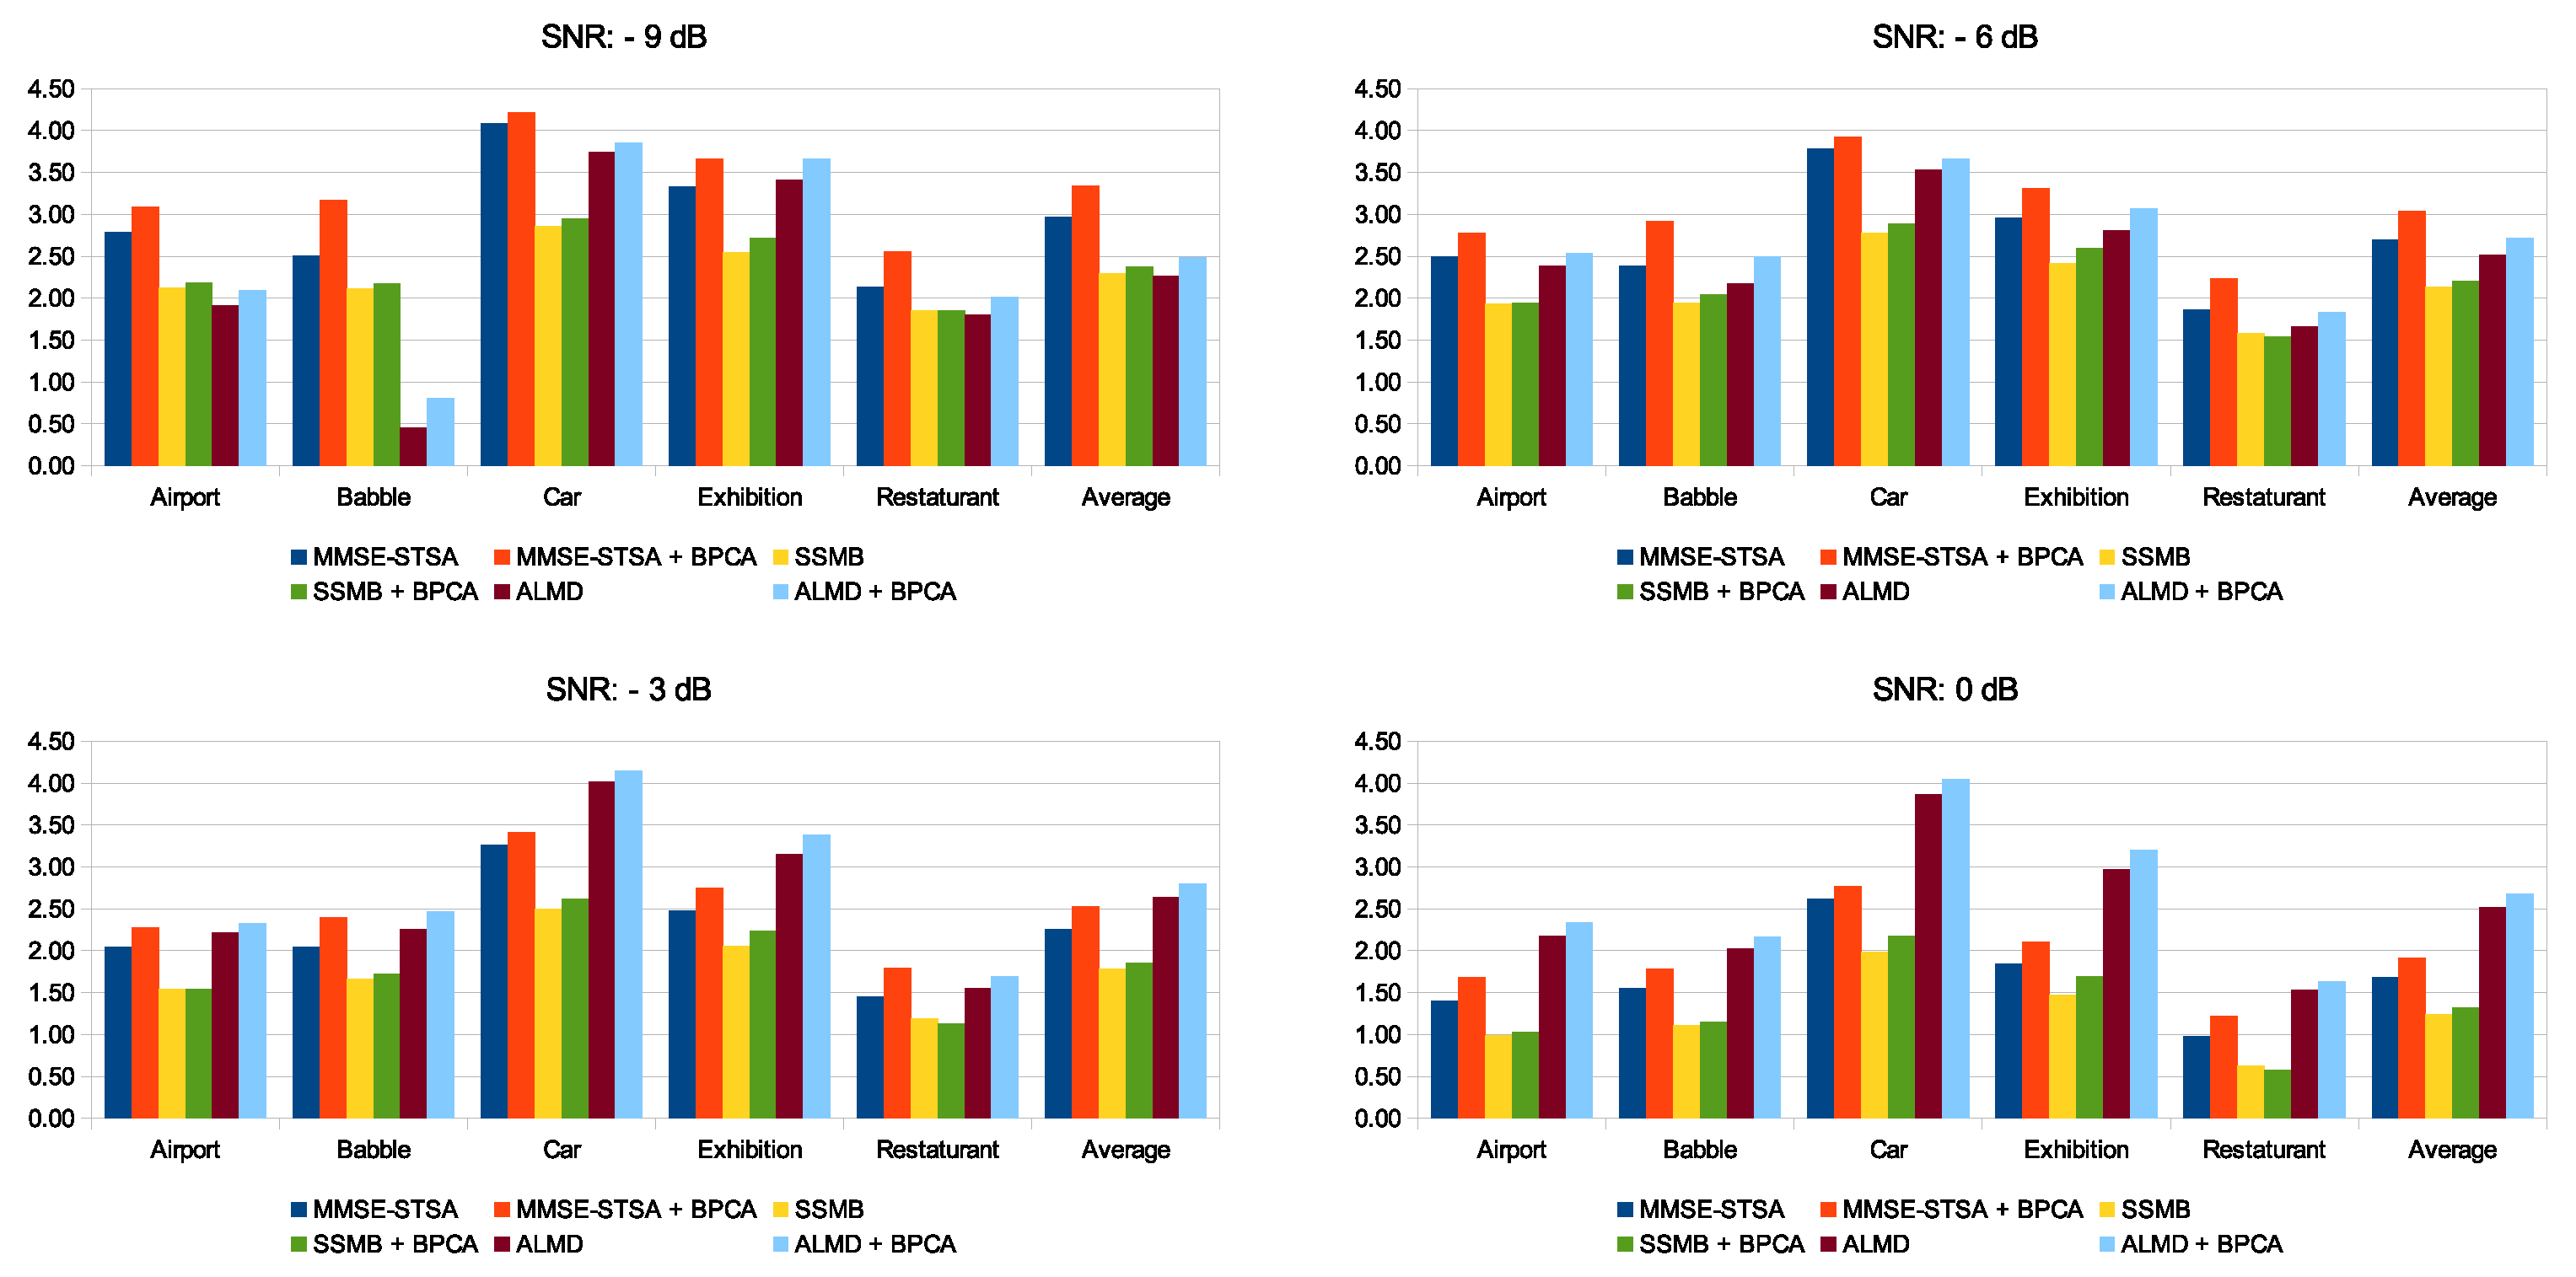
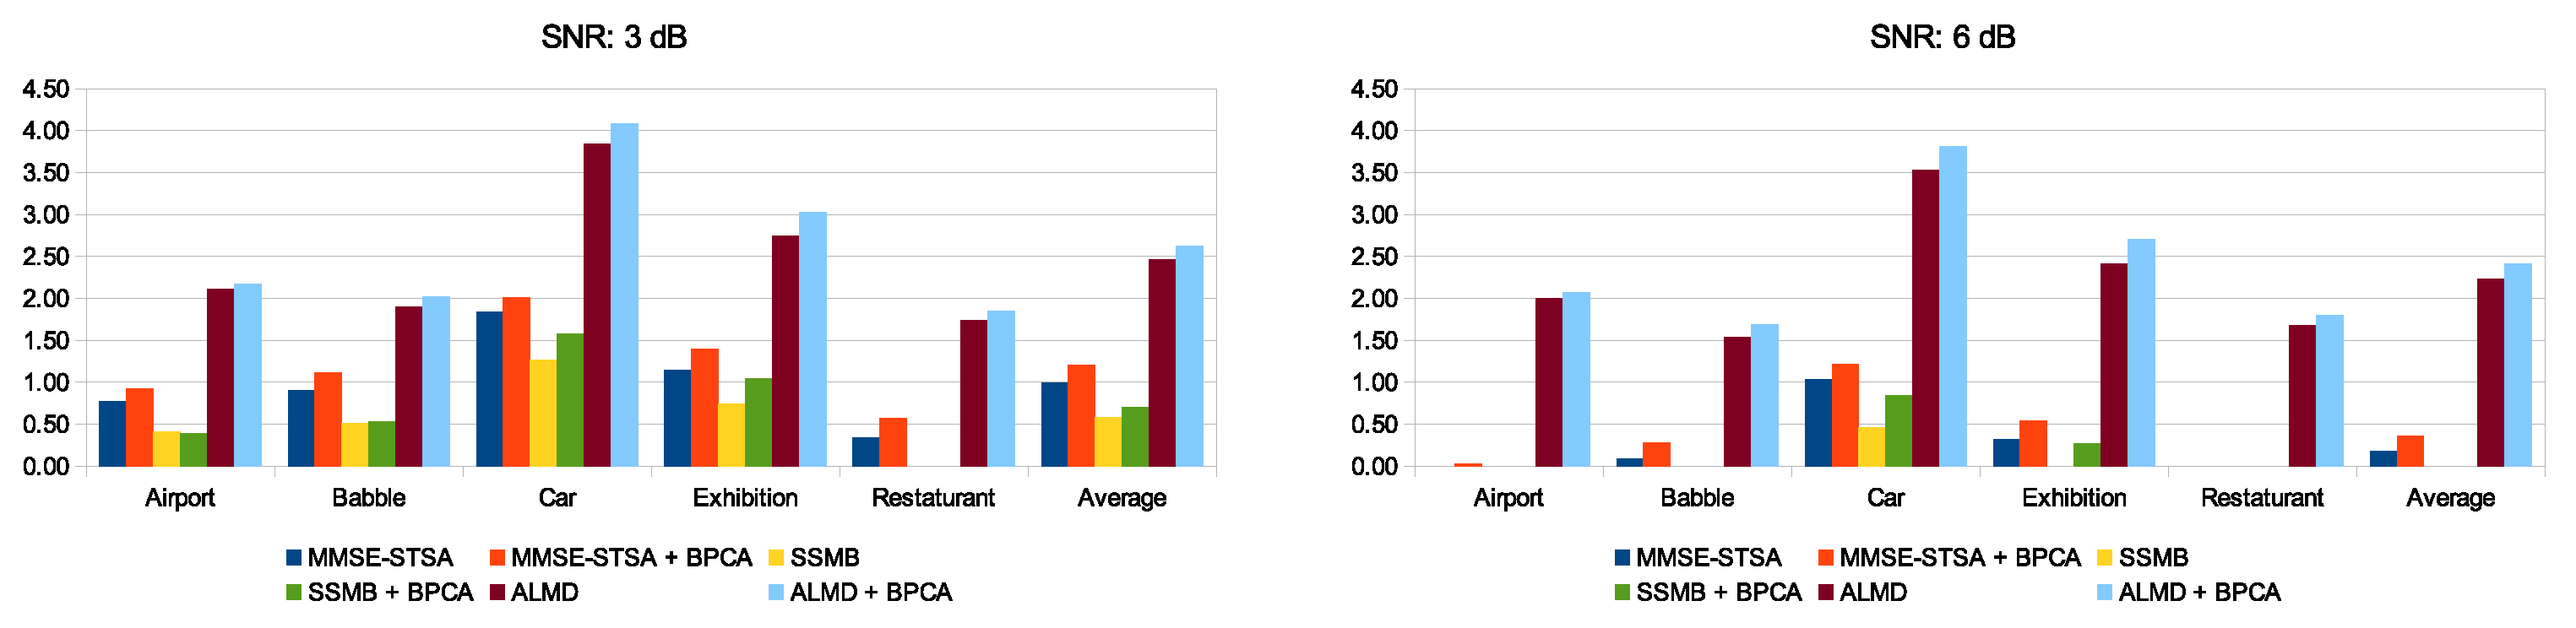
In this section, we have presented the PESQ in Figure 9, and SSNR improvement (in dB) with regard to the noise floor in Figure 10 for all five noise types and six SNR levels. The trend remains the same as that seen in Figure 7 and Figure 8 and Table 2, that is, the introduction of noise suppression in the enhancement framework helps the MMSE-STSA, SSMB, and ALMD methods, which leads to higher metric scores for the recovered speech signals. This performance gain offered by the inclusion of the proposed pre-processing method is terms of both PESQ and SSNR is very significant when noise energy in the contaminated signal is high and gradually gets small as the noise levels get lower. Focusing on SSNR for the cases of SNR −9 and −6 dB in Figure 10, we see that, on average, MMSE-STSA + BPCA methods perform best. For the cases of SNR −3 and above, ALMD + BPCA surpasses MMSE-STSA + BPCA. Similarly, for PESQ scores shown in Figure 9, the top-scoring method, on average, for −9, −6, and −3 dB is MMSE-STSA + BPCA, and for 0 dB and above, it is ALMD + BPCA. Overall, the improvement offered by our noise suppression algorithm to all methods is consistent across different real noise types and over multiple SNR levels.
Figure 9.
PESQ scores for all noise types and all SNR noise levels. (For interpretation of the bar colors, the reader is referred to the web version of this article).
Figure 10.
SSNR improvement in dB with regard to the noise floor scores for all noise types and SNR noise levels. (For interpretation of the bar colors, the reader is referred to the web version of this article).
5.4. Performance Comparison for Babble and Exhibition Noise Types over Multiple Metrics and SNR Levels
Finally, in this section we summarize the score from all performance metrics for the noise types ‘Babble’ and ‘Exhibition’ in Table 3 and Table 4, respectively. For both noise types, performance improvement resulting from inclusion of Block-PCA in the enhancement framework is evident across multiple metrics and is not restricted to PESQ only. Moreover, for both noise types, MMSE-STSA + BPCA shows superior performance under SNR levels of −9, −6, and −3 dB and gets surpassed by ALMD + BPCA for SNR levels of 0 dB and above. Additionally, all three methods experience performance improvement when operating on noise-suppressed signal generated by the proposed algorithm.
Table 3.
All performance metric scores for noise type ‘Babble’ over multiple SNR levels. Best results are highlighted in bold.
Table 4.
All performance metric scores for noise type ‘Exhibition’ over multiple SNR levels. Best results are highlighted in bold.
6. Conclusions
In this manuscript, we have presented a noise suppression method that can help other speech enhancement algorithms when the noise content in the speech signal is large. This is accomplished by applying the speech enhancement algorithms on a noise-suppressed approximation of the signals’ short-time Fourier transform, generated by the proposed Block-PCA algorithm, instead of the original signal. Speech signals from the NOIZEUS database were used to highlight the efficacy of the proposed speech enhancement framework under multiple noise levels and different noise types, and according to various performance indicators. The experiments show that the algorithms working in either the time or frequency domains can utilize the proposed method to preprocess signals if the noise level perceived in the received signal is high, leading to superior speech enhancement performance.
Author Contributions
Conceptualization, A.Z.A. and K.P.V.; Formal analysis, A.Z.A. and A.I.; Methodology, A.Z.A., A.I. and M.N.A.; Supervision, K.P.V.; Validation, M.N.A.; Visualization, M.N.A.; Writing – original draft, A.Z.A.; Writing – review and editing, K.P.V. and M.N.A. All authors have read and agreed to the published version of the manuscript.
Funding
This research received no external funding.
Institutional Review Board Statement
Not applicable.
Informed Consent Statement
Not applicable.
Data Availability Statement
Not applicable.
Conflicts of Interest
The authors declare no conflict of interest.
References
- Loizou, P.C. Speech Enhancement: Theory and Practice; CRC Press: Boca Raton, FL, USA, 2013. [Google Scholar]
- Veisi, H.; Sameti, H. Hidden-Markov-model-based voice activity detector with high speech detection rate for speech enhancement. IET Signal Process. 2012, 6, 54–63. [Google Scholar] [CrossRef] [Scilit]
- Wei, H.; Long, Y.; Mao, H. Improvements on self-adaptive voice activity detector for telephone data. Int. J. Speech Technol. 2016, 19, 623–630. [Google Scholar] [CrossRef] [Scilit]
- Sayoud, A.; Djendi, M. Efficient subband fast adaptive algorithm based-backward blind source separation for speech intelligibility enhancement. Int. J. Speech Technol. 2020, 23, 471–479. [Google Scholar] [CrossRef] [Scilit]
- Bahadur, I.N.; Kumar, S.; Agarwal, P. Performance measurement of a hybrid speech enhancement technique. Int. J. Speech Technol. 2021, 24, 665–677. [Google Scholar] [CrossRef] [Scilit]
- Sanam, T.F.; Shahnaz, C. A semisoft thresholding method based on Teager energy operation on wavelet packet coefficients for enhancing noisy speech. EURASIP J. Audio Speech Music. Process. 2013, 2013, 25. [Google Scholar] [CrossRef] [Scilit]
- Boll, S. Suppression of acoustic noise in speech using spectral subtraction. IEEE Trans. Acoust. Speech Signal Process. 1979, 27, 113–120. [Google Scholar] [CrossRef] [Scilit]
- Kamath, S.; Loizou, P. A multi-band spectral subtraction method for enhancing speech corrupted by colored noise. In Proceedings of the 2002 IEEE International Conference on Acoustics, Speech, and Signal Processing, Orlando, FL, USA, 13–17 May 2002; Volume 4, p. 44164. [Google Scholar]
- Yadava, T.G.; Jayanna, H.S. Speech enhancement by combining spectral subtraction and minimum mean square error-spectrum power estimator based on zero crossing. Int. J. Speech Technol. 2019, 22, 639–648. [Google Scholar] [CrossRef] [Scilit]
- Nahma, L.; Yong, P.C.; Dam, H.H.; Nordholm, S. An adaptive a priori SNR estimator for perceptual speech enhancement. Eurasip J. Audio Speech Music Process. 2019, 2019, 7. [Google Scholar] [CrossRef] [Scilit]
- Farahani, G. Autocorrelation-based noise subtraction method with smoothing, overestimation, energy, and cepstral mean and variance normalization for noisy speech recognition. EURASIP J. Audio Speech Music. Process. 2017, 2017, 13. [Google Scholar] [CrossRef] [Scilit]
- Abd El-Fattah, M.A.; Dessouky, M.I.; Abbas, A.M.; Diab, S.M.; El-Rabaie, E.S.M.; Al-Nuaimy, W.; Alshebeili, S.A.; Abd El-Samie, F.E. Speech enhancement with an adaptive Wiener filter. Int. J. Speech Technol. 2014, 17, 53–64. [Google Scholar] [CrossRef] [Scilit]
- Catic, J.; Dau, T.; Buchholz, J.; Gran, F. The Effect of a Voice Activity Detector on the Speech Enhancement Performance of the Binaural Multichannel Wiener Filter. EURASIP J. Audio Speech Music Process. 2010, 2010, 840294. [Google Scholar] [CrossRef] [Scilit]
- Ma, Y.; Nishihara, A. A modified Wiener filtering method combined with wavelet thresholding multitaper spectrum for speech enhancement. EURASIP J. Audio Speech Music Process. 2014, 2014, 32. [Google Scholar] [CrossRef] [Scilit]
- Ephraim, Y.; Malah, D. Speech enhancement using a minimum-mean square error short-time spectral amplitude estimator. IEEE Trans. Acoust. Speech Signal Process. 1984, 32, 1109–1121. [Google Scholar] [CrossRef] [Scilit]
- Ephraim, Y.; Malah, D. Speech enhancement using a minimum mean-square error log-spectral amplitude estimator. IEEE Trans. Acoust. Speech Signal Process. 1985, 33, 443–445. [Google Scholar] [CrossRef] [Scilit]
- You, C.H.; Koh, S.N.; Rahardja, S. /spl beta/-order MMSE spectral amplitude estimation for speech enhancement. IEEE Trans. Speech Audio Process. 2005, 13, 475–486. [Google Scholar]
- Bahrami, M.; Faraji, N. Minimum mean square error estimator for speech enhancement in additive noise assuming Weibull speech priors and speech presence uncertainty. Int. J. Speech Technol. 2021, 24, 97–108. [Google Scholar] [CrossRef] [Scilit]
- Sayoud, A.; Djendi, M.; Guessoum, A. A new speech enhancement adaptive algorithm based on fullband–subband MSE switching. Int. J. Speech Technol. 2019, 22, 993–1005. [Google Scholar] [CrossRef] [Scilit]
- Roy, S.K.; Paliwal, K.K. A noise PSD estimation algorithm using derivative-based high-pass filter in non-stationary noise conditions. EURASIP J. Audio Speech Music Process. 2021, 2021, 32. [Google Scholar] [CrossRef] [Scilit]
- Hu, Y. Subjective evaluation and comparison of speech enhancement algorithms. Speech Commun. 2007, 49, 588–601. [Google Scholar] [CrossRef] [Scilit]
- Kumar, B. Comparative performance evaluation of MMSE-based speech enhancement techniques through simulation and real-time implementation. Int. J. Speech Technol. 2018, 21, 1033–1044. [Google Scholar] [CrossRef] [Scilit]
- Ji, Y.; Zhu, W.P.; Champagne, B. Speech Enhancement Based on Dictionary Learning and Low-Rank Matrix Decomposition. IEEE Access 2018, 7, 4936–4947. [Google Scholar] [CrossRef] [Scilit]
- Sigg, C.D.; Dikk, T.; Buhmann, J.M. Speech enhancement using generative dictionary learning. IEEE Trans. Audio Speech Lang. Process. 2012, 20, 1698–1712. [Google Scholar] [CrossRef] [Scilit]
- Li, C.; Jiang, T.; Wu, S.; Xie, J. Single-Channel Speech Enhancement Based on Adaptive Low-Rank Matrix Decomposition. IEEE Access 2020, 8, 37066–37076. [Google Scholar] [CrossRef] [Scilit]
- Jolliffe, I.T.; Cadima, J. Principal component analysis: A review and recent developments. Philos. Trans. R. Soc. Math. Phys. Eng. Sci. 2016, 374, 20150202. [Google Scholar] [CrossRef] [Scilit]
- Koch, I. Analysis of Multivariate and High-Dimensional Data; Cambridge University Press: Cambridge, UK, 2013; Volume 32. [Google Scholar]
- Pyatykh, S.; Hesser, J.; Zheng, L. Image noise level estimation by principal component analysis. IEEE Trans. Image Process. 2012, 22, 687–699. [Google Scholar] [CrossRef] [Scilit]
- Zhang, L.; Lukac, R.; Wu, X.; Zhang, D. PCA-based spatially adaptive denoising of CFA images for single-sensor digital cameras. IEEE Trans. Image Process. 2009, 18, 797–812. [Google Scholar] [CrossRef] [Scilit]
- Srinivasarao, V.; Ghanekar, U. Speech enhancement—An enhanced principal component analysis (EPCA) filter approach. Comput. Electr. Eng. 2020, 85, 106657. [Google Scholar] [CrossRef] [Scilit]
- Sun, P.; Qin, J. Low-rank and sparsity analysis applied to speech enhancement via online estimated dictionary. IEEE Signal Process. Lett. 2016, 23, 1862–1866. [Google Scholar] [CrossRef] [Scilit]
- Khalilian, H.; Bajic, I.V. Video watermarking with empirical PCA-based decoding. IEEE Trans. Image Process. 2013, 22, 4825–4840. [Google Scholar] [CrossRef] [Scilit]
- Vaswani, N.; Chellappa, R. Principal components null space analysis for image and video classification. IEEE Trans. Image Process. 2006, 15, 1816–1830. [Google Scholar] [CrossRef]
- Seghouane, A.K.; Iqbal, A.; Desai, N.K. BSmCCA: A block sparse multiple-set canonical correlation analysis algorithm for multi-subject fMRI data sets. In Proceedings of the 2017 IEEE International Conference on Acoustics, Speech and Signal Processing (ICASSP), New Orleans, LA, USA, 5–9 March 2017; pp. 6324–6328. [Google Scholar]
- Seghouane, A.K.; Iqbal, A. The Adaptive Block Sparse PCA and its Application to Multi-Subject fMRI Data Analysis Using Sparse mCCA. Signal Process. 2018, 153, 311–320. [Google Scholar] [CrossRef] [Scilit]
- Caruso, G.; Battista, T.D.; Gattone, S.A. A micro-level analysis of regional economic activity through a PCA approach. In Proceedings of the International Conference on Decision Economics, Ávila, Spain, 26–28 June 2019; pp. 227–234. [Google Scholar]
- Yang, J.; Zhang, D.; Frangi, A.F.; Yang, J.Y. Two-dimensional PCA: A new approach to appearance-based face representation and recognition. IEEE Trans. Pattern Anal. Mach. Intell. 2004, 26, 131–137. [Google Scholar] [CrossRef] [Scilit] [PubMed]
- Bishop, C.M. Pattern Recognition and Machine Learning; Springer: New York, NY, USA, 2006. [Google Scholar]
- Du, J.; Huo, Q. A speech enhancement approach using piecewise linear approximation of an explicit model of environmental distortions. In Proceedings of the Ninth Annual Conference of the International Speech Communication Association, Brisbane, QLD, Australia, 22–26 September 2008. [Google Scholar]
- Hu, Y.; Loizou, P.C. Evaluation of objective quality measures for speech enhancement. IEEE Trans. Audio Speech Lang. Process. 2007, 16, 229–238. [Google Scholar] [CrossRef] [Scilit]
- Quackenbush, S.R. Objective Measures of Speech Quality (Subjective). Ph.D. Dissertation, The University of Michigan, Ann Arbor, MI, USA, 1986. [Google Scholar]
- Klatt, D. Prediction of perceived phonetic distance from critical-band spectra: A first step. In Proceedings of the ICASSP’82 IEEE International Conference on Acoustics, Speech, and Signal Processing, Paris, France, 3–5 May 1982; Volume 7, pp. 1278–1281. [Google Scholar]

Publisher’s Note: MDPI stays neutral with regard to jurisdictional claims in published maps and institutional affiliations. |
© 2022 by the authors. Licensee MDPI, Basel, Switzerland. This article is an open access article distributed under the terms and conditions of the Creative Commons Attribution (CC BY) license (https://creativecommons.org/licenses/by/4.0/).