


Abstract
Corrosion under insulation (CUI) remains a major asset integrity concern in process plants because degradation occurs beneath insulation, cladding, coatings, or protective wrapping, where direct visual access to the metal surface is restricted. A wide range of non-destructive testing (NDT) and monitoring methods have been used to manage CUI; however, these methods generate different levels of engineering evidence. Moisture detection, thermography, and sensor-based monitoring may indicate corrosion-favorable conditions or activity, whereas pulsed eddy current testing (PEC), guided wave testing (GWT), and radiography can support through-insulation screening of suspicious areas. In contrast, ultrasonic thickness measurement (UTM) and phased-array ultrasonic testing (PAUT)-based corrosion mapping are more appropriately positioned as local confirmation methods after access or inspection windows are created. This review examines the screening-confirmation gap in CUI inspection by classifying inspection and monitoring methods based on the evidence type and decision-support value. This review proposes an evidence-chain framework that links risk indication, screening indication, activity monitoring, local confirmation, and asset integrity decision support. This framework shows why screening and monitoring outputs are valuable for prioritization but should not be overclaimed as final evidence for repair planning, remaining life assessment, risk-based inspection (RBI) updates, or fitness-for-service (FFS) decisions. By distinguishing between indirect risk indicators, suspicious wall-loss responses, active-source evidence, and local confirmation data, this review provides a more defensible basis for integrating NDT results into CUI inspection planning and asset integrity management.
1. Introduction
Corrosion under insulation (CUI) remains one of the most persistent inspection and asset integrity challenges in process plants, petrochemical facilities, refineries, power plants, and other industries that rely on insulated metallic equipment. Unlike exposed external corrosion, CUI develops beneath thermal insulation, cladding, coating, fireproofing, or protective wrapping, where early corrosion activity is usually hidden from routine visual examination. Consequently, degradation may remain undetected until the insulation is removed, leakage occurs, wall loss becomes severe, or a failure investigation reveals the true damage condition [1,2].
The difficulty of CUI is related not only to corrosion chemistry but also to inspection accessibility. Moisture ingress, damaged jacketing, coating breakdown, chloride contamination, cyclic wetting and drying, temperature variation, and poor drainage can create localized external corrosion conditions beneath insulation systems [3,4]. However, the external metal surface is physically covered, and direct visual confirmation usually requires partial or complete insulation removal. This process can be costly, labor-intensive, and disruptive, especially when scaffolding, confined access, hot work control, insulation reinstatement, and production constraints are involved [5].
Owing to these access limitations, a wide range of non-destructive testing (NDT) and monitoring techniques have been applied or proposed for CUI inspection. These include pulsed eddy current (PEC), guided wave ultrasonic testing (GWT), real-time or profile radiography, infrared thermography (IRT), acoustic emission testing (AET), ultrasonic thickness measurement (UTM), phased array ultrasonic testing (PAUT), microwave or terahertz (THz) methods, electrochemical sensors, and humidity or fiber-optic monitoring systems [6,7,8,9]. Each technique provides a different type of evidence: some methods indicate possible hidden wall loss, some detect wet insulation or thermal anomalies, some monitor active damage or leakage, and others provide local wall thickness confirmation after access is created.
The diversity of these techniques has created practical problems in CUI inspection planning. In many cases, inspection discussions focus on whether a technique can “detect CUI”, but this question is too broad for engineering decision-making. A screening technique may identify suspicious areas but may not provide an accurate remaining wall thickness. A moisture-sensitive technique may indicate wet insulation; however, moisture does not automatically prove metal loss.
An activity-based method may detect acoustic or electrochemical activity; however, dormant corrosion may remain silent. For example, PEC can support through-insulation screening of wall loss, but its interpretation can be affected by lift-off, insulation thickness, cladding, wire mesh, geometry, and material properties [10,11,12,13]. Similarly, IRT can support the detection of thermal anomalies or trapped moisture; however, it does not directly measure corrosion depth or remaining wall thickness [8,14,15].
This creates what may be called a screening–confirmation gap in CUI inspections. Screening methods are valuable because they reduce unnecessary insulation removal and help prioritize areas for further examination. However, screening indications often require follow-up confirmation by direct visual inspection (VI), UTM, PAUT-based corrosion mapping, radiography testing (RT) or local insulation removal before repair, replacement, fitness-for-service (FFS) or risk-based inspection (RBI) decisions can be justified [16,17]. The gap becomes critical when screening results are treated as final evidence or when confirmatory inspection is planned without understanding the uncertainty, coverage and limitations of the earlier screening method.
Several techniques illustrate this gap. GWT can screen relatively long pipe runs from limited access points, which is attractive for insulated pipework; however, it is generally stronger for detecting and prioritizing suspicious regions than for precise local sizing [7,18]. AET can monitor active cracking, leakage, corrosion-related activity or stress-wave events; however, it does not directly measure static wall loss and may be affected by noise, attenuation and source-location uncertainty [19,20]. Radiographic and gamma backscatter methods can provide profile or imaging evidence through insulation in selected cases; however, their use is constrained by radiation safety, access geometry, pipe diameter, exposure arrangement, and site-control requirements [9].
At the other end of the inspection chain, UTM and PAUT-based corrosion mapping are more directly linked to confirmation and sizing. These methods can provide local wall thickness and corrosion mapping evidence that supports repair planning, remaining-life assessment and FFS evaluation. However, these techniques usually require surface access, coupling, surface preparation, or insulation windowing and are not always as efficient as first-stage broad CUI screening tools [21,22,23,24]. This means that their value is strongest when used as a targeted confirmation after screening or risk-based prioritization has identified the most relevant inspection locations.
The purpose of this review is not simply to list the available CUI inspection methods or compare techniques based on detection capability alone. Instead, it critically reviews CUI-related NDT and monitoring methods according to the type of engineering evidence they generate and the decision-making role they can realistically support. The central argument is that CUI inspection should be understood as an evidence chain: risk indication → screening indication → activity monitoring → local confirmation → asset integrity decision support. This perspective helps avoid overclaiming the capability of any single method and supports a more realistic integration of NDT results into inspection planning, RBI updating, repair decisions and FFS assessment [16,17].
Accordingly, this review examines the screening–confirmation gap across major CUI inspection and monitoring methods, including PEC, GWT, IRT, RT, AET, microwave and THz techniques, embedded monitoring systems, UT and PAUT-based corrosion mapping. The discussion focuses on current applications, evidence types, field limitations and practical decision support. By reorganizing the literature according to inspection function rather than technique name alone, this study provides a decision-oriented framework for linking screening, monitoring and confirmation methods into a more defensible CUI inspection strategy for process plant asset integrity management.
Review Methodology and Literature Selection
The literature for this review was identified through searches of Scopus, Web of Science, ScienceDirect, Google Scholar, and relevant publisher databases. The final body of literature included in this review comprised publications published between 2016 and 2026, reflecting both established and recent developments in CUI inspection, monitoring, and asset-integrity decision support. Keywords and combinations included “corrosion under insulation”, “CUI inspection”, “non-destructive testing”, “pulsed eddy current”, “guided wave testing”, “radiography”, “infrared thermography”, “acoustic emission testing”, “ultrasonic thickness measurement”, “phased-array ultrasonic testing”, “moisture monitoring”, “microwave”, “terahertz”, “risk-based inspection”, and “fitness-for-service”.
Articles were included when they addressed CUI mechanisms, inspection or monitoring techniques, field performance, practical limitations, data interpretation, or asset-integrity decision support. Publications were excluded when they were unrelated to insulated metallic assets, did not provide relevant inspection or monitoring evidence, or substantially duplicated information already covered by a more complete source. Titles and abstracts were initially screened for relevance, followed by full-text review of the most relevant publications. Additional references were identified from the reference lists of key review papers and technical studies.
The review was conducted as a critical narrative review rather than a formal systematic review or meta-analysis. The literature was organized according to the type of engineering evidence generated by each method and its role within the screening–confirmation decision chain.
2. CUI Damage Mechanisms and Inspection Challenges
2.1. Hidden External Corrosion Beneath Insulation Systems
CUI is an external corrosion mechanism, and its inspection is difficult because of physical concealment. In insulated piping, vessels and process equipment, the external metal surface is covered by insulation, cladding, coatings, fireproofing or protective wrapping. These layers are installed for thermal control, personnel protection, process stability or condensation reduction; however, once moisture enters the insulation system, the same layers can retain water and create a concealed corrosive environment at the metal surface [2].
The earliest stages of CUI are rarely visible from the outside of the insulation system. Damaged jacketing, failed sealant, open insulation joints, coating breakdown, water traps, insulation aging, and repeated wetting–drying cycles may create localized corrosion cells while the external appearance of the asset remains acceptable [3,4]. This hidden condition explains why CUI is often discovered only after insulation removal, leakage, wall thickness measurements or failure investigations [2,5].
The inspection challenge is not only that corrosion occurs but also that the evidence of corrosion is separated from the inspector. The outer surface of the insulation system may only show indirect signs such as damaged cladding, staining, wet insulation, abnormal heat transfer, or local deterioration. These signs may indicate increased CUI susceptibility; however, they do not define corrosion morphology, remaining wall thickness, or repair scope. This distinction is central to the screening–confirmation gap addressed in this review [2].
CUI should not be treated as a single material problem. Carbon steel and low-alloy steel are commonly affected by external wall thinning beneath insulation, whereas stainless steels may suffer localized attack or chloride-related degradation when contamination, moisture, and elevated temperatures are present [4,5]. In both cases, degradation depends on the interaction between the material, insulation condition, coating integrity, moisture availability, operating temperature, and inspection accessibility. This multifactorial nature necessitates direct confirmation whenever engineering decisions depend on the actual damage condition.
2.2. Moisture Ingress, Wet Insulation and Corrosion Risk
Moisture ingress is the principal driver of CUI. Water may enter through damaged weatherproofing, failed sealants, insulation joints, pipe supports, penetrations, low points, terminations, vibration-damaged cladding, or poorly maintained protective covers. Once inside the insulation system, moisture can remain trapped at the metal–insulation interface and support external corrosion, especially where coating protection has degraded or where contaminants such as chlorides are present [4,5].
However, wet insulation and confirmed metal loss are not equivalent. Wet insulation is a corrosion risk condition, whereas wall loss is a material degradation outcome. This distinction is important because several inspection and monitoring methods identify moisture, dielectric changes, thermal anomalies, and local environmental activity rather than directly confirming the corrosion depth. IRT, microwave, and THz methods, humidity sensing, and electrochemical monitoring may provide useful early warnings, but their outputs must be interpreted as risk states or activity evidence unless supported by physical confirmation [14,25,26,27].
The physical basis of the CUI inspection challenge is illustrated in Figure 1. Moisture ingress through damaged cladding, failed sealing, penetrations, or insulation terminations can create wet insulation and concealed corrosion at the metal–insulation interface, whereas external signs may remain indirect or visually unreliable.
Figure 1.
Schematic representation of corrosion under insulation, showing moisture ingress, wet insulation, coating degradation, and localized external wall loss beneath the insulation system.
This creates an early screening–confirmation gap. Moisture indication may justify inspection prioritization, insulation opening, or follow-up NDT, but it should not be automatically treated as confirmed CUI damage. Conversely, dry insulation at the time of inspection does not prove that previous wetting did not cause a wall loss. CUI may be intermittent, with corrosion activity increasing during wet periods and becoming less visible during dry periods [4,27]. Moisture-related evidence should be linked with screening and confirmation methods, rather than being interpreted in isolation.
A decision-oriented CUI program should address three questions: whether moisture or environmental conditions are present, whether hidden wall loss is indicated, and whether the wall loss is physically confirmed and severe enough to justify engineering action. Moisture-related methods are valuable because they help identify where CUI may develop; however, confirmation methods are still required when decisions involve repair, replacement, RBI update, remaining-life assessment, or FFS evaluation [16,28,29,30].
2.3. Localised Wall Loss and Uneven Damage Morphology
CUI rarely develops uniformly or predictably. Depending on the insulation condition, water retention behavior, coating breakdown, temperature profile, surface geometry, and drainage conditions, degradation may appear as localized pitting, broad external wall thinning, under-deposit corrosion, damage near pipe supports, corrosion at insulation terminations, or concentrated attack at low points where water accumulates [1,2]. This uneven morphology is one of the main reasons why CUI inspection cannot rely solely on general risk ranking or limited visual observation.
For screening methods, localized corrosion morphology can weaken the relationship between the inspection response and the actual minimum remaining wall thickness. PEC is useful for through-insulation wall loss screening. However, its signal may be influenced by the defect size, lift-off, cladding, insulation thickness, electromagnetic averaging, and material property variations [10,11,12]. A broad area of wall thinning may produce a clearer screening response than a small, deep pit, even though the latter may be more critical for assessing the remaining wall. Similarly, GWT can screen long pipe sections; however, its response depends on the circumferential extent, defect severity, attenuation, welds, bends and supports [7,18,31].
Confirmation methods present a different challenge because of uneven CUI morphology. Conventional ultrasonic thickness measurements can provide quantitative wall thickness data; however, sparse spot readings may miss the deepest localized attack if the measurement grid is not properly planned. PAUT-based corrosion mapping can improve spatial coverage and provide more detailed corrosion distribution; however, it still requires suitable surface access, coupling, calibration, and scan coverage [21,22,23]. The confirmation quality depends not only on the selected method but also on whether the inspection area, scan density, and sampling strategy match the expected corrosion morphology.
This morphological issue is central to the screening–confirmation gap. A screening method can identify a suspicious region without defining the deepest point of attack, whereas a confirmation method can produce reliable local data only for the inspected area. For decision-making, the key issue is not merely whether the CUI is detected, but whether the evidence is representative of the actual damage condition. A robust CUI strategy should use screening methods to guide confirmation and vice versa to determine whether the selected locations adequately capture the most severe damage.
2.4. Access Limitations and Insulation Removal Burden
Direct VI after insulation removal remains one of the most effective methods for confirming CUI. It allows inspectors to observe corrosion products, coating failure, pitting, wet insulation marks, surface staining, insulation damage, and corrosion morphology. However, this method is often expensive and disruptive because the insulation must be removed, the surface may require cleaning, and the insulation system must be reinstated. In many process plant environments, access may also require scaffolding, rope access, confined space control, hot surface precautions, work permits, or production planning [2].
Owing to these practical constraints, complete insulation removal is rarely feasible for large insulated systems. Inspection programs depend on selective opening, risk-based prioritization, and limited inspection periods. Although this approach is practical, it introduces uncertainty in sampling. Only the opened locations are physically confirmed, whereas the adjacent insulated regions may remain unknown. If the selected locations are not representative of the most susceptible or damaged areas, inspection may provide false confidence, even when local confirmation is technically valid.
The burden of insulation removal explains why through-insulation and limited-access methods have become important in managing CUI. PEC, GWT, RT, IRT, microwave or THz methods and embedded monitoring systems all attempt to reduce unnecessary insulation removal by identifying higher-priority locations for follow-up inspection [7,8,9,32]. Their value lies in improving the efficiency of confirmation planning rather than eliminating the need for confirmation when engineering decisions require physical damage evidence.
Insulation removal should be considered part of an evidence chain strategy rather than an isolated inspection activity. Screening and monitoring methods help decide where access should be created, whereas VI, UT, and PAUT-based corrosion mapping determine the actual damage condition at the opened location. This staged approach reduces unnecessary insulation removal while preserving the decision-grade evidence needed for repair planning, RBI updating, remaining life assessment, and FFS evaluation.
2.5. Field Constraints Affecting NDT Reliability
CUI inspection is typically performed under field conditions that are far less controlled than laboratory conditions. The pipe diameter, insulation thickness, cladding type, coating condition, operating temperature, component geometry, surface accessibility, environmental exposure, and inspection window size can all influence the reliability of the NDT evidence. A method that performs well on a simplified test specimen may produce less certain results on an aging process plant asset with wet insulation, repaired jacketing, pipe supports, elbows, welds, branches, restricted access or variable surface conditions.
These field variables affect the inspection methods differently. PEC may be influenced by lift-off, insulation thickness, metallic cladding, wire mesh, pipe curvature, material properties and corrosion morphology [11,12,13,33]. IRT may be affected by emissivity, wind, solar loading, ambient temperature, process temperature, insulation thickness, and heat-flow conditions [14,15,34]. The application of RT and gamma backscatter may be limited by the source–detector geometry, pipe diameter, insulation thickness, radiation safety control, and access orientation [9]. AET may be affected by acoustic attenuation, sensor placement, source-location uncertainty, background noise and whether the degradation source is active during the monitoring period [20,35,36].
These limitations do not render the methods unsuitable for CUI inspection. Instead, they showed that each method must be matched to the inspection objective and field conditions. One method may be highly useful for broad screening but unsuitable for final sizing, whereas another may provide reliable local confirmation but be inefficient for wide-area through-insulation coverage. Similarly, a monitoring method may reveal active leakage or acoustic activity but may not define the remaining wall thickness. The reliability of CUI inspection depends not only on the method capability but also on whether the method output is interpreted within valid evidence.
A field-ready CUI inspection strategy should avoid treating NDT results as simple positive or negative results. Screening indications should be interpreted with awareness of the coverage, sensitivity, geometry, environmental conditions, and method-specific uncertainty. The confirmation results should also be assessed in relation to scan coverage, grid density, access limitations, and the possibility of localized corrosion outside the inspected area. This reliability-aware interpretation is essential for closing the screening–confirmation gap without creating false confidence in the results.
2.6. Screening Evidence Versus Confirmation Evidence
The key challenge in CUI inspection is that different methods generate different levels of evidence. Moisture detection indicates a condition that may promote corrosion in the future. Thermal anomalies suggest abnormal heat transfer or possible wet insulation. Acoustic emissions may indicate active damage, leakage, or corrosion-related acoustic activity. PEC or GWT may indicate a possible hidden wall loss or suspicious pipe sections. UT, PAUT-based corrosion mapping and VI provide stronger local evidence of surface condition, wall thickness, corrosion morphology, and damage extent [5,19,22,23].
This distinction is central to the screening–confirmation gap. Screening methods are valuable because they improve coverage, reduce unnecessary insulation removal, and identify where follow-up inspections should be focused. However, a screening indication should not automatically be treated as decision-grade evidence for repair, replacement, remaining life calculation, or FFS assessment. Such decisions normally require physical or quantitative confirmation, including local VI, UTM, PAUT-based corrosion mapping, RT or other suitable confirmation methods [16,17].
Negative screening results also require careful interpretation. This may reduce the inspection priority but does not necessarily prove that the CUI is absent. Localized pitting, dormant corrosion, poor inspection coverage, unfavorable geometry, attenuation, lift-off variation, and insufficient sensitivity may still leave residual uncertainty. Similarly, a local confirmation result may be technically valid but spatially incomplete if the open area or UT grid does not represent the most damaged region. Both positive and negative findings must be interpreted according to method coverage and evidence sufficiency.
In a decision-oriented CUI program, screening and confirmation should be connected rather than treated as competing approaches. Screening helps determine where inspection should be focused, while confirmation helps determine the actual damage condition and whether engineering action is required. This separation prevents overclaiming of screening technologies while preserving their practical value in reducing access burden, improving inspection prioritization, and supporting more defensible asset integrity decisions.
2.7. Implications for Asset Integrity Decision Support
For asset integrity management, the practical question is not only whether CUI may exist, but also whether the available inspection evidence is sufficiently strong to support a specific engineering decision. Different decisions require different levels of confidence. A broad screening indication may be sufficient to prioritize insulation removal or plan follow-up inspection, but it is usually insufficient for remaining-life calculation, repair boundary definition, or FFS assessment. Conversely, a local UT or PAUT result may provide strong thickness evidence at one opened location, but it may not represent a fully insulated system if corrosion is localized or inspection coverage is limited [22,28,29,30].
This distinction is important because CUI decisions are often based on incomplete evidence. Inspection teams may need to decide whether to remove the insulation, extend the inspection scope, repair the coating, replace the insulation, perform local repairs, conduct additional UT, PAUT-based corrosion mapping, update RBI intervals, or initiate FFS assessments. Each action depends on the type, reliability, and scope of the available evidence. Risk-indication evidence may justify prioritization, screening evidence may identify suspicious regions, activity-monitoring evidence may influence urgency, and confirmation evidence may support repair or continued service decisions.
The screening–confirmation gap becomes critical when the evidence generated by a method is weaker than the decision made. Treating a moisture indication as confirmed wall loss, a PEC response as the final minimum thickness, a guided-wave reflection as repair-ready evidence, or a quiet AET result as proof of no CUI can create a false confidence. Simultaneously, relying only on local confirmation without effective screening may result in inefficient insulation removal and poor sampling of the most susceptible areas. Both problems arise when inspection evidence is not aligned with decision requirements.
A decision-oriented CUI program should connect method selection to the intended engineering outcome. Where the objective is prioritization, indirect or screening evidence may be acceptable if the uncertainty is understood. When the objective is repair planning, the RBI update, remaining life assessment, or FFS evaluation, stronger confirmation evidence is required. In this sense, the purpose of CUI inspection is not simply to detect degradation but to build a defensible evidence chain from risk conditions to screening indications, activity assessment, local confirmation, and asset integrity actions.
This evidence chain perspective provides the basis for the functional classification developed in the following section. Rather than comparing CUI inspection methods as competing technologies, the following section classifies them according to the type of evidence they generate and the level of decision support they can realistically provide.
3. Evidence Types and Functional Classification of CUI Inspection Methods
3.1. From Technique Comparison to Evidence Interpretation
CUI inspections are often discussed in comparison with available NDT techniques. In such discussions, methods are usually described according to their physical principles, application range, advantages, and limitations. Although this approach is useful, it can lead to an incomplete understanding of CUI inspections because different methods do not produce the same type of evidence. A method that detects moisture does not provide the same information as a method that measures the remaining wall thickness. A method that detects active acoustic events does not provide the same evidence as a method that maps the corrosion morphology. The central question in CUI inspection should not be only “which method can detect CUI?”, but rather “what kind of evidence does this method produce, and what decision can that evidence support?” [6,16].
This distinction is especially important because CUI inspection is rarely a single-step activity. In practice, inspection teams often begin with risk-based prioritization, followed by screening of selected insulated assets, local confirmation at suspicious areas, and finally, repair, replacement, RBI update, or FFS assessment. Each stage requires different levels of evidence. A broad screening result may be sufficient to justify insulation removal at selected locations, but it may not be sufficient for remaining life calculation. A local UT thickness reading may support the engineering assessment at one location, but it may not represent the fully insulated system. This mismatch between the evidence generated and the decisions required is the basis for the screening–confirmation gap [16,17,30].
To ensure consistent terminology throughout this review, the following terms are used with specific meanings. “Risk indication” refers to evidence of corrosion-favourable conditions, such as moisture ingress, wet insulation, coating deterioration, or thermal anomalies, but does not constitute proof of metal loss. “Screening indication” refers to evidence that identifies a suspicious region or possible hidden degradation requiring targeted follow-up inspection. “Activity monitoring” refers to time-dependent evidence of active degradation, leakage, corrosion activity, or environmental change during the monitoring period. “Local confirmation” refers to direct or quantitative evidence of physical condition, remaining wall thickness, corrosion morphology, or damage extent obtained using methods such as visual inspection, UT/UTM, PAUT-based corrosion mapping, or suitable local radiography. In this review, “inspection” is used as the broader term describing the overall planned process, which may include risk assessment, screening, monitoring, local confirmation, and subsequent engineering evaluation.
The evidence generated during CUI inspection can therefore be divided into five functional categories: risk indication, screening indication, activity monitoring, local confirmation, and asset integrity decision support. These categories are not mutually exclusive because some methods may contribute evidence at more than one stage. However, the classification helps prevent overclaiming by distinguishing whether a method identifies a corrosion-favourable condition, indicates a suspicious region, monitors active degradation, confirms physical damage, or contributes to an engineering decision.
The functional evidence chain logic is illustrated in Figure 2. The figure shows how different CUI inspection and monitoring methods contribute to different stages of the inspection-to-decision process, from early risk indication to screening, activity monitoring, local confirmation, and final asset integrity decision support.
Figure 2.
Functional evidence chain for CUI inspection linking risk indication, screening, activity monitoring, local confirmation, and asset integrity decision support.
Based on this evidence chain structure, the following subsections examine each evidence category, beginning with the risk-indication evidence.
3.2. Risk Indication: Evidence of Conditions Favourable to CUI
Risk-indication evidence identifies conditions that may promote CUI but does not directly confirm metal loss. This category is important because CUI is strongly influenced by moisture ingress, insulation wetting, coating degradation, temperature cycling, and local environmental conditions. Methods such as IRT, microwave or THz inspection, humidity sensing, fiber-optic sensing, and electrochemical monitoring can indicate wet insulation, thermal anomalies, dielectric changes, local environmental activity, and corrosion-favorable conditions [8,14,25,37].
The value of risk-indication evidence lies in prioritization. This helps identify where CUI is more likely and where further screening or confirmation should be focused. However, risk evidence should not be interpreted as proof of corrosion. Wet insulation may increase the likelihood of CUI, but it is not equivalent to the measured wall loss. A thermal anomaly may indicate trapped moisture or abnormal heat transfer, but it does not define the corrosion depth. Electrochemical or sensor activity may suggest a changing environment, but it may not describe the full extent of the damage. Risk-indication evidence is strongest when used as an early warning or prioritization input in a staged inspection strategy.
3.3. Screening Indication: Evidence of Suspicious Wall Loss or Abnormal Regions
Screening-indication evidence identifies suspicious locations before expensive or disruptive confirmation work is conducted. This role is essential in CUI inspection because full insulation removal is rarely practical in large process plant systems. Methods such as PEC, GWT, selected RT and IRT can improve inspection coverage, reduce unnecessary insulation removal and direct confirmatory inspection toward higher-priority locations [7,8,9,32].
The strength of screening is coverage and prioritization, not necessarily final sizing. A screening method may indicate possible hidden wall loss, abnormal reflection, thermal anomaly, or selected-area profile change, but it may not provide the exact minimum remaining wall thickness or full corrosion morphology. Its output may be influenced by lift-off, cladding, insulation conditions, geometry, attenuation, radiation access, thermal contrast, or defect morphology. Screening evidence is most useful when it answers the question of where to inspect. It becomes insufficient when treated as final evidence for repair, replacement, remaining life calculation, or FFS input without local confirmation.
3.4. Activity Monitoring: Evidence of Active Degradation or Leakage
Activity monitoring provides different information from wall-loss screening. Instead of determining whether metal has already been lost, it indicates whether a degradation-related source, leakage event, corrosion process, or environmental change is active during the monitoring period. This evidence is particularly useful for CUI because corrosion may be intermittent, moisture-driven, dormant during dry periods, or active only under certain operating or environmental conditions.
AET, electrochemical noise, leak monitoring, and related sensor-based methods can provide evidence of activity by detecting acoustic events, corrosion activity, leakage behavior, or changing interface conditions [27,38,39,40]. Their main decision value is the assessment of inspection urgency. If activity is detected near a suspected CUI location, follow-up confirmation may be urgent. However, the absence of activity does not prove the absence of damage. Dormant wall loss, inactive corrosion, or previously formed damage may not generate measurable acoustic or electrochemical signals during the monitoring window. Evidence of activity should be interpreted together with risk history, screening results, and local confirmation data.
3.5. Local Confirmation: Evidence of Physical Condition and Remaining Wall Thickness
Local confirmation provides direct or quantitative information required to support engineering decisions. Direct VI after insulation removal can be used to confirm the surface condition, corrosion morphology, coating damage, and wet insulation marks. UT can provide local remaining wall thickness data. PAUT-based corrosion mapping can extend this evidence to spatial corrosion mapping. These methods are central to repair planning, remaining life assessment, FFS evaluation, and RBI update because they produce stronger physical evidence than risk indication, screening, or activity monitoring [24,41,42].
However, the evidence for confirmation is still limited by coverage and access. The evidence obtained through VI is limited to areas where insulation has been removed. UT spot measurements depend on grid density, probe placement, surface condition, and sampling strategy. PAUT-based corrosion mapping provides richer spatial information but still requires surface access, coupling, calibration, and sufficient scan coverage. Confirmation closes the evidence gap only when it is properly targeted and executed. It should be planned using risk, screening, and monitoring evidence generated earlier in the inspection chain.
3.6. Decision-Support Evidence: Linking Inspection Results to Asset Integrity Action
Inspection evidence is valuable when it supports a defensible asset integrity decision. In CUI management, decisions may include insulation removal, targeted UT, PAUT-based corrosion mapping, coating repair, insulation reinstatement, local repair, component replacement, RBI interval adjustment, FFS assessment or continued operation. These actions require different levels of evidence and confidence.
Decision-support evidence is not produced using a single method. It was developed by integrating risk indication, screening indication, activity monitoring, and local confirmation into a coherent evidence chain. Risk evidence can justify prioritization. Screening evidence can identify where confirmation should be focused. Evidence of activity can influence this urgency. Confirmation evidence can support the repair scope, remaining life assessment, and FFS inputs. The decision-support value lies in aligning each evidence type with the decision being made rather than treating all inspection outputs as equivalent.
3.7. Functional Classification and Review Logic for CUI Inspection Evidence
Table 1 summarizes the functional classification of CUI inspection evidence used in this review. The evidence hierarchy is defined according to the strength and directness of the evidence available for a specific engineering decision, rather than according to the technological sophistication of an inspection method. Risk-indication evidence identifies conditions favourable to CUI but does not confirm metal loss. Screening-indication evidence identifies suspicious regions or wall-loss-related responses and supports targeted follow-up inspection. Activity-monitoring evidence indicates whether degradation-related activity, leakage, moisture, or environmental changes are occurring during the monitoring period. Local-confirmation evidence provides direct or quantitative information on physical condition, remaining wall thickness, corrosion morphology, or damage extent. Finally, asset-integrity decision-support evidence integrates confirmed inspection results with engineering assessment to support repair planning, remaining-life evaluation, RBI reassessment, FFS evaluation, or continued-service decisions.
Table 1.
Functional classification of CUI inspection evidence within the screening–confirmation chain.
This classification provides a review logic for the subsequent sections. Each technique should be evaluated according to four questions: what evidence does it produce, what field conditions influence that evidence, what decision can the evidence support without overclaiming, and what follow-up confirmation is required before asset integrity action. PEC may indicate hidden wall loss but requires UT confirmation.
IRT may indicate wet insulation but requires physical verification. GWT may identify suspicious pipe sections but may require local measurements. AET may identify active damage but may require thickness or visual confirmation. UT and PAUT-based corrosion mapping provide strong local evidence, but screening data are still required to determine where the inspection should be focused.
This framework shifts the review from a technique-by-technique comparison to an evidence-based decision-making process. Method selection should begin with an engineering question rather than equipment availability. The central issue is not whether a method can “detect CUI” in general, but whether its evidence is sufficient for the specific decision being made.
3.8. Scope and Limitations of the Evidence-Chain Framework
The proposed evidence chain is a decision-support framework rather than a universal inspection sequence. The appropriate method, sequence, and confidence level depend on the asset and field context. Insulation material and thickness, metallic cladding or wire mesh, coating condition, operating temperature, pipe diameter and geometry, corrosion morphology, access, surface condition, environmental exposure, and plant operating constraints can alter both method performance and the meaning of an indication. Consequently, transitions from risk indication to screening, monitoring, and confirmation should be adapted to the specific component, expected damage mechanism, consequence of failure, and decision being supported. The framework should therefore be used to structure evidence and follow-up actions, not to prescribe a single fixed inspection route for all CUI applications.
4. Screening Methods for CUI: Capabilities, Evidence Strength and Confirmation Needs
4.1. The Role of Screening in CUI Inspection
Screening methods occupy a central position in CUI inspection because they directly address the practical challenges associated with insulation removal. If every insulated pipe, vessel, tank shell, or process component must be fully stripped before inspection, the cost, labor requirements, and operational disruptions would be extremely high. Process plant inspection programs often rely on screening methods to reduce uncertainty before committing to direct access, insulation removal, ultrasonic thickness measurement, or repair planning [5,6].
The purpose of screening is not necessarily to provide final engineering evidence. Rather, screening helps answer a more practical question: where should confirmation be performed? This distinction is crucial. A screening technique may identify suspicious areas, classify relative risk, or indicate abnormal wall-loss response; however, this does not automatically mean that the method can provide the final minimum remaining wall thickness, exact corrosion morphology, corrosion rate, or FFS input values. In this sense, screening methods are decision filters, not always the final evidence.
The value of screening for CUI lies in four main areas. First, it reduces unnecessary insulation removal by narrowing the inspection effort to higher-risk locations. Second, it provides coverage of areas that would otherwise remain unexamined. Third, it supports risk-based prioritization by identifying locations for follow-up. Fourth, it helps design local confirmation programs using VI, UT and PAUT-based corrosion mapping. These roles are clearly aligned with published literature that treats CUI inspection as a risk-based and staged activity rather than a single universal detection task [2,5].
However, screening introduces uncertainty. A positive screening result may not indicate the exact severity of corrosion. A negative result may not eliminate the possibility of small, localized, or inactive damage. A signal may reflect moisture, geometry, lift-off, cladding, insulation condition, wave attenuation or source location rather than corrosion alone. The screening–confirmation gap is not a failure of the screening methods. This is a consequence of using methods designed to reduce uncertainty rather than eliminate it completely.
This section reviews the principal screening or limited-access methods relevant to CUI, including PEC, conventional EC, ECT, GWT, RT and gamma backscatter, IRT, and microwave, radar, and THz methods.
The screening–confirmation gap described in this review is shown in Figure 3. Screening methods can provide broad coverage and identify areas of potential concern; however, their indications are usually indirect and may not be sufficient for repair, replacement, RBI updates, or FFS assessments without targeted confirmation.
Figure 3.
Screening–confirmation gap in CUI inspections. Screening methods provide broad prioritization, whereas local confirmation methods provide quantitative evidence for asset integrity.
The following subsections compare the principal screening methods in terms of the evidence generated, field uncertainty, and confirmation requirements.
Before discussing PEC in detail, it is important to distinguish it from conventional eddy current (EC) and eddy current thermography (ECT). Conventional EC is primarily a near-surface electromagnetic inspection method and generally requires close probe access to the conductive surface; therefore, it is not directly equivalent to PEC for through-insulation screening. ECT combines electromagnetic induction with thermal imaging and can improve visualization of heating patterns related to near-surface or subsurface defects. However, its applicability to insulated process-plant CUI depends strongly on access, excitation geometry, material properties, insulation configuration, and thermal boundary conditions. In this review, PEC is treated as the more established electromagnetic option for through-insulation wall-loss screening of suitable ferromagnetic components, whereas conventional EC and ECT are considered complementary or application-dependent techniques.
4.2. Pulsed Eddy Current as Through-Insulation Wall-Loss Screening
PEC is one of the most important CUI screening methods because it can assess the wall-loss response through insulation, coating, cladding, or fireproofing, particularly for ferromagnetic components. Its practical value lies in reducing insulation removal, enabling the rapid coverage of selected areas, and prioritizing locations for follow-up confirmation. Early and later PEC studies have demonstrated its relevance for wall thinning through insulation and cladding, inner-wall flaws beneath insulation and field wall-loss assessment in pipework and heater shells [10,12,32,43].
The evidence produced by the PEC is primarily electromagnetic wall-loss evidence. Pulsed excitation induces transient eddy currents in the inspected metal, and the measured signal is influenced by the wall thickness, conductivity, permeability, geometry, and distance between the probe and metal surface. In CUI inspection, this allows the PEC to indicate areas where wall loss may exist beneath the insulation. However, this evidence is not equivalent to a direct local thickness measurement because the PEC does not expose the corrosion surface or necessarily measure the smallest local pit depth. Its output remains a thickness-related response that requires interpretation through models, calibration, signal features or comparative evaluation [44,45,46,47].
This distinction is important because CUI often involves uneven corrosion morphology. Broad and relatively distributed wall loss may produce a useful PEC screening response, whereas highly localized pitting, irregular corrosion, complex geometry, or variable insulation/cladding conditions can weaken the relationship between the PEC signal and the actual minimum remaining wall thickness. In such cases, PEC is more reliable for locating and ranking suspicious regions than for the final local sizing.
A major field limitation is lift-off, which is inherent in CUI inspection because the probe is separated from the pipe wall by insulation, coating, cladding, curvature or protective wrapping. Studies on lift-off reduction and lift-off point-of-intersection methods have shown that signal-processing strategies can reduce this influence. However, they also confirmed that PEC interpretation remains sensitive to probe positioning, insulation thickness, and stand-off variations [33,48,49,50]. Metallic layers within insulation systems, including cladding, foil, reinforcement layers, and wire mesh, can also modify the PEC response and require specific interpretation strategies [11,51].
Recent PEC research has focused on improving the robustness of PECs under variable-field conditions. Developments in phase features, frequency-band selection, principal component analysis, machine learning, wavelet scattering and data-driven compensation aim to improve signal interpretation where lift-off, geometry or material variation complicate response evaluation [52,53,54,55]. Newer approaches, including circular-array PEC and UAV-deployed PEC sensors, indicate that PEC is evolving from a handheld screening method to more deployable and digitally assisted inspection systems [10,56,57,58].
Overall, PEC is a well-established method for through-insulation wall-loss screening of suitable ferromagnetic components and is valuable for improving inspection coverage and prioritization. Its indications can guide targeted UT, PAUT-based corrosion mapping, VI, or other local confirmation, while final repair, replacement, remaining-life, or FFS decisions should be based on confirmed wall-thickness evidence [57,58,59].
4.3. Guided Wave Testing and LRUT as Long-Range Pipe Screening
GWT, including long-range ultrasonic testing (LRUT), addresses a different CUI inspection problem than PEC. Whereas PEC is generally applied over selected local areas to screen for through-insulation wall loss, GWT is designed to screen longer pipe sections from limited access points. This makes it attractive for insulated pipe runs, elevated pipework, pipe racks, road crossings, pipe supports, and other locations where complete insulation removal is impractical.
The evidence produced by the GWT is based on the propagation, reflection, mode behavior, and attenuation of guided ultrasonic waves. A transducer array or collar excites guided wave modes that travel along the pipe, and changes in the received signal may indicate geometric features, welds, supports, corrosion, wall thinning or other discontinuities. Foundational guided-wave pipe inspection work established its value for long-range pipe defect detection, while subsequent reviews and pipeline-focused studies expanded its use for corrosion detection and structural health monitoring [60,61,62,63].
The main strength of GWT is its extensive coverage. A single access location can provide information over a pipe length that would otherwise require extensive insulation to be removed. This makes guided waves useful for CUI screening because they can help rank pipe sections for follow-up inspections. This is especially valuable when the objective is to identify whether a pipe run contains suspicious regions rather than mapping every corrosion pit.
However, the same long-range nature also creates interpretation challenges. Guided waves interact with all features along the propagation path, including welds, bends, supports, branches, coatings, insulation, clamps and corrosion. The signal amplitude, reflection strength, and attenuation may reflect both damage and non-damage features. Reviews of the limitations of GWT emphasize the influence of wave mode selection, frequency, temperature, attenuation, defect orientation, pipe geometry, and environmental conditions [18,31,64,65]. These variables complicate the conversion of guided-wave indications into exact local wall loss severity.
Defect morphology is another important limitation. Localized pitting, narrow axial corrosion, broad circumferential wall loss, and corrosion under pipe supports may generate different guided wave responses. Studies on quantitative wall-thinning assessment, group delay, multifrequency identification, and probabilistic imaging have attempted to improve severity estimation and defect characterization [66,67,68,69]. These developments are important, but field interpretation still depends strongly on pipe complexity, propagation conditions and follow-up verification.
In the screening–confirmation framework, GWT is particularly useful as a pipe-section prioritization method. It can identify suspect zones and improve the efficiency of subsequent confirmation. However, final wall thickness assessment, repair planning, or FFS input normally requires targeted UT, PAUT-based corrosion mapping, radiography, or local insulation removal at the indicated locations [70,71,72,73].
The principal advantage of GWT/LRUT is long-range coverage from limited access locations, making it useful for ranking pipe sections for further inspection. However, welds, bends, supports, branches, attenuation, wave-mode selection, temperature, and defect morphology complicate local severity estimation. Accordingly, GWT is best used to identify suspect pipe sections, with targeted UT, PAUT-based corrosion mapping, radiography, or local inspection used where quantitative confirmation is required [18,31,64,65,66,67,68,69,70,71,72,73].
4.4. Radiography, Digital Radiography and Gamma Backscatter as Selected-Area Profile Screening
Radiographic methods occupy an intermediate position in the CUI evidence chain. Unlike thermography or moisture-sensitive methods, radiography can provide profile- or image-based evidence of wall-loss geometry. Unlike UT- or PAUT-based corrosion mapping, it can inspect selected areas through insulation without requiring direct surface contact. This gives radiography a hybrid role as selected-area screening, profile confirmation or local evidence gathering, depending on access, geometry, inspection objective and image quality.
Profile radiography, real-time radiography, digital radiography, and gamma backscatter have been applied or proposed for CUI-related inspections. Gamma backscatter is particularly relevant when single-side access is required because it can provide information on wall thickness variations and defects in insulated pipes and metal plates [9]. Radiographic methods may support the selected-area profile assessment, where geometry and site controls permit.
The main value of RT is targeted visualization of wall thinning, profile change, local metal loss, density variation, or under-insulation degradation in selected areas where direct access is difficult.
However, radiographic methods are strongly constrained by field deployment conditions. Radiation safety is the most obvious limitation, as exclusion zones, permits, source control, personnel safety and production restrictions can limit when and where the method is practical. Geometry is another major constraint. The source–detector alignment, pipe diameter, insulation thickness, component orientation, adjacent structures, and access direction all influence whether useful images can be obtained. For backscattering methods, the scattering geometry, signal strength, and material thickness further affect the interpretation.
RT is therefore most appropriate for targeted assessment rather than universal broad-area CUI screening. Where accurate remaining wall thickness, corrosion mapping, repair-boundary definition, remaining-life assessment, or FFS input is required, radiographic evidence may need to be supplemented by UT, PAUT-based corrosion mapping, VI, or other suitable local confirmation.
4.5. Infrared and Active Thermography as Thermal-Anomaly and Moisture-Risk Screening
IRT is an attractive method for CUI inspection because it is rapid, non-contact, and capable of surveying large areas. In CUI applications, the main value of IRT is the detection of thermal anomalies, wet insulation patterns, trapped moisture, and abnormal heat-transfer behavior. This makes thermography particularly useful as a risk indication or anomaly screening method rather than as a direct wall thickness measurement technique [8,15,74,75].
The evidence produced by passive IRT is indirect. A thermal anomaly may suggest moisture under insulation, damaged insulation, local heat loss, process variation or abnormal surface conditions. This is useful because wet insulation is a major risk factor for CUI. However, the thermal signal does not automatically prove the corrosion depth or remaining wall thickness. Surface emissivity, ambient temperature, solar loading, wind, process temperature, insulation thickness, and water distribution can influence the observed thermal patterns [14,34,76,77].
Active, pulsed, lock-in, and eddy-current pulsed thermography extend the role of thermal methods beyond passive heat-pattern observation. These techniques use controlled thermal or electromagnetic excitation to reveal subsurface defects, corrosion blisters, hidden cracks, coating-related degradation, and wall thinning signatures [78,79,80,81]. Recent studies on in-pipe pulsed thermography, synthetic-data approaches, and algorithmic pipe corrosion detection have shown that thermal methods are moving from simple visual screening to more quantitative or semi-quantitative interpretations, especially when combined with image processing and AI [82,83,84].
Thermographic interpretation remains strongly dependent on heat-transfer conditions, including surface emissivity, ambient and process temperature, insulation thickness, moisture distribution, and environmental exposure. IRT is therefore most appropriate for identifying thermal or moisture-related anomalies and prioritizing follow-up inspection. Where minimum remaining wall thickness, repair scope, remaining-life assessment, or FFS input is required, confirmation using VI, UT, PAUT-based corrosion mapping, RT, or another suitable local method remains necessary.
4.6. Microwave, Radar and Terahertz Methods as Emerging Hidden-Condition Screening
Microwave, radar, millimeter-wave, and THz methods represent an emerging group of CUI-related screening technologies. Their relevance lies in their interaction with dielectric materials, coatings, insulation and moisture-sensitive layers. In CUI inspection, this provides potential value for detecting water in insulation, dielectric contrast, coating degradation, trapped moisture, or hidden corrosion beneath non-metallic layers.
Microwave methods have been studied to detect water as a cause of CUI in thermally insulated pipelines. Jones et al. demonstrated that the insulated pipe configuration can support microwave-based inspection of water inside insulation and that bends can influence long-range microwave signal behavior [85,86]. This is important because trapped moisture is one of the earliest risk conditions for CUI, although moisture detection alone does not prove wall loss.
Microwave holographic radar and related techniques have also been explored for defects in thermal insulation coatings and reinforced polyurethane foam [85,86]. These methods are relevant because insulation systems are dielectric, multilayered and often difficult to inspect using conventional methods. However, their evidence is usually related to insulation conditions, hidden discontinuities, or dielectric variations rather than direct remaining wall thickness measurements.
THz methods extend this concept to coating and undercoating corrosion assessments. Studies on the THz imaging of corrosion in coated steel plates, coating thickness characterization, and corrosion beneath epoxy protective coatings have shown that THz methods can provide information about hidden corrosion or coating-related degradation [25,87,88,89]. Recent work on the NDT quantification of corrosion under coatings using THz time-domain spectroscopy suggests a movement toward a more quantitative interpretation of the results [90].
Microwave and THz methods remain emerging for process-plant CUI applications. Their field use is constrained by calibration, material variability, curvature, insulation geometry, moisture distribution, coating condition, signal interpretation, and equipment deployment. Their strongest current role is hidden-condition or moisture-related screening, while decisions requiring quantitative wall-loss assessment, repair scope, remaining-life evaluation, or FFS input require suitable local confirmation such as UT, PAUT-based corrosion mapping, or VI.
4.7. Comparative Evidence Strength and Confirmation Needs of Screening Methods
The screening methods reviewed in this section provide different levels and types of evidence for the inspection of CUI. PEC generates wall-loss-related electromagnetic evidence and is particularly useful for through-insulation screening of ferromagnetic components. GWT provides long-range reflection or attenuation evidence and is valuable for pipe run prioritization. RT and gamma backscatter offer selected area profiles or image-based evidence, whereas infrared and active thermography mainly provide thermal anomalies or moisture risk evidence. Microwave, radar, and THz methods are emerging approaches for detecting hidden moisture, dielectric changes, coating degradation, and undercoating anomalies.
This distinction is important because the strength of the screening results depends on the decision being made. If the objective is to prioritize insulation removal or identify areas for follow-up inspections, screening evidence may be sufficient. However, if the objective is to define repair boundaries, calculate the remaining life, update FFS inputs, or justify replacement, screening evidence alone is usually insufficient to achieve these objectives. In such cases, targeted confirmation using VI, UT, PAUT-based corrosion mapping, or RT is necessary.
Table 2 summarizes the screening methods reviewed in this section according to the evidence type, decision value, field uncertainty, and confirmation requirements. The table emphasizes that screening methods are useful for prioritization and inspection planning; however, their outputs should not be overclaimed as final engineering evidence without suitable confirmation.
Table 2.
Screening methods for CUI and their confirmation requirements.
The comparison in Table 2 shows that screening methods reduce the coverage problem but do not fully close evidence gaps. Their value lies in directing confirmatory inspection toward the most relevant locations, whereas final repair, replacement, RBI, or FFS decisions require physical or quantitative confirmation.
Overall, screening methods are best understood as coverage and prioritization tools rather than as final decision evidence. They reduce unnecessary insulation removal and help identify where confirmation should be performed; however, they do not fully remove uncertainty regarding corrosion morphology, minimum remaining wall thickness, or repair extent. In practical CUI management, screening closes the coverage gap and confirmation closes the evidence gap. A robust inspection strategy requires a staged evidence chain in which screening, monitoring, local confirmation, and asset integrity decision support are deliberately connected.
5. Activity and Monitoring Methods for CUI: Active Damage, Leakage and Risk-State Evidence
5.1. Why Activity and Monitoring Evidence Is Different from Screening Evidence
Screening methods help identify suspicious locations before direct confirmation. Activity and monitoring methods answer different questions. Instead of asking whether hidden wall loss may already exist, they asked whether degradation-related activity, leakage, environmental change, or corrosion risk occurred during the monitoring period. This distinction is important because CUI is not only a problem of hidden metal loss but also a problem of changing exposure conditions, intermittent wetting, active corrosion processes, leakage risk, and uncertainty between inspection intervals.
In CUI inspection, activity evidence is especially valuable when the damage process is dynamic. Moisture may enter and dry out repeatedly. Corrosion may accelerate during wet periods and slow down during dry periods. Leakage may begin at a local wall loss site before the full extent of the damage is known. Inspection programs that rely only on one-time screening or periodic wall thickness confirmation may overlook temporal changes. Activity and monitoring methods can help fill this time-dependent evidence gap [27,40,51].
However, activity evidence is not the same as confirmation. AET, electrochemical noise, humidity sensors, and fiber-optic monitoring can indicate active events, moisture ingress, environmental change, or corrosion activity; however, they do not always provide the minimum remaining wall thickness or full corrosion morphology. Their contribution to CUI management is strongest when linked to screening and confirmation methods [6,41]. This section discusses these methods as part of the CUI evidence chain rather than as standalone replacements for UT, PAUT or direct VI.
5.2. Acoustic Emission Testing as Active-Source and Leakage-Monitoring Evidence
AET is one of the most important activity-monitoring methods for process plant assets because it detects transient elastic waves generated by active sources. These sources may include crack growth, leakage, coating disbondment, corrosion-related activity, structural damage, cavitation, pressure boundary events, and other energy-release processes. Unlike PEC, GWT, and UT, AET does not primarily measure the wall thickness or map the corrosion geometry. It listens for active events that occur during the monitoring period [19,91,92].
This gives AET a distinct role in CUI inspections. In a hidden corrosion problem, a wall-loss screening method may identify possible degraded regions; however, it may not indicate whether the degradation is currently active. AET can contribute to this question by detecting acoustic activity associated with leakage, cracking, coating disbondment or corrosion-related processes. Studies on AE corrosion feature extraction, severity prediction, leakage localization, and leak-size classification support its value for active degradation and leakage monitoring [93,94,95,96].
For CUI management, this evidence is useful because active leakage or progressive cracking may require more urgent attention than dormant historical wall losses. AET may also support the monitoring of pressure equipment, tanks, pipelines, valves, bolted joints, and other components where active damage or leakage is a concern [39,97,98]. However, AET evidence should not be interpreted as direct proof of the corrosion depth or remaining wall thickness. A detected acoustic event is not automatically CUI, and a quiet AET result does not prove the absence of wall loss. Dormant corrosion, inactive damage or previously formed metal loss may not emit measurable acoustic signals during the monitoring window.
5.3. Signal Interpretation, Localisation and Noise Limitations
The practical value of AET depends heavily on the interpretation of the signal. AE signals are influenced by the source mechanism, wave propagation, attenuation, sensor placement, coupling, background noise, structural geometry, and operating conditions. In process plants, this problem is especially challenging because flow turbulence, valve operation, pumps, vibration, mechanical impact, friction, thermal expansion and environmental disturbance can all generate acoustic activity that may not be related to CUI [20,35,99,100].
Source localization is central to the usefulness of AET. If the AET detects activity but cannot locate the source with sufficient confidence, the result may be difficult to convert into a follow-up inspection. Localization accuracy can be affected by complex piping geometry, supports, insulation, attenuation, multiple propagation paths, and sensor arrangement [20,101]. This is particularly important for CUI because the final decision often requires targeted insulation opening, UT, PAUT-based corrosion mapping or visual confirmation at a specific location.
Modern AET research increasingly uses feature extraction, wavelet analysis, support vector classifiers, convolutional neural networks, blind source separation, and other machine-learning-assisted methods to improve source classification and noise discrimination [102,103,104,105]. These approaches can strengthen interpretation, but their reliability depends on validation under realistic field conditions because laboratory-trained models may not transfer directly to noisy operating plants. Consequently, the decision value of AET depends on the confidence with which the detected source can be localized and classified.
5.4. AET in the CUI Evidence Chain
In the CUI evidence chain, AET should be positioned as activity evidence rather than wall loss screening or local-size evidence. It is not a broad wall-loss screening method, such as PEC or GWT, nor a local confirmation method, such as UT, PAUT-based corrosion mapping, or direct VI. Its value lies in identifying active behaviors that may change inspection priority, urgency, or monitoring strategy [19,38,39].
This role is strongest when AET is interpreted together with other evidence. If the PEC indicates a possible hidden wall loss and the AET detects active acoustic activity in the same area, the combined evidence may justify urgent local confirmation. If the IRT indicates wet insulation but the AET is quiet, the area may still require follow-up, although the urgency may differ. If UT confirms wall loss but AET detects no activity, the decision may focus on the remaining thickness, corrosion history, and inspection interval rather than on immediate leakage activity [106,107].
A quiet AET result should not be used to dismiss CUI risk, because corrosion may be dormant, intermittent, or already present as historical wall loss. AET therefore contributes primarily to urgency assessment and active-source monitoring within a staged inspection strategy [20,36].
5.5. Electrochemical Monitoring as Corrosion-Activity Evidence
Electrochemical monitoring methods provide different forms of evidence for corrosion activity. Instead of detecting acoustic waves, they detect the electrochemical behavior associated with corrosion processes. This can include corrosion potential changes, electrochemical noise, linear polarization resistance, impedance behavior, mass loss, or other indicators of corrosion activity at the metal–insulation interface [27,51].
Electrochemical methods are particularly relevant to CUI because they are strongly influenced by wetting, drying, and local electrolyte conditions. A novel electrochemical method for monitoring CUI has shown that electrochemical approaches can be adapted to hidden corrosion environments [27,51]. Caines et al. demonstrated increased corrosion activity for insulated pipework using simplified electrochemical potential noise and linked the monitoring evidence with visual and mass loss confirmation [37]. This is important because it shows how activity evidence can be validated against physical degradation.
In situ monitoring of CUI using electrochemical and mass loss measurements further supports the value of electrochemical evidence [27,37]. These methods can provide information on corrosion activity over time, which may be difficult to obtain from a single inspection. They can be particularly useful for testing insulation systems, coatings, temperature exposure, and moisture ingress scenarios.
However, electrochemical monitoring has several limitations. Sensors are local. They measure the condition in which they are installed, which is not necessarily the worst location for the asset. They may be affected by the electrolyte availability, contact conditions, temperature, insulation material, sensor durability, and calibration. Their evidence may show corrosion activity but may not directly define the remaining wall thickness across the entire component [27,51].
Electrochemical monitoring can support early warning, risk trending, and monitoring of known problem zones. Where repair sizing, remaining-life assessment, or FFS input is required, the monitoring evidence should be supported by suitable physical confirmation [108].
5.6. Humidity, Moisture and Fiber-Optic Monitoring
Humidity, moisture, and fiber-optic monitoring systems provide evidence of risk states rather than direct confirmation of corrosion. Their main role is to detect environmental changes under insulation that may lead to CUI [4,26,27]. In this sense, they are closer to early warning systems than conventional inspection methods.
Humidity measurement has already been combined with AET in CUI monitoring studies, demonstrating that moisture-related information can help interpret acoustic activity [27,40]. This is valuable because AET signals may be more meaningful when linked to wetting and drying cycles. If acoustic activity increases during wet periods, the evidence for active CUI becomes stronger than that of acoustic data alone.
Fiber-optic sensing and distributed monitoring technologies provide additional opportunities. Fiber-optic approaches can provide spatially distributed or continuous sensing along pipelines or assets, potentially offering early warnings for changes associated with moisture, temperature, strain, and corrosion [109,110,111,112,113]. These technologies are attractive because CUI is often spatially distributed and difficult to capture using point inspections.
However, fiber-optic and embedded monitoring methods face practical challenges. The installation under insulation must be durable. The sensors must survive thermal cycling, moisture, mechanical disturbances, and maintenance activities. The system must be calibrated and interpreted accurately. A detected change may indicate moisture, temperature shifts, strain, or environmental variations rather than confirmed corrosion. These systems require validation against inspection evidence [111,113].
In the screening–confirmation framework, humidity and fiber-optic systems provide risk state monitoring. They indicate that conditions are becoming more favorable for CUI; however, they do not eliminate the need for wall loss screening or local confirmation [22,51].
5.7. Embedded Sensors and Digital Monitoring Systems
Embedded and permanent monitoring systems represent a shift from periodic inspection to continuous or semi-continuous awareness of asset conditions. This is attractive for CUI management because moisture ingress, corrosion activity, interface change, and leakage risk may develop between inspection intervals. Sensor-based corrosion monitoring at the metal–insulation interface is particularly relevant because CUI occurs beneath the insulation and is often inaccessible to routine VI [26,114].
Flexible moisture sensors, electrochemical sensors, and fiber-optic technologies can contribute to different forms of environmental, corrosion, and distributed monitoring [4,26,27]. Combined monitoring approaches, such as acoustic emission with electrochemical noise, suggest that multi-sensor evidence may improve the interpretation of the corrosion state [105,109].
However, embedded monitoring does not automatically provide a complete assessment of the CUI. The main limitation of this study is its representativeness. A sensor may perform well at its installation point, whereas corrosion may occur elsewhere on the asset. Distributed sensing can improve coverage, but its outputs still require interpretation in relation to insulation conditions, geometry, operating history, and follow-up inspection evidence. Sensor drift, calibration, installation quality and maintenance disturbance can also affect data reliability. Embedded systems should be treated as monitoring evidence within the broader CUI evidence chain and not as a replacement for wall-loss screening or local confirmation.
5.8. Integrated Role of Activity and Monitoring Methods in the CUI Evidence Chain
The value of activity and monitoring methods becomes strongest when they are interpreted together with screening and confirmatory data. These methods do not determine whether a hidden wall loss already exists; rather, they help identify whether the condition is active, changing, intermittent, or environmentally favorable for the progression of CUI. In this sense, they add a temporal dimension to CUI inspection that one-time screening or local thickness measurements may not fully capture [37,38].
AET contributes active-source evidence by detecting acoustic activity associated with leakage, cracking, coating disbondment, corrosion-related events, and pressure-boundary behavior. Electrochemical monitoring provides corrosion activity evidence at the monitored interface, whereas humidity, moisture, and fiber-optic systems provide risk states or distributed environmental evidence. Embedded sensors further extend this role by supporting the continuous or semi-continuous monitoring of high-risk insulated assets. These outputs can refine inspection priorities and urgency, especially when interpreted alongside PEC, GWT, IRT, RT, PAUT-based corrosion mapping or VI results [38,115].
Table 3 summarizes the activity and monitoring methods discussed in this section according to the type of evidence they generate, decision values, key uncertainties, and typical follow-up actions. These methods add a temporal or risk-state dimension to CUI inspection; however, their outputs should be interpreted together with screening and confirmation evidence before asset integrity decisions are made [16,17,30].
Table 3.
Activity and monitoring methods for CUI and their evidence roles.
The comparison in Table 3 shows that activity and monitoring methods strengthen CUI inspection by identifying active degradation, leakage potential, moisture trends or changing environmental conditions. However, they do not replace the need for local confirmation. Their strongest role is to refine inspection urgency, support prioritization, and guide targeted follow-up rather than independently defining corrosion morphology, minimum wall thickness, or repair scope.
6. Confirmation and Sizing Methods for CUI: From Indication to Engineering Evidence
6.1. Why Confirmation Is Necessary After Screening and Monitoring
Screening and monitoring methods reduce uncertainty; however, they do not always provide the level of evidence required for making engineering decisions. This distinction is especially important in CUI inspection because many methods identify indirect or partial evidence. PEC may indicate a possible hidden wall loss. IRT may indicate wet insulation or thermal abnormality. The GWT can identify suspicious pipe sections. The AET can detect active acoustic sources. Electrochemical or humidity sensors can indicate corrosion activity and moisture-related risks. These results are valuable; however, they usually do not define the actual corrosion morphology, minimum remaining wall thickness, or repair boundary.
Confirmation methods are required to convert these indications into physical evidence. In practical terms, confirmation answers questions that screening cannot fully resolve, such as whether corrosion is present. What is the minimum remaining wall thickness? Is the damage localized or widespread? Does the corrosion morphology require repair? Is the asset still fit for use? Should the RBI interval be shortened? These questions require more direct information than screening signals can provide.
In the CUI evidence chain, confirmation methods bridge the gap between suspicion and action. They help determine whether a screening indication represents real damage, whether the damage is severe enough to require intervention, and whether the evidence is strong enough for repair, replacement, remaining life calculation, or FFS assessment of the structure. Direct inspection, UT and PAUT-based corrosion mapping remain central even when advanced through-insulation or monitoring methods are available [6,24,41].
6.2. Direct Visual Inspection After Insulation Removal
Direct VI after insulation removal remains the most straightforward method for confirming CUI. It exposes the external metal surface and allows inspectors to observe corrosion products, coating failure, surface staining, pitting, wet insulation marks, under-deposit corrosion, jacketing damage and local corrosion morphology. This evidence is important because many screening methods infer possible CUI indirectly, whereas VI confirms the actual surface condition [2,5].
The strength of direct VI lies in its simplicity and effectiveness. When insulation is removed, inspectors can determine whether corrosion exists and whether the insulation system has allowed water ingress. Visual evidence can also aid in the interpretation of other inspection results. For example, if the IRT indicates a wet region, the VI can confirm whether the insulation is actually wet and whether metal degradation has occurred. If the PEC indicates wall loss, the VI can help determine whether the signal corresponds to broad corrosion, localized attack, or other surface conditions.
However, the VI has certain limitations. It is costly, labor-intensive, and disruptive because insulation must be removed and reinstated. It may require scaffolding, rope access, confined space planning, surface cleaning, safety preparation, and insulation repair. It is also spatially limited; only the opened area is confirmed, while adjacent insulated regions may remain uncertain [5,6]. The VI is strong as confirmation evidence but weak as a broad inspection strategy if applied without prioritization.
Direct VI is rarely efficient as a standalone full-coverage method for large process plants; however, it is highly valuable when targeted by screening, risk ranking or monitoring. In a decision-oriented CUI program, VI should be used when the expected information justifies the cost of access. It is not replaced by screening methods; rather, screening methods should help determine where visual confirmation is most required.
6.3. Ultrasonic Thickness Measurement as Quantitative Local Confirmation
UTM is one of the most widely accepted local confirmation methods for CUI because it provides quantitative remaining wall thickness data. This is essential for corrosion assessment, repair planning, remaining life estimation, and FFS input. Unlike moisture detection or acoustic activity monitoring, UT can provide direct numerical thickness values at the measurement points [22,108,116,117].
In CUI inspection, UT is typically performed after local insulation removal or through inspection windows. Once the surface is accessible and suitably prepared, UT can determine whether a component has lost wall thickness and whether the measured thickness approaches the minimum allowable limits. This makes UT a natural follow-up method after PEC, GWT, IRT or AET indications.
The main strength of UT is its quantitative credibility. Engineering decisions often require wall thickness data, and UT is a familiar and accepted method for this purpose. It is also relatively flexible and can be applied to pipes, vessels, tanks, plates and other metallic components. For many CUI cases, UT provides the first direct numerical evidence that a screening indication corresponds to an actual wall loss.
However, UT does not automatically confirm completion. Conventional UT is local in nature. A single thickness point may not represent the most corroded location, especially when CUI is localized, irregular, or pitted. The measurement results depend on probe placement, grid density, surface condition, coupling, calibration, and operator technique. If only a few readings are taken, the inspection may miss the deepest local wall loss. UT confirmation must be planned carefully, especially after screening methods identify broad or uncertain indication zones.
The screening–confirmation gap can persist even within the confirmation itself. A PEC indication may lead to UT measurement; however, if the UT grid is too sparse, the true minimum thickness may still be missed. A GWT indication may identify a pipe section, but local UT points must be selected appropriately to represent the suspected damage. Thus, confirmation is not simply “do UT”; it requires a sampling strategy that matches the expected CUI morphology.
6.4. PAUT and Corrosion Mapping as Spatial Confirmation
PAUT-based corrosion mapping can provide stronger spatial confirmation than isolated UT thickness measurements. Instead of relying only on spot measurements, these methods can help define wall-loss distribution, minimum thickness locations and the approximate extent of local corrosion after surface access has been created [118]. This is useful in CUI management because repair decisions often depend not only on the lowest measured thickness but also on the affected area, damage pattern and repair boundary.
Quantitative experimental evidence supports this confirmation role. Tai et al. [24] evaluated phased-array corrosion mapping on a 15 mm-thick A36 low-carbon-steel specimen over a temperature range of 30 °C to 250 °C at 10 °C intervals, generating 69 data sets. Machined slots of 2, 4, 6 and 8 mm depth were used to represent general wall loss, while flat-bottom holes represented localized corrosion. The study demonstrated clear detection of 6 mm-deep localized defects corresponding to 40% wall loss, while 3 mm-deep defects corresponding to 20% wall loss were also detectable, although characterization of the smallest 5 mm-diameter defects was less distinct. At elevated temperatures up to 250 °C, the localized wall-loss features remained identifiable, although image quality and sensitivity requirements became more demanding. These results demonstrate the value of PAUT-based corrosion mapping as a quantitative confirmation method while also showing that defect size, temperature and signal quality influence the confidence of the resulting engineering evidence [24].
However, PAUT-based corrosion mapping should not be considered a primary CUI screening method. It requires insulation removal, inspection windows, surface preparation, coupling, calibration, suitable geometry, and sufficient scan coverage. Its role is optimally positioned as targeted confirmation following the identification of relevant locations through risk ranking, screening indication, or visual inspection. When used in this way, they provide decision-grade local evidence for repair planning, remaining-life assessment, RBI update or FFS assessment [119].
6.5. Radiography as Partial Confirmation Evidence
Although RT was discussed in Chapter 4 as a screening or selected-area profile method, it can also contribute to confirmation in specific contexts. Radiographic and gamma backscatter methods can provide profiles or image evidence of wall loss through insulation, sometimes without complete insulation removal [9]. This can be useful when local access is difficult or when a physical profile is required before deciding whether to open the insulation.
The strength of RT lies in its ability to provide image- or profile-based evidence rather than only a signal indication. In some cases, this may help verify whether a suspected region contains wall-loss geometry. However, RT has limitations as a confirmatory tool. Image interpretation may be constrained by the pipe diameter, exposure geometry, wall thickness, insulation condition, source-detector arrangement, and radiation safety requirements.
RT should be considered a partial confirmation method for selected cases. This may strengthen the evidence chain, especially when combined with the screening results. However, UT- and PAUT-based corrosion mapping confirmation may still be required if an accurate remaining wall thickness is needed. Its role is strongest when it provides useful profile evidence in areas where direct insulation removal is difficult or when radiation exposure is manageable.
6.6. From Confirmation Evidence to Asset Integrity Decisions
Confirmation and sizing methods are essential because they convert CUI indications into engineering data. Direct VI confirms the exposed surface condition, UT provides quantitative local thickness data, UT/PAUT-based corrosion mapping provides spatial corrosion-mapping evidence, and RT supports the selected-area profile assessment where direct access is difficult.
Table 4 summarizes the confirmation and sizing methods discussed in this section. These methods convert screening, monitoring or risk-state indications into physical or quantitative evidence that can support repair planning, remaining-life assessment, RBI updating and FFS evaluation. However, confirmatory evidence still depends on access, coverage, procedure quality, and representativeness.
Table 4.
Confirmation and sizing methods for CUI decision support.
The comparison in Table 4 shows that confirmation closes the evidence gap only when it is targeted properly and is sufficiently representative. Direct VI, UT, PAUT-based corrosion mapping and RT methods provide stronger engineering evidence than screening or monitoring alone; however, their decision value still depends on inspection coverage, field conditions, and the confidence assigned to the measured data.
However, these results do not constitute asset-integrity decisions. They must be interpreted against the design thickness, corrosion allowance, minimum allowable thickness, operating pressure, consequence of failure, corrosion rate, repair options and inspection history.
In a decision-oriented CUI program, screening and confirmation should be deliberately connected. Risk ranking may first identify assets with higher CUI susceptibility based on insulation condition, operating temperature, moisture exposure, coating history, previous inspection findings and consequence of failure. Screening methods such as PEC, GWT, IRT, and RT can reduce location uncertainty by identifying suspicious regions. Local insulation removal, VI, UT and PAUT-based corrosion mapping can confirm the physical damage condition and provide the thickness or corrosion-mapping evidence needed for repair planning, remaining-life assessment, RBI update or FFS evaluation.
The quality of the confirmation evidence determines the strength of the resulting decision. Minor and localized corrosion may justify coating repair, insulation reinstatement, and continued monitoring. Significant wall loss may require local repair, replacement or further corrosion mapping. Thickness approaching the minimum allowable limits may require FFS assessment, whereas repeated or widespread findings may require revision of RBI assumptions, inspection intervals, or a broader CUI management strategy [28,30,120,121].
This staged approach reduces two common weaknesses in CUI inspection. The first is an overreliance on screening, where indirect or semi-quantitative indications are treated as the final evidence for repair or continued operation. The second is inefficient confirmation, where insulation removal or local UT inspection is performed without sufficient prioritization. Screening defines the focus of confirmation, whereas confirmation defines the engineering actions that can be justified. Confirmation closes the evidence gap not only by verifying that CUI exists but also by producing the decision-grade data required to determine whether the asset can remain in service, requires intervention, or needs broader inspection coverage.
7. Field Deployment, Evidence Integration and Decision Support
7.1. Why Field Deployment Determines the Value of CUI NDT
The effectiveness of CUI inspection methods is determined not only by their physical principles but also by the reliability of the evidence generated, interpreted, and acted upon under field conditions. Laboratory studies often evaluate NDT techniques using controlled insulation thickness, known defect geometries, stable environmental conditions and simplified component configurations. However, in operating process plants, CUI inspection is performed on aging assets with variable insulation conditions, damaged jacketing, wet or partially dried insulation, coating degradation, pipe supports, elbows, welds, branches, restricted access, and changing process temperatures. These field variables directly affect the reliability of the inspection evidence and influence whether a method can support screening, confirmation, or asset integrity decision-making.
This is particularly important because the CUI is hidden by design. The external metal surface is physically separated from the inspector by insulation, cladding, coating, fireproofing or protective wrapping. Consequently, most inspection methods do not directly observe the corrosion surface. Instead, they infer possible degradation from the electromagnetic response, guided-wave reflection, thermal anomaly, radiographic profile, acoustic activity, moisture condition, or local thickness measurement. Each type of evidence carries a different level of certainty. The practical value of a CUI NDT method depends on whether its field output is sufficiently strong for the intended application.
The screening–confirmation gap is most visible during field deployment. A screening indication may identify a suspicious region, but the reliability of that indication depends on access, surface condition, insulation system, component geometry, material properties and signal interpretation. Similarly, a confirmation method may provide direct thickness evidence, but only within an opened or scanned area. This implies that CUI inspection should not be treated as a simple detection task. It should be managed as a staged evidence process in which field conditions, evidence uncertainty and decision requirements are considered together.
From an industrial deployment perspective, CUI inspection methods can be broadly grouped according to their current level of field maturity. Direct visual inspection after insulation removal, ultrasonic thickness measurement (UT/UTM), selected radiographic techniques, PEC for through-insulation screening of suitable ferromagnetic components, and GWT/LRUT for long-range pipe screening are among the more established or routinely deployed approaches. IRT, AET, and permanent or embedded monitoring systems are more application-dependent because their effectiveness is strongly influenced by operating conditions, monitoring objectives, signal interpretation, and the availability of suitable baseline or reference data. Microwave, THz, advanced multimodal sensing, and AI-assisted interpretation remain less routine for process-plant CUI and are better regarded as emerging or developing approaches. This maturity classification is not absolute, because practical deployment varies with vendor capability, component geometry, inspection objective, site restrictions, regulatory requirements, and the availability of field validation data.
7.2. Inspection Barriers: Insulation, Cladding, Geometry and Access
The first major field barrier is the insulation system. The insulation thickness, density, material type, moisture content, aging condition, and installation quality can all affect the inspection performance. For through-insulation methods, such as PEC, the distance between the probe and pipe wall introduces lift-off effects, whereas metallic cladding, foil, wire mesh, or fireproofing may influence the electromagnetic response. For thermography, insulation thickness, trapped moisture, heat flow condition, surface emissivity, and external weather exposure can alter the thermal pattern observed at the outer surface. For microwave and THz methods, the dielectric behavior, curvature, and moisture distribution influence the signal interpretation. These factors imply that the insulation system is not only a physical barrier but also a source of measurement uncertainty.
The component geometry is another important limitation. Process plant piping rarely consists of long, straight and unobstructed sections. CUI-sensitive locations often occur near pipe supports, elbows, branches, welds, nozzles, low points, insulation terminations, damaged jacketing and areas where water can accumulate. These locations are often difficult to inspect. The GWT may be affected by welds, bends, supports, branches, and attenuation. PEC may be affected by curvature, local geometry, and variable standoff. UT and PAUT-based corrosion mapping may require surface preparation, coupling and sufficient scanning access. RT may be limited by source–detector positioning, pipe diameter, shielding requirements and exclusion zones.
Access is also a major constraint. CUI inspection may require scaffolding, rope access, confined space entry, insulation removal, hot surface precautions, radiation control, work permits, and insulation reinstatement. These requirements increase inspection costs and may restrict the number of locations that can be opened or confirmed. Consequently, inspection planning often becomes a compromise between coverage, confidence and practicality. Screening methods are used to reduce unnecessary insulation removal; however, their indications must be interpreted in light of the field variables that affect reliability.
These barriers do not render CUI NDT ineffective; rather, they emphasize that method selection must reflect the inspection objective and realistic field capability. A field-ready CUI strategy should therefore consider not only nominal method performance, but also the evidence that can be reliably generated under actual plant conditions.
In addition to the physical barriers described above, industrial reliability is influenced by inspection-system maturity and implementation quality. Calibration practices, operator competence, equipment configuration, data interpretation procedures, inspection coverage, and vendor-specific capability can significantly affect the result. Permanent sensors and monitoring systems introduce additional concerns related to long-term durability, drift, installation quality, maintenance access, and local representativeness. False-positive and false-negative indications may also arise when geometry, cladding, insulation condition, environmental variation, or process noise are not adequately controlled. A further challenge is the limited availability of field ground truth, because insulation removal and full-area confirmation are rarely performed across the entire inspected asset. Consequently, field performance should be judged not only by whether an indication is detected, but also by whether the indication can be verified, localized, and translated into a defensible engineering action.
7.3. Data Interpretation, Reliability and Evidence Uncertainty
CUI inspection evidence should be interpreted as graded rather than binary. In practice, inspection results rarely fall into a simple “corrosion present” or “corrosion absent” category. A thermal anomaly may indicate wet insulation, but it does not directly confirm wall loss. A PEC response may suggest hidden thinning; however, the result may be influenced by lift-off, cladding, defect size, and geometry. A guided-wave reflection may identify a suspicious pipe section but may not provide the final local sizing. Acoustic activity may indicate active damage or leakage but may also be affected by background noise and source-location uncertainty. UT or PAUT-based corrosion mapping can provide stronger local evidence, but only within the measured areas.
Evidence from CUI inspection can be understood in terms of confidence and decision strength. Moisture or thermal evidence represents risk state information. Screening evidence from PEC, GWT, or RT indicates possible hidden degradation or abnormalities. Activity evidence from AET or electrochemical monitoring indicates whether a damage process, leakage source or corrosion environment may be active. Confirmation evidence from VI, UT or PAUT-based corrosion mapping provides direct or quantitative information on the surface condition, remaining wall thickness or corrosion morphology.
Reliability also depends on the data collection method. Sparse UT spot readings may miss localized pitting if the grid is not sufficiently dense. PAUT-based corrosion mapping can provide richer spatial evidence but still depends on access, coupling, surface condition and scan coverage. AET can monitor a wider area, but its value depends on sensor placement, noise filtering, source localization, and whether degradation is active during monitoring. Embedded sensors can provide continuous data, but only at their installed locations or along their sensing paths. Reliability is a property of both the NDT method and inspection design.
A robust CUI inspection program should clearly document evidence limitations. Inspection reports should distinguish between risk indications, screening indications, activity monitoring, and confirmed wall loss. They should also record the coverage, access limitations, sources of uncertainty, assumptions, follow-up requirements, and decision relevance. Without this distinction, screening outputs may be overused as final evidence, or confirmation data may be applied beyond the actual inspection areas.
Multi-method data fusion should not be interpreted as a simple accumulation of positive indications. The evidence must first be normalized to its physical meaning and uncertainty. A moisture anomaly, PEC wall-loss response, acoustic event, and UT thickness measurement represent different measurands and confidence levels. Fusion is most defensible when the data are spatially registered, method limitations are retained, and the combined result is used to determine the next confirmation action rather than to create an unsupported single ‘CUI probability’. Quantitative evaluation should therefore report both the fused decision and the uncertainty contributed by each inspection source.
7.4. Linking Inspection Evidence to RBI, FFS and Repair Planning
The purpose of CUI inspection is not only to detect degradation but also to support asset integrity action. Inspection results may lead to continued monitoring, insulation repair, coating repair, local insulation removal, targeted UT, PAUT-based corrosion mapping, component repair, replacement, RBI reassessment or FFS evaluation. The level of evidence required depends on the consequence of failure, severity of the indication, confidence in the inspection method, and proximity to the minimum allowable thickness.
Risk state evidence may justify closer surveillance or follow-up screening. For example, wet insulation or repeated thermal anomalies may not prove metal loss, but it can justify prioritizing that area for PEC, RT, or insulation opening inspection. Screening evidence from PEC or GWT may justify targeted confirmation, as it indicates possible wall loss or an abnormal area. Activity evidence from AET, electrochemical monitoring, or leak detection may increase urgency, especially if the indication suggests active degradation or pressure-boundary concerns. Confirmation evidence from VI, UT or PAUT-based corrosion mapping can then support engineering decisions because it provides physical or quantitative data.
The decision pathway should be proportional to the risk. A low-consequence asset with weak moisture evidence may be scheduled for future screening or monitored during the next inspection cycle. A high-consequence line with screening indications and poor insulation conditions may require immediate local confirmation. Confirmed wall loss below acceptable limits may require repair, replacement or FFS assessment. Repeated CUI findings across similar locations may require revision of RBI assumptions, inspection intervals, insulation specifications, or coating strategies.
This connection between inspection evidence and decision action is where many CUI programs can be strengthened. If screening methods are used without defined confirmation rules, inspection campaigns may produce many indications without clear engineering results. If confirmation is performed without risk-based targeting, insulation removal may become both costly and inefficient. The most defensible approach is to define how each type of evidence triggers the next action. CUI inspection should operate as a decision chain rather than a collection of isolated NDT activities.
The proposed evidence-chain framework is broadly aligned with current industry practice, while making the transition between evidence types more explicit. API RP 583 provides CUI-specific guidance for susceptibility assessment, inspection planning, examination, maintenance and mitigation, whereas API RP 580 and API RP 581 provide the principles and methodology for risk-based inspection. For in-service process piping, API 570 relies on inspection information, including reliable thickness data, to support condition assessment, inspection intervals, repair and rerating decisions, while API 579-1/ASME FFS-1 requires sufficiently reliable characterization of damage geometry, remaining thickness, material properties and loading conditions for formal fitness-for-service assessment. Accordingly, the present framework agrees with existing industry expectations by using risk and screening indications for prioritization and inspection planning, while requiring confirmed quantitative evidence for repair boundaries, remaining-life calculations and FFS decisions. It extends current practice by explicitly distinguishing the evidential roles of risk indication, screening indication, activity monitoring and local confirmation before engineering action, but it does not replace the requirements of the applicable inspection, RBI or FFS standards.
Align the transition from inspection evidence to asset-integrity action with the applicable management, inspection, RBI, and fitness-for-service frameworks. API RP 583 provides CUI-specific guidance for the design, inspection, maintenance, and mitigation of corrosion under insulation, whereas API RP 580 and API RP 581 provide the principles and quantitative methodology for risk-based inspection planning. For in-service process piping, API 570 provides the inspection, rating, repair, and alteration framework, while API 579-1/ASME FFS-1 provides the engineering assessment basis for evaluating components containing metal loss or other damage. Accordingly, the level of inspection evidence required increases as the intended decision progresses from prioritization to repair, remaining-life assessment, RBI reassessment, or formal FFS evaluation. Table 5 summarizes the relationship between CUI inspection evidence, the engineering decisions it can support, and the applicable industry standards and guidance.
Table 5.
Linkage between CUI Inspection Evidence, Engineering Decisions, and Applicable Industry Standards.
Evidence sufficiency therefore depends on the engineering decision being made. Moisture, thermal, or susceptibility evidence may be adequate for prioritization, but it is not sufficient to define a repair boundary. Similarly, PEC, GWT, or other screening indications can justify targeted follow-up inspection but should not normally be used as the sole minimum-thickness input for remaining-life or FFS calculations. RBI reassessment and remaining-life evaluation require reliable local thickness data, corrosion extent or rate, operating conditions, inspection history, and consequence information. Where formal FFS assessment is required, the inspection results must provide the validated geometry, material, damage and loading information required by the applicable assessment procedure. Repair or replacement decisions should therefore be based on confirmed damage extent and the applicable inspection or assessment standard rather than on screening evidence alone.
7.5. Proposed Decision-Oriented CUI Inspection Pathway
A decision-oriented CUI inspection pathway should begin by identifying the assets and locations where CUI susceptibility is sufficiently high to justify the use of inspection resources. This prioritization should consider the operating temperature, insulation condition, coating history, moisture exposure, previous CUI findings, material type, consequence of failure, inspection history, and accessibility. The purpose of this stage is not to select an NDT method immediately but to define where the inspection effort is most justified and what level of evidence is required for the expected decision-making.
The integrated inspection and decision-support pathways are shown in Figure 4. The workflow links CUI susceptibility assessment, screening or monitoring strategy selection, inspection evidence generation, targeted local confirmation, and confirmed damage evaluation with asset integrity actions, such as RBI updating, FFS assessment, repair planning, replacement, or continued service. This structure helps prevent screening results from being overclaimed while ensuring that confirmation activities are directed toward locations where decision-grade evidence is required.
Figure 4.
An integrated CUI inspection and asset integrity decision-support pathway, linking susceptibility assessment, screening and monitoring, targeted local confirmation, confirmed-damage evaluation, and risk-based engineering decisions.
Risk or anomaly screening provides an early indication layer in this pathway. Visual assessment of jacketing condition, IRT, moisture detection, microwave methods, humidity sensing or embedded monitoring may identify areas where wet insulation, abnormal heat transfer, moisture retention or environmental conditions suggest an elevated CUI likelihood. These methods are valuable because they help locate corrosion-favorable conditions, but their outputs should be interpreted as risk-state evidence rather than confirmed metal loss. A wet insulation indication, thermal anomaly, or humidity trend may justify closer inspection, but it does not by itself define corrosion morphology, remaining wall thickness, or repair requirements.
Where wall loss or pipe-section abnormality is suspected, screening methods such as PEC, GWT, selected RT or other through-insulation techniques can be used to reduce location uncertainty. Their purpose is to identify suspicious regions, wall-loss responses, or abnormal pipe sections so that confirmation can be focused more effectively. Positive screening indications should be ranked according to severity, confidence, consequence, accessibility and consistency with other evidence. This ranking is essential because screening evidence may be influenced by field variables, such as lift-off, insulation thickness, cladding, geometry, attenuation, thermal contrast, and defect morphology.
Activity or leakage monitoring may be added if the inspection concern includes active degradation, changing conditions, or pressure boundary risks. AET, electrochemical monitoring, leak detection, and embedded sensors can help determine whether corrosion-related activity, leakage behavior, acoustic events, or environmental changes occur during the monitoring period [38,39,115]. This evidence is particularly useful when the issue is not only whether wall loss exists but also whether the condition appears active, intermittent, or urgent. However, activity evidence should not be treated as direct thickness confirmation because dormant corrosion, inactive historical damage, or localized wall loss may remain undetected during the monitoring period.
Targeted local confirmation is required when the available evidence supports repair, replacement, remaining life assessment, RBI updating, or FFS evaluation. At this stage, insulation is removed or access is created at selected locations, followed by VI, UTM, PAUT-based corrosion mapping or radiographic confirmation. These methods provide the physical and quantitative evidence needed to define the corrosion morphology, minimum remaining wall thickness, local extent, damage severity and repair boundaries [22,23,24,117]. Confirmation should be planned according to the expected damage morphology; sparse spot readings may be insufficient where CUI is localized, irregular or concentrated near supports, low points or insulation terminations.
The confirmed inspection data should then be evaluated against the design requirements, corrosion allowance, minimum allowable thickness, operating pressure, consequence of failure, and applicable RBI or FFS criteria [117,120,121,122]. This assessment determines whether continued service is acceptable, whether further mapping is required, whether insulation or coating repair is sufficient, and whether local repair, replacement, or formal FFS assessment is necessary. The decision should be proportional to both the risk and strength of the evidence. A low-consequence item with weak risk state evidence may be monitored or scheduled for later screening, whereas a high-consequence item with screening indications, poor insulation conditions, and active monitoring evidence may require immediate confirmation.
The pathway should be closed with feedback from the broader CUI management system. Inspection results, confirmed wall loss data, recurring damage locations, insulation conditions, coating performance, and operating history should be used to update the risk ranking, inspection intervals, insulation repair strategy, monitoring requirements, and future inspection scope. Thus, each inspection campaign improves the next. The pathway transforms CUI inspection from a reactive search for hidden corrosion into a structured evidence-based process for asset integrity decision support.
The applicable engineering framework should therefore be selected according to the final decision: API RP 583 for CUI management and mitigation, API RP 580/API RP 581 for RBI reassessment, API 570 for in-service process piping inspection and repair decisions, and API 579-1/ASME FFS-1 where a formal fitness-for-service assessment is required.
7.6. Illustrative Screening-to-Confirmation Worked Example
Consider an insulated carbon-steel process line with damaged jacketing at a low point and a history of intermittent wetting. A visual condition survey and IRT/moisture indication identify an elevated CUI risk but do not confirm wall loss. PEC is then used to screen the insulated region and identifies a localized wall-loss-related response. Because PEC alone does not define the minimum remaining thickness or corrosion morphology, a targeted insulation window is opened and the area is examined by visual inspection and UT/PAUT corrosion mapping. The confirmed minimum thickness and damage extent are then compared with the design/minimum allowable thickness and used to update remaining-life, RBI, repair, or FFS decisions. If screening is negative but the consequence of failure is high and the location remains strongly CUI-susceptible, additional confirmation or shortened inspection intervals may still be justified. This example illustrates that each stage changes the inspection question: risk methods identify where CUI may occur, screening identifies where hidden damage may exist, and confirmation establishes the physical data required for engineering action.
8. Research Gaps and Future Directions
8.1. Field-Representative Validation and Multi-Method CUI Datasets
Although many CUI inspection and monitoring methods have been developed, the limited availability of field-representative validation data remains a significant research gap. A substantial proportion of published CUI-related NDT studies rely on simplified laboratory specimens, artificial wall-loss geometries, controlled insulation configurations, or idealized test conditions [10,11,12,24,33,48,74,89,90]. These studies are necessary for understanding the basic signal behavior; however, they do not fully reproduce the complexity of operating process plant assets. In actual CUI environments, inspection performance may be influenced by aged insulation, damaged jacketing, wet–dry cycling, variable lift-off, metallic cladding, wire mesh, coating degradation, elbows, supports, welds, branches, temperature variations, and irregular corrosion morphology.
Future research should move beyond isolated technique demonstrations and develop realistic validation programs using representative insulation systems, process plant geometries, and mixed corrosion morphologies. PEC studies should not only address lift-off compensation and signal processing but also validate performance under aged cladding, variable insulation thickness, wire mesh and non-uniform wall loss [10,11,33,48]. GWT research should continue to address the influence of welds, supports, bends, coatings, attenuation, and complex pipe features on defect localization and severity ranking [31,70,123]. IRT, microwave, and THz methods should be validated under realistic heat transfer, moisture distribution, and coating conditions rather than only under controlled laboratory contrasts [74,89,90,124].
A related gap is the absence of multi-method datasets in which screening, monitoring and confirmation methods are applied to the same specimens or field assets. Such datasets are needed to clarify how different evidence types agree, disagree or complement each other. For example, a realistic CUI validation program should compare PEC or GWT indications with IRT moisture patterns, AET activity, electrochemical monitoring outputs, VI findings, and UT and PAUT-based corrosion mapping confirmation data. Without this type of correlated evidence, it remains difficult to determine whether a screening indication truly corresponds to wall loss, whether an activity signal reflects active corrosion, or whether a moisture indication has asset integrity significance. Future CUI research should prioritize shared, field-representative, and multi-method datasets that can support evidence correlation rather than technique-by-technique validation alone.
The current industrial landscape shows a clear difference between mature field inspection methods and emerging CUI technologies. Established methods generally have better-understood procedures, limitations, and confirmation pathways, whereas application-dependent and emerging approaches still require stronger evidence of repeatability, field robustness, uncertainty, and decision-support value. The main research challenge is therefore not simply to develop more sensitive techniques, but to demonstrate how newer methods perform under realistic process-plant conditions, how their indications correlate with confirmed damage, and how they can be integrated into existing inspection, RBI, FFS, and repair workflows without overstating their maturity or capability.
8.2. Quantitative Interpretation and Uncertainty Assessment
The second research gap concerns quantitative interpretation and reliability assessment. Many CUI screening methods can indicate suspicious areas, but their outputs are not always quantitatively linked to the minimum remaining wall thickness, defect morphology, or repair boundary. This limitation is central to the screening–confirmation gap. Screening methods are highly valuable when they identify where confirmation should be performed, but their decision value increases when their sensitivity, false-call rate, sizing uncertainty and probability of detection are better understood.
PEC has made progress in signal modelling, feature extraction, compensation techniques, and data-driven interpretation; however, further work is needed to define confidence limits under realistic field conditions. The key question is not only whether PEC can detect wall loss but also under what insulation thickness, cladding condition, lift-off, defect size, and corrosion morphology it can provide a reliable severity ranking or semi-quantitative evidence [47,52,125,126]. Similar questions apply to GWT, where long-range coverage is valuable but interpretation is affected by attenuation, welds, bends, supports, circumferential extent and feature density [18,64,65,123]. For IRT, quantitative interpretation remains difficult because thermal contrast may reflect moisture, insulation condition, emissivity, solar loading, wind or process temperature rather than metal loss alone [34,127,128,129].
Future studies should develop CUI-specific reliability frameworks that extend beyond simple detection. The POD, probability of false alarm, sizing uncertainty, localization accuracy, and confidence-based reporting should be extended from conventional local NDT to through-insulation screening and monitoring methods. This is especially important because CUI inspection decisions often involve risk trade-offs. A method with high coverage but moderate sizing confidence may be suitable for prioritization, whereas a method with strong local accuracy but limited coverage may be suitable for confirmation. Reliability research should make these decision boundaries more explicit.
Uncertainty assessment should also be incorporated into the inspection report. Screening results should identify the confidence level of the indication, expected limitations of the method, and required confirmation action. Monitoring results should identify whether the evidence reflects active degradation, environmental risk, leakage activity or uncertain noise. The confirmation results should document the measurement coverage, grid density, coupling limitations, surface condition, and uncertainty in the minimum remaining thickness. Thus, reliability assessment is not only a research exercise but also a practical requirement for defensible CUI decision-making.
8.3. AI-Assisted Interpretation Using Realistic CUI Data
Artificial intelligence and machine learning have increasing potential in CUI inspection, particularly for signal classification, image interpretation, pattern recognition, anomaly detection, and multi-sensor data fusion. AI-assisted methods may support PEC signal compensation, thermographic image interpretation, AE source classification, radiographic image analysis, sensor trend interpretation, and inspection prioritization. Recent PEC studies have demonstrated data-driven signal denoising, wavelet-based processing, regression, machine-learning classification, and decision-support approaches [52,53,54,55]. However, the value of AI depends heavily on the quality and representativeness of training data.
A major limitation of the current research is that many AI- and data-driven NDT models are developed using controlled datasets, simulated defects, or limited experimental conditions [52,53,54,55]. Such models may perform well during laboratory validation but may not generalize directly to field assets with irregular corrosion, mixed insulation materials, variable temperatures, background noise, moisture variation, lift-off effects, geometric complexity, and inconsistent inspection access. This is particularly important for CUI because the inspected condition is hidden and the available evidence is often indirect. An AI model trained predominantly on idealized or laboratory-generated signals may learn test-specific patterns rather than field-relevant corrosion behaviour; therefore, field-representative validation is required before such models can be relied upon for asset-integrity decision support [10,11,33,48,52,53,54,55].
Future AI research on CUI should focus on field-representative datasets, uncertainty-aware models, and explainable decision support. AI should not simply classify an indication as “CUI” or “no CUI”; it should help identify the evidence type, confidence level, likely uncertainty source, and required follow-up action. For example, an AI-assisted PEC system should support severity ranking and confirmation planning rather than overclaiming the final size. An AI-assisted thermography system should distinguish the wet insulation risk from confirmed metal loss. An AI-assisted AET system should improve source classification and noise discrimination while still recognizing that the absence of activity does not prove the absence of damage.
The strongest future direction is multimodal AI, where screening, monitoring, and confirmation datasets are linked. A model that integrates the PEC response, IRT thermal patterns, AET activity, humidity trends, UT thickness readings, and inspection history can support more reliable prioritization than any single data stream. However, such systems require robust traceability, standardized data structures, validated ground truth, and clear boundaries between decision support and final engineering judgement. AI should be developed as a tool for evidence integration and not as a replacement for confirmation or engineering assessment.
8.4. Permanent Monitoring, Sensor Durability and Action Thresholds
Permanent and embedded monitoring systems represent an important future direction because CUI is often intermittent, time-dependent, and difficult to capture through periodic inspection alone. Moisture ingress, wet–dry cycling, corrosion activity, and leakage risk may change between inspection intervals. Electrochemical sensors, humidity sensors, fiber-optic systems, acoustic emission monitoring, and other embedded technologies can potentially provide early warnings of changing conditions under insulation [26,113,114].
However, the long-term reliability of these systems remains a major research gap. Sensors installed under insulation must survive moisture, thermal cycling, mechanical disturbance, insulation removal, maintenance activity, coating interaction, and process temperature variation. Their outputs may also be affected by sensor drift, calibration loss, installation quality, local representativeness, and data interpretation uncertainty. Although a sensor can accurately measure its local environment, CUI can occur at another location. Although a distributed sensing system may improve coverage, it still requires interpretation and validation against physical inspection evidence.
Future research should address not only sensor sensitivity but also durability, maintainability, calibration strategies, and representativeness. Laboratory sensor performance is insufficient; long-duration field trials are required to determine whether sensors can remain reliable over realistic inspection intervals. Future research should examine how embedded sensors can be integrated with screening and confirmation methods. For example, moisture or electrochemical trends could trigger PEC screening, insulation opening, or UT confirmation only when the defined thresholds are exceeded.
Action thresholds are particularly important. Without clear thresholds, monitoring systems may generate large amounts of data without practical decision values. Future studies should define how sensor outputs should trigger inspection actions under different consequence categories. A minor moisture indication on a low-consequence line may justify continued monitoring, whereas repeated moisture activity with screening evidence on a high-consequence line may require immediate confirmation. Permanent monitoring will become more valuable when its outputs are linked to risk-based action rules rather than being treated as isolated data streams.
8.5. RBI and FFS Integration, Economic Modelling and Digital Traceability
The final research gap concerns the integration of CUI inspection evidence into asset integrity systems. CUI inspection is not complete when an indication is detected; it becomes meaningful only when the evidence supports the RBI update, FFS assessment, repair planning, inspection interval adjustment, or continued operation decisions. Future research should explicitly connect method selection, evidence confidence, and decision consequences [16,28,30,130].
Economic modelling is required because CUI inspections always involve trade-offs. Full insulation removal provides direct access but is expensive, disruptive, and labor-intensive. Screening methods reduce unnecessary insulation removal but may introduce uncertainty. Confirmation methods provide stronger evidence but require access and are locally available. Monitoring systems may reduce unexpected failures but require installation, maintenance, and interpretation resources. Future decision models should compare not only detection capability but also inspection cost, insulation removal cost, downtime, scaffolding, safety control, false positives, missed damage, and consequences of failure. The screening–confirmation gap has an economic dimension: insufficient confirmation increases integrity risk, whereas excessive confirmation increases cost without proportional benefit [29,120,122,131].
Digital traceability is also important. CUI inspection data are often fragmented across visual reports, UT thickness logs, PEC maps, thermographic images, AET event files, sensor records, repair reports and RBI databases. If these data remain disconnected, it becomes difficult to build a reliable asset history or to evaluate whether inspection decisions are justified. Future research should focus on developing digital CUI inspection workflows that link screening indications to confirmation results, sensor trends to field findings, and repair records to future inspection plans [22,111,132].
A defensible digital workflow should allow each inspection result to be traced through the evidence chain. PEC indications should be linked to follow-up UT or PAUT-based corrosion mapping. An IRT anomaly should be linked to moisture verification or insulation openings. AET events should be linked to the operating conditions, source localization, and physical inspection results. Confirmed wall-loss data should be linked to FFS calculations, repair history, and RBI interval revisions. This type of traceability is essential for future AI-assisted inspections, robotic deployments, and risk-based asset management [30,111,130,132].
Overall, future CUI research should shift from isolated method development to decision-grade evidence. The objective is not to find a universal CUI inspection technique but to build validated systems that combine risk indication, screening, activity monitoring, local confirmation, and asset integrity decision support. Closing the screening–confirmation gap will require better field validation, quantitative uncertainty assessment, realistic AI datasets, durable monitoring systems, economic optimization, and digitally traceable inspection evidence [16,17,29,131].
8.6. Challenges for Robotic, Autonomous and AI-Assisted CUI Inspection
Robotic and autonomous inspection systems can reduce personnel exposure, improve inspection repeatability, and extend access to difficult process-plant locations. However, CUI poses challenging deployment conditions because insulated assets include supports, bends, branches, nozzles, damaged cladding, variable diameters, congested pipe racks, and restricted-access areas. A robotic platform must therefore maintain reliable localization, sensor positioning, lift-off or coupling, and sufficient contact force while navigating irregular surfaces. For NDT methods that depend strongly on probe orientation, standoff, or coupling, uncertainty in robot motion can directly translate into measurement uncertainty.
Embodied-intelligence systems also require robust perception and decision rules under changing field conditions. Moisture, reflective cladding, thermal gradients, vibration, electromagnetic interference, and plant background noise can produce domain shifts between laboratory training data and field deployment. Autonomous systems should therefore be capable of recognizing insufficient data quality, uncertain localization, or unreliable sensor contact and triggering re-inspection or human intervention rather than forcing a classification. This is particularly important for CUI because the inspected condition is hidden and many screening outputs are indirect.
AI-assisted robotic inspection introduces additional challenges related to representative training data, explainability, uncertainty quantification, data traceability, model drift, cybersecurity, and responsibility for engineering decisions. Multimodal AI may improve inspection prioritization by combining PEC, IRT, AET, sensor trends and UT/PAUT confirmation data; however, the physical meaning and uncertainty associated with each input should be preserved. For safety-critical CUI applications, robotics and AI should therefore be treated as tools for data acquisition, screening, interpretation and decision support. Final repair, remaining-life, RBI and FFS decisions should remain based on validated confirmation evidence and accountable engineering assessment. The final research gap concerns the integration of CUI inspection evidence into asset integrity systems.
9. Conclusions
CUI remains a difficult asset integrity problem because degradation develops beneath insulation, cladding, coating, fireproofing or protective wrapping, where early damage is normally hidden from direct visual examination. The challenge is not only whether CUI can be detected, but also whether the evidence generated by an inspection or monitoring method is sufficiently strong to support the intended engineering decision.
This review shows that CUI inspection should be understood as a staged evidence process rather than a single-step detection task. Risk indication methods can identify conditions favorable to CUI, such as wet insulation, thermal anomalies, moisture ingress, and corrosion-favorable interface conditions. Screening methods such as PEC, GWT, RT, IRT, and emerging microwave or THz techniques can improve coverage and prioritize locations for follow-up inspection.
Activity and monitoring methods, including AET, electrochemical monitoring, humidity sensing, fiber-optic sensing and embedded sensors, add temporal evidence by indicating whether degradation-related conditions are active, changing or intermittent. Confirmation and sizing methods, particularly direct VI, UT and PAUT-based corrosion mapping, provide the physical or quantitative evidence required for repair planning, remaining-life assessment, RBI update and FFS evaluation.
The central contribution of this review is the clarification of the screening–confirmation gap. Screening and monitoring methods are valuable because they reduce uncertainty; however, they do not always eliminate it. A positive screening indication may not define corrosion morphology or minimum remaining wall thickness, whereas a negative result may not eliminate localized, inactive, or geometrically complex damages. Similarly, activity-based evidence may indicate active behavior, but it does not necessarily quantify existing losses. Final asset integrity decisions require evidence that is appropriate for the decision being considered.
The proposed evidence-based classification helps prevent the overestimation of the individual inspection technologies. Instead of asking whether a method can detect CUI, inspection planning should ask what type of evidence the method produces, what field variables influence that evidence, what decisions the evidence can support, and what follow-up confirmations are required. This approach aligns method selection with engineering purposes rather than equipment availability considerations.
Overall, no single CUI inspection method can fully satisfy all the requirements for wide-area coverage, hidden-condition detection, active damage monitoring, local sizing and decision support. A robust CUI inspection strategy requires the deliberate integration of risk indication, screening, monitoring, confirmation and asset integrity assessment. Future progress will depend on strengthening the reliability, traceability, and decision value of this evidence chain so that CUI inspection results can be converted into defensible actions for safe and cost-effective asset integrity management.
Author Contributions
Conceptualization, J.L.T.; methodology, J.L.T. and M.S.; investigation, J.L.T. and M.S.; data curation, J.L.T. and M.S.; writing—original draft preparation, J.L.T.; writing—review and editing, J.L.T. and M.S.; project administration, M.S. All authors have read and agreed to the published version of the manuscript.
Funding
This research received no external funding.
Data Availability Statement
No new data were created or analyzed in this study. Data sharing is not applicable to this article.
Acknowledgments
The authors would like to thank the affiliated institutions for supporting this research work. During the preparation of this manuscript, the authors used ChatGPT-5 (OpenAI) to assist with English language editing, grammatical refinement, and the preparation and improvement of selected schematic figures. All AI-assisted outputs were reviewed, verified, and revised by the authors, who take full responsibility for the accuracy, originality, and content of this publication.
Conflicts of Interest
The authors declare no conflicts of interest.
References
- Cao, Q.; Pojtanabuntoeng, T.; Esmaily, M.; Thomas, S.; Brameld, M.; Amer, A.; Birbilis, N. A Review of Corrosion under Insulation: A Critical Issue in the Oil and Gas Industry. Metals 2022, 12, 561. [Google Scholar] [CrossRef] [Scilit]
- Wu, J.; Ghosh, S.; Gonuguntla, M.; Liu, F.; Jin, Y. A Review of Research Methods for Corrosion under Insulation. Corros. Rev. 2023, 41, 263–276. [Google Scholar] [CrossRef] [Scilit]
- Wu, J.; Li, W.; Huang, F.; Zhang, H.; Zhang, B.; Liu, F.; Jin, Y. Simulation of Internal Environmental Conditions Within Rock Wool Insulation: Implications for Corrosion Under Insulation in Piping Systems. Coatings 2025, 15, 571. [Google Scholar] [CrossRef] [Scilit]
- Popova, K.; Prošek, T. Corrosion Monitoring in Atmospheric Conditions: A Review. Metals 2022, 12, 171. [Google Scholar] [CrossRef] [Scilit]
- Eltai, E.O.; Musharavati, F.; El-Sadig, M. Severity of Corrosion under Insulation (CUI) to Structures and Strategies to Detect It. Corros. Rev. 2019, 37, 553–564. [Google Scholar] [CrossRef] [Scilit]
- Vasagar, V.; Hassan, M.K.; Abdullah, A.M.; Karre, A.V.; Chen, B.; Kim, K.; Al-Qahtani, N.; Cai, T. Non-Destructive Techniques for Corrosion Detection: A Review. Corros. Eng. Sci. Technol. 2024, 59, 56–85. [Google Scholar] [CrossRef] [Scilit]
- Zang, X.; Xu, Z.-D.; Lu, H.; Zhu, C.; Zhang, Z. Ultrasonic Guided Wave Techniques and Applications in Pipeline Defect Detection: A Review. Int. J. Press. Vessel. Pip. 2023, 206, 105033. [Google Scholar] [CrossRef] [Scilit]
- Cadelano, G.; Bortolin, A.; Ferrarini, G.; Molinas, B.; Giantin, D.; Zonta, P.; Bison, P. Corrosion Detection in Pipelines Using Infrared Thermography: Experiments and Data Processing Methods. J. Nondestr. Eval. 2016, 35, 49. [Google Scholar] [CrossRef] [Scilit]
- Wu, R.; Zhang, H.; Yang, R.; Chen, W.; Chen, G. Nondestructive Testing for Corrosion Evaluation of Metal under Coating. J. Sens. 2021, 2021, 6640406. [Google Scholar] [CrossRef] [Scilit]
- Bailey, J.; Gouws, G.J.; Long, N. Numerical Investigation of Encircling Eddy Current Signals for Improved Sizing of Localised Corrosion under Insulation in Steel Pipelines. Struct. Health Monit. 2025, 24, 2747–2761. [Google Scholar] [CrossRef] [Scilit]
- Xu, Z.; Zhou, Z.; Chen, H.; Qu, Z.; Liu, J. Effects of the Wire Mesh on Pulsed Eddy Current Detection of Corrosion under Insulation. Nondestruct. Test. Eval. 2023, 38, 233–253. [Google Scholar] [CrossRef] [Scilit]
- Chen, H.; Xu, Z.; Zhou, Z.; Jin, J.; Hu, Z. Study on the Effect of Metal Mesh on Pulsed Eddy-Current Testing of Corrosion under Insulation Using an Early-Phase Signal Feature. Materials 2023, 16, 1451. [Google Scholar] [CrossRef] [Scilit] [PubMed]
- Ulapane, N.; Alempijevic, A.; Valls Miro, J.; Vidal-Calleja, T. Non-Destructive Evaluation of Ferromagnetic Material Thickness Using Pulsed Eddy Current Sensor Detector Coil Voltage Decay Rate. NDT E Int. 2018, 100, 108–114. [Google Scholar] [CrossRef] [Scilit]
- de Souza, M.P.V.; López, F.; Maldague, X. Corrosion under Insulation Mitigation by Passive Multivariate Thermography. Quant. Infrared Thermogr. J. 2025, 22, 121–133. [Google Scholar] [CrossRef] [Scilit]
- Ismon, M.; Jamalludin, M.D.; Zaman Bujang, I.; Azmir, N.A.; Asmawi, R.; Sies, M.F.; Roslan, M.N.; Ibrahim, Z. Pitting Hole Evaluation by Active Infrared Thermography in Stainless Steel 304. J. Adv. Res. Fluid Mech. Therm. Sci. 2020, 68, 114–124. [Google Scholar] [CrossRef] [Scilit]
- Le Gratiet, L.; Iooss, B.; Blatman, G.; Browne, T.; Cordeiro, S.; Goursaud, B. Model Assisted Probability of Detection Curves: New Statistical Tools and Progressive Methodology. J. Nondestr. Eval. 2017, 36, 8. [Google Scholar] [CrossRef] [Scilit]
- Falcetelli, F.; Yue, N.; Di Sante, R.; Zarouchas, D. Probability of Detection, Localization, and Sizing: The Evolution of Reliability Metrics in Structural Health Monitoring. Struct. Health Monit. 2022, 21, 2990–3017. [Google Scholar] [CrossRef] [Scilit]
- Olisa, S.C.; Khan, M.A.; Starr, A. Review of Current Guided Wave Ultrasonic Testing (GWUT) Limitations and Future Directions. Sensors 2021, 21, 811. [Google Scholar] [CrossRef] [Scilit] [PubMed]
- Alkhateeb, S.; Riccioli, F.; Morales, F.L.; Pahlavan, L. Non-Contact Acoustic Emission Monitoring of Corrosion under Marine Growth. Sensors 2023, 23, 161. [Google Scholar] [CrossRef] [Scilit] [PubMed]
- Rajendran, V.; Prathuru, A.; Fernandez, C.; Faisal, N. Acoustic Emission Wave Propagation in Pipeline Sections and Analysis of the Effect of Coating and Sensor Location. Nondestruct. Test. Eval. 2025, 40, 3004–3034. [Google Scholar] [CrossRef] [Scilit]
- Tai, J.L.; Sultan, M.T.H.; Shahar, F.S.; Łukaszewicz, A.; Oksiuta, Z.; Grzejda, R. Ultrasound Corrosion Mapping on Hot Stainless Steel Surfaces. Metals 2024, 14, 1425. [Google Scholar] [CrossRef] [Scilit]
- Huang, J.; Chen, P.; Li, R.; Fu, K.; Wang, Y.; Duan, J.; Li, Z. Systematic Evaluation of Ultrasonic In-Line Inspection Techniques for Oil and Gas Pipeline Defects Based on Bibliometric Analysis. Sensors 2024, 24, 2699. [Google Scholar] [CrossRef] [Scilit] [PubMed]
- Mohd Tahir, M.F.; Echtermeyer, A.T. Phased Array Ultrasonic Testing on Thick Glass Fiber Reinforced Thermoplastic Composite Pipe Implementing the Classical Time-Corrected Gain Method. J. Nondestr. Eval. 2024, 43, 74. [Google Scholar] [CrossRef] [Scilit]
- Tai, J.L.; Grzejda, R.; Sultan, M.T.H.; Łukaszewicz, A.; Shahar, F.S.; Tarasiuk, W.; Rychlik, A. Experimental Investigation on the Corrosion Detectability of A36 Low Carbon Steel by the Method of Phased Array Corrosion Mapping. Materials 2023, 16, 5297. [Google Scholar] [CrossRef] [Scilit] [PubMed]
- Jiang, X.; Xu, Y.; Zhao, D. Terahertz Non-Destructive Testing and Imaging of Corrosion in Coated Steel Plates. Constr. Build. Mater. 2023, 385, 131427. [Google Scholar] [CrossRef] [Scilit]
- Popova, K.; Montemor, M.F.; Prošek, T. Application of Resistometric Sensors for Real-Time Corrosion Monitoring of Coated Materials. Corros. Mater. Degrad. 2024, 5, 573–592. [Google Scholar] [CrossRef] [Scilit]
- Takeyama, M. High-Temporal-Resolution Corrosion Monitoring in Fluctuating-Temperature Environments with an Improved Electrical Resistance Sensor. Sensors 2025, 25, 268. [Google Scholar] [CrossRef] [Scilit] [PubMed]
- Li, A.; Jin, F.; Li, Y.; Lan, W.; Liu, P.; Yu, Z.; Wen, K. A Reliability Assessment Method for Natural Gas Pipelines with Corroded Defects That Considers Detection Cycles. Energies 2024, 17, 3366. [Google Scholar] [CrossRef] [Scilit]
- Huang, Y.; Qin, G.; Yang, M. A Risk-Based Approach to Inspection Planning for Pipelines Considering the Coupling Effect of Corrosion and Dents. Process Saf. Environ. Prot. 2023, 180, 588–600. [Google Scholar] [CrossRef] [Scilit]
- Wang, Y.; Su, C.; Xie, M. Optimizing Inspection Plan for Corroded Pipeline with Considering Imperfect Maintenance. Proc. Inst. Mech. Eng. O J. Risk Reliab. 2024, 238, 417–428. [Google Scholar] [CrossRef] [Scilit]
- Ghavamian, A.; Mustapha, F.; Baharudin, B.T.H.T.; Yidris, N. Detection, Localisation and Assessment of Defects in Pipes Using Guided Wave Techniques: A Review. Sensors 2018, 18, 4470. [Google Scholar] [CrossRef] [Scilit] [PubMed]
- Sophian, A.; Tian, G.; Fan, M. Pulsed Eddy Current Non-Destructive Testing and Evaluation: A Review. Chin. J. Mech. Eng. 2017, 30, 500–514, Erratum in Chin. J. Mech. Eng. 2017, 30, 1474. [Google Scholar] [CrossRef] [Scilit]
- Lin, S.; Yu, K.; Zou, X.; Zhu, F.; She, S.; Li, Y.; Zheng, X.; Yin, W. Exploration of Lift-off Effects Reduction Based on Tilted Coils for Eddy Current Testing of Planar Structures. Nondestruct. Test. Eval. 2025, 1–14. [Google Scholar] [CrossRef] [Scilit]
- Doshvarpassand, S.; Wu, C.; Wang, X. An Overview of Corrosion Defect Characterization Using Active Infrared Thermography. Infrared Phys. Technol. 2019, 96, 366–389. [Google Scholar] [CrossRef] [Scilit]
- Abeln, B.; Bartsch, H.; Sanchez, P.M.; Kianfar, A.; Geers, T.; Feldmann, M.; Clausen, E. Prediction of Micro-Cracks in Steel Structures Subjected to Fatigue by Means of Acoustic Emission. J. Nondestr. Eval. 2025, 44, 118. [Google Scholar] [CrossRef] [Scilit]
- Pénicaud, M.; Lequien, F.; Fisher, C.; Recoquillay, A. Review of Current Trends and Uses of Machine Learning for Discrete Acoustic Emission Interpretation. J. Nondestr. Eval. 2025, 44, 109. [Google Scholar] [CrossRef] [Scilit]
- Yang, M.; Liu, J. In Situ Monitoring of Corrosion under Insulation Using Electrochemical and Mass Loss Measurements. Int. J. Corros. 2022, 2022, 6681008. [Google Scholar] [CrossRef] [Scilit]
- May, Z.; Alam, M.K.; Nayan, N.A.; Rahman, N.A.A.; Mahmud, M.S. Acoustic Emission Corrosion Feature Extraction and Severity Prediction Using Hybrid Wavelet Packet Transform and Linear Support Vector Classifier. PLoS ONE 2021, 16, e0261040. [Google Scholar] [CrossRef] [Scilit] [PubMed]
- Nguyen, D.T.; Nguyen, T.K.; Ahmad, Z.; Kim, J.M. A Reliable Pipeline Leak Detection Method Using Acoustic Emission with Time Difference of Arrival and Kolmogorov–Smirnov Test. Sensors 2023, 23, 9296. [Google Scholar] [CrossRef] [Scilit] [PubMed]
- Wang, R.; Shan, G.; Qiu, F.; Zhu, L.; Wang, K.; Meng, X.; Li, R.; Song, K.; Chen, X. Corrosion State Monitoring Based on Multi-Granularity Synergistic Learning of Acoustic Emission and Electrochemical Noise Signals. Processes 2024, 12, 2935. [Google Scholar] [CrossRef] [Scilit]
- Lee, J.; Choe, E.; Pham, C.-T.; Le, M. Measurement of Thinned Water-Cooled Wall in a Circulating Fluidized Bed Boiler Using Ultrasonic and Magnetic Methods. Appl. Sci. 2021, 11, 2498. [Google Scholar] [CrossRef] [Scilit]
- Tai, J.L.; Sultan, M.T.H.; Łukaszewicz, A.; Shahar, F.S.; Oksiuta, Z.; Krishnamoorthy, R.R. Enhancing Turnaround Maintenance in Process Plants through On-Stream Phased Array Corrosion Mapping: A Review. Appl. Sci. 2024, 14, 6707. [Google Scholar] [CrossRef] [Scilit]
- Yang, L.; Dang, J.; Yang, M.; Dang, Y.; Yuan, K.; Zhou, Y.; Dang, B. Circular-Arc Array for the Pulsed Eddy Current Inspection of Thermally Insulated Pipelines. Meas. Sci. Technol. 2023, 34, 125114. [Google Scholar] [CrossRef] [Scilit]
- Wang, H.; Huang, J.; Liu, L.; Qin, S.; Fu, Z. A Novel Pulsed Eddy Current Criterion for Non-Ferromagnetic Metal Thickness Quantifications under Large Liftoff. Sensors 2022, 22, 614. [Google Scholar] [CrossRef] [Scilit] [PubMed]
- Sun, H.; Shi, Y.; Zhang, W.; Li, Y. Transient Eddy Current Response to Pulsed Eddy Current Testing inside a Ferromagnetic Casing. NDT E Int. 2022, 126, 102587. [Google Scholar] [CrossRef] [Scilit]
- Song, Y.; Wu, X. An Analytical Solution for Vertical Coils near a Multi-Layered Metallic Pipe in Pulsed Eddy Current Testing. NDT E Int. 2022, 125, 102570. [Google Scholar] [CrossRef] [Scilit]
- Ulapane, N.; Thiyagarajan, K.; Miro, J.V.; Kodagoda, S. Surface Representation of Pulsed Eddy Current Sensor Signals for Improved Ferromagnetic Material Thickness Quantification. IEEE Sens. J. 2021, 21, 5413–5422. [Google Scholar] [CrossRef] [Scilit]
- Fu, Y.; Lei, M.; Li, Z.; Gu, Z.; Yang, H.; Cao, A.; Sun, J. Lift-off Effect Reduction Based on the Dynamic Trajectories of the Received-Signal Fast Fourier Transform in Pulsed Eddy Current Testing. NDT E Int. 2017, 87, 85–92. [Google Scholar] [CrossRef] [Scilit]
- Wen, D.; Fan, M.; Cao, B.; Ye, B.; Tian, G. Lift-Off Point of Intersection in Spectral Pulsed Eddy Current Signals for Thickness Measurement. IEEE Sens. Lett. 2018, 2, 2822296. [Google Scholar] [CrossRef] [Scilit]
- Fan, M.; Cao, B.; Sunny, A.I.; Li, W.; Tian, G.; Ye, B. Pulsed Eddy Current Thickness Measurement Using Phase Features Immune to Liftoff Effect. NDT E Int. 2017, 86, 123–131. [Google Scholar] [CrossRef] [Scilit]
- Rajendran, V.; Prathuru, A.; Fernandez, C.; Faisal, N.H. Corrosion Monitoring at the Interface Using Sensors and Advanced Sensing Materials: Methods, Challenges and Opportunities. Corros. Eng. Sci. Technol. 2023, 58, 281–321. [Google Scholar] [CrossRef] [Scilit]
- Zuo, Y.; Hu, G.; Gan, F.; Zeng, Z.; Lin, Z.; Wang, X.; Xu, R.; Wen, L.; Hu, S.; Le, H.; et al. Multi-Modal Joint Pulsed Eddy Current Sensor Signal Denoising Method Integrating Inductive Disturbance Mechanism. Sensors 2025, 25, 3830. [Google Scholar] [CrossRef] [Scilit] [PubMed]
- Sudirman, S.; Natalia, F.; Sophian, A.; Ashraf, A. Pulsed Eddy Current Signal Processing Using Wavelet Scattering and Gaussian Process Regression for Fast and Accurate Ferromagnetic Material Thickness Measurement. Alex. Eng. J. 2022, 61, 11239–11250. [Google Scholar] [CrossRef] [Scilit]
- Silva, M.M.; Simas Filho, E.F.; Farias, P.C.M.A.; Albuquerque, M.C.S.; Silva, I.C.; Farias, C.T.T. Intelligent Embedded System for Decision Support in Pulsed Eddy Current Corrosion Detection Using Extreme Learning Machine. Measurement 2021, 185, 110069. [Google Scholar] [CrossRef] [Scilit]
- Xie, S.; Zhang, L.; Zhao, Y.; Wang, X.; Kong, Y.; Ma, Q.; Chen, Z.; Uchimoto, T.; Takagi, T. Features Extraction and Discussion in a Novel Frequency-Band-Selecting Pulsed Eddy Current Testing Method for the Detection of a Certain Depth Range of Defects. NDT E Int. 2020, 111, 102211. [Google Scholar] [CrossRef] [Scilit]
- Zhao, T.; Watson, R.; Zhang, D.; McMillan, R.; Galbraith, W.; MacLeod, C.; Mohseni, E.; Dobie, G. A Pulsed Eddy Current Sensor for UAV Deployed Pipe Thickness Measurement. IEEE Sens. J. 2024, 24, 33326–33335. [Google Scholar] [CrossRef] [Scilit]
- Huang, X.; Wehlin, P.; Srinivasan, V.; Aromando, J.; Deng, Y. A Novel Data-Driven Auto Compensation Algorithm for Pulsed Eddy Current Inspection of High Voltage Feeder Cable Pipe. Nondestruct. Test. Eval. 2026, 41, 1174–1193. [Google Scholar] [CrossRef] [Scilit]
- Piao, G.; Guo, J.; Hu, T.; Deng, Y.; Leung, H. A Novel Pulsed Eddy Current Method for High-Speed Pipeline Inline Inspection. Sens. Actuators A Phys. 2019, 295, 244–258. [Google Scholar] [CrossRef] [Scilit]
- Xu, S.; Liu, Y.; Shi, Y.; Liu, Y.; Zhou, Z.; Hu, X. A Pulse Eddy Current Detection Method for Ferromagnetic Material Defects Based on Orthogonal Vector Magnetic Field Sensors. IET Sci. Meas. Technol. 2026, 20, e70040. [Google Scholar] [CrossRef] [Scilit]
- Nakhli Mahal, H.; Yang, K.; Nandi, A.K. Defect Detection Using Power Spectrum of Torsional Waves in Guided-Wave Inspection of Pipelines. Appl. Sci. 2019, 9, 1449. [Google Scholar] [CrossRef] [Scilit]
- Zheng, Z.; Zhang, Z. Circumferential Damage Monitoring of Steel Pipe Using a Radar Map Based on Torsional Guided Waves. Sensors 2023, 23, 8734. [Google Scholar] [CrossRef] [Scilit] [PubMed]
- Raišutis, R.; Tumšys, O.; Žukauskas, E.; Samaitis, V.; Draudvilienė, L.; Jankauskas, A. An Inspection Technique for Steel Pipes Wall Condition Using Ultrasonic Guided Helical Waves and a Limited Number of Transducers. Materials 2023, 16, 5410. [Google Scholar] [CrossRef] [Scilit] [PubMed]
- Lyu, F.; Zhou, X.; Ding, Z.; Qiao, X.; Song, D. Application Research of Ultrasonic-Guided Wave Technology in Pipeline Corrosion Defect Detection: A Review. Coatings 2024, 14, 358. [Google Scholar] [CrossRef] [Scilit]
- Pedram, S.K.; Gan, T.-H.; Ghafourian, M. Improved Defect Detection of Guided Wave Testing Using Split-Spectrum Processing. Sensors 2020, 20, 4759. [Google Scholar] [CrossRef] [Scilit] [PubMed]
- Jan, H.; Sulaiman, M.; Khan, N.A.; Alshammari, F.S.; Laouini, G.; Ashraf, R.; Ali, M.A. Improved Pipeline Damage Detection Using Flexural and Torsional Ultrasonic Guided Waves. Res. Math. 2026, 13, 2648988. [Google Scholar] [CrossRef] [Scilit]
- Cirtautas, D.; Samaitis, V.; Mažeika, L.; Raišutis, R. Detection and Classification of Uniform and Concentrated Wall-Thinning Defects Using High-Order Circumferential Guided Waves and Artificial Neural Networks. Sensors 2023, 23, 6505. [Google Scholar] [CrossRef] [Scilit] [PubMed]
- Gao, T.; Sun, H.; Hong, Y.; Qing, X. Hidden Corrosion Detection Using Laser Ultrasonic Guided Waves with Multi-Frequency Local Wavenumber Estimation. Ultrasonics 2020, 108, 106182. [Google Scholar] [CrossRef] [Scilit] [PubMed]
- Zima, B. Guided Wave-Based Probabilistic Imaging Using Wavefront Asymmetry for Corrosion Assessment in Metallic Plates. J. Nondestr. Eval. 2025, 45, 10. [Google Scholar] [CrossRef] [Scilit]
- Zima, B. Guided Ultrasonic Wave Technique for Corrosion Monitoring and Thickness Variability Analysis. Measurement 2025, 245, 116584. [Google Scholar] [CrossRef] [Scilit]
- Rodgers, E.C.; Mariani, S.; Cawley, P. The Use of Circumferential Guided Waves to Monitor Axial Cracks in Pipes. Struct. Health Monit. 2023, 22, 2609–2625. [Google Scholar] [CrossRef] [Scilit]
- Vinogradov, S.; Akimov, N.; Cobb, A.; Fisher, J. Screening of Corrosion in Storage Tank Walls and Bottoms Using an Array of Guided Wave Magnetostrictive Transducers. Sensors 2026, 26, 1253. [Google Scholar] [CrossRef] [Scilit] [PubMed]
- Chen, Z.; Zhao-Dong, X.; Xulei, Z.; Yan-Wei, X.; Changqing, M.; Yong, L. Quantification of Corrosion-Like Defects in Pipelines Using Multifrequency Identification of Nondispersive Torsional Guided Waves. J. Eng. Mech. 2024, 150, 4024050. [Google Scholar] [CrossRef] [Scilit]
- Li, Y.; Liang, Q.; He, F. Research on Ultrasonic Guided Wave Damage Detection in Internally Corroded Pipes with Curved Random Surfaces. Appl. Sci. 2025, 15, 2372. [Google Scholar] [CrossRef] [Scilit]
- Kopf, L.F.; Tighe, R.C. Automated Detection and Quantification of the Onset of Undercoating Corrosion Using Pulsed Thermography. Mater. Corros. 2023, 74, 777–792. [Google Scholar] [CrossRef] [Scilit]
- Rezayiye, R.K.; Ibarra-Castanedo, C.; Maldague, X. Methods for Corrosion Detection in Pipes Using Thermography: A Case Study on Synthetic Datasets. Algorithms 2024, 17, 439. [Google Scholar] [CrossRef] [Scilit]
- Elizalde, J.S.G.; Chiou, Y.-S. Improving the Detectability and Confirmation of Hidden Surface Corrosion on Metal Sheets Using Active Infrared Thermography. J. Build. Eng. 2023, 66, 105931. [Google Scholar] [CrossRef] [Scilit]
- Yu, S.; Chung, W.W.; Lau, T.C.; Lai, W.W.; Sham, J.F.C.; Ho, C.Y. Laboratory Validation of In-Pipe Pulsed Thermography in the Rapid Assessment of External Pipe Wall Thinning in Buried Metallic Utilities. NDT E Int. 2023, 135, 102791. [Google Scholar] [CrossRef] [Scilit]
- Xu, C.; Zhou, N.; Xie, J.; Gong, X.; Chen, G.; Song, G. Investigation on Eddy Current Pulsed Thermography to Detect Hidden Cracks on Corroded Metal Surface. NDT E Int. 2016, 84, 27–35. [Google Scholar] [CrossRef] [Scilit]
- Tian, G.Y.; Gao, Y.; Li, K.; Wang, Y.; Gao, B.; He, Y. Eddy Current Pulsed Thermography with Different Excitation Configurations for Metallic Material and Defect Characterization. Sensors 2016, 16, 843. [Google Scholar] [CrossRef] [Scilit] [PubMed]
- Gao, Y.; Tian, G.Y.; Wang, P.; Wang, H.; Gao, B.; Woo, W.L.; Li, K. Electromagnetic Pulsed Thermography for Natural Cracks Inspection. Sci. Rep. 2017, 7, 42073. [Google Scholar] [CrossRef] [Scilit] [PubMed]
- Wu, Y.; Zhang, C.; Wang, F.; Yang, C. Theoretical and Numerical Study of Eddy Current Pulsed Thermography to Detect Damage of Deep-Sea Manned Pressure Hull. J. Mar. Sci. Eng. 2023, 11, 1410. [Google Scholar] [CrossRef] [Scilit]
- Xie, J.; Chen, L.; Han, Y.; Huang, W.; Li, G.; Xu, C. Visualization of Hidden Cracks under Corrosion Layer in Steel Structures via Eddy Current Pulsed Thermography: Simulation and Experiment. NDT E Int. 2025, 152, 103321. [Google Scholar] [CrossRef] [Scilit]
- Panella, F.W.; Pirinu, A. Application of Pulsed Thermography and Post-Processing Techniques for CFRP Industrial Components. J. Nondestr. Eval. 2021, 40, 52. [Google Scholar] [CrossRef] [Scilit]
- Wei, Z.; Osman, A.; Valeske, B.; Maldague, X. A Dataset of Pulsed Thermography for Automated Defect Depth Estimation. Appl. Sci. 2023, 13, 3093. [Google Scholar] [CrossRef] [Scilit]
- Chizh, M.; Zhuravlev, A.; Razevig, V.; Ivashov, S.; Falorni, P.; Capineri, L. Defects Investigation in Thermal Insulation Coatings with Microwave Imaging Based on a 22 GHz Holographic Radar. NDT E Int. 2020, 109, 102191. [Google Scholar] [CrossRef] [Scilit]
- Bossi, L.; Falorni, P.; Capineri, L. Performance Comparison for the Detection of Defects in Thermal Insulating Materials Using Microwave Holograms Acquired Manually and with a Robotized Scanner. J. Electromagn. Waves Appl. 2019, 33, 2081–2095. [Google Scholar] [CrossRef] [Scilit]
- Tu, W.; Zhong, S.; Zhang, Q.; Huang, Y. Rapid Diagnosis of Corrosion beneath Epoxy Protective Coating Using Non-Contact THz-TDS Technique. Nondestruct. Test. Eval. 2024, 39, 557–572. [Google Scholar] [CrossRef] [Scilit]
- Yang, S.; Zhang, Y.; Zou, Q.; Jiang, X.; Jiang, S. Non-Destructive Quantification of Corrosion under Coatings and Evaluation of Coating Performance Using Terahertz Time-Domain Spectroscopy. Constr. Build. Mater. 2025, 501, 144251. [Google Scholar] [CrossRef] [Scilit]
- Tobar, D.; Kambhampati, S.; Fitzgerald, A.J.; Nener, B.; Pojtanabuntoeng, T.; Wallace, V.P. Non-Destructive Detection of Coating Delamination Using Reflected Time-Domain Terahertz Waveforms. Sci. Rep. 2025, 15, 42401. [Google Scholar] [CrossRef] [Scilit] [PubMed]
- Jiang, X.; Xu, Y.; Hu, H. Thickness Characterization of Steel Plate Coating Materials with Terahertz Time-Domain Reflection Spectroscopy Based on BP Neural Network. Sensors 2024, 24, 4992. [Google Scholar] [CrossRef] [Scilit] [PubMed]
- Fernández-Osete, I.; Bermejo, D.; Ayneto-Gubert, X.; Escaler, X. Review of the Uses of Acoustic Emissions in Monitoring Cavitation Erosion and Crack Propagation. Foundations 2024, 4, 114–133. [Google Scholar] [CrossRef] [Scilit]
- Kästle, E.D.; Duffner, E.; Popiela, B.; Ghaznavi, A. Monitoring Failure of Composite Pressure Vessels with Acoustic Emissions. J. Nondestr. Eval. 2026, 45, 39. [Google Scholar] [CrossRef] [Scilit]
- Li, Z.; Zhang, H.; Tan, D.; Chen, X.; Lei, H. A Novel Acoustic Emission Detection Module for Leakage Recognition in a Gas Pipeline Valve. Process Saf. Environ. Prot. 2017, 105, 32–40. [Google Scholar] [CrossRef] [Scilit]
- Sheikh, M.F.; Kamal, K.; Rafique, F.; Sabir, S.; Zaheer, H.; Khan, K. Corrosion Detection and Severity Level Prediction Using Acoustic Emission and Machine Learning Based Approach. Ain Shams Eng. J. 2021, 12, 3891–3903. [Google Scholar] [CrossRef] [Scilit]
- Saleem, F.; Ahmad, Z.; Siddique, M.F.; Umar, M.; Kim, J.M. Acoustic Emission-Based Pipeline Leak Detection and Size Identification Using a Customized One-Dimensional DenseNet. Sensors 2025, 25, 1112. [Google Scholar] [CrossRef] [Scilit] [PubMed]
- Ullah, N.; Ahmed, Z.; Kim, J.-M. Pipeline Leakage Detection Using Acoustic Emission and Machine Learning Algorithms. Sensors 2023, 23, 3226. [Google Scholar] [CrossRef] [Scilit] [PubMed]
- Zheng, D.; Wang, X.; Yang, L.; Li, Y.; Xia, H.; Zhang, H.; Xiang, X. Review of Acoustic Emission Detection Technology for Valve Internal Leakage: Mechanisms, Methods, Challenges, and Application Prospects. Sensors 2025, 25, 4487. [Google Scholar] [CrossRef] [Scilit] [PubMed]
- Tai, J.L.; Sultan, M.T.H.; Łukaszewicz, A.; Siemiątkowski, Z.; Skorulski, G.; Shahar, F.S. Preventing Catastrophic Failures: A Review of Applying Acoustic Emission Testing in Multi-Bolted Flanges. Metals 2025, 15, 438. [Google Scholar] [CrossRef] [Scilit]
- Huang, C.; Zhang, W.; Yang, B.; Zheng, R.; Sun, X.; Chen, F.; Xu, D.; Li, W. Noise Identification in Acoustic Emission (AE) Inspection of Oil Tank Bottom Corrosion Based on Multi-Domain Features and BES-SVM Algorithm. Processes 2025, 13, 3291. [Google Scholar] [CrossRef] [Scilit]
- Barat, V.; Marchenkov, A.; Kritskiy, D.; Bardakov, V.; Karpova, M.; Kuznetsov, M.; Zaprudnova, A.; Ushanov, S.; Elizarov, S. Structural Health Monitoring of Walking Dragline Excavator Using Acoustic Emission. Appl. Sci. 2021, 11, 3420. [Google Scholar] [CrossRef] [Scilit]
- Hu, P.; Gui, X.; Yu, X.; Hua, L. Modal Acoustic Emission-Based Circumferential Crack Feature Extractions for Pipeline Welds with L-Shaped Flexible Sensor Array. Nondestruct. Test. Eval. 2025, 40, 1074–1091. [Google Scholar] [CrossRef] [Scilit]
- Mu, W.; Gao, Y.; Wang, Y.; Liu, G.; Hu, H. Modeling and Analysis of Acoustic Emission Generated by Fatigue Cracking. Sensors 2022, 22, 1208. [Google Scholar] [CrossRef] [Scilit] [PubMed]
- Chai, M.; Zhang, J.; Zhang, Z.; Duan, Q.; Cheng, G. Acoustic Emission Studies for Characterization of Fatigue Crack Growth in 316LN Stainless Steel and Welds. Appl. Acoust. 2017, 126, 101–113. [Google Scholar] [CrossRef] [Scilit]
- Huang, J.; Zhang, Z.; Yu, Y.; Li, Y.; Zhang, S.; Qin, R.; Xing, J.; Cheng, W.; Wen, G.; Chen, X. An Incremental Learning Framework for Pipeline Weld Crack Damage Identification and Leakage Rate Prediction. Eng. Appl. Comput. Fluid Mech. 2024, 18, 2406256. [Google Scholar] [CrossRef] [Scilit]
- Wang, X.; Xu, S.; Zhang, Y.; Tu, Y.; Peng, M. A Method for the Pattern Recognition of Acoustic Emission Signals Using Blind Source Separation and a CNN for Online Corrosion Monitoring in Pipelines with Interference from Flow-Induced Noise. Sensors 2024, 24, 5991. [Google Scholar] [CrossRef] [Scilit] [PubMed]
- Nguyen, T.K.; Ahmad, Z.; Kim, J.M. Leak Localization on Cylinder Tank Bottom Using Acoustic Emission. Sensors 2023, 23, 27. [Google Scholar] [CrossRef] [Scilit] [PubMed]
- Rahman, N.A.A.; May, Z.; Jaffari, R.; Hanif, M. Failure Severity Prediction for Protective-Coating Disbondment via the Classification of Acoustic Emission Signals. Sensors 2023, 23, 6833. [Google Scholar] [CrossRef] [Scilit] [PubMed]
- Tian, Y.; Palaev, A.G.; Shammazov, I.A.; Ren, Y. Non-Destructive Testing Technology for Corrosion Wall Thickness Reduction Defects in Pipelines Based on Electromagnetic Ultrasound. Front. Earth Sci. 2024, 12, 1432043. [Google Scholar] [CrossRef] [Scilit]
- Ghahremani, P.; Najafabadi, M.A.; Alimirzaei, S.; Fotouhi, M. Acoustic Emission-Based Analysis of Damage Mechanisms in Filament Wound Fiber Reinforced Composite Tubes. Sensors 2023, 23, 6994. [Google Scholar] [CrossRef] [Scilit] [PubMed]
- Ghadarah, N.; Ayre, D. A Review on Acoustic Emission Testing for Structural Health Monitoring of Polymer-Based Composites. Sensors 2023, 23, 6945. [Google Scholar] [CrossRef] [Scilit] [PubMed]
- Frankowski, P.K.; Matysik, S. Integrating Electromagnetic NDT and IoT for Enhanced Structural Health Monitoring of Corrosion in Reinforced Concrete as a Key to Sustainable Smart Cities. Sustainability 2025, 17, 307. [Google Scholar] [CrossRef] [Scilit]
- Yang, D.; Wang, H.; Wang, T.; Lu, G. Piezoelectric Active Sensing-Based Pipeline Corrosion Monitoring Using Singular Spectrum Analysis. Sensors 2024, 24, 4192. [Google Scholar] [CrossRef] [Scilit] [PubMed]
- Hou, L.; Akutagawa, S.; Tomoshige, Y.; Kimura, T. Experimental Investigation for Monitoring Corrosion Using Plastic Optical Fiber Sensors. Sensors 2024, 24, 885. [Google Scholar] [CrossRef] [Scilit] [PubMed]
- Strader, N.; Jordan, B.R.; Bilac, O.; Tennant, K.M.; Reynolds, D.S.; Sabolsky, E.M.; Daniszewski, A.C. Near-Field Passive Wireless Sensor for High-Temperature Metal Corrosion Monitoring. Sensors 2024, 24, 7806. [Google Scholar] [CrossRef] [Scilit] [PubMed]
- Angelopoulos, N.; Kappatos, V. An Experimental Assessment Using Acoustic Emission Sensors to Effectively Detect Surface Deterioration on Steel Plates. Sensors 2024, 24, 6462. [Google Scholar] [CrossRef] [Scilit] [PubMed]
- Kubacka, T.; Nguyen Dinh, C. Measurements of Thickness of a Steel Operation Pipe Occurring in a Salt Cavern and Its Geometry: Simulations and Experiments. Acta Geophys. 2024, 72, 3355–3369. [Google Scholar] [CrossRef] [Scilit]
- Chi, D.; Xu, Z.; Liu, H. Detection and Imaging of Corrosion Defects in Steel Structures Based on Ultrasonic Digital Image Processing. Metals 2024, 14, 390. [Google Scholar] [CrossRef] [Scilit]
- Tai, J.L.; Sultan, M.T.H.; Shahar, F.S.; Yidris, N.; Basri, A.A.; Shah, A.U.M. Exploring Probability of Detection (POD) Analysis in Nondestructive Testing: A Comprehensive Review and Potential Applications in Phased Array Ultrasonic Corrosion Mapping. Pertanika J. Sci. Technol. 2024, 32, 2165–2191. [Google Scholar] [CrossRef] [Scilit]
- Tai, J.L.; Sultan, M.T.H.; Tarasiuk, W.; Napiórkowski, J.; Łukaszewicz, A.; Shahar, F.S. Ultrasonic Velocity and Attenuation of Low-Carbon Steel at High Temperatures. Materials 2023, 16, 5123. [Google Scholar] [CrossRef] [Scilit] [PubMed]
- Amaya-Gómez, R.; Sánchez-Silva, M.; Bastidas-Arteaga, E.; Schoefs, F.; Muñoz, F. Reliability Assessments of Corroded Pipelines Based on Internal Pressure—A Review. Eng. Fail. Anal. 2019, 98, 190–214. [Google Scholar] [CrossRef] [Scilit]
- Vijaya Kumar, S.D.; Karuppanan, S.; Ovinis, M. Failure Pressure Prediction of High Toughness Pipeline with a Single Corrosion Defect Subjected to Combined Loadings Using Artificial Neural Network (ANN). Metals 2021, 11, 373. [Google Scholar] [CrossRef] [Scilit]
- Lo, M.; Karuppanan, S.; Ovinis, M. Failure Pressure Prediction of a Corroded Pipeline with Longitudinally Interacting Corrosion Defects Subjected to Combined Loadings Using FEM and ANN. J. Mar. Sci. Eng. 2021, 9, 281. [Google Scholar] [CrossRef] [Scilit]
- Cui, Y.; Zeng, L.; Luo, Z.; Ding, J. Pipeline Corrosion Detection via Group Delay Accumulation Effect of Multi-Path Circumferential Guided Wave Packets. Ultrasonics 2025, 155, 107742. [Google Scholar] [CrossRef] [Scilit] [PubMed]
- Morales-Cervantes, A.; Chávez-Campos, G.M.; Vergara-Hernández, H.J.; Téllez-Martínez, J.S.; León-Bejarano, M.F. Infrared Thermography for Spatiotemporal Analysis of High-Temperature Oxidation Dynamics in AISI 1045 Steel. Case Stud. Therm. Eng. 2025, 74, 106806. [Google Scholar] [CrossRef] [Scilit]
- Huang, Q.; Wang, R.; Hu, J.; Jiao, H.; Zhang, C.; Hou, Z.; Duan, C.; Long, X.; Lv, L. Development of Pulsed Eddy Current Nondestructive Testing: A Review. Sensors 2026, 26, 2289. [Google Scholar] [CrossRef] [Scilit] [PubMed]
- Nafiah, F.; Tokhi, M.O.; Shirkoohi, G.; Duan, F.; Zhao, Z.; Asfis, G.; Rudlin, J. Parameter Analysis of Pulsed Eddy Current Sensor Using Principal Component Analysis. IEEE Sens. J. 2021, 21, 6897–6903. [Google Scholar] [CrossRef] [Scilit]
- Sagarduy-Marcos, D.; Batsale, J.-C.; Rodríguez-Aseguinolaza, J. Quantitative Optimization Analysis of Lock-in Infrared Thermography for Characterizing Delaminations. Int. J. Heat Mass Transf. 2024, 231, 125748. [Google Scholar] [CrossRef] [Scilit]
- Łukaszuk, R.D.; Marques, R.M.; Chady, T. Lock-In Thermography with Cooling for the Inspection of Composite Materials. Materials 2023, 16, 6924. [Google Scholar] [CrossRef] [Scilit] [PubMed]
- Grys, S. Determining the Dimension of Subsurface Defects by Active Infrared Thermography -- Experimental Research. J. Sens. Sens. Syst. 2018, 7, 153–160. [Google Scholar] [CrossRef] [Scilit]
- Zelmati, D.; Bouledroua, O.; Ghelloudj, O.; Amirat, A.; Djukic, M.B. A Probabilistic Approach to Estimate the Remaining Life and Reliability of Corroded Pipelines. J. Nat. Gas. Sci. Eng. 2022, 99, 104387. [Google Scholar] [CrossRef] [Scilit]
- Wang, Y.; Xie, M.; Su, C. Multi-Objective Maintenance Strategy for Corroded Pipelines Considering the Correlation of Different Failure Modes. Reliab. Eng. Syst. Saf. 2024, 243, 109894. [Google Scholar] [CrossRef] [Scilit]
- Olawole, O.O.; Gbadeyan, O.J.; Deigh, C.; Sijuade, M.F. Advanced Sensor Systems and Machine Learning for Pipeline Integrity Management: A Review of Corrosion Monitoring and Prediction Strategies. npj Mater. Degrad. 2026, 10, 48, Correction in npj Mater. Degrad. 2026, 10, 91. [Google Scholar] [CrossRef] [Scilit]
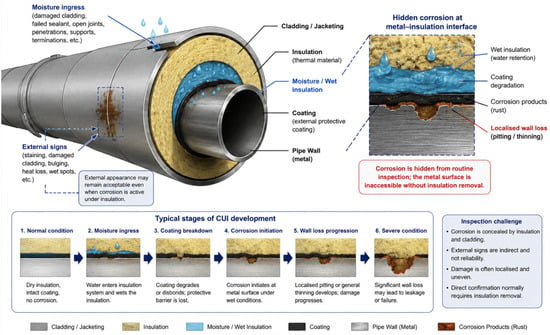
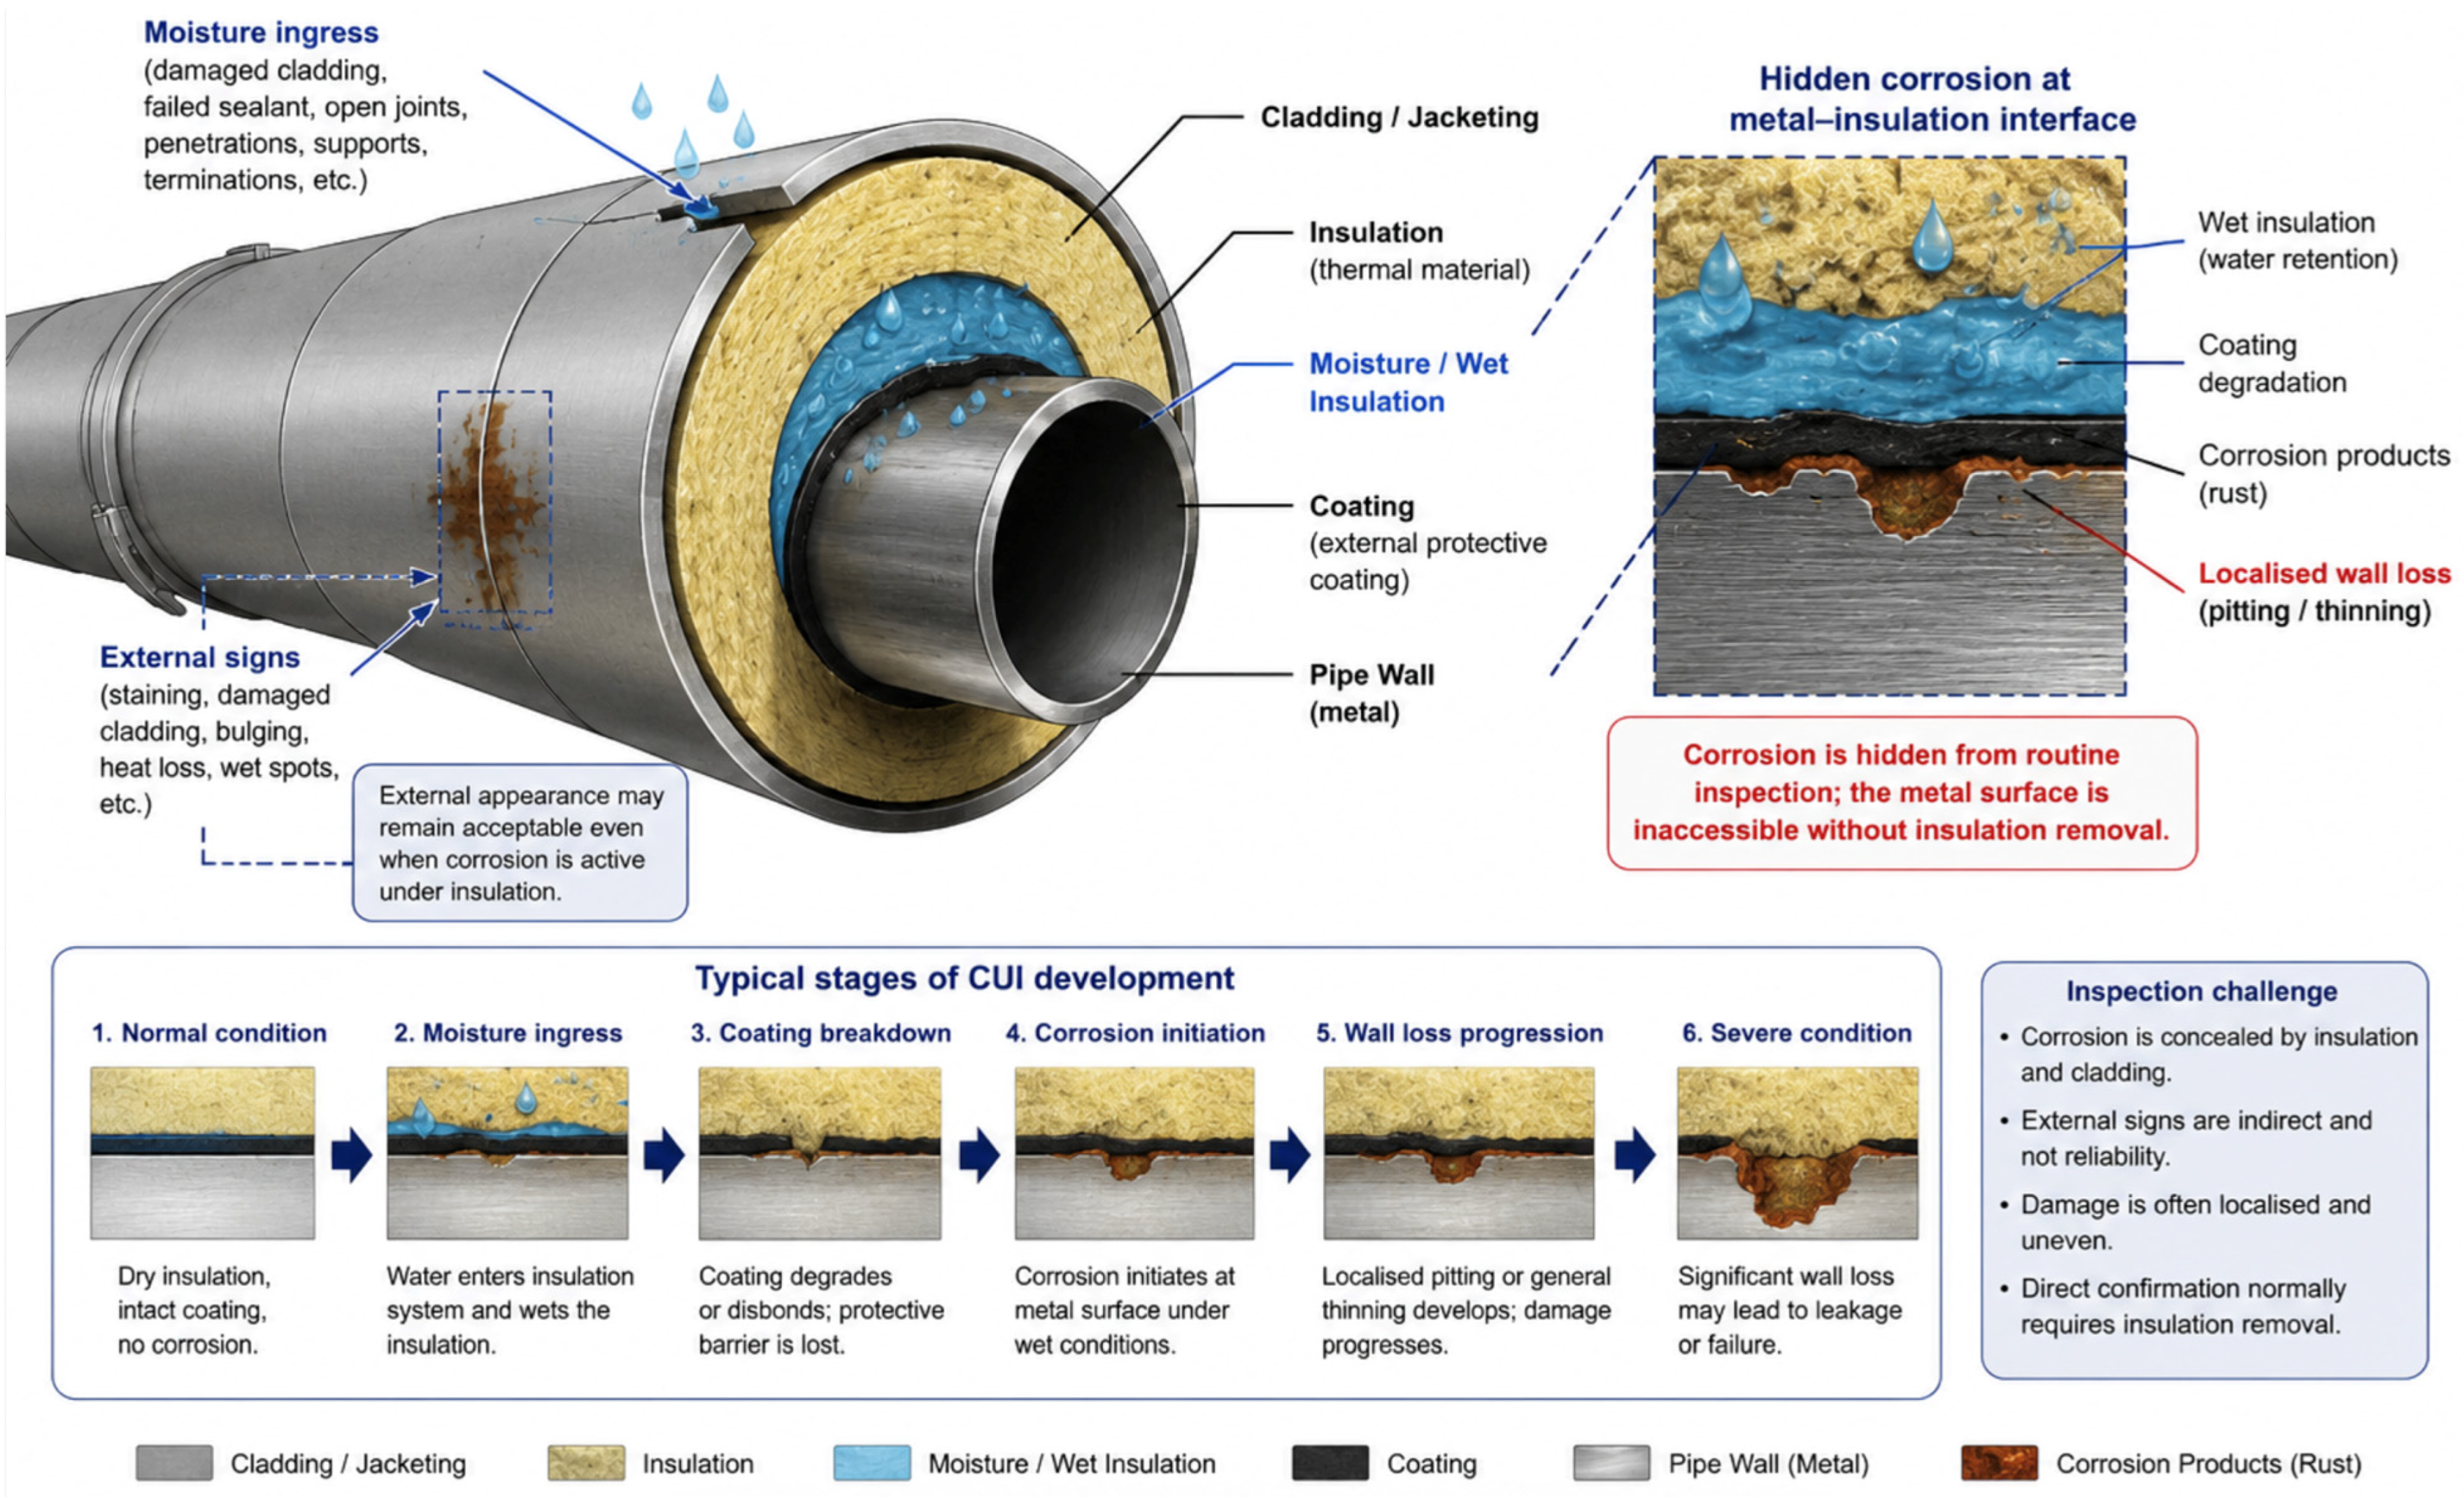
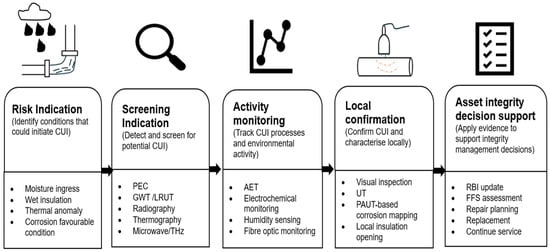
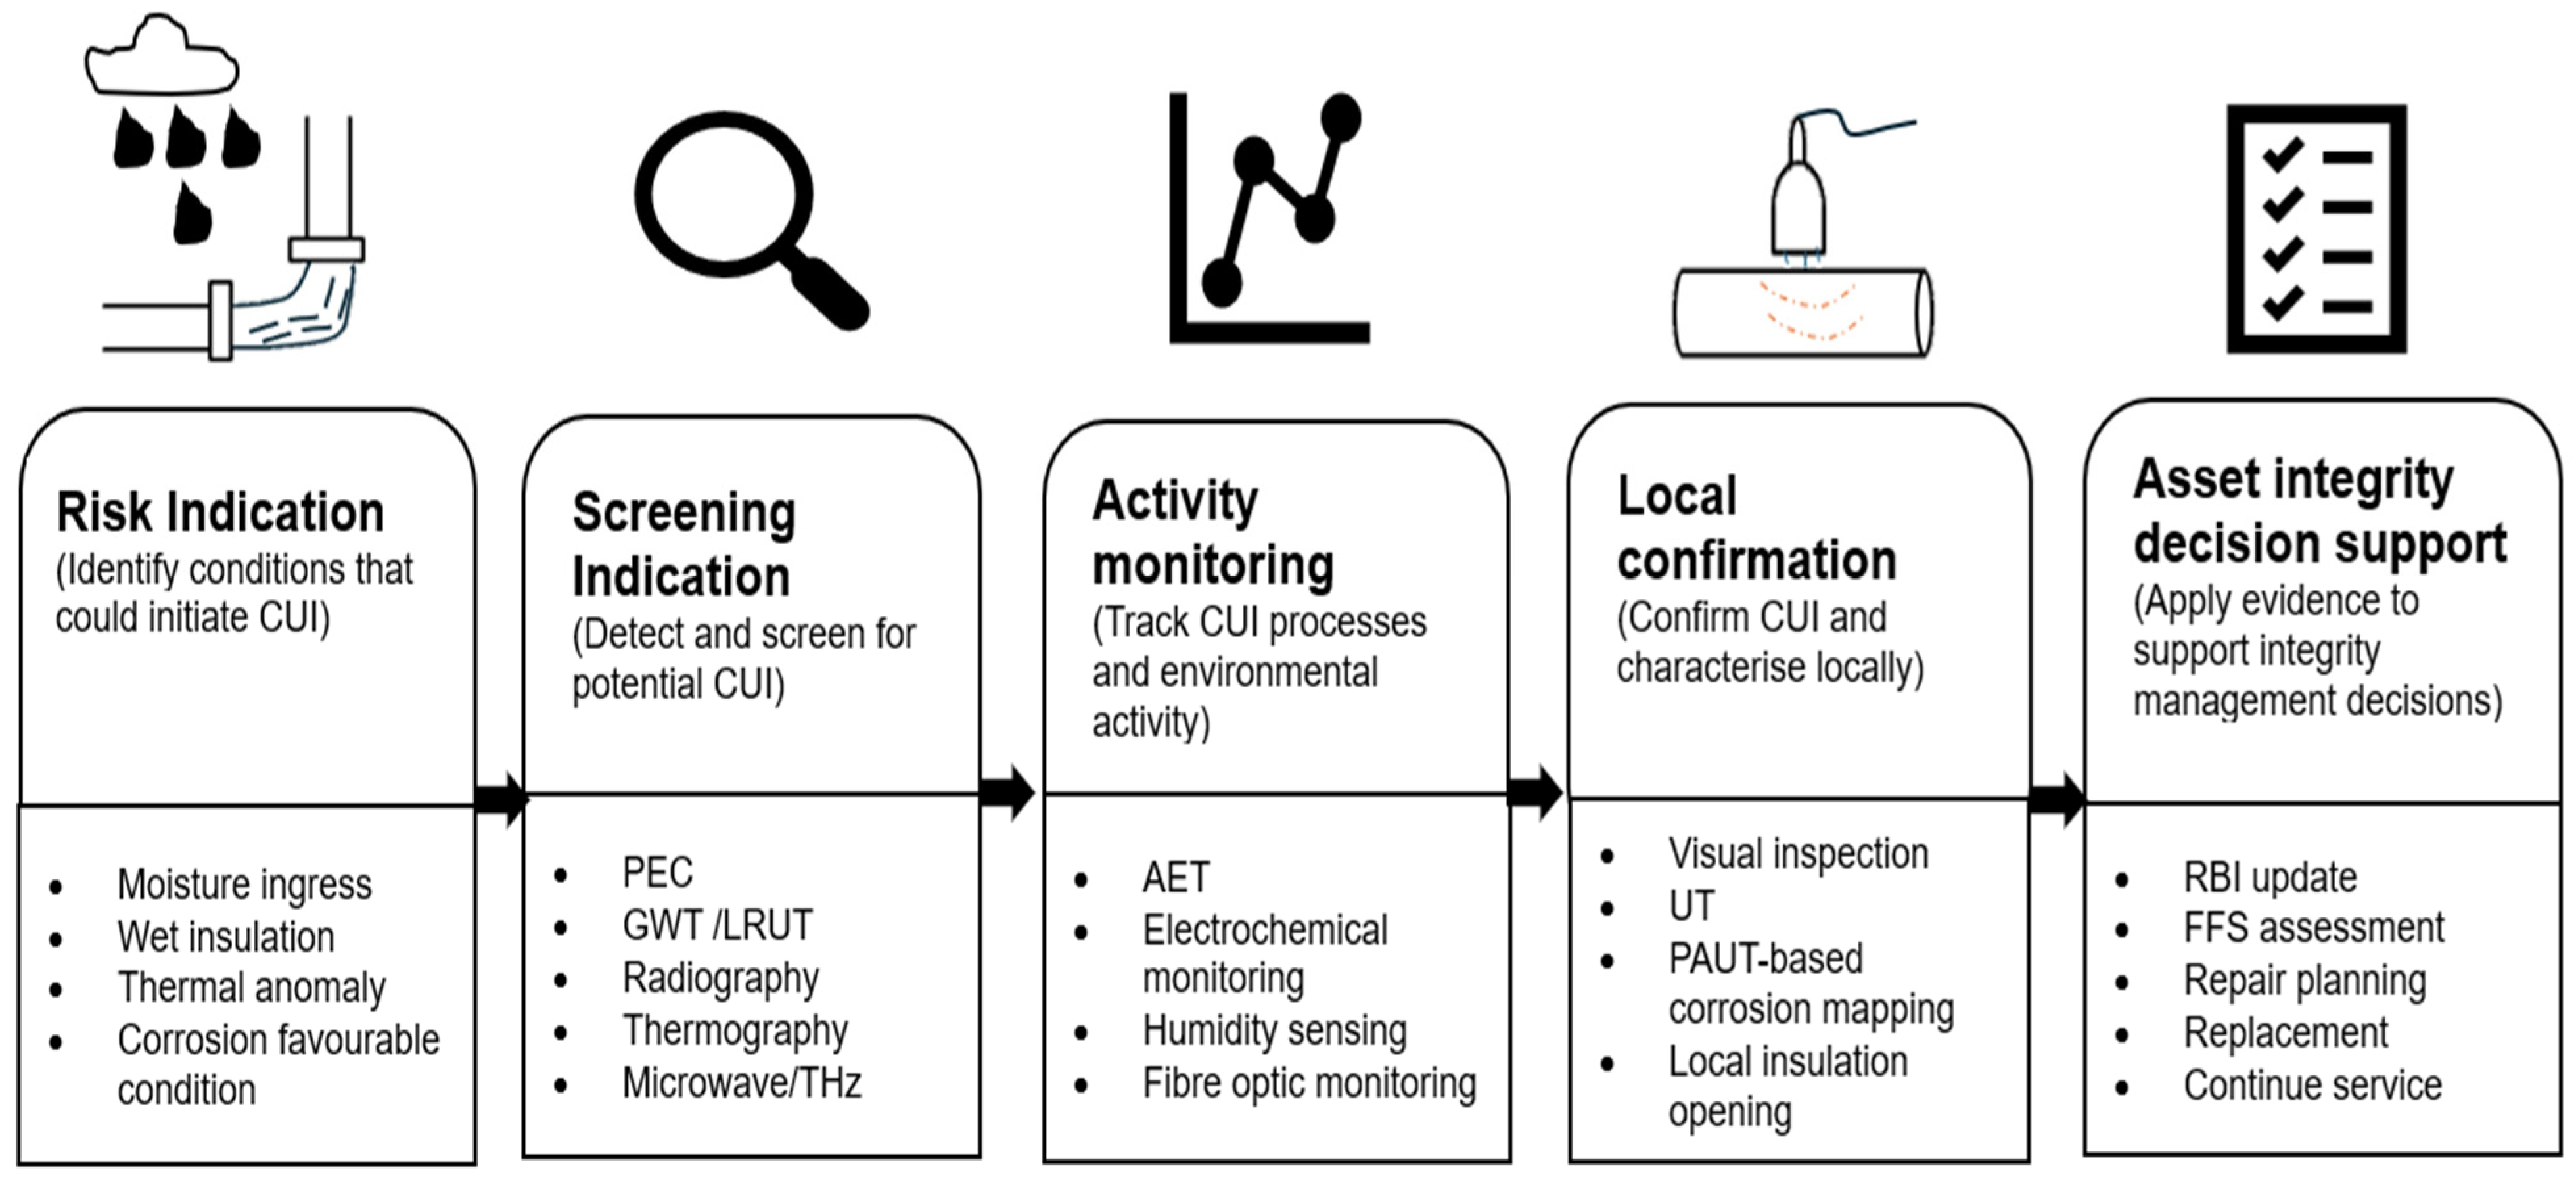
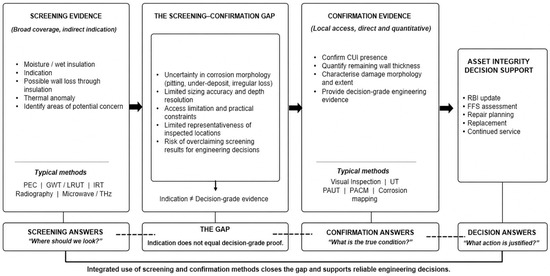
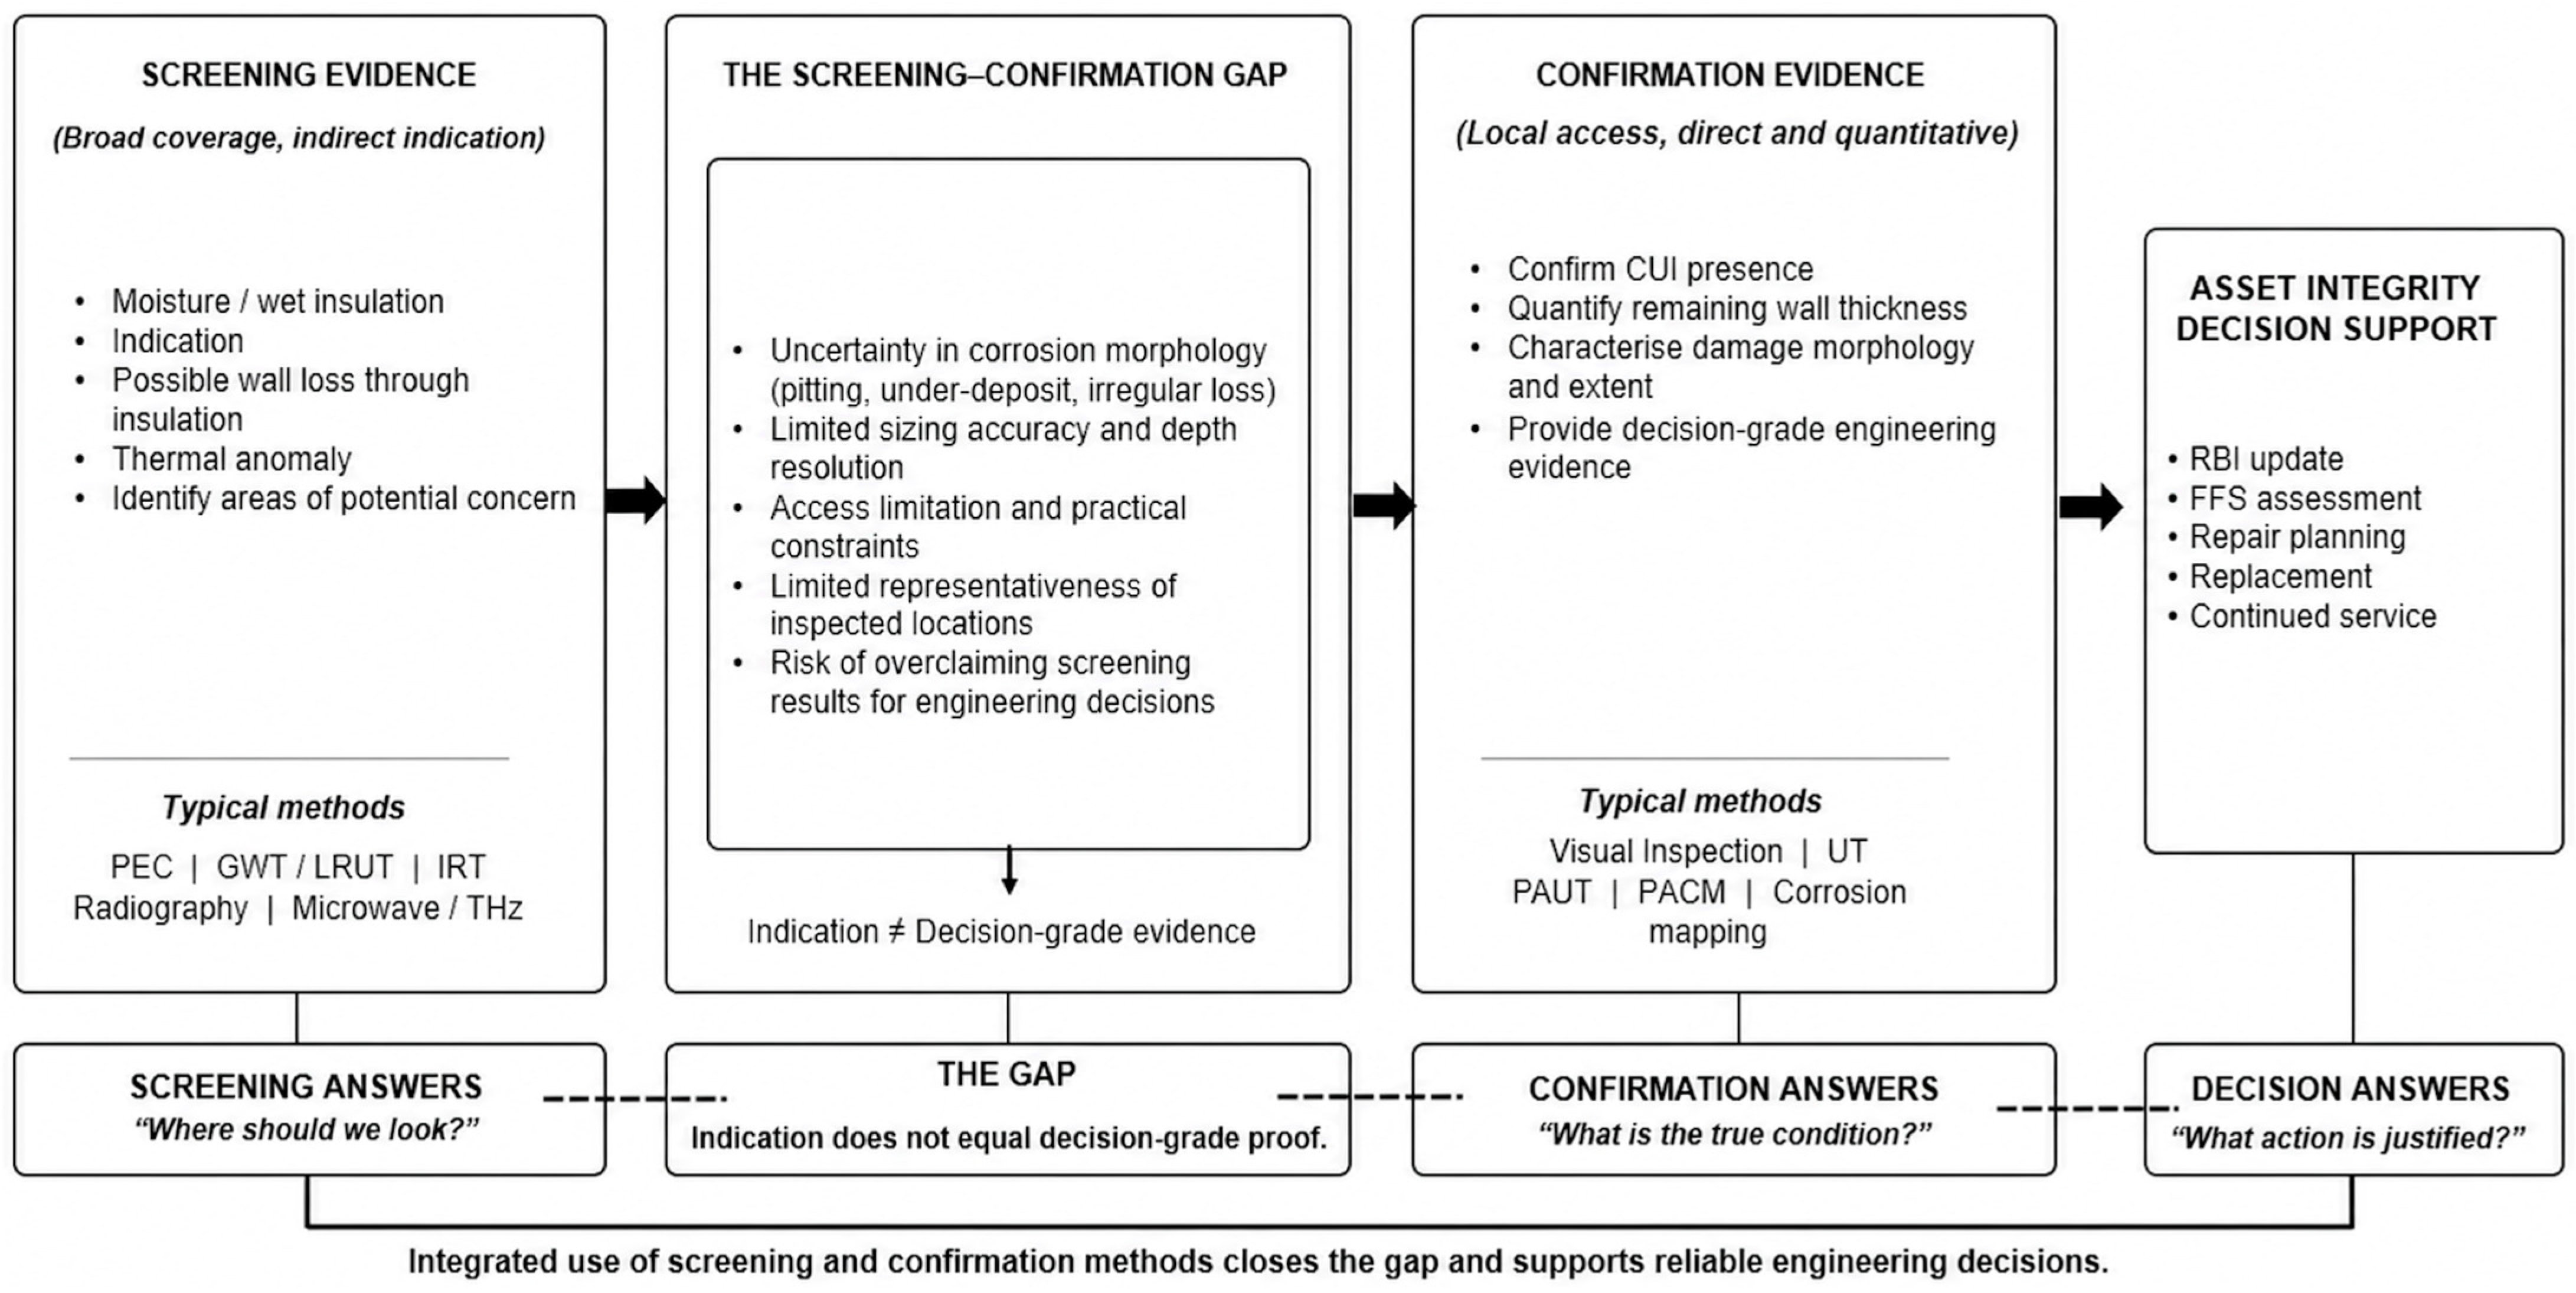
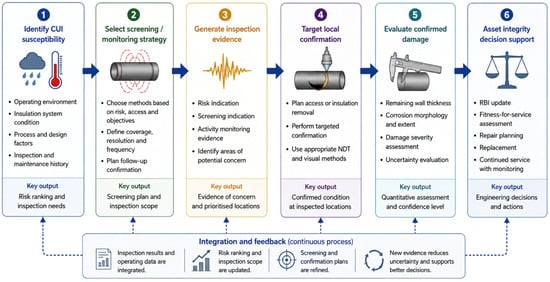
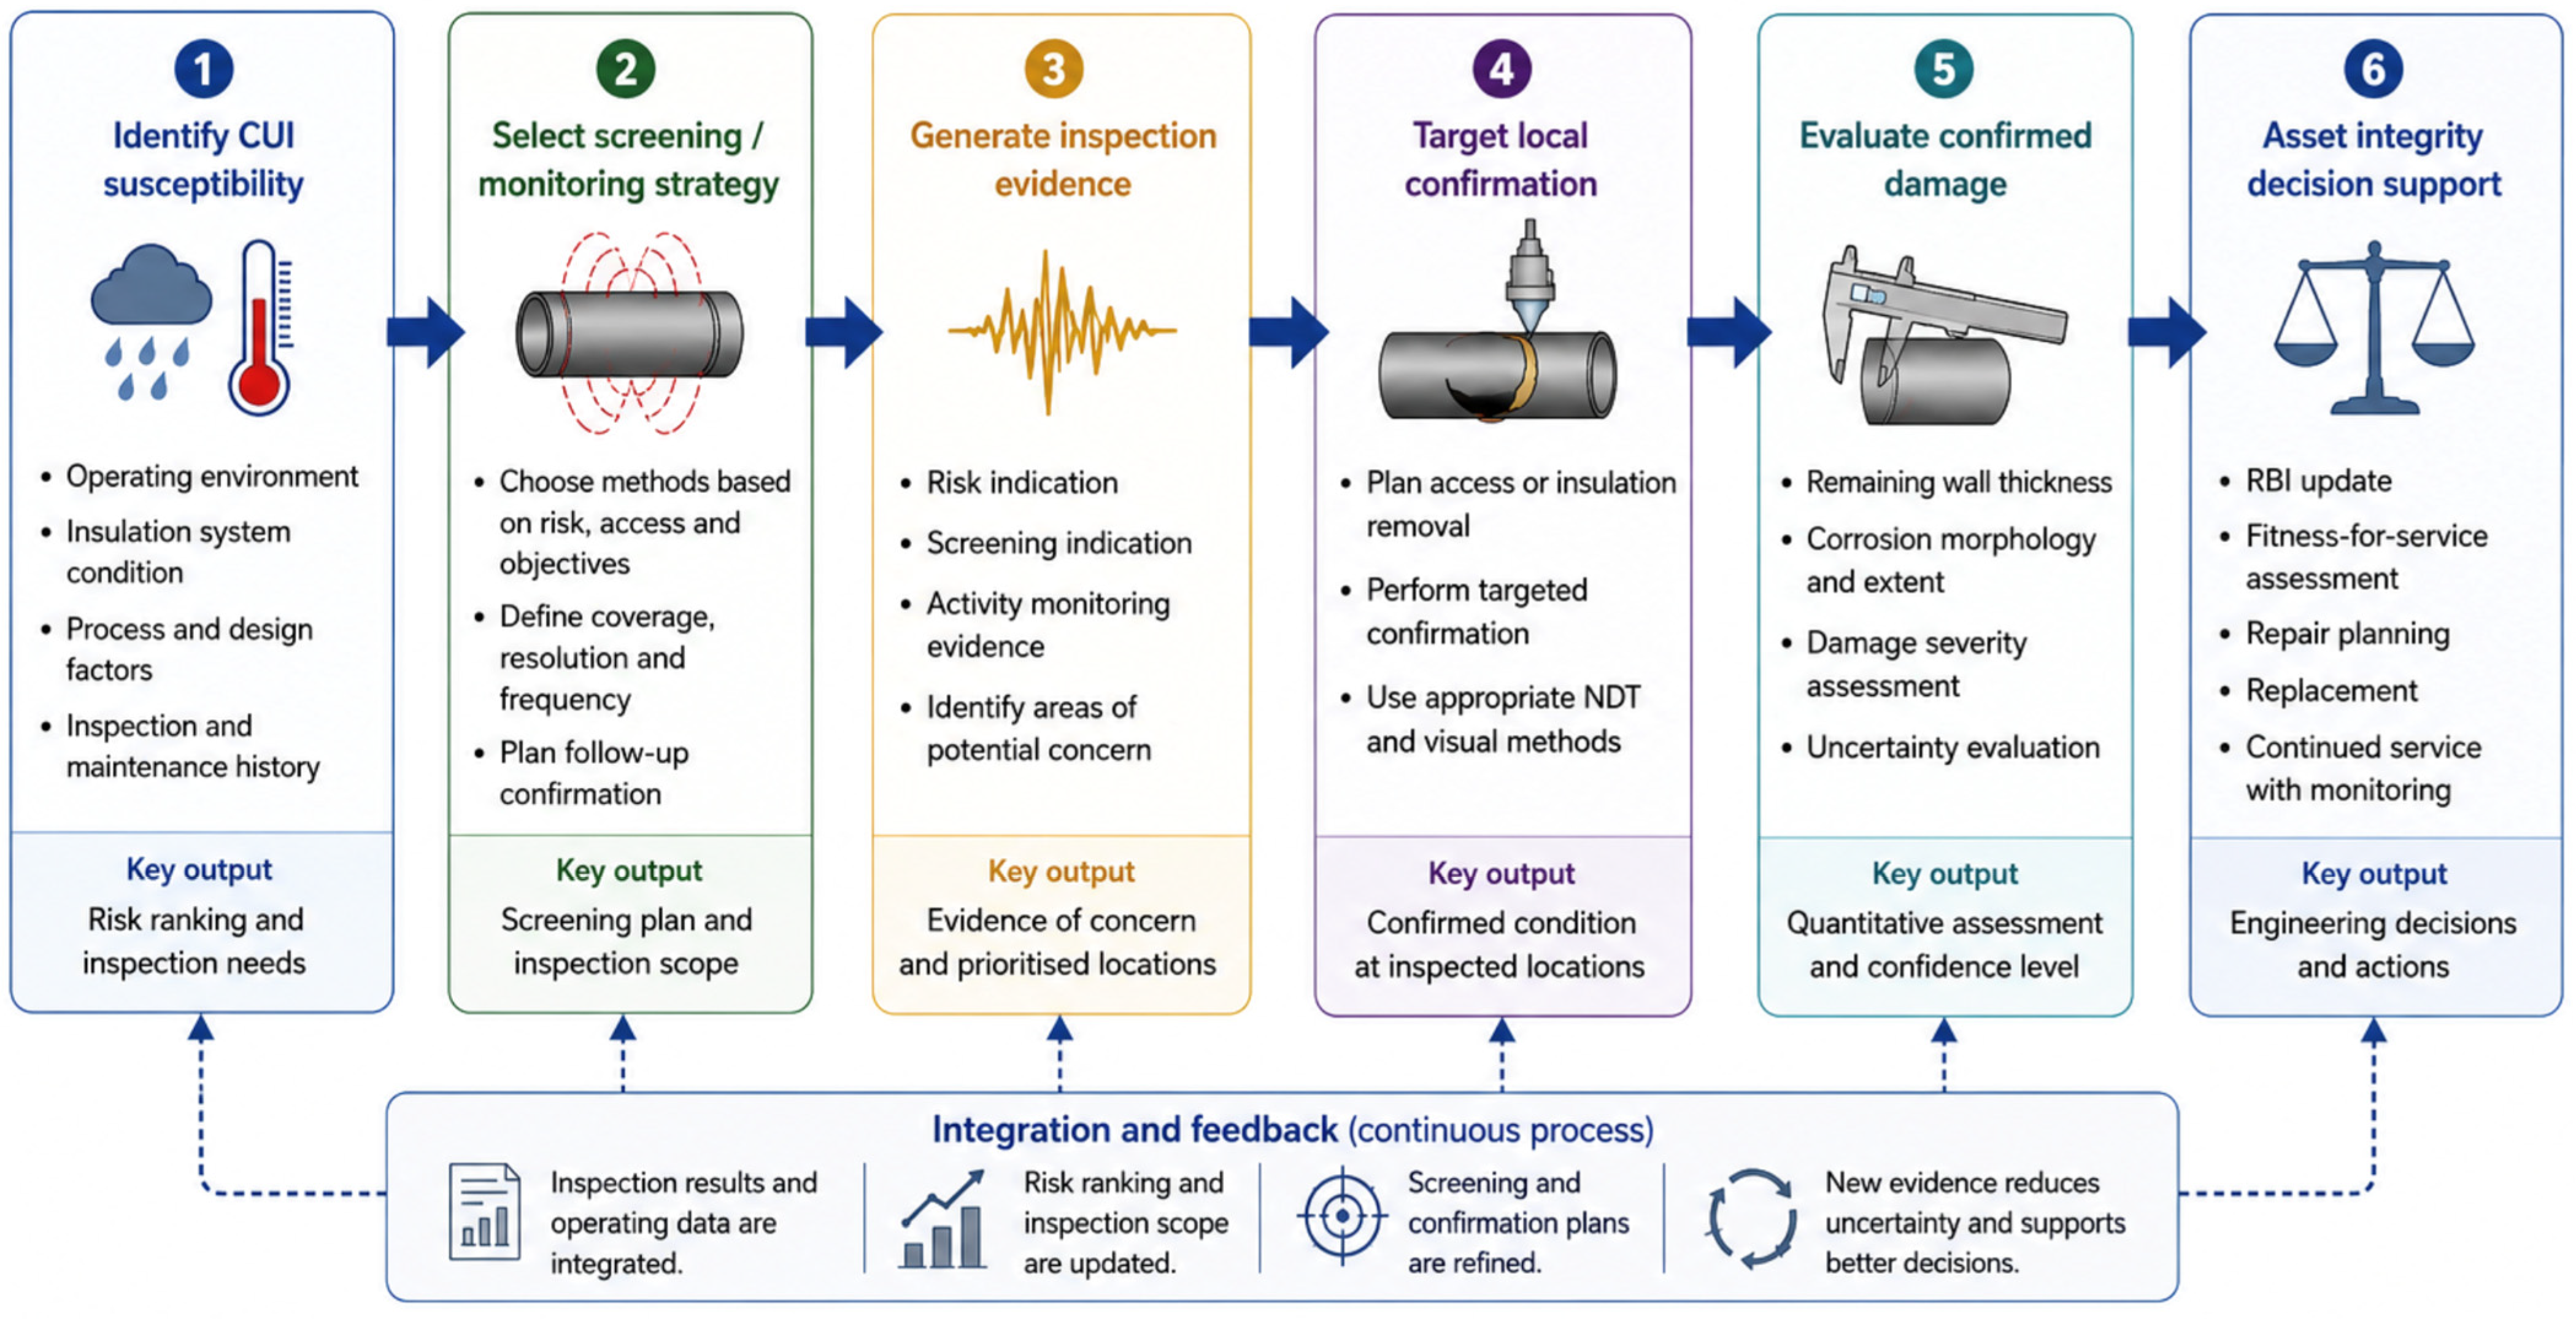

Disclaimer/Publisher’s Note: The statements, opinions and data contained in all publications are solely those of the individual author(s) and contributor(s) and not of MDPI and/or the editor(s). MDPI and/or the editor(s) disclaim responsibility for any injury to people or property resulting from any ideas, methods, instructions or products referred to in the content. |
© 2026 by the authors. Licensee MDPI, Basel, Switzerland. This article is an open access article distributed under the terms and conditions of the Creative Commons Attribution (CC BY) license.