


Abstract
Aluminum–lithium (Al–Li) alloys are widely used in aerospace applications because of their high strength-to-weight ratio and reduced density. However, their corrosion behavior can be significantly affected by thermomechanical processing and exposure to chloride-containing environments. In the present study, the corrosion behavior of AA8090-T3 Al–Li alloy was investigated in 3.5 wt.% NaCl solution under simulated marine conditions. The specimens were extracted from a plate and subsequently subjected to annealing and rolling treatments using a specially designed wedge-shaped geometry to generate a continuous strain gradient, enabling the evaluation of deformation-dependent corrosion behavior across different deformation zones. The corrosion behavior was evaluated using potentiodynamic polarization, immersion testing, and surface characterization techniques. The results revealed significant variations in corrosion behavior with thermomechanical condition and deformation zone. The T3 temper-rolled specimen exhibited superior corrosion resistance compared to the annealed and rolled conditions. The lowest corrosion rate of 0.003 mpy was observed for the highly deformed T3 temper-rolled condition, whereas annealed specimens showed higher corrosion susceptibility associated with localized corrosion attack and precipitate-related galvanic activity. Surface characterization confirmed the formation of aluminum hydroxide- and copper oxide-based corrosion products. The study demonstrates the effectiveness of the wedge-shaped rolling methodology for evaluating zone-dependent corrosion behavior in thermomechanically processed AA8090 alloy.
1. Introduction
AA8090 is a second-generation Al–Li alloy widely used in aerospace structural applications because of its high specific strength, reduced density, and improved stiffness compared to conventional aluminum alloys [1,2]. The addition of lithium to aluminum alloys reduces the density by nearly 3% and increases the elastic modulus by approximately 6% for every 1 wt.% Li addition [1,3]. Owing to these advantages, Al–Li alloys have been extensively used in aircraft fuselage and wing structures. The superior mechanical properties of Al–Li alloys are mainly associated with their low density, high elastic modulus, and precipitation strengthening behavior [1,4].
The mechanical properties of AA8090 alloy are strongly influenced by precipitation behavior and thermomechanical processing conditions. Aging treatment promotes the formation of metastable δ′ (Al3Li) precipitates, while alloying elements such as Cu, Mg, and Zr contribute to the formation of strengthening phases including T1 (Al2CuLi), S′ (Al2CuMg), and β′ (Al3Zr) [4,5]. Among these precipitates, δ′ and T1 are considered the primary strengthening phases in Al–Li alloys [1,4]. Previous studies have reported that thermomechanical processing methods such as rolling, cold deformation, and friction stir processing can significantly influence precipitate distribution, grain structure, and dislocation density, thereby affecting both the mechanical and corrosion behavior of Al–Li alloys [6,7,8].
Despite their excellent mechanical properties, Al–Li alloys remain susceptible to localized corrosion in chloride-containing environments. Aircraft structures operating in humid coastal regions and marine atmospheres are frequently exposed to chloride ions, which can damage the protective oxide film and initiate localized corrosion [9,10]. The corrosion behavior of Al–Li alloys is strongly affected by precipitate distribution, grain boundary chemistry, thermomechanical history, and microstructural heterogeneity [9,10,11,12]. Previous investigations have shown that precipitate-rich regions and grain boundary phases can promote galvanic interactions, leading to pitting and intergranular corrosion in Al–Li alloys exposed to chloride environments [8,10,11,12]. In particular, Cu-rich precipitates such as T1 and S′ phases can significantly influence localized corrosion behavior because of their electrochemical potential difference relative to the Al matrix [8,11,12]. Recent studies have also reported that corrosion behavior in Al–Li alloys is closely associated with heat treatment, precipitate evolution, and deformation-induced microstructural variations [7,8,9,10].
Although several studies have investigated the corrosion behavior of Al–Li alloys under chloride-containing environments, the influence of rolling-induced strain gradients and post-annealing deformation on the zone-dependent corrosion behavior of AA8090 alloy remains insufficiently understood. In the present study, the corrosion behavior of rolled and annealed + rolled AA8090-T3 alloy was investigated using a wedge-shaped specimen geometry adapted from earlier thermomechanical processing studies to generate a continuous strain gradient during rolling [13]. This approach enabled the evaluation of deformation-dependent corrosion behavior across multiple deformation zones using a single specimen. Potentiodynamic polarization, immersion testing, SEM, XRD, EDS, and FTIR analyses were employed to investigate the corrosion behavior and surface characteristics of the alloy under simulated marine conditions.
Unlike previous studies that primarily focused on uniform deformation or conventional heat treatment conditions, the present work employs a wedge-shaped rolling methodology to investigate zone-dependent corrosion behavior across a continuous strain gradient within a single AA8090 specimen.
2. Materials and Methods
Commercially available AA8090-T3 Al–Li alloy sheet with a thickness of 2.5 mm was procured from Mallinath Metal (Mumbai, India) and used as the starting material. The chemical composition of the alloy is presented in Table 1.
Table 1.
Chemical composition of AA8090-T3 alloy (wt.%).
2.1. Rolling Procedure
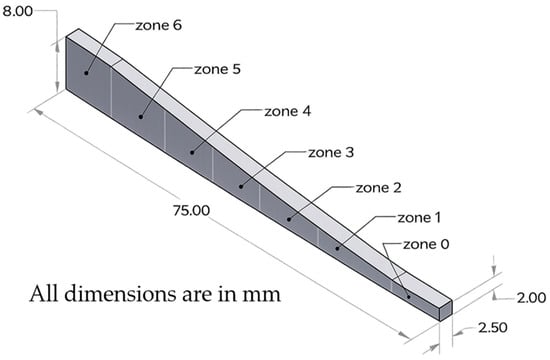
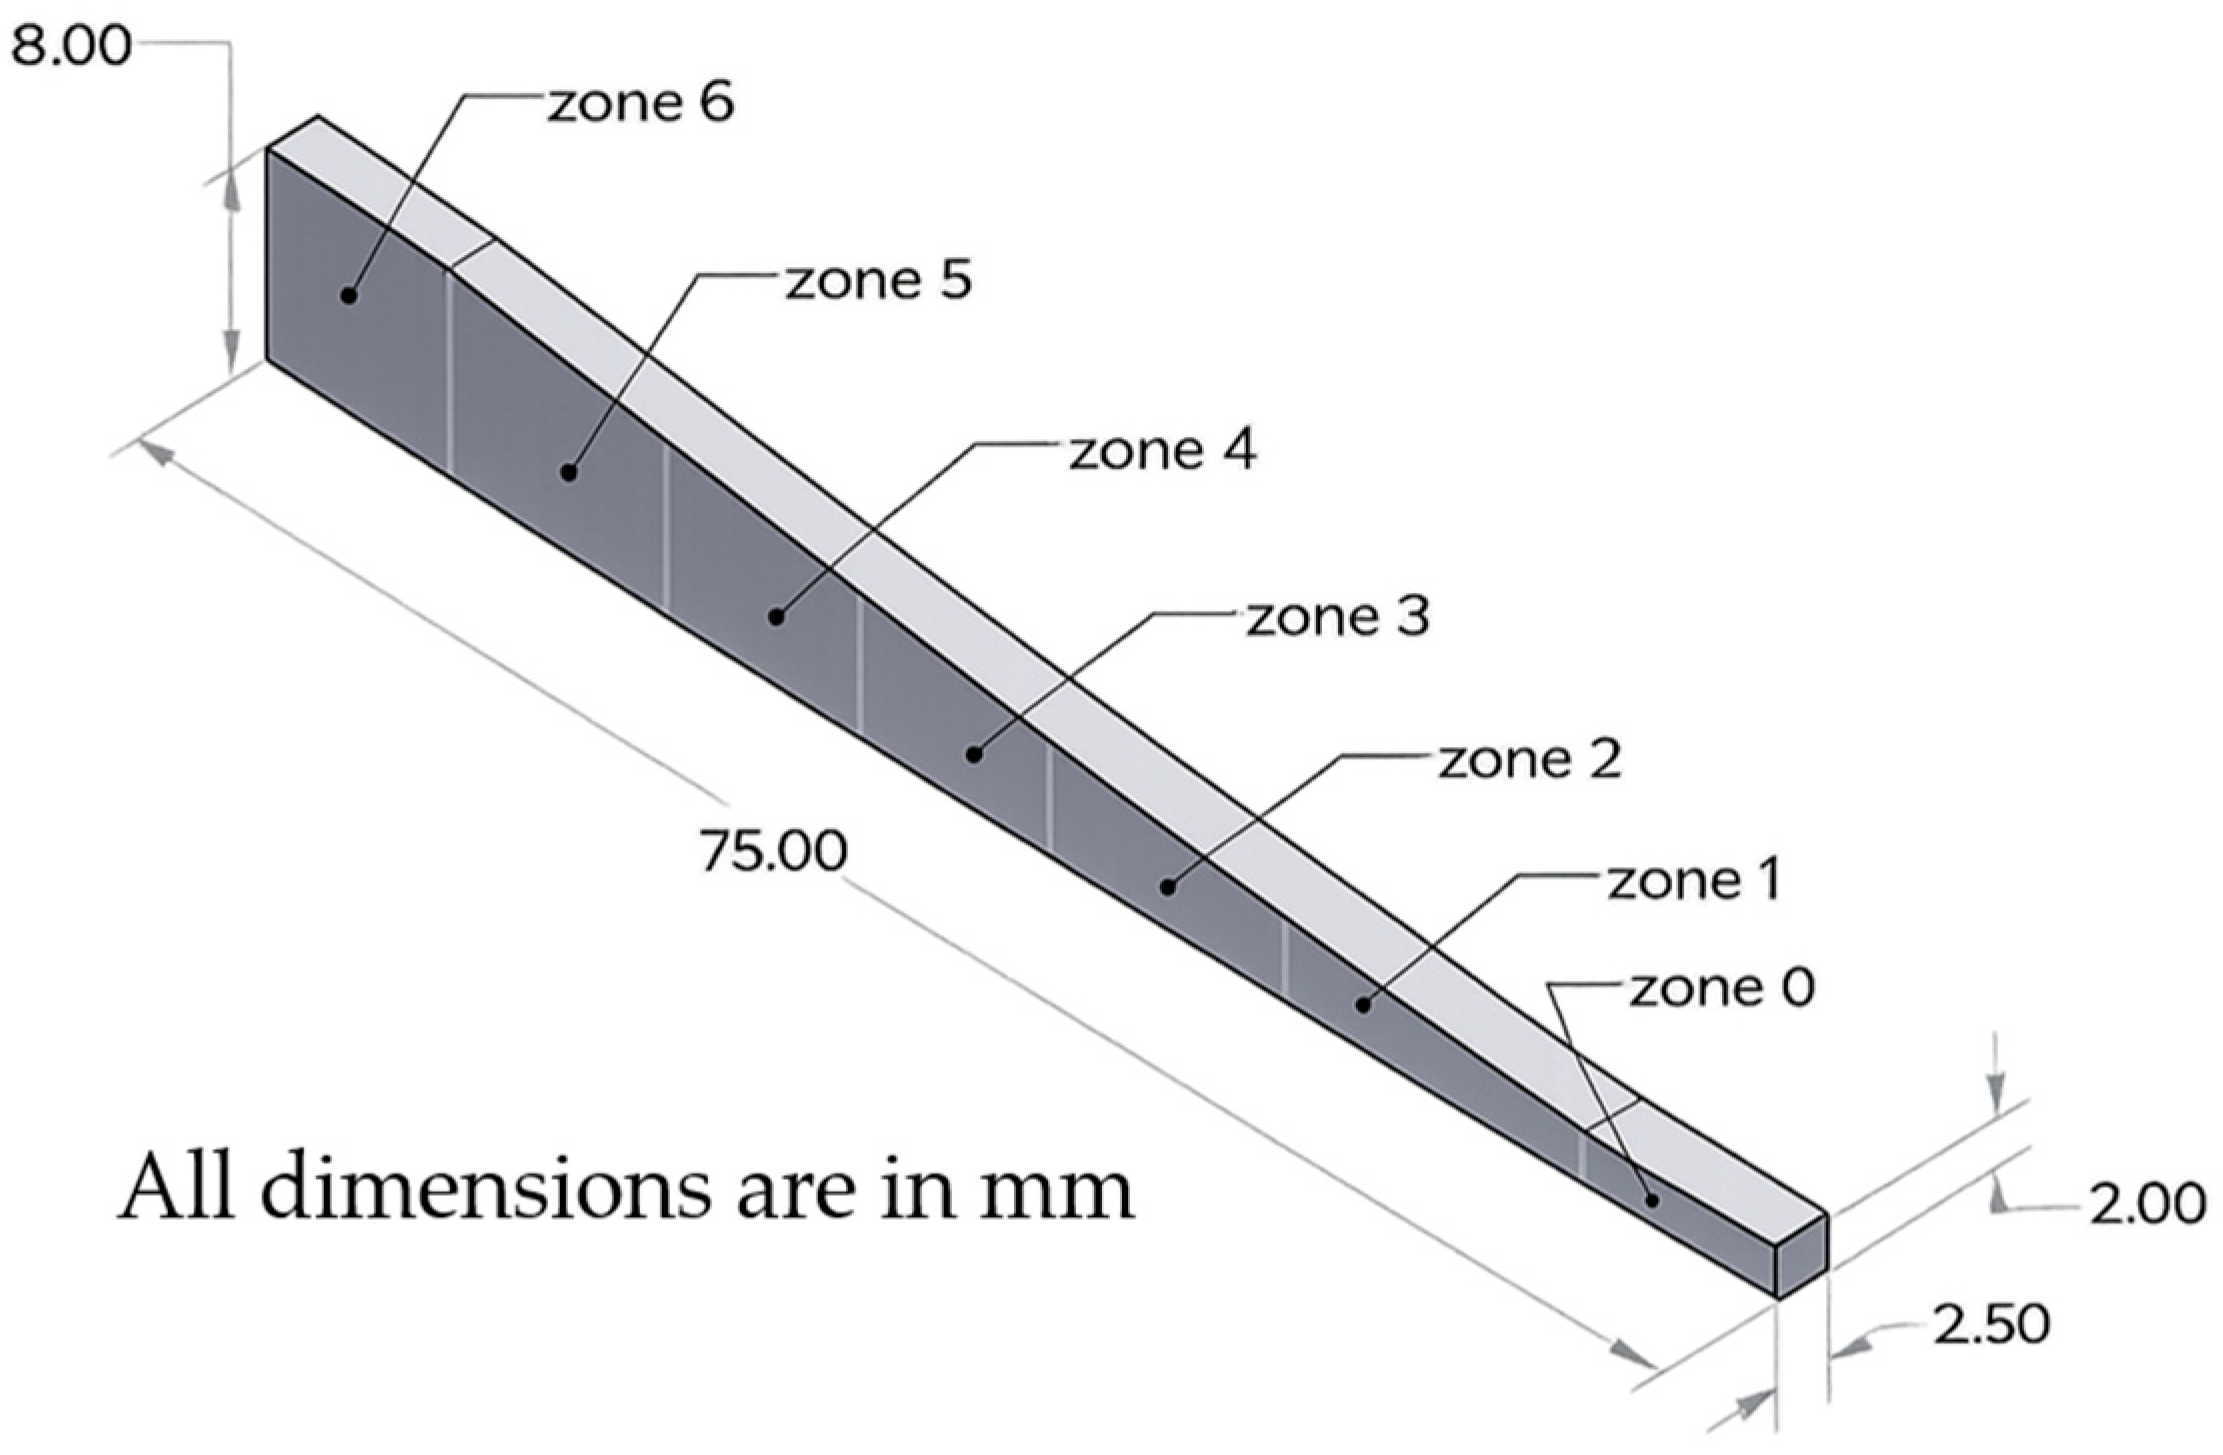
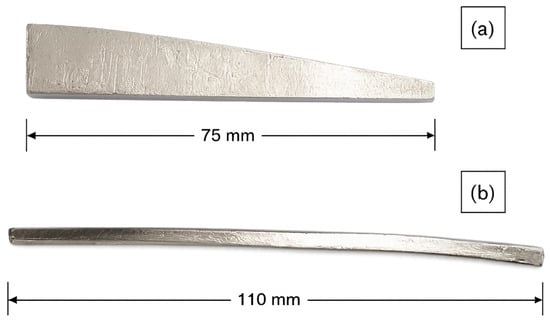
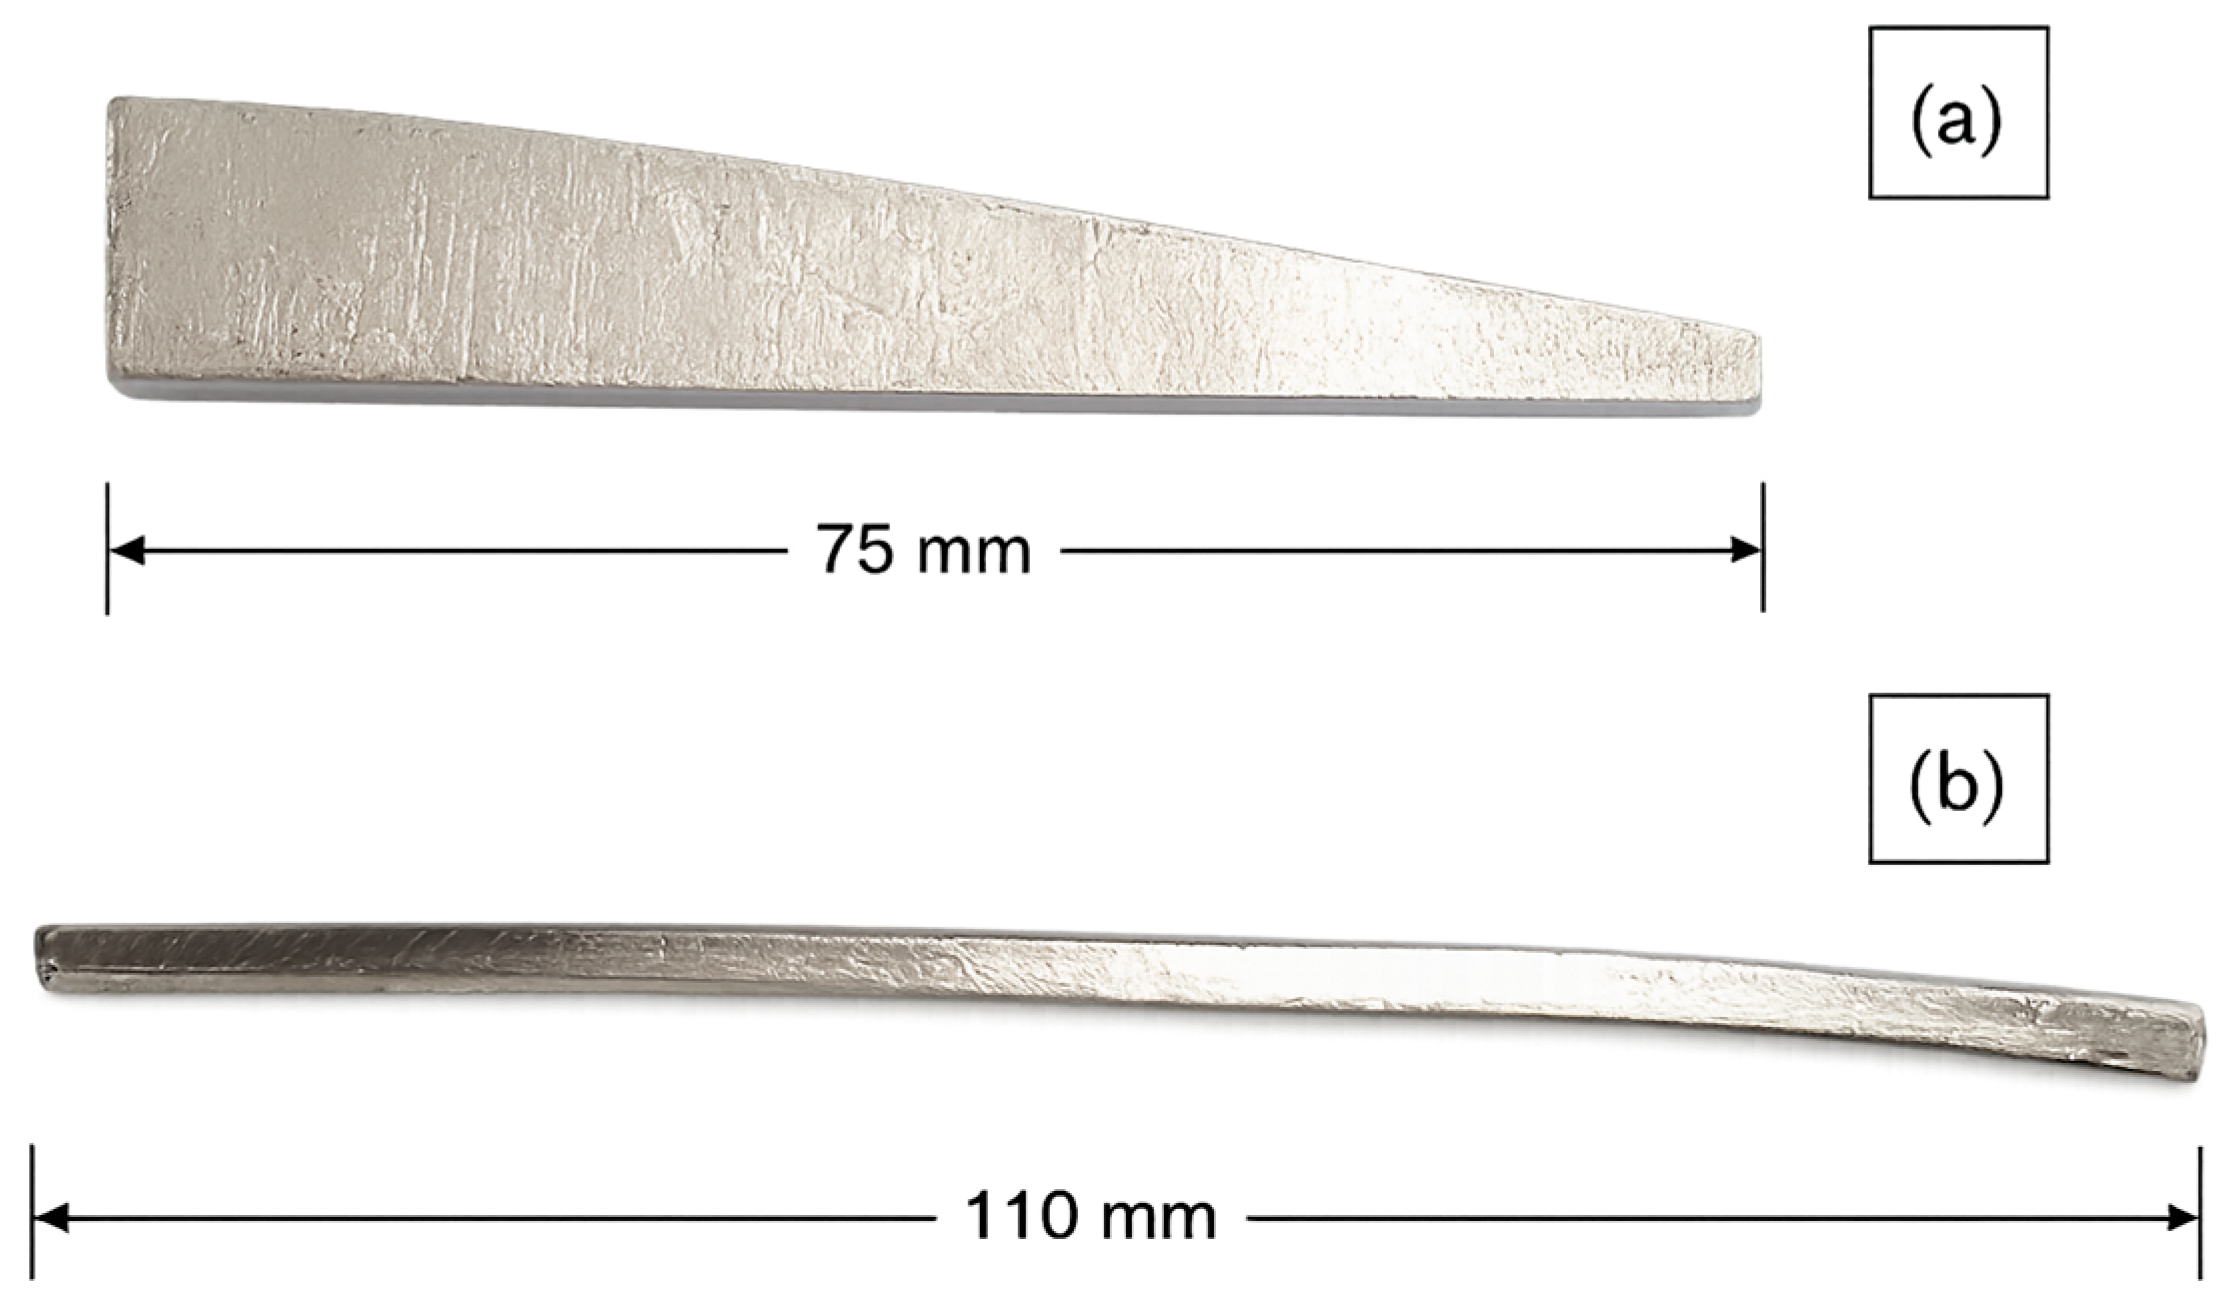
To investigate the influence of deformation-induced strain hardening on corrosion behavior, rolling was carried out using a wedge-shaped specimen geometry, as shown in Figure 1. The specimen thickness varied continuously from 2 mm at the leading edge to 8 mm at the trailing edge. Rolling was performed with a roll gap of 2 mm, initiated from the trailing edge and progressing towards the leading edge to generate different levels of deformation along the rolling direction. Figure 2 shows the specimens before and after rolling.
Figure 1.
Schematic illustration of the wedge-shaped AA8090 Al–Li alloy specimen.
Figure 2.
(a) Wedge-shaped machined specimen before rolling and (b) annealed and rolled specimen after rolling.
Macrocracks were observed at the leading edge (zones 4–6) of the as-received AA8090-T3 specimen because of the large reduction ratio during rolling. Owing to this cracking tendency, the as-received specimen could only be subjected to a single-pass rolling process. Therefore, to improve the ductility and facilitate further deformation during rolling, another wedge-shaped specimen was subjected to an annealing treatment at 450 °C for 1 h prior to rolling. The annealed specimens exhibited smooth deformation during rolling without visible crack formation. These annealed specimens were subsequently subjected to 1, 2, and 3 rolling passes to investigate the effect of rolling passes on the properties of annealed + rolled specimens. The rolled specimens were further sectioned into seven regions with progressively increasing deformation levels, designated as zones 0–6. The nomenclature used for the various specimens is listed in Table 2. Microhardness testing was performed using a Vickers microhardness tester at HV0.5 (4.903 N load) with a dwell time of 15 s.
Table 2.
Nomenclature used for rolled specimens.
2.2. Immersion Test
Immersion testing was carried out on the T3 temper and annealed specimens in accordance with ASTM G31 standard. Square specimens of 30 mm × 30 mm were immersed in approximately 350 mL of 3.5 wt.% NaCl solution at room temperature for 107 days (2568 h). The immersion duration was selected based on preliminary observations of measurable surface degradation and corrosion product formation on the exposed specimens. Prior to immersion testing, the specimen surfaces were mechanically prepared using SiC emery papers and cleaned before exposure to the NaCl solution.
After immersion, the corrosion rate was calculated from the weight-loss measurements using the following Equation (1):
where is the corrosion rate, is the weight loss, is the exposed surface area, is the immersion time, is the density of the material, and is a constant.
Surface characterization of the specimens before and after corrosion testing was carried out using scanning electron microscopy (SEM, TESCAN MIRA 3, Brno, Czech Republic), energy-dispersive spectroscopy (EDS, Plano, TX, USA), X-ray diffraction (XRD, Bruker D2, Karlsruhe, Germany), and Fourier-transform infrared spectroscopy (FTIR, PerkinElmer Frontier, Shelton, CT, USA) analyses. Prior to weight-loss measurements, the specimens were cleaned using a standard nitric acid pickling procedure in accordance with ASTM G1-03 standard.
2.3. Potentiodynamic Polarization (PDP) Test
Zones 1, 3, and 6 were selected for electrochemical corrosion testing. These zones were selected to represent low, intermediate, and high deformation regions along the strain gradient of the rolled specimen. Owing to limited specimen availability and electrochemical testing capacity, representative zones were selected instead of testing all deformation zones. The rolled T3 temper specimen subjected to single-pass rolling and the annealed + rolled specimens subjected to 1, 2, and 3 rolling passes were evaluated for their corrosion behavior. Potentiodynamic polarization (PDP) testing was carried out under aerated conditions at room temperature using a Gamry Reference 1010E electrochemical workstation in accordance with ASTM G102 standard. The experimental setup consisted of a three-electrode flat cell configuration with the specimen as the working electrode, a graphite plate as the counter electrode, and a saturated calomel electrode (SCE) as the reference electrode.
Prior to testing, the specimens were mechanically polished up to 1200 grit SiC paper followed by alumina polishing to obtain a mirror-finished surface. An exposed area of 2.85 cm2 of the specimen was subjected to 3.5 wt.% NaCl solution, while the remaining area was insulated. Prior to polarization testing, the open circuit potential (OCP) of the specimens was monitored for approximately 10,000 s until a relatively stable potential response was achieved. PDP testing was subsequently carried out at a scan rate of 1 mV/s over a potential range from −250 mV to +1200 mV with respect to the OCP.
The corrosion rate was determined from the Tafel extrapolation method using the corrosion current density obtained from the polarization curves.
3. Results and Discussion
3.1. SEM Characterization
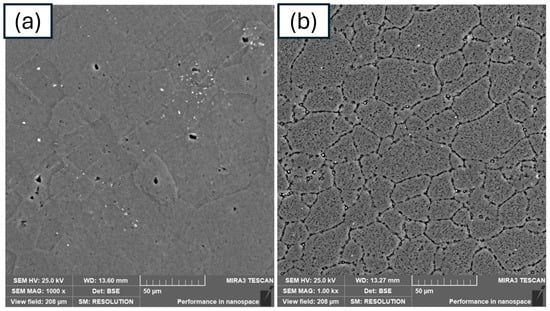
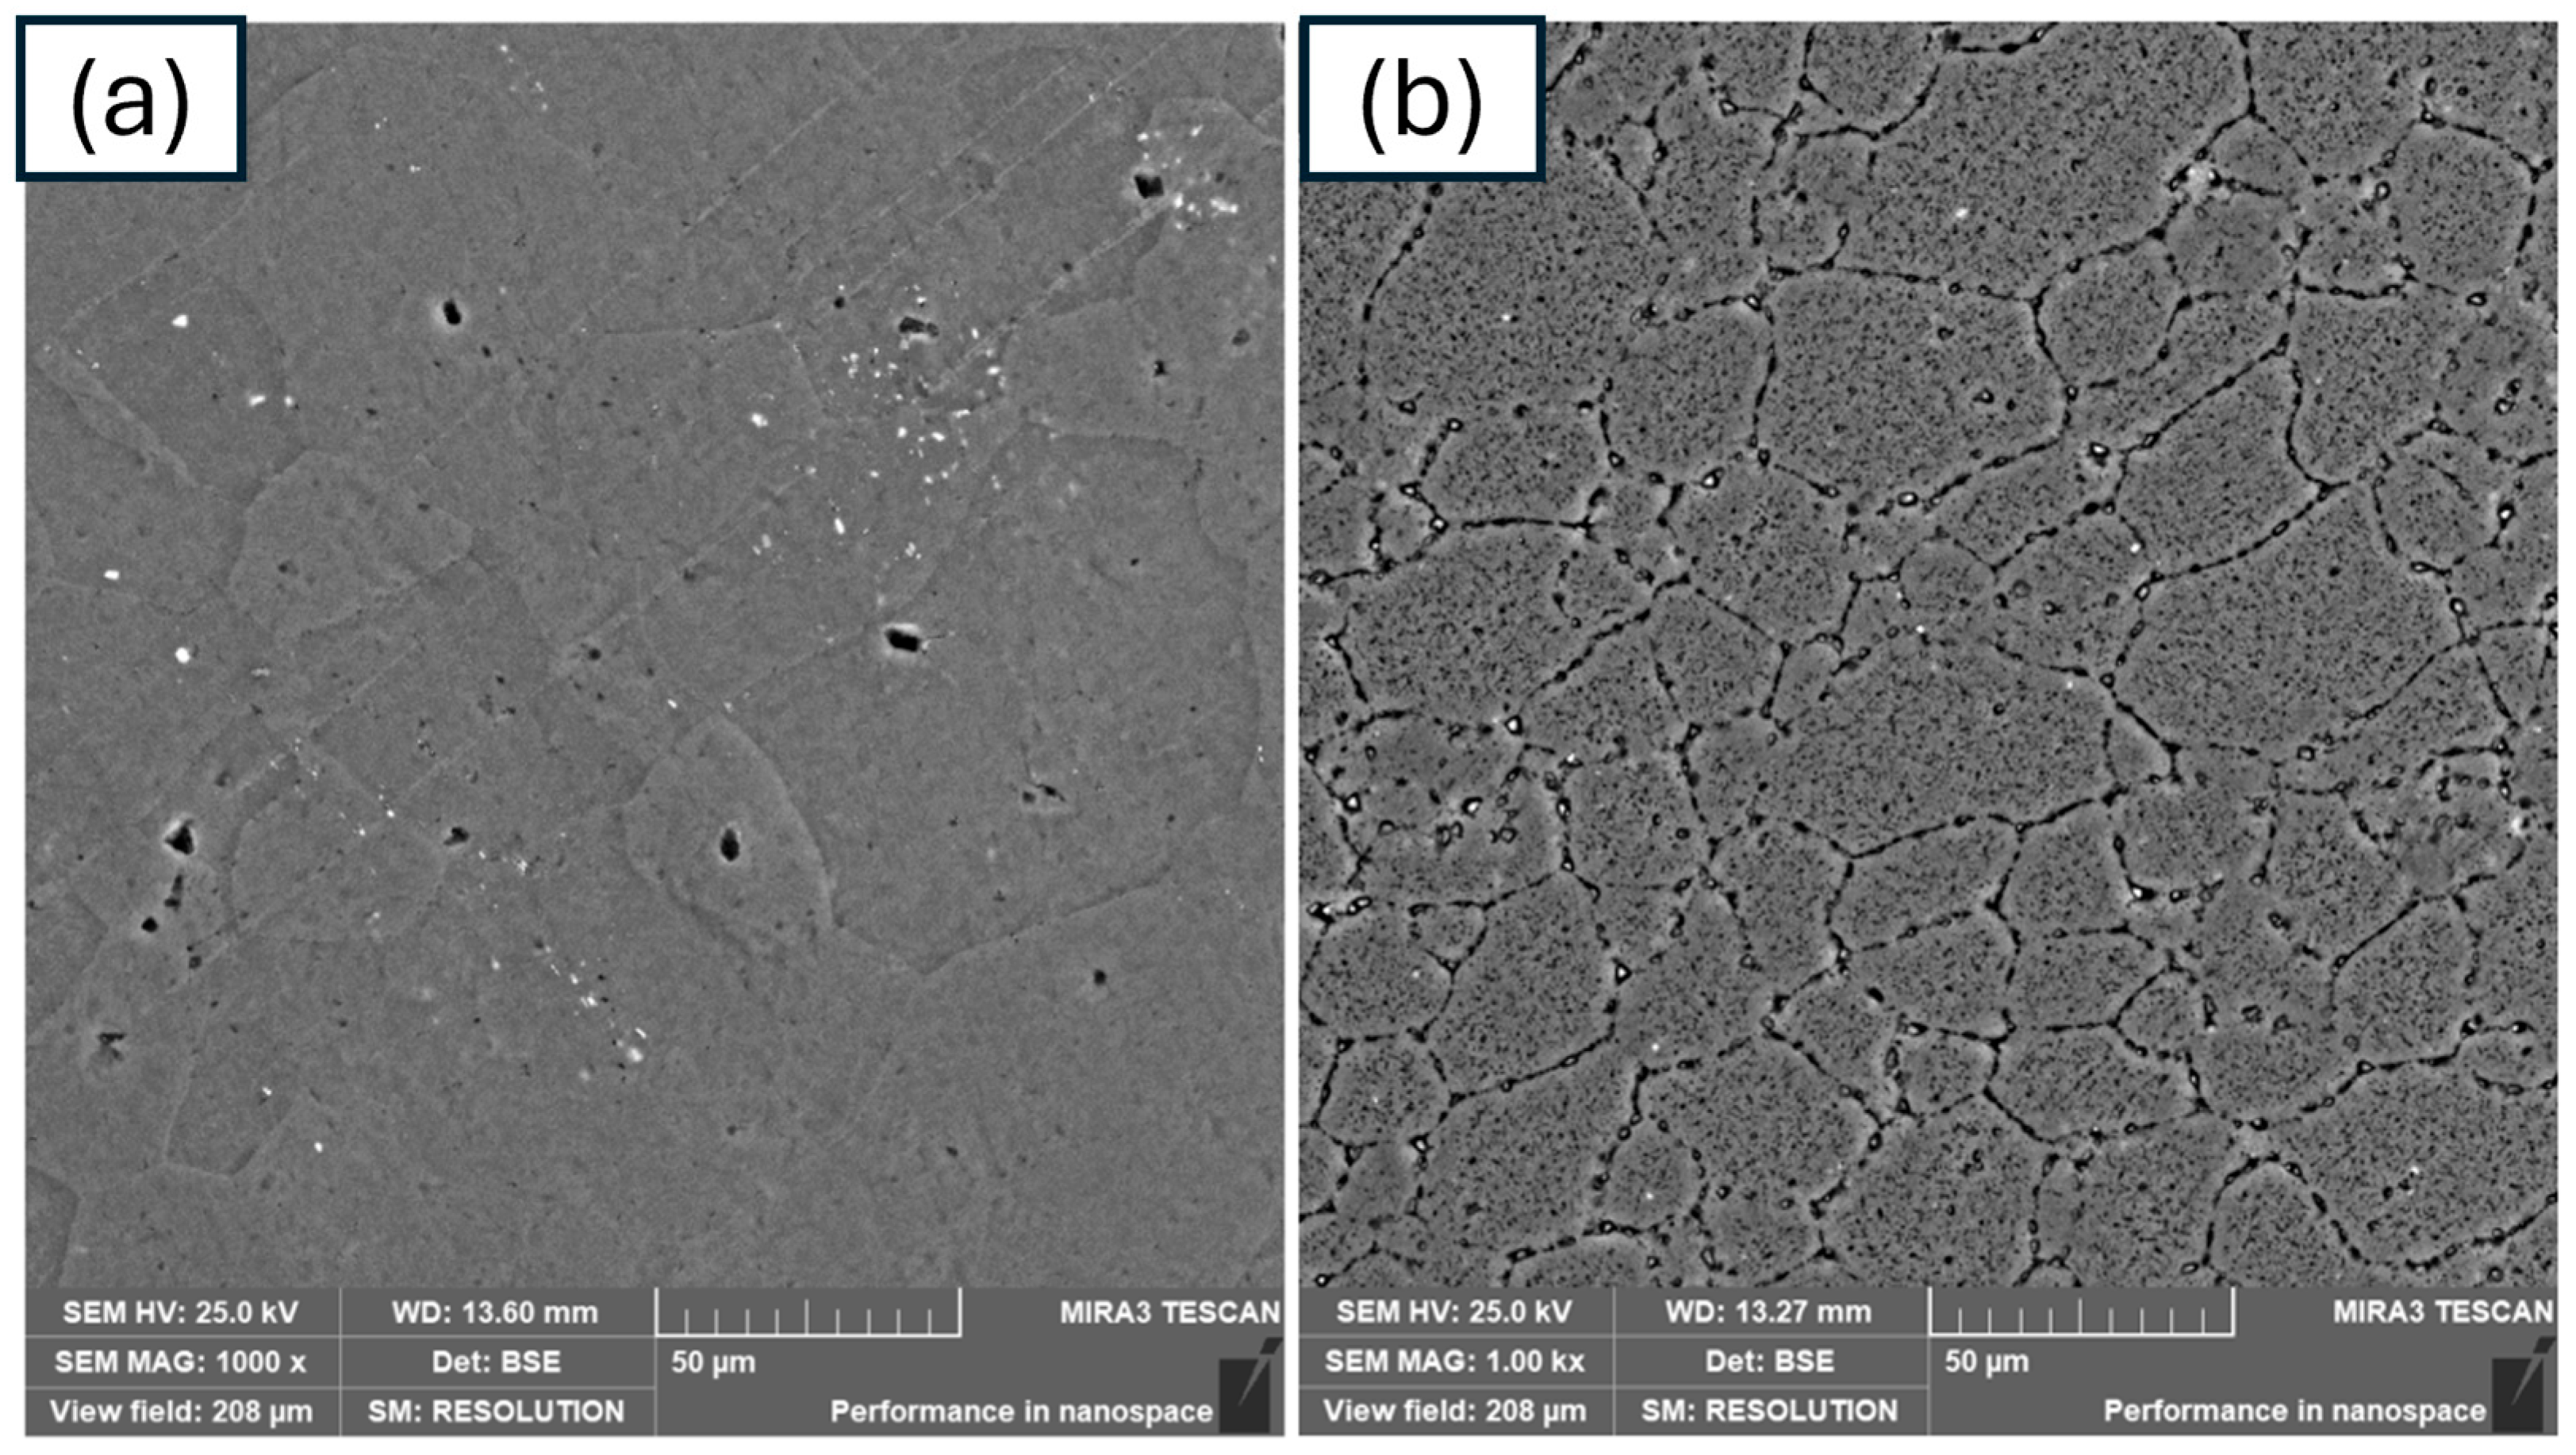
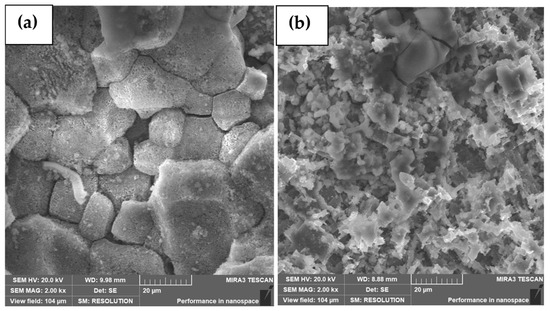
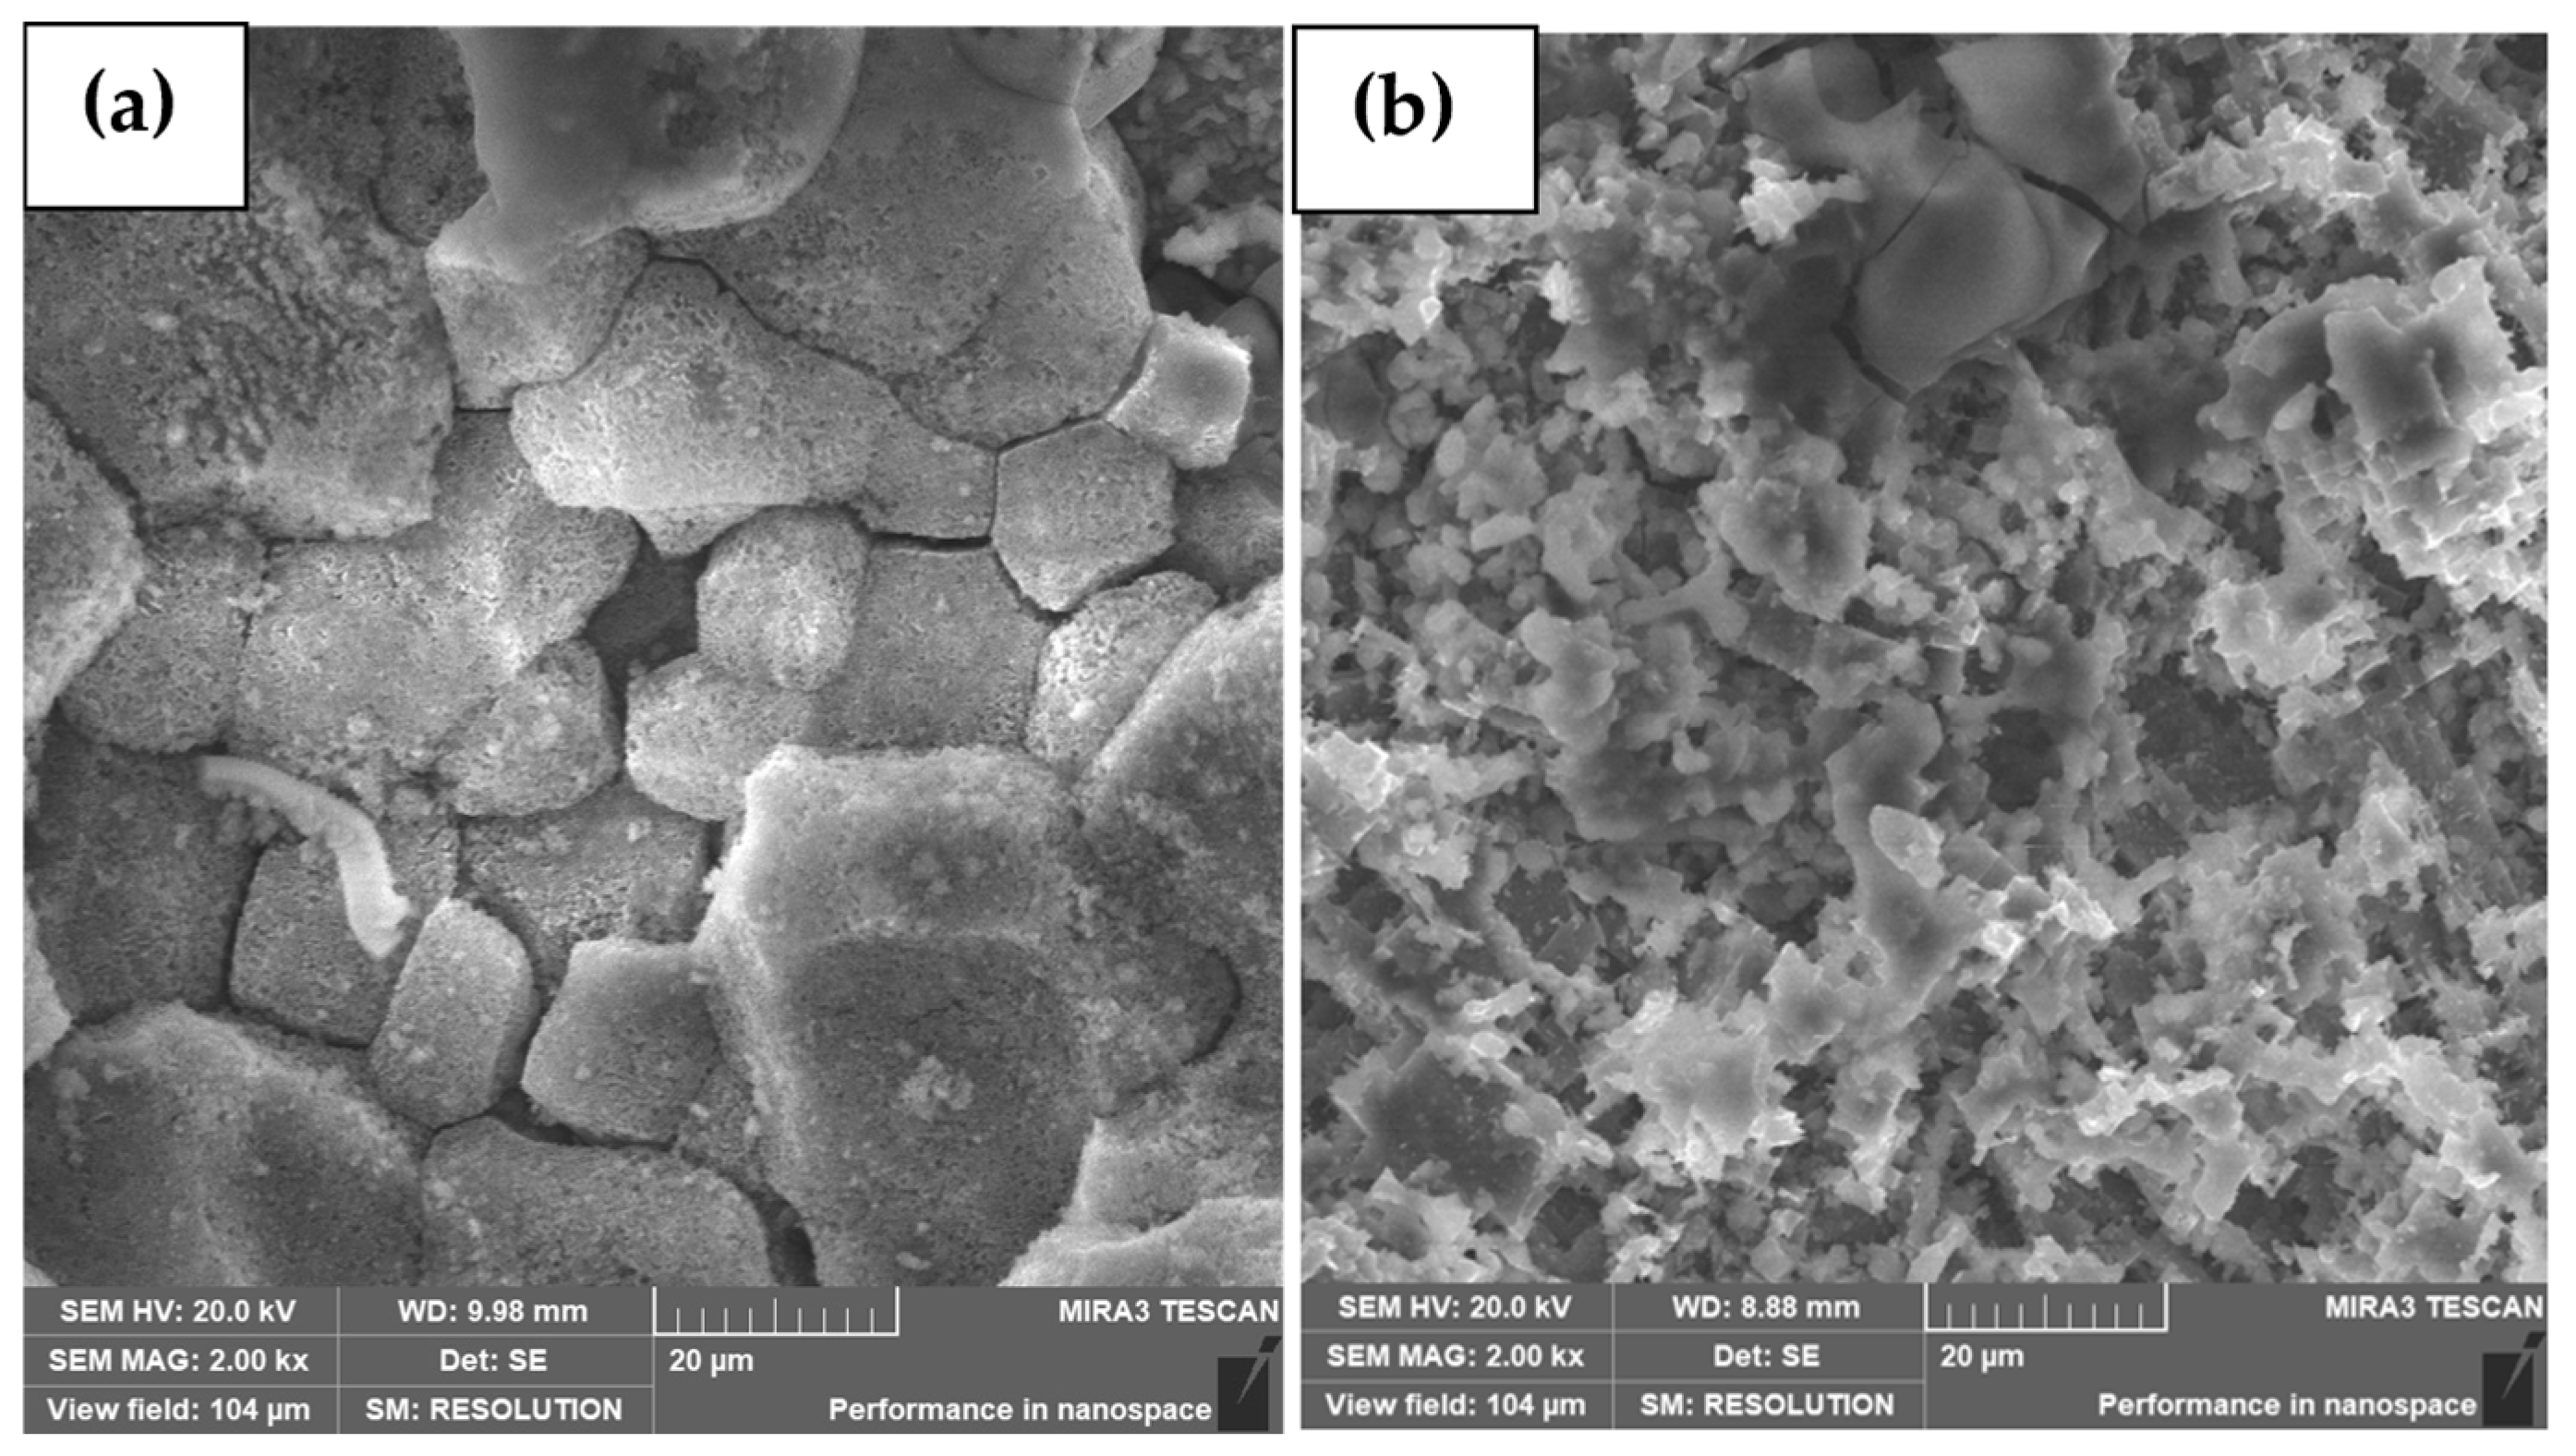
SEM micrographs of the T3 temper and annealed AA8090 specimens prior to rolling are shown in Figure 3a,b, respectively. The T3 temper specimen exhibits a relatively uniform surface appearance with less distinct grain boundary contrast, whereas the annealed specimen shows clearly visible grain boundaries and increased microstructural contrast after heat treatment. The observed microstructural variations indicate the influence of annealing treatment on the surface characteristics and precipitate distribution of the alloy.
Figure 3.
SEM micrographs showing the surface morphology of (a) T3 temper and (b) annealed AA8090 specimens prior to rolling.
3.2. XRD Characterization
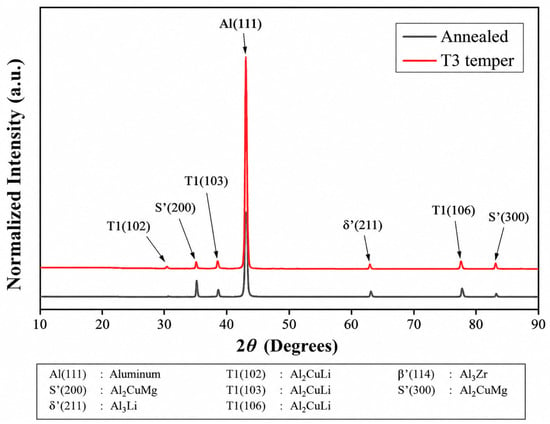
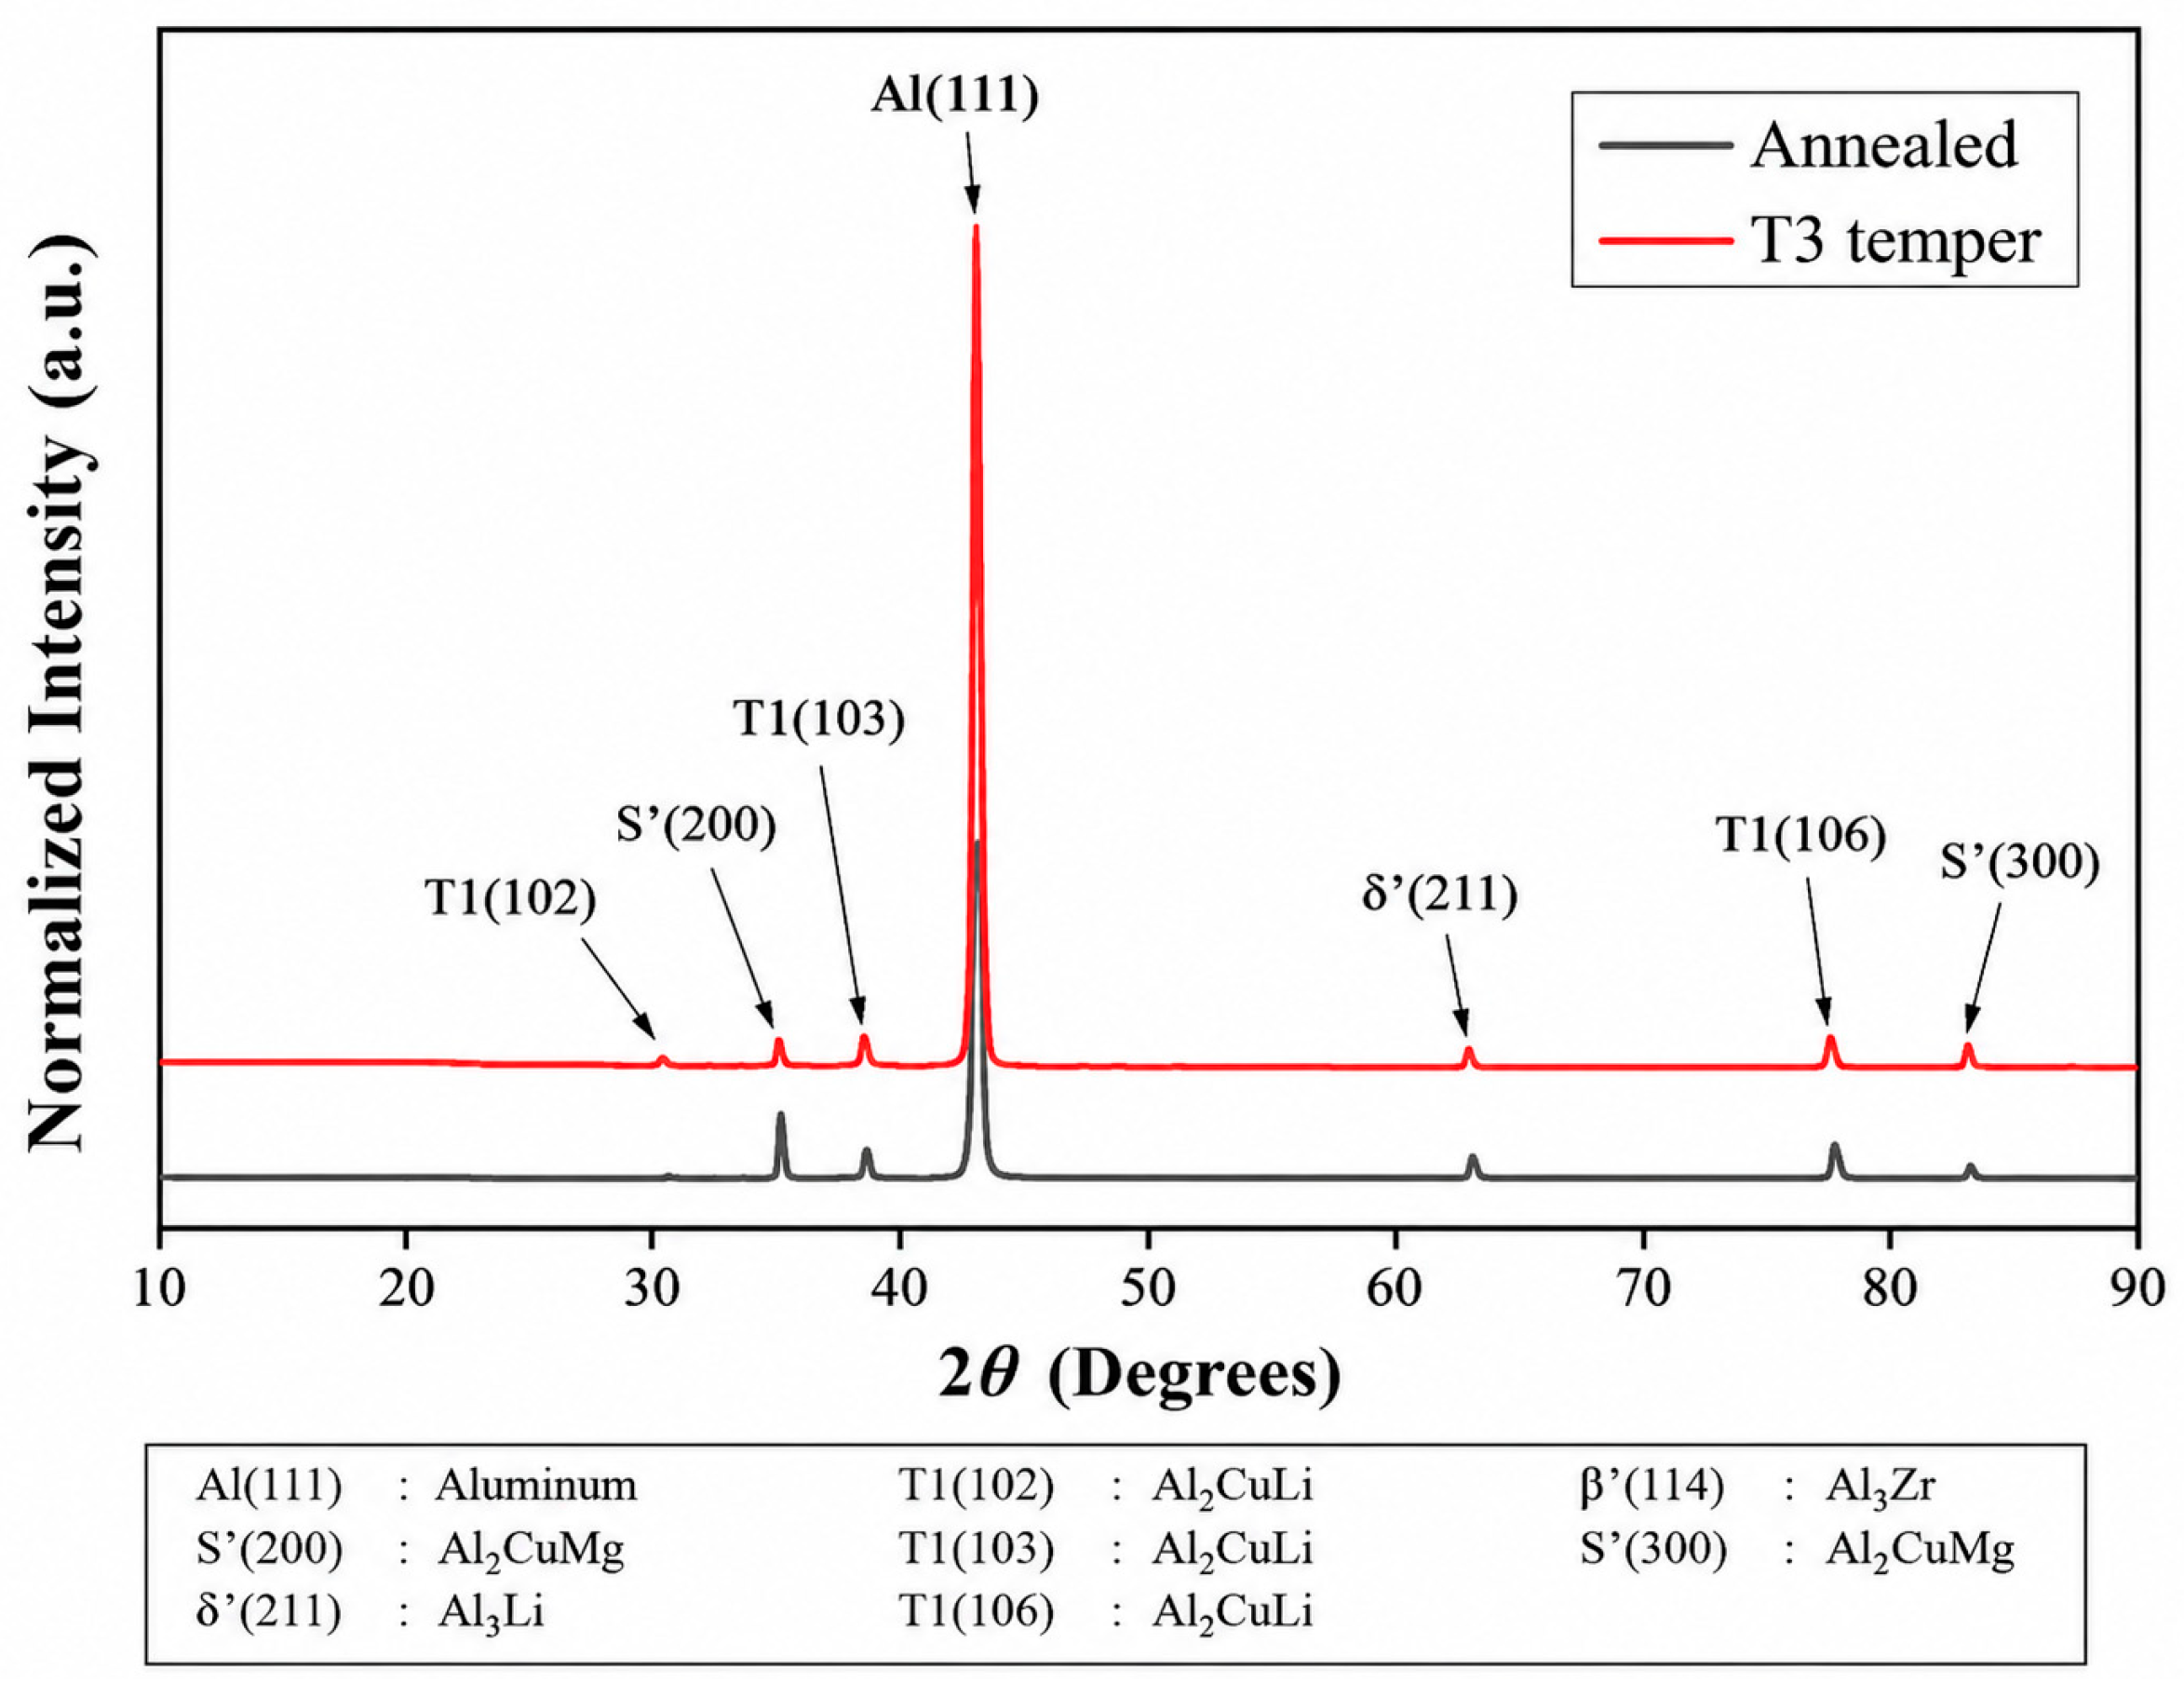
The X-ray diffraction (XRD) patterns recorded from the T3 temper and annealed specimens are shown in Figure 4. The diffraction peaks corresponding to δ′ (Al3Li), S′ (Al2CuMg), T1 (Al2CuLi), and β′ (Al3Zr) phases were identified in both conditions [14,15,16,17,18]. These precipitates are known to contribute to the strengthening behavior and corrosion characteristics of Al–Li alloys. The diffraction peak observed near 2θ ≈ 45° exhibited relatively higher intensity in the T3 temper specimen compared to the annealed specimen, indicating variations in phase distribution and precipitation behavior after annealing.
Figure 4.
XRD pattern of annealed and T3 temper AA8090 specimen.
3.3. Rolling and Microhardness Behavior
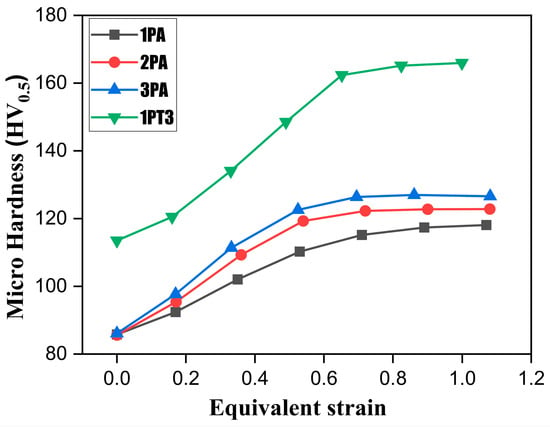
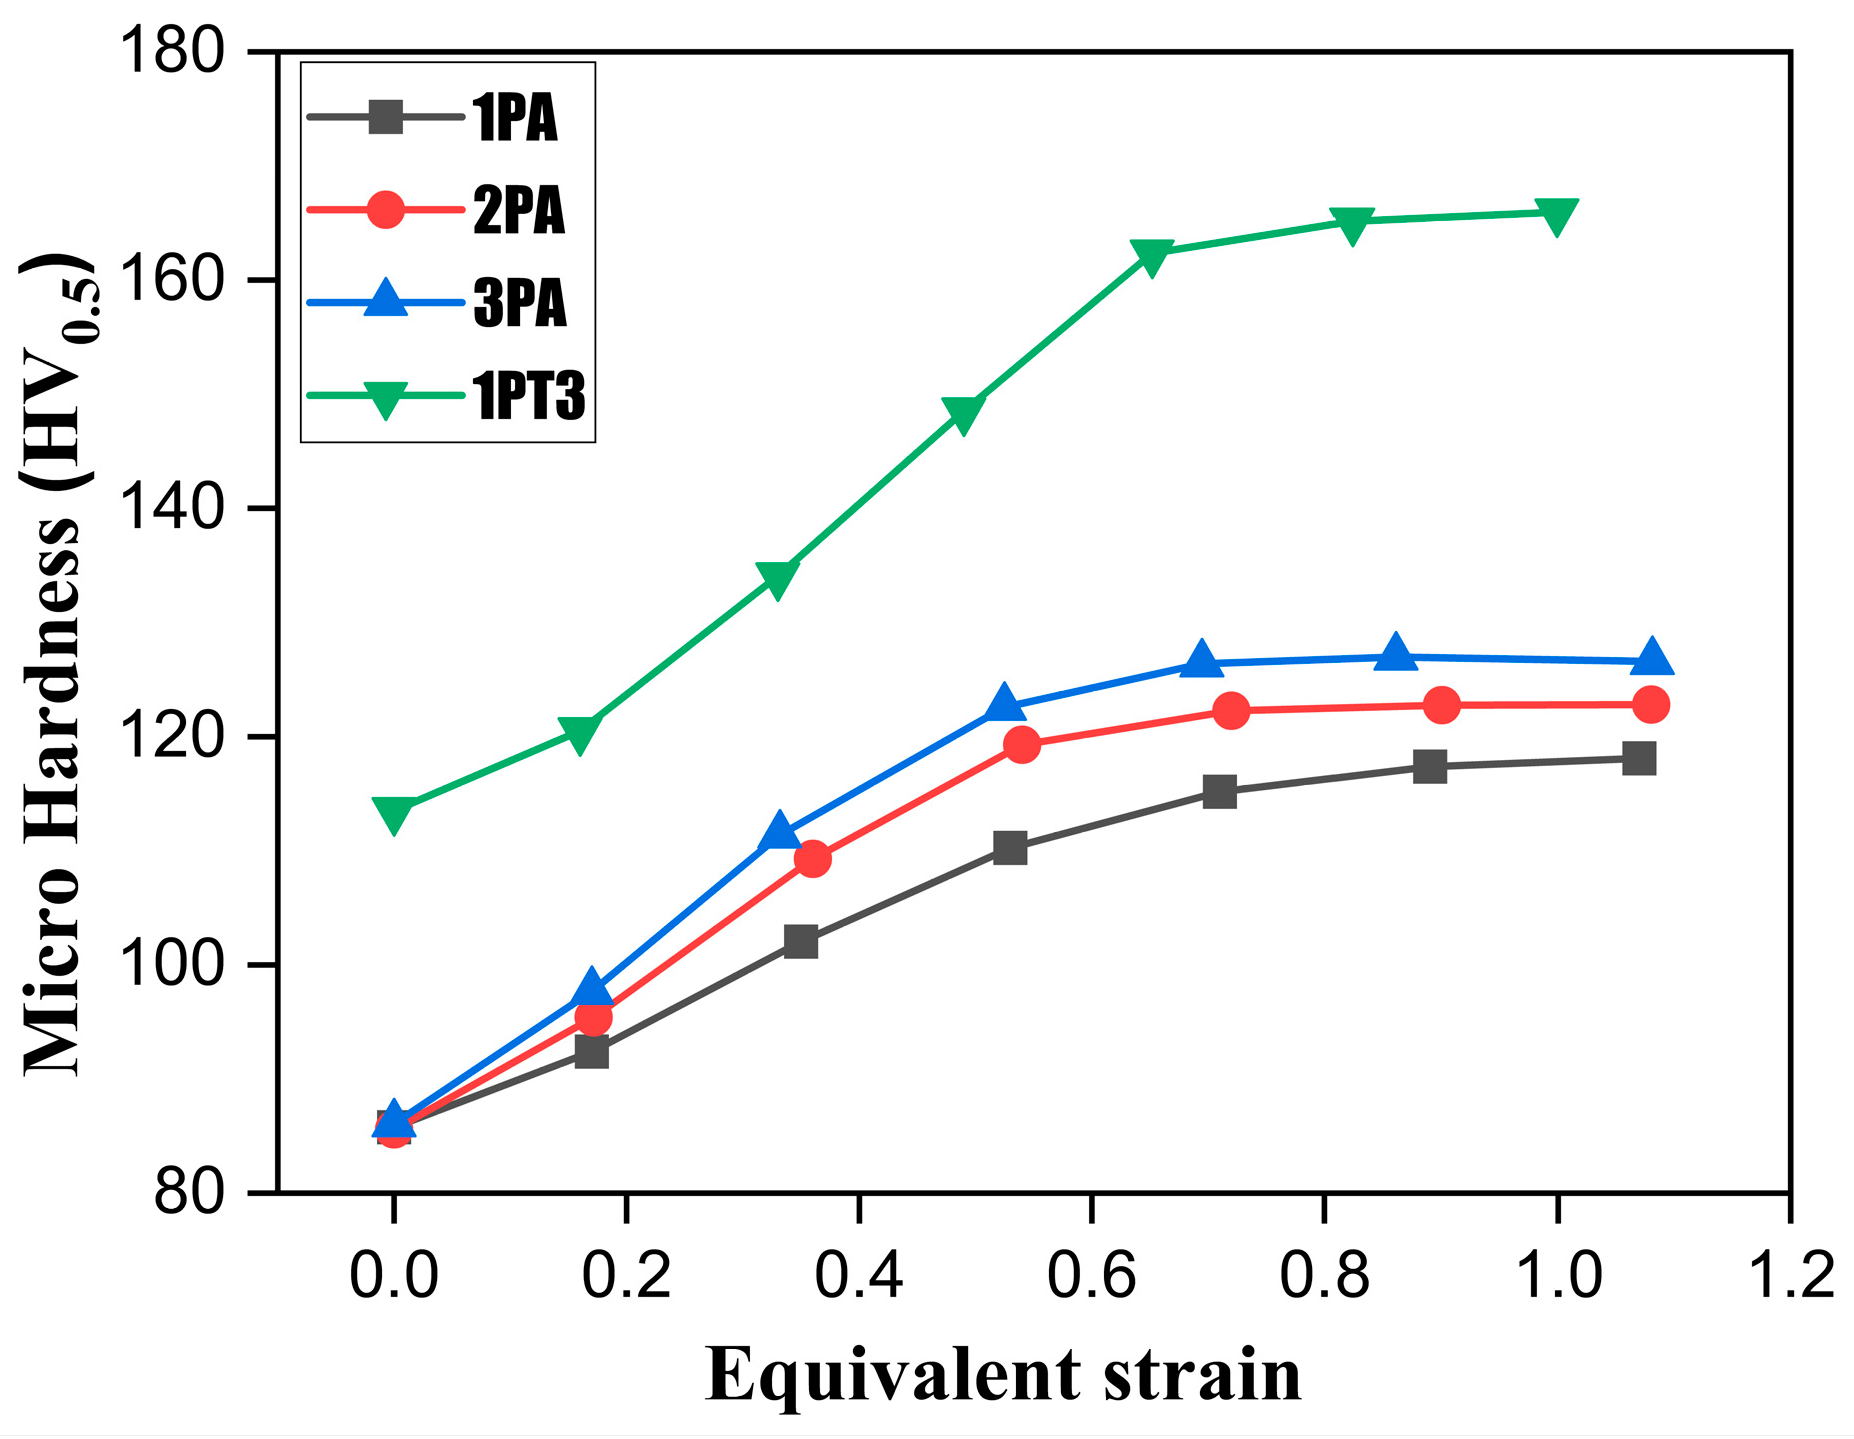
The microhardness values plotted as a function of equivalent strain are shown in Figure 5. The AA8090 T3 temper specimen subjected to single-pass rolling exhibited a progressive increase in microhardness from zone 0 to zone 4, whereas the microhardness values showed only marginal variation in zones 5 and 6. The annealed specimens subjected to 1, 2, and 3 rolling passes also exhibited two distinct deformation regions. An increase in microhardness was observed from zones 0 to 3 because of deformation-induced strain hardening, while the microhardness values in zones 4–6 approached saturation with a reduced rate of hardening. The observed behavior indicates the influence of rolling-induced deformation on the hardness response of the alloy.
Figure 5.
Variation in microhardness with equivalent strain for T3-tempered rolled and annealed + rolled specimens.
3.4. Immersion Test
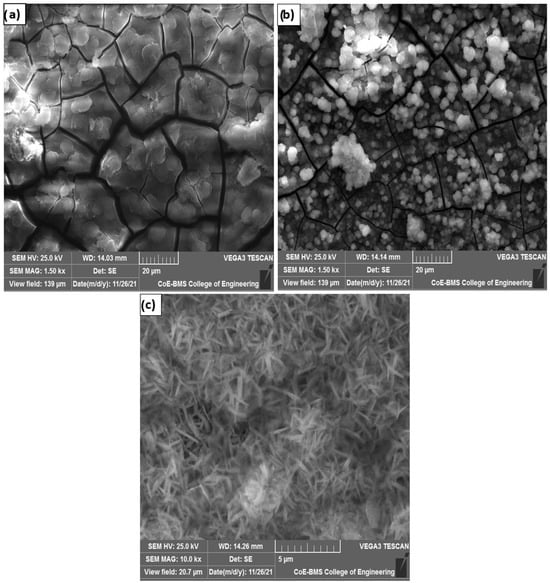
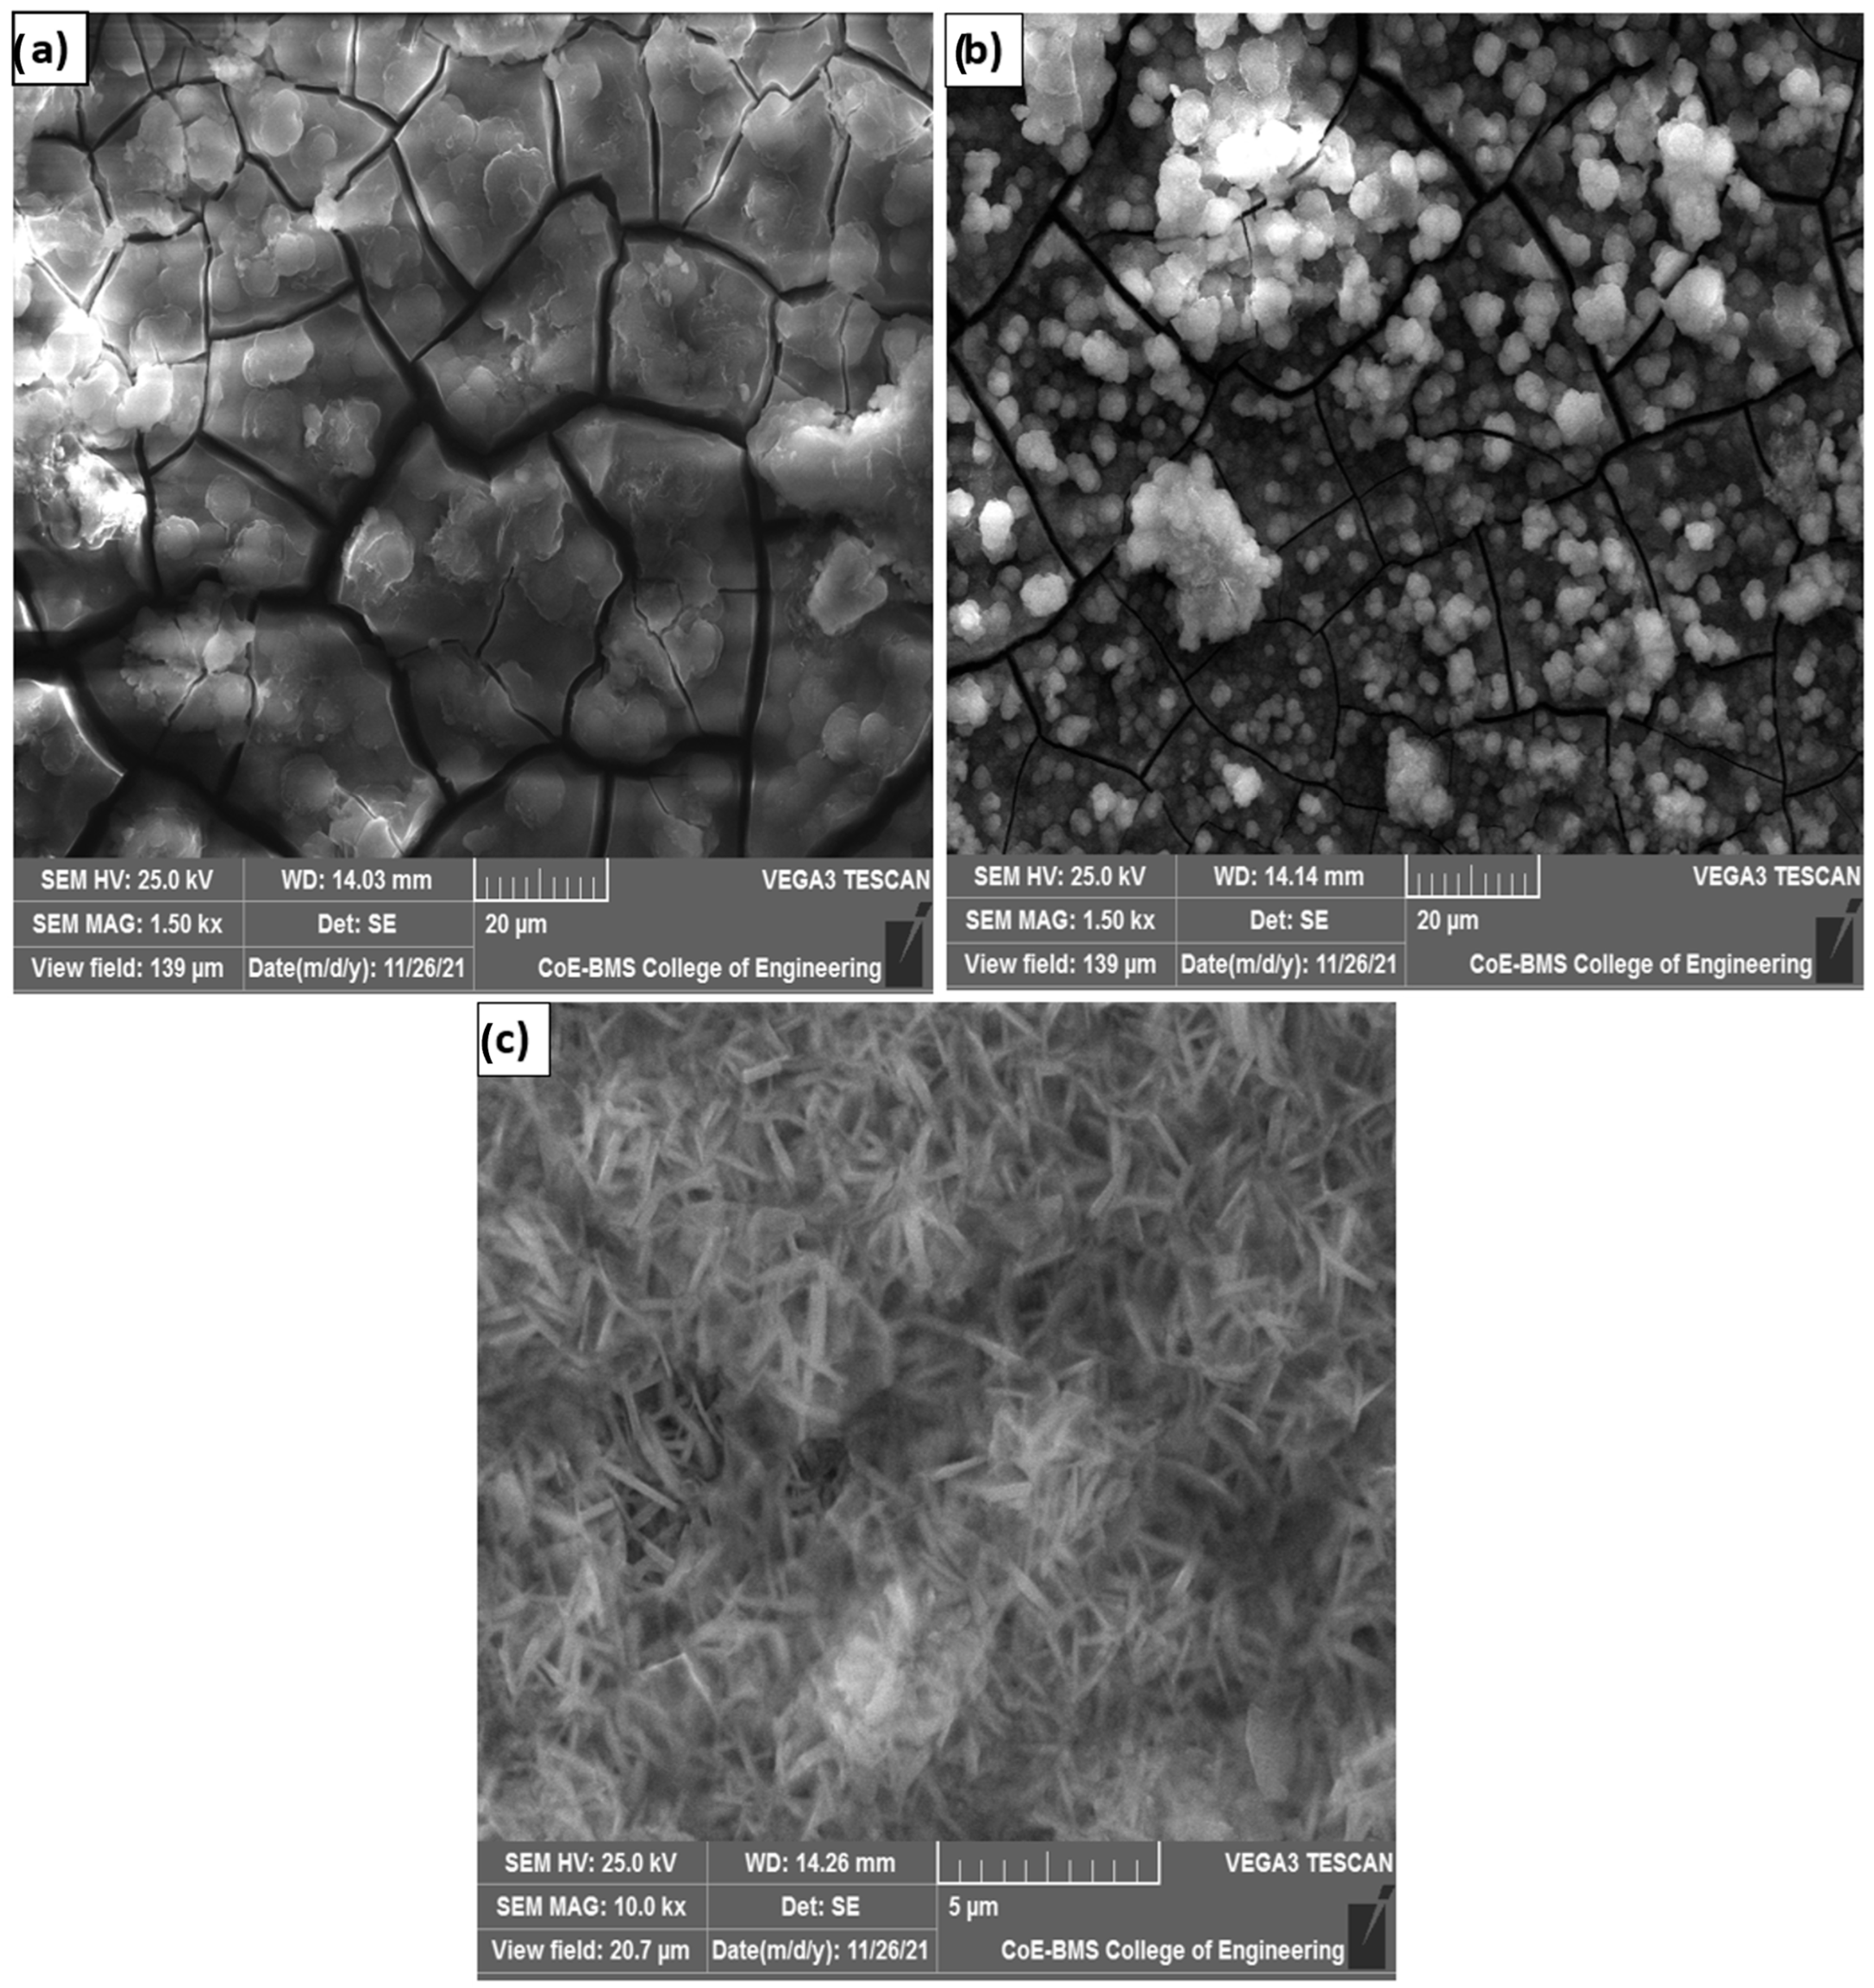
SEM micrographs of the corroded specimens after immersion testing are shown in Figure 6a–c. The T3 temper specimen exhibited localized corrosion features along the grain boundary regions with corrosion products deposited on the surface. In contrast, the annealed specimen showed two distinct surface morphologies. Corrosion attack associated with oxide film formation was predominantly observed near the edge regions, whereas flaky corrosion products were observed in the central regions of the specimen surface. Figure 6c presents a higher magnification view of the flaky corrosion products observed on the annealed specimen surface.
Figure 6.
SEM micrographs of corroded AA8090 specimens after 107 days (2568 h) of immersion testing in 3.5 wt.% NaCl solution: (a) localized corrosion features observed on the T3 temper specimen with oxide film deposits near the exposed surface edges, (b) corrosion features observed on the annealed specimen surface, and (c) higher magnification view of flaky corrosion products observed in the central region of the annealed specimen surface.
After SEM examination, the corrosion products formed on the specimen surfaces were removed using 70% HNO3 for 3 min in accordance with ASTM G1-03 standard. The corrosion rate values obtained from the weight-loss measurements are presented in Table 3.
Table 3.
Corrosion rate values obtained from immersion testing.
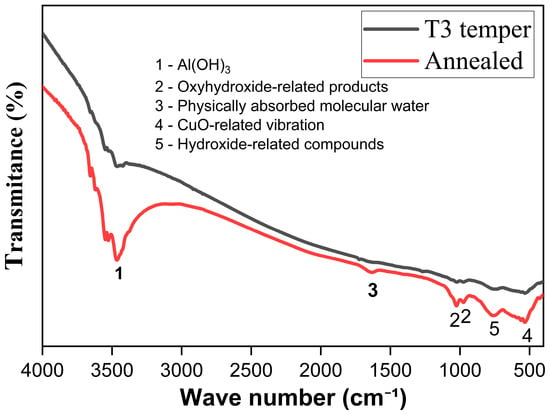
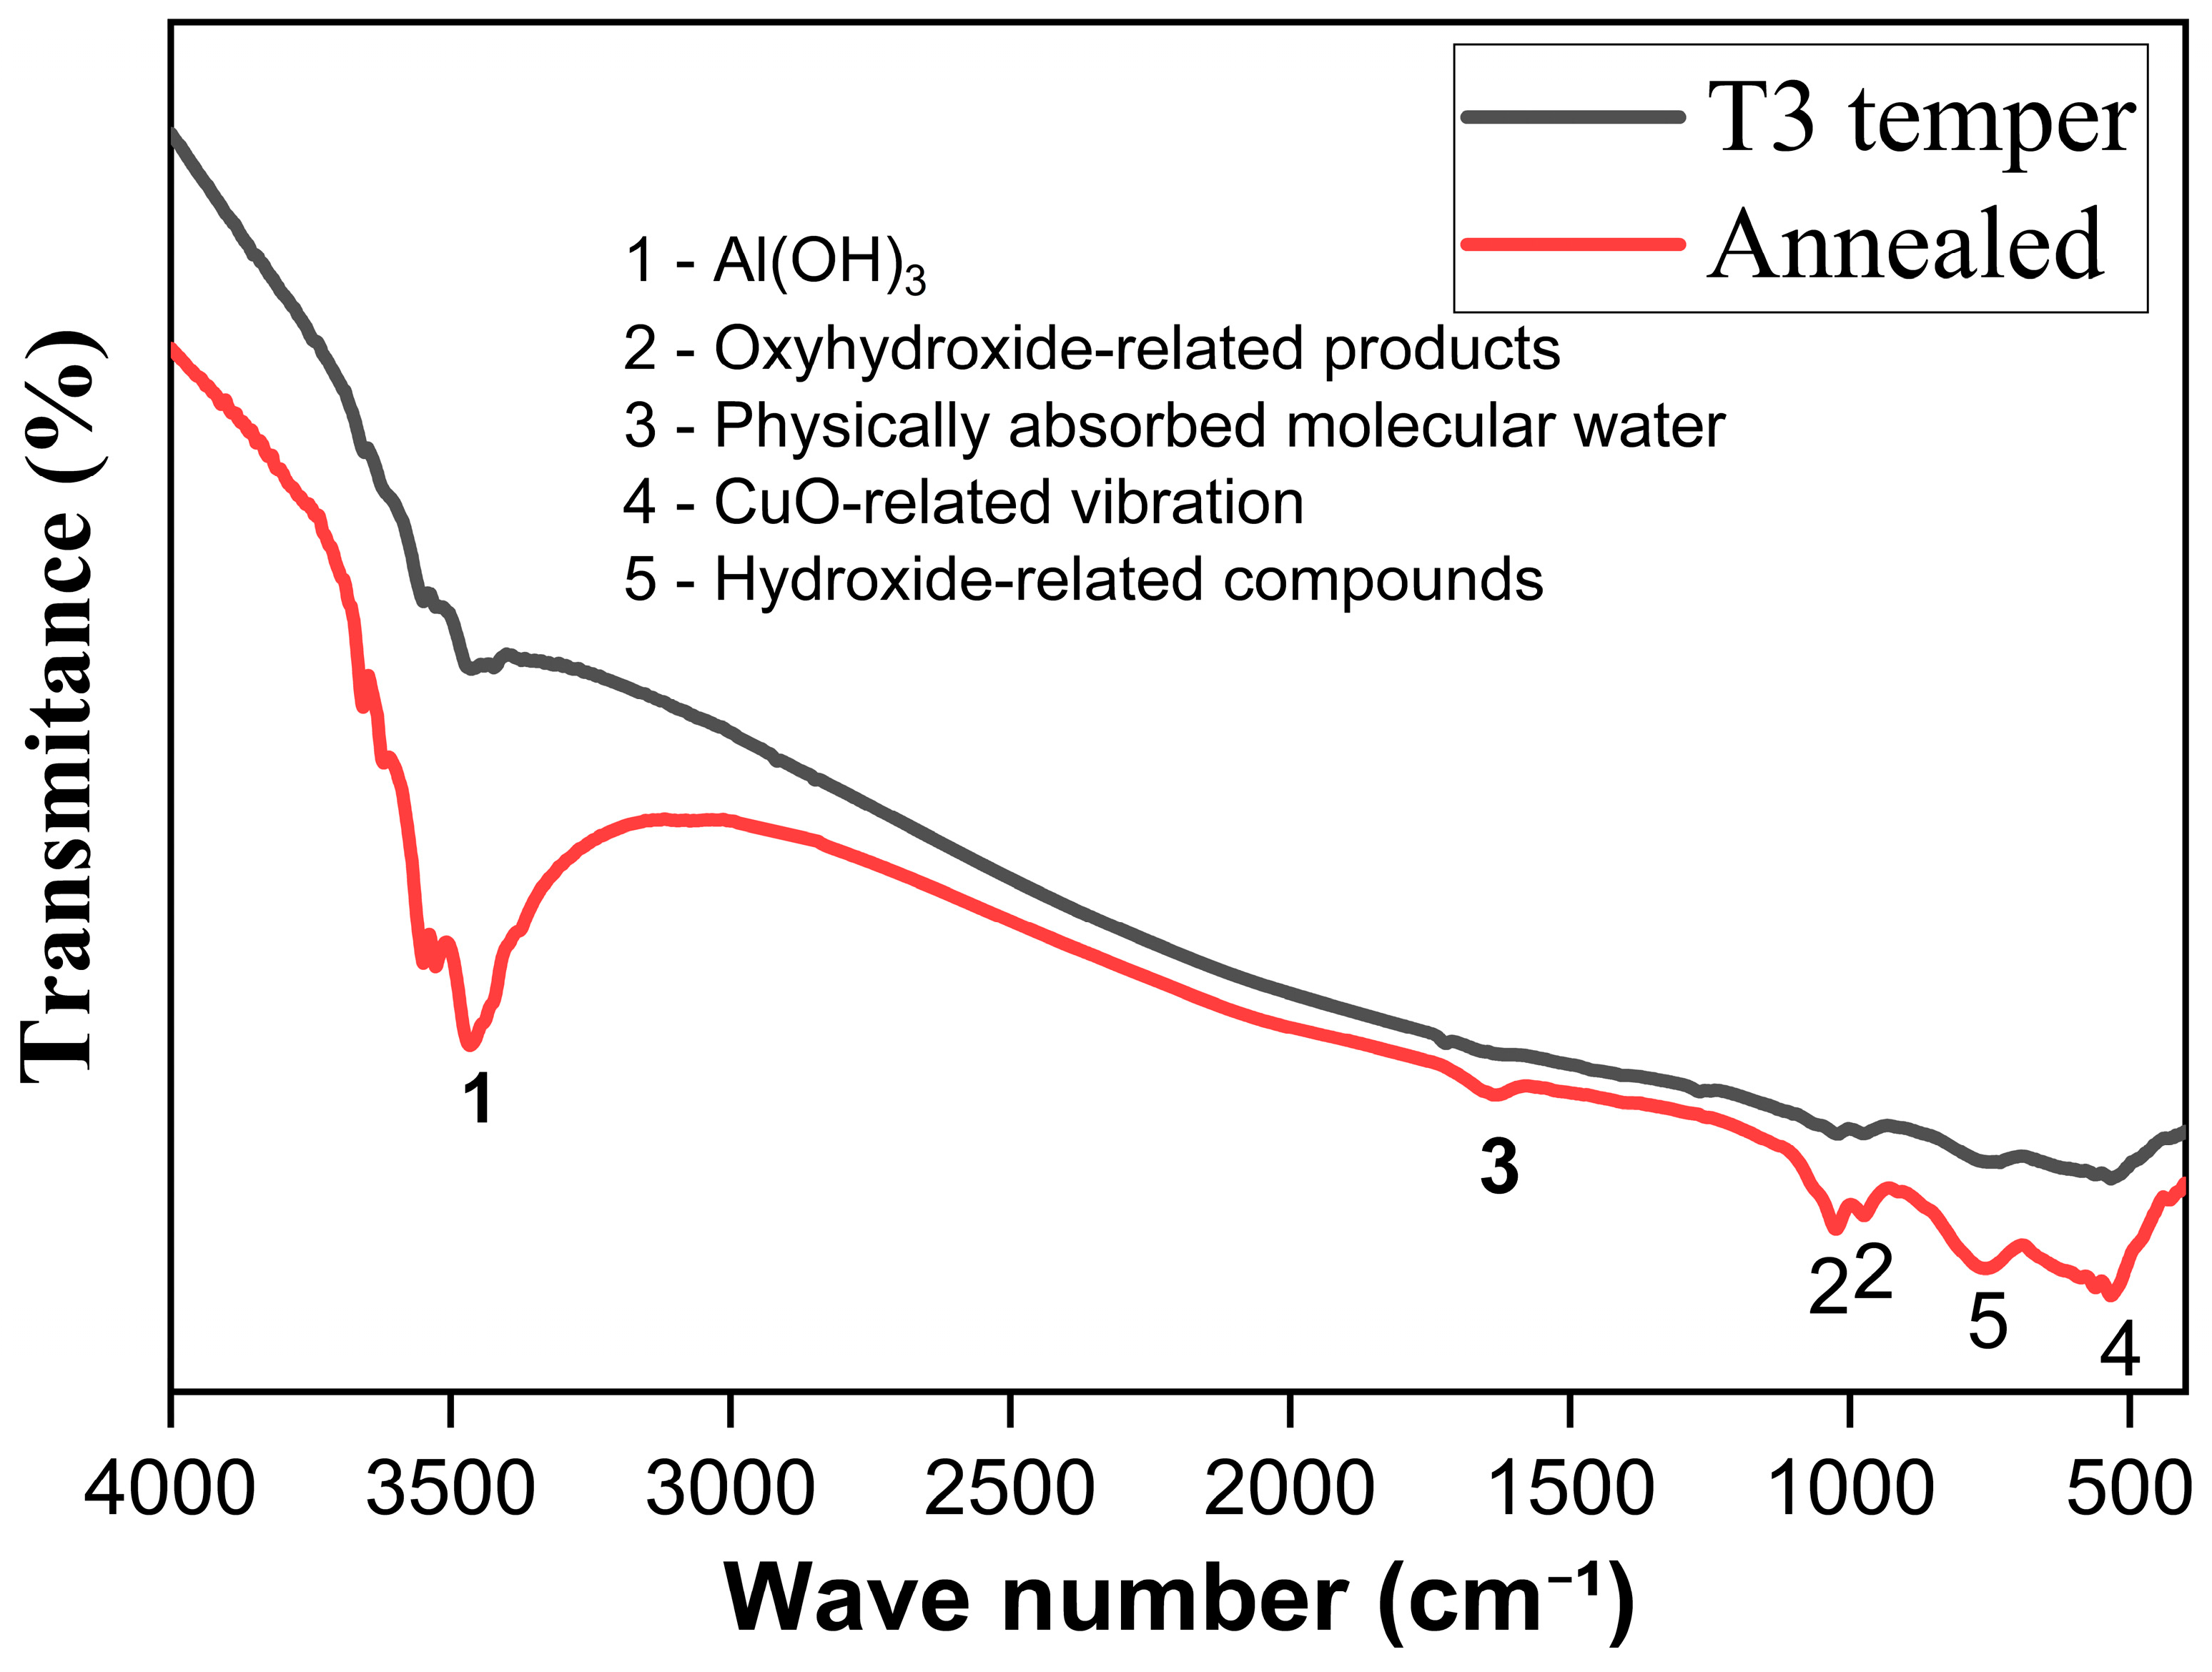
FTIR spectra were recorded in the range of 4000–400 cm−1 at ambient temperature with a resolution of 4 cm−1, as shown in Figure 7. The broad absorption region above 3500 cm−1, centered around 3465 cm−1, is associated with O–H stretching vibrations from hydroxyl-containing corrosion products and adsorbed moisture. The band near 1644 cm−1 can be attributed to physically adsorbed molecular water associated with hydrated aluminum corrosion products [19,20]. The absorption features in the lower wavenumber region are associated with metal–oxygen vibrations. The band near 535 cm−1 may be assigned to Cu–O vibrations related to cupric oxide (CuO), while aluminum hydroxide-related phases such as gibbsite/bayerite and oxyhydroxide products may contribute to the bands in the lower wavenumber region [20,21].
Figure 7.
FTIR spectra of corrosion products formed on T3 temper and annealed AA8090 specimens after immersion testing.
The T3 temper specimen showed comparatively weaker Al–OH-related absorption bands than the annealed specimen, suggesting lower hydroxide-type corrosion product formation on the analyzed surface. SEM observations also showed that the annealed specimen contained more uniformly distributed surface corrosion features. Therefore, the combined SEM-EDS and FTIR results suggest that annealing influenced the corrosion product formation, with Al–OH-containing products and CuO-related oxides being detected on the corroded surfaces.
3.5. Potentiodynamic Polarization (PDP)
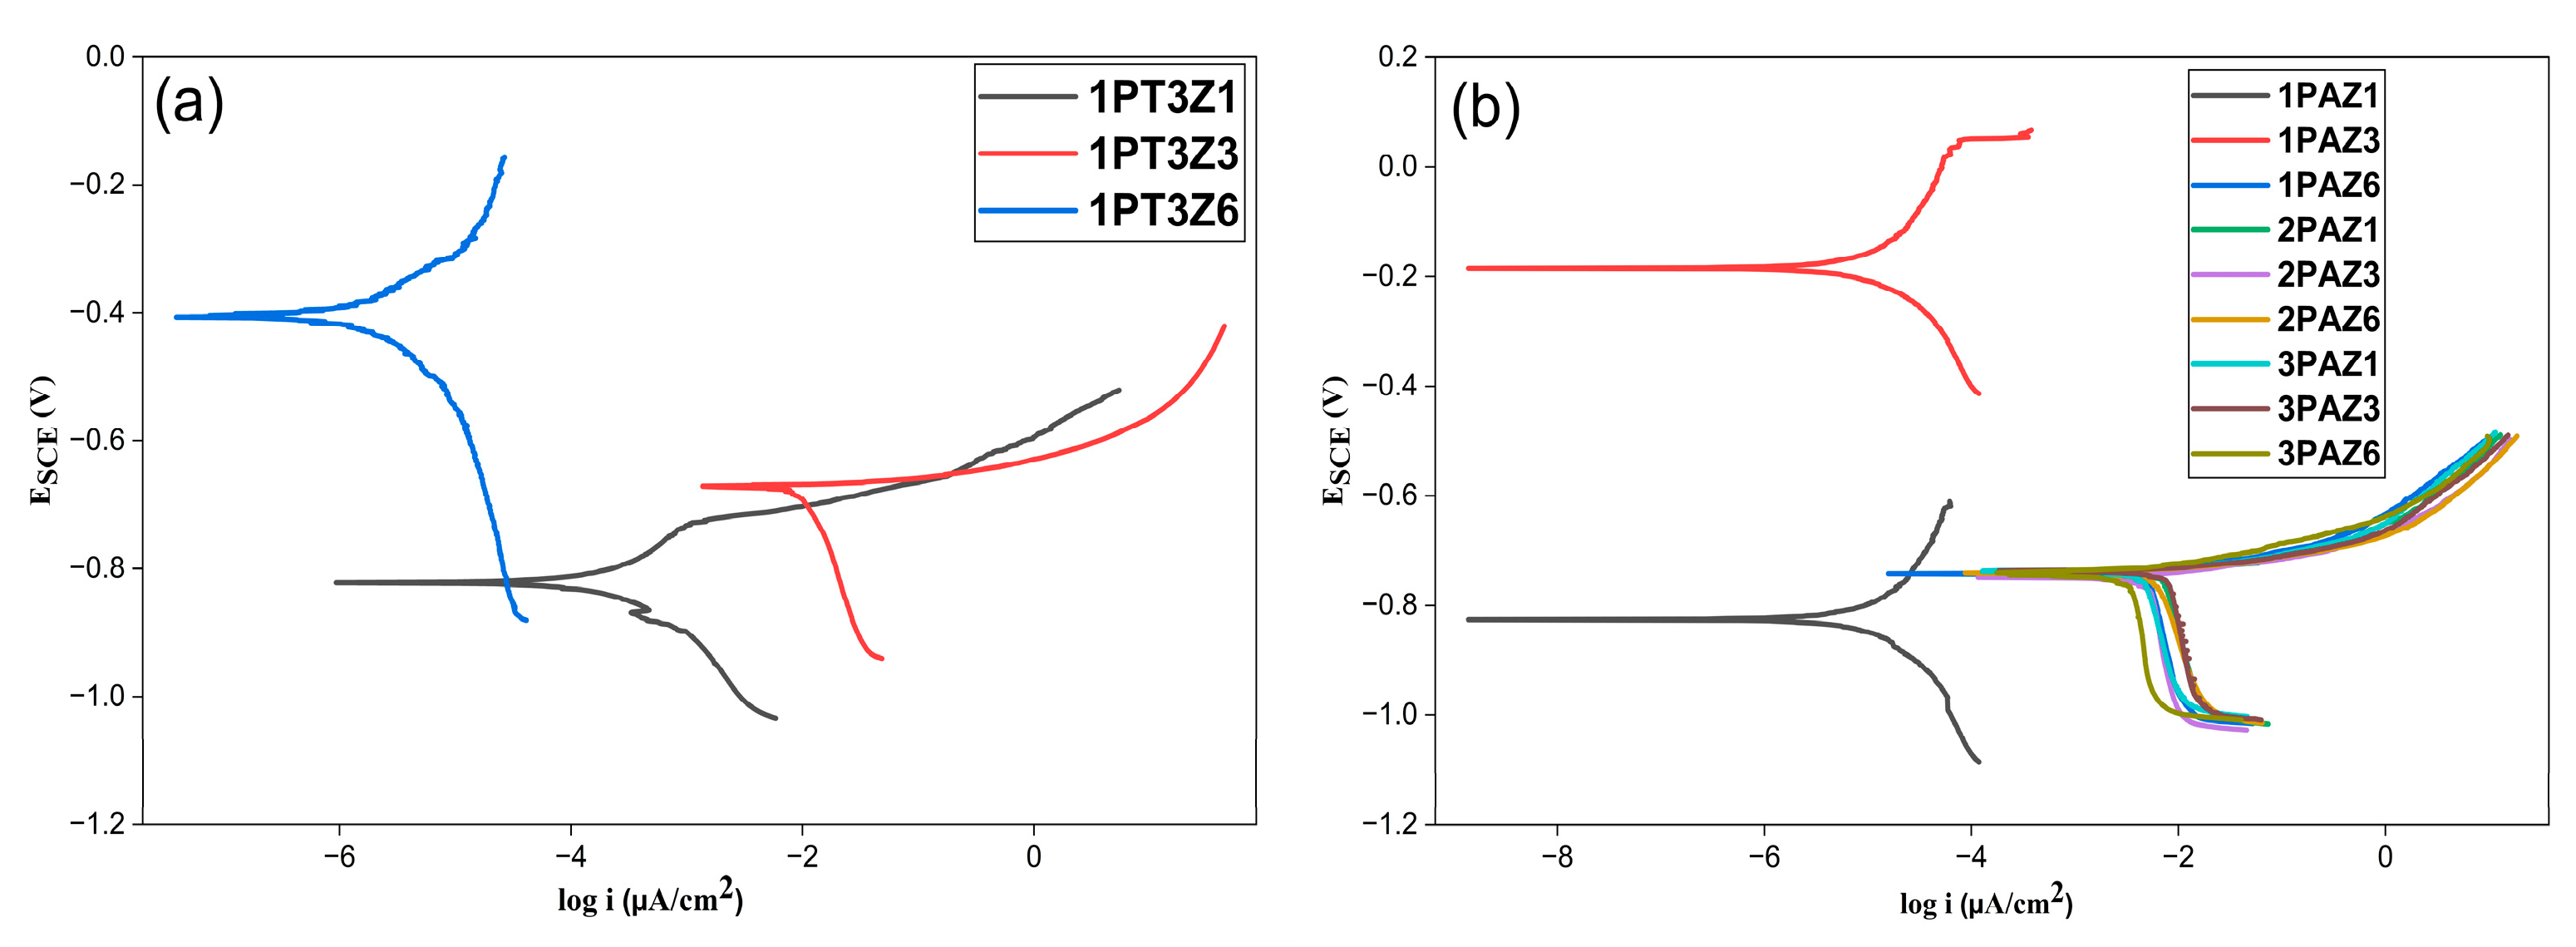
The PDP curves obtained after exposing the specimen to 3.5% NaCl solution are shown in Figure 8. Variations in corrosion potential () and corrosion rate were observed for the different rolling conditions and deformation zones. In general, the values exhibited a tendency to shift towards the noble direction with decreasing deformation level. The corrosion behavior of Al–Li alloys is strongly influenced by deformation, precipitate distribution, and thermomechanical treatment [10,22,23,24].
Figure 8.
Potentiodynamic polarization curves of AA8090 specimens exposed to 3.5 wt.% NaCl solution: (a) T3 temper-rolled specimens and (b) annealed and rolled.
The precipitation behavior of secondary phases such as T1 (Al2CuLi), S′ (Al2CuMg), and δ′ (Al3Li) significantly affects the corrosion response of Al–Li alloys [22,23,25,26,27]. The grain boundaries decorated with T1 precipitates are generally more susceptible to localized corrosion because of their electrochemical activity relative to the aluminum matrix [25,26]. In addition, the formation of precipitation-free zones (PFZs) adjacent to grain boundaries can promote localized galvanic interactions between the matrix and precipitate-rich regions [26].
Among the investigated conditions, the lowest corrosion rate was observed for the 1PT3Z6 specimen (0.003 mpy), whereas the highest corrosion rate was recorded for the 1PT3Z3 specimen (7.47 mpy). The comparatively lower corrosion rate observed for 1PT3Z6 may be associated with deformation-induced microstructural modifications and comparatively lower galvanic activity. The second lowest corrosion rate was obtained for the 1PAZ3 specimen (0.01 mpy). These specimens exhibited relatively stable anodic behavior compared with the other conditions. In contrast, most of the remaining specimens showed active anodic dissolution with comparatively larger anodic Tafel slopes (), indicating the destabilization of the natural oxide film in chloride-containing solution [25].
The cathodic Tafel slopes for 1PT3Z1 and 1PAZ1 were relatively low, indicating an activation-controlled cathodic reaction, whereas the remaining specimens exhibited comparatively higher cathodic slopes, suggesting diffusion-controlled oxygen reduction behavior [11]. Considerable variations in corrosion rate were observed in the single-pass rolled conditions for both the T3 temper and annealed specimens. However, the corrosion rates for several annealed + rolled conditions remained within the range of 2.3–5.8 mpy. The comparatively smaller variation in corrosion behavior observed for the annealed and rolled specimens after multiple rolling passes may be associated with the significant deformation introduced during the initial rolling pass, after which additional rolling produced relatively smaller changes in the electrochemical response. The electrochemical parameters obtained from the polarization curves include the corrosion current density () and polarization resistance (). The detailed electrochemical parameters are presented in Table 4. The polarization curves were analyzed using Tafel extrapolation in the near-corrosion-potential region (approximately within ±20 mV of ). The differences observed between and values may be associated with non-ideal polarization behavior and mixed activation/diffusion-controlled corrosion processes in the chloride-containing solution.
Table 4.
Electrochemical parameters obtained from potentiodynamic polarization tests in 3.5 wt.% NaCl solution.
Hydrogen evolution is generally the dominant cathodic reaction in acidic environments, whereas oxygen reduction becomes predominant under neutral and alkaline conditions [11]. The anodic dissolution of aluminum is balanced by the corresponding cathodic reactions. The electrochemical reactions involved in the corrosion process are expressed as follows [28]:
Although aluminate species are soluble in aqueous environments, hydrated aluminum hydroxide-containing surface products may form because of local precipitation during corrosion exposure.
The corrosion potentials of the rolled T3 temper specimens shifted towards comparatively noble values for certain deformation zones. The variations in electrochemical response among the specimens may be associated with localized chloride adsorption and simultaneous anodic and cathodic reactions occurring on the alloy surface [11]. The specimens 1PAZ3 and 1PT3Z6 exhibited comparatively more positive corrosion potentials of 0.06607 V/SCE and −0.1595 V/SCE, respectively. The PDP curves generally did not exhibit a well-defined passive region, indicating continuous metal dissolution in 3.5 wt.% NaCl solution.
Although the alloy exhibited acceptable corrosion resistance overall, the corrosion behavior was influenced by deformation and thermomechanical treatment. The variation in corrosion response between different deformation zones may be associated with localized microstructural variations induced during rolling. In several specimens, the intermediate deformation regions exhibited comparatively lower corrosion resistance than the lower deformation regions.
SEM micrographs of the specimens after electrochemical testing are shown in Figure 9a,b. The T3 temper-rolled specimen exhibited localized corrosion features along grain boundary regions after polarization testing. In contrast, the annealed specimen showed comparatively more uniform surface attack with evidence of precipitate-related surface degradation. The variation in electrochemical potential between the grain interior and grain boundary regions can promote localized galvanic interactions and corrosion attack [26]. The precipitation of secondary phases at grain boundaries may also produce precipitation-free zones (PFZs), leading to galvanic coupling between the matrix and adjacent regions [26]. The T1 and S′ phases are generally considered electrochemically active relative to the aluminum matrix [25,26].
Figure 9.
SEM micrographs of corroded AA8090 specimens after potentiodynamic polarization testing: (a) T3 temper-rolled specimen and (b) annealed specimen.
In the annealed specimen, the larger number of precipitates formed within the grain interior may reduce the potential difference between grain boundaries and the matrix, resulting in relatively more uniform corrosion behavior. However, localized pitting features were also observed at certain locations because of compositional heterogeneity. The increase in precipitate size after annealing can reduce the homogeneity of the natural oxide film, thereby increasing the number of preferential sites for chloride adsorption and pit initiation [28]. Adsorbed chloride ions further hinder the repair of the protective oxide layer and accelerate localized dissolution.
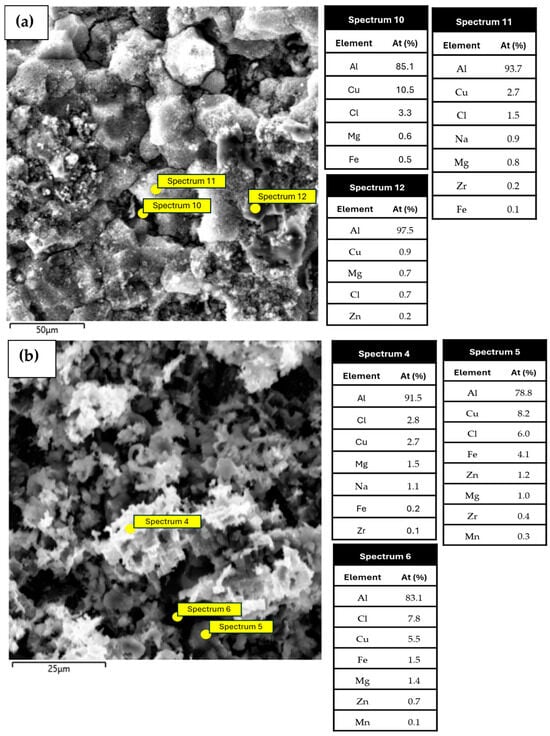
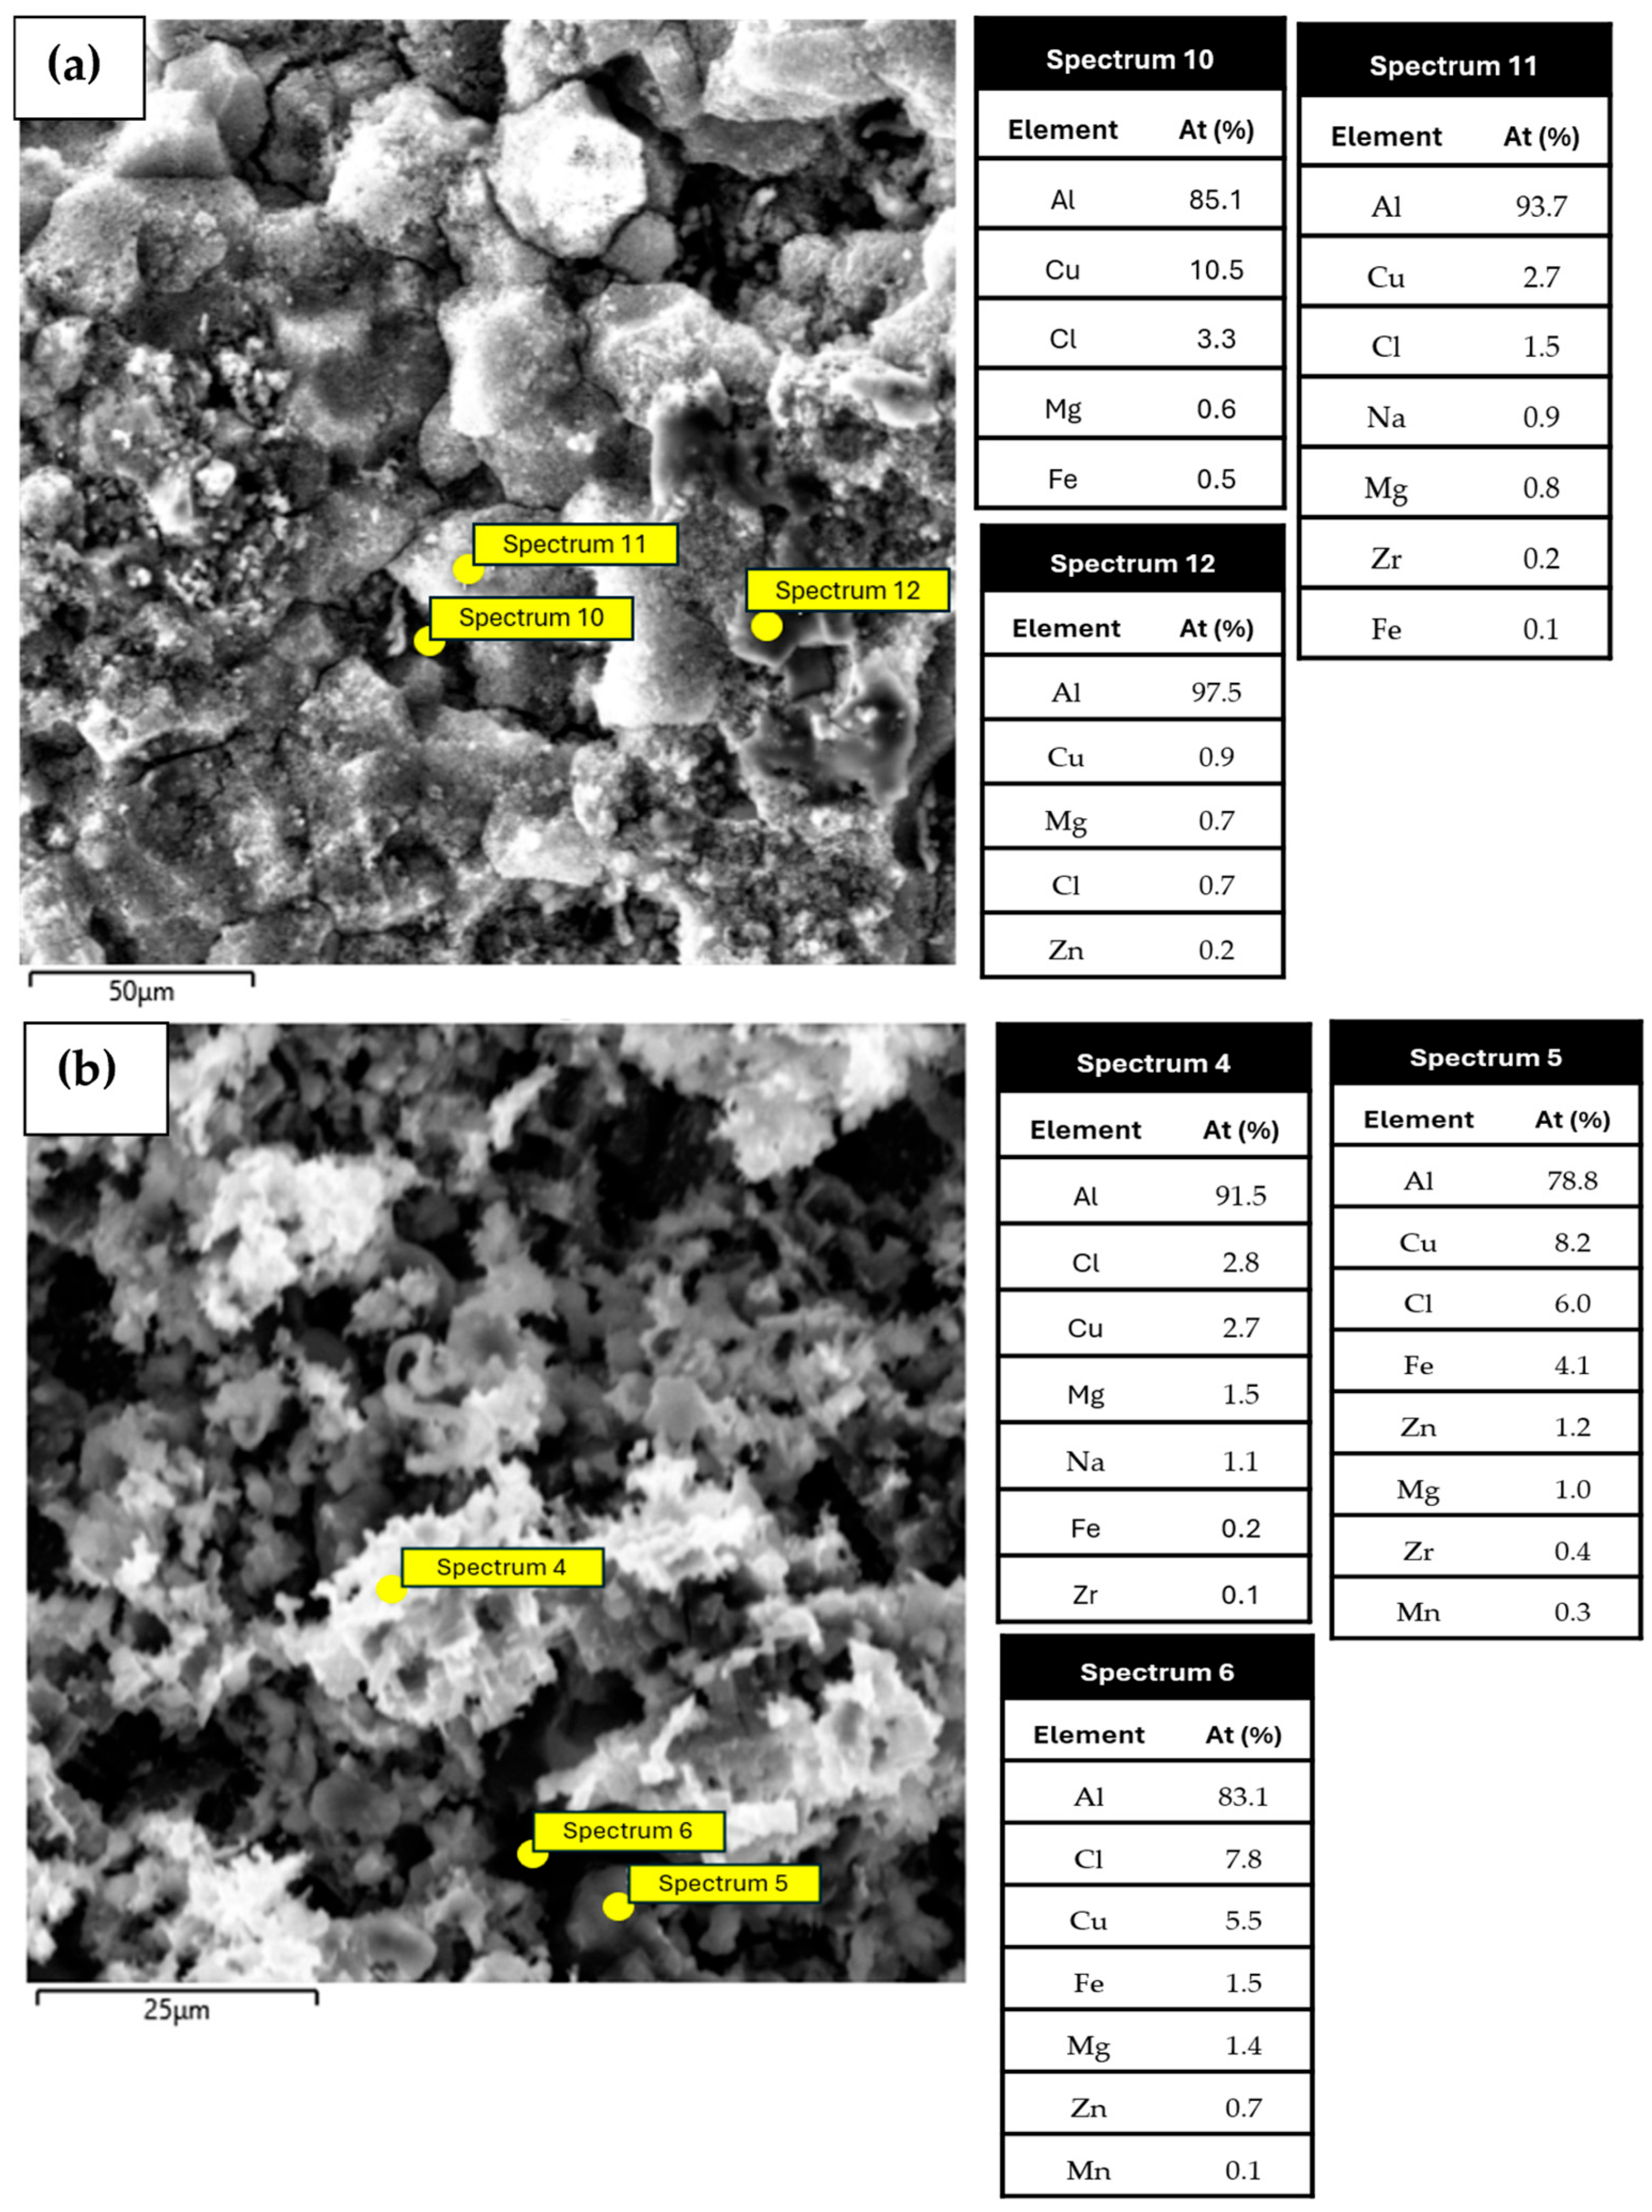
The SEM-EDS analysis of the T3 temper-rolled and annealed + rolled specimens after PDP testing is shown in Figure 10a,b. The darker contrast regions predominantly correspond to aluminum-rich areas, whereas the brighter regions indicate copper-rich corrosion products and precipitate-containing regions.
Figure 10.
SEM-EDS analysis of (a) T3 temper and (b) annealed AA8090 specimens after PDP testing.
4. Conclusions
The effect of mechanical processing on the corrosion behavior of lightweight AA8090 Al–Li alloy was investigated using microhardness measurements, potentiodynamic polarization (PDP), immersion testing, SEM-EDS, XRD, and FTIR analyses. The annealed specimens exhibited two stages of deformation behavior, where the microhardness initially increased because of strain hardening and later approached a saturation region with increasing deformation.
The T3 temper-rolled specimens generally exhibited comparatively lower corrosion rates than several annealed and rolled conditions. The corrosion behavior of the alloy was influenced by thermomechanical treatment, deformation condition, and precipitate distribution within the matrix and along grain boundary regions. XRD analysis identified the presence of δ′ (Al3Li), S′ (Al2CuMg), T1 (Al2CuLi), and β′ (Al3Zr) phases in the investigated specimens. These phases are known to influence both the strengthening behavior and corrosion characteristics of Al–Li alloys.
FTIR analysis indicated the presence of Al–OH-related compounds, oxyhydroxide-related products, adsorbed molecular water, and CuO-related oxides among the corrosion products formed on the specimen surfaces. The FTIR and SEM-EDS results suggest the formation of aluminum hydroxide-containing surface films during corrosion exposure.
The T3 temper-rolled specimens exhibited localized corrosion features along grain boundary regions after corrosion testing. The observed corrosion behavior may be associated with the presence of Cu-rich intermetallic phases such as S′ (Al2CuMg) and T1 (Al2CuLi), which can promote localized galvanic interactions and preferential dissolution of the surrounding matrix.
The present study was limited by the number of electrochemical test repetitions and the absence of detailed zone-wise microstructural characterization such as EBSD analysis. Future work will focus on detailed deformation-zone microstructural analysis, repeat electrochemical testing, and quantitative corrosion-product characterization for improved understanding of corrosion mechanisms in rolled AA8090 alloy.
Author Contributions
Writing—original draft preparation: M.R.J.; Conceptualization: M.R.J., B.P. and V.K.; Methodology: M.R.J. and B.P.; Investigation: M.R.J., V.A.D. and K.B.; Formal analysis: M.R.J., B.P., V.A.D., S.M.S. and K.B.; Validation: M.R.J., B.P. and V.A.D.; Visualization: M.R.J., V.A.D. and P.B.A.; Data curation: M.R.J., P.B.A. and S.M.S.; Resources: B.P., K.B., M.S., V.R.J. and V.K.; Writing—review and editing: S.N., S.B.D., R.V.K.B.V., B.P., V.K. and M.S.; Supervision: B.P., V.K., S.M.S., S.B.D. and S.N.; Project administration: S.N. and S.B.D. All authors have read and agreed to the published version of the manuscript.
Funding
This research received no external funding. The work was self-funded by Maheshwara Reddy JEDLA.
Data Availability Statement
The original contributions presented in this study are included in the article. Further inquiries can be directed at the corresponding authors.
Conflicts of Interest
The authors declare no conflicts of interest.
References
- Abd El-Aty, A.; Xu, Y.; Guo, X.; Zhang, S.H.; Ma, Y.; Chen, D. Strengthening mechanisms, deformation behavior, and anisotropic mechanical properties of Al-Li alloys: A review. J. Adv. Res. 2018, 10, 49–67. [Google Scholar] [CrossRef] [Scilit]
- Rioja, R.J.; Liu, J. The evolution of Al-Li base products for aerospace and space applications. Met. Mater. Trans. A 2012, 43, 3325–3337. [Google Scholar] [CrossRef] [Scilit]
- Reddy, A.C. Effect of lithium addition in 8090 aluminium alloy on strengthening mechanisms and wear behaviour of new generation aerospace alumina nanoparticle metal matrix composites. Indian Foundry J. 2017, 63, 23–33. [Google Scholar]
- Gaber, A.; Afify, N. Characterization of the precipitates in Al–Li (8090) alloy using thermal measurements and TEM examinations. Phys. B 2002, 315, 1–6. [Google Scholar] [CrossRef] [Scilit]
- Ghosh, K.S.; Das, K.; Chatterjee, U.K. Studies of microstructural changes upon retrogression and reaging (RRA) treatment to 8090 Al-Li-Cu-Mg-Zr alloy. Mater. Sci. Technol. 2004, 20, 825–834. [Google Scholar] [CrossRef] [Scilit]
- Zhi, J.; Guo, M.; Wang, T.; Meng, W.; Zhou, W.; Zhuang, L.; Lou, H. Synergistic effects of heterostructure and pre-deformation on precipitation and corrosion behaviors of Al–Zn–Mg–Cu alloys. J. Mater. Res. Technol. 2025, 35, 1663–1679. [Google Scholar] [CrossRef] [Scilit]
- Shyamlal, C.; Shanmugavel, R.; Jappes, J.T.W.; Nair, A.; Ravichandran, M.; Abuthakeer, S.S.; Prakash, C.; Dixit, S.; Vatin, N.I. Corrosion behavior of friction stir welded AA8090-T87 aluminum alloy. Materials 2022, 15, 5165. [Google Scholar] [CrossRef] [Scilit]
- Zheng, X.; Luo, P.; Yin, H.; Chu, Z. Analysis of Corrosion Behavior and Residual Strength of Lightweight 2060-T8 Al-Li Alloy. J. Mater. Eng. Perform. 2024, 33, 680–692. [Google Scholar] [CrossRef] [Scilit]
- Tan, Y.; Jiang, Z.X.; Chen, J.H.; Hu, Z.H.; Zhang, H.; Zhang, X.; Dong, C.-F.; Xiao, K. Corrosion Behavior of 2A97 Al–Li Alloy in Cl− and SO42− Mixed Salt Spray. J. Mater. Eng. Perform. 2024, 33, 12781–12792. [Google Scholar] [CrossRef] [Scilit]
- Li, J.F.; Birbilis, N.; Liu, D.Y.; Chen, Y.L.; Zhang, X.H.; Cai, C. Intergranular corrosion of Zn-free and Zn-microalloyed Al-xCu-yLi alloys. Corros. Sci. 2016, 105, 44–57. [Google Scholar] [CrossRef] [Scilit]
- Zhang, X.; Zhou, X.; Hashimoto, T.; Liu, B.; Luo, C.; Sun, Z.; Tang, Z.; Lu, F.; Ma, Y. Corrosion behaviour of 2A97-T6 Al-Cu-Li alloy: The influence of non-uniform precipitation. Corros. Sci. 2018, 132, 1–8. [Google Scholar] [CrossRef] [Scilit]
- Zhao, J.; Dan, Z.; Chang, H.; Zhou, L. Cracks propagation mechanism of intergranular corrosion in Al–Cu–Li AA2195 alloys governed by constant relative humidity. J. Mater. Res. Technol. 2024, 32, 165–176. [Google Scholar] [CrossRef] [Scilit]
- Jindal, V.; De, P.K.; Venkateswarlu, K. Effect of Al3Sc precipitates on the work hardening behavior of aluminum-scandium alloys. Mater. Lett. 2006, 60, 3373–3375. [Google Scholar] [CrossRef] [Scilit]
- de Damborenea, J.J.; Conde, A. Intergranular corrosion of 8090 Al–Li: Interpretation by electrochemical impedance spectroscopy. Br. Corros. J. 2000, 35, 48–53. [Google Scholar] [CrossRef] [Scilit]
- Lervik, A.; Wenner, S.; Lunder, O.; Marioara, C.D.; Holmestad, R. Grain boundary structures and their correlation with intergranular corrosion in an extruded Al-Mg-Si-Cu alloy. Mater. Charact. 2020, 170, 110695. [Google Scholar] [CrossRef] [Scilit]
- Astaghfari, G.; Soegijono, B. Influence of heat treatment on structure and corrosion resistance of 8090 aluminium alloy for ethanol fuel tank application. IOP Conf. Ser. Mater. Sci. Eng. 2019, 694, 012032. [Google Scholar] [CrossRef] [Scilit]
- Gairola, S.; Joshi, A.; Gangil, B.; Rawat, P.; Verma, R. Correlation of Tensile Properties and Fracture Toughness with Microstructural Features for Al–Li 8090 Alloy Processed by Cryorolling and Post-rolled Annealing. Trans. Indian Inst. Met. 2019, 72, 1743–1755. [Google Scholar] [CrossRef] [Scilit]
- John Xavier Raj, J.R.; Shanmugavel, B.P. Thermal stability of ultrafine grained AA8090 Al-Li alloy processed by repetitive corrugation and straightening. J. Mater. Res. Technol. 2019, 8, 3251–3260. [Google Scholar] [CrossRef] [Scilit]
- Traverso, P.; Beccaria, A.M.; Poggi, G. Corrosion behaviour of aluminium-lithium alloy 8090-T81 in sea water. Br. Corros. J. 1995, 30, 227–231. [Google Scholar] [CrossRef]
- Abdollahifar, M.; Zamani, M.R.; Beiygie, E.; Nekouei, H. Synthesis of micro-mesopores flower-like γ-Al2O3 nano-architectures. J. Serb. Chem. Soc. 2014, 79, 1007–1017. [Google Scholar] [CrossRef] [Scilit]
- Nasrazadani, S.; Nakka, S. Characterization of Corrosion Products in RTPF and All-Aluminum Microchannel Heat Exchangers. J. Fail. Anal. Prev. 2016, 16, 189–196. [Google Scholar] [CrossRef] [Scilit]
- Conde, A.; de Damborenea, J. Effect of surface depletion of lithium on corrosion behaviour of aluminium alloy 8090 in a marine atmosphere. J. Mater. Sci. 1996, 31, 4921–4926. [Google Scholar] [CrossRef] [Scilit]
- Zhang, X.; Zhou, X.; Hashimoto, T.; Lindsay, J.; Ciuca, O.; Luo, C.; Sun, Z.; Tang, Z. The influence of grain structure on the corrosion behaviour of 2A97-T3 Al-Cu-Li alloy. Corros. Sci. 2017, 116, 14–21. [Google Scholar] [CrossRef] [Scilit]
- Zhao, K.; Liu, J.H.; Yu, M.; Li, S.M. Through-thickness inhomogeneity of precipitate distribution and pitting corrosion behavior of Al–Li alloy thick plate. Trans. Nonferrous Met. Soc. China (Engl. Ed.) 2019, 29, 1793–1802. [Google Scholar] [CrossRef] [Scilit]
- Kertz, J.E.; Gouma, P.I.; Buchheit, R.G. Localized corrosion susceptibility of Al-Li-Cu-Mg-Zn alloy AF/C458 due to interrupted quenching from solutionizing temperatures. Met. Mater. Trans. A 2001, 32, 2561–2573. [Google Scholar] [CrossRef] [Scilit]
- de Sousa Araujo, J.V.; Milagre, M.X.; Ferreira, R.O.; de Souza Carvalho Machado, C.; de Fátima Santos Bugarin, A.; Machado, I.F.; Costa, I. Exfoliation and intergranular corrosion resistance of the 2198 Al–Cu–Li alloy with different thermomechanical treatments. Mater. Corros. 2020, 71, 1957–1970. [Google Scholar] [CrossRef] [Scilit]
- Xiang, L.; Tao, J.; Chen, Q.; Wang, Y.; Zhang, Y.; Su, Y.; Chai, S.; Zhang, F.; Xia, X. Grain-interior corrosion and tensile performance degradation of 2XXX Al–Li alloy in an actual marine environment. J. Mater. Res. Technol. 2023, 26, 5838–5850. [Google Scholar] [CrossRef] [Scilit]
- Deepa, P.; Padmalatha, R. Corrosion behaviour of 6063 aluminium alloy in acidic and in alkaline media. Arab. J. Chem. 2017, 10, S2234–S2244. [Google Scholar] [CrossRef] [Scilit]

Disclaimer/Publisher’s Note: The statements, opinions and data contained in all publications are solely those of the individual author(s) and contributor(s) and not of MDPI and/or the editor(s). MDPI and/or the editor(s) disclaim responsibility for any injury to people or property resulting from any ideas, methods, instructions or products referred to in the content. |
© 2026 by the authors. Licensee MDPI, Basel, Switzerland. This article is an open access article distributed under the terms and conditions of the Creative Commons Attribution (CC BY) license.