


Abstract
The rest–activity rhythm (RAR) is a key marker of circadian regulation and is commonly assessed using actigraphy. Emerging evidence suggests that characteristics of RAR, such as amplitude, stability, and regularity, may be associated with pain-related outcomes. However, no systematic review has yet synthesized this evidence across populations and pain conditions. This systematic review aimed to provide an overview of current approaches to measuring and defining RAR and to examine its associations with pain outcomes in both healthy individuals and clinical populations experiencing acute or chronic pain. A systematic search of PubMed, Web of Science, Scopus, and Embase was conducted, with the final search completed on 20 May 2025. Observational studies reporting associations between at least one RAR characteristic and a pain outcome were eligible. Article selection and risk-of-bias assessment using the ROBINS-E tool were performed independently by two reviewers, and findings were synthesized narratively. Seven cross-sectional studies were included, employing diverse analytic methods such as cosinor and non-parametric analyses. Overall, the findings were heterogeneous, suggesting that associations between RAR and pain vary according to the RAR metric used, the analytical approach, and the population studied. Nevertheless, the evidence generally indicates that more robust and well-consolidated circadian rhythms are associated with lower pain, whereas regularity and timing appear to play more context-dependent roles, highlighting the potential relevance of RAR metrics as modifiable targets and the need for standardized measurement approaches.
1. Introduction
Pain is a universal human experience and a key reason for seeking medical care [1,2]. Chronic pain in particular significantly impairs quality of life, daily functioning, and psychological well-being [2,3,4]. Due to the high prevalence of chronic pain and its substantial socioeconomic burden, it represents a major public health concern [5,6].
Pain is defined as an unpleasant sensory and emotional experience associated with actual or potential tissue damage [7] and is shaped by biological, psychological, and social factors [7]. Pain is also dynamic, with its perceived intensity and unpleasantness fluctuating within a day in most people with chronic pain [8,9]. For example, postoperative pain, fibromyalgia, trigeminal neuralgia, and migraines are described to peak in the morning [9], while tension-type headaches are more frequent in the afternoon and temporomandibular joint pain and neuropathic pain typically worsen in the evening [9]. Such temporal within-day fluctuations matter clinically because they might shape within-day pain-related movement behaviour or inform ideal timing of medication [8,9].
In constant-routine experiments that minimize behavioural and environmental influences, human pain-modulatory pathways follow a robust, endogenous 24 h rhythm [8]. This rhythm is generated by the circadian timing system, an intrinsic network of biological clocks that coordinates rhythms across nearly all physiological systems [10]. The circadian timing system comprises a central pacemaker in the suprachiasmatic nucleus, numerous peripheral clocks in organs and cell types, and input–output pathways that keep these clocks synchronized [10], with the molecular basis of each cellular clock being a set of clock-gene feedback loops that oscillate every ~24 h [10]. Yet, circadian rhythms are also shaped by environmental factors such as light–dark exposure, meal timing and sleep–wake scheduling [11,12,13], which provide input to the circadian clock and thereby influence biological rhythms [11,12,13]. With regard to sleep–wake scheduling, the rest–activity rhythm (RAR) is a core behavioural factor of the circadian timing system [14,15].
Modern wearable technology enables non-invasive monitoring of the RAR in real-world settings [16]. Actigraphy, in particular, uses compact accelerometer-based devices worn continuously over multiple days to estimate sleep and (variations in) daytime activity [16,17,18]. Over time, several metrics have been proposed to quantify RAR from accelerometry data [19,20]. These metrics are typically derived using either parametric or non-parametric approaches. Parametric methods assume that the rhythm follows a mathematical model, typically a sinusoidal curve [19]. Parametric metrics derived from cosinor analysis include Mesor, which represents the average activity level within a 24 h cycle; Amplitude, which reflects how pronounced the contrast is between daytime activity and nighttime rest; and Acrophase, which indicates the timing of peak activity within the cycle [19,20,21]. The goodness-of-fit of the cosinor model is expressed by R2, while the Circadian Quotient represents the ratio of Amplitude to Mesor, indicating the relative strength of the rhythm [20]. Non-parametric methods make no assumptions about the shape of the rhythm [19]. Non-parametric metrics include Interdaily Stability, which captures how consistent the rhythm is across multiple days, while Intradaily Variability reflects how fragmented the rhythm is within a day. Relative Amplitude, on the other hand, represents the difference between the most active and least active periods, and the Dichotomy Index (I < O) compares activity levels during in-bed versus out-of-bed periods. Finally, R24 measures how similar the activity pattern is from one day to the next, based on a 24 h autocorrelation [19,20,21].
When behavioural rest–activity patterns become misaligned with the endogenous circadian timing system—shift work being an extreme example—disrupted RARs arise [22]. Such misalignment is expressed in accelerometry-derived rhythms as a weakened day–night contrast, increased intradaily fragmentation, and greater day-to-day variability [22]. Research suggests that disrupted RARs are associated with poorer health outcomes, such as higher risks of incident cancer [23]; cardiovascular, infectious, respiratory, and digestive diseases [22]; dementia and cognitive impairment [24,25]; depression [26]; and all-cause and cause-specific mortality [23]. The association with pain-related outcomes is less frequently reported in the literature. It has been hypothesized that circadian timing disruption can exacerbate pain, while pain itself may further disturb circadian timing, suggesting a potentially bidirectional relationship [8]. However, to date, there is no integrated synthesis of how RAR—as a core behavioural factor of the circadian timing system—relates to pain-related outcomes. This review addresses that gap by systematically synthesizing evidence on how RAR characteristics relate to pain outcomes (pain intensity, sensitivity, duration, frequency, and interference) across diverse populations. We also map and compare actigraphy-based methods used to quantify RAR in pain populations, including preprocessing choices and commonly used metrics. Together, these aims provide a coherent framework for interpreting RAR characteristics as markers of circadian health in pain research and highlight methodological considerations relevant for future studies and clinical translation.
2. Results
2.1. Study Selection Process
Our literature search resulted in 9794 records in total. After removing duplicates, 5680 unique studies remained and were screened based on title and abstract. Title and abstract screening retrieved 254 records for full-text evaluation.
Of the 254 full-text articles assessed, seven studies met all inclusion criteria and were included in the qualitative synthesis. An overview of the study selection process and reasons for exclusion is provided in Figure 1.
Figure 1.
Flowchart for study selection process and reasons for exclusion. Abbreviations: RAR, rest–activity rhythm.
2.2. Study Characteristics
The seven studies included were published between 2014 and 2025 and originated from diverse geographical regions, including North America and Asia (Canada, the United States, and Taiwan). Four studies [27,28,29,30] adopted a cross-sectional observational design; three [31,32,33] were longitudinal observational studies. Sample sizes ranged from 37 to 292 participants. The study populations were heterogeneous, encompassing individuals with advanced cancer [27,29], those experiencing cancer-related pain [31], patients with fibromyalgia [30], individuals with inflammatory bowel disease [28], patients with temporomandibular disorders [32], and endometrial cancer survivors [33]. Two included studies used data from the same cohort of 68 hospitalized cancer patients with pain, recruited from the oncology ward of a teaching hospital in Taiwan, with Chang & Lin (2014) explicitly stating that their study was part of a larger investigation whose results had previously been published by Ma et al. (2014) [29,31]. Mean participant ages ranged from 37 to 68 years, and the proportion of female participants varied between 47.3% and 100%. Study settings and recruitment strategies were diverse, including community-based, outpatient, and inpatient hospital settings. Detailed inclusion and exclusion criteria and additional study characteristics are summarized in Table 1.
Table 1.
Study characteristics of the included studies.
2.3. Risk of Bias
The resulting κ value (κ = 0.78) indicated a high level of consistency between reviewers’ assessments. The results of the risk of bias assessment for each study are shown in Figure 2 [34], which includes both the domain-specific scores and the overall judgment. One study was rated as having some concerns [30], four as high risk of bias [29,31,32,33], and two as very high risk of bias [27,28].
Figure 2.
Results of the risk of bias assessment for each included study [27,28,29,30,31,32,33], showing domain-specific ratings and overall judgement.
All studies received a low risk of bias rating for the domains post-exposure interventions and outcome measurement. In contrast, all studies scored some concerns for selective reporting, mainly because none of them had a predefined analysis plan or study protocol. However, there was no further indication that the reported effect estimates were selectively chosen based on the desirability of the results. Risk of bias related to confounding, exposure measurement, participant selection, and missing data varied across studies. In the domain of confounding, four studies [27,28,29,31] did not account for relevant confounding factors and were therefore rated as having a high risk of bias. One study [32] did control for time-invariant confounders but failed to adjust for important time-varying ones, resulting in a rating of some concerns. In the domain of exposure measurement, three studies [29,31,33] were rated as having some concerns due to a limited actigraphy period (less than the recommended seven days [35]). The greatest bias in participant selection came from excluding participants after the exposure window based on factors related to the exposure itself, such as extreme patterns in actigraphy (outliers), non-adherence, or missing data. Finally, in the missing data domain, most issues were related to missing values in the exposure data, particularly in the actigraphy recordings.
2.4. Assessment of Pain Outcomes
Reported pain-related constructs were pain intensity, interference with daily activities, and daily or 24 h worst pain severity. The specific dimensions and instruments varied considerably across studies. An overview of all pain instrument characteristics can be found in Table 2.
Table 2.
Pain instrument characteristics.
Three studies [29,31,33] employed the Brief Pain Inventory (BPI) or its Chinese adaptation (BPI-C), a widely used self-report questionnaire designed to assess both pain intensity and pain interference with daily functioning [36]. It includes four 0–10 Numeric Rating Scale (NRS) items assessing pain at its “worst in the last 24 h”, “least in the last 24 h”, “average”, and “now”, with a 0 indicating “no pain” and 10 representing “pain as bad as you could imagine” [36]. The remaining seven items measure the extent to which pain interferes with general activity, mood, walking ability, normal work, relations with other people, sleep, and enjoyment of life, again using a 0–10 NRS [36]. For the interference items, 0 represents “does not interfere” and 10 indicates “interferes completely” [36]. Despite using the same instrument, scoring and interpretation differed. Ver Hoeve et al. (2024) computed composite scores for intensity and interference and applied a clinical cut-off (≥5) to classify elevated pain [33]. Ma et al. (2014) also calculated composite scores for intensity and interference but treated them exclusively as continuous variables without categorical thresholds [29]. Chang & Lin (2014) focused solely on pain intensity and categorized scores into mild (1–4), moderate (5–6), and severe (7–10) [31].
Bernatchez et al. (2018) used a single-question pain diary based on the BPI, asking participants to rate their worst pain in the past 24 h on a 0–10 scale (0 = no pain, 10 = worst imaginable) [27]. Mun et al. (2025) assessed daily pain severity in a similar way, using an end-of-day NRS (0 = no pain, 10 = worst imaginable pain) to rate the average level of pain experienced throughout the day [32]. Pain was broadly defined to include any source, ensuring that comorbid pain commonly experienced in people with temporomandibular disorders was captured [32].
In inflammatory bowel disease patients, Conley et al. (2021) measured abdominal pain and other gastrointestinal symptoms over the previous seven days using Patient-Reported Outcomes Measurement Information System (PROMIS) gastrointestinal symptom scales [28]. Finally, in fibromyalgia patients, Neikrug et al. (2017) assessed pain using the pain severity scale from the Multidimensional Pain Inventory (MPI) [30]. This scale assesses how pain interferes with different daily life activities and how severe it was over the last week [30,37].
2.5. Assessment and Data Processing Methods of RAR
2.5.1. Measurement Instruments of RAR
RARs were assessed using wrist-worn actigraphy devices. Across studies, devices and protocols varied as follows:
All studies measured RAR using actigraphy, typically worn on the non-dominant wrist. Bernatchez et al. (2018) used the Actiwatch-64® (Philips Respironics, Murrysville, PA, USA) with 30 s epochs, worn continuously for seven days [27]. Chang & Lin (2014) and Ma et al. (2014) used Ambulatory Monitoring Inc. (Ardsley, NY, USA) actigraphs with epochs from one minute, worn for at least three consecutive days [29,31]. Conley et al. (2021) employed the Actiwatch Spectrum Plus (Philips Respironics) with 30 s epochs, worn for ten consecutive days [28]. Mun et al. (2025) used the Actigraph GTX3 (Actigraph LLC, Pensacola, FL, USA) with 1 min epochs, worn continuously for fourteen days [32]. Neikrug et al. (2017) utilized the MicroMini-Motionlogger Actigraph (Ambulatory Monitoring) with 1 min epochs, worn for seven consecutive days [30], while Ver Hoeve et al. (2024) used the Actiwatch-64 (Mini-Mitter, Bend, OR, USA) with 1 min epochs for at least three consecutive days at each time point [33].
All studies supplemented actigraphy with sleep diaries completed by the participants to verify sleep–wake times and off-wrist periods. The devices’ software (e.g., Actiware v6, Action4 software, Action3 software, ActiLife v6 7.3) was used to preprocess data and detect off-wrist intervals.
2.5.2. Metrices of RAR
RAR metrics were derived using both parametric and non-parametric methods [19].
Parametric measures included Mesor (M), Amplitude (A), Acrophase or Phi (φ), R-squared (R2), and Circadian Quotient (CQ), which were reported by Bernatchez et al. (2018), Ver Hoeve et al. (2024), Neikrug et al. (2017), and Conley et al. (2021) [27,28,30,33]. The core cosinor parameters M, A, and φ are illustrated in Figure 3. Non-parametric measures included Interdaily Stability (IS), Intradaily Variability (IV), and Relative Amplitude (RA), as used in Conley et al. (2021) and Mun et al. (2025) [28,32]. The Dichotomy Index (I < O), which compares activity in bed versus out of bed, was employed in Chang & Lin (2014) and Ma et al. (2014) [29,31]. Ma et al. (2014) also calculated the autocorrelation coefficient (R24), which represents the autocorrelation of activity counts at a 24 h lag [29]. An overview of the RAR metrics is provided in Table 3.
Figure 3.
Schematic illustration of a cosinor curve. Mesor represents the rhythm-adjusted mean, Amplitude the maximal deviation from this mean, and Acrophase the timing of the peak.
Table 3.
Overview of rest–activity rhythm (RAR) metrics, categorized by analytical approach, including metric name and definition. Sources: [19,20,21].
2.5.3. Software, Algorithms and Procedures to Analyse RAR
The analysis of RARs in the included studies relied on a combination of data preprocessing, rhythm detection algorithms, and statistical modelling procedures. Although all studies employed wrist-worn actigraphy to capture continuous activity data, the specific analytical methods varied depending on the objectives of each study and the metrics used for characterizing RAR. RAR assessment, data processing methods, and analyses are summarized in Table 4.
Data preprocessing formed in all studies a crucial initial step to ensure the validity of the actigraphy recordings. Raw activity data were downloaded from Actigraph devices using software such as Actiware v6 (Philips Respironics) [27,28,33], Action4 (Ambulatory Monitoring Inc.) [29,30], ActiLife v6 7.3. (Actigraph LLC.) [32], or Action3 [30]. Non-wear periods were first identified automatically using built-in detection algorithms (e.g., the Wear Time Validation function in ActiLife). Subsequently, trained research staff manually verified these periods by comparing them with information from participants’ diaries. Diaries or event markers were consistently used to define lights-off and lights-on periods, nap intervals, and times of device removal.
Following wear-time validation, studies consistently applied either the Cole–Kripke [38] or Sadeh [39] sleep–wake detection algorithms to the actigraphy data. While the algorithms themselves were similar across studies, the operational definitions of sleep onset and wake onset varied. For example, Mun et al. (2025) defined sleep onset as the first sequence of at least five consecutive minutes scored as sleep, and wake onset as the last sequence of at least five minutes of sleep preceding a sustained wake period [32]. In contrast, Bernatchez et al. (2018) relied on sleep diaries and manually scored sleep–wake periods based on participants’ reported bedtimes and rise times [27]. Ver Hoeve et al. (2024) also used sleep logs to document sleep–wake patterns and off-wrist periods, excluding the latter from scoring [33]. Neikrug et al. (2017) also incorporated self-reported electronic sleep logs, using participants’ “Down” (time in bed attempting to sleep) and “Up” (out-of-bed) timestamps to constrain the scoring window; within these boundaries, the Sadeh algorithm was applied to classify each minute as asleep or awake [30]. Conley et al. (2021) used a different approach: sleep–wake periods were scored by a single trained scorer, based on participant-triggered event markers, supported by sleep diaries, and verified using the device’s light sensor [28]. Ma et al. (2014) and Chang & Lin (2014) did not clearly describe how sleep–wake scoring was performed, limiting the comparability of their methods to other studies [29,31].
Once the time series were preprocessed and scored as wake or sleep, rhythm analysis was conducted using two primary methodological frameworks: cosinor modelling (parametric) and non-parametric analysis of activity profiles.
The parametric cosinor model assumes that the circadian rhythm follows a sinusoidal pattern with a 24 h periodicity. This model was applied in the studies of Bernatchez et al. (2018), Conley et al. (2021), Neikrug et al. (2017) and Ver Hoeve et al. (2024), where the actigraphy data from several consecutive days were averaged into a single 24 h profile representing each participant’s overall rhythm [27,28,30,33]. A cosine function was then fitted to this averaged curve to estimate key rhythmic metrics, including the Mesor (M), the Amplitude (A), and the Acrophase (ϕ). From these, additional metrics such as the Circadian Quotient (CQ), R2, and R24 were also calculated.
In Bernatchez et al. (2018), model fitting was performed using the extended five-parameter cosinor model in SAS (versions 9.2–9.3) or SPSS (version 24), which allows for more flexibility in capturing asymmetries in activity curves [27]. The R2 statistic was derived to quantify the goodness-of-fit of the model, indicating the proportion of variance in activity explained by the rhythmic component. Higher R2 values reflected more robust, regular 24 h activity cycles, while lower values suggested irregular or flattened rhythms.
where Y(t) is the activity level at time t, M (Mesor) is the midline estimating statistic of rhythm, A represents the Amplitude (the extent of predictable change within the 24 h cycle), ϕ is the Acrophase (the timing of the rhythm’s peak), and τ is the assumed period, typically fixed at 24 h for circadian analysis.
In contrast, Neikrug et al. (2017) fitted the cosinor model to each individual 24 h day rather than to a single averaged profile [30]. This approach yielded a set of daily parameter estimates (e.g., Amplitude, Mesor, and Acrophase) for each participant. The variability of these metrics across days, expressed as the standard deviation or standard error, was then calculated to quantify intra-individual rhythm stability. In this way, researchers could assess not only the average characteristics of a person’s rest–activity rhythm but also how consistent or variable those rhythms were from day to day.
Non-parametric analyses were used when the data did not follow a regular sinusoidal pattern, which often occurs in individuals with disrupted circadian rhythms. These analyses, as implemented by Chang & Lin (2014), Conley et al. (2021), Ma et al. (2014), and Mun et al. (2025), relied on direct computation of rhythm metrics from the raw activity data without assuming any functional form [28,29,31,32]. The most frequently reported non-parametric variables included Interdaily Stability, Intradaily Variability, Relative Amplitude, R24 and the Dichotomy Index.
Table 4.
Summary of the assessment, data processing methods, and analyses of rest–activity rhythms (RAR) for each included study.
2.6. Associations Between RAR and Pain Outcomes in Different Populations
2.6.1. Correlation Statistics
Two studies (Bernatchez et al. 2018 [27] and Conley et al. 2021 [28]) assessed associations between cosinor-derived parameters (Amplitude, Acrophase, Mesor, up-Mesor and down-Mesor) and pain intensity measures (worst pain in the past 24 h and abdominal pain intensity). Both studies reported correlation coefficients close to zero (ranging from −0.27 to 0.19), and none of the associations reached statistical significance (all p > 0.05) [27,28]. Non-parametric RAR metrics (Interdaily Stability, Intradaily Variability, and the Circadian Quotient) likewise showed non-significant correlations with pain (all p > 0.05) [28].
Two additional studies by Ma et al. (2014) [29] and Chang & Lin (2014) [31] evaluated indices reflecting overall rhythm strength (R24) or day–night differentiation (I > O). Higher R24 and I < O values showed statistically significant negative correlations with both worst pain and composite pain intensity (p ≤ 0.001) [29]. A chi-square comparison of I < O groups showed a statistically significant association between I < O classification and pain severity (p = 0.013) [31].
2.6.2. Regression Statistics
Two studies (Mun et al. 2025 [32] and Ver Hoeve et al. 2024 [33]) used mixed-effects regression models with participant-level random intercepts to examine associations between RAR metrics and pain. In daily data, Mun et al. (2025) [32] estimated the extent to which prior-day disturbances in sleep (TST, WASO) and RARs (IV, RA) were associated with overall pain severity on the following day. In these models, Intradaily Variability was not a significant predictor (Est = −0.43, p = 0.375), whereas Relative Amplitude showed a statistically significant negative association with next-day pain (Est = −2.56, p = 0.001).
In the longitudinal dataset of Ver Hoeve et al. (2024) [33], mixed-effects linear regression models were used to examine whether individual differences in RAR measures (Mesor, Amplitude, Acrophase, R2), entered as time-varying predictors, were associated with differences in pain intensity and pain interference. Mesor (B = −0.20, p = 0.030) and Amplitude (B = −0.20, p = 0.026) showed significant negative associations with pain intensity, with borderline or non-significant associations for pain interference (p = 0.050 and p = 0.070, respectively). Acrophase showed a significant positive association with pain intensity (B = 0.20, p = 0.008) but not with pain interference (p = 0.145). For R2, mixed-effects models yielded non-significant results for both outcomes (p = 0.086; p = 0.426).
In the same longitudinal study of Ver Hoeve et al. (2024) [33], fixed-effects linear regression was used to examine whether within-person changes in RAR measures over time were associated with corresponding changes in pain intensity and pain interference. These within-person models showed statistically significant negative associations of Mesor (B = −0.51, p < 0.001) and Amplitude (B = −0.38, p = 0.001) with pain intensity and similar significant associations with pain interference (B = −0.45, p < 0.001; B = −0.36, p < 0.001). Acrophase was not significant in fixed-effects models (p = 0.152; p = 0.104). For R2, fixed-effects models yielded statistically significant negative associations with both pain outcomes (B = −0.19, p = 0.046; B = −0.19, p = 0.013).
2.6.3. Complex Multivariate Models
Using canonical correlation analysis, Neikrug et al. (2017) [30] identified a statistically significant multivariate association (canonical r = 0.376, p < 0.001) between actigraphy-derived rhythm and variability measures (Amplitude, Acrophase, Mesor and their variability indices) and clinical outcomes (pain, fatigue, mood and physical impairment).
Covariance selection models showed that: (i) variability measures remained associated with the clinical outcome set after adjusting for demographics (χ2 = 21.23, p = 0.047); (ii) rhythm metrics remained associated with the clinical outcome set after adjusting for demographics and variability measures (χ2 = 36.24, p < 0.001); and (iii) rhythm metrics remained associated with the clinical outcome set beyond weekly activity averages (χ2 = 34.28, p < 0.001).
Follow-up analyses examined whether individual rhythm metrics contributed to the overall multivariate association. Using multivariate general linear models (Pillai’s trace), Amplitude, Acrophase and Mesor each showed significant multivariate associations with the clinical outcome set comprising pain, fatigue, mood and physical impairment (p = 0.003, 0.018, 0.007 for Amplitude, Acrophase, and Mesor, respectively). The authors reported that better pain, fatigue, mood and disability outcomes were associated with higher Amplitude and Mesor, and with lower Acrophase (earlier peak activity).
For descriptive purposes, Amplitude and Phi were grouped into three levels, and univariate contrasts were conducted for pain scores. Pain did not differ significantly across Amplitude groups (p = 0.229), whereas participants in the late-Phi group reported significantly higher pain compared with the early/average groups (p = 0.005).
The results of the correlation, regression and multivariate analyses are summarized in Table 5.
Table 5.
Overview of the results of the correlation, regression and multivariate analyses per included study.
3. Discussion
3.1. Main Findings
This review is the first to provide a systematic overview of the evidence on the association between RARs and pain-related outcomes. Following a rigorous study selection process, only seven studies with predominantly low methodological quality were eligible for inclusion. Across the seven included studies, findings were heterogeneous, indicating that the association between RAR and pain depends on the type of RAR metric, the analytical approach, and the population studied.
Studies examining timing-metrics, i.e., traditional cosinor-derived metrics such as Mesor, Amplitude, and Acrophase, often reported no significant associations with pain intensity when using simple cross-sectional correlations [27,28]. In contrast, Ver Hoeve et al. (2024) demonstrated that cosinor-derived metrics become relevant when examined using longitudinal and multilevel approaches [33]. At the between-person level, higher Mesor and Amplitude, reflecting greater overall activity and stronger differentiation between the mean activity level and the peak activity, were associated with lower pain intensity, whereas a later Acrophase, indicating delayed timing of peak activity, was associated with higher pain intensity [33]. At the within-person level, postoperative increases in Mesor and Amplitude predicted reductions in both pain intensity and pain interference, reflecting concurrent changes in overall activity levels and pain outcomes over time [33]. Acrophase did not show significant within-person associations, whereas increases in R2, a measure of predictability and the goodness-of-fit of actigraphy-derived rhythms to a 24 h cosinor curve, were associated with modest reductions in pain [33]. Similarly, Neikrug et al. (2017) further highlighted that a combination of RAR metrics (Amplitude, Acrophase, Mesor) and their variability was significantly associated with a combined set of clinical outcomes, including pain, fatigue, mood, and physical impairment [30]. Follow-up covariance selection models demonstrated that all these metrics and their variability retained unique associations with the set of clinical outcomes after controlling for demographic factors and even after accounting for average weekly activity levels [30]. When focusing solely on pain as a clinical outcome, only Acrophase showed a clear univariate association, with later circadian timing being associated with higher pain scores, consistent with findings from Ver Hoeve et al. (2024) [30].
Metrics capturing the robustness and consolidation of the day–night rhythm, such as the Dichotomy Index (I < O) and Relative Amplitude (RA), showed associations with pain outcomes across several studies. Ma et al. (2014) and Chang & Lin (2014) reported significant negative correlations between pain intensity and I < O, indicating that individuals with a clearer separation between daytime activity and nighttime rest experience lower pain levels [29,31]. In line with this, Mun et al. (2025) found that Relative Amplitude was a significant negative predictor of daily pain severity, further supporting that a stronger contrast between active and rest periods is associated with reduced pain on a day-to-day basis [32]. Together, these studies suggest that metrics capturing rhythm robustness and consolidation may show more consistent associations with pain outcomes than traditional cosinor-derived metrics, although this pattern is based on a small number of heterogeneous studies.
Evidence regarding the regularity of rhythms was less consistent. Mun et al. (2025) reported that Interdaily Variability did not significantly predict daily pain severity within-person longitudinal analyses, and Conley et al. (2021) similarly found no significant associations between Interdaily Stability or Interdaily Variability and pain intensity [28,32]. These findings suggest that day-to-day variation or within-day fragmentation, when considered in isolation, did not yield robust associations with pain outcomes. However, other indicators of rhythm regularity may be more informative. For example, Ma et al. (2014) reported that higher R24 values, representing the autocorrelation of activity counts at a 24 h lag, calculated by correlating the activity time series of one day with that of the preceding day, were associated with lower Brief Pain Inventory scores [29]. Together with evidence from multivariate approaches (e.g., [30]), these findings suggest that rhythm regularity should be considered alongside rhythm robustness and timing rather than in isolation.
Importantly, the strength and direction of these associations appear to be population-dependent. Robustness of RARs, as captured by the Dichotomy Index (I < O), seems particularly relevant in individuals with advanced cancer [29,31], whereas Relative Amplitude was more predictive of daily pain severity in patients with temporomandibular disorder [32]. In contrast, cross-sectional analyses in palliative cancer patients [27] and adults with inflammatory bowel disease [28] found no significant associations, suggesting that study design and the timing of assessments may influence detectability. In fibromyalgia, lower Amplitude, Mesor, and later Acrophase were linked to greater pain [30], and the same thing was demonstrated within the population of post-surgical endometrial cancer patients [33]. Collectively, these findings underscore the importance of considering both population characteristics and methodological approaches when interpreting the relationship between RARs and pain. However, given the limited number of studies per population and differences in study design, these population-specific patterns should be interpreted as exploratory.
Overall, the available evidence shows that reduced robustness and consolidation of the day–night rhythm are associated with worse pain-related outcomes, whereas no such clear association is currently evident for metrics related to regularity and timing.
3.2. Quality and Limitations of the Reviewed Evidence
Interpretation of the findings requires careful consideration of several methodological issues.
First, the limited number of studies makes it difficult to draw generalizable conclusions. This limitation is further reinforced by the inclusion of two studies [29,31] derived from the same cohort of 68 cancer patients. These should therefore not be considered as independent sources of evidence, which further reduces the weight that can be assigned to their findings.
Second, although all studies employed wrist-worn actigraphy to assess RAR, there was substantial heterogeneity in how these measurements were conducted. Traditional approaches to monitoring behaviour in daily life, such as questionnaires, sleep logs, and diaries, are prone to recall bias and confounding by disease and lack precise timing information on these behaviours [41,42,43]. In contrast, actigraphy provides an objective, high-resolution method for capturing multiple aspects of daily behaviour, including circadian rhythms [40]. The rapid expansion of wearable technology has opened new opportunities to study these rhythms, but it also brings challenges: Actigraphy generates complex continuous movement data [40], from which multiple RAR-related metrics can be derived, each capturing a different aspect of circadian rhythmicity [40]. Additionally, studies included in this review differed across the following methodological areas:
- Duration of monitoring: The length of actigraphy recording varied substantially across the included studies, ranging from three to fourteen days. This heterogeneity is important because the duration of monitoring directly affects the ability to capture representative sleep–wake patterns [44]. The American Academy of Sleep Medicine recommends a minimum of 72 h but notes that this may be insufficient for certain applications, such as assessing circadian rhythm disorders [45]. The SBSM Guide to Actigraphy Monitoring emphasizes that seven to fourteen days are generally preferred to provide a comprehensive picture and detect weekday–weekend variability [35]. These guidelines also acknowledge the trade-offs associated with extended monitoring, including greater participant burden, higher risk of missing data or device loss, and increased processing demands [44].
- Sampling epoch length: The sampling epoch length varied across the included studies, either 30 s or one minute. Shorter epochs improve sensitivity and specificity for detecting sleeping and waking after sleep onset [35]. Current guidelines indicate that 30 s and 1 min epochs are the most validated and commonly used [35].
- Non-wear detection and handling of data missingness: Approaches to identify non-wear periods and handle missing data differed across studies. Correctly distinguishing wear from non-wear is crucial, as non-wear can compromise data quality and introduce bias [35]. Ideally, participants should log off-wrist periods throughout the study [35], as done by Ver Hoeve et al. (2024). Automated algorithms have also been developed for non-wear detection [46]. For example, Mun et al. (2025) applied ActiLife’s Wear Time Validation function to identify extended inactivity indicative of non-wear [32]. Yet, studies still typically manually verify automated non-wear detection using diaries or visual inspection, indicating that the identification of wear and non-wear is not yet fully independent of human judgment. Importantly, missingness due to non-wear may not be random [46]. Participants with higher pain levels might be less consistent in wearing the device, introducing systematic bias.
- Sleep/wake scoring: Actigraphy relies on algorithms to classify each epoch as asleep or awake. Two widely used algorithms are Cole–Kripke [38] and Sadeh [39], both validated against polysomnography and showing good overall agreement. In healthy populations, both achieve >85% agreement with polysomnography and correctly classify over 95% of sleep epochs (high sensitivity) [47]. However, wake detection is less accurate, with specificity ranging from about 60% for Cole–Kripke to 74% for Sadeh in healthy populations [47]. In patients with sleep disorders, specificity can even drop below 40% [47]. Sadeh has slightly lower sensitivity but higher specificity, making it potentially more suitable for populations with fragmented sleep, whereas Cole–Kripke may overestimate sleep in such cases [47].
- Analytical approaches to estimate RAR metrics: There are several analytical approaches to estimate RAR metrics, including parametric, nonparametric, data-adaptive, and nonlinear dynamic methods [19]. The studies reviewed in this paper employed either parametric or nonparametric approaches. Parametric models rely on assumptions about the distribution of data and the rhythm’s shape and provide interpretable metrics such as Amplitude, Mesor, and Acrophase, but their validity depends on how well the chosen model fits the data [16]. Nonparametric methods make no assumptions about rhythm shape and are less dependent on model fit but quantify a limited set of characteristics that are not always straightforward to interpret [16]. Previous research has shown that these two approaches often yield mixed findings [19], making it difficult to compare results and to understand the relationships between circadian rhythms and health outcomes. Moreover, parametric metrics are particularly sensitive to data gaps; applying them to raw versus non-wear-cleansed data can yield substantially different results, further undermining cross-study comparability [48]. Among simple correlation and regression analyses, there was a trend toward greater significance when using non-parametric RAR metrics.
Beyond actigraphy protocols, studies also varied in design and statistical approach. Designs ranged from cross-sectional to cohort and longitudinal studies. Cross-sectional studies (e.g., [27]) typically relied on a single measurement or averaged values across days, which limits the ability to capture the impact of short-term fluctuations in RAR on pain. Longitudinal designs (Mun et al. 2014 and Ver Hoeve et al. 2024) incorporated repeated measurements within individuals, enabling intra-individual changes in RAR to be linked to changes in pain over time [32,33]. Statistical approaches also differed in how RAR metrics were operationalized. For example, Chang & Lin (2014) dichotomized participants into groups above or below a predefined rhythmicity threshold [31]. While this method simplifies interpretation, it introduces information loss and reduces statistical power.
Differences in study populations further added heterogeneity. Studies included patients with cancer at different disease stages, as well as populations with fibromyalgia and IBS, conditions that differ substantially in their underlying pain mechanisms. Within cancer populations specifically, pain mechanisms also differ by disease stage: advanced and palliative patients frequently experience mixed nociceptive and neuropathic pain, whereas survivors more commonly present with chemotherapy-induced peripheral neuropathy (CIPN), a localized peripheral mechanism [49]. Baseline pain levels may also play a role. For instance, Bernatchez et al. (2018) found no association between RAR and pain [27], which may be explained by the relatively low pain intensity in their sample compared to Ma et al. (2014), who observed stronger associations among patients with higher pain levels [29]. Within fibromyalgia patients, it has been found that a feeling of loneliness in the morning can affect the intensity of pain in the evening [50]. Psychological factors can thus contribute more to circadian pain variation than the disease itself, highlighting that even within a single diagnosis, the drivers of circadian disruption may be highly individual and linked to other factors as well. Pain is a complex and multidimensional phenomenon, and the heterogeneity across included populations suggests that disease diagnosis alone is insufficient to explain variability in RAR–pain associations. Future research should therefore characterize pain phenotype (including inflammatory, neuropathic, and central sensitization-related markers) rather than relying solely on pain severity or disease stage to understand RAR–pain relationships.
The pronounced heterogeneity across studies limits comparability and makes it difficult to identify overarching patterns, such that the reported findings are best viewed as isolated observations rather than as a coherent body of evidence.
Moreover, all included studies are observational, which calls for cautious interpretation of the findings. The observed associations do not allow for conclusions about causality or about the direction of the relationship between rest–activity rhythms and pain. Bidirectional relationships, as well as the influence of unmeasured third factors such as mood, activity levels, or medication use, therefore remain plausible.
Finally, risk-of-bias assessment reflected generally low methodological quality: one study raised some concerns, four were high risk, and two were very high risk. The three main limitations across studies were insufficient control for confounders, short actigraphy monitoring periods in most of the studies, and selective exclusion of participants from the analysis or missing actigraphy data, all of which may compromise the reliability and generalizability of the observed RAR–pain associations.
3.3. Circadian Rhythms and Pain
The findings of our review may fit within a broader body of literature showing that sleep characteristics, physical activity levels, and other behavioural factors are related to pain [51,52,53]. Although these bidirectional associations help explain why behavioural factors influence pain, they do not explain how their timing and regularity shape pain experiences. In this regard, circadian rhythms have recently gained attention as a novel and underexplored contributor to pain [54].
Increasing evidence indicates that pain itself is under circadian control [54,55,56] and that pain modulation pathways and circadian regulation interact via different mechanisms [57]: At the circuit level, the suprachiasmatic nucleus (SCN) regulates pain processing through a multisynaptic pathway involving the subparaventricular zone (SPZ) and the lateral parabrachial nucleus (LPB), forming a bidirectional network in which nociceptive and circadian signals reinforce each other. At the molecular level, clock genes (e.g., BMAL1, CLOCK, PER, CRY) drive rhythmic expression of nociceptive mediators (including substance P, NMDA receptors, and cytokines), while inflammatory signals reciprocally disrupt these clocks. Glial cells possess intrinsic circadian rhythms and critically mediate neuroinflammation and SCN desynchronization. Importantly, different pain conditions (e.g., inflammatory vs. neuropathic) disrupt these systems in distinct ways, and circadian fluctuations in hormones and neurotransmitters further modulate pain and treatment response [57].
Previous research has mainly focused on describing daily pain fluctuations or the effects of circadian disruption [57,58,59,60], offering limited insight into whether the organization and robustness of everyday activity patterns themselves relate to pain. Our systematic review addresses this gap by synthesizing evidence on RAR metrics and pain outcomes, positioning RAR as a potentially modifiable pathway linking circadian regulation to pain.
The present findings suggest that the timing and consolidation of activity and rest may be more relevant to pain than overall activity levels. Metrics such as the Dichotomy Index (I < O) and Relative Amplitude capture how well periods of activity and rest are segregated across the 24 h cycle, and these metrics showed the strongest associations with pain. Individuals with more pronounced and stable day–night activity patterns tend to report lower pain levels, indicating that clearly defined behavioural rhythms support circadian alignment across systems involved in pain processing.
However, patients with chronic pain frequently exhibit poorly consolidated daily activity patterns, characterized by periods of overactivity, during which patients attempt to complete tasks or “push through” pain, followed by prolonged periods of inactivity or bed rest during pain flares [61,62,63]. Overall, they spend more time lying or sitting than healthy individuals [64], frequently accompanied by pain-related sleep disturbances and nocturnal wakefulness [65]. Together, these patterns blur the distinction between day and night and undermine circadian signalling.
In addition to rhythm robustness, the timing of peak activity may also hold clinical relevance for pain. A later Acrophase, reflecting a shift of peak activity toward the evening, corresponds to evening chronotypes, who often exhibit greater pain sensitivity than morning chronotypes [66,67]. Several mechanisms may explain this association, which has already been shown in the literature. First, affective functioning is central to pain perception: negative mood states enhance pain sensitivity, and evening types often report less favourable mood profiles and higher levels of depressive symptoms than morning types [68]. Second, circadian regulation of cortisol may contribute: evening types tend to have lower daytime cortisol levels and attenuated cortisol awakening responses, both associated with increased pain sensitivity [68]. Third, sleep patterns and social jetlag exacerbate pain in individuals with later Acrophase, as delayed sleep–wake timing can lead to sleep deprivation in social situations [68]. Together, these factors provide a plausible explanation for the link between late Acrophase and elevated pain observed across multiple studies in this systematic review, but more research about the timing of physical activity and its effects on pain and sleep is needed.
Finally, regular and well-timed physical activity is a potent zeitgeber that strengthens the day–night rhythm, whereas physical inactivity and irregular activity patterns are increasingly recognized as risk factors for pain [11,52,53].
RARs have also been studied in relation to conditions beyond pain. In mood disorders, irregular and delayed RAR profiles are linked to higher levels of depressive and manic–hypomanic symptoms [69,70]. In dementia research, greater rhythm fragmentation relates to neurodegenerative biomarkers, lower amplitude predicts future cognitive decline, and reduced 24 h rhythm fit is associated with executive dysfunction [24]. Similarly, in cardiometabolic research, more stable and less fragmented rhythms are associated with lower odds of cardiovascular disease, hypertension, and obesity, even after adjustment for traditional lifestyle factors [71].
Although further longitudinal research is needed, this suggests that circadian disorganization may represent a transdiagnostic vulnerability factor rather than a pain-specific mechanism. From this broader perspective, pain may constitute one manifestation of a more generalized circadian dysregulation phenotype, affecting multiple interconnected physiological systems.
3.4. Strengths and Limitations of This Review and Protocol Deviation
This review followed rigorous methodological standards. The protocol was prospectively registered to enhance transparency and reduce the risk of bias. A comprehensive search was conducted across multiple databases, and study screening and data extraction were performed independently by two reviewers. Similarly, risk of bias was assessed independently by two reviewers using a standardized instrument, ensuring consistent evaluation of study quality.
Despite these strengths, the review has several limitations. First, a meta-analysis could not be performed due to substantial heterogeneity in RAR measurement approaches, study designs, and pain populations. Second, despite an extensive search, the possibility of publication bias cannot be excluded, as unpublished or non-English studies may have been missed. Third, the included studies predominantly examined Western pain populations; therefore, the findings may not be generalizable to non-Western populations.
A protocol deviation occurred during the review process. The initial protocol aimed to capture all of the literature examining circadian regulation in relation to pain, including chronotype, RAR, and circadian dysregulation. During screening, it became apparent that these domains were conceptually and methodologically distinct, making combined synthesis impractical. Therefore, the scope of this review was narrowed to focus specifically on RAR, ensuring a coherent and interpretable synthesis while recognizing that the other domains warrant separate analyses.
3.5. Future Research Recommendations and Clinical Implications
While circadian principles are already proposed to some extent in phototherapeutic [72,73] and pharmacological interventions [74,75], future research is needed to clarify which specific RAR metrics are most strongly associated with pain outcomes and to understand the mechanisms underlying these associations, exploring why certain features of circadian rhythmicity relate to pain perception and severity. A deeper mechanistic understanding is essential before translating these findings into clinical practice, designing interventions, or testing targeted strategies to modulate RAR for pain management. Firstly, standardized measurement approaches are needed. Actigraphy offers a powerful tool for assessing RAR in large chronic pain populations, yet current practices for sampling, data processing, and analysis vary widely, limiting comparability. An urgent consensus on minimum data quality standards—including thresholds for non-wear detection and sampling density—is needed to enable valid metric comparisons and reproducible research. While general guidelines and flowcharts exist to support actigraphy use [35], dedicated guidance specifically for RAR measurement in different pain populations and with regard to different pain mechanisms would greatly improve data quality, enable more reliable cross-study comparisons, and facilitate the translation of research findings into clinical practice.
Despite these gaps, the results of this review suggest cautious yet promising clinical considerations for pain rehabilitation. Lifestyle interventions that focus on the timing and regularity of sleep and physical activity could provide low-risk, non-invasive strategies to improve pain outcomes [60]. Educating patients about the importance of maintaining a clear and well-consolidated day–night rhythm, characterized by regular daytime activity and protected nighttime rest, may offer a simple yet effective preventive approach. Early evidence already suggests that integrating simple circadian-alignment practices into daily routines may support sustainable improvements in sleep regularity and health outcomes [75]. Future research should further investigate how chronobiologically-informed interventions can optimize pain management in clinical populations.
In this context, the rapid advancement of wearable devices could enable remote monitoring of rest–activity rhythms to assess and support the behavioural separation between activity and rest as a feasible component of routine care. While further research is needed to confirm and refine these strategies, they already point toward practical avenues to support patients with chronic pain.
4. Materials and Methods
4.1. Systematic Review Protocol
This study follows the Preferred Reporting Items for Systematic Reviews and Meta-Analyses (PRISMA) guidelines [76]. The PRISMA checklist is included in the Supplementary Materials. The protocol of this review was preregistered on PROSPERO (CRD420251052792).
4.2. Eligibility Criteria
This systematic review includes observational studies across healthy and clinical populations that objectively quantify RAR over multiple days (at least 3 days) and report statistical associations with pain outcomes (e.g., pain prevalence, sensitivity, intensity, duration, or interference). Table 6 outlines the inclusion and exclusion criteria that guided the selection of studies for this review.
Table 6.
Inclusion and exclusion criteria used to determine study eligibility.
4.3. Search Strategy and Study Selection Process
Systematic searches were conducted in PubMed (MEDLINE), Embase, and Web of Science Core Collection, with the final search performed on 20 May 2025. The full search strategy and search strings are provided in Appendix A. Search terms were structured around three core concepts: (1) rest–activity rhythm or circadian activity patterns, (2) actigraphy or accelerometry, and (3) pain and pain-related outcomes. Both controlled vocabulary (e.g., MeSH and Emtree terms) and free-text keywords were combined using Boolean operators (AND, OR).
All search results were exported to EndNote (Clarivate Analytics) for reference management and subsequently imported into Rayyan (Qatar Computing Research Institute) to facilitate systematic screening and documentation of decisions. After duplicate removal, two reviewers (M.D.d. and A.V.S.) independently screened all titles and abstracts. Discrepancies or uncertain cases were resolved through consensus before proceeding to full-text screening, which was again performed independently by both reviewers. Finally, reference lists of eligible studies and relevant reviews were screened manually to identify additional publications not captured through electronic searches.
4.4. Data Extraction
Data from all included studies were extracted systematically using a predefined data extraction form. Data extraction was done by A.V.S. and checked by M.D.d. and consisted of the following items:
- Study identification: first author, year of publication, country, and study design.
- Population characteristics: sample size, demographic information (age, sex), health or pain condition, inclusion/exclusion criteria, study setting and how recruitment was carried out.
- RAR assessment details: device type, recording duration, software or algorithm used for data preprocessing.
- Specific RAR metrics reported (e.g., Interdaily Stability, Intradaily Variability, Relative Amplitude, Acrophase, Amplitude, transition probability).
- Pain-assessment details: the assessment method used, the timing or time points of assessment, and the measurement procedure.
- Specific pain-related outcomes (e.g., pain intensity, sensitivity, threshold, frequency, interference, or duration).
- Statistical analyses and effect estimates: reported associations between RAR metrics and pain outcomes, including correlation coefficients, regression estimates, or other summary statistics.
- Confounders and covariates: variables controlled for in the analysis.
- Risk of bias assessment outcomes (as evaluated using the ROBINS-E tool; see Section 2.5).
4.5. Risk of Bias Assessment
The risk of bias for all included studies was assessed using the ROBINS-E (Risk Of Bias In Non-randomized Studies of Exposures) tool, which provides a structured framework for evaluating potential biases in observational studies examining exposure–outcome relationships [77].
Two reviewers (M.D.d. and A.V.S.) independently assessed each study across the seven ROBINS-E domains: (1) bias due to confounding factors, (2) bias arising from measurement of exposure, (3) bias in selection of participants for the study or the analysis, (4) bias due to post-exposure interventions, (5) bias due to missing data, (6) bias arising from measurement of outcomes, and (7) bias in selection of the reported result [77].
To ensure consistency and reproducibility, the two reviewers established several predefined criteria prior to the risk of bias assessment. Relevant confounders were identified through a review of the literature to capture variables known to correlate with both RAR and pain but unlikely to fully account for their association (i.e., mediators). These confounders included psychological distress (primarily depression) [78], sociodemographic factors (age, sex, ethnicity, socioeconomic status, income) [79], BMI [80], type of work (e.g., shift work) [81,82], and cardiovascular or metabolic comorbidities (e.g., diabetes) [71]. During the risk of bias assessment, studies were evaluated on whether and how they accounted for these predefined confounders. This information was incorporated into the scoring of the relevant risk of bias items, with higher scores assigned to studies that adequately adjusted for key confounding variables.
Second, a minimum standard exposure window for valid RAR assessment was established to ensure construct validity. Based on the prior methodological literature [38] and expert consensus within the review team, studies were required to include at least seven consecutive valid days of actigraphy recording to be considered sufficiently representative.
Each domain was then judged as having a low risk of bias, some concerns, high risk of bias, or very high risk of bias, following the ROBINS-E guidance and algorithm. Any discrepancies between reviewers (M.D.d. and A.V.S.) were discussed and resolved through consensus, and if required, there was the option to involve a third researcher (L.D.B.). To quantify inter-rater agreement prior to consensus, Cohen’s kappa (κ) was calculated across all domains.
5. Conclusions
This review highlights preliminary evidence that more robust day–night activity rhythms may be linked to lower pain outcomes. Findings are limited by methodological heterogeneity and small study numbers, emphasizing the need for standardized assessment and mechanistic research. Advancing this field could inform personalized, rhythm-based strategies for pain management.
Supplementary Materials
The following supporting information can be downloaded at: https://www.mdpi.com/article/10.3390/clockssleep8020032/s1, Table S1: PRISMA 2020 Checklist [76].
Author Contributions
Conceptualization, A.V.S., M.D.d. and L.D.B.; methodology, A.V.S. and M.D.d.; validation, A.V.S., M.D.d. and L.D.B.; data curation, A.V.S. and M.D.d.; writing—original draft preparation, A.V.S. and M.D.d.; writing—review and editing, A.V.S., M.D.d., L.D.B. and C.L.; visualization, M.D.d.; supervision, L.D.B.; project administration, L.D.B.; funding acquisition, A.V.S., M.D.d. and L.D.B. All authors have read and agreed to the published version of the manuscript.
Funding
Flanders Research Foundation—FWO. A.V.S. 1S86326N. and M.D.d. 1S07825N.
Institutional Review Board Statement
Not applicable.
Informed Consent Statement
Not applicable.
Data Availability Statement
The original contributions presented in this study are included in the article. Further inquiries can be directed to the corresponding author.
Acknowledgments
During the preparation of this manuscript/study, the authors used M365 Copilot (bizchat.20260520.19.3) to support writing and rephrasing. All generated outputs were reviewed and edited by the authors, who take full responsibility for the final content of this publication.
Conflicts of Interest
The authors declare no conflicts of interest.
Abbreviations
The following abbreviations are used in this manuscript:
| RAR | Rest–Activity Rhythm |
| BPI | Brief Pain Inventory |
| NRS | Numeric Rating Scale |
| PROMIS | Patient-Reported Outcomes Measurement Information System |
| MPI | Multidimensional Pain Inventory |
| M | Mesor |
| A | Amplitude |
| φ | Phi or Acrophase |
| CQ | Circadian Quotient |
| IS | Interdaily Stability |
| IV | Intradaily Variability |
| RA | Relative Amplitude |
| I > O | Dichotomy Index |
Appendix A
PUBMED
(((“circadian rhythm”[MeSH Terms] OR Chronotype [Title/Abstract] OR “diurnal type”[Title/Abstract] OR “evening type”[Title/Abstract] OR “morning type”[Title/Abstract] OR “intermediate type”[Title/Abstract] OR “sleep–wake cycle”[Title/Abstract] OR chronobiology [Title/Abstract])) AND ((“pain”[MeSH Terms] OR pain [Title/Abstract] OR “acute pain”[Title/Abstract] OR “chronic pain”[Title/Abstract] OR nociception[MeSH Terms] OR nocicept*[Title/Abstract])))
EMBASE
((‘circadian rhythm’/exp OR chronotype:ti,ab OR “diurnal type”:ti,ab OR “evening type”:ti,ab OR “morning type”:ti,ab OR “intermediate type”:ti,ab OR “sleep–wake cycle”:ti,ab OR chronobiology:ti,ab) AND (“pain”/exp OR pain:ti,ab OR “acute pain”:ti,ab OR “chronic pain”:ti,ab OR “nociception”/exp OR nocicept*:ti,ab))
WEB OF SCIENCE
TS = ((“circadian rhythm” OR chronotype OR “diurnal type” OR “evening type” OR “morning type” OR “intermediate type” OR “sleep–wake cycle” OR chronobiology) AND (pain OR “acute pain” OR “chronic pain” OR nociception OR nocicept*))
SCOPUS
TITLE-ABS-KEY(“circadian rhythm” OR chronotype OR “diurnal type” OR “evening type” OR “morning type” OR “intermediate type” OR “sleep–wake cycle” OR chronobiology AND (pain OR “acute pain” OR “chronic pain” OR nociception OR nocicept*))
References
- Niv, D.; Kreitler, S. Pain and quality of life. Pain Pract. 2001, 1, 150–161. [Google Scholar] [CrossRef] [Scilit] [PubMed]
- Paananen, M.V.; Taimela, S.P.; Tammelin, T.H.; Kantomaa, M.T.; Ebeling, H.E.; Taanila, A.M.; Zitting, P.J.; Karppinen, J.I. Factors related to seeking health care among adolescents with musculoskeletal pain. Pain 2011, 152, 896–903. [Google Scholar] [CrossRef] [Scilit] [PubMed]
- Grabovac, I.; Dorner, T.E. Association between low back pain and various everyday performances: Activities of daily living, ability to work and sexual function. Wien. Klin. Wochenschr. 2019, 131, 541–549. [Google Scholar] [CrossRef] [Scilit] [PubMed]
- Yildizeli Topcu, S. Relations among Pain, Pain Beliefs, and Psychological Well-Being in Patients with Chronic Pain. Pain Manag. Nurs. 2018, 19, 637–644. [Google Scholar] [CrossRef] [Scilit]
- Phillips, C. Economic burden of chronic pain. Expert Rev. Pharmacoecon. Outcomes Res. 2006, 6, 591–601. [Google Scholar] [CrossRef] [Scilit]
- Cohen, S.P.; Vase, L.; Hooten, W.M. Chronic pain: An update on burden, best practices, and new advances. Lancet 2021, 397, 2082–2097. [Google Scholar] [CrossRef] [Scilit]
- Raja, S.N.; Carr, D.B.; Cohen, M.; Finnerup, N.B.; Flor, H.; Gibson, S.; Keefe, F.J.; Mogil, J.S.; Ringkamp, M.; Sluka, K.A.; et al. The revised International Association for the Study of Pain definition of pain: Concepts, challenges, and compromises. Pain 2020, 161, 1976–1982. [Google Scholar] [CrossRef] [Scilit]
- Daguet, I.; Raverot, V.; Bouhassira, D.; Gronfier, C. Circadian rhythmicity of pain sensitivity in humans. Brain 2022, 145, 3225–3235. [Google Scholar] [CrossRef] [Scilit]
- Knezevic, N.N.; Nader, A.; Pirvulescu, I.; Pynadath, A.; Rahavard, B.B.; Candido, K.D. Circadian pain patterns in human pain conditions—A systematic review. Pain Pract. 2023, 23, 94–109. [Google Scholar] [CrossRef] [Scilit]
- Chu, Y.; He, H.; Liu, Q.; Jia, S.; Fan, W.; Huang, F. The Circadian Clocks, Oscillations of Pain-Related Mediators, and Pain. Cell. Mol. Neurobiol. 2023, 43, 511–523. [Google Scholar] [CrossRef] [Scilit]
- Quante, M.; Mariani, S.; Weng, J.; Marinac, C.R.; Kaplan, E.R.; Rueschman, M.; Mitchell, J.A.; James, P.; Hipp, J.A.; Cespedes Feliciano, E.M.; et al. Zeitgebers and their association with rest-activity patterns. Chronobiol. Int. 2019, 36, 203–213. [Google Scholar] [CrossRef] [Scilit]
- Hasler, B.P.; Smith, L.J.; Cousins, J.C.; Bootzin, R.R. Circadian rhythms, sleep, and substance abuse. Sleep Med. Rev. 2012, 16, 67–81. [Google Scholar] [CrossRef] [Scilit] [PubMed]
- Blume, C.; Garbazza, C.; Spitschan, M. Effects of light on human circadian rhythms, sleep and mood. Somnologie 2019, 23, 147–156. [Google Scholar] [CrossRef] [Scilit]
- Wallace, D.A.; Johnson, D.A.; Redline, S.; Sofer, T.; Kossowsky, J. Rest-activity rhythms across the lifespan: Cross-sectional findings from the US representative National Health and Nutrition Examination Survey. Sleep 2023, 46, zsad220. [Google Scholar] [CrossRef] [Scilit]
- Qiao, Y.S.; Blackwell, T.; Chen, D.M.; Zeitzer, J.M.; Ancoli-Israel, S.; Posner, A.B.; Redline, S.; Tranah, G.J.; Yaffe, K.; Stone, K.L.; et al. Circadian rest-activity rhythms and physical function in community-dwelling older men: The MrOS sleep study. Sleep Health 2026, 12, 93–103. [Google Scholar] [CrossRef] [Scilit]
- Krafty, R.T.; Fu, H.; Graves, J.L.; Bruce, S.A.; Hall, M.H.; Smagula, S.F. Measuring Variability in Rest-Activity Rhythms from Actigraphy with Application to Characterizing Symptoms of Depression. Stat. Biosci. 2019, 11, 314–333. [Google Scholar] [CrossRef] [Scilit] [PubMed]
- Ancoli-Israel, S.; Cole, R.; Alessi, C.; Chambers, M.; Moorcroft, W.; Pollak, C.P. The Role of Actigraphy in the Study of Sleep and Circadian Rhythms. Sleep 2003, 26, 342–392. [Google Scholar] [CrossRef] [Scilit]
- Troiano, R.P.; Berrigan, D.; Dodd, K.W.; MÂSse, L.C.; Tilert, T.; McDowell, M. Physical Activity in the United States Measured by Accelerometer. Med. Sci. Sports Exerc. 2008, 40, 181–188. [Google Scholar] [CrossRef] [Scilit]
- Gao, C.; Haghayegh, S.; Wagner, M.; Cai, R.; Hu, K.; Gao, L.; Li, P. Approaches for assessing circadian rest-activity patterns using actigraphy in cohort and population-based studies. Curr. Sleep Med. Rep. 2023, 9, 247–256. [Google Scholar] [CrossRef] [Scilit] [PubMed]
- Ali, F.Z.; Parsey, R.V.; Lin, S.; Schwartz, J.; DeLorenzo, C. Circadian rhythm biomarker from wearable device data is related to concurrent antidepressant treatment response. npj Digit. Med. 2023, 6, 81. [Google Scholar] [CrossRef] [Scilit]
- Danilevicz, I.M.; van Hees, V.T.; van der Heide, F.C.; Jacob, L.; Landré, B.; Benadjaoud, M.A.; Sabia, S. Measures of fragmentation of rest activity patterns: Mathematical properties and interpretability based on accelerometer real life data. BMC Med. Res. Methodol. 2023, 24, 132. [Google Scholar] [CrossRef] [Scilit]
- Feng, H.; Yang, L.; Ai, S.; Liu, Y.; Zhang, W.; Lei, B.; Chen, J.; Liu, Y.; Chan, J.W.; Chan, N.Y.; et al. Association between accelerometer-measured amplitude of rest-activity rhythm and future health risk: A prospective cohort study of the UK Biobank. Lancet Healthy Longev. 2023, 4, e200–e210. [Google Scholar] [CrossRef] [Scilit]
- Innominato, P.F.; Wreglesworth, N.I.; Karaboué, A.; Spiegel, D.; Lévi, F.A. Rest-activity rhythm as a clinical biomarker in cancer. Lancet Healthy Longev. 2023, 4, e304. [Google Scholar] [CrossRef] [Scilit] [PubMed]
- Haghayegh, S.; Gao, C.; Sugg, E.; Zheng, X.; Yang, H.W.; Saxena, R.; Rutter, M.K.; Weedon, M.; Ibanez, A.; Bennett, D.A.; et al. Association of Rest-Activity Rhythm and Risk of Developing Dementia or Mild Cognitive Impairment in the Middle-Aged and Older Population: Prospective Cohort Study. JMIR Public Health Surveill. 2024, 10, e55211. [Google Scholar] [CrossRef] [Scilit]
- Zhang, M.; Chi, N.C.; Gardner, S.E.; Moon, C. Rest-activity rhythm and cognitive function in older adults: A scoping review and integrative framework. Geriatr. Nurs. 2025, 61, 80–90. [Google Scholar] [CrossRef] [Scilit]
- Ho, F.Y.; Poon, C.Y.; Wong, V.W.; Chan, K.W.; Law, K.W.; Yeung, W.F.; Chung, K.F. Actigraphic monitoring of sleep and circadian rest-activity rhythm in individuals with major depressive disorder or depressive symptoms: A meta-analysis. J. Affect. Disord. 2024, 361, 224–244. [Google Scholar] [CrossRef] [Scilit]
- Bernatchez, M.S.; Savard, J.; Ivers, H. Disruptions in sleep-wake cycles in community-dwelling cancer patients receiving palliative care and their correlates. Chronobiol. Int. 2018, 35, 49–62. [Google Scholar] [CrossRef] [Scilit] [PubMed]
- Conley, S.; Jeon, S.; Lehner, V.; Proctor, D.D.; Redeker, N.S. Sleep Characteristics and Rest-Activity Rhythms Are Associated with Gastrointestinal Symptoms Among Adults with Inflammatory Bowel Disease. Dig. Dis. Sci. 2021, 66, 181–189. [Google Scholar] [CrossRef] [Scilit] [PubMed]
- Ma, C.L.; Chang, W.P.; Lin, C.C. Rest/activity rhythm is related to the coexistence of pain and sleep disturbance among advanced cancer patients with pain. Support. Care Cancer 2014, 22, 87–94. [Google Scholar] [CrossRef] [Scilit]
- Neikrug, A.B.; Donaldson, G.; Iacob, E.; Williams, S.L.; Hamilton, C.A.; Okifuji, A. Activity rhythms and clinical correlates in fibromyalgia. Pain 2017, 158, 1417–1429. [Google Scholar] [CrossRef] [Scilit]
- Chang, W.P.; Lin, C.C. Correlation between rest-activity rhythm and survival in cancer patients experiencing pain. Chronobiol. Int. 2014, 31, 926–934. [Google Scholar] [CrossRef] [Scilit]
- Mun, C.J.; Tsang, S.; Reid, M.J.; Tennen, H.; Haythornthwaite, J.A.; Finan, P.H.; Smith, M.T. Effects of sleep and circadian rest-activity rhythms on daily pain severity in women with temporomandibular disorders. Pain 2025, 166, 1487–1496. [Google Scholar] [CrossRef] [Scilit]
- Ver Hoeve, E.S.; Rumble, M.E.; Gorzelitz, J.S.; Rose, S.L.; Nelson, A.M.; Morris, K.E.; Costanzo, E.S. Biobehavioral predictors of mood, pain, fatigue, and insomnia in endometrial cancer survivors. Gynecol. Oncol. 2024, 191, 265–274. [Google Scholar] [CrossRef] [Scilit] [PubMed]
- McGuinness, L.A.; Higgins, J.P.T. Risk-of-bias VISualization (robvis): An R package and Shiny web app for visualizing risk-of-bias assessments. Res. Synth. Methods 2021, 12, 55–61. [Google Scholar] [CrossRef] [Scilit] [PubMed]
- Ancoli-Israel, S.; Martin, J.L.; Blackwell, T.; Buenaver, L.; Liu, L.; Meltzer, L.J.; Sadeh, A.; Spira, A.P.; Taylor, D.J. The SBSM Guide to Actigraphy Monitoring: Clinical and Research Applications; Taylor & Francis: Abingdon, UK, 2015; pp. S4–S38. [Google Scholar]
- Walk, D.; Poliak-Tunis, M. Chronic Pain Management: An Overview of Taxonomy, Conditions Commonly Encountered, and Assessment. Med. Clin. N. Am. 2016, 100, 1–16. [Google Scholar] [CrossRef] [Scilit] [PubMed]
- Kerns, R.D.; Turk, D.C.; Rudy, T.E. The West Haven-Yale Multidimensional Pain Inventory (WHYMPI). Pain. 1985, 23, 345–356. [Google Scholar] [CrossRef] [Scilit]
- Cole, R.J.; Kripke, D.F.; Gruen, W.; Mullaney, D.J.; Gillin, J.C. Automatic Sleep/Wake Identification From Wrist Activity. Sleep 1992, 15, 461–469. [Google Scholar] [CrossRef] [Scilit]
- Sadeh, A.; Sharkey, M.; Carskadon, M.A. Activity-Based Sleep-Wake Identification: An Empirical Test of Methodological Issues. Sleep 1994, 17, 201–207. [Google Scholar] [CrossRef] [Scilit]
- Di, J.; Spira, A.; Bai, J.; Urbanek, J.; Leroux, A.; Wu, M.; Resnick, S.; Simonsick, E.; Ferrucci, L.; Schrack, J.; et al. Joint and Individual Representation of Domains of Physical Activity, Sleep, and Circadian Rhythmicity. Stat. Biosci. 2019, 11, 371–402. [Google Scholar] [CrossRef] [Scilit]
- Ballard-Barbash, R.; Macera, C.; Troiano, R. Be Physically Active Each Day. How Can We Know? J. Nutr. 2001, 131, 451S–460S. [Google Scholar] [CrossRef] [Scilit]
- Argiropoulou, E.C.; Michalopoulou, M.; Aggeloussis, N.; Avgerinos, A. Validity and reliability of physical activity measures in greek high school age children. J. Sports Sci. Med. 2004, 3, 147–159. [Google Scholar] [PubMed]
- Shephard, R.J. Limits to the measurement of habitual physical activity by questionnaires. Br. J. Sports Med. 2003, 37, 197–206. [Google Scholar] [CrossRef] [Scilit] [PubMed]
- Berger, A.M.; Wielgus, K.K.; Young-McCaughan, S.; Fischer, P.; Farr, L.; Lee, K.A. Methodological challenges when using actigraphy in research. J. Pain Symptom Manag. 2008, 36, 191–199. [Google Scholar] [CrossRef] [Scilit] [PubMed]
- Littner, M.; Kushida, C.A.; Anderson, W.M.; Bailey, D.; Berry, R.B.; Davila, D.G.; Hirshkowitz, M.; Kapen, S.; Kramer, M.; Loube, D.; et al. Practice parameters for the role of actigraphy in the study of sleep and circadian rhythms: An update for 2002. Sleep 2003, 26, 337–341. [Google Scholar] [CrossRef] [Scilit]
- Slyepchenko, A.; Uher, R.; Ho, K.; Hassel, S.; Matthews, C.; Lukus, P.K.; Daros, A.R.; Minarik, A.; Placenza, F.; Li, Q.S.; et al. A standardized workflow for long-term longitudinal actigraphy data processing using one year of continuous actigraphy from the CAN-BIND Wellness Monitoring Study. Sci. Rep. 2023, 13, 15300. [Google Scholar] [CrossRef] [Scilit]
- Lüdtke, S.; Hermann, W.; Kirste, T.; Beneš, H.; Teipel, S. An algorithm for actigraphy-based sleep/wake scoring: Comparison with polysomnography. Clin. Neurophysiol. 2021, 132, 137–145. [Google Scholar] [CrossRef] [Scilit]
- Weed, L.; Lok, R.; Chawra, D.; Zeitzer, J. The Impact of Missing Data and Imputation Methods on the Analysis of 24-Hour Activity Patterns. Clocks Sleep 2022, 4, 497–507. [Google Scholar] [CrossRef] [Scilit]
- Caraceni, A.; Shkodra, M. Cancer Pain Assessment and Classification. Cancers 2019, 11, 510. [Google Scholar] [CrossRef] [Scilit]
- Wolf, L.D.; Davis, M.C.; Yeung, E.W.; Tennen, H.A. The within-day relation between lonely episodes and subsequent clinical pain in individuals with fibromyalgia: Mediating role of pain cognitions. J. Psychosom. Res. 2015, 79, 202–206. [Google Scholar] [CrossRef] [Scilit]
- Jain, S.V.; Panjeton, G.D.; Martins, Y.C. Relationship Between Sleep Disturbances and Chronic Pain: A Narrative Review. Clin. Pract. 2024, 14, 2650–2660. [Google Scholar] [CrossRef] [Scilit]
- Geneen, L.J.; Moore, R.A.; Clarke, C.; Martin, D.; Colvin, L.A.; Smith, B.H. Physical activity and exercise for chronic pain in adults: An overview of Cochrane Reviews. Cochrane Database Syst. Rev. 2017, 4, Cd011279. [Google Scholar] [PubMed]
- Núñez-Cortés, R.; Cruz-Montecinos, C.; López-Bueno, R.; Andersen, L.L.; Calatayud, J. Physical inactivity is the most important unhealthy lifestyle factor for pain severity in older adults with pain: A SHARE-based analysis of 27,528 cases from 28 countries. Musculoskelet. Sci. Pract. 2025, 76, 103270. [Google Scholar] [CrossRef] [Scilit]
- Mun, C.J.; Burgess, H.J.; Sears, D.D.; Parthasarathy, S.; James, D.; Altamirano, U.; Sajith, S.; Lakhotia, A.; Fillingim, R.B.; Youngstedt, S.D. Circadian Rhythm and Pain: A Review of Current Research and Future Implications. Curr. Sleep Med. Rep. 2022, 8, 114–123. [Google Scholar] [CrossRef] [Scilit]
- Vitaterna, M.H.; Takahashi, J.S.; Turek, F.W. Overview of circadian rhythms. Alcohol Res. Health 2001, 25, 85–93. [Google Scholar]
- Martel, J.; Ojcius, D.M.; Young, J.D. Circadian rhythmicity and human health. Biomed. J. 2025, 48, 100855. [Google Scholar] [CrossRef] [Scilit] [PubMed]
- Warfield, A.E.; Prather, J.F.; Todd, W.D. Systems and Circuits Linking Chronic Pain and Circadian Rhythms. Front. Neurosci. 2021, 15, 705173. [Google Scholar] [CrossRef] [Scilit]
- Lucassen, E.A.; Coomans, C.P.; van Putten, M.; de Kreij, S.R.; van Genugten, J.H.; Sutorius, R.P.; de Rooij, K.E.; van der Velde, M.; Verhoeve, S.L.; Smit, J.W.; et al. Environmental 24-hr Cycles Are Essential for Health. Curr. Biol. 2016, 26, 1843–1853. [Google Scholar] [CrossRef] [Scilit]
- Sletten, T.L.; Cappuccio, F.P.; Davidson, A.J.; Van Cauter, E.; Rajaratnam, S.M.W.; Scheer, F.A.J.L. Health consequences of circadian disruption. Sleep 2020, 43, zsz194. [Google Scholar] [CrossRef] [Scilit] [PubMed]
- Münch, M.; Bromundt, V. Light and chronobiology: Implications for health and disease. Dialogues Clin. Neurosci. 2012, 14, 448–453. [Google Scholar] [CrossRef] [Scilit]
- Andrews, N.; Strong, J.P.; Meredith, P.; Gordon, K.; Bagraith, K. “It’s very hard to change yourself”: An exploration of overactivity in people with chronic pain using interpretative phenomenological analysis. Pain 2015, 156, 1215–1231. [Google Scholar] [CrossRef] [Scilit]
- Esteve, R.; Ramírez-Maestre, C.; Peters, M.L.; Serrano-Ibáñez, E.R.; Ruíz-Párraga, G.T.; López-Martínez, A.E. Development and Initial Validation of the Activity Patterns Scale in Patients With Chronic Pain. J. Pain 2016, 17, 451–461. [Google Scholar] [CrossRef] [Scilit]
- Paraschiv-Ionescu, A.; Buchser, E.; Aminian, K. Unraveling dynamics of human physical activity patterns in chronic pain conditions. Sci. Rep. 2013, 3, 2019. [Google Scholar] [CrossRef] [Scilit]
- Parker, R.; Bergman, E.; Mntambo, A.; Stubbs, S.; Wills, M. Levels of physical activity in people with chronic pain. S. Afr. J. Physiother. 2017, 73, 1–7. [Google Scholar] [CrossRef] [Scilit] [PubMed]
- Mathias, J.L.; Cant, M.L.; Burke, A.L.J. Sleep disturbances and sleep disorders in adults living with chronic pain: A meta-analysis. Sleep Med. 2018, 52, 198–210. [Google Scholar] [CrossRef] [Scilit] [PubMed]
- Pesonen, A.K.; Kahn, M.; Kuula, L.; Korhonen, T.; Leinonen, L.; Martinmäki, K.; Gradisar, M.; Lipsanen, J. Sleep and physical activity—The dynamics of bi-directional influences over a fortnight. BMC Public Health 2022, 22, 1160. [Google Scholar] [CrossRef] [Scilit] [PubMed]
- Tang, N.K.; Sanborn, A.N. Better quality sleep promotes daytime physical activity in patients with chronic pain? A multilevel analysis of the within-person relationship. PLoS ONE 2014, 9, e92158. [Google Scholar] [CrossRef] [Scilit]
- Heikkala, E.; Oura, P.; Määttä, J.; Karppinen, J.; Merikanto, I. Pressure Pain Sensitivity and Chronotype: A Population-based Study of Middle-aged Finns. J. Pain 2024, 25, 104473. [Google Scholar] [CrossRef] [Scilit]
- Mun, C.J.; Winsick, N.; Wegener, S.T.; Youngstedt, S.; Campbell, C.M.; Aaron, R.V. Longitudinal Effects Of Insomnia And Evening Chronotype On Pain And Emotional Distress Among Individuals With Chronic Pain. J. Pain 2023, 24, 106–107. [Google Scholar] [CrossRef] [Scilit]
- Jankowski, K.S. Morning types are less sensitive to pain than evening types all day long. Eur. J. Pain 2013, 17, 1068–1073. [Google Scholar] [CrossRef] [Scilit]
- Hoopes, E.K.; Witman, M.A.; D’Agata, M.N.; Berube, F.R.; Brewer, B.; Malone, S.K.; Grandner, M.A.; Patterson, F. Rest-activity rhythms in emerging adults: Implications for cardiometabolic health. Chronobiol. Int. 2021, 38, 543–556. [Google Scholar] [CrossRef] [Scilit]
- Martin, L.; Porreca, F.; Mata, E.I.; Salloum, M.; Goel, V.; Gunnala, P.; Killgore, W.D.; Jain, S.; Jones-MacFarland, F.N.; Khanna, R.; et al. Green Light Exposure Improves Pain and Quality of Life in Fibromyalgia Patients: A Preliminary One-Way Crossover Clinical Trial. Pain Med. 2021, 22, 118–130. [Google Scholar] [CrossRef] [Scilit]
- Cheng, K.; Martin, L.F.; Slepian, M.J.; Patwardhan, A.M.; Ibrahim, M.M. Mechanisms and Pathways of Pain Photobiomodulation: A Narrative Review. J. Pain 2021, 22, 763–777. [Google Scholar] [CrossRef] [Scilit]
- Walton, J.C.; Walker, W.H.; Bumgarner, J.R.; Meléndez-Fernández, O.H.; Liu, J.A.; Hughes, H.L.; Kaper, A.L.; Nelson, R.J. Circadian Variation in Efficacy of Medications. Clin. Pharmacol. Ther. 2021, 109, 1457–1488. [Google Scholar] [CrossRef] [Scilit]
- Bruguerolle, B.; Labrecque, G. Rhythmic pattern in pain and their chronotherapy. Adv. Drug Deliv. Rev. 2007, 59, 883–895. [Google Scholar] [CrossRef] [Scilit]
- Page, M.J.; McKenzie, J.E.; Bossuyt, P.M.; Boutron, I.; Hoffmann, T.C.; Mulrow, C.D.; Shamseer, L.; Tetzlaff, J.M.; Akl, E.A.; Brennan, S.E.; et al. The PRISMA 2020 statement: An updated guideline for reporting systematic reviews. BMJ 2021, 372, n71. [Google Scholar] [CrossRef] [Scilit]
- Higgins, J.P.; Morgan, R.L.; Rooney, A.A.; Taylor, K.W.; Thayer, K.A.; Silva, R.A.; Lemeris, C.; Akl, E.A.; Bateson, T.F.; Berkman, N.D.; et al. A tool to assess risk of bias in non-randomized follow-up studies of exposure effects (ROBINS-E). Environ. Int. 2024, 186, 108602. [Google Scholar] [CrossRef] [Scilit]
- Chen, I.M.; Lin, C.; She, G.J.; Chang, H.C.; Chuang, H.H.; Chen, T.Y.; Lin, Y.H. Rest-Activity Rhythm Patterns and Their Associations With Depression and Obesity: A Study Using Actigraphy and Human-Smartphone Interactions. Depress. Anxiety 2025, 2025, 2617282. [Google Scholar] [CrossRef] [Scilit]
- Li, J.; Somers, V.K.; Lopez-Jimenez, F.; Di, J.; Covassin, N. Demographic characteristics associated with circadian rest-activity rhythm patterns: A cross-sectional study. Int. J. Behav. Nutr. Phys. Act. 2021, 18, 107. [Google Scholar] [CrossRef] [Scilit]
- Li, J.; Vungarala, S.; Somers, V.K.; Di, J.; Lopez-Jimenez, F.; Covassin, N. Rest-Activity Rhythm Is Associated With Obesity Phenotypes: A Cross-Sectional Analysis. Front. Endocrinol. 2022, 13, 907360. [Google Scholar] [CrossRef] [Scilit]
- Chang, W.P.; Li, H.B. Influence of shift work on rest-activity rhythms, sleep quality, and fatigue of female nurses. Chronobiol. Int. 2022, 39, 557–568. [Google Scholar] [CrossRef] [Scilit]
- Lee, P.S.; Liu, Y.L.; Chen, Y.L.; Cheng, W.J. Work is associated with a more robust rest-activity rhythm and high-intensity physical activity among older adults. Aging Clin. Exp. Res. 2025, 37, 200. [Google Scholar] [CrossRef] [Scilit]
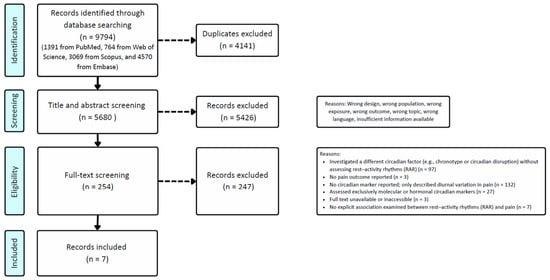
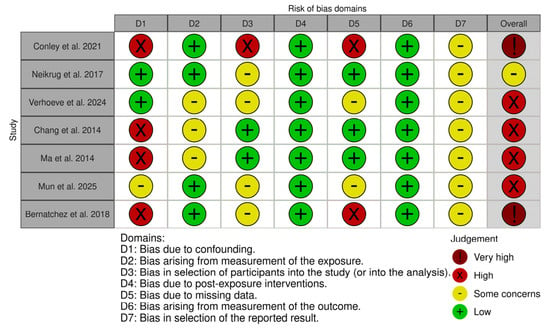
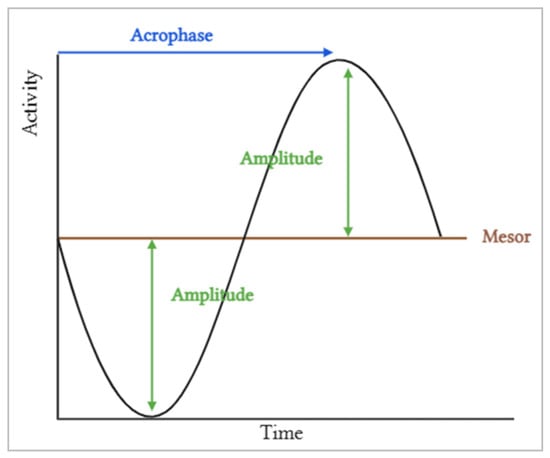
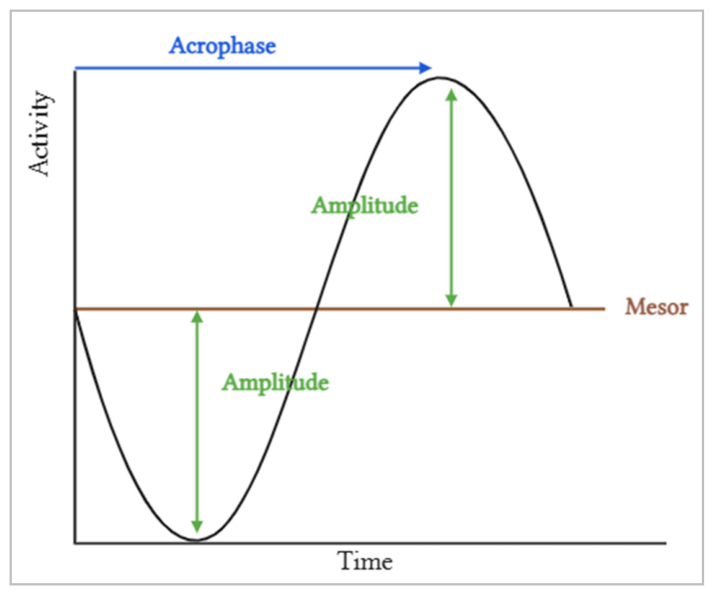

Disclaimer/Publisher’s Note: The statements, opinions and data contained in all publications are solely those of the individual author(s) and contributor(s) and not of MDPI and/or the editor(s). MDPI and/or the editor(s) disclaim responsibility for any injury to people or property resulting from any ideas, methods, instructions or products referred to in the content. |
© 2026 by the authors. Licensee MDPI, Basel, Switzerland. This article is an open access article distributed under the terms and conditions of the Creative Commons Attribution (CC BY) license.