


Abstract
Circadian Syndrome (CircS) links metabolic, behavioral, and mental health challenges to disrupted circadian rhythm. Hyperuricemia (HUA) is associated with cardiometabolic disorders; however, its connection to CircS remains incompletely understood. This study aims to determine if HUA can serve as a biomarker for CircS. We analyzed the National Health and Nutrition Examination Survey (NHANES) data (2005–2020) from 27,410 adults. CircS was defined as the presence of at least five out of eight components, encompassing the traditional metabolic syndrome criteria plus three additional factors: short sleep duration, depression, and non-alcoholic fatty liver disease (NAFLD). HUA was set at serum uric acid levels >6 mg/dL (357 µmol/L) for females and >7 mg/dL (416 µmol/L) for males. Multivariable logistic regression identified predictors of CircS, and dose–response relationships were explored. Of 27,410 participants, 2076 (7.57%) had CircS. HUA was found to be the strongest independent predictor of CircS, with an odds ratio (OR) of 3.26 (95% uncertainty interval (UI) 2.80–3.80, p < 0.001). Other important risk factors included chronic kidney disease (CKD) (OR 2.80), female sex (OR 1.44), and smoking (OR 1.29). In addition, older age, lower educational level, and lower income were also linked with higher risk. Higher uric acid levels were consistently linked to metabolic components of CircS more strongly than to depression and short sleep. In conclusion, HUA is linked with a greater risk of CircS. Although testing is simple and widely available, it could be used for early risk detection. Future studies should determine if lowering uric acid improves circadian health.
1. Introduction
Circadian Syndrome (CircS) is an emerging clinical construct that extends beyond the traditional framework of Metabolic Syndrome (MetS) by integrating behavioral and neuropsychological dimensions associated with circadian rhythm disruption [1]. It is defined by the presence of at least five out of the following eight criteria: elevated triglycerides, reduced high-density lipoprotein cholesterol (HDL-C), non-alcoholic fatty liver disease (NAFLD), increased waist circumference, elevated fasting blood glucose, high blood pressure, short sleep duration, and depressive symptoms [2]. While MetS primarily addresses metabolic risk, CircS includes a broader perspective by including sleep and mood disturbances [1,3,4]. This growing understanding implies that the body’s circadian rhythm affects metabolic functions, hormones, and cardiac functions [5,6]. Therefore, it highlights the need for a more holistic framework in preventing and managing cardiometabolic diseases [3,7].
Hyperuricemia (HUA) is characterized by serum uric acid level greater than 6 mg/dL (357 µmol/L) in females and 7 mg/dL (416 µmol/L) in males [8]. In addition to being a byproduct of purine metabolism, uric acid has been implicated in several pathophysiological mechanisms that intersect with insulin resistance, type 2 diabetes, and hypertension [9]. HUA is increasingly regarded as a mediator of metabolic risk, often preceding MetS components, and its reduction may mitigate cardiometabolic risk [9,10]. However, the role of HUA within broader metabolic constructs such as CircS remains unclear, representing the gap that this study seeks to fill.
CircS and HUA are prevalent in the general population [11]. Although the prevalence of CircS is still being established, recent population-based studies have reported rates ranging from 31.5% in China to 32.9% in the United States [12,13]. On the other hand, HUA is estimated to affect approximately 21% of adults in the United States [6].
Clarifying whether hyperuricemia is associated with the development or progression of CircS represents an important gap with significant clinical relevance. Given the modifiable nature of serum uric acid through both lifestyle changes and pharmacological agents such as xanthine oxidase inhibitors [14,15], the potential for improving cardiometabolic health outcomes is vast. Exploring this relationship using predictive modeling could also clarify shared pathophysiological pathways between metabolic dysfunction and circadian disruption, paving the way for more integrated and personalized prevention strategies [3]. Hence, this study aims to assess whether HUA can serve as a predictor of CircS.
2. Results
2.1. Baseline Characteristics
Table 1 presents the baseline demographic, socioeconomic, and clinical characteristics of the study population, stratified by CircS status. Of the 27,410 participants, 2076 (7.57%) met CircS criteria. Participants with CircS were older (median 60.0 vs. 42.0 years, p < 0.001) and more often female (55.2% vs. 47.8%, p < 0.001). CircS prevalence was higher in the lowest income category (PIR < 1: 27.2% vs. 21.4%, p < 0.001) and among those with lower educational attainment. HUA was more prevalent in the CircS group (40.0% vs. 16.7%, p < 0.001). The prevalence of individual CircS components among participants is presented in the Supplementary Material (See Supplementary Figure S1).
Table 1.
Baseline demographic, socioeconomic, lifestyle, and clinical characteristics of the study population stratified by Circadian Syndrome status (n = 27,410).
Comparison of included and excluded participants demonstrated several statistically significant differences (See Supplementary Table S1). Excluded individuals were older (median age 52 vs. 44 years, p < 0.001) and more likely to be female. They also had lower educational attainment and lower income levels. Differences were observed across ethnic groups, although the distributions remained broadly comparable. In addition, excluded participants had a higher prevalence of hyperuricemia (45.2% vs. 16.7%) and chronic kidney disease (4.3% vs. 2.8%).
2.2. Primary Analysis
In the logistic regression model, HUA was the strongest independent predictor of CircS, with a 3.26-fold increase in odds, compared to normal serum uric acid levels (OR: 3.26; 95% UI: 2.80–3.80; p < 0.001). CKD also showed a strong association (OR: 2.80; 95% UI: 2.06–3.81; p < 0.001). Females showed increased odds compared to males (OR: 1.44; 95% UI: 1.24–1.68; p < 0.001). Age, modeled using restricted cubic splines, had a nonlinear effect: risk rose from young adulthood to midlife, then plateaued and slightly declined at older ages (see Supplementary Figure S2). Using Hispanic participants as the reference group, Black (OR: 0.49; 95% UI: 0.39–0.62; p < 0.001) and Other/Multiracial participants (OR: 0.53; 95% UI: 0.38–0.72; p < 0.001) demonstrated significantly lower odds of CircS, while no significant difference was observed among White participants.
Among lifestyle factors, alcohol intake was associated with reduced odds (OR: 0.59; 95% UI: 0.48–0.73; p < 0.001), while smoking was associated with increased odds (OR: 1.28; 95% UI: 1.10–1.50; p < 0.001). Graduate-level education lowered odds (OR: 0.54; 95% UI: 0.41–0.71; p < 0.001), whereas high school education showed no significant difference (OR: 1.03; p = 0.785). Socioeconomic status, measured by PIR, showed a gradient: participants with PIR ≥ 5 had lower odds (OR: 0.47; 95% UI: 0.36–0.61; p < 0.001), as did PIR 4–4.9 (OR: 0.56; 95% UI: 0.41–0.76; p < 0.001) with smaller, but significant, reductions for PIR 1–3.9. Diet quality was not significantly associated with CircS risk. Higher physical activity was linked to lower odds (OR: 0.99; 95% UI: 0.99–0.99; p = 0.010), despite the small per-unit estimate. To visually demonstrate the multifactorial nature of CircS, a forest plot was generated to display the predictive ORs from the logistic regression model (see Supplementary Table S2, Figure S3). The full multivariable logistic regression model is presented in Table 2.
Table 2.
Multivariable logistic regression model predicting Circadian Syndrome (CircS) using hyperuricemia and other demographic, socioeconomic, lifestyle, and clinical predictors (n = 13,782).
2.3. Secondary Analysis
2.3.1. Model Performance
The predictive performance of the final model was evaluated using the ROC curve and the Linktest. The model demonstrated good discrimination, with an area under the ROC curve (AUC) of 0.79, indicating a strong ability to distinguish between participants with and without CircS (see Supplementary Figure S4). Model specification was supported by the Linktest, showing that predicted values were significantly associated with the outcome while their squared terms were not, suggesting no evidence of misspecification (See Supplementary Table S3). Together, these results confirm the adequacy and robustness of the final predictive model.
2.3.2. Dose–Response Analysis with Individual Components:
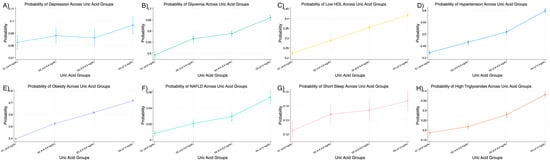
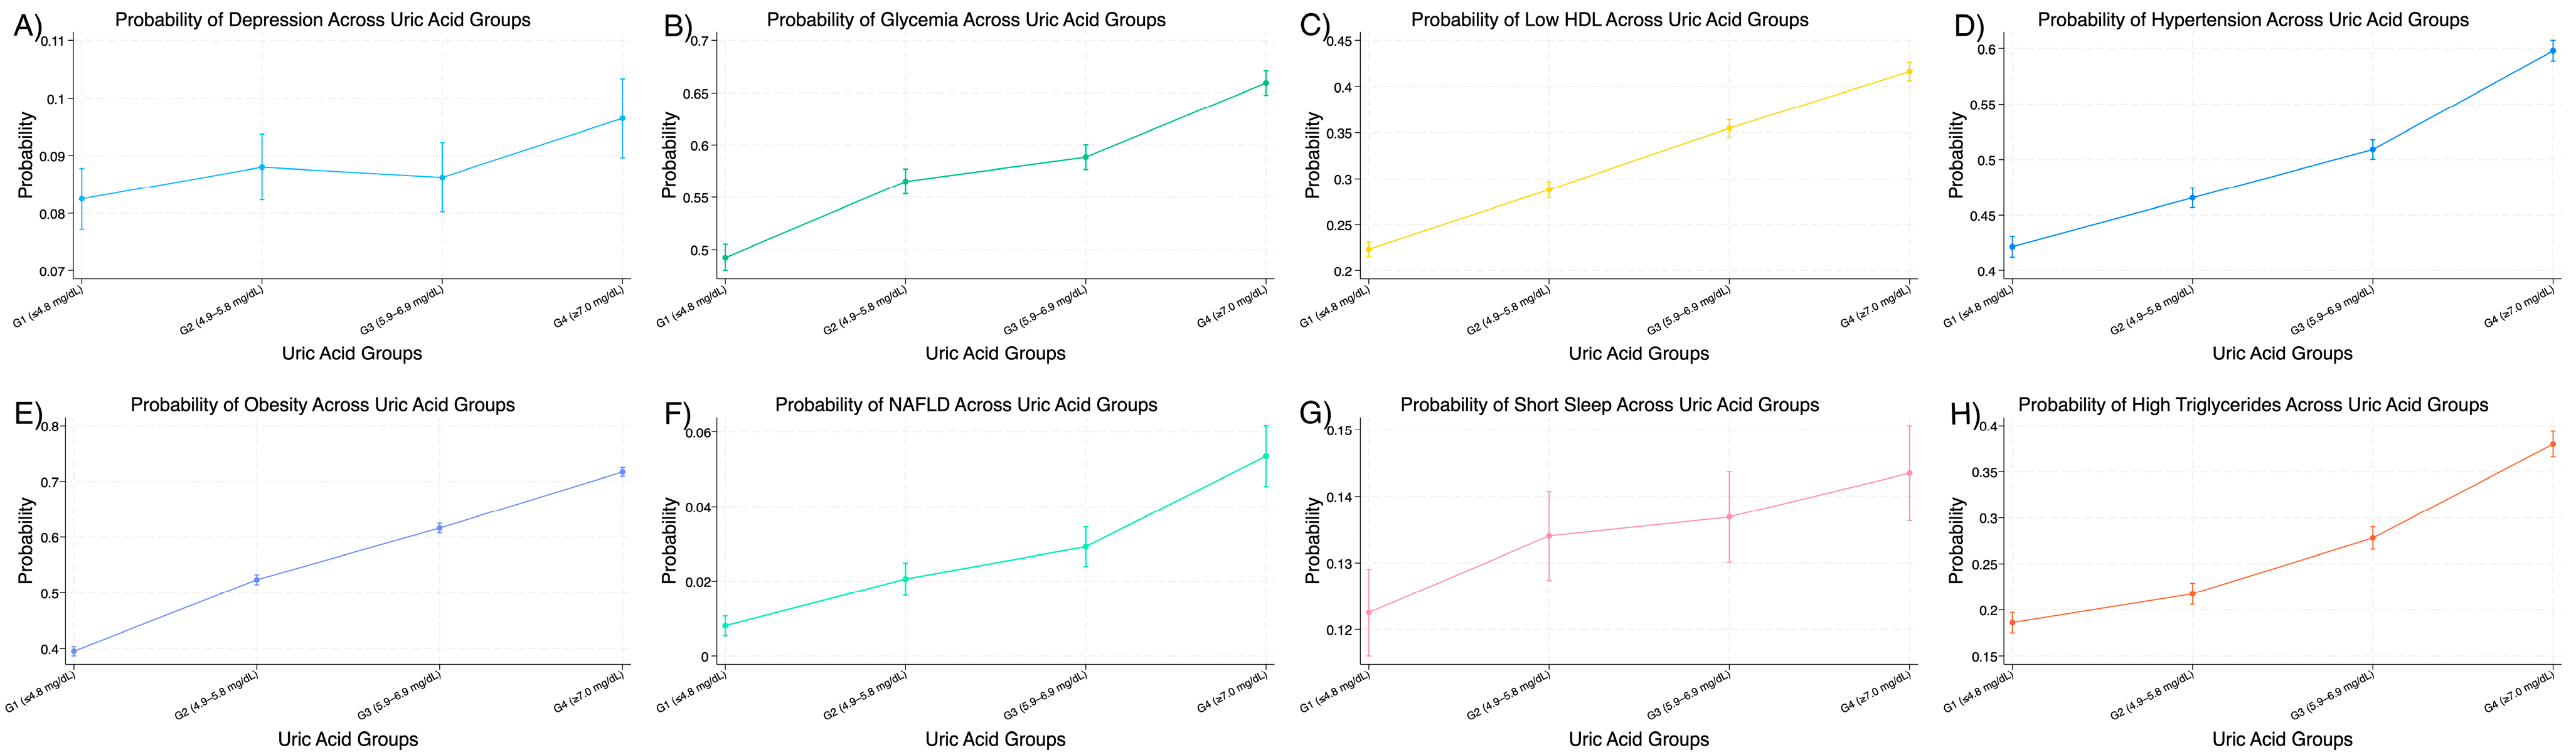
To explore the dose–response relationship between uric acid levels and the individual components of CircS, participants were categorized into 4 groups using quartiles based on serum uric acid concentration: G1 (≤4.8 mg/dL (≤286 µmol/L)), G2 (4.9–5.8 mg/dL (292–345 µmol/L)), G3 (5.9–6.9 mg/dL (351–410 µmol/L)), and G4 (≥7.0 mg/dL (≥416 µmol/L))(see Figure 1).
Figure 1.
Probability of individual components of Circadian Syndrome (CircS) across serum uric acid Groups (G1–G4). Panels (A–H) illustrate the estimated probability of (A) depression, (B) glycemia, (C) low HDL cholesterol, (D) hypertension, (E) obesity, (F) non-alcoholic fatty liver disease (NAFLD), (G) short sleep duration, and (H) high triglycerides across increasing uric acid groups (e.g., G1–G4). Data are presented as predicted probabilities with error bars representing 95% confidence intervals. Uric acid groups were categorized into quartiles based on serum uric acid levels. The total sample size was n = 27,410, with group-specific sample sizes provided where applicable. Abbreviations: HDL, high-density lipoprotein; NAFLD, non-alcoholic fatty liver disease.
Visual inspection of the probabilities across uric acid groups revealed a consistent upward trend for several CircS components. Groups with higher uric acid levels were associated with progressively greater probability of hypertension (from ~0.42 in G1 to ~0.6 in G4), hyperglycemia (~0.47 to ~0.68), hypertriglyceridemia (~0.18 to ~0.38), low HDL cholesterol (~0.23 to ~0.41), obesity (~0.4 to ~0.72), and NAFLD (~0.01 to ~0.05). These findings suggest the relationship of progressive increase in uric acid levels and the development of different CircS components.
For short sleep duration, a modest and less consistent upward trend was observed with relatively wide uncertainty intervals, indicating potential variability or instability in the relationship. Similarly, the association with depressive symptoms appeared weak, with overlapping uncertainty intervals and minimal separation across groups.
In addition to analyzing uric acid levels by quartiles, dose–response relationships were also assessed using uric acid as a continuous variable (see Supplementary Figure S5). Both approaches showed consistent positive associations with individual components of CircS, reinforcing a graded and robust relationship. Full regression outputs for these analyses are presented in Supplementary Tables S4–S19.
To assess the robustness of the association between HUA and CircS, a sensitivity analysis was conducted using three alternative definitions of elevated uric acid levels based on varying sex-specific thresholds: Model A (>7.0 mg/dL (416 µmol/L) for males, >6.0 mg/dL (357 µmol/L) for females), Model B (>6.8 mg/dL (405 µmol/L) for males, >5.7 mg/dL (339 µmol/L) for females), and Model C (>7.5 mg/dL (446 µmol/L) for males, >6.5 mg/dL (387 µmol/L) for females). A forest plot displaying the results yielded consistently elevated ORs, ranging from 3 to 3.5 approximately (see Supplementary Figure S6). This consistency across multiple thresholds confirms the stability and robustness of the predictive association between uric acid levels and CircS. Full regression outputs for the three models are provided in Supplementary Tables S20–S22.
In the 10% random subsample analysis, hyperuricemia remained significantly associated with circadian syndrome (OR 3.03, 95% CI 1.73–5.31), with effect estimates comparable to the primary analysis. Model diagnostics demonstrated acceptable discrimination and no evidence of misspecification (Supplementary Tables S23–S25, Figure S7).
3. Discussion
This study supports that hyperuricemia is a significant predictor of CircS, extending prior evidence beyond MetS by incorporating behavioral, neuropsychological, and clinical factors, and highlighting its potential utility as a predictive biomarker.
Our study contributes to the growing evidence on the association between CircS and HUA, while offering several distinct strengths. Mao et al. (2025) reported a significant association between CircS and HUA (OR = 1.23; 95% CI: 1.07–1.40) using a 7-component CircS definition [16]. In comparison, we used an 8-component CircS definition by including NAFLD, which adds metabolic relevance. The robustness of our findings was supported by comprehensive dose–response, sensitivity, and subsample validation analyses. Our results are consistent with Zhang et al. (2025), who found that short sleep (OR = 1.10) and daytime napping (OR = 1.34) were associated with HUA [17]. Findings from Raya-Cano et al. (2022) and Darmawan et al. (2017) also support the link between HUA, metabolic syndrome, and NAFLD [18,19]. In contrast, Wang et al. (2018) reported a negative association between serum uric acid and depression, which our study did not assess [9]. These differences highlight the importance of expanding CircS definitions and tailoring research to regional and demographic contexts to better capture early metabolic risk.
HUA is increasingly recognized as a potential biomarker of CircS, reflecting underlying circadian–metabolic interactions rather than direct measures of circadian disruption. Previous studies suggest that elevated uric acid promotes oxidative stress, inflammasome activation (e.g., NLRP3), and endothelial dysfunction, contributing to cardiometabolic disorders and symptom clustering in CircS [20,21]. Uric acid also interacts with circadian regulation: monosodium urate crystals disrupt immune cell clock function, while serum uric acid shows diurnal variation regulated by circadian genes controlling renal transporters [22,23]. Short sleep is further linked to oxidative stress and HUA [24,25], which may reflect a bidirectional relationship contributing to both circadian and metabolic dysregulation [26,27]. Collectively, these mechanisms support HUA as a plausible biomarker of CircS [6,28]. However, as this study was conducted within a predictive modeling framework, which prioritizes predictive performance over causal inference, caution is required when interpreting potential biological mechanisms underlying these associations.
The stronger association between HUA and CircS in females may reflect sex-specific differences in uric acid metabolism. Estrogen promotes renal uric acid clearance, and its decline after menopause can elevate serum levels, compounding risks of metabolic and circadian disruption [29,30]. Notably, the elevated risk observed in individuals with normal BMI suggests HUA may act as an early metabolic warning sign, which is consistent with the metabolically unhealthy normal weight (MUNW) phenotype [30,31]. This underscores the value of HUA for early risk stratification beyond traditional anthropometric measures.
Several predictors emerged as significant risk factors of CircS, underscoring its multifaceted nature. Advancing age was strongly linked to higher odds of CircS, consistent with aging-related attenuation of circadian rhythms and associated metabolic and sleep disturbances [32,33]. Higher odds in females may reflect hormonal influences on metabolism and sleep, as well as differences in the expression of CircS components, such as depressive symptoms [34]. Conversely, lower odds among Black and multiracial participants compared with Hispanic individuals suggest the influence of genetic, environmental, and social determinants of health. These differences may reflect variations in dietary habits, sleep patterns, socioeconomic conditions, healthcare access, and other unmeasured factors. Although our analysis adjusted for key confounders, residual confounding cannot be excluded and warrants further investigation.
CKD was a strong independent predictor of CircS, reflecting the close link between renal, metabolic, and circadian functions. CKD has been associated with chronic metabolic dysfunction, including HUA, and may also be linked to circadian disruption through shared regulatory pathways [35,36]. Smoking was also associated with higher odds of CircS, consistent with its role in driving inflammation, oxidative stress, and circadian disruption [37,38]. Alcohol intake was linked to lower odds, though this may reflect underreporting, measurement limitations, or behavioral changes following diagnosis.
Socioeconomic status, indicated by education and PIR, showed a favorable gradient with higher levels linked to lower odds of CircS. This highlights the impact of social determinants on health [39,40]. Higher education and economic stability often correlate with better health literacy, access to nutritious food, promotion of physical activity, reduced stress, improved sleep, and supporting metabolic and circadian homeostasis.
The lack of association between the Healthy Eating Index (HEI-2015) and CircS may reflect limitations in measurement rather than the absence of effect. Specifically, the HEI captures dietary quality but does not account for circadian-relevant behaviors such as meal timing and chrono-nutrition, which may influence circadian and metabolic regulation.
The findings have important public health and clinical implications. HUA emerges as a potential biomarker for CircS with utility in early risk stratification, provided that these results are validated in future prospective and clinical studies [41,42]. Its widespread availability and modifiability through lifestyle or pharmacologic interventions make it a low-cost tool to identify at-risk patients. The multifactorial nature of CircS, reflected in demographic, socioeconomic, lifestyle, and clinical predictors, underscores the need for multidimensional interventions, including addressing social determinants, promoting sleep hygiene, managing stress, and encouraging balanced diets [43,44].
3.1. Limitations
A substantial proportion of participants were excluded due to missing data. Importantly, excluded individuals differed from those included in several key demographic and clinical characteristics, including age, socioeconomic status, and prevalence of hyperuricemia and CKD. These findings suggest that missingness may not be completely at random and could introduce selection bias. However, the consistency of the observed associations across multiple sensitivity analyses supports the robustness of the study findings.
Several methodological limitations should also be acknowledged. First, the cross-sectional design precludes causal inference, and the reliance on single-time-point measurements of uric acid and CircS components may not fully capture long-term patterns. In addition, several variables, including sleep, alcohol consumption, dietary intake, and physical activity, -were assessed using self-reported questionnaires. Although commonly used in epidemiological research, these measures are subject to recall and social desirability bias, which may lead to misclassification and attenuation of effect estimates. In particular, the alcohol intake variable, defined using fixed daily thresholds, may not adequately capture important consumption patterns such as binge drinking or distinguish between never, former, and current drinkers, thereby reducing measurement precision.
Similarly, physical activity was assessed using self-reported data, which may underestimate its true physiological impact. Future studies incorporating objective measures, such as actigraphy, are warranted to better characterize the relationship between physical activity and CircS. A key limitation is that depression was assessed using the PHQ-9, which, while validated for symptom severity, is not a diagnostic tool and does not capture functional impairment; therefore, clinically diagnosed depression cannot be confirmed. Cirrhosis was initially considered as a covariate but was excluded from the final analyses due to substantial missing data.
Finally, the absence of objective circadian markers, such as melatonin levels, actigraphy, or light exposure data, as well as genetic and hormonal measures, limits our ability to directly assess circadian rhythm disruption. Consequently, the observed associations may partly reflect broader metabolic dysfunction rather than circadian-specific effects. Additionally, unmeasured confounders, including chronotype, shift work, and genetic variation in circadian-related pathways, may have influenced the observed relationships.
To ensure appropriate interpretation of our findings, circadian-related claims should be approached with caution. Although Circadian Syndrome (CircS) incorporates behavioral and psychological components linked to circadian rhythm disturbances, the NHANES dataset lacks objective circadian measures. Therefore, the associations observed in this study should be interpreted as reflecting relationships with circadian–metabolic syndrome indicators rather than direct evidence of circadian disruption. Furthermore, the cross-sectional design limits causal inference and precludes mechanistic conclusions. Nevertheless, the robustness of our results is supported by multiple sensitivity analyses, dose–response assessments, and subsample validation. Future research should employ prospective and longitudinal designs incorporating objective circadian phenotyping, such as actigraphy, melatonin and cortisol profiling, light exposure measurements, and chronotype assessments, to elucidate causal pathways and underlying biological mechanisms.
3.2. Strength
This study has several notable strengths. First, it utilized a large, nationally representative sample from the National Health and Nutrition Examination Survey (NHANES), enhancing the generalizability of the findings to the U.S. adult population. Second, the comprehensive evaluation of demographic, socioeconomic, lifestyle, and clinical variables allowed for rigorous multivariable adjustment and minimized potential confounding. Third, the use of standardized laboratory measurements for serum uric acid ensured high data reliability and reproducibility. Fourth, the study incorporated a multidimensional definition of Circadian Syndrome (CircS), integrating metabolic, behavioral, and psychological components to provide a holistic assessment of circadian–metabolic health. Additionally, the robustness of the findings was reinforced through multiple analytical approaches, including dose–response analyses, sensitivity analyses using alternative hyperuricemia thresholds, and validation using a 10% random subsample. Finally, by evaluating hyperuricemia within the broader CircS framework, this study offers novel insights into the interplay between metabolic and circadian health and supports the potential utility of serum uric acid as a clinically accessible biomarker for early risk stratification.
4. Materials and Methods
4.1. Study Design and Sample Selection
This study utilized publicly available data from the National Health and Nutrition Examination Survey (NHANES), National Center for Health Statistics, Centers for Disease Control and Prevention (CDC), Hyattsville, MD, USA. NHANES, is a cross-sectional survey designed to assess the health and nutritional status of people living in the United States [45]. Data is gathered through interviews, comprehensive questionnaires, laboratory testing, and physical assessments [2]. The study is ethically overseen by the National Center for Health Statistics, Institutional Ethics Review Board, and all participants provide written informed consent. Detailed information about the survey’s data and procedures can be found at https://wwwn.cdc.gov/nchs/nhanes/Default.aspx (accessed on 20 January 2025).
This cross-sectional study utilized data from seven consecutive NHANES cycles (2005–2020), initially comprising 76,496 participants. Individuals under 18 years of age (n = 30,516) were excluded, as were those with missing data on serum uric acid (n = 28,577) or CircS status (n = 18,570). After applying exclusion criteria, a total of 27,410 participants were retained for analysis.
To assess potential selection bias arising from missing data, we compared baseline characteristics between included and excluded participants.
4.2. Predictors
The primary outcome analysis incorporated the following variables as Predictors.
4.2.1. Uric Acid Levels
Uric acid was quantified from serum samples using enzymatic colorimetric assays, a standard clinical laboratory method [46]. Patients with HUA were defined by having a serum uric acid level greater than 6 mg/dL (357 µmol/L) in females and 7 mg/dL (416 µmol/L) in males [47].
4.2.2. Demographics
Demographic information was obtained through self-report, including gender, age (years), ethnicity (Hispanic, white, black, and others/multi-racial), educational level, and socioeconomic status. Socioeconomic status was assessed using the level of education and the poverty income ratio (PIR), which was calculated by dividing a family’s income by the appropriate family poverty threshold that corresponds to the family’s size, year, and state. PIR was then grouped into six categories, with higher values reflecting greater economic stability.
4.2.3. Lifestyle Factors & Clinical Predictors
Diet quality was assessed using the Healthy Eating Index–2015 (HEI-2015), which measures adherence to the 2015–2020 Dietary Guidelines for Americans across 13 components. Total scores range from 0 to 100, with higher scores indicating better diet quality. Participants were classified as having healthy (HEI ≥ 67.6), moderate (HEI 51.2–67.5), or poor (HEI ≤ 51.1) diet quality, based on thresholds derived from NHANES percentile distributions [48].
Physical activity was measured using the Global Physical Activity Questionnaire (GPAQ), which captures activity across occupational, transport, and recreational domains. Activities were assigned MET values: 8 METs for vigorous-intensity and 4 METs for moderate-intensity or transport-related activity. Total weekly MET-hours were calculated accordingly [49,50].
Smoking status was determined via self-reported responses to NHANES questionnaires. Alcohol consumption was categorized as low-risk or at-risk, using sex-specific thresholds: men reporting > 4 drinks/day and women > 3 drinks/day were classified as at-risk drinkers [51]. Chronic Kidney Disease (CKD) status was derived from self-reported physician diagnosis.
4.3. Outcome Measure: Circadian Syndrome Status
CircS was defined by the presence of at least five out of eight diagnostic components [2]. These included: (1) depressive symptoms, identified by a Patient Health Questionnaire (PHQ-9) score of ≥10, indicating moderate to severe depression [52]; (2) short sleep duration, defined as self-reported sleep of less than 6 h per night [53], and (3) non-alcoholic fatty liver disease (NAFLD), which was assessed using the United States Fatty Liver Index (US-FLI) [54] with a score of ≥30 considered diagnostic in the absence of other liver disease etiologies, such as heavy alcohol consumption (>4 standard drinks/day (56 g ethanol/day) for men and >3 (42 g/day) for women) [51], hepatitis B infection (HBsAg positive), or hepatitis C infection (HCV RNA positive). The remaining five components correspond to the standard criteria for Metabolic Syndrome (MetS) [55]: (4) elevated waist circumference (≥102 cm in men and ≥88 cm in women); (5) elevated blood pressure (systolic ≥130 mm Hg and/or diastolic ≥85 mm Hg) or current use of antihypertensive medication; (6) low HDL cholesterol (<1 mmol/L (40 mg/dL) in men and <1.3 mmol/L (50 mg/dL) in women) or use of medication for low HDL-C; (7) elevated triglycerides (≥150 mg/dL(1.7 mmol/L)) or use of medication for hypertriglyceridemia; and (8) elevated fasting plasma glucose (≥100 mg/dL (5.6 mmol/L)), use of glucose-lowering medication, or a diagnosis of diabetes or prediabetes.
4.4. Statistical Analyses
The primary aim is to evaluate whether HUA can serve as a predictor of CircS. Hence, we employed a predictive modeling approach using logistic regression. Prediction modeling emphasizes assessing predictive accuracy rather than causal inference, making it appropriate for assessing the utility of HUA as a potential biomarker in clinical risk stratification
Categorical variables were summarized as frequencies (n) and percentages (%). For continuous variables, normality was assessed using histograms; however, all were found to be non-normally distributed; therefore, they were reported as medians with interquartile ranges (IQR). Group comparisons were conducted using Pearson’s chi-squared test for categorical variables and the Wilcoxon rank-sum test for continuous variables. Data was visualized using bar graphs and line graphs as appropriate.
To account for potential nonlinearity in the relationship between age and outcomes, age was modeled using restricted cubic splines with four knots, following recommended practices in regression modeling strategies [56]. This flexible approach captures complex associations without imposing a strict linear or quadratic form. All multivariable models were adjusted for age using these spline terms. For simplicity and clarity, age was modeled as a linear covariate in visual presentations, such as forest plots.
To evaluate the extent to which the study data diverged from the tested hypothesis (a population model assuming no effect), p-values were calculated. A smaller p-value indicated greater statistical divergence from the tested hypothesis. Results with p-values below the predefined threshold of 0.05 were described as statistically divergent, suggesting that random error alone may not adequately explain the observed findings. In addition to p-values, point estimates and their corresponding 95% uncertainty intervals (UIs) were reported. The 95% UI reflects the range of test hypotheses for which the observed data lie within the central 95% of their predicted distribution, representing models that remain plausible explanations for the data [57].
To assess predictive performance, a Receiver Operating Characteristic (ROC) curve was generated, and the area under the curve (AUC) was computed. Model specification was evaluated using the Linktest. For dose–response exploration, the relationship between serum uric acid and individual components of CircS was examined by modeling uric acid both as a continuous variable and in quartiles. Quartile cutoffs were defined based on the sample distribution. A sensitivity analysis was conducted using three alternative definitions of HUA, applying varying sex-specific serum uric acid thresholds to test the robustness of associations. All statistical analyses were performed using Stata version SE18.5 (Stata Corp., College Station, TX, USA).
Finally, the robustness of the primary findings was examined using a 10% random subsample of the study population, which was analyzed using the same multivariable logistic regression model. Results of this validation analysis are presented in the Supplementary Material (Supplementary Tables S23–S25, Figure S7).
5. Conclusions
HUA was independently associated with CircS, highlighting its relationship with circadian-related indicators. Its accessibility and modifiability make it a potential biomarker for early risk stratification. Future research should investigate the causal relationship and evaluate whether interventions targeting uric acid levels influence circadian and metabolic health outcomes in longitudinal or experimental settings.
Supplementary Materials
The following supporting information can be downloaded at: https://www.mdpi.com/article/10.3390/clockssleep8020033/s1.
Author Contributions
Conceptualization, H.H.F. and S.M.Z.; methodology, N.A.-M.; software, J.A. and H.Z.; validation, J.A., H.Z. and H.H.F.; formal analysis, J.A. and H.Z.; investigation, J.A. and H.Z.; resources, H.H.F. and S.M.Z.; data curation, J.A. and H.Z.; writing—original draft preparation, R.O. (Introduction), A.A.-T. (Results), N.A.-M. (Methodology), M.A.H. and R.J. (Discussion), S.A.-K. (Conclusion); writing—review and editing, J.A., H.Z. and H.H.F.; visualization, A.A.-T.; supervision, H.H.F. and S.M.Z.; project administration, H.H.F.; funding acquisition, not applicable. All authors have read and agreed to the published version of the manuscript.
Funding
This research received no external funding.
Institutional Review Board Statement
This study is a secondary analysis of publicly available NHANES data; there is no separate IRB approval specific to this analysis. The ethical approval pertains to the original NHANES data collection, which was reviewed and approved by the National Center for Health Statistics (NCHS) Ethics Review Board (ERB), which ensures the protection of all human participants in NCHS studies and surveys. The NHANES protocols, including current and past protocols, are reviewed and approved by the NCHS ERB.
Informed Consent Statement
Patient consent was waived due to the use of publicly available, de-identified data from NHANES. Informed consent was obtained from all participants by NHANES during the original data collection.
Data Availability Statement
Publicly available datasets were analyzed in this study. These data can be found in the National Health and Nutrition Examination Survey (NHANES) repository, hosted by the Centers for Disease Control and Prevention (CDC): https://wwwn.cdc.gov/nchs/nhanes/ (accessed on 20 January 2025).
Conflicts of Interest
The authors declare no conflicts of interest.
Abbreviations
The following abbreviations are used in this manuscript:
| AUC | Area Under the Curve |
| BMI | Body Mass Index |
| CDC | Centers for Disease Control and Prevention |
| CI | Confidence Interval |
| CircS | Circadian Syndrome |
| CKD | Chronic Kidney Disease |
| HDL-C | High-Density Lipoprotein Cholesterol |
| HEI-2015 | Healthy Eating Index–2015 |
| HUA | Hyperuricemia |
| HCV | Hepatitis C Virus |
| HBsAg | Hepatitis B Surface Antigen |
| IQR | Interquartile Range |
| MET | Metabolic Equivalent of Task |
| MetS | Metabolic Syndrome |
| MUNW | Metabolically Unhealthy Normal Weight |
| NAFLD | Non-Alcoholic Fatty Liver Disease |
| NCHS | National Center for Health Statistics |
| NHANES | National Health and Nutrition Examination Survey |
| OR | Odds Ratio |
| PHQ-9 | Patient Health Questionnaire-9 |
| PIR | Poverty Income Ratio |
| ROC | Receiver Operating Characteristic |
| UI | Uncertainty Interval |
| US-FLI | United States Fatty Liver Index |
References
- Zimmet, P.; Alberti, K.; Stern, N.; Bilu, C.; El-Osta, A.; Einat, H.; Kronfeld-Schor, N. The Circadian Syndrome: Is the Metabolic Syndrome and much more! J. Intern. Med. 2019, 286, 181–191. [Google Scholar] [CrossRef] [Scilit] [PubMed]
- Arabi, A.A.; Nasrallah, D.; Mohsen, S.; Abugharbieh, L.; Al-Hashimi, D.; AlMass, S.; Albasti, S.; Al-Ajmi, S.A.; Khan, M.N.; Zughaier, S.M. Association between Serum Vitamin D Status and Circadian Syndrome: A Cross-Sectional Study. Nutrients 2024, 16, 2111. [Google Scholar] [CrossRef] [Scilit] [PubMed]
- Maury, E.; Ramsey, K.M.; Bass, J. Circadian rhythms and metabolic syndrome: From experimental genetics to human disease. Circ. Res. 2010, 106, 447–462. [Google Scholar] [CrossRef] [Scilit] [PubMed]
- Germain, A.; Kupfer, D.J. Circadian rhythm disturbances in depression. Hum. Psychopharmacol. 2008, 23, 571–585. [Google Scholar] [CrossRef] [Scilit] [PubMed]
- Kanbay, M.; Jensen, T.; Solak, Y.; Le, M.; Roncal-Jimenez, C.; Rivard, C.; Nakagawa, T.; Johnson, R.J. Uric acid in metabolic syndrome: From an innocent bystander to a central player. Eur. J. Intern. Med. 2016, 29, 3–8. [Google Scholar] [CrossRef] [Scilit]
- Du, L.; Li, H.; Zhang, X.; Zhang, Y.; Wang, Y. Hyperuricemia and its related diseases: Mechanisms and advances in therapy. Signal Transduct. Target. Ther. 2024, 9, 212. [Google Scholar] [CrossRef] [Scilit]
- Shi, Z.; Tuomilehto, J.; Kronfeld-Schor, N.; Alberti, G.K.; Stern, N.; El-Osta, A.; Bilu, C.; Einat, H.; Zimmet, P. The circadian syndrome predicts cardiovascular disease better than metabolic syndrome in Chinese adults. J. Intern. Med. 2021, 289, 851–860. [Google Scholar] [CrossRef] [Scilit]
- Soltani, Z.; Rasheed, K.; Kapusta, D.R.; Reisin, E. Potential role of uric acid in metabolic syndrome, hypertension, kidney injury, and cardiovascular diseases: Is it time for reappraisal? Curr. Hypertens. Rep. 2013, 15, 175–181. [Google Scholar] [CrossRef] [Scilit]
- Wang, H.; Zhang, H.; Sun, L.; Guo, W. Roles of hyperuricemia in metabolic syndrome and cardiac-kidney-vascular system diseases. Am. J. Transl. Res. 2018, 10, 2749–2763. [Google Scholar]
- American Academy of Family Physicians. Gout and Hyperuricemia. Am. Fam. Physician 1999, 59, 925–928. [Google Scholar]
- Lubawy, M.; Formanowicz, D. High-Fructose Diet-Induced Hyperuricemia Accompanying Metabolic Syndrome-Mechanisms and Dietary Therapy Proposals. Int. J. Env. Res. Public Health 2023, 20, 3596. [Google Scholar] [CrossRef] [Scilit]
- Liang, H.; Zheng, J.; Sun, Y. Prevalence and risk factors associated with circadian syndrome in community-dwelling middle-aged to older adults: Based on health ecology model. Sleep Med. 2024, 119, 210–213. [Google Scholar] [CrossRef] [Scilit]
- Xiao, Y.; Yin, S.; Wang, J.; Cui, J.; Yang, Z.; Wang, J.; Bai, Y. A positive association between the prevalence of circadian syndrome and overactive bladder in United States adults. Front. Public Health 2023, 11, 1137191. [Google Scholar] [CrossRef] [Scilit]
- Cicero, A.F.G.; Fogacci, F.; Cincione, R.I.; Tocci, G.; Borghi, C. Clinical Effects of Xanthine Oxidase Inhibitors in Hyperuricemic Patients. Med. Princ. Pract. 2021, 30, 122–130. [Google Scholar] [CrossRef] [Scilit] [PubMed]
- Wang, D.; Chen, L.; Shi, W.; Zhang, T. Association of circadian syndrome with risk of hyperuricemia among middle-aged and older adults in China: The first nationwide cohort study. Public Health 2025, 238, 23–28. [Google Scholar] [CrossRef] [Scilit] [PubMed]
- Mao, H.; Huang, S.; Lin, T.; Ding, Y.; Yang, Z. Exploring the relationship between circadian syndrome, serum uric acid levels, and hyperuricemia: Evidence from NHANES 2005–2018. Sci. Rep. 2025, 15, 28984. [Google Scholar] [CrossRef] [Scilit] [PubMed]
- Zhang, X.; Wei, G.; Zhang, X.; Guo, J.; Zhao, J.; Li, X.; Zhao, X.; Shi, J.; Yang, Y.; Fan, S.; et al. Association of Sleep Duration and Daytime Napping With Risk of Hyperuricemia: A Systematic Review and Meta-Analysis. Int. J. Rheum. Dis. 2025, 28, e70050. [Google Scholar] [CrossRef] [Scilit]
- Raya-Cano, E.; Vaquero-Abellán, M.; Molina-Luque, R.; De Pedro-Jiménez, D.; Molina-Recio, G.; Romero-Saldaña, M. Association between metabolic syndrome and uric acid: A systematic review and meta-analysis. Sci. Rep. 2022, 12, 18412. [Google Scholar] [CrossRef] [Scilit]
- Darmawan, G.; Hamijoyo, L.; Hasan, I. Association between Serum Uric Acid and Non-Alcoholic Fatty Liver Disease: A Meta-Analysis. Acta Med. Indones. 2017, 49, 136–147. [Google Scholar]
- Wu, H.; Dai, R.; Wang, M.; Chen, C. Uric acid promotes myocardial infarction injury via activating pyrin domain-containing 3 inflammasome and reactive oxygen species/transient receptor potential melastatin 2/Ca(2+)pathway. BMC Cardiovasc. Disord. 2023, 23, 10. [Google Scholar] [CrossRef] [Scilit]
- Shubietah, A.; Awashra, A.; Milhem, F.; Ghannam, M.; Hattab, M.; Rajab, I.; Neiroukh, H.; Zahdeh, M.; Nouri, A.; Assaassa, A.; et al. Hyperuricemia and Cardiovascular Risk: Insights and Implications. Crit. Pathw. Cardiol. 2025, 24, e0388. [Google Scholar] [CrossRef] [Scilit] [PubMed]
- Kanemitsu, T.; Tsurudome, Y.; Kusunose, N.; Oda, M.; Matsunaga, N.; Koyanagi, S.; Ohdo, S. Periodic variation in bile acids controls circadian changes in uric acid via regulation of xanthine oxidase by the orphan nuclear receptor PPARα. J. Biol. Chem. 2017, 292, 21397–21406. [Google Scholar] [CrossRef] [Scilit]
- Shimizu, M.; Naito, R.; Sato, A.; Ishiwata, S.; Yatsu, S.; Shitara, J.; Matsumoto, H.; Murata, A.; Kato, T.; Suda, S.; et al. Diurnal Variations in Serum Uric Acid, Xanthine, and Xanthine Oxidoreductase Activity in Male Patients with Coronary Artery Disease. Nutrients 2023, 15, 4480. [Google Scholar] [CrossRef] [Scilit]
- Yu, X.; Gong, S.; Chen, J.; Zhang, H.; Shen, Z.; Gu, Y.; Lv, S.; Zhang, D.; Wang, Y.; Ding, X.; et al. Short sleep duration increases the risk of hyperuricemia among Chinese adults: Findings from the China Health and Nutrition Survey. Sleep Med. 2021, 84, 40–45. [Google Scholar] [CrossRef] [Scilit] [PubMed]
- An, Y.; Li, X.; Ouyang, F.; Xiao, S. Association between nocturnal sleep duration and the risk of hyperuricemia among Chinese government employees: A cross-sectional study. Front. Public Health 2022, 10, 1055778. [Google Scholar] [CrossRef] [Scilit]
- Chou, Y.T.; Li, C.H.; Shen, W.C.; Yang, Y.C.; Lu, F.H.; Wu, J.S.; Chang, C.J. Association of sleep quality and sleep duration with serum uric acid levels in adults. PLoS ONE 2020, 15, e0239185. [Google Scholar] [CrossRef] [Scilit]
- Dai, Y.; Sun, X.; Zhang, G.; Cui, C.; Wu, X.; Aizezi, Y.; Kadier, K. Association between sleep duration, sleep trouble and all-cause mortality in individuals with hyperuricemia in the United States. Front. Public Health 2025, 13, 1521372. [Google Scholar] [CrossRef] [Scilit] [PubMed]
- Han, Y.; Yao, M.; Zhao, H.; Han, X.; Di, H.; Xie, T.; Wu, J.; Wang, Y.; Zhang, Y.; Zeng, X. Exploration of the Interrelationship Between Serum Uric Acid, Gout, and Cardiac, Renal, and Metabolic Conditions in Middle Aged and Older People. J. Am. Heart Assoc. 2025, 14, e038723. [Google Scholar] [CrossRef] [Scilit]
- Hak, A.E.; Choi, H.K. Menopause, postmenopausal hormone use and serum uric acid levels in US women--the Third National Health and Nutrition Examination Survey. Arthritis Res. Ther. 2008, 10, R116. [Google Scholar] [CrossRef] [Scilit]
- Xiao, Z.; Liu, H. The estrogen receptor and metabolism. Womens Health 2024, 20, 17455057241227362. [Google Scholar] [CrossRef] [Scilit]
- Vasco, J.; Tavares, M.; Mansilha, H.F. Association Between Hyperuricemia, Body Composition, and Comorbidities in an Obese Pediatric Population. J. Nutr. Metab. 2025, 2025, 2768062. [Google Scholar] [CrossRef] [Scilit]
- Yang, L.; He, Z.; Gu, X.; Cheng, H.; Li, L. Dose-Response Relationship Between BMI and Hyperuricemia. Int. J. Gen. Med. 2021, 14, 8065–8071. [Google Scholar] [CrossRef] [Scilit] [PubMed]
- Hood, S.; Amir, S. The aging clock: Circadian rhythms and later life. J. Clin. Invest. 2017, 127, 437–446. [Google Scholar] [CrossRef] [Scilit]
- Sui, X.; Church, T.S.; Meriwether, R.A.; Lobelo, F.; Blair, S.N. Uric acid and the development of metabolic syndrome in women and men. Metabolism 2008, 57, 845–852. [Google Scholar] [CrossRef] [Scilit] [PubMed]
- Mohandas, R.; Douma, L.G.; Scindia, Y.; Gumz, M.L. Circadian rhythms and renal pathophysiology. J. Clin. Invest. 2022, 132, e148277. [Google Scholar] [CrossRef] [Scilit] [PubMed]
- Xiong, Y.; Zhong, Q.; Zhang, Y.; Liu, Z.; Wang, X. The association between circadian syndrome and chronic kidney disease in an aging population: A 4-year follow-up study. Front. Endocrinol. 2024, 15, 1338110. [Google Scholar] [CrossRef] [Scilit]
- Hwang, J.W.; Sundar, I.K.; Yao, H.; Sellix, M.T.; Rahman, I. Circadian clock function is disrupted by environmental tobacco/cigarette smoke, leading to lung inflammation and injury via a SIRT1-BMAL1 pathway. FASEB J. 2014, 28, 176–194. [Google Scholar] [CrossRef] [Scilit]
- Numaguchi, S.; Esumi, M.; Sakamoto, M.; Endo, M.; Ebihara, T.; Soma, H.; Yoshida, A.; Tokuhashi, Y. Passive cigarette smoking changes the circadian rhythm of clock genes in rat intervertebral discs. J. Orthop. Res. 2016, 34, 39–47. [Google Scholar] [CrossRef] [Scilit]
- Coughlin, S.S.; Vernon, M.; Hatzigeorgiou, C.; George, V. Health Literacy, Social Determinants of Health, and Disease Prevention and Control. J. Environ. Health Sci. 2020, 6, 3061. [Google Scholar]
- Shayakhmetov, S.S.; Toguzbayeva, K.K.; Ismailova, A.A.; Tabibi, R.; Derbishalieva, Z.K.; Dzhusupov, K.O. Health Literacy of Rural Population of Kazakhstan. Iran. J. Public Health 2020, 49, 1269–1277. [Google Scholar] [CrossRef] [Scilit]
- Zhang, Z.; Pang, Y.; Shen, J.; Chen, W.; Hao, C.; Lei, Z. The new definition of metabolic syndrome including hyperuricemia improves its prognostic value: Results from NHANES database. BMC Cardiovasc. Disord. 2025, 25, 93. [Google Scholar] [CrossRef] [Scilit]
- Yanai, H.; Adachi, H.; Hakoshima, M.; Katsuyama, H. Molecular Biological and Clinical Understanding of the Pathophysiology and Treatments of Hyperuricemia and Its Association with Metabolic Syndrome, Cardiovascular Diseases and Chronic Kidney Disease. Int. J. Mol. Sci. 2021, 22, 9221. [Google Scholar] [CrossRef] [Scilit]
- Cockerham, W.C.; Hamby, B.W.; Oates, G.R. The Social Determinants of Chronic Disease. Am. J. Prev. Med. 2017, 52, S5–S12. [Google Scholar] [CrossRef] [Scilit]
- Smith, H.A.; Betts, J.A. Circadian rhythms, feeding patterns and metabolic regulation: Implications for critical care. Proc. Nutr. Soc. 2024, 85, 1–5. [Google Scholar] [CrossRef] [Scilit]
- National Health and Nutrition Examination Survey (NHANES III). NHANES III Plan and Operations Procedures Manuals CD-ROM: Draft; National Centers for Disease Control and Prevention: Atlanta, GA, USA, 1997. [Google Scholar]
- National Center for Health Statistics. NHANES Laboratory Procedures for Uric Acid Measurement, 2005–2020; U.S. Department of Health and Human Services, Centers for Disease Control and Prevention (CDC): Hyattsville, MD, USA, 2020. [Google Scholar]
- George, C.; Leslie, S.W.; Minter, D.A. Hyperuricemia. In StatPearls; StatPearls Publishing: Treasure Island FL, USA, 2025. Available online: https://www.ncbi.nlm.nih.gov/books/NBK459218/ (accessed on 3 May 2026).
- Krebs-Smith, S.M.; Pannucci, T.E.; Subar, A.F.; Kirkpatrick, S.I.; Lerman, J.L.; Tooze, J.A.; Wilson, M.M.; Reedy, J. Update of the Healthy Eating Index: HEI-2015. J. Acad. Nutr. Diet. 2018, 118, 1591–1602, Erratum in J. Acad. Nutr. Diet. 2018, 119, 1759. [Google Scholar] [CrossRef] [Scilit]
- Shi, Z.; Tuomilehto, J.; Kronfeld-Schor, N.; Alberti, G.; Stern, N.; El-Osta, A.; Chai, Z.; Bilu, C.; Einat, H.; Zimmet, P. The Circadian Syndrome Is a Significant and Stronger Predictor for Cardiovascular Disease than the Metabolic Syndrome-The NHANES Survey during 2005–2016. Nutrients 2022, 14, 5317. [Google Scholar] [CrossRef] [Scilit]
- Wang, J.; Wu, Y.; Ning, F.; Zhang, C.; Zhang, D. The Association between Leisure-Time Physical Activity and Risk of Undetected Prediabetes. J. Diabetes Res. 2017, 2017, 4845108. [Google Scholar] [CrossRef] [Scilit]
- National Institute on Alcohol Abuse and Alcoholism (NIAAA). Alcohol Drinking Patterns. Bethesda, MD, USA: National Institute on Alcohol Abuse and Alcoholism. Available online: https://www.niaaa.nih.gov/alcohols-effects-health/alcohol-drinking-patterns (accessed on 3 May 2026).
- Schueller, S.M.; Kuhn, E.; Fogg, B.F.; Dear, N.; Titov, N.; Mohr, D.C. Cut points on the Patient Health Questionnaire (PHQ-9) that predict response to cognitive-behavioral treatments for depression. Gen. Hosp. Psychiatry 2015, 37, 470–475. [Google Scholar] [CrossRef] [Scilit]
- Wang, Y.; Chen, M.L.; Chen, X. Short sleeping duration is associated with a higher risk of asymmetric handgrip strength among older Chinese males: A cross-sectional study evidence from the China health and retirement longitudinal study. Front. Public Health 2023, 11, 1246008. [Google Scholar] [CrossRef] [Scilit]
- Ballestri, S.; Lonardo, A.; Romagnoli, D.; Carulli, L.; Losi, L.; Day, C.P.; Loria, P. Ultrasonographic fatty liver indicator, a novel score which rules out NASH and is correlated with metabolic parameters in NAFLD. Liver Int. 2012, 32, 1242–1252. [Google Scholar] [CrossRef] [Scilit]
- Alberti, K.G.M.M.; Eckel, R.H.; Grundy, S.M.; Zimmet, P.Z.; Cleeman, J.I.; Donato, K.A.; Fruchart, J.C.; James, W.P.T.; Loria, C.M.; Smith, S.C. Harmonizing the metabolic syndrome: A joint interim statement. Circulation 2009, 120, 1640–1645. [Google Scholar] [CrossRef] [Scilit]
- Gauthier, J.; Wu, Q.V.; Gooley, T.A. Cubic splines to model relationships between continuous variables and outcomes: A guide for clinicians. Bone Marrow Transplant. 2020, 55, 675–680, Correction in Bone Marrow Transplant. 2023, 58, 962. [Google Scholar] [CrossRef] [Scilit]
- Zar, L.A.; Abdulmajeed, J.; Elshoeibi, A.M.; Syed, A.; Awaisu, A.; Glasziou, P. From Significance to Divergence: Guiding Statistical Interpretation Through Language. Curr. Opin. Epidemiol. Public Health 2025, 4, 30–39. [Google Scholar] [CrossRef] [Scilit]

Disclaimer/Publisher’s Note: The statements, opinions and data contained in all publications are solely those of the individual author(s) and contributor(s) and not of MDPI and/or the editor(s). MDPI and/or the editor(s) disclaim responsibility for any injury to people or property resulting from any ideas, methods, instructions or products referred to in the content. |
© 2026 by the authors. Licensee MDPI, Basel, Switzerland. This article is an open access article distributed under the terms and conditions of the Creative Commons Attribution (CC BY) license.