


Abstract
A B-spline Quasi-interpolation Empirical Mode Decomposition (BSQI-EMD) method is presented and applied to similarity analysis of DNA sequences. The B-spline quasi-interpolation is used to approximate the extrema envelopes during the Intrinsic Mode Function (IMF) sifting process. The BSQI-EMD method is simple, easy to implement, and does not require solving any linear system of equations. Then we implement the classic EMD method and our method respectively. This work verifies our method’s suitability and better performance for similarity/dissimilarity analysis among the coding sequences of the first exon of β-globin gene of ten different species.
1. Introduction
With the huge amount of biological sequences discovered in the post-genomic era, it is very significant to develop fast and accurate methods for evaluating sequence similarity. Unlike the traditional methods such as the alignment methods, which are relatively precise, but sometimes they are very complex and time-consuming, especially when the data are great. The graphical representation methods can give us a visual representation.
Graphical representations of DNA sequences were initiated by Hamori and Ruskin [1] and expanded by Nandy, Randić and others [2,3,4]. The advantage of graphical representation of DNA sequences is that they allow visual inspection of data, helping in recognizing major differences, comparing various structures, and making the analysis of similarity among DNA sequences. It has been shown that some of the graphical representations lead to numerical characterizations of DNA sequences and quantitative measures of the degree of similarity/dissimilarity between the sequences [5,6,7].
One can convert a DNA sequence into a one-dimensional or multi-dimensional discrete complex sequences by the graphical representations. This method can also be called signalization of a DNA sequence. The DNA sequence is in one to one correspondence with its numerical signal sequence, so if we want to analyze and compare the features and similarity of DNA sequences, the only thing that we need to do is to compare the features and investigate the similarity of their signal sequences.
EMD is a nonlinear, non-stationary signal processing method proposed by Norden Huang [8,9] et al. in 1998. With this method, a complicated data set can be decomposed into a small number of IMFs that admit well-behaved Hilbert transforms, with an additional residue. As the EMD method is one of the most popular tools in signal processing, we [10,11,12] have used the EMD method to make the similarity analysis among the long DNA sequences and the protein sequences [13].
However, in practice, the EMD has met several problems, such as boundary extension, curve fitting, stop criteria. In the classic EMD [8], one uses cubic spline functions to obtain the upper and lower envelopes of data. The cubic spline interpolating methods may produce large swings near the ends of data, which may make the decomposition of data inaccurate. Various methods are proposed to improve it. In [14], B-spline approach is proposed to fit the extremes of data, which improves the analytical performance. In [15], a rational spline EMD and flexible treatment of the end conditions are discussed. In [16], the TPS-RBF is made use of surface interpolation in bi-dimensional EMD.
An EMD method using the B-spline quasi-interpolation, abbreviated as the BSQI-EMD method, is first presented and used to compare the similarities among different species in this paper. Compared with the classic EMD method, our method is simple, easy to implement and showing better performance in similarity analysis of short DNA sequences. The paper is organized as follows: the B-spline quasi-interpolation is introduced and the BSQI-EMD method is proposed in Section 2, where the extrema envelopes are approximated by the B-spline quasi-interpolation during the IMF sifting process. A graphical representation method is introduced and similarity/dissimilarity analysis of DNA sequences by using the classic EMD method and our method is given in Section 3. We present the BSQI-EMD method and use it to carry out research on the similarities among the coding sequences of the first exon of β-globin gene of 10 different species respectively. Finally, we compare it with the EMD method.
2. The BSQI-EMD Method
2.1. Univariate B-spline Quasi-interpolation
Let I = [a, b], h = (b − a)/n, and Xn = {xi = a + ih, 0 ≤ i ≤ n} be a uniform partition, we denote Sd(I, Xn) to be the space of spline of degree d and class Cd−1 on Xn. A basis of this space is {Bj, j ∈ J}, with J = {1, 2, …, n + d}. The support of Bj is supp(Bj) = [xj−d−1, xj], and = {xj−d, …, xj−1} is denoted to be the collection of all the knots of Xn in the interior of supp(Bj). As usual, we add multiple knots at the endpoints: a = x−d = x−d+1 = ··· = x0 and b = xn = xn+1 = ··· = xn+d.
A univariate B-spline quasi-interpolation of degree d can be defined as operators of the form
where µj(s) is a linear combination of discrete values of s at some points in the neighborhood of supp(Bj) in [17,18]. Denote Πd to be the collection of univariate polynomials of degree ≤ d, and we impose that Qd is exact on the space Πd, i.e., Qdp = p, for all p ∈ Πd. Then the approximation order of Qd is hd+1.
For the determination of the functional µj(s)(j ∈ J), the exactness of Qd on Πd amounts to solve a system of linear equations. The main advantage of spline quasi-interpolation is that they have a direct construction without solving any system of linear equations. Moreover, they have local property, in other words, the value of Qds(x) depends on values of s in a neighborhood of x. Also, they have a rather small infinity norm, so that they are nearly optimal approximants.
Since the cubic spline has been used to the EMD method, we use cubic B-spline quasiinterpolation for the comparison in this paper. The coefficient functionals [18] of the cubic spline quasi-interpolation
are given as
where si = s(xi)(0 ≤ i ≤ n).
For s ∈ C4, we have the error estimate [18]
‖s − Q3s‖∞ = O(h4).
2.2. The BSQI-EMD Method
The EMD method is an algorithm for the analysis of nonlinear signals that runs by dividing them into a number of amplitude and frequency modulated zero mean signals, named Intrinsic Mode Functions (IMFs). By using this data-driven algorithm, a non-linear signal can be decomposed adaptively as follows:
where ci(x) is an IMF and rn(x) is the residue. Each IMF must satisfy the following two terms: (1) the number of extreme and the number of zero crossings must either be equal or differ by at most one in the whole data set; (2) at any point, the mean value of the envelope defined by the local maxima and the envelope defined by the local minima is close to zero.
Actually, the EMD method is a sifting process by extracting the IMFs from the signal until the residue being either the mean trend or a constant. At the same time, one can reconstruct the original signal just by adding all IMFs and the residue without any information loss.
We revise the EMD method by using the B-spline quasi-interpolation to approximate the extrema envelopes and name it the BSQI-EMD method. Compared with previous methods, which interpolate the envelopes, our method has the following advantages:
(1) It has an explicit expression (see Eq. (2) and Eq. (3)) and does not require solving any linear system of equations, so that we do not meet the question of the ill-condition of the matrix; (2) It has high accuracy (see Eq. (4)), and is easy to implement. Therefore, we can save computational time and decrease numerical errors.
3. Similarities/Dissimilarities among the Coding Sequences of the First Exon of β-gene of 10 Species
3.1. Graphical Representation for the Coding Sequences
In order to analyze the DNA sequence, we transform it into a one-dimensional or multi-dimensional discrete complex sequence by a graphical representation method. Thus, we can get a numerical signal sequence and a graph.
We assign A, T to +x-axis, and G and C to −x-axis, then we take [10,19,20] the map: A → x = +1, T → x = +2, G → x = −1, C → x = −2. Suppose that S = s1s2 ··· may be an arbitrary DNA sequence, si stands for a unit, then we can get a recursive formula as follows:
where s(xi) stands for a one-dimensional numerical sequence, d is a non-zero real number, and s(x0) = 0.
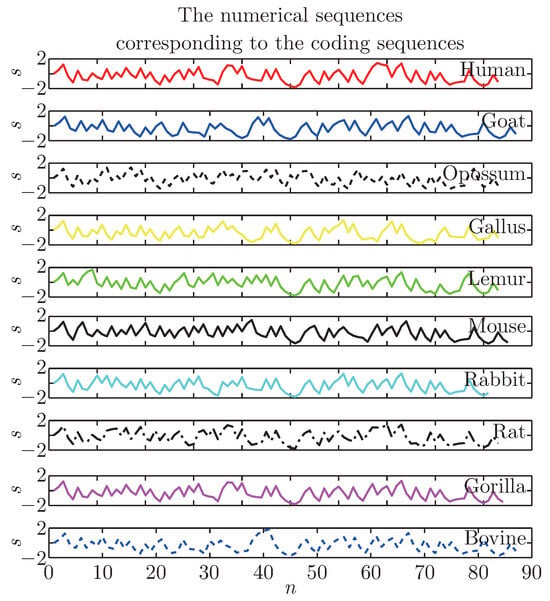
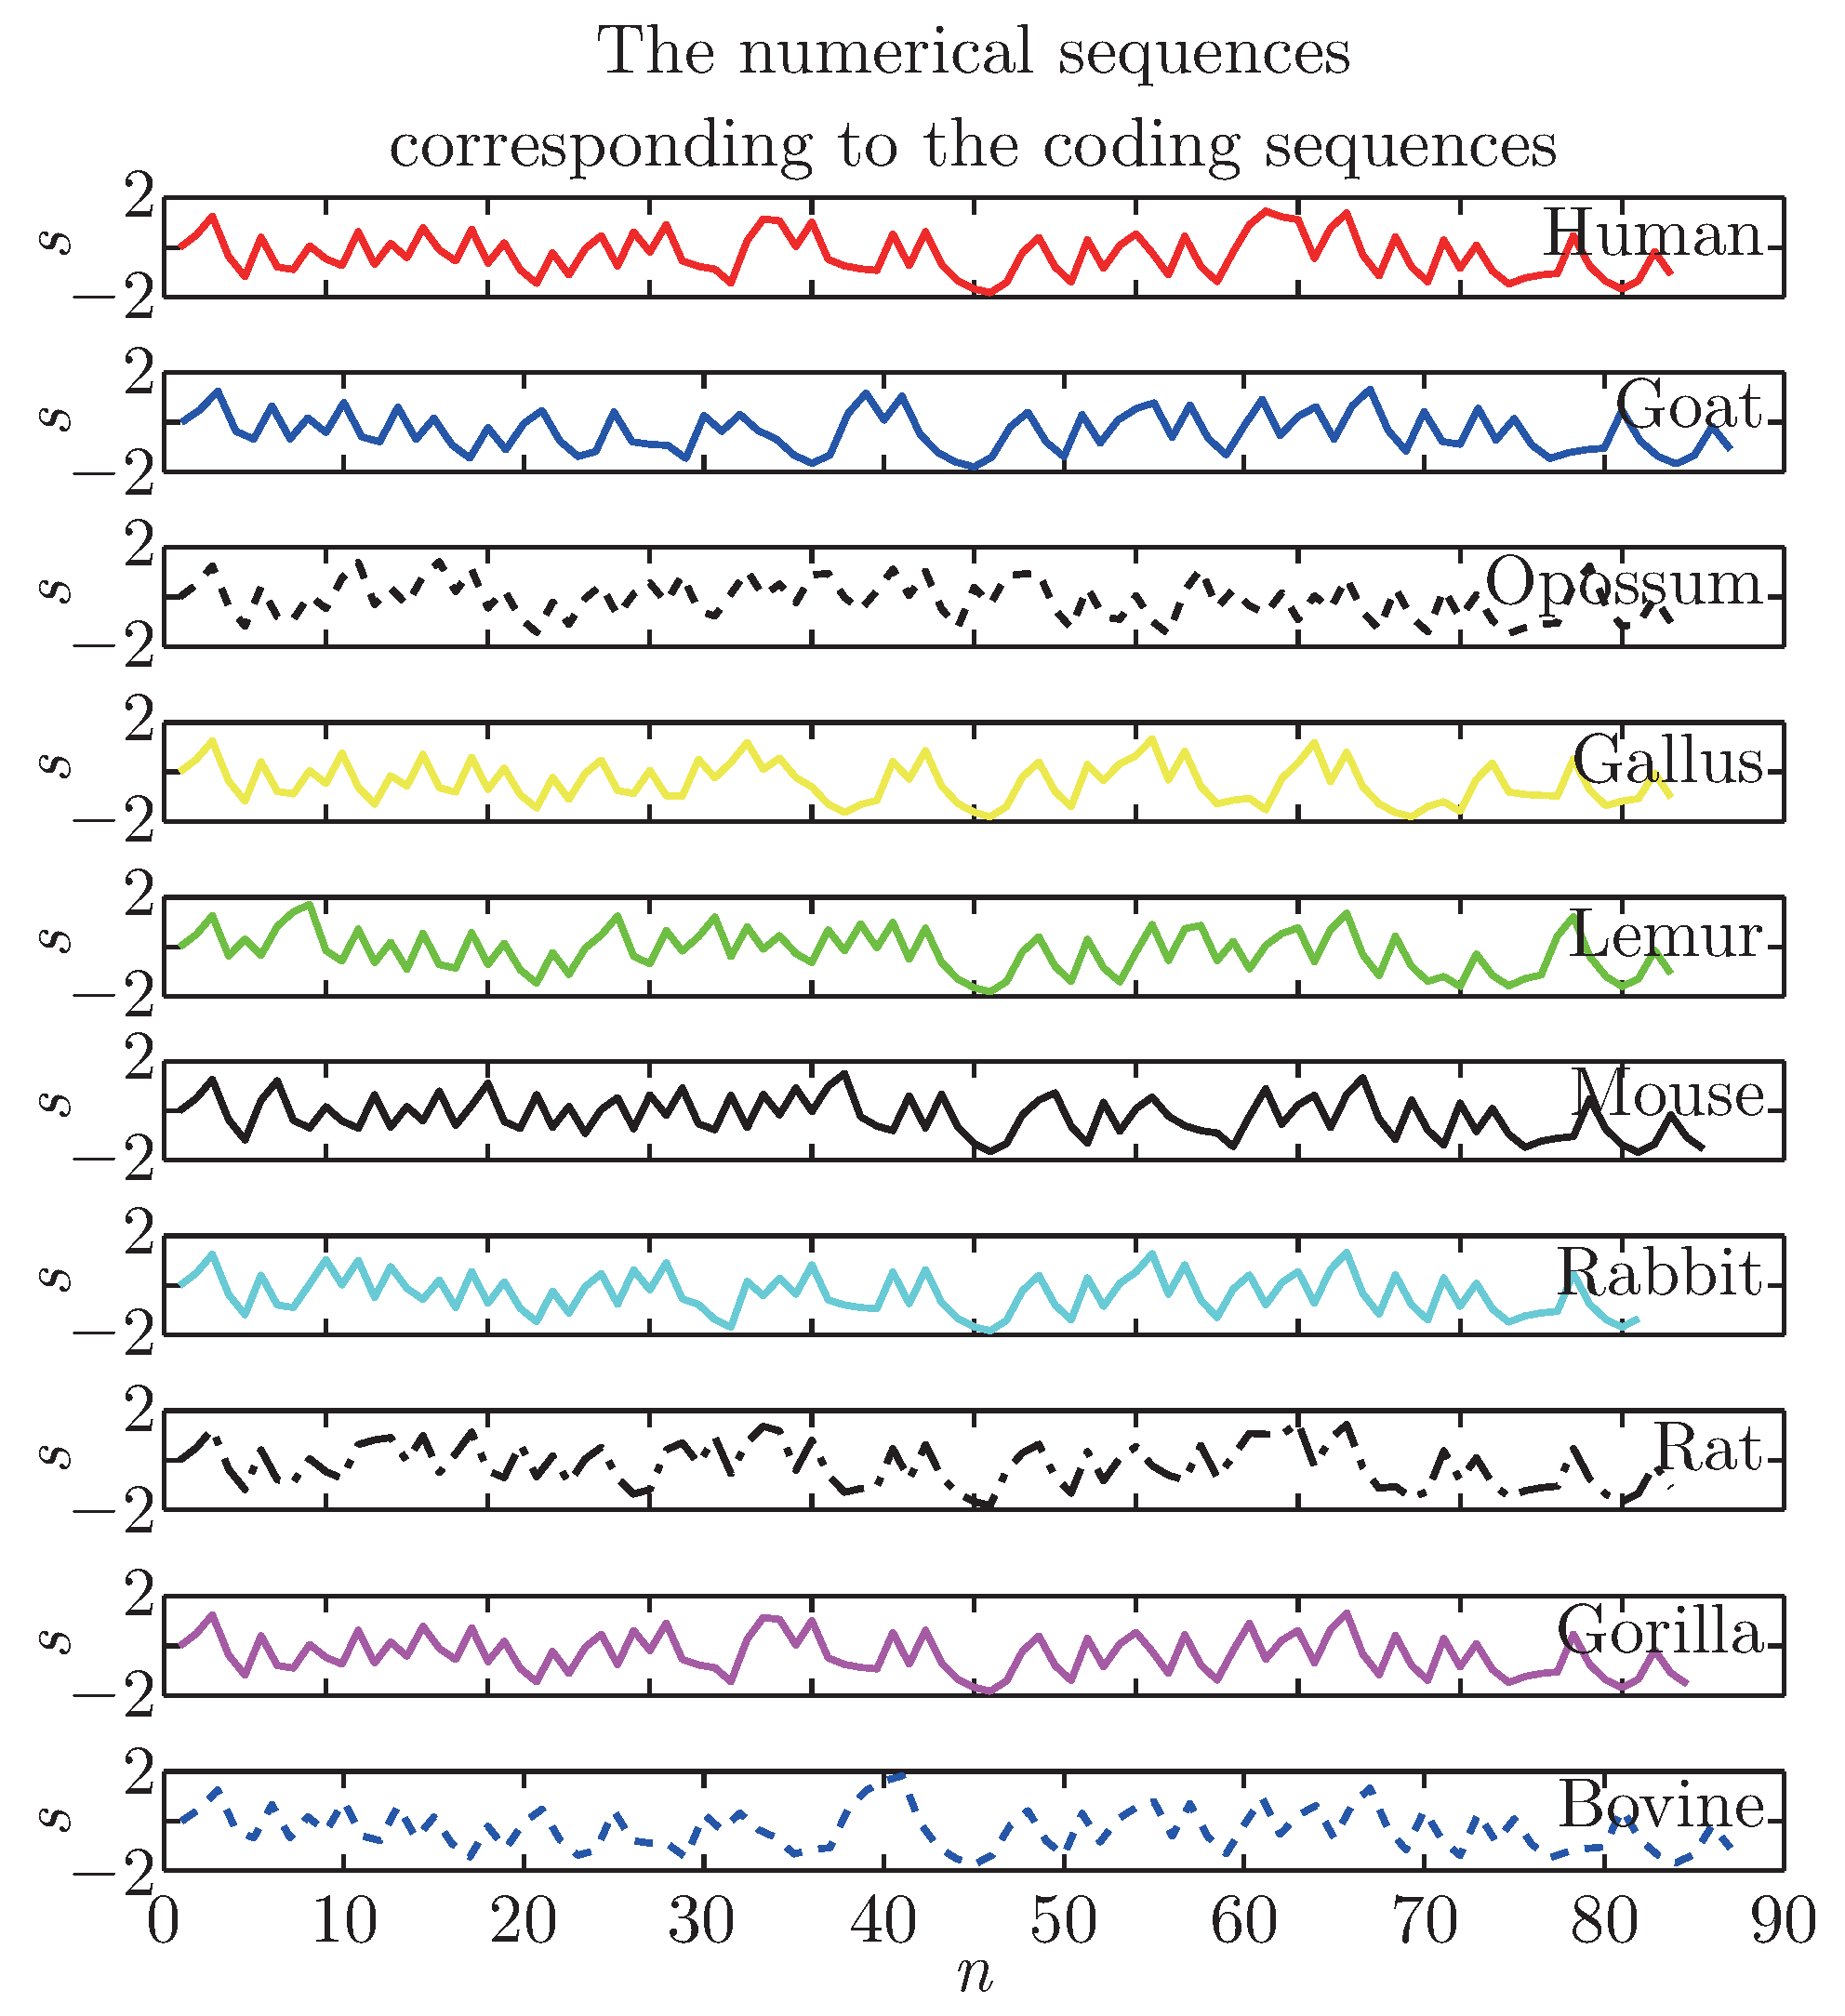
We will characterize the coding sequences of the first exon of β-globin gene of 10 species, as shown in Table 1. For example, take d = 2, we can calculate the corresponding coordinates of the sequences of the 10 species, and the graphical representation is shown in Figure 1 (where n is the number of the coding sequence). From the graph, we could see the numerical sequences are similar to each other, so it is difficult to distinguish them directly. Therefore, we will use the BSQI-EMD method to separate them from each other.
Table 1.
The coding sequences of the first exon of β-globin gene of different species.
Figure 1.
The common chimp’s nonlinear signal.
3.2. Similarities/Dissimilarities Analysis by the BSQI-EMD Method
We select the 10 species for analyzing features and comparing similarities. Firstly, according to the graphical presentation Eq. (5), we can convert the coding sequences of the first exon of β-gene of the 10 species into the numerical signal sequences. Secondly, we can use the classic EMD method and our BSQI-EMD method described in Section 2 to the 10 signals to get their corresponding IMFs and residues. Finally, we compare the different species conveniently by comparing their residues for the residue being either the mean trend or a constant.
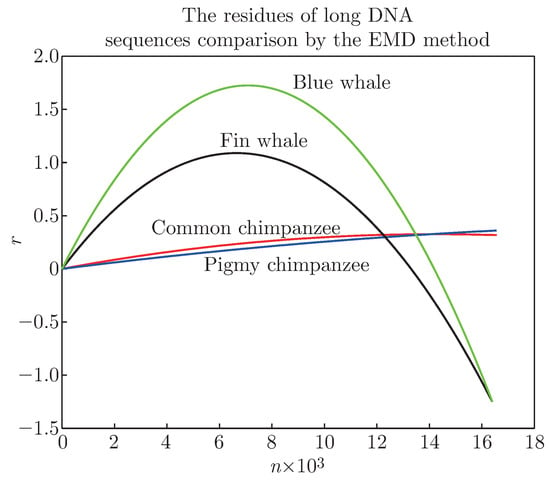
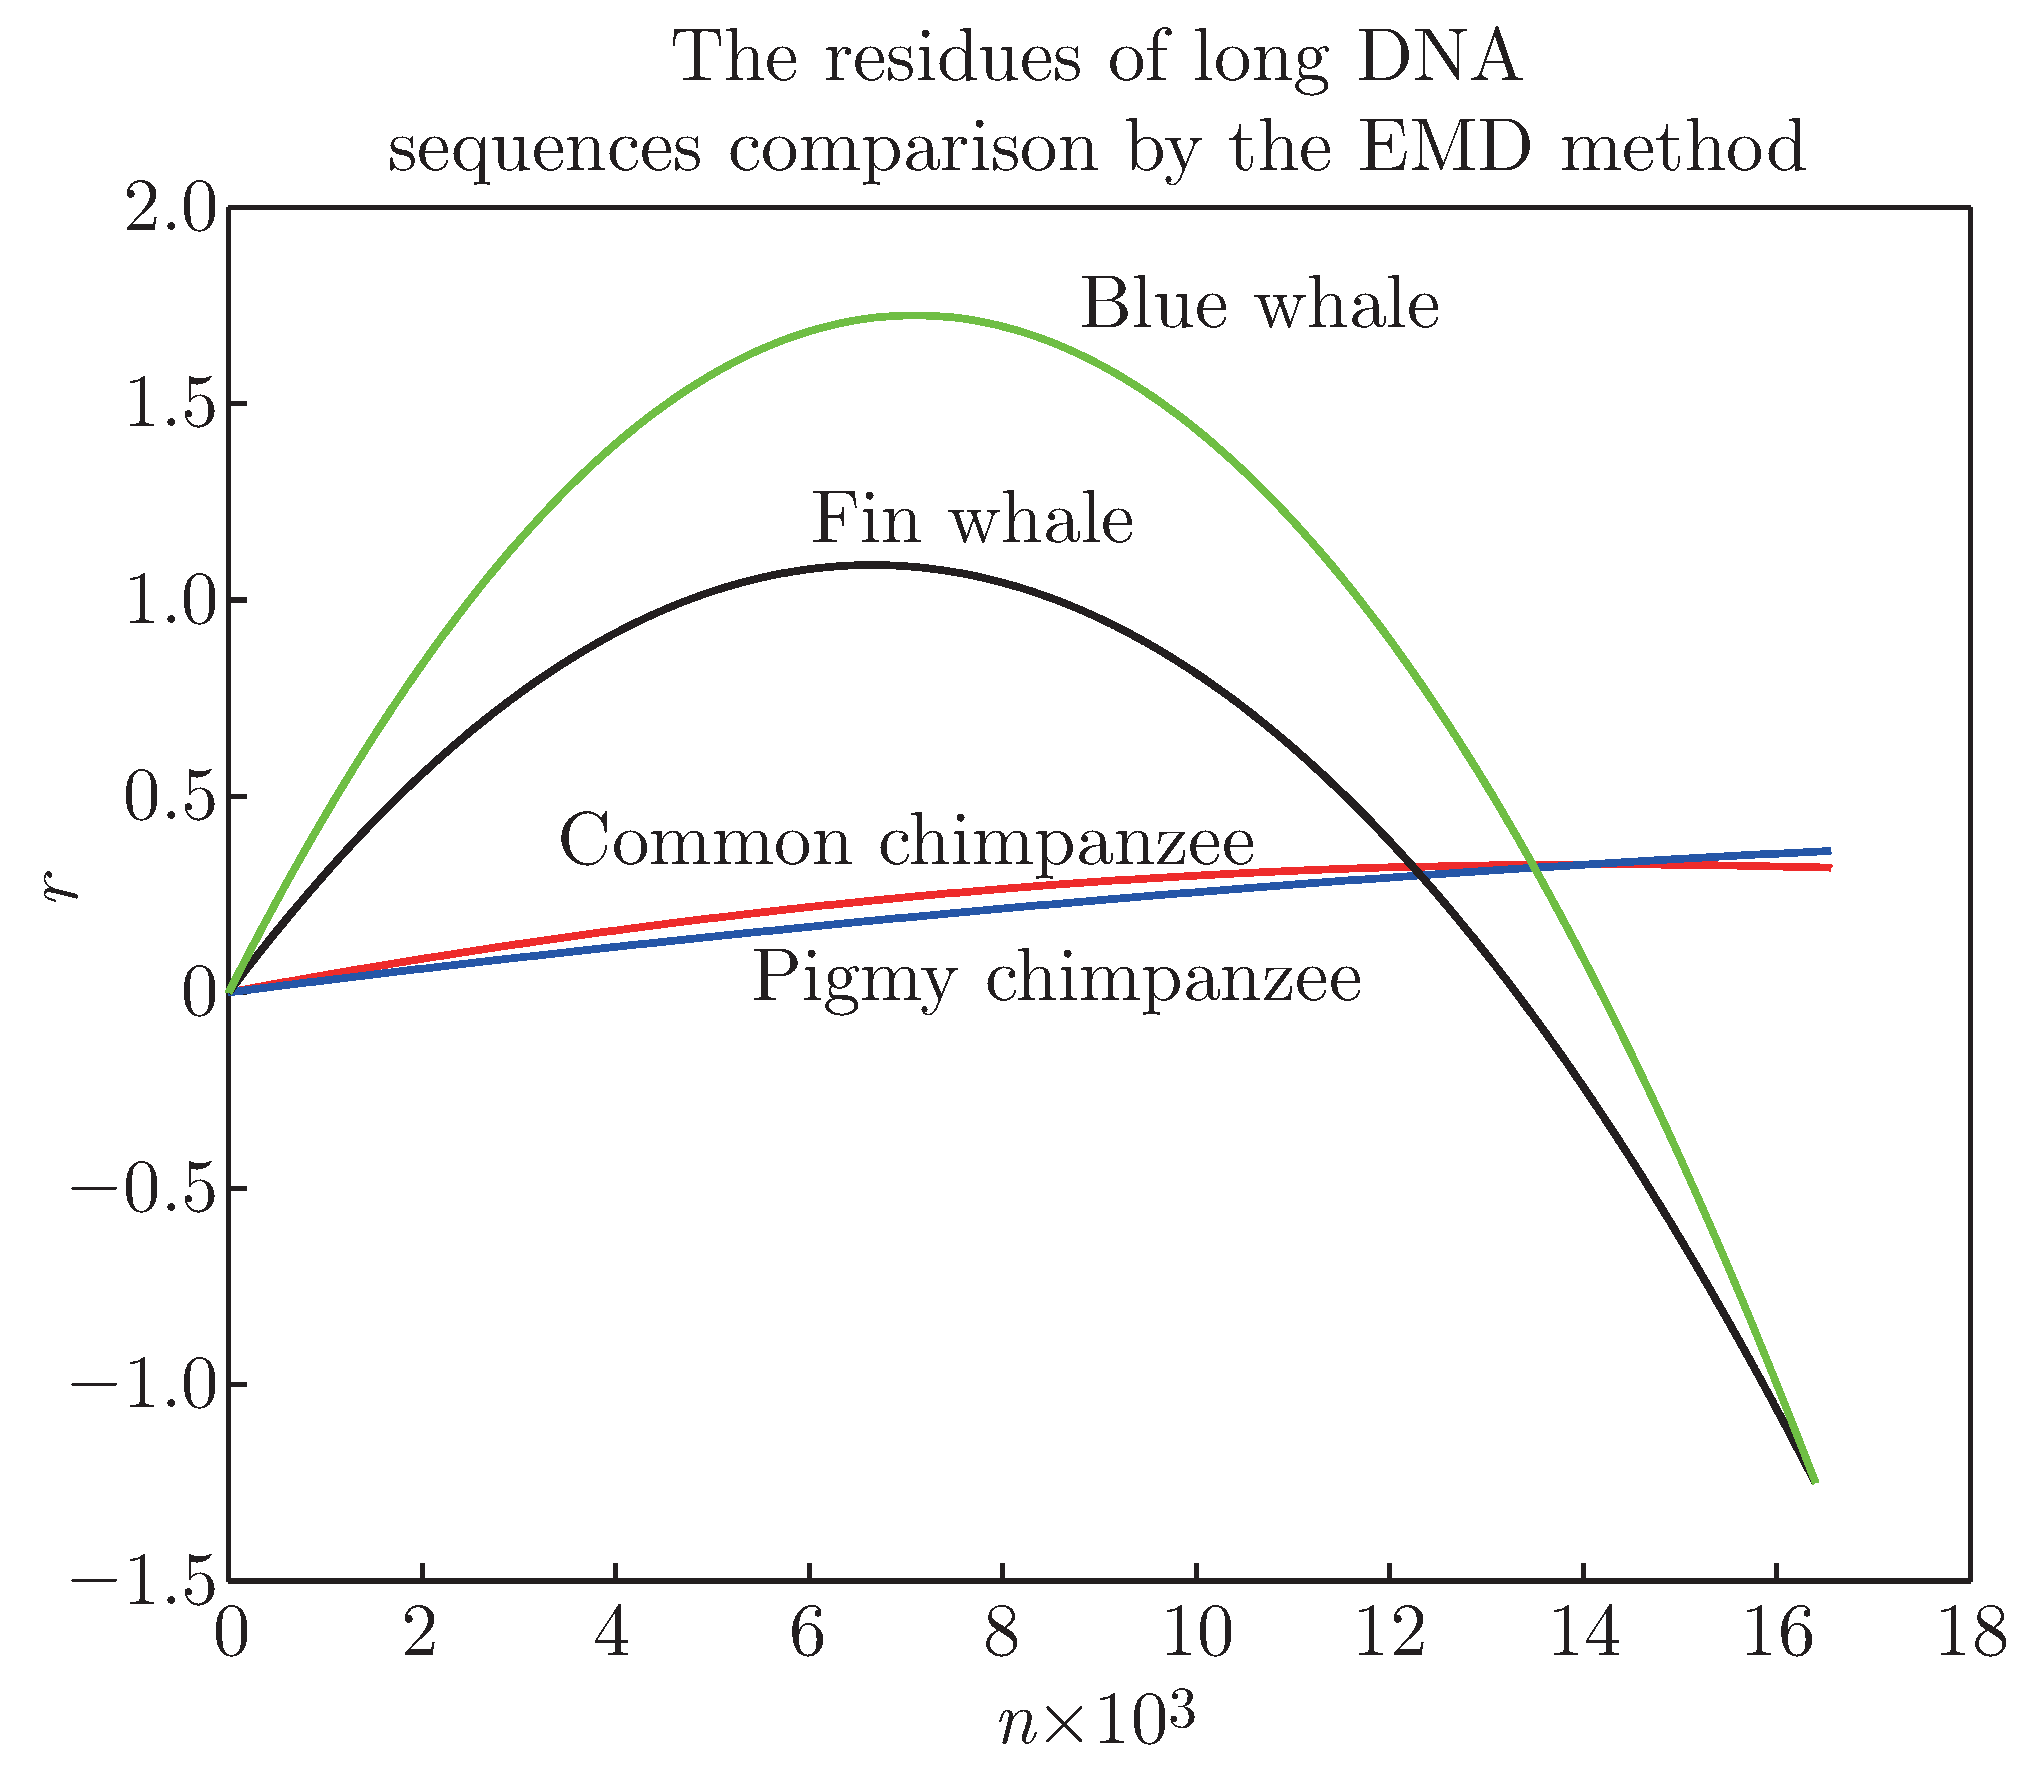
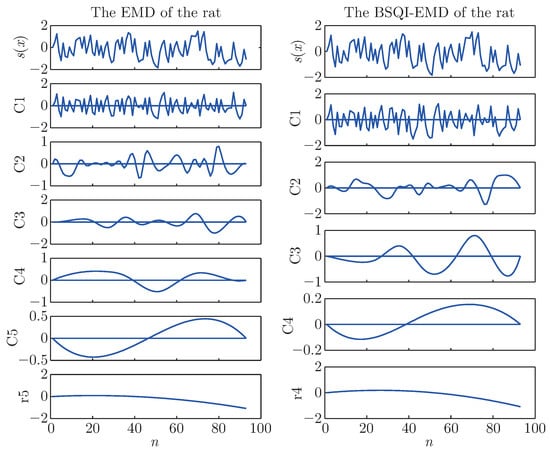
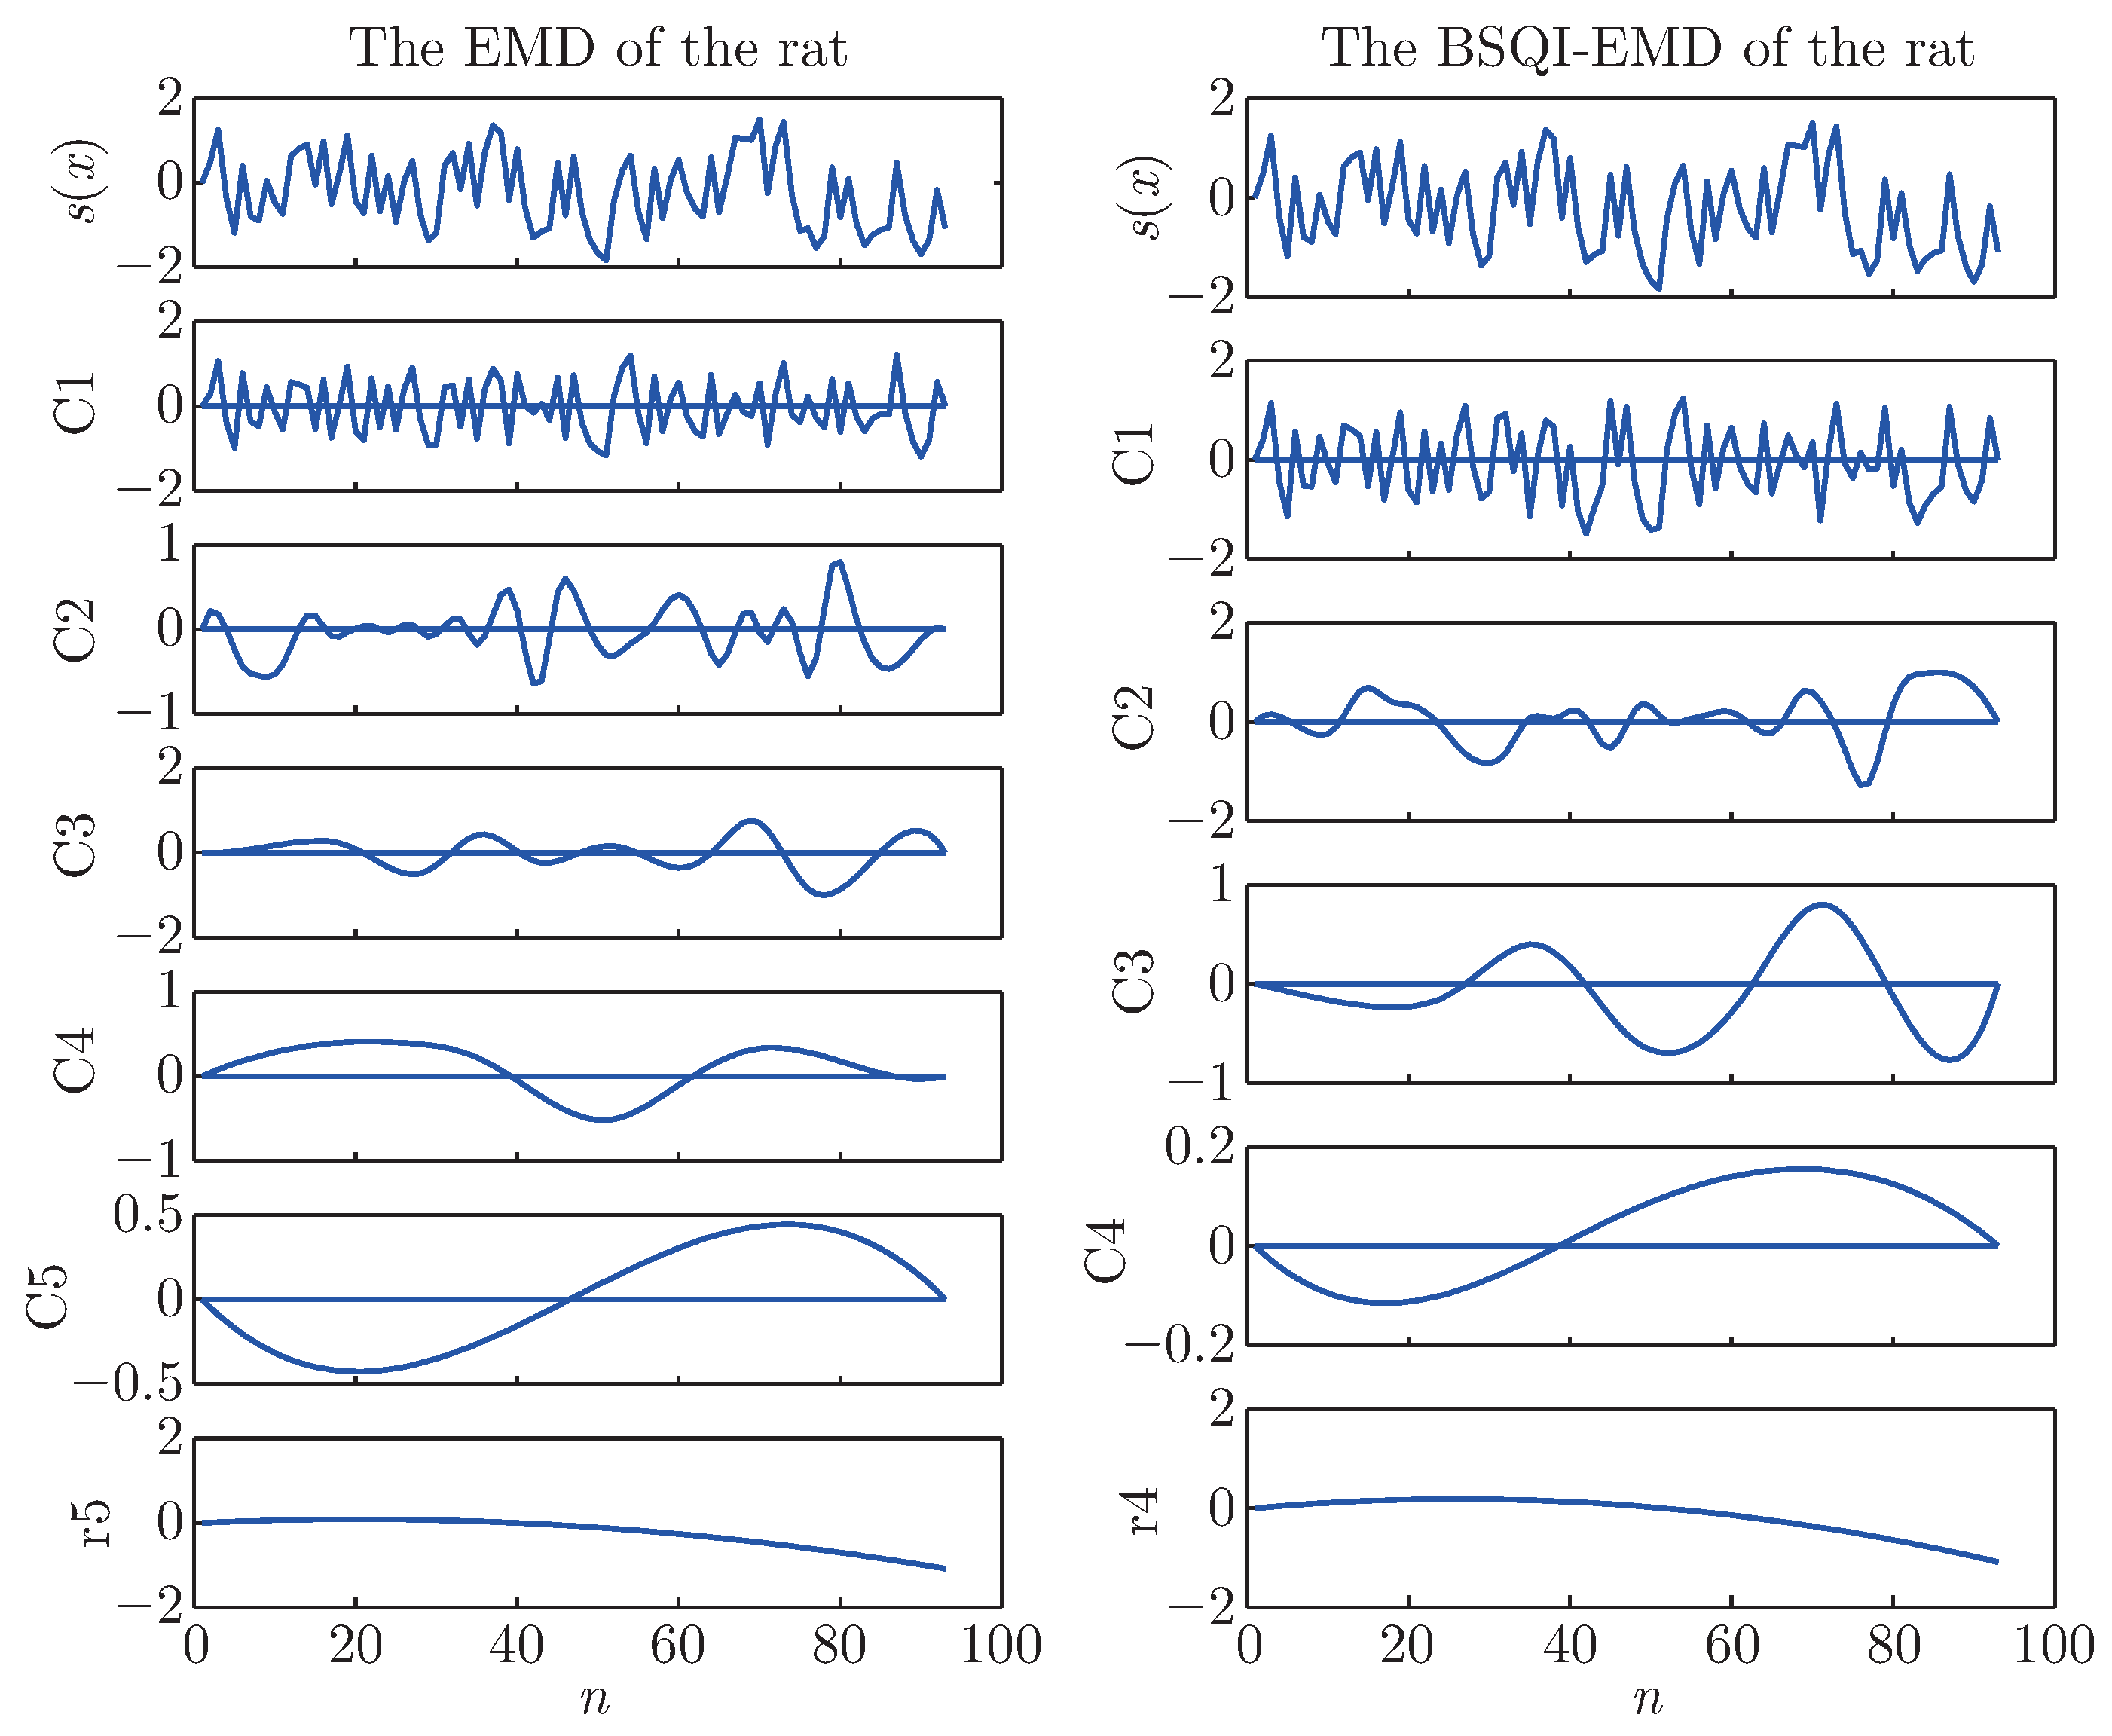
As described in [10], the classic EMD is suitable for long DNA sequences (see Figure 2 for the residue comparison for long DNA sequences, we can compare the similarity very clearly), but it, being affected by endpoints, may not be fit to compare short DNA sequences. In order to find whether our method is suitable for the similarity analysis of short DNA sequences, we take the first exon of β-gene of the 10 species for examples to make the comparison. Then we will get 10 graphs of the 10 species by the EMD and the BSQI-EMD method respectively. We focus on the corresponding residues, so we just give the graph of the EMD comparison of the rat for observation. This is shown in Figure 3, where the left plot is the result of the classic EMD method, the right one is the result of our method, and the symbol ci denotes the IMF and r denotes the residue.
Figure 2.
The residue comparison by the classic EMD method for long DNA sequences.
Figure 3.
The EMD and the BSQI-EMD comparison of the rat.
The BSQI-EMD method is not an interpolating method, so it will get a different decomposition from the classic EMD method. As shown in Figure 3, the numerical sequences are decomposed into a number of different IMFs and the residue respectively by the two EMD methods.
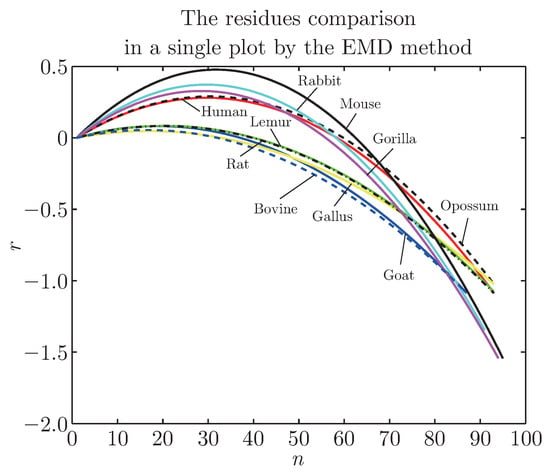
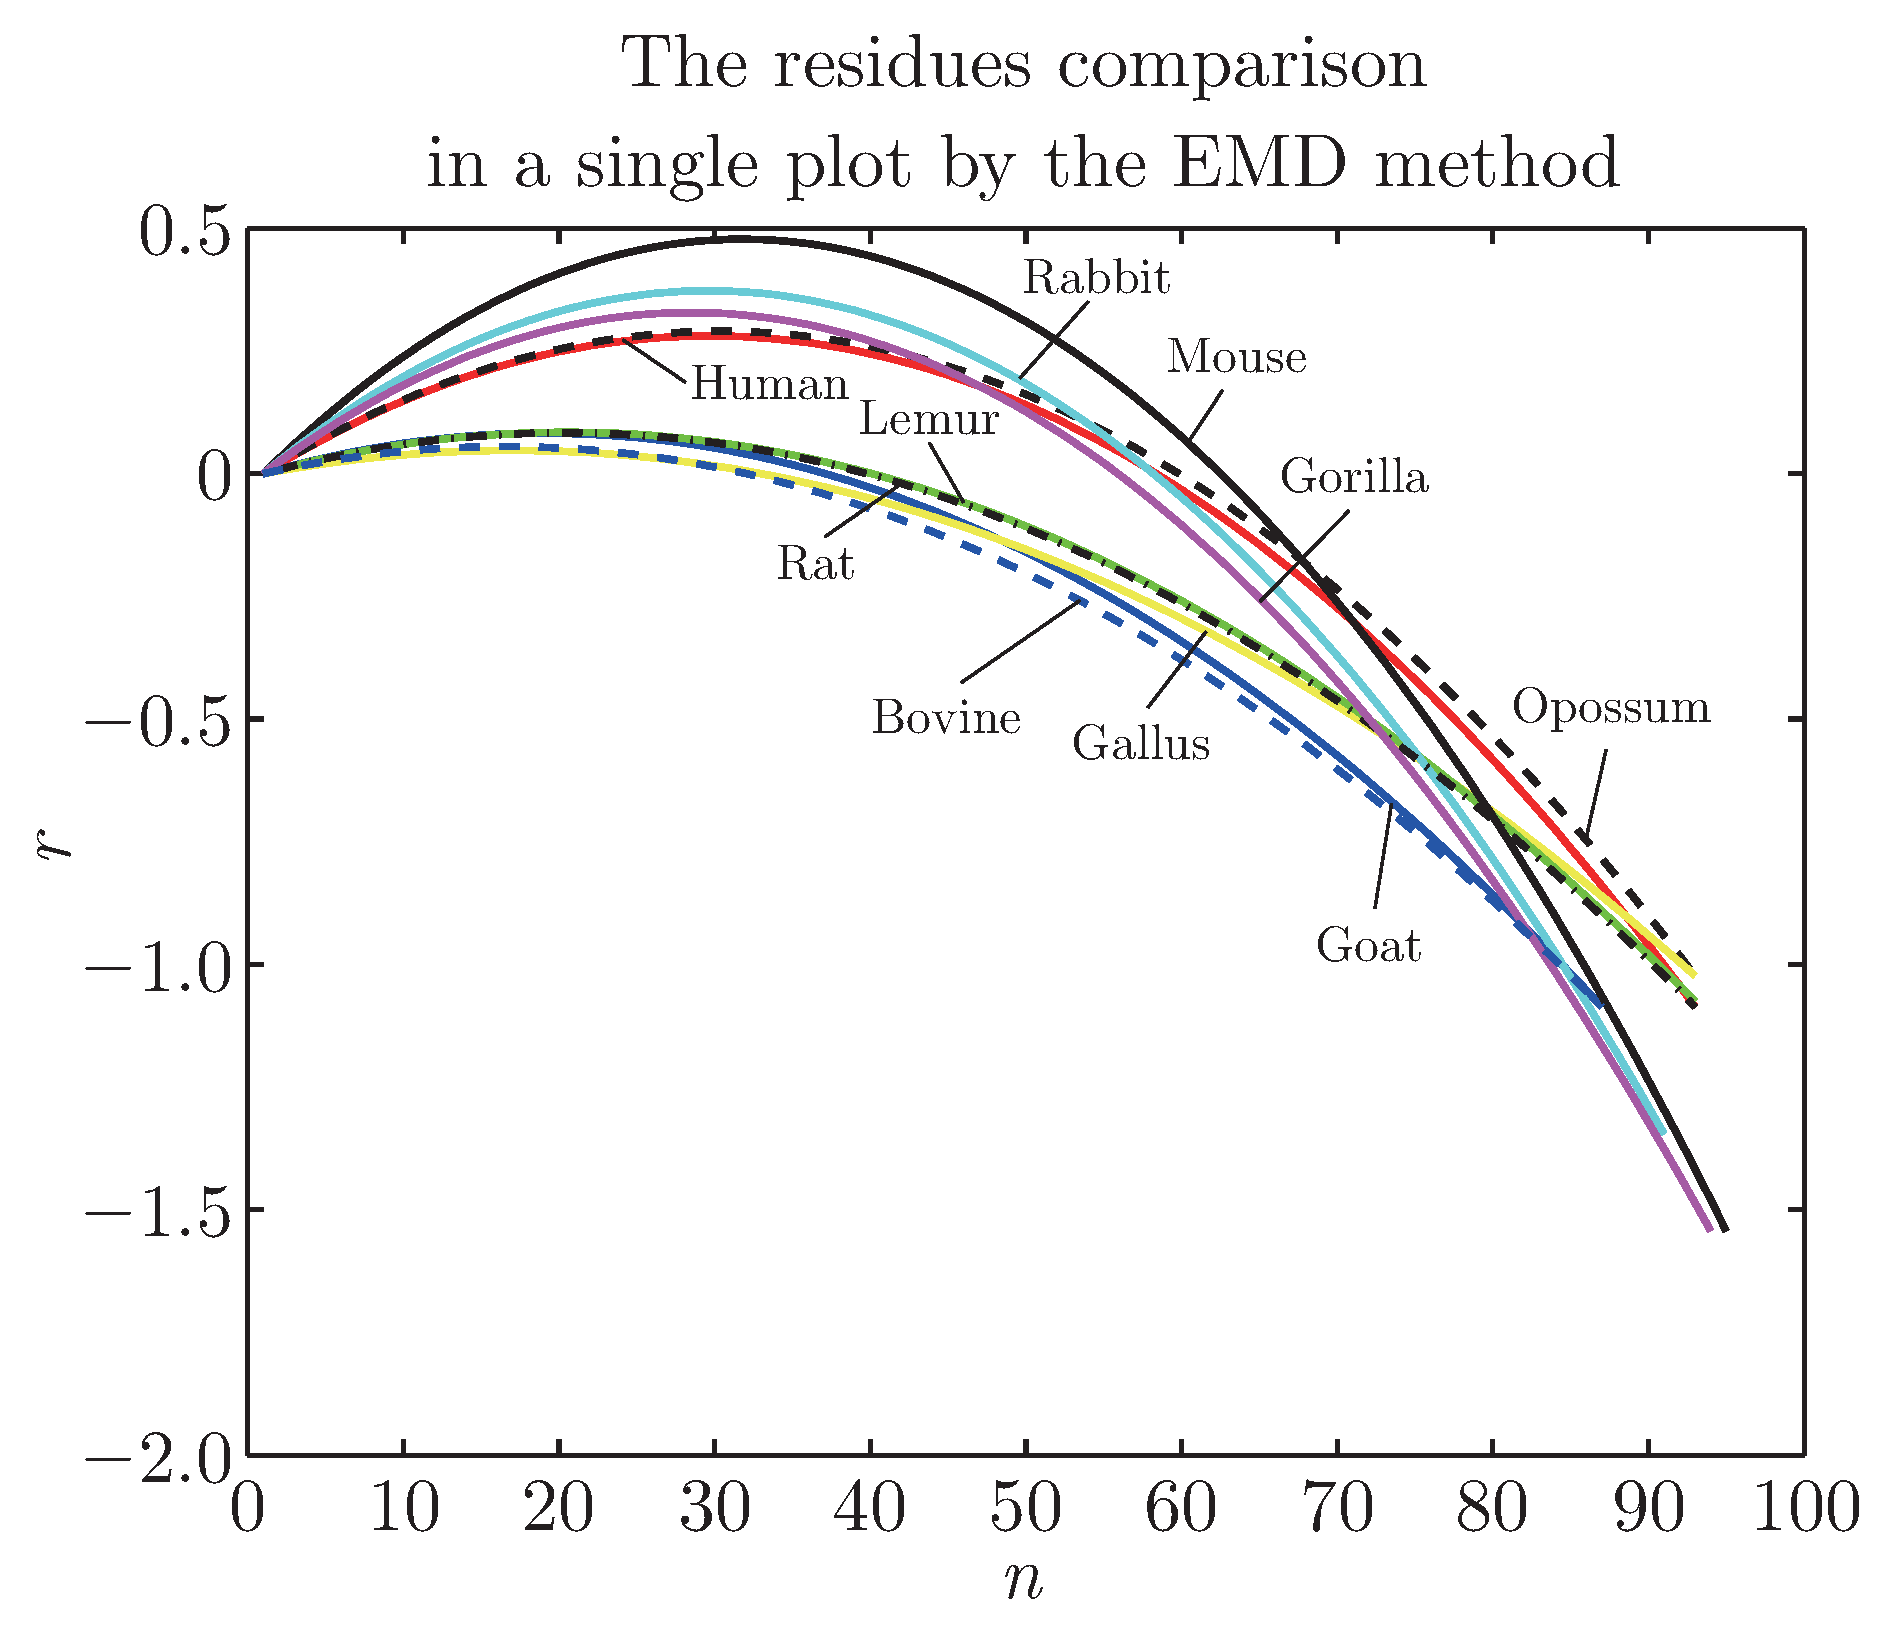
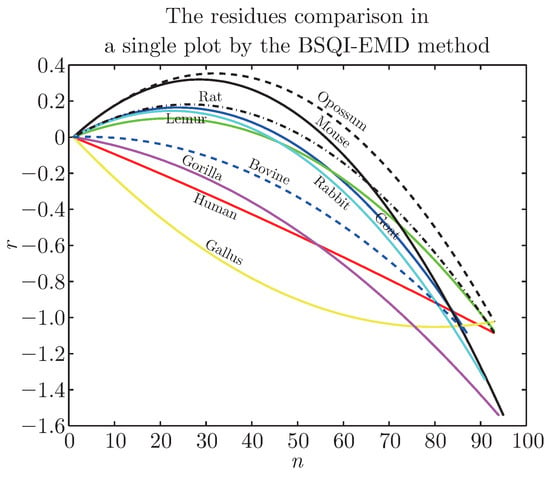
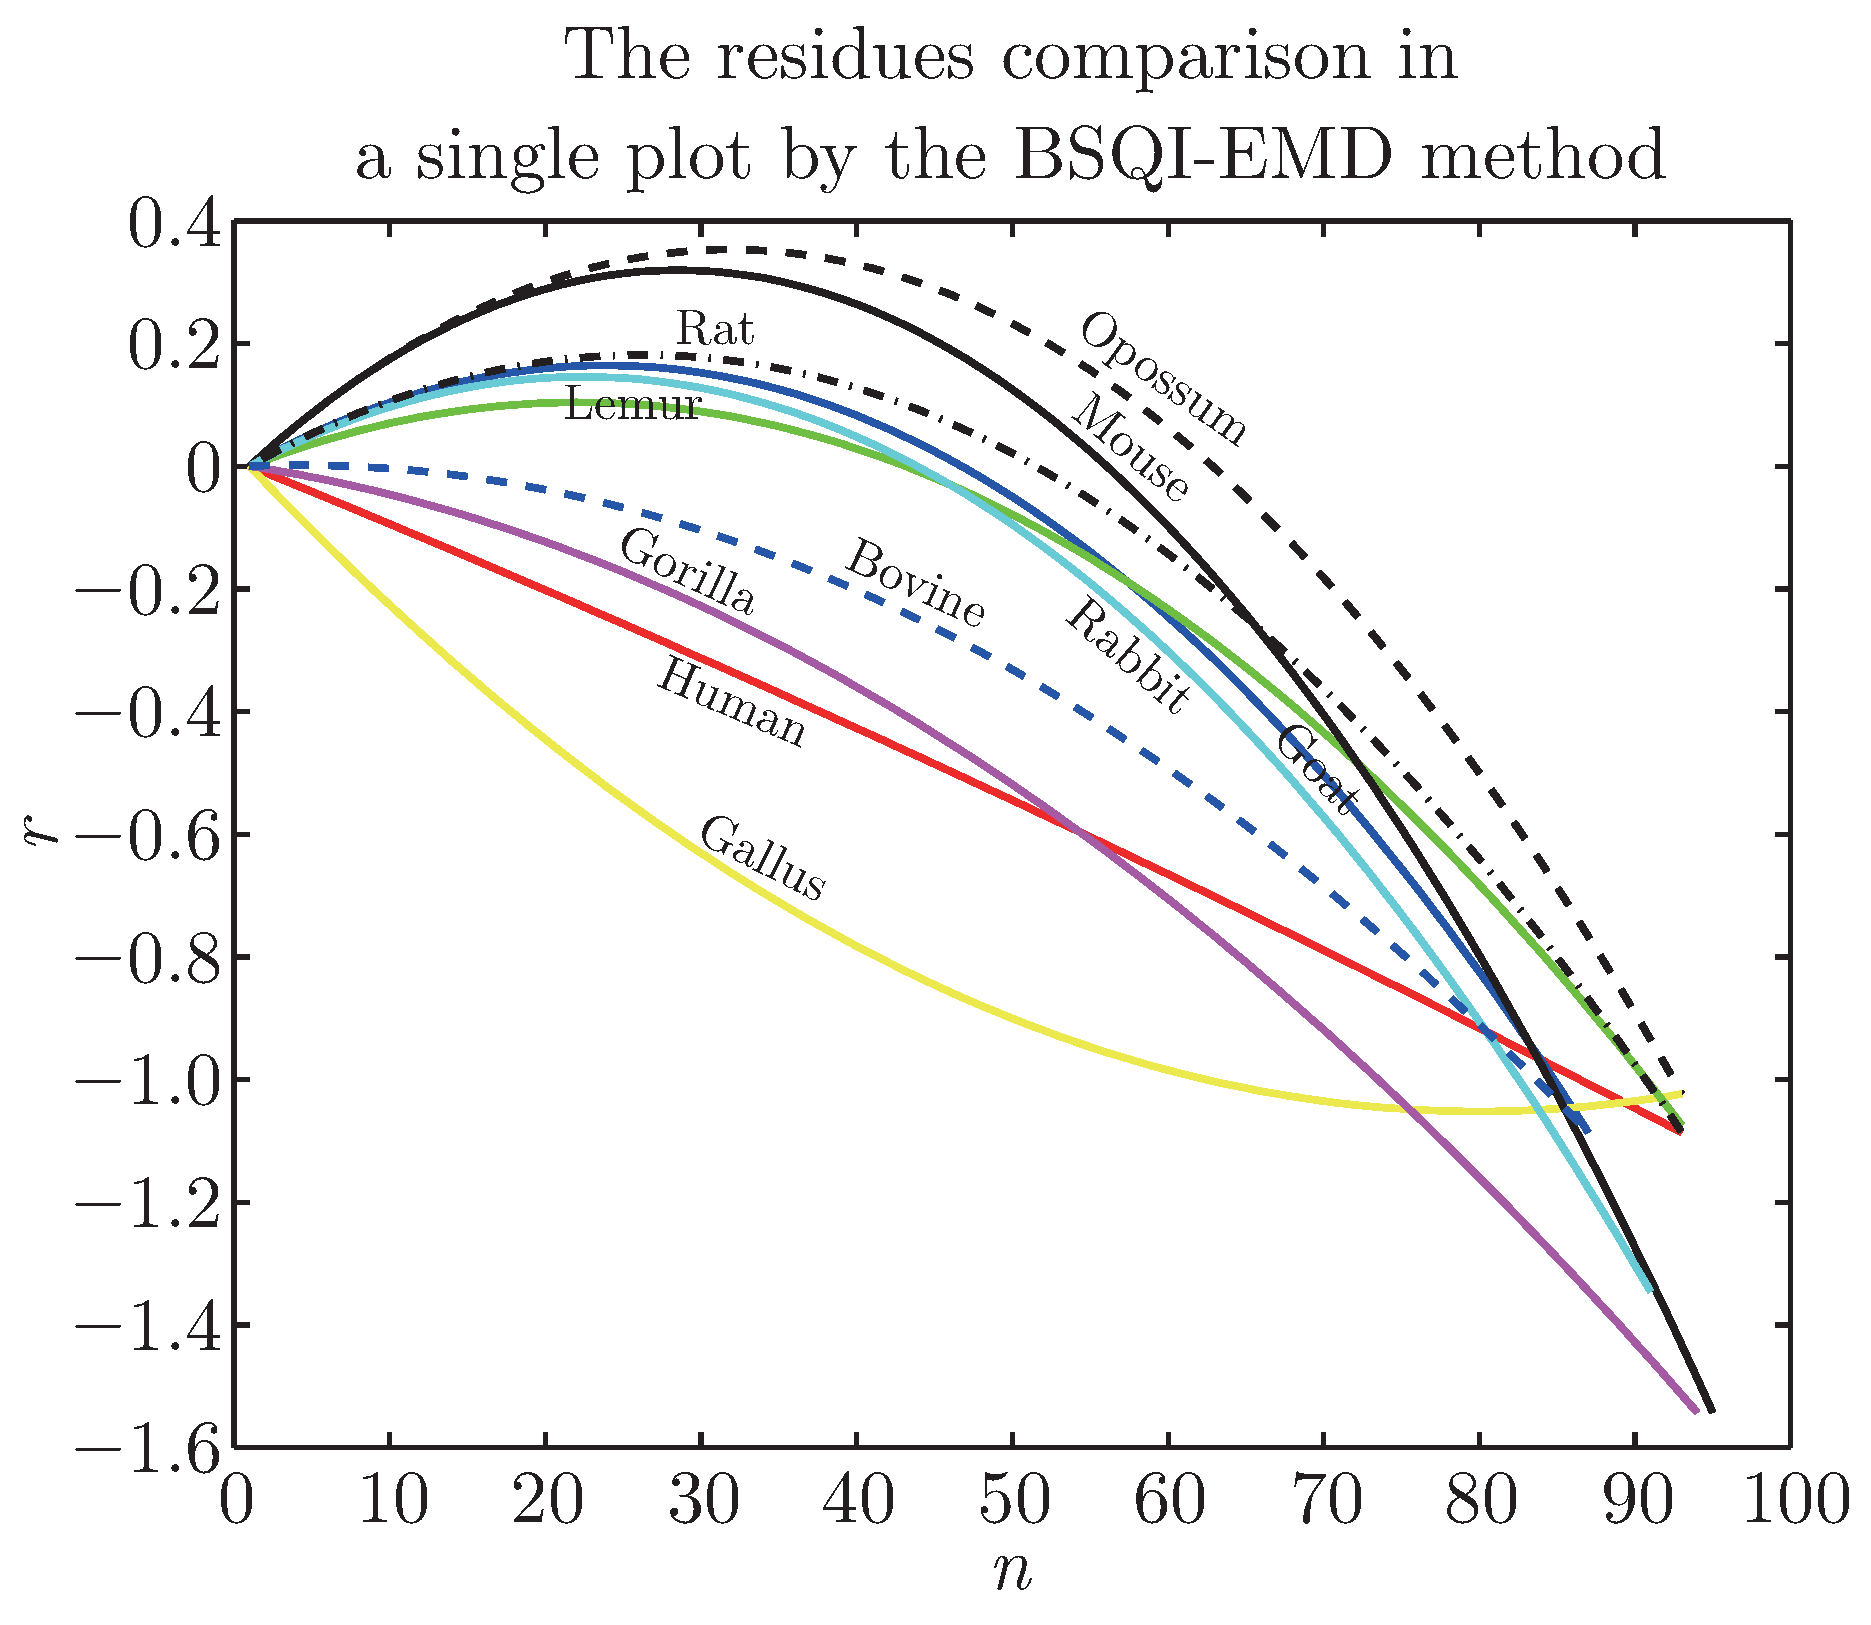
The residue denotes the trend of a numerical sequence and is monotonic or a constant, so we can separate the sequences by comparing their residues easily. We give Figure 4 and Figure 5, where the residues by the two methods are printed in a single plot respectively. From Figure 4 and Figure 5, we can find that the different species have the different residues. To make a comparison, we refer to the Randić’s result [4] shown in Table 2. The closer the two residues are, the more similar the two species are. In Figure 4, we note that the residues of the pairs (bovine, goat), (human, gorilla) are closer with each other, and this is in accordance with Table 2. The residues of the pairs (human, opossum), (lemur, rat) are closer, it is not in accordance with Table 2. We guess that the reason may be related to the graphical presentation method or the endpoints effect of the EMD method.
Figure 4.
The residues comparison in a single plot by the EMD method.
Figure 5.
The residues comparison in a single plot by the BSQI-EMD method.
Table 2.
The similarity/dissimilarity matrix by Randić for the coding sequences of Table 1.
In Figure 5, we see the residues of the pairs (human, gorilla), (rat, mouse) are closer, and it is in agreement with Table 2. The more important thing is that the residue of the opossum (the most remote species from the remaining mammals) is convex and at the top of the graph, moreover, the one of the gallus (the only non-mammalian representative) is concave and at the bottom of the graph, so it is in good agreement with Table 2. We can see from the above residues’ graphs that the non-mammals and the mammals could be separated very clearly and even the ones who belong to the mammals can also be compared clearly.
On the basis of these findings we conclude that the BSQI-EMD method is more suitable for the similarities/dissimilarities among the coding sequences of the first exon of β-gene of 10 species.
4. Conclusion
This work has proposed the BSQI-EMD method and applied it to divide the nonlinear numerical sequence, converted from a DNA sequence, into a set of IMFs and a residue. The residue represents the trend of the numerical sequence and is monotonic or a constant, so we can conveniently and intuitively establish the similarity of different DNA sequences by comparing the corresponding residues. In the end, we get a good method which could separate DNA sequences of the nonmammals from that of the mammals very clearly and even separate the ones who belong to the mammals from each other clearly by the suitability for the coding sequences of the first exon of β-gene of the 10 species.
Compared with the EMD method, our method is simple, easy to implement for its explicit expression, and more suitable for the similarity analysis of short DNA sequences. Similarity analysis of biological sequences are still in development, and we hope that this method can be used widely and be a complementary tool for the biological sequences analysis.
References
- Hamori, E.; Ruskin, J. H curves, a novel method of representation of nucleotide series especially suited for long DNA sequences. J. Biol. Chem. 1983, 258, 1318–1327. [Google Scholar] [CrossRef] [Scilit]
- Gates, M.A. A simple way to look at DNA. J. Theor. Biol. 1986, 119, 319–328. [Google Scholar] [CrossRef] [Scilit]
- Nandy, P. Nandy, Graphical analysis of DNA sequence structure - II: Relative abundances of nucleotides in DNAs, gene evolution and duplication. Curr. Sci. 1995, 68, 75–85. [Google Scholar]
- Randić, M.; Vracko, M.; Lers, N.; Plavsic, D. Analysis of similarity/dissimilarity of DNA sequences based on novel 2-D graphical representation. Chem. Phys. Lett. 2003, 371, 202–207. [Google Scholar] [CrossRef] [Scilit]
- Randić, M.; Balaban, A.T. On a four-dimensional representation of DNA primary sequences. J. Chem. Inform. Comput. Sci. 2003, 43, 532–539. [Google Scholar] [CrossRef] [Scilit]
- Liao, B.; Wang, T.M. Analysis of similarity of DNA sequences based on triplets. J. Chem. Inf. Comp. Sci. 2004, 44, 1666–1670. [Google Scholar] [CrossRef] [Scilit]
- Bai, F.L.; Liu, Y.Z.; Wang, T.M. A representation of DNA primary sequences by random walk. Math. Biosci. 2007, 209, 282–291. [Google Scholar]
- Huang, N.E.; Shen, Z.; Long, S.R.; et al. The empirical mode decomposition and the hilbert spectrum for nonlinear and non-stationary time series analysis. P. Roy. Soc. Lond. A 1998, 454, 903–995. [Google Scholar] [CrossRef] [Scilit]
- Huang, N.E.; Wu, M.L.; Qu, W.D. Applications of Hilbert-Huang transform to non-stationary financial time series analysis. Appl. Stoch. Model. Bus. Ind. 2003, 19, 245–268. [Google Scholar] [CrossRef] [Scilit]
- Bai, F.L.; Zhang, J.H.; Zheng, J.S. Similarity analysis of DNA sequences based on EMD method. Appl. Math. Lett. 2011, 24, 232–237. [Google Scholar] [CrossRef] [Scilit]
- Zhang, J.H.; Wang, R.H.; Bai, F.L.; Zheng, J.S. A Quasi-MQ EMD method for similarity analysis of DNA sequences. Appl. Math. Lett. 2011, 24, 2052–2058. [Google Scholar] [CrossRef] [Scilit]
- Zhang, J.H.; Wang, R.H.; Bai, F.L.; Zheng, J.S. A RK-EMD method for similarity analysis of DNA sequences. J. Inf. Com. 2012, 9, 565–573. [Google Scholar]
- Zhang, J.H.; Zheng, J.S.; Bai, F.L.; Liu, L.W. Similarity analysis of protein sequences based on the EMD method. J. Fiber Bioeng. Inform. 2014, 7, 387–395. [Google Scholar] [CrossRef] [Scilit]
- Chen, Q.H.; Huang, N.E.; Riemenschneider, S.; Xu, Y.S. A B-spline approach for empirical mode decompositions. Adv. Comput. Math. 2006, 24, 171–195. [Google Scholar] [CrossRef] [Scilit]
- Pegram, G.G.S.; Peel, M.C.; McMahon, T.A. Empirical mode decomposition using rational splines: An application to rainfall time series. Proc. R. Soc. A 2008, 464, 1483–1501. [Google Scholar]
- Nunes, J.C.; Bouaoune, Y.; Deléchelle, E.; Niang, O.; Bunel, P. Image analysis by bidimensional empirical mode decomposition. Image. Vision. Comput. 2003, 21, 1019–1026. [Google Scholar] [CrossRef] [Scilit]
- Sablonni`ere, P. Recent progress on univariate and multivariate polynomial and spline quasiinterpolants. Int. Ser. Numer. Math. 2005, 151, 229–245. [Google Scholar] [CrossRef] [Scilit]
- Sablonni`ere, P. Univariate spline quasi-interpolants and applications to numerical analysis. Rend. Sem. Mat. Univ. Pol. Torino. 2005, 63, 211–222. [Google Scholar]
- Bai, F.L.; Li, D.C.; Wang, T.M. A new mapping rule for RNA secondary structures with its applications. J. Math. Chem. 2008, 43, 932–943. [Google Scholar] [CrossRef] [Scilit]
- Zupan, J.M. Randić, Algorithm for coding DNA sequences into “Spectrum-Like” and “Zigzag” representations. J. Chem. Inf. Model. 2005, 45, 309–313. [Google Scholar] [CrossRef] [Scilit]

© 2015 Textile Bioengineering and Informatics Society. This article is an open access article distributed under the terms and conditions of the Creative Commons Attribution (CC BY) license (https://creativecommons.org/licenses/by/4.0/).