


Abstract
For the blood cell signal has the characteristics of nonlinear, non-stationary and M-morphous, an intelligent algorithm for blood cell recognition based on Hilbert-Huang Transformation and BP Neural Network (HHT-BPNN) is put forward, which convert the time domain features of the blood cell signal into energy features by combining empirical mode decomposition with Hilbert transform, and put the time domain features and the energy features together as the feature vector. Then, a model based on BP neural network is built by training and simulating that complete the work of effective identification and accurate count for M-morphous blood cells. Simulation results show that the algorithm proposed has high recognition accuracy with good recognition performance.
1 Introduction
With the rapid development of the medical electronic technology, the blood cell recognition has become a hot topic in biomedical field gradually [1]. Currently, the most commonly used method in clinical diagnosis for blood cells’ analysis is electric impedance method, whose principle is that when a blood cell go through the detection zone of micropore will generate a potential pulse, then we can complete the identification and counting for blood cells by detecting the pulse signals. However, the process of blood cells’ detection will be affected by the negative pressure and concentration of cell suspension, which will arise the phenomenon of gang and edge, and form the M-morphous pulse that may be loss count or error count, so the accuracy of recognition and counting for blood cells will be influenced [2].
In this paper we put forward a intelligent algorithm based on Hilbert-Huang Transformation and BP Neural Network (HHT-BPNN) to research the recognition of blood cell signals. First of all, we take a decomposition by EMD on M-morphous pulse signal and extract the energy features of Intrinsic Mode Function (IMF), then selecting the time domain features and the energy features together as the feature vector which is the input of BP neural network, at the same time, a BP neural network model is established to complete the recognition of M-morphous pulse signal. The simulation and experiment show that the characteristic dimensions of neural network has been reduced by HHT-BPNN algorithm and the convergence speed of the network has also been improved, which will improve the recognition accuracy for blood cell to a certain extent.
2 Analysis and Feature Extraction for Blood Cell Signal
2.1 The Analysis of Blood Cell Signal
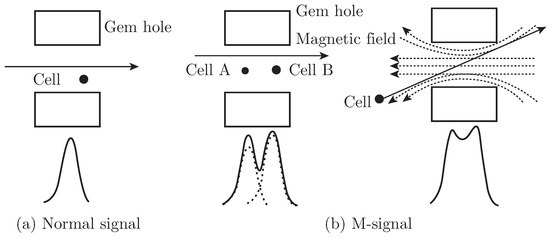
When a blood cell go through the keyhole, the detection sensor in the keyhole will generate a series of electronic pulse signals [3]. The normal unimodal signal is shown in Fig. 1 (a) while M-morphous signal produced by the phenomenon of gang and edge is shown in Fig. 1 (b).
Fig. 1.
Pulse signal characteristic diagram of blood cells.
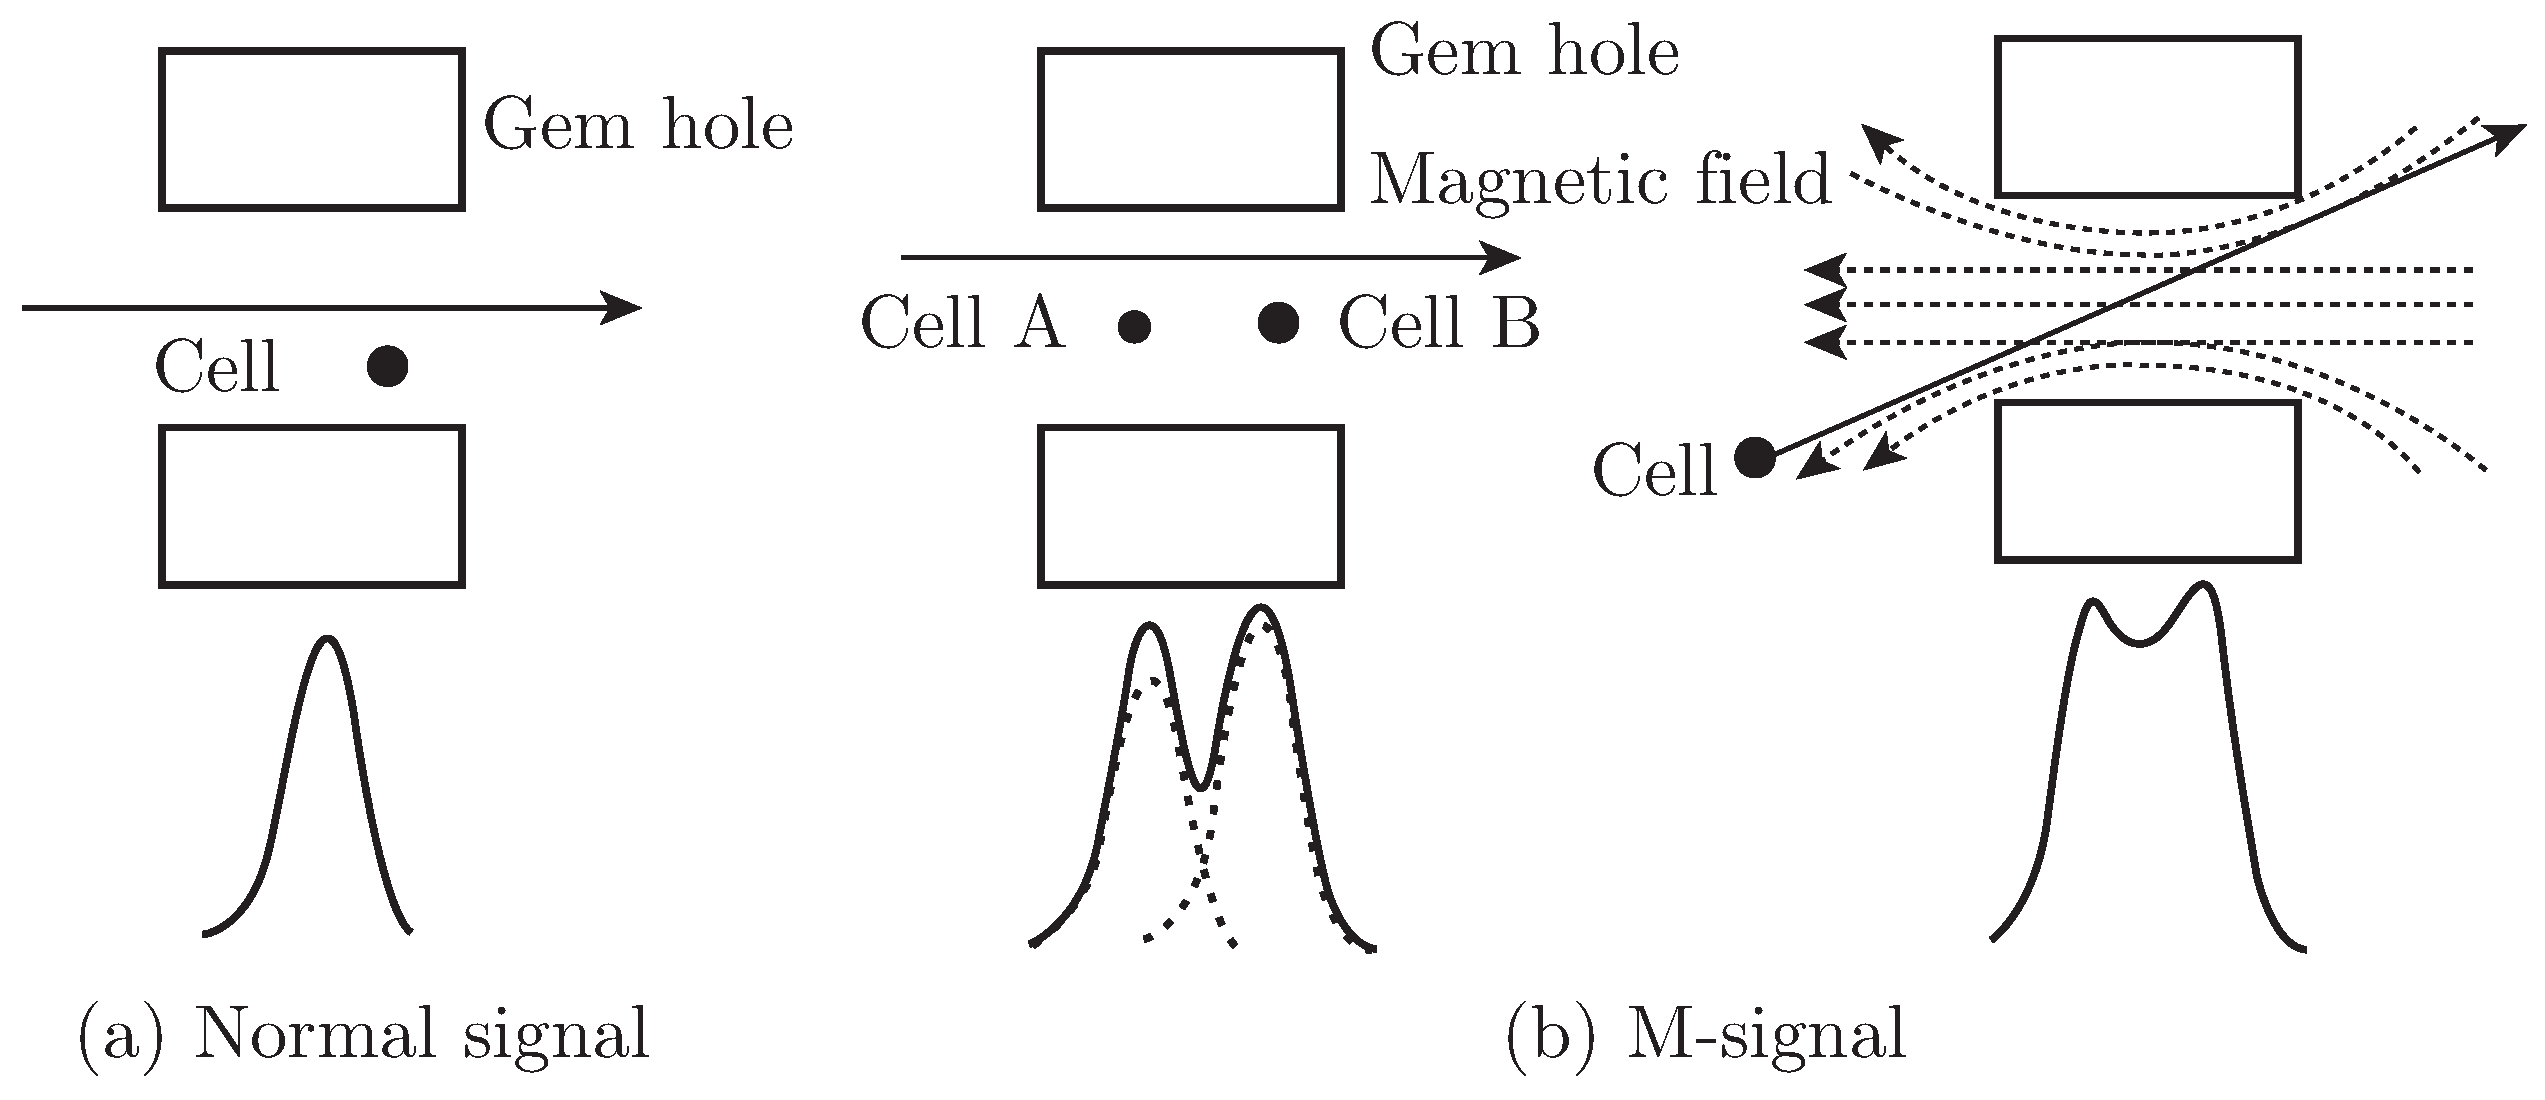
In the following research, M-morphous pulse signal is called as M signal for short. For the M signal, we should choose the five points of A, B, C, D, E as the the feature points of M signal which are shown in Fig. 2, where the V0 is the smallest amplitude of the blood cell signal that has been removed the bottom interference signal, and A, C, B are representing the two peaks and one trough of M signal while D, E are the points where the amplitude of M signal is equal to V0. Then we should take the ordinate value of A, B, C (marked as Y1, Y2, Y3) and the difference of horizontal coordinates between the five adjacent points of A, B, C, D, E (marked as X1, X2, X3, X4) as the time domain features.
Fig. 2.
The waveform of M signal.
2.2 Hilbert-Huang Transform (HHT)
HHT is a algorithm for the analysis of time series signals with the capacity of adaptive time-frequency resolution that has gained great development in recent years, and the algorithm has a better adaptability for nonlinear and non-stationary signals especially. In addition, the core part of HHT consists of two parts: Empirical Mode Decomposition (EMD) and Hilbert spectrum analysis [4, 5].
EMD is often regard as a process of screen which can decompose any complex signals into some IMF components based on its own signal characteristics adaptively. For the method has the characteristics of completeness and self-adaptability, it has been widely application in different engineering fields currently [6, 7]. In this paper the EMD is adopted to decompose the M signal into six components which can be marked as IMF1, IMF2, IMF3, IMF4, IMF5, IMF6. Hilbert marginal spectrum is the amplitude accumulation of each frequency point in the entire range of time area, which can reflect the energy distribution in frequency area [8, 9].
2.3 Feature Extraction for Blood Cell Based on Empirical Mode Decomposition
Firstly, the M signal is decomposed into several IMFs by EMD, and each IMF can be transformed with Hilbert, then the energy of each IMF can be calculated. Specific steps are as follows:
- (1)
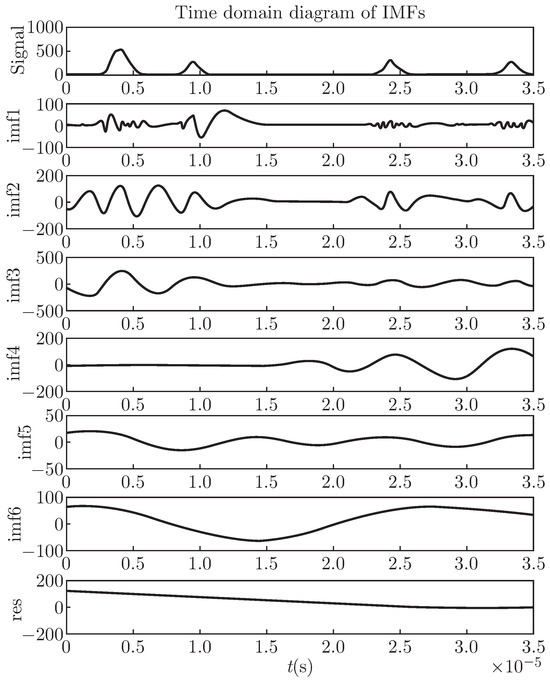
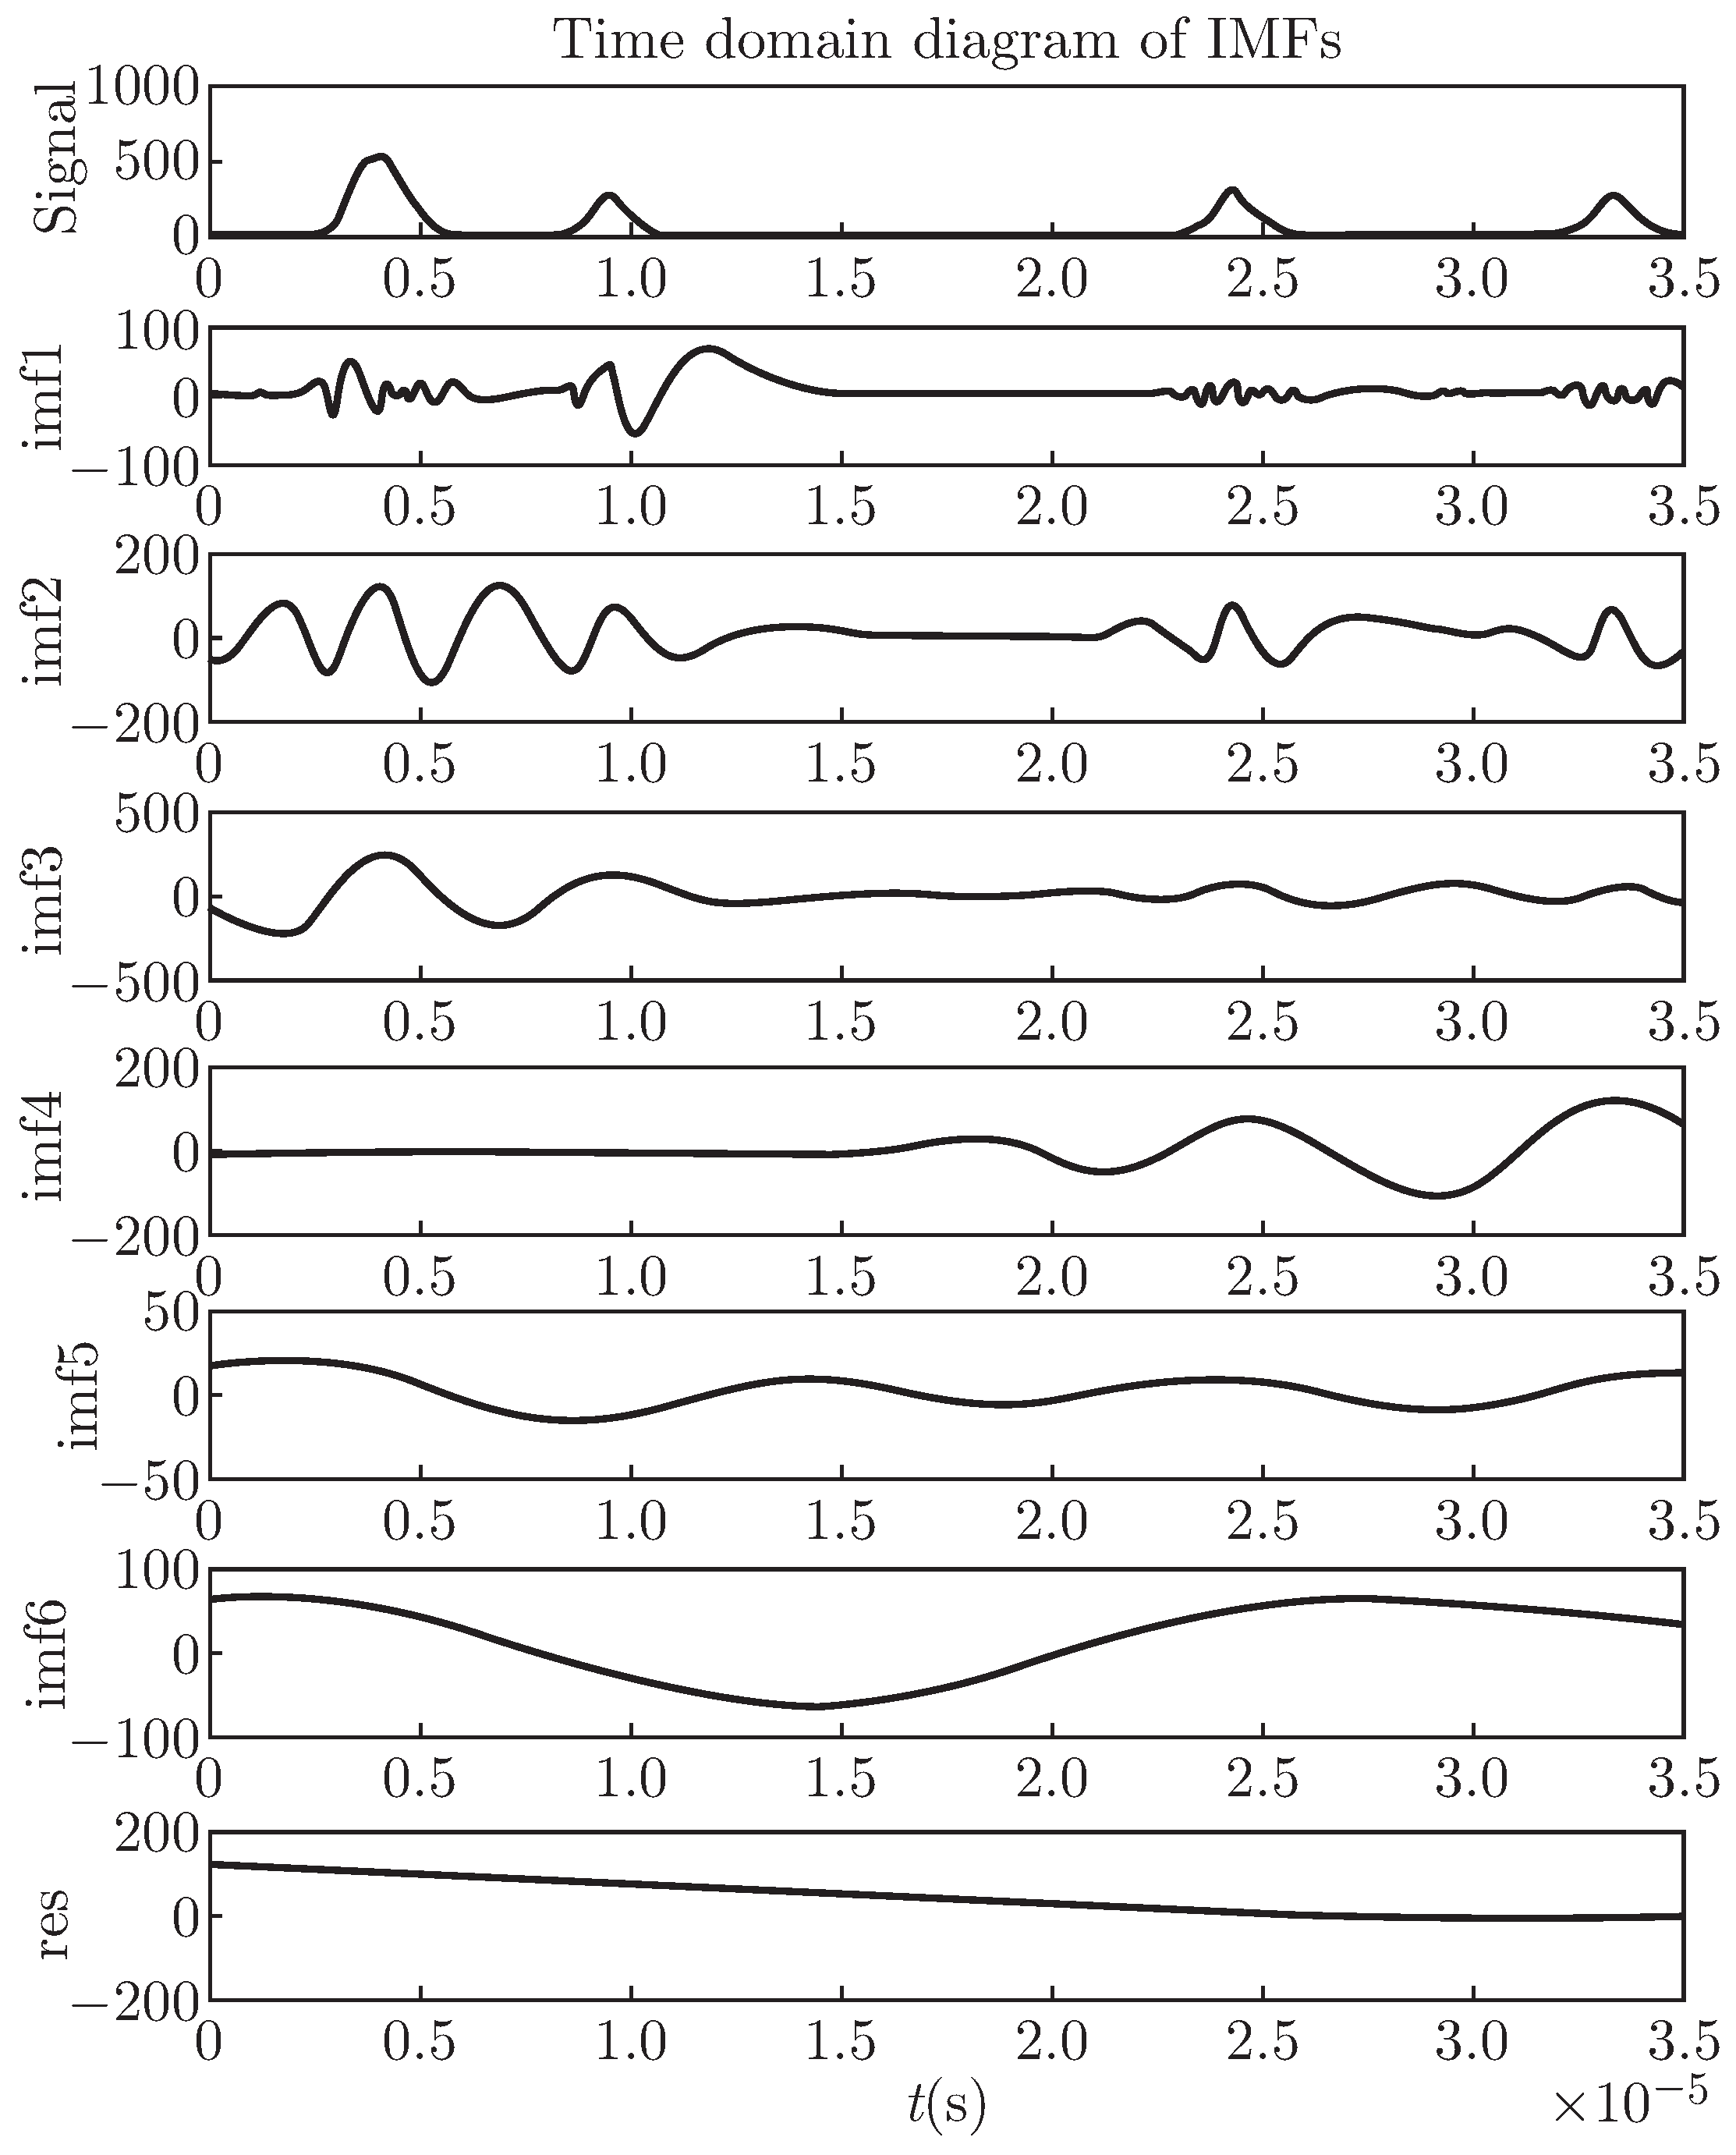
- Decompose the M signal by empirical mode decomposition and get all the IMF components, then residual components which are shown in Fig. 3.Fig. 3. Original signal and IMFS decomposed with EMD.
- (2)
- Transforming the M signal and each IMF by Hilbert Transformation and calculating the energy values of M signal and each IMF which can be denoted respectively by Es and EI(j), where j = 1, 2, ⋯ , n, and n is the number of IMFs.
- (3)
- Feature analysis and extraction. Since the energy value of IMFs between the unimodal signal and M-morphous signal have significant differences, then energy value of IMFs can be selected as the features to recognize blood cells. As shown in Fig. 3, we can see that the earlier IMF decomposed, the higher frequency it has. The first IMF represents the highest frequency component decomposed from original signal, and the following is hypo-highest, intermediate, low frequency component and finally we can get the monotonous trend component successively. At this time, we can select the components of IMF2, IMF3, IMF4, IMF5 that have been normalized as the feature components of signal which have a high correlation with original signal on frequency and energy according to the frequency characteristics of blood cell signal and the energy correlation of each IMF associating with original signal.
3 The BP Neural Network Model and the Training Process for Blood Cell Recognition
3.1 BP Neural Network
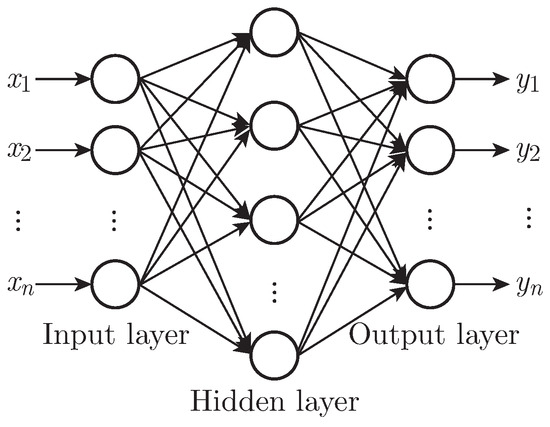
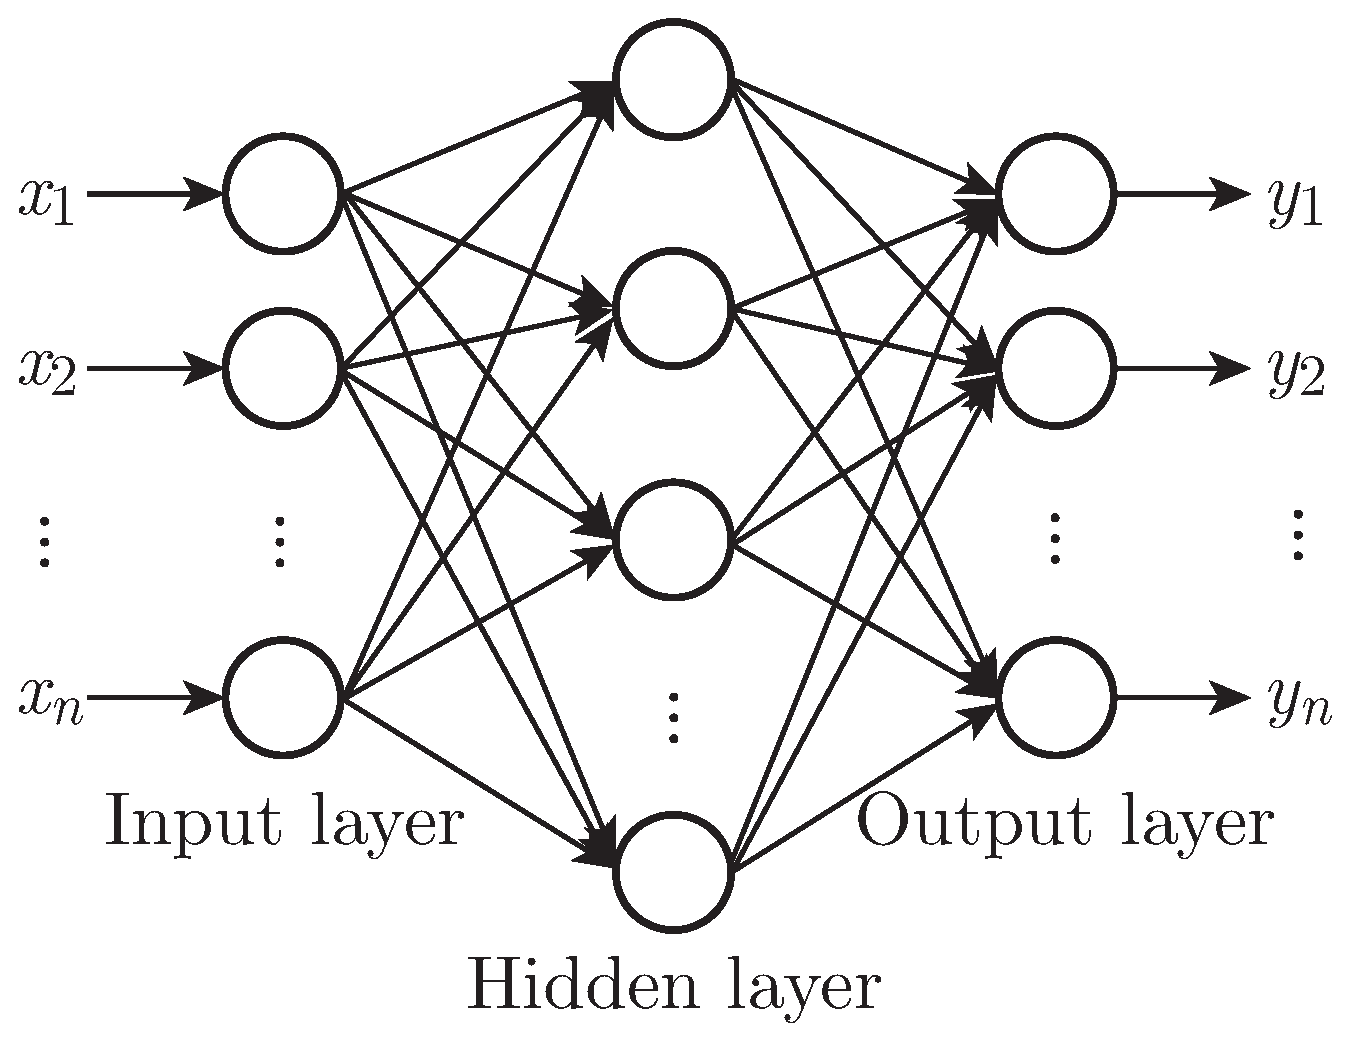
BP Neural Network (BPNN), which is a typical multilayer feedforward network, also known as error back propagation neural network, is a kind of artificial neural network commonly used in the world [10, 11]. BPNN has been successfully applied in pattern recognition, signal processing, automatic control and other fields. It generally consists of input layer, hidden layer and output layer and the structure of BPNN as shown in Fig. 4.
Fig. 4.
Original signal and IMFS decomposed with EMD.
3.2 The Establishment of the Network Model
According to the theorem of Kolmogorov, under the condition of reasonable neural network configuration and properly weights of the nodes, the three layer perceptron can approach any multiple nonlinear continuous functions with high level of accuracy [12]. A BP network with three-layer is adopted to identify the M signal which has used 11 nodes in the hidden layer and 2 nodes in output layer. In this paper, we select 7 time domain features and 4 energy features as the input vector of BPNN:
where EI(2), EI(3), EI(4), EI(5) are the energy of IMF2, IMF3, IMF4, IMF5 respectively. In order to ensure that the dimension of each component in the network input vector is equal, each input vector element in X should be normalized into the interval of [0, 1]. After the above processing, the input vector of BPNN can be represented as:
X = (X1, X2, , X3, X4, Y1, Y2, Y3, EI(2), EI(3), EI(4), EI(5))T
In order to accelerate the convergence speed, a improved single polarity S-shaped function was chosen for hidden layer neurons, which is shown as follows:
According to the characteristic of network output vector, a single polarity threshold function is adopted in output layer neurons, the formula of which is shown as follows:
According to the expected output result of the network, 2 nodes are adopted in the output layer and the method named as n − 1 is used to represent the output result. The expected output vector of unimodal signal can be represented by (1, 0) or (0, 1) while M signal can be represented by (1, 1).
The gradient descent method is used to make the modification of weight in proportion to error gradient descent and the adjusted weights can be represented as:
where η is learning factor, , , Ep is error function and Opj is the output of sample p at unit j.
ΔWji = ηδpjOpj, η > 0
In order to improve the training speed of the network, a momentum term is added in the above weight adjustment formula. So the iterative algorithm for vector of weights can be calculated as follows:
where W represents an matrix, X represents the input vector, η is a learning factor and α is the momentum coefficient, and meet the criteria of α ∈ (0, 1).
ΔW(t) = ηδX + αΔW(t − 1)
4 Experimental Simulations
4.1 Network Training
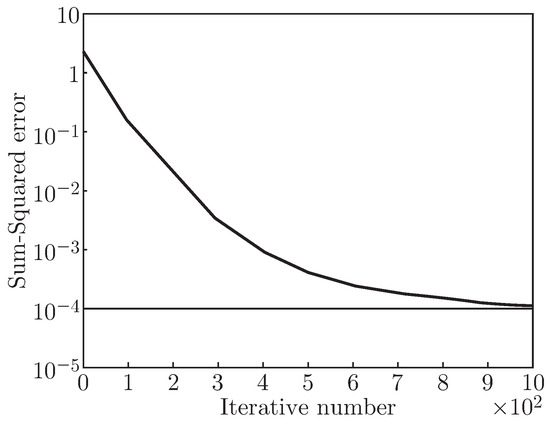
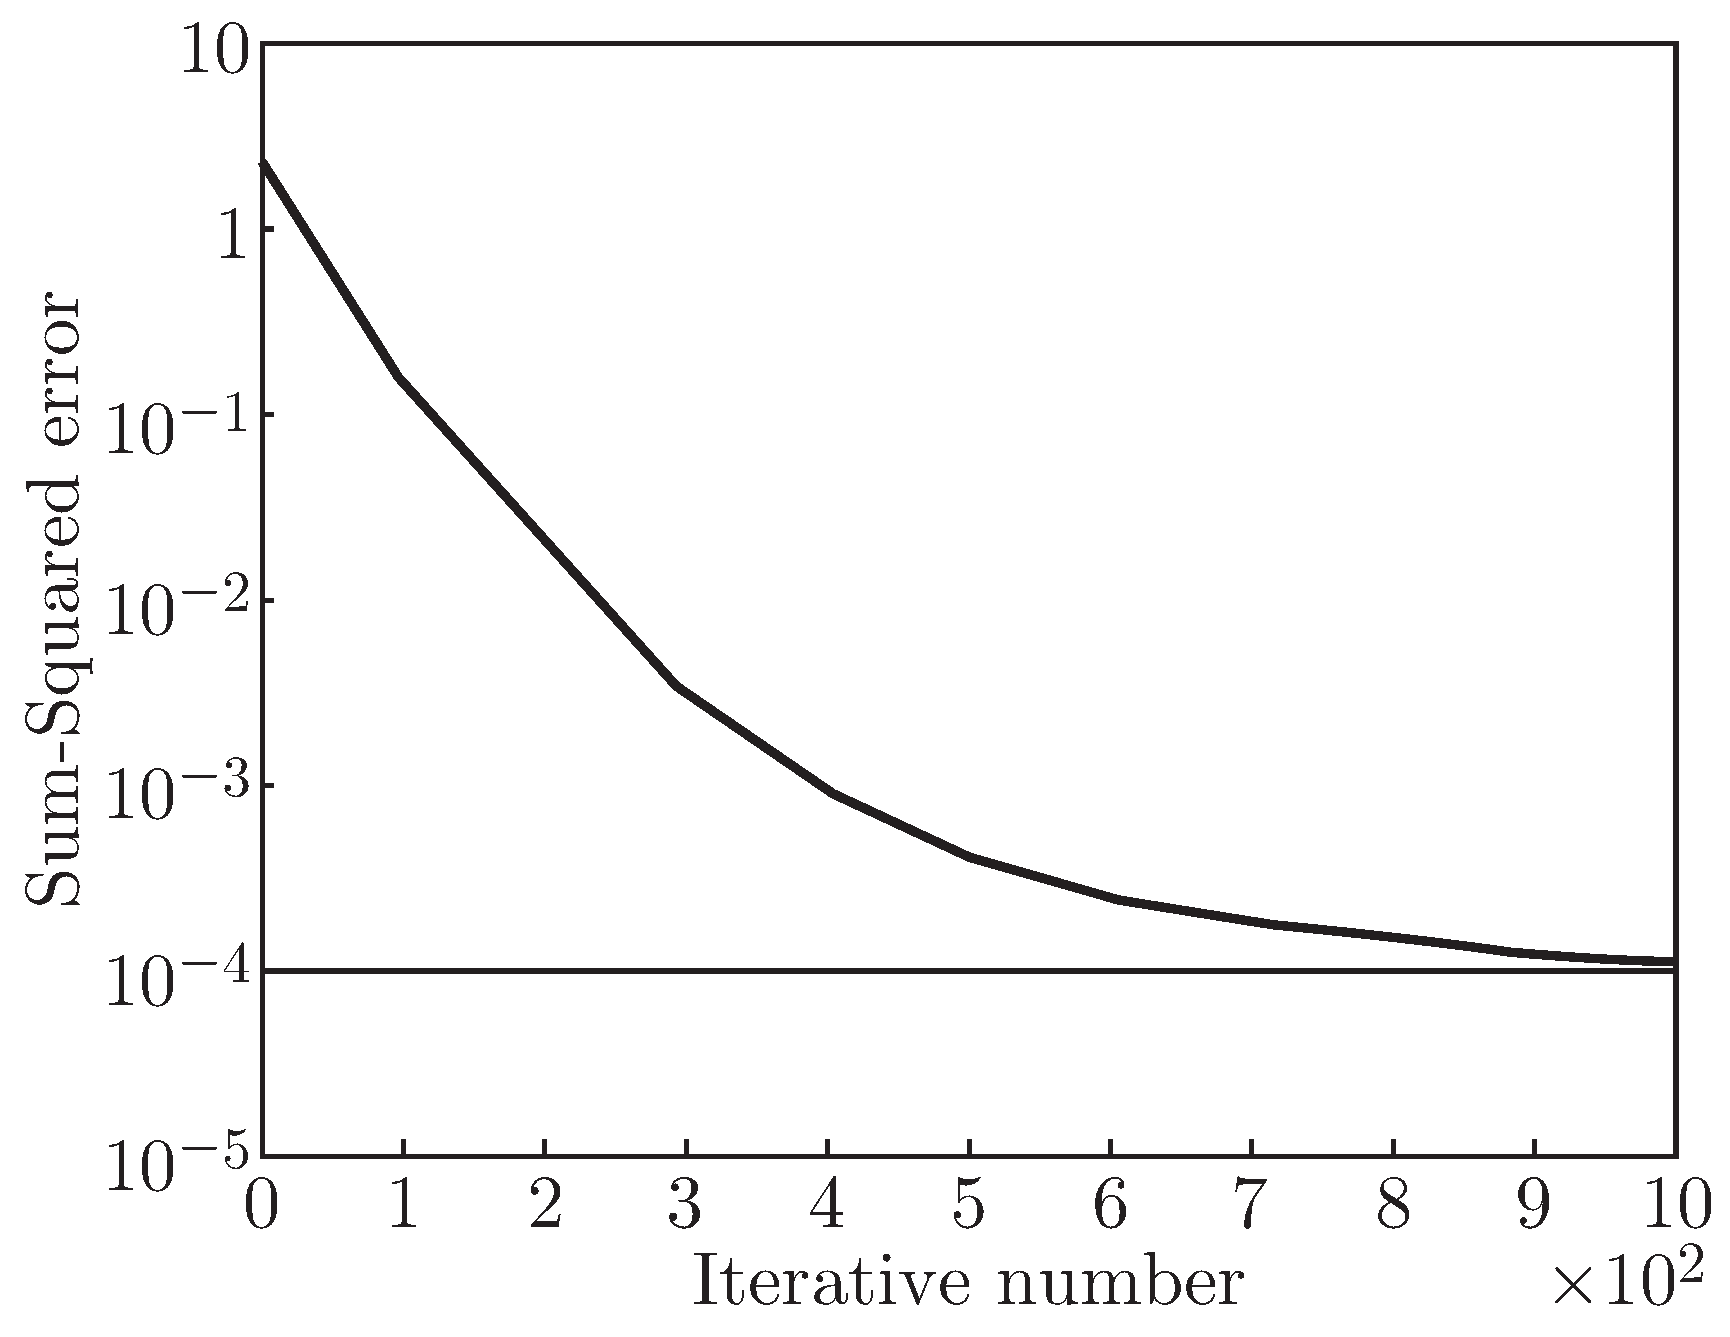
300 simulation signals which are constructed by the characteristics of M-morphous blood cell is selected as the experimental signal library, and 200 pulse signals are taken as training samples while take the rest as testing samples in signal library. Then the BP algorithm is used to train the neural network where the final error is set to 10−4 when the training of network ended and initial weights and thresholds are randomly given by Rands() function, the final the parameters of the network is shown in Table 1. The simulation result of network training error changed by the number of iterations is shown in Fig. 5, in which we can see the output error was reduced to 10−4 by the three-layer network after 2764 iteration trainings, so the neural network achieved the expected accuracy.
Table 1.
BP network parameters.
Fig. 5.
Error diagram of network training.
4.2 Experimental Simulation and Results Analysis
After the training of the BPNN, another test should be given to verification it. First of all, 90 samples were chosen randomly from sample set and divided them into three groups on average, then tested them by the algorithm proposed in this paper (HHT-BPNN) and the Analog Circuit Method (ACM) respectively, and calculated the average recognition inaccuracy for the samples of each group. The recognition results of the two algorithms are shown in Table 2.
Table 2.
Recognition results of M signal.
Simulation result shows that the maximum relative error for recognizing blood cell of M-morphous signal by the algorithm proposed in this paper was controlled within 2%, while the analog circuit method has a larger relative error. The reason is that the analog circuit method usually adopt trigger to transform pulse waves into square waves when counted the number of pulse signals which has the shortcomings of leak counting or miscounting, as a result, the method can not reflect the characteristics of blood cell signal and recognize M signal correctly. In conclusion, the algorithm proposed in this paper has a higher recognition accuracy relatively.
At the same time, 10 M-signals of blood cells were collected as testing signals which is take from imported hematology analyzer SYSMEX KX-21. The counting results by the algorithm proposed and the instrument are shown in Table 3.
Table 3.
Recognition result of blood cells.
The simulation result shows that the M-signal can be recognized perfectly by the algorithm proposed in the paper when taking the actual collected M signals as testing samples, and its average accurate recognition rate is above 94%, which means that this algorithm has a good performance of recognition.
5 Conclusions
HHT algorithm is a time-frequency analysis method without any prior knowledge which is suitable for nonlinear and non-stationary signals. In addition, BP neural network has the advantages of self-organization, self-study and fault-tolerance that can overcome some disadvantages in traditional classication methods and greatly improved the recognition accuracy. Therefore, the HHT-BPNN algorithm put forward in this paper has a good ability of recognition for M-morphous blood cell signal under the conditions of BP neural network with a reasonable structure and parameters.
References
- Percannella, G.; Soda, P.; Vento, M. Mitotic cells recognition in HEp-2 images. Pattern Recognit. Lett. 2014, 45, 136–144. [Google Scholar] [CrossRef] [Scilit]
- Huang, Y.; Chen, M.; He, W.; et al. A parameter selecting method of Newton’s one-step error reconstructor in electrical impedance tomography imaging. J. Inf. Comput. Sci. 2013, 10, 729–741. [Google Scholar]
- An, J.; Zhang, S. A new method of designing electrical impedance matching network for piezoelectric ultrasound transducer. J. Eng. Sci. Technol. Rev. 2014, 7, 71–75. [Google Scholar] [CrossRef] [Scilit]
- Saxena, D.; Singh, S.N.; Verma, K.S.; et al. HHT-based classification of composite power quality events. Int. J. Energy Sect. Manag. 2014, 8, 146–159. [Google Scholar] [CrossRef] [Scilit]
- Kai, F.; Qu, J.; Chai, Y.; et al. Classification of seizure based on the time-frequency image of EEG signals using HHT and SVM. Biomed. Signal Process. Control 2014, 13, 15–22. [Google Scholar] [CrossRef] [Scilit]
- Tian, Z.; Gao, X.; Li, K. Time-delay prediction method of networked control system based on EMD and LS-SVM. Acta Electron. Sin. 2014, 42, 868–874. [Google Scholar]
- Dai, P.; Chen, F.; Cao, Z.; et al. An EMD based algorithm for non-contact physiological monitoring. J. Comput. Inf. Syst. 2013, 9, 1061–1069. [Google Scholar]
- Yang, Z.; Ling, B.W.-K.; Bingham, C. Trend extraction based on separations of consecutive empirical mode decomposition components in Hilbert marginal spectrum. Meas. J. Int. Meas. Confed. 2013, 46, 2481–2491. [Google Scholar] [CrossRef] [Scilit]
- Wang, B.; Wang, Z.; Xu, J. A new coal-rock interface recognition method based on Hilbert marginal spectrum distribution characteristics. J. Comput. Inf. Syst. 2012, 8, 8137–8142. [Google Scholar]
- Sun, W.; Ren, Q. BP neural network application in wind turbine type selection based on particle swarm optimization. J. Inf. Comput. Sci. 2014, 11, 2415–2423. [Google Scholar] [CrossRef] [Scilit]
- Hu, Y.; Wang, Z.; Wang, Y.; et al. Prediction of milling force based on multiple linear regression and BP neural network. J. Comput. Inf. Syst. 2014, 10, 3691–3700. [Google Scholar]
- Castillo, L.E.; Cament, L.A.; Galdames, F.J.; et al. Illumination normalisation method using Kolmogorov-Nagumo-based statistics for face recognition. Electron. Lett. 2014, 50, 940–942. [Google Scholar] [CrossRef] [Scilit]

© 2015 Textile Bioengineering and Informatics Society. This article is an open access article distributed under the terms and conditions of the Creative Commons Attribution (CC BY) license (https://creativecommons.org/licenses/by/4.0/).