


Abstract
An Empirical Mode Decomposition (EMD) method to analyze the similarities of protein sequences is proposed. The EMD method was used to divide a signal sequence converted from a protein sequence into a group of well-behaved Intrinsic Mode Functions (IMFs) and a residue which is monotonic or a trend. This is so that the similarities can be compared among protein sequences by the corresponding residues conveniently and intuitively. This work verifies the method’s suitability by using the cytochrome c protein sequences of seven different species.
1. Introduction
Protein sequence analysis have been widely used in structure and function prediction such as phylogenesis studies and the study on different conservation pattern recognition on the basis of molecular biological analysis.
Various approaches have been explored for protein sequences. Recently, graphical representations of proteins have emerged as a powerful tool for sequence analysis. The advantage of these representations is that it creates special patterns of protein sequences that can be recognized intuitively by the human eyes. These methods provide a simple way for viewing, sorting, and comparing various structures, and making the analysis of similarity among protein sequences. It has been successfully applied to genome sequences of many species as demonstrated [1,2,3,4,5,6,7,8,9,10,11,12,13,14].
The protein sequences could be converted into nonlinear signal sequences by graphical representations of proteins, while the EMD method is a nonlinear, non-stationary data processing method proposed by Norden Huang [15,16] et al. in 1998. With this method, a complicated data set can be decomposed into a small number of intrinsic mode functions (IMFs) that admit well-behaved Hilbert transforms, with an additional residue. As one of the most popular tools in signal processing, the EMD method [17] has been used to divide the DNA sequences into a set of IMFs and residues, this helps to establish the similarity of the different DNA sequences by comparing their residues. Although the similarity of proteins have been studied in the paper [18], they don’t focus on the residues but the cross-correlation functions between the IMFs.
In this paper, we extend our method [17] to protein sequences. Cytochrome c is a highly conserved protein across the spectrum of species, found in plants, animals, and many unicellular organisms which is used to transport oxygen around the body for respiration. When the specimens of cytochrome c from different organisms are compared, it is found that the more widely separated two species are in their macroscopic features, the greater the degree of difference in their protein sequences, therefore we select cytochrome c protein sequences of seven species [19] shown in Table 1 - the human, the pig, the dog, the kangaroo, the wheat germ, the green bean and the sunflower seed -as our research objects. Then the EMD method was used to carry out the similarity analysis. In other words, cytochrome c was firstly transformed from protein sequences into nonlinear signal sequences on the basis of graphical representations; after that the EMD method was used to obtain the corresponding IMFs and the residues of the protein sequences which was then compared. Compared with other methods, our EMD method based on graphical representations is more visual and is simple and easy to implement. However, as a new method, there are still some issues to be addressed, such as it has not until now, formed an independent and complete theoretical system.
Table 1.
The cytochrome c protein sequences of seven species.
2. The EMD Method
The EMD [15,16] method is an algorithm for the analysis of nonlinear signals that runs by dividing them into a number of amplitude and frequency modulated zero mean signals, named Intrinsic Mode Functions (IMFs).
By using this data-driven algorithm, a non-linear signal s(t) can be decomposed adaptively as follows:
where ci(t) is an IMF and rn(t) is the residue.
Each IMF must satisfy the following two terms: (1) the number of extreme and the number of zero crossings must either be equal or differ by at most one in the whole data set; (2) at any point, the mean value of the envelope defined by the local maxima and the envelope defined by the local minima is close to zero.
Actually, the EMD method is a sifting process by extracting the IMFs from the signal until the residue being either the mean trend or a constant. At the same time, one can reconstruct the original signal just by adding all IMFs and the residue without any information loss.
3. Graphical Representation for the Protein Sequences
In order to analyze the protein sequence, it was transformed into a one-dimensional or multidimensional discrete complex sequence; this method is called signalization or graphical representation of a protein sequence. Thus, a nonlinear signal sequence and a graph can be obtained.
Hydrophobicity is one of the most important physicochemical properties of proteins. This property is very essential so that it is considered as one of the fundamental components that govern protein folding. Furthermore, the hydrophobic characteristics of a protein perform a fundamental role defining its behavior in solution and how the protein relates to other biomolecules.
On the basis of physicochemical properties of amino acids, a protein sequence can be transformed into a numerical signal sequence and a 2-D graph, where amino acids are represented by their hydrophobicity values (Kyte-Doolittle scale) as listed in Table 2.
Table 2.
Hydrophobicity values of amino acids.
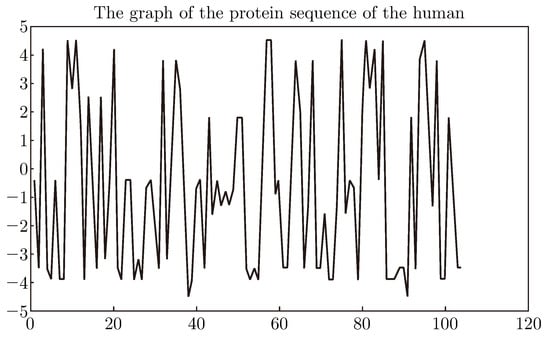
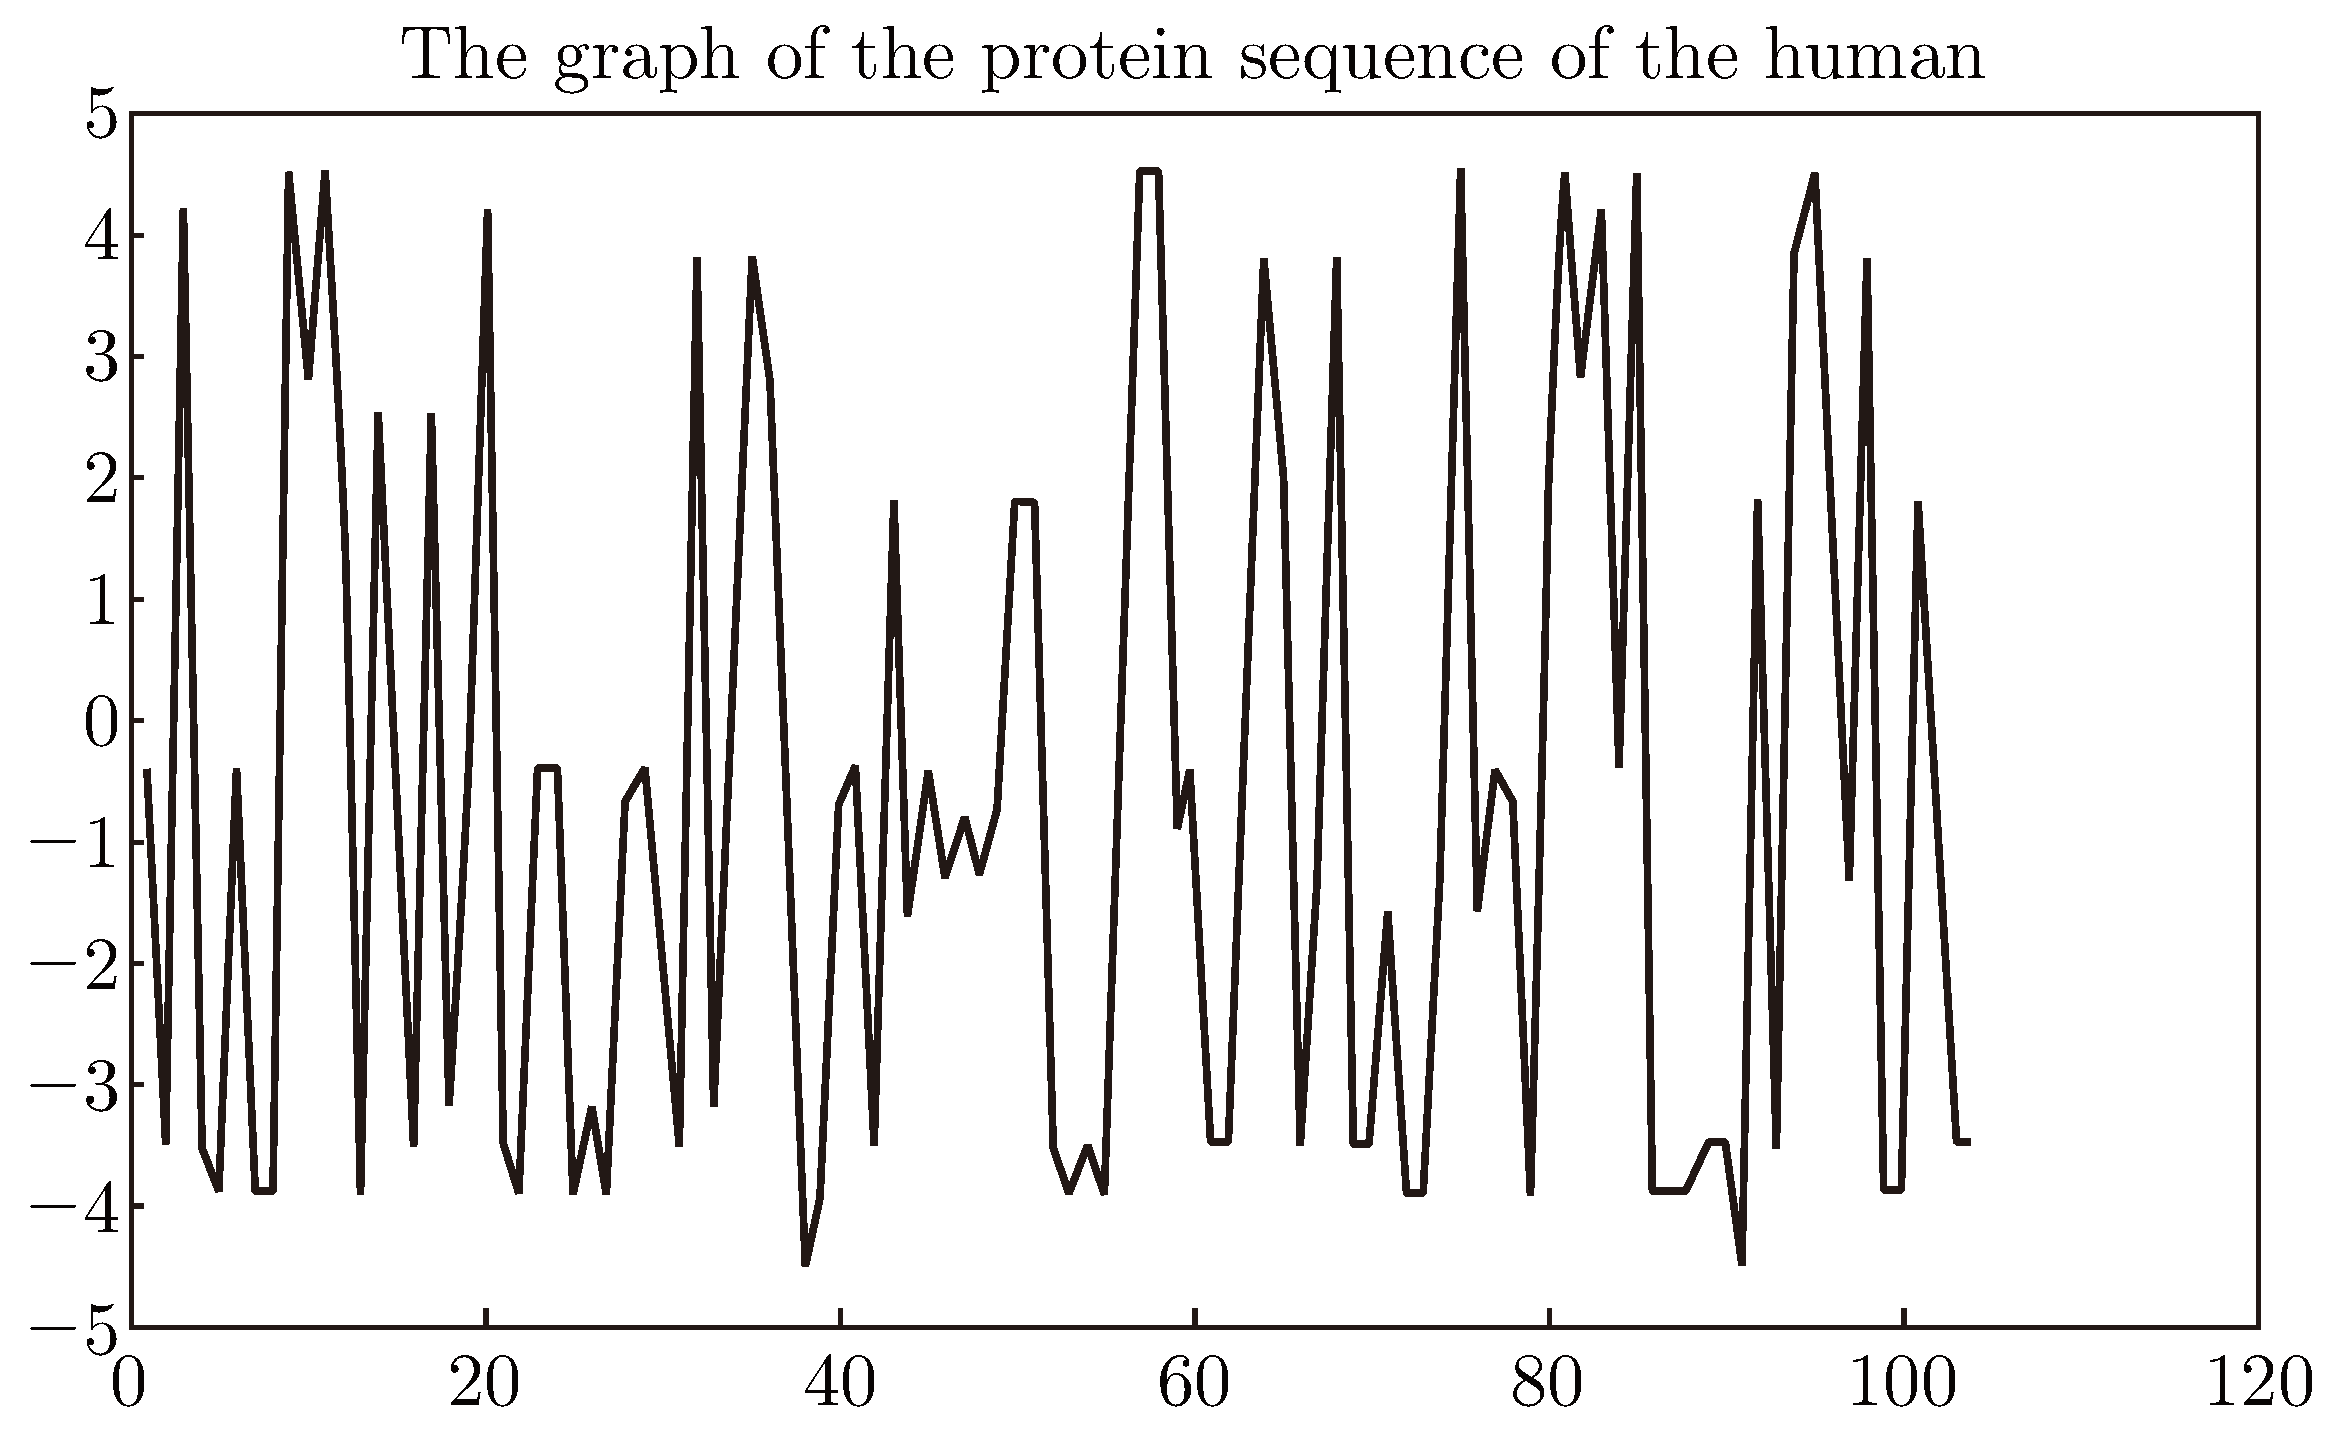
According to Table 1 and Table 2, the one-dimensional signal sequence can be obtained that corresponds to the protein sequence. For example, the signal sequence can be obtained which corresponds to the cytochrome c protein sequence of the human whose primary structure consists of a chain of about 104 amino acids (see Figure 1).
Figure 1.
The graph of the protein sequence of the human.
Although there are many such methods that could convert a protein sequence to a numerical sequence, this method was used for its simplicity and the main purpose is to verify the EMD method’s suitability for similarities analysis of protein sequences.
4. Similarity Analysis of the Cytochrome C Protein Sequences
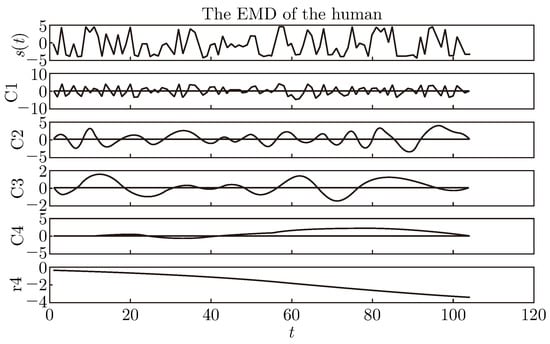
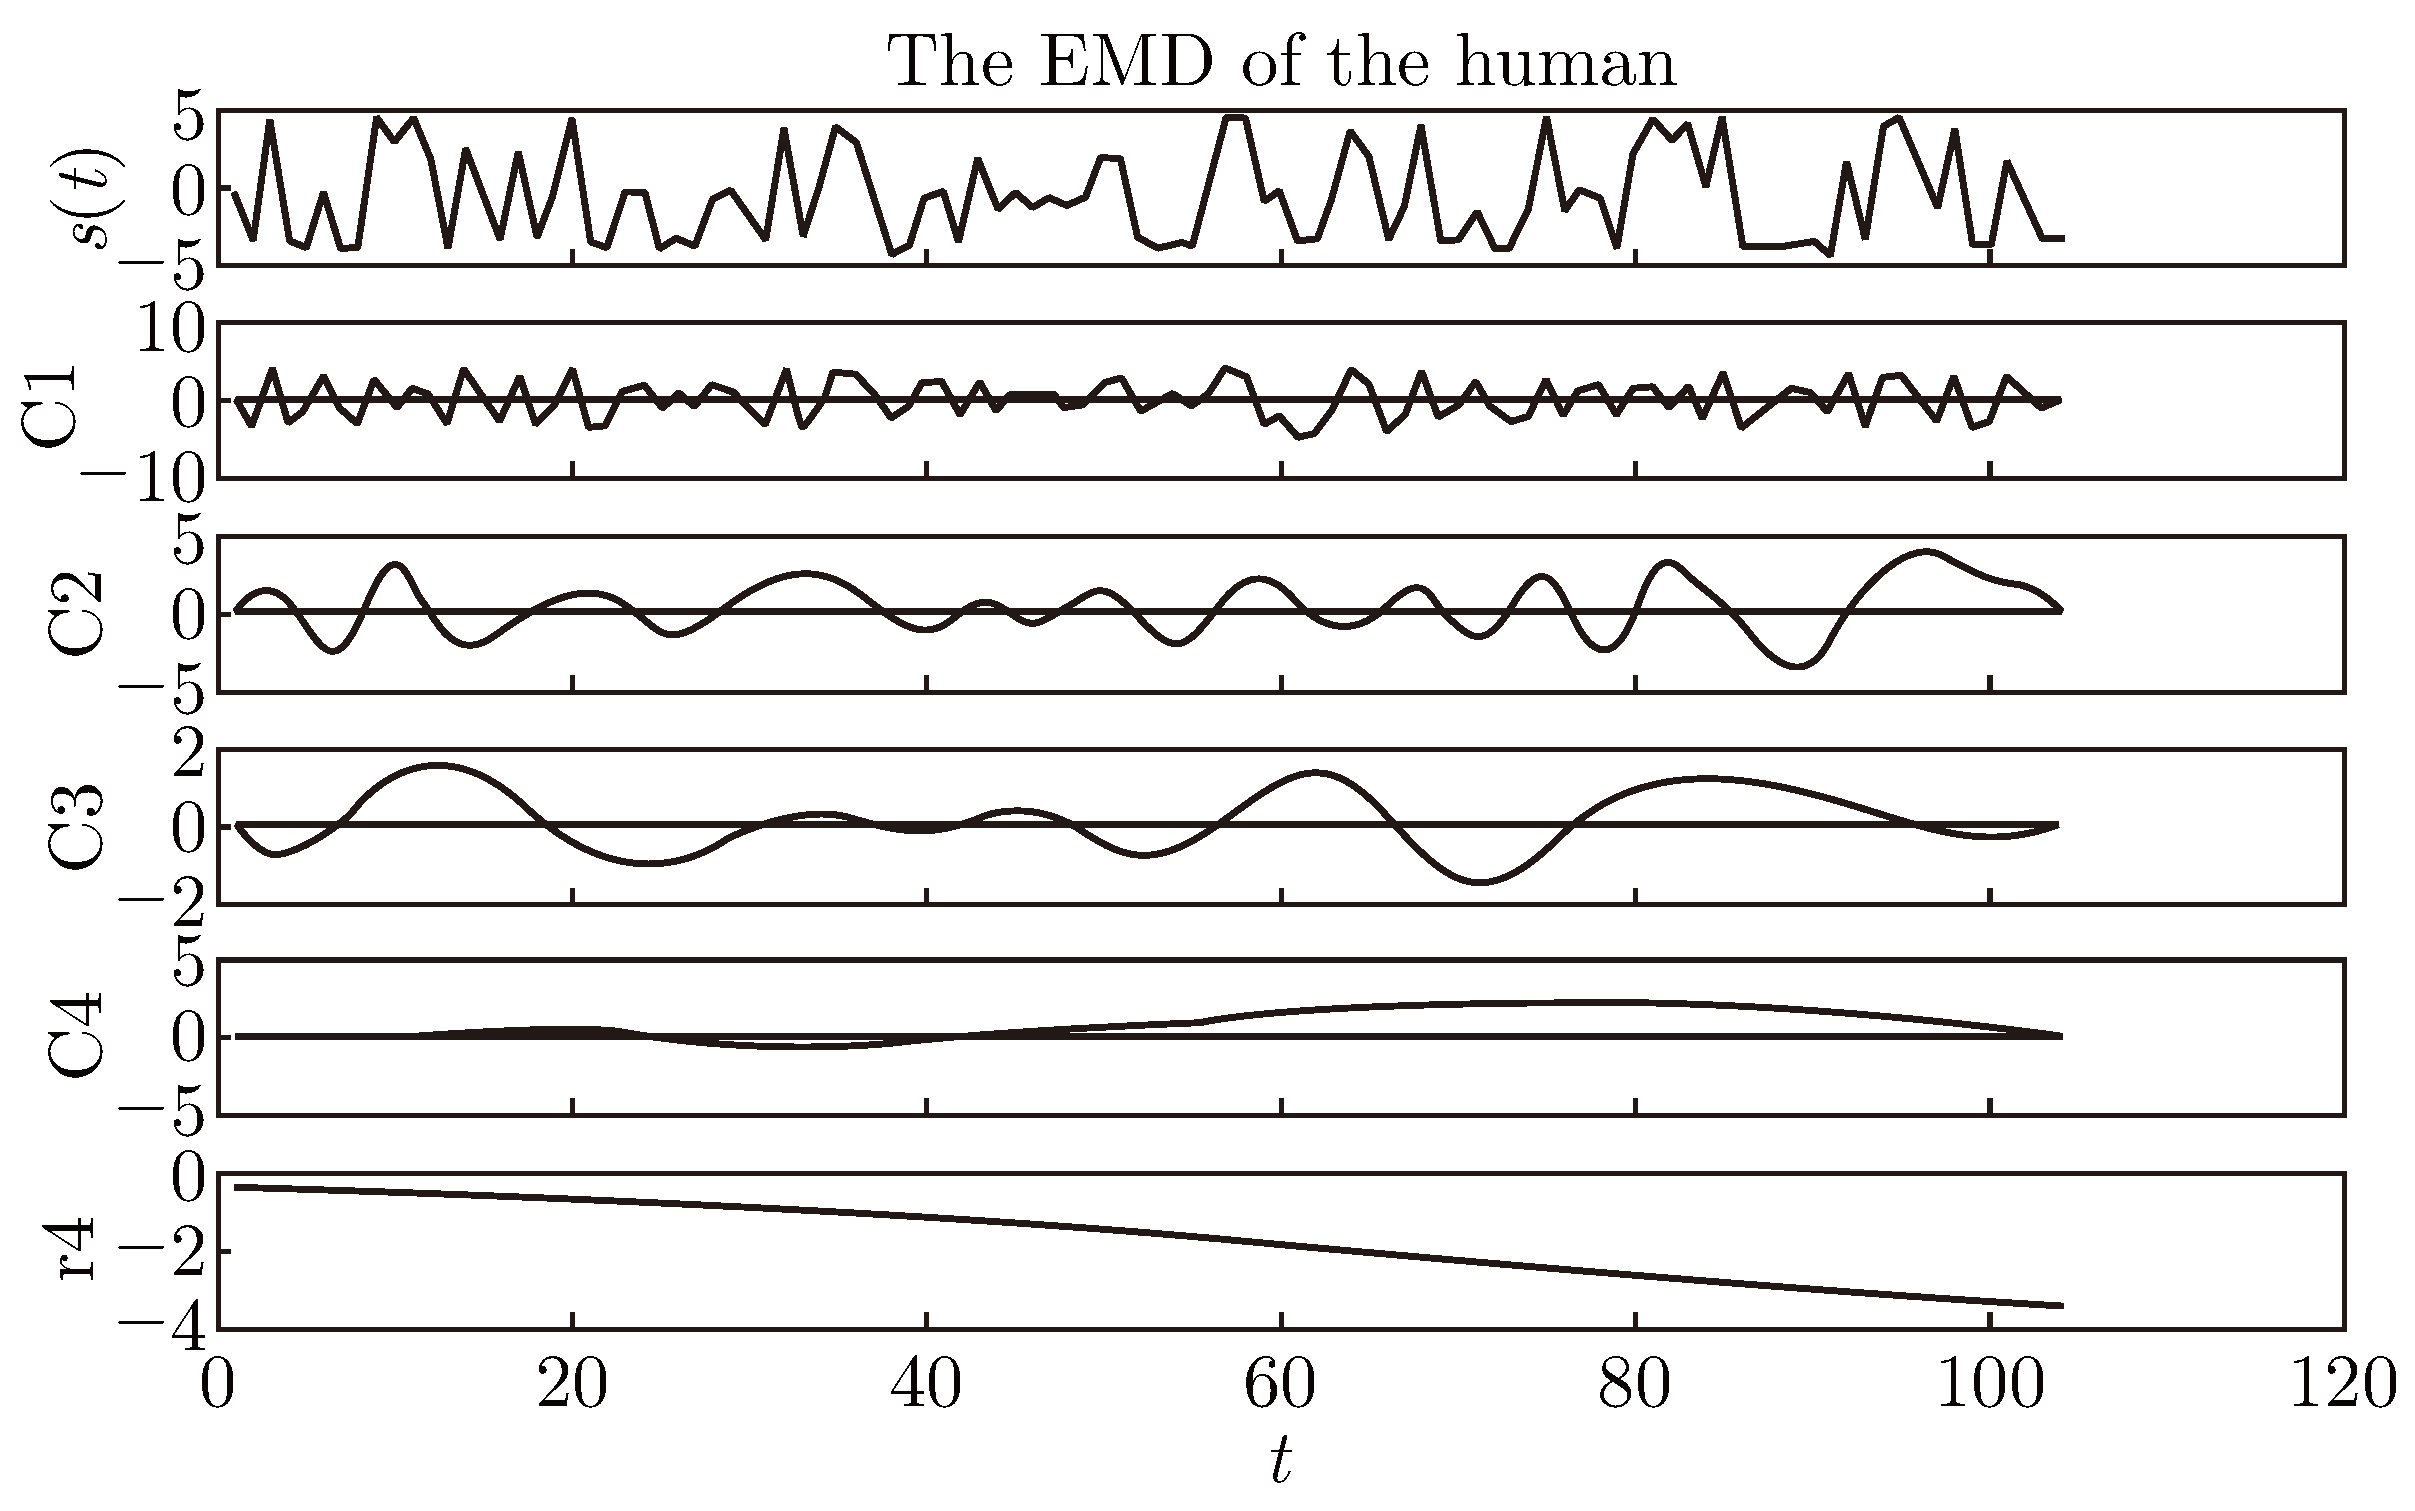
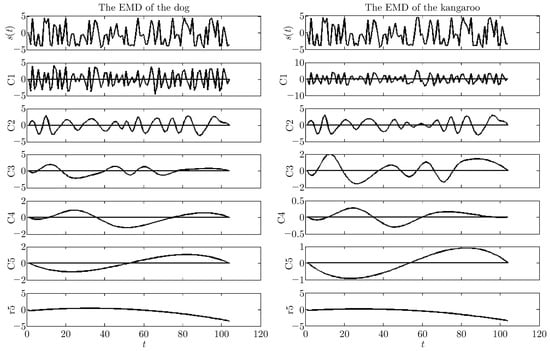
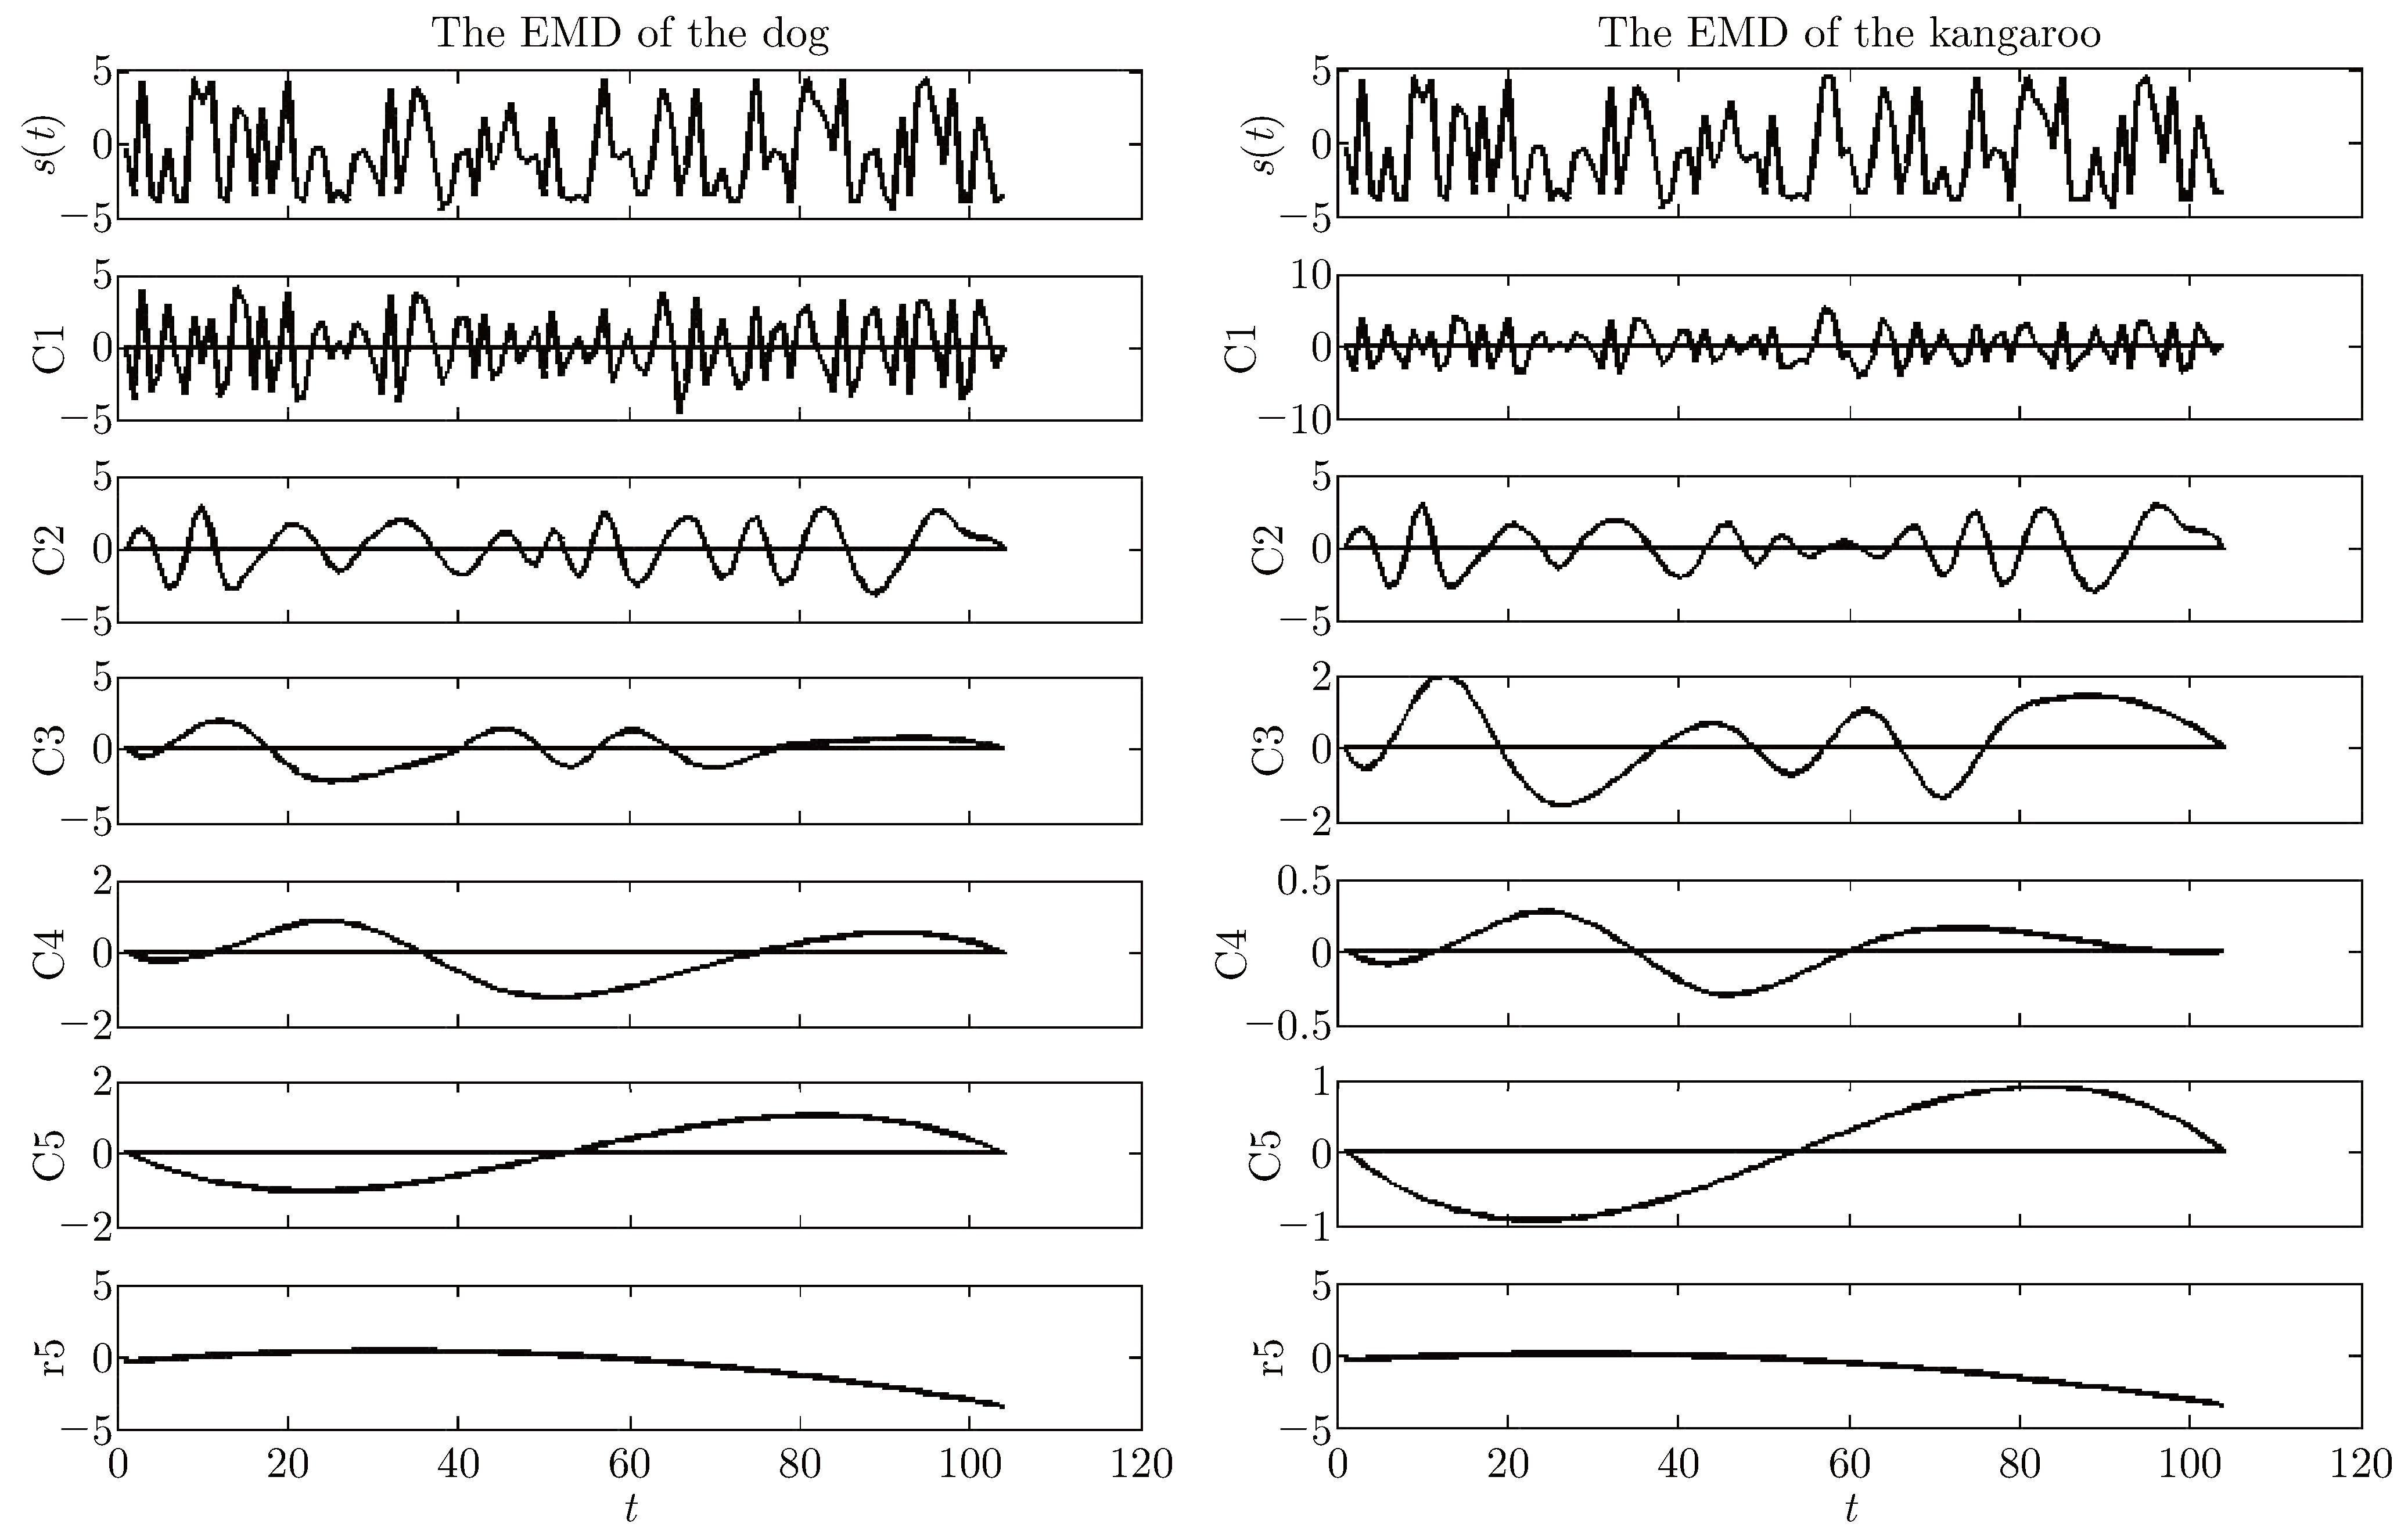
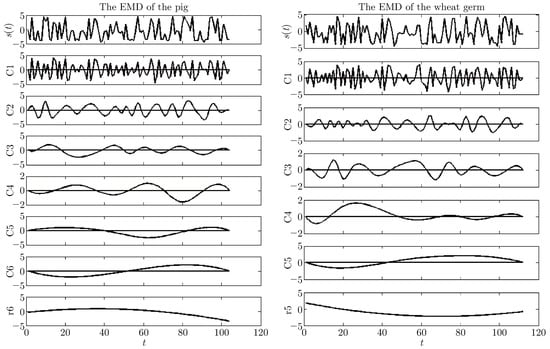
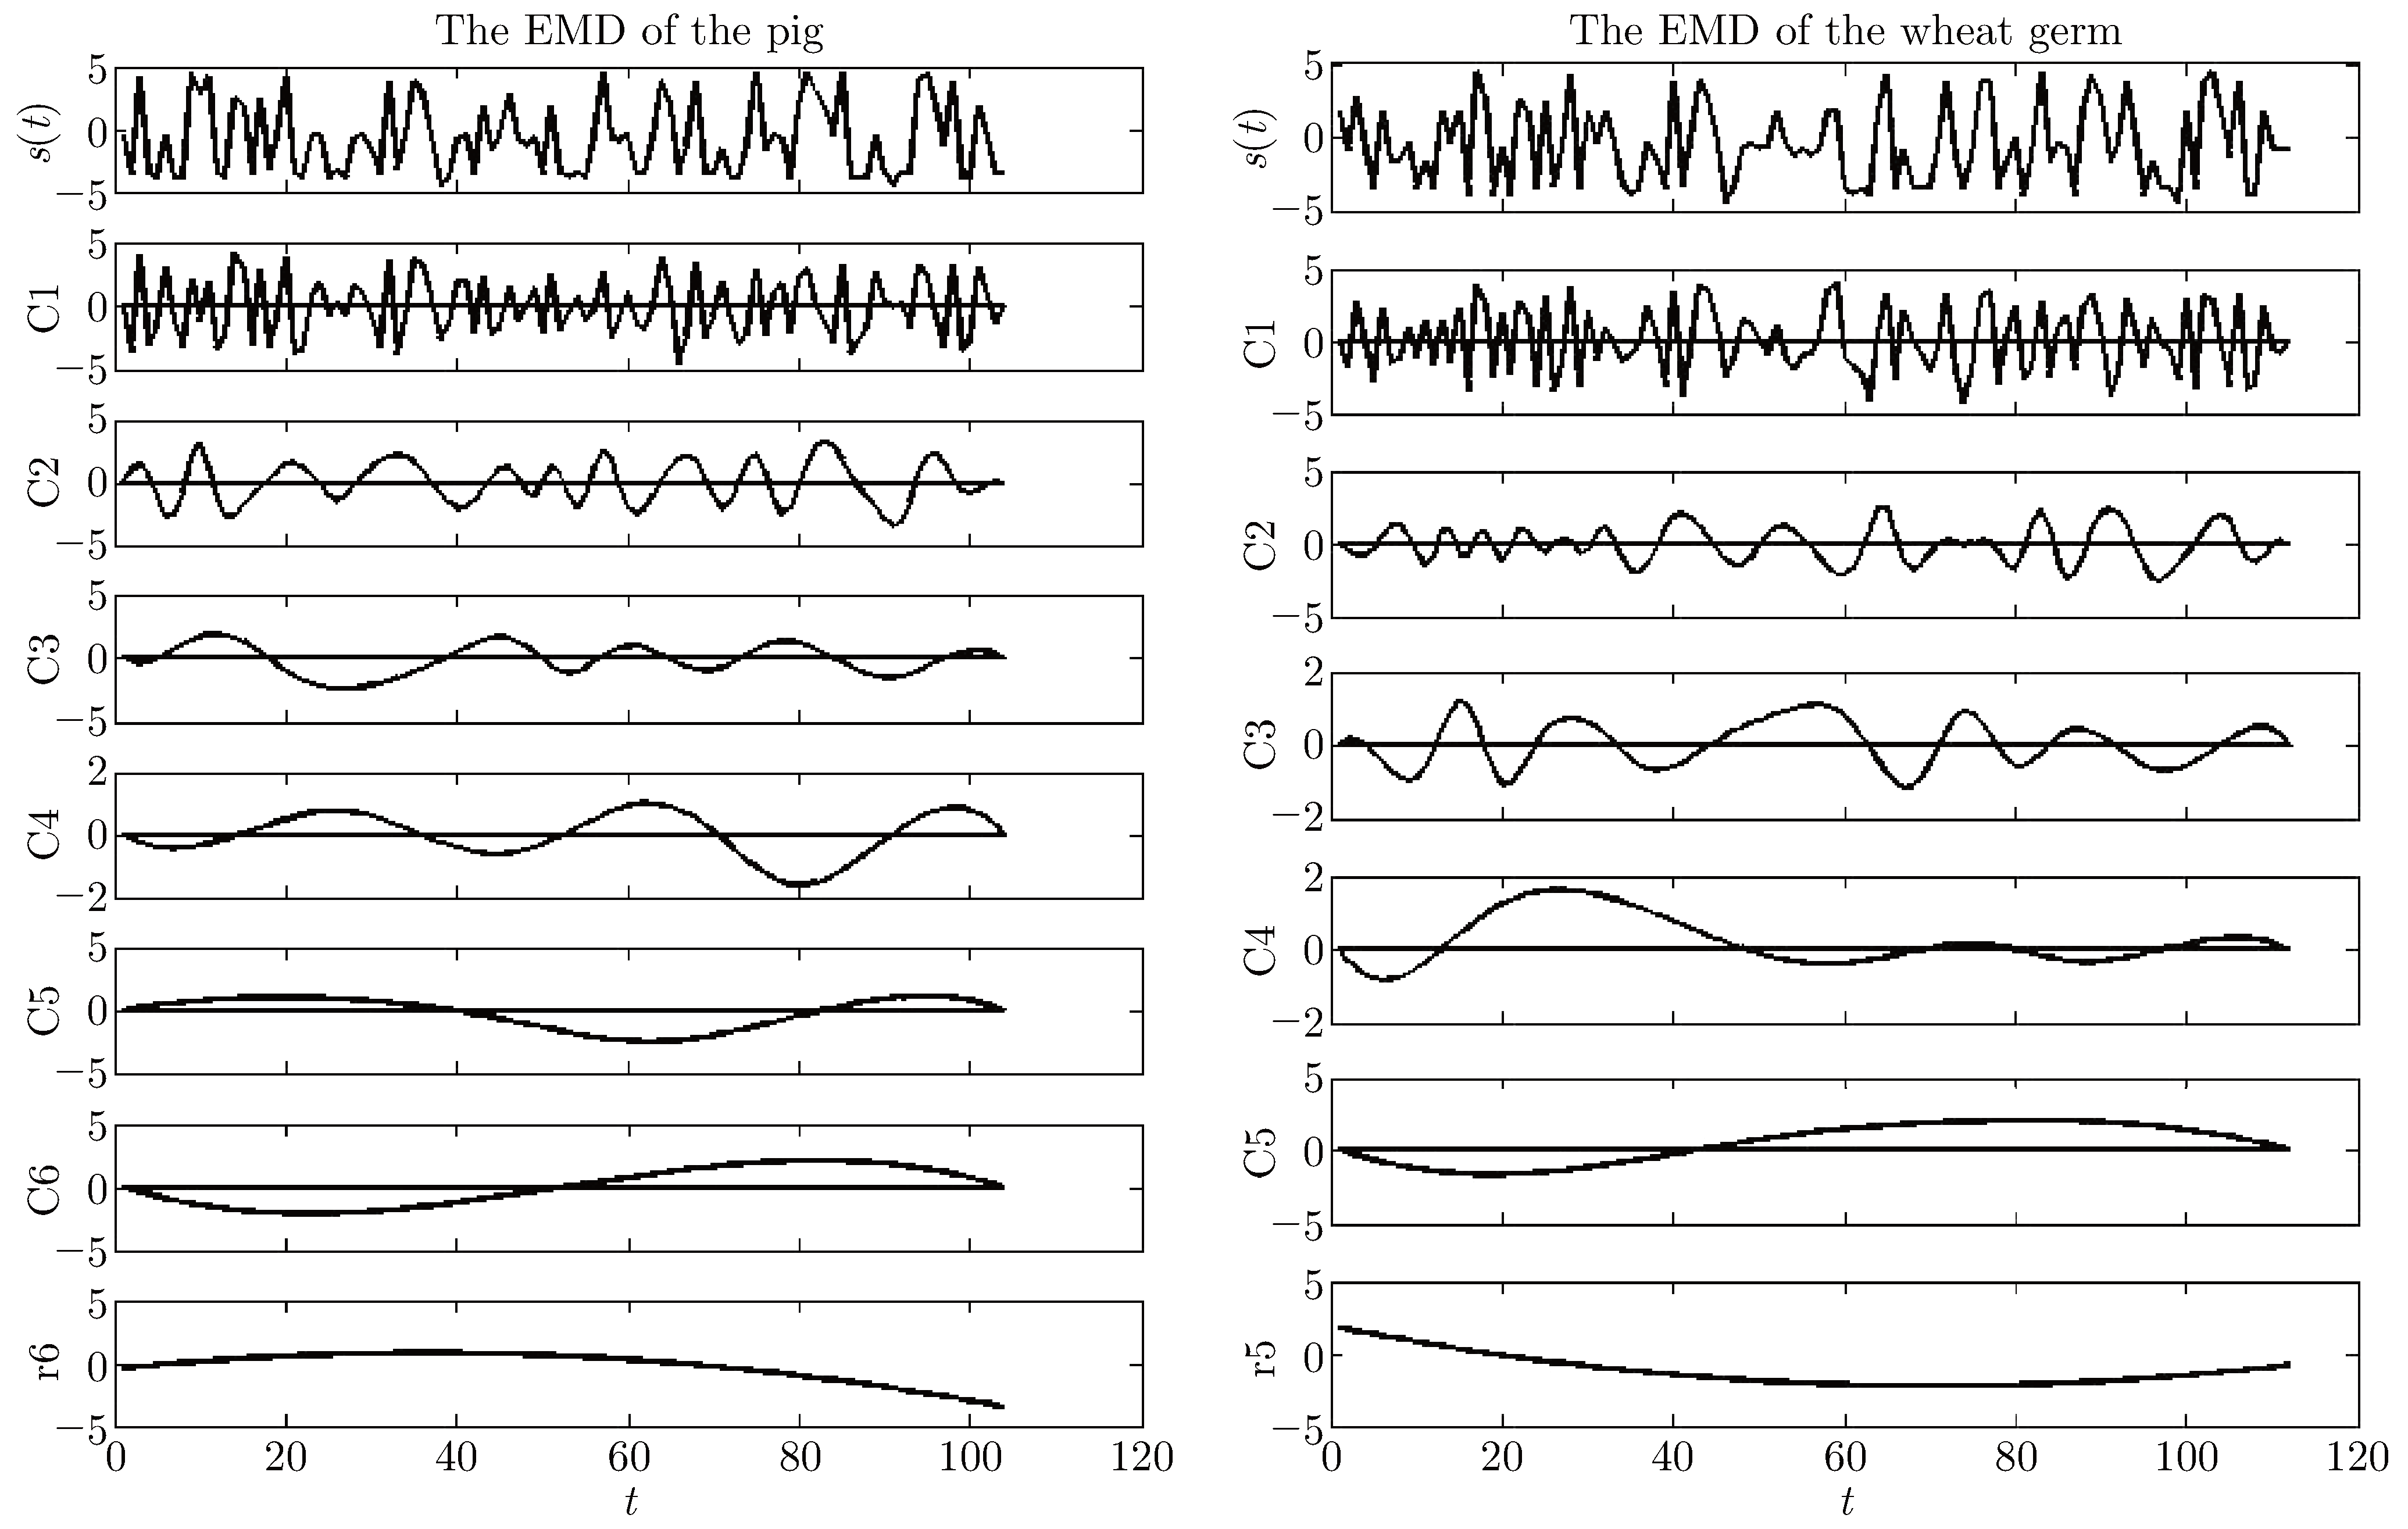
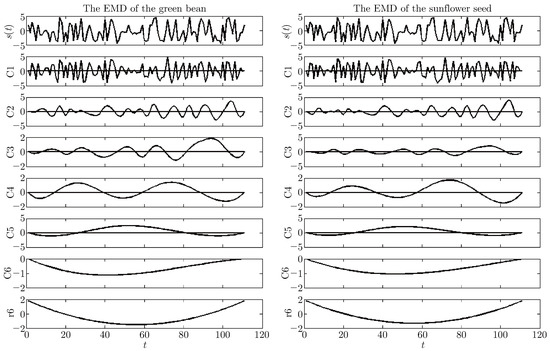
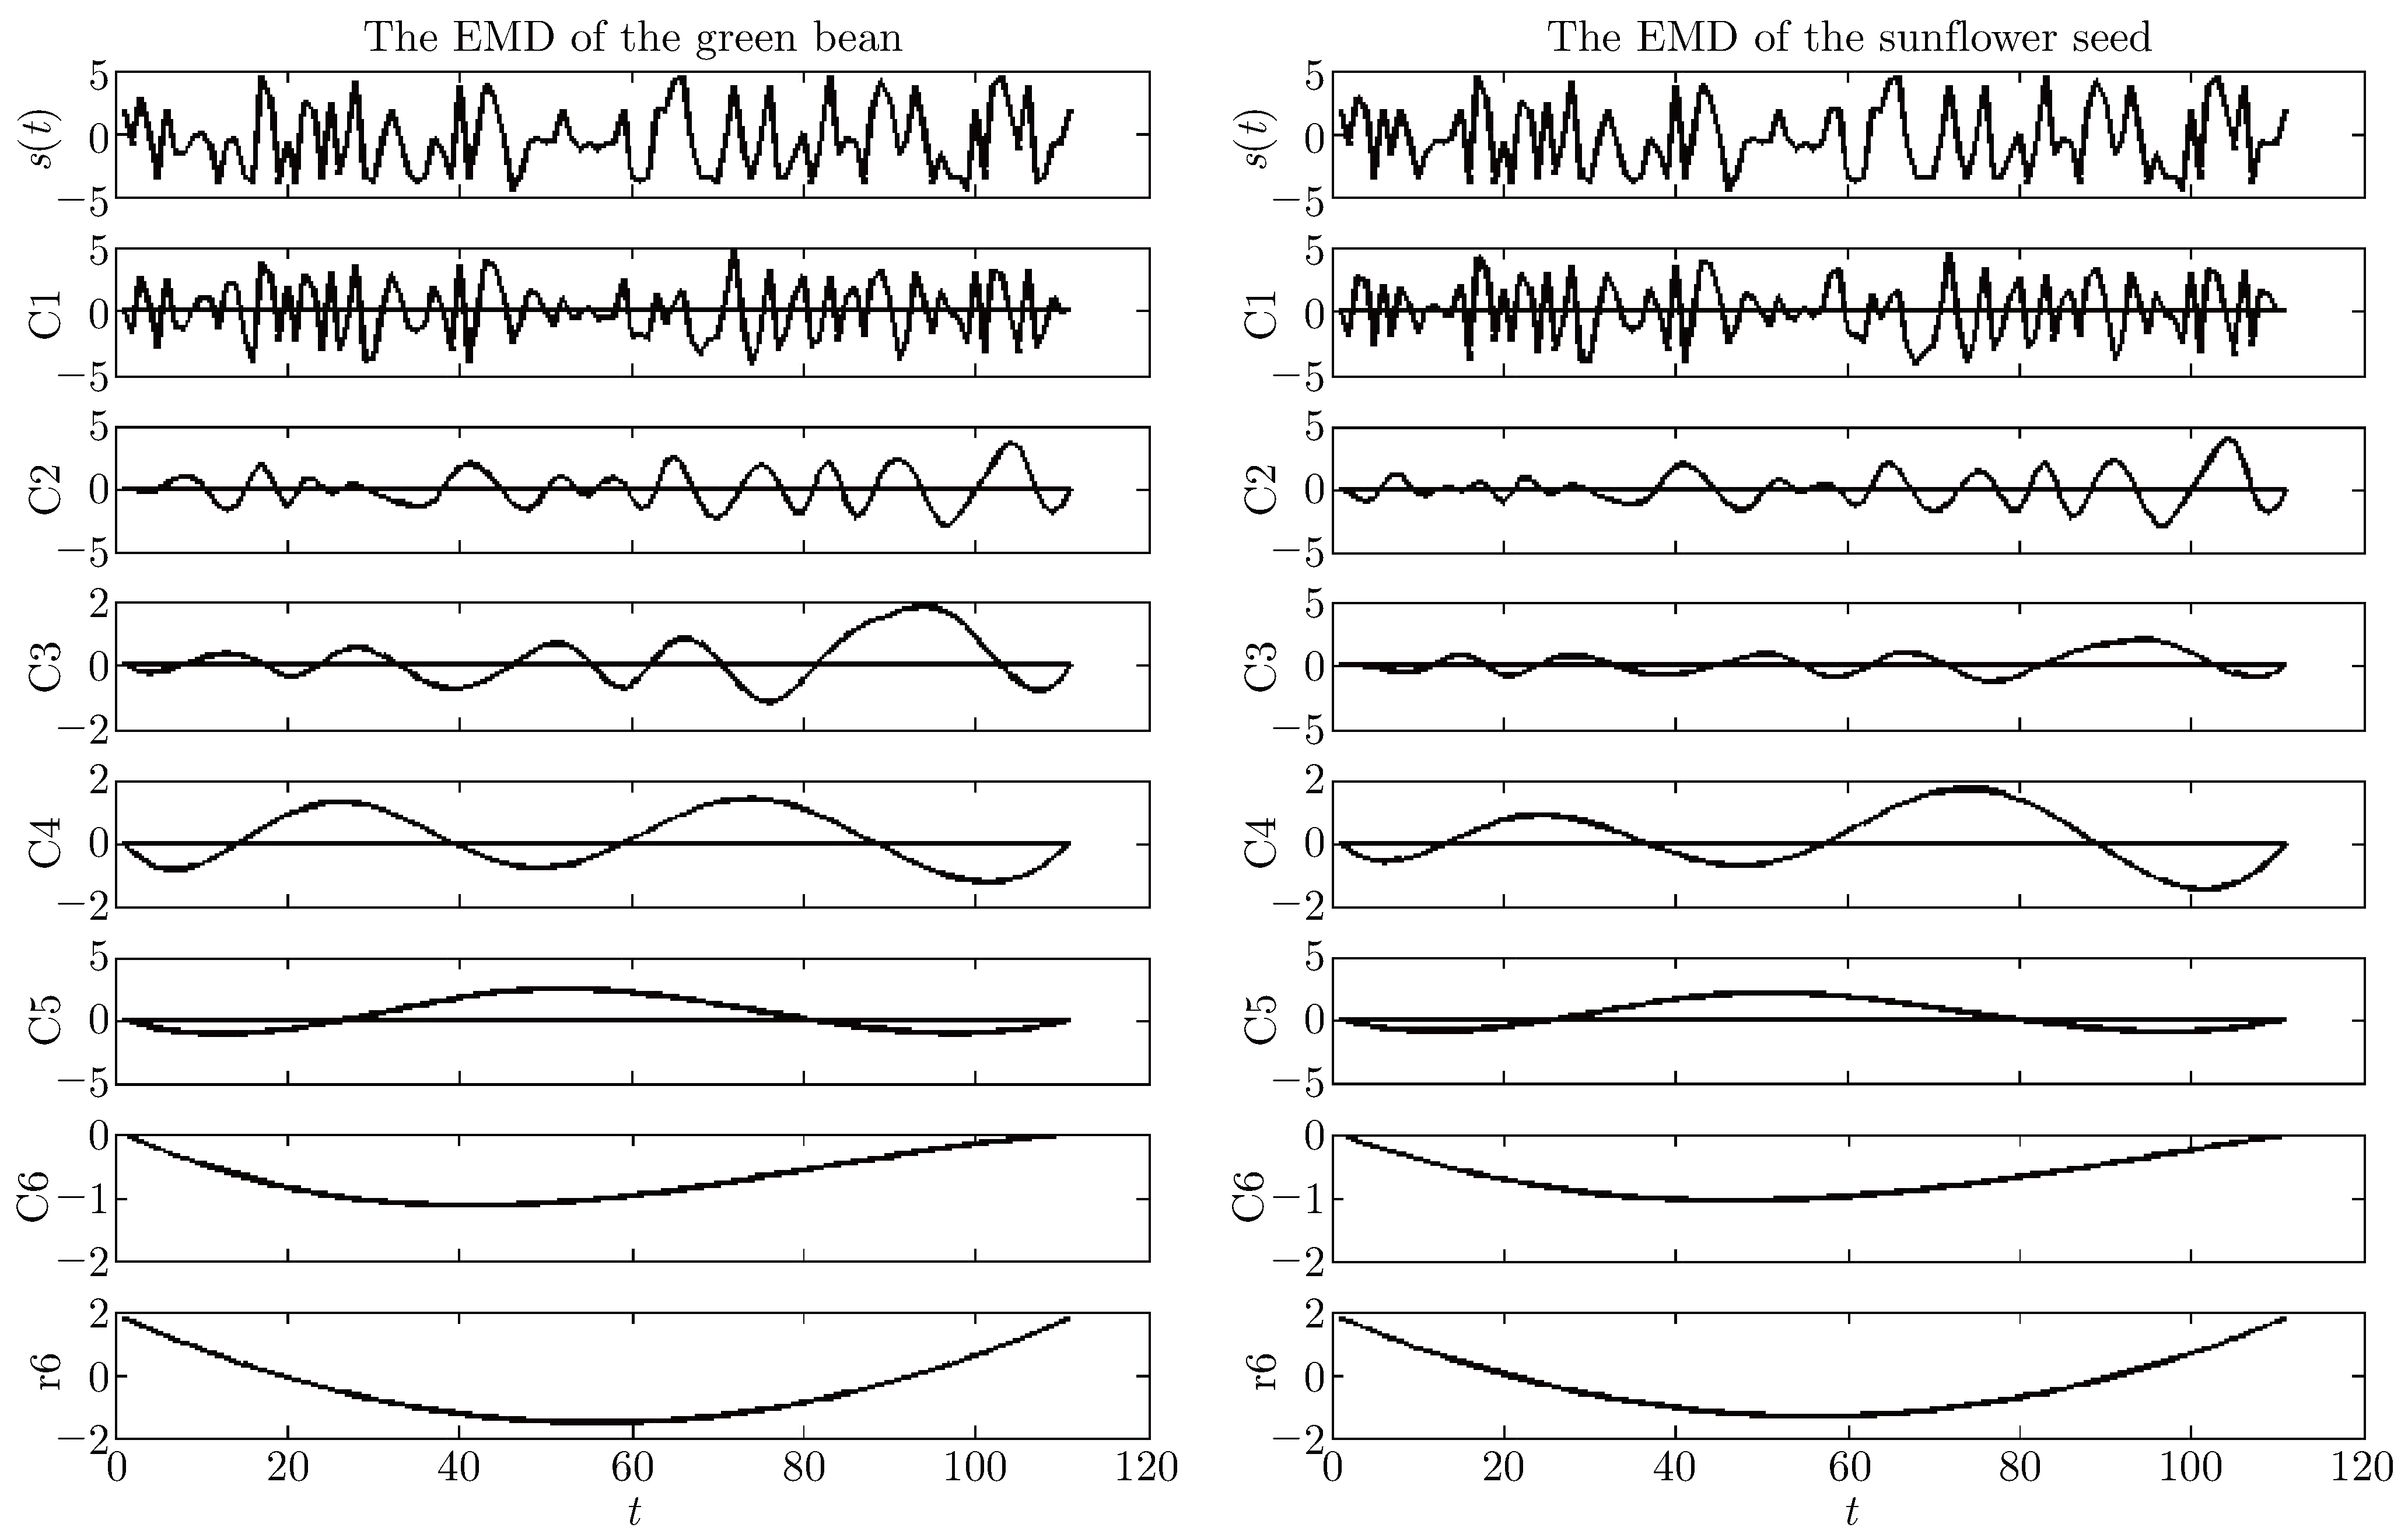
A protein sequence and its signal sequence are in one-to-one correspondence, so in order to analyze and compare the features and similarity of the protein sequence, the features and similarity of the signal sequences must be compared. Firstly, cytochrome c protein sequences of seven species was selected, according to Table 1, then the protein sequences were converted to the signal sequences. Secondly, the EMD method was used as signals obtain their corresponding IMFs and residues. Finally, the residues was compared. This work is shown in the following Figure 2, Figure 3, Figure 4, Figure 5, Figure 6 and Figure 7.
Figure 2.
The EMD of the human.
Figure 3.
The EMD of the dog and the kangaroo.
Figure 4.
The EMD of the pig and the wheat germ.
Figure 5.
The EMD of the green bean and the sunflower seed.
Figure 6.
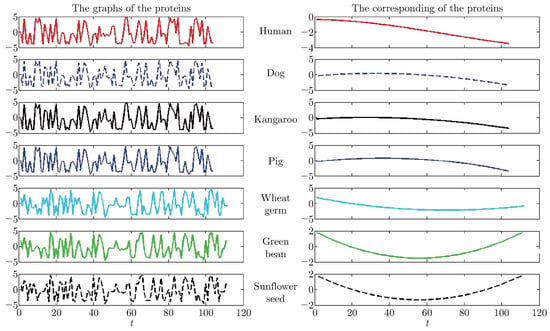
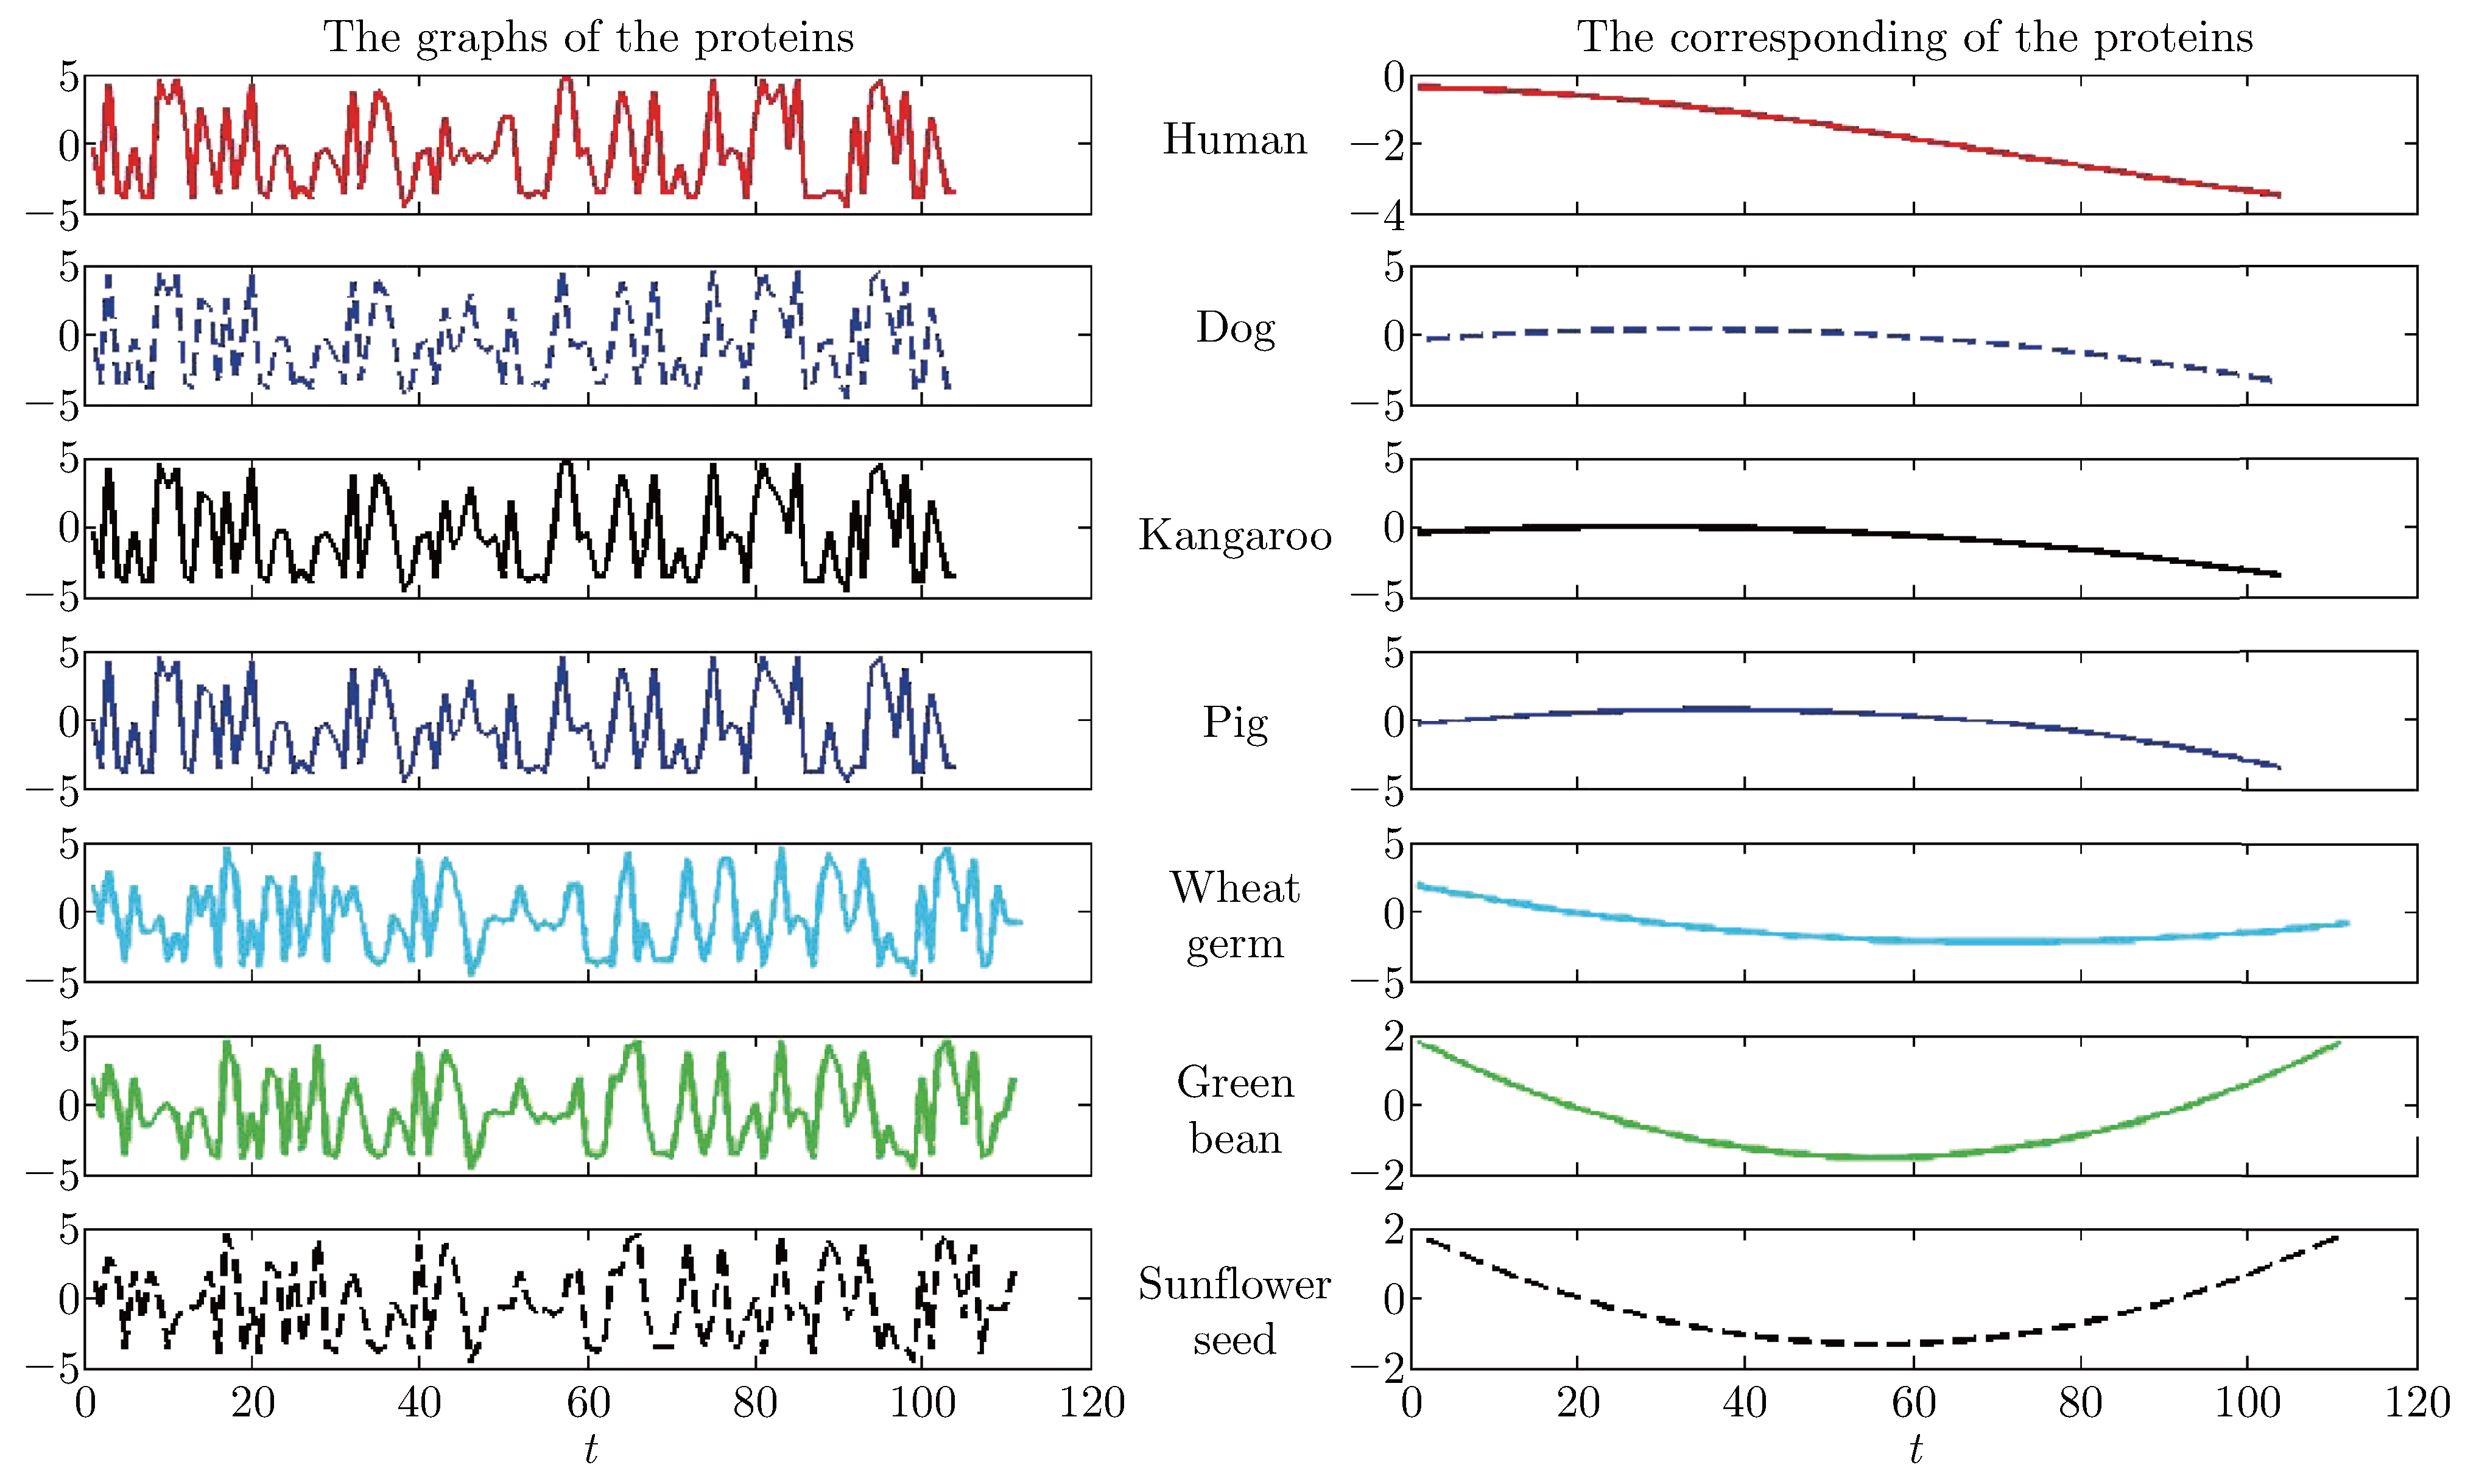
The graphs and the residues of the proteins.
Figure 7.
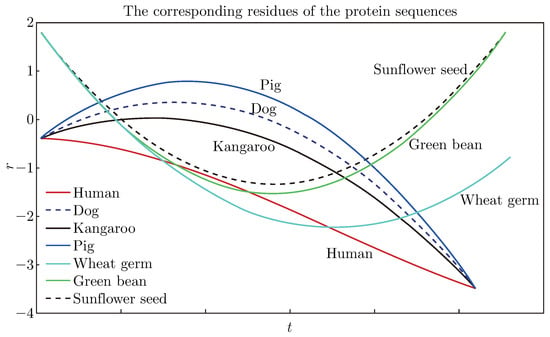
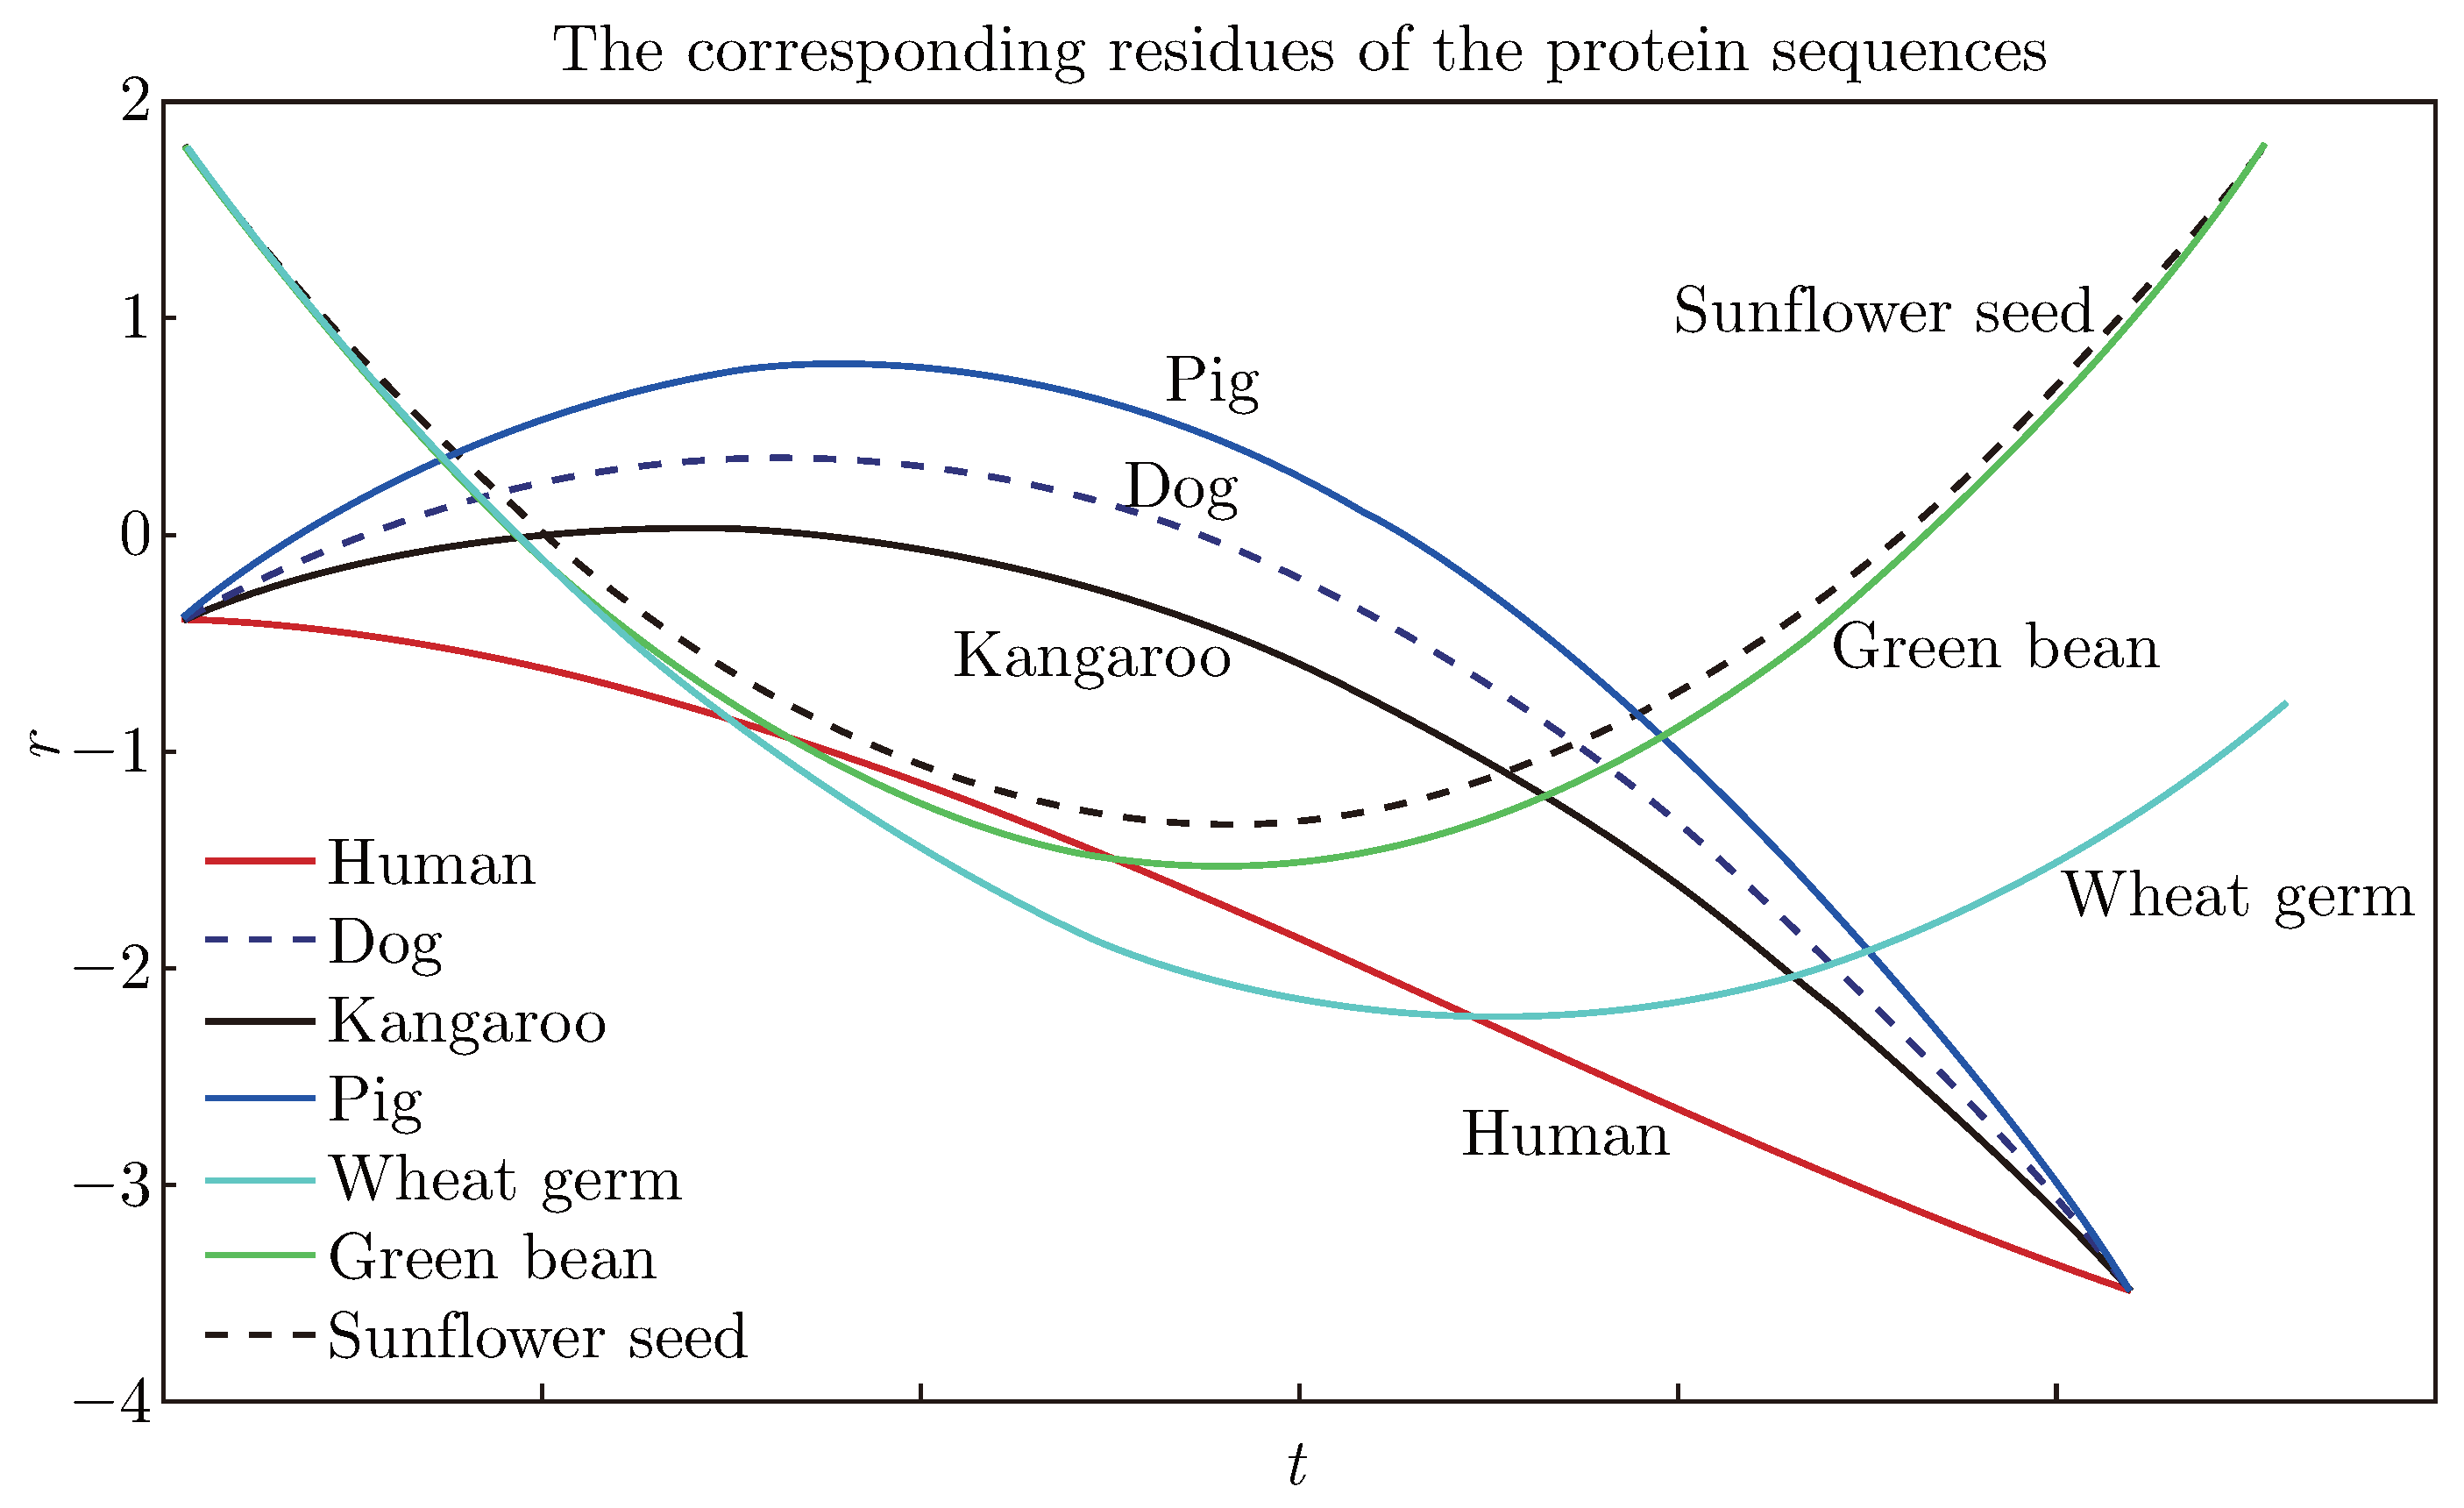
The residues comparison of the protein sequences in a single plot.
From Figure 2, Figure 3, Figure 4 and Figure 5, the signal s(t) converted from the protein sequence of the human and the IMFs and the residue after using the EMD method can be seen. Moreover, the IMFs of the protein sequence are different for the EMD method being a data-driven method. After extraction from the signal, the residue is monotonic or a trend of the protein sequence, therefore, it is easy to judge the similarities from the residues’ graph.
From the left side of Figure 6, it is apparent that there is difficulty when comparing the protein sequences of the seven species by their graphs directly; whereas, from the right side of Figure 6, it can be seen that that the residues of protein sequences can be separated easily.
It is shown that the residue denotes the trend of a sequence in the EMD method, so the sequences was separated by their residues from each other. The closer the two residues, the more similar the two species. From Figure 7, it is apparent that the residues are different for the different species. Then we notice that the residues of the group of (human, pig, dog, kangaroo) are close, moreover, the residues of (pig, dog, kangaroo) are closer to each other, in other words, the residue of the human is distant from the others in the group, and the residues of the group of (wheat germ, the green bean, the sunflower seed) are closer.
As a matter of fact, the human, the pig, the dog, and the kangaroo are animals, so their genes are very similar. The wheat germ, the green bean and the sunflower seed are plants, so their genes are also very similar. But there is some disparity between the human and other animals, so are the three plants. We can see from the above residues’ graphs that the plants and animals could be separated very clearly and even the ones who belong to the same species can also be compared clearly, especially the human can be separated from the other animals very clearly. Therefore, the results by our method are in good agreement with the real world.
5. Discussion and Conclusions
This paper studied how to use the EMD method to establish the similarity of protein sequences. The nonlinear signal sequence was divided and converted from a protein sequence into a set of IMFs and a residue. Then the similarity of different protein sequences was conveniently and intuitively analyzed by comparing the corresponding residues. In the end, a good method was discovered which separates protein sequences from each other very clearly. The suitability and effectiveness of this method are tested by the cytochrome c protein sequences of seven species.
EMD method is introduced. It is a popular tool for signal processing and analyzing the similarities among various protein sequences and realize the intercross of multi-subjects between signal processing and biomathematics. Considering the similarities from a residue’s point of view, our method cannot be compared with other methods in detail. Compared with some traditional similarity analysis methods, what can be concluded is that the main advantage of our method is visual, simple, intuitive and convenient. Especially compared with most of the methods using matrix invariants [1,3,4,20], our method can greatly save the computational time because the computational complexity of the matrix invariants techniques is at least O(N 2) for N data points, remaining very difficult to solve numerically for large numbers of bases and that of our method is O(N + log(N )) derived from the EMD method. Furthermore, the final result of our method is still a graph, not a data or a matrix like some methods, which is consistent with the graphical representations of proteins recognized intuitively by human eyes.
Similarity analysis of biological sequences are still in development, and we hope that this method can be used widely and be a complementary tool for the biological sequences analysis.
Acknowledgments
Project supported by the Educational Commission of LiaoNing Province of China (Grant No. L2012167) and the National Natural Science Foundation of China (Nos. 61273022, 11271060, U0935004, U1135003, 11071031, 11290143).
References
- Randic M. On graphical and numerical characterization of protemics maps. J Chem Inf Comput Sci. 2001; 41: 1330–1338.
- Randic M, Zupan J, Novic M. On 3-D graphical repressentation of proteomics maps and their numerical charaterization. J Chem Inf Comput Sci. 2001; 41: 1339–1344.
- Randic M, Zupan J, Novic M, Gute B, Basak S C. Novel matrix invariants for charaterization of changes of proteomics maps. SAR QSAR Environ Res. 2002; 13: 689–703.
- Randic M, Vracko M, Lers N, Plavsic D. Novel 2-D Graphical representation of DNA sequence and their numerical characterization. Chem Phys Lett. 2003; 368: 1–6.
- Randic M. 2-D Graphical representation of proteins based on virtual genetic code. SAR QSAR Environ Res. 2004; 15: 147–157.
- Randic M, Zupan J, Balaban AT. Unique graphical representation of protein sequences based on nucleotide triplet codons. Chem Phys Lett. 2004; 397: 247–252.
- Nandy A, Nandy P. On the uniqueness of quantitative DNA difference descriptors in 2D graphical representation models. Chem Phys Lett. 2003; 368: 102–107.
- Liao B, Wang TM. Analysis of similarity of DNA sequences based on triplets. J Chem Inf Comp Sci. 2004; 44: 1666–1670.
- Bai FL, Wang TM. A 2-D graphical representation of protein sequences based on nucleotide triplet codons. Chem Phys Lett. 2005; 413: 458–462.
- Bai FL, Wang TM. The construction of phylogenetic tree by graphic representation of DNA sequences. WSEAS Trans Inf Sci Appl. 2005; 2: 463–467.
- Bai FL, Wang TM. On graphical and numerical representation of protein sequences. J Biomol Struc Dtn. 2006; 23: 537–545.
- Bai FL, Liu YZ, Wang TM. A representation of DNA primary sequences by random walk. Math Biosci. 2007; 209: 282–291.
- Bai FL, Li DC, Wang TM. A new mapping rule for RNA secondary structures with its applications. J Math Chem. 2008; 43: 932–943.
- Zupan J, Randic M. Algorithm for coding DNA sequences into “Spectrum-Like” and “Zigzag” representations. J Chem Inf Model. 2005; 45: 309–313.
- Huang NE, Shen Z, Long SR et al. The empirical mode decomposition and the Hilbert spectrum for nonlinear and non-stationary time series analysis. P Roy Soc Lond A. 1998; 454: 903–995.
- Huang NE, Wu ML, Qu WD. Applications of Hilbert-Huang transform to non-stationary financial time series analysis. Appl Stoch Model Bus Ind. 2003; 19: 245–268.
- Bai FL, Zhang JH, Zheng JS. Similarity analysis of DNA sequences based on EMD method. Appl Math Lett. 2011; 24: 232–237.
- Zhu SM, Yu ZG, Anh V, Yang SY. Analysing the similarity of proteins based on a new approach to empirical mode decomposition. ICBBE. 2010; 6: 1–4.
- Wang ZH, Wang W, Li Y, Lin YW, Huang ZX. Sequence analysis and structure comparison of cytochrome c proteins. China Journal of Bioinformatics. 2010; 8: 274–278.
- Zhao YB, Li XH, Qi ZH. Novel 2D graphic representation of protein sequence and its application. Journal of Fiber Bioengineering and Informatics. 2014; 7: 23–33.

© 2014 Textile Bioengineering and Informatics Society. This article is an open access article distributed under the terms and conditions of the Creative Commons Attribution (CC BY) license (https://creativecommons.org/licenses/by/4.0/).