


Abstract
The study investigated the skin temperature (Tsk) at sixteen points, Stratum Corneum Water Content (SCWC) and Transepidermal Water Loss (TEWL) at fourteen points over the ventral and dorsal surfaces, during submaximal cycling exercise in an ambient temperature of 25 °C, and a relative humidity of 60%. Nine healthy competitive males completed a 20 min rest on the cycle and 5-min warm-up, followed by a 30 min of cycle exercise at 70% maximal heart rate and 30 min recovery. Average mechanical power output and pedaling rate were 150 W and 70 rpm. The results showed that the ventral and dorsal skin temperatures were significantly decreased from a minimum of 0.68 °C up to 3.48 °C than those measured at rest before cycling. In accordance with the regions of declines in skin temperatures, the values of SCWC and TEWL almost attained 120 A.C.U. and 40∼60 g/h.m2. Meanwhile, the subjects produced 0.45 L/h sweating throughout the experiment. The distribution state of Tsk, SCWC and TEWL could be visualized directly by a novel color mapping of human body. The results obtained suggest that during the submaximal cycling exercise, the reduction of skin surface temperature is associated with the evaporative heat loss due to skin sweat.
1. Introduction
Stratum corneum water content (SCWC) is considered to maintain proper function of the skin as a barrier and transepidermal water loss is commonly ascribed to be a measure of skin barrier function at baseline [1,2]. The studies of various methods have found that the SC hydration state was increased rapidly after increase of the environmental relative humidity (RH) and temperature (T) [3,4,5,6,7] or logarithmic relationship was demonstrated between SC water contain and RH [4]. Increase of the SC hydration state increases the permeability of stratum corneum, leading to TEWL elevation [8]. Increasing the skin surface temperature increases the rate of TEWL, and increase of skin temperature by 7–8 °C doubled the rate of TEWL [8]. A recent study reported that the higher moisture absorption capacity and lower thermal diffusivity of the clothing material can remain the higher level of SCWC in the skin [9,10]. However, despite considerable research suggesting the effects of the temperature/humidity of skin/environment on the stratum corneum water content, transepidermal water loss in near windstill conditions, studies have not assessed simultaneously the change of skin temperatures, SCWC and TEWL and interaction among them with higher air velocities in cycling exercise.
In competitive cycling, excellent cyclists ride at speeds ranging from 20 to 50 km/h and thus generate an equivalent facing windspeed, which may increase the extent of heat loss by both convection and evaporation [11]. Adams et al. [12] showed that subjects reached higher rectal and oesophageal temperatures when they exercised in windstill conditions compared with a facing air velocity of 12.6 km/h. Saunders et al. [18] observed that the skin temperature in 0.2 km/h increased significantly with time and was significantly greater compared with the other three conditions (9.9, 33.3 and 50.1 km/h) from 10 to 50 min. Kwon et al. [13] further found the skin temperature became abruptly lower when exposed to a wind velocity of 5.4 km/h compared with the near windstill condition.
Above studies suggested that during dynamic exercising, skin temperature reduced [14,15,16]. The sweating rate and evaporative heat loss due to skin sweat markedly increased as an increase of workload [17,18]. The trends in SCWC and TEWL are currently unknown if the human body is in the dynamic exercising state and sweating is not inhibited. Therefore the purpose of this study is to investigate skin temperature, SCWC, TEWL distributions and analyze the involved reasons in cycling subjects when the environmental values of RH and T are kept in the thermoneutral level. A novel color mapping of human body would be plotted to visualize directly the distribution state of skin temperature, SCWC and TEWL.
2. Methods
2.1. Subjects
Nine healthy male competitive collegiate sportsmen were recruited as subjects. Age, height, body weight, and Dubois body surface area [19] were 21.6 ± 1.6 yr, 172.8 ± 6.4 cm, 61.7 ± 7.6 kg and 1.74 ± 0.13 m2, respectively. Average maximal heart rate was 198.4 ± 1.5 beats/min. Before testing, each subject signed a consent form approved by the Human Subjects Ethics Sub-Committee of the Hong Kong Polytechnic University.
2.2. Measurements
Ventral infrared thermograms of the subjects were scanned using an infrared (IR) thermographic system (Nikon Thermal Vision, LAIRD-S270, Nikon Corperation). A total of 85 ventral thermograms were obtained from each subject (1 min Rec interval). The temperature-resolving power of the Thermoviewer was ± 0.1 °C. The infrared thermogram was digitized and saved on a floppy diskette using a thermographic data converting program (FAI-Controller, Nikon Corperation). The data from the thermograms were analyzed with an image processing system (FAI-Analyzer, Nikon Corperation). Ventral skin temperatures in chest, abdomen, under arm, upper arm, forearm, hand, ventral thigh and ventral leg were estimated by IR. IR provided temperatures from 270, 000 pixels, on average, from the ventral body surface. The mean temperature from thermography (Tsk-IR) was taken as an arithmetic mean of these points. Dorsal skin temperatures were measured with thermistors (Nikkiso-YSI, Japan) taped at eight sites: dorsal neck, upper back, middle back, lower back, buttocks, dorsal thigh, popliteal fossa and dorsal calf. All temperatures were recorded continuously and temperature readings were stored in the data logger LT-8A (Nikkiso-YSI, Japan) every 2 s, and then sampled by a computer though a converter.
Measurements of SCWC were performed on the ventral areas (head, chest, abdomen, armpit, upper arm, forearm, hand, ventral thigh and ventral leg) and dorsal areas (upper back, lower back, dorsal thigh, popliteal fossa and dorsal calf) with a Corneometer CM825 (Courage and Khazaka electronic GmbH, Cologne, Germany) that registered the electrical capacitance of the skin surface as an indicator of stratum corneum water content. This parameter depends on the high dielectric constant of water content relative to other skin components. A testing probe is slightly pressed on the skin with the result of a temporary vacuum. The skin is lifted, stretched and then released. These deflections are optically recorded and evaluated. The capacitance was expressed digitally in arbitrary units (A.C.U.). The range of all measurements was from 0 to 120 A.C.U. The connection between indications and numerical values are presented below [20]:
20∼40 A.C.U.: dry skin
> 120 A.C.U.: high water content skin (sweating skin)
The TEWL was recorded on the same locations as the SCWC using a Tewameter TM 300 (Courage + Khazaka electronic GmbH, Cologne, Germany). Tewameter probe is applied on the skin. It consists of two pairs of sensors to measure the humidity and temperature gradients in two different spacings. Based on the resulting humidity and temperature gradients the TEWL is automatically calculated and shown as g/h.m2. The connection between indications and numerical values are presented below [20]:
3∼6 g/h.m2: normal skin water evaporation (> 3∼6 g/h.m2 in the face and hands)
30∼60 g/h.m2: The skin is hydrated
Measurements of SCWC and TEWL were performed 10 times for each subject. At the beginning and end of each experiment, the body weight of the subjects was measured with an electronic scale (EA 150 FEG-1, Sartorius AG, Germany).
2.3. Test Procedures
Subjects reported to the laboratory (Ta of 25 ± 1 °C, rh of 60 ± 3%) on two separate occasions. During the initial visit, the maximal heart rate was estimated [21], and the mechanical power output, heart rate, and pedaling rate were recorded by a power meter mounted on an Excalibur Sport 925900 cycle ergometer (Lode BV, Groningen, the Netherlands). On this occasion, the subjects also familiarized the crank length and the mechanical power output and pedaling rate in which subjects cycled at intensities intended to elicit 70% maximal heart rate. The second visit involved the following steps. The subjects wore only shorts entered the laboratory. After their body weight had been measured, the thermistor sensors for skin temperatures were attached and then sat on the cycle ergometer to rest for 20 min. The subjects then completed a 5-min warm-up, followed by a 30 min of cycle exercise at 70% maximal heart rate. During this session, the mechanical power output and pedaling rate were regulated according to each case to keep the cycle exercise at 70% maximal heart rate. Average mechanical power output and pedaling rate were 150 W and 70 rpm. The fan was turned on (wind velocity of 14.4 km/h, when measured at chest level) during the cycle exercise. A large industrial fan with the fixed height and location was used (1.9 KWA (0.7 KW/1 HP), CHIEF EXECUTIVE INDUSTRIES CORP, Taiwan). The center of fan was mainly towards the chest, and the whole body of the subjects was covered in the airflows. After the exercise was completed, each subject still sat on the cycle ergometer to recover for 30 min. All temperatures were recorded continuously every 2 s, and the infrared thermograms were scanned every 1 min from the starting of 20-min rest. The SCWC and TEWL were measured at 0 (starting of rest), 20 (end of rest), 40 (middle of cycling), 55 (end of cycling), 70 (middle of recovery) and 85 min (end of recovery). It should be noted that, at 40 min, the SCWC and TEWL in ventral thigh and leg, dorsal thigh, popliteal fossa and dorsal calf were not measured due to cycle exercise. Upon completion of the trial, subjects towelled dry and weighed themselves again.
2.4. Calculations
The subject’s sweat rate was estimated below [18]:
(There were no water consumed and urine volume produced during this test) where BW is body weight.
2.5. Statistical Analysis
Statistical analyzes were done with SPSS 15.0 for Windows (SPSS, Chicago, IL). An analysis of variance with repeated measures was used to analyze differences between rest, cycling and recovery for skin temperatures, SCWC and TEWL. When a significant difference was obtained, the time comparisons procedure by Bonferroni’s method was used to identify specific differences. Difference in body weight between the beginning and end of experiment was assessed using a paired-samples t-test. Relationships between SCWC and TEWL, and SCWC and skin temperature were assessed by Pearson’s correlation coefficients. All differences reported were regarded as significant at the P<0.05 level.
3. Results
3.1. Skin Temperature
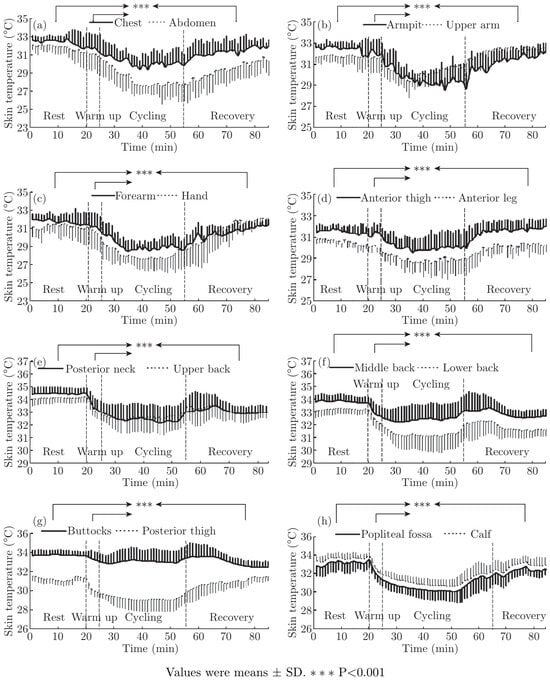
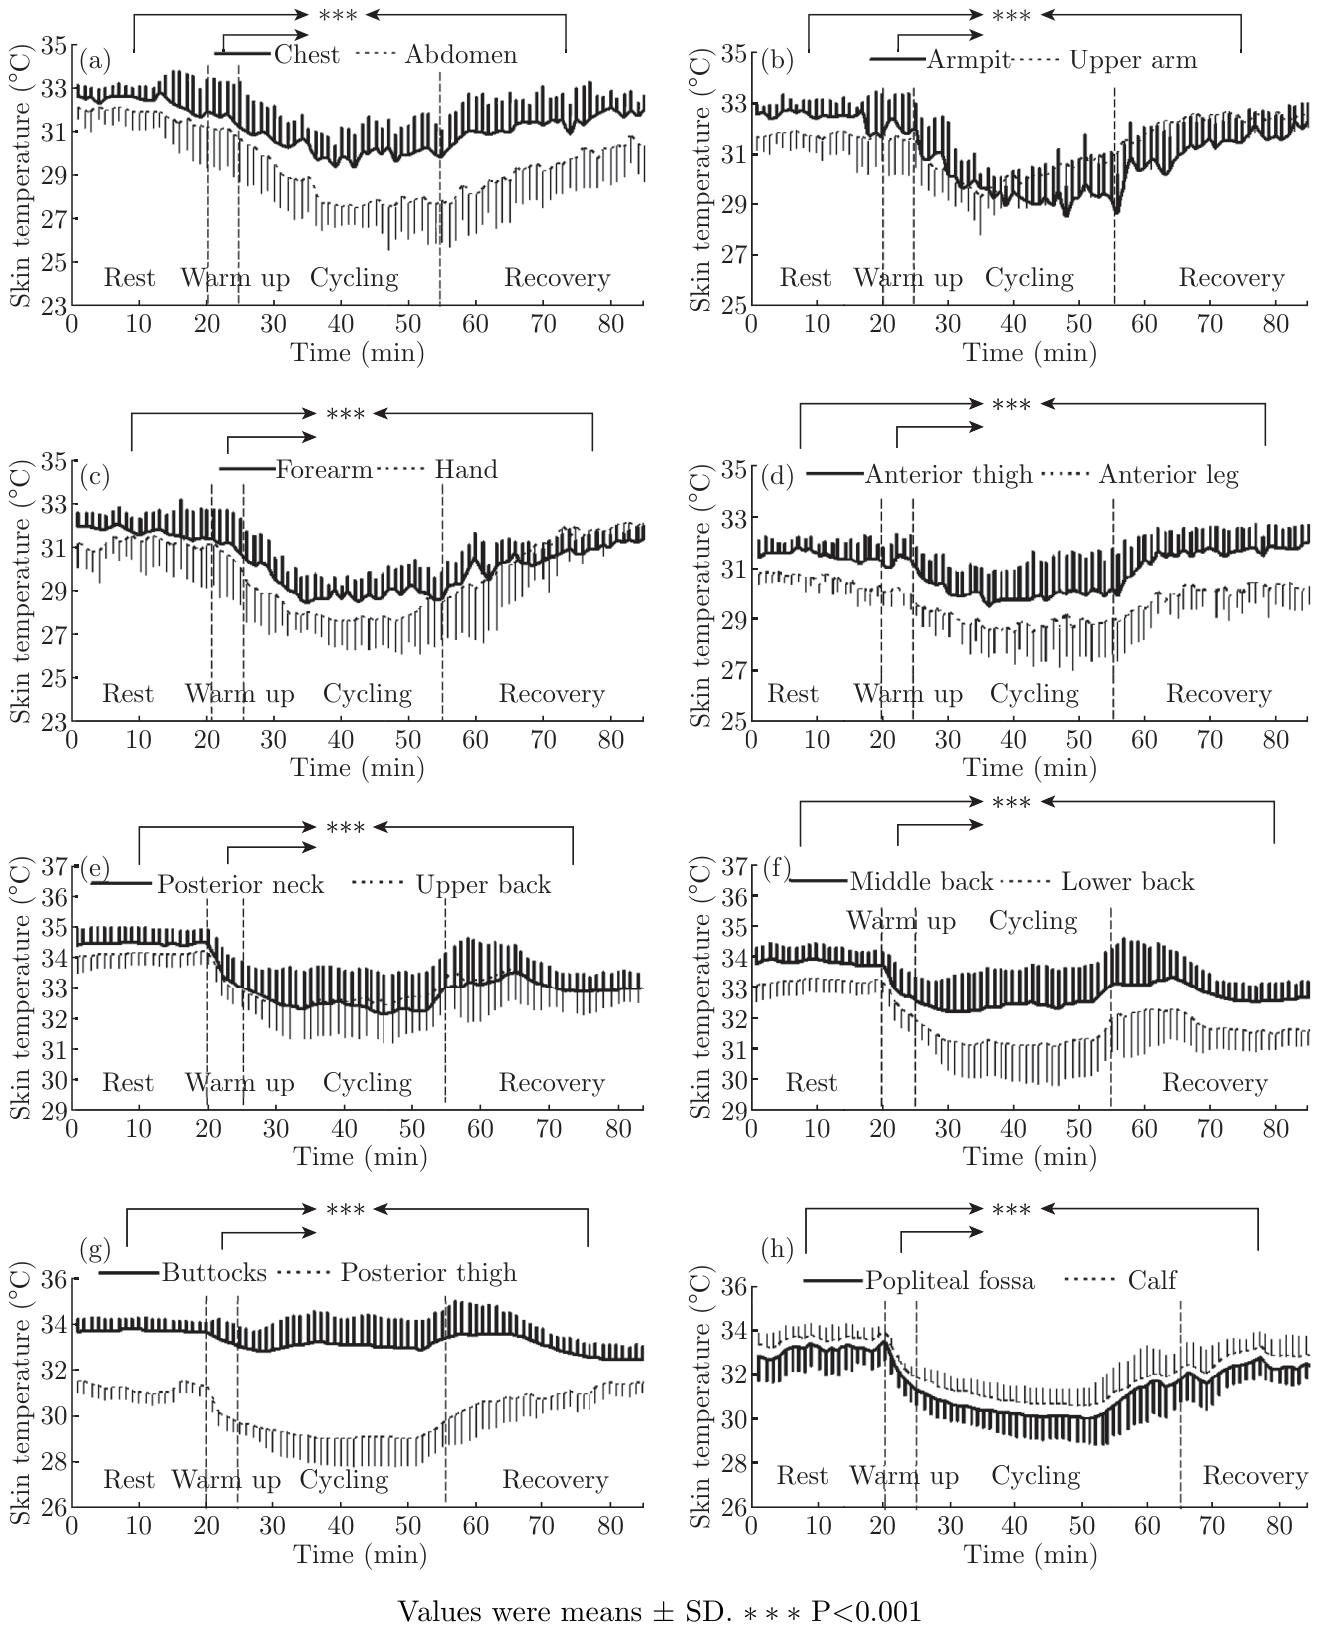
Cycling exposed to a wind velocity of 14.4 km/h caused a decrease in the temperature of ventral and dorsal skin. The typical pattern of skin temperature change during one consecutive cycle of rest-warm up-cycling-recovery appears in Figure 1. The onset of decreased skin temperature occurred in warm up period in conjunction with rest period, and the rate of decrease of skin temperature was always greatest within the cycling period. Then skin temperature elevated during 30 min recovery period. All ventral and dorsal skin temperatures were significantly lower than those measured at rest and warm up before cycling and recovery after cycling (P<0.001). At the ventral area, the skin temperatures in chest, abdomen, under arm, upper arm, forearm, hand, ventral thigh and ventral leg were lower in cycling than rest by 2.22, 3.48, 2.79, 1.52, 2.65, 3.07, 1.47 and 1.64 °C, respectively. On the other hand, at the dorsal area, the skin temperatures in dorsal neck, upper back, middle back, lower back, buttocks, dorsal thigh, popliteal fossa and dorsal calf were lower in cycling than rest by 2.05, 1.57, 1.44, 1.52, 0.68, 2.05, 2.72 and 2.58 °C, respectively. The above results showed that there were great differences between corresponding skin temperature decreases of ventral and dorsal trunk. Tchest was lower (a minimum of 0.65 °C and up to 0.78 °C) during the cycling than in the matching upper and middle back. Tabdomen was lower by 1.96 °C during the cycling than in the matching lower back. On the contrary, Tdorsalthigh was lower by 0.58 °C during the cycling than in the matching ventral thigh. And Tdorsalcalf was lower by 0.94 °C during the cycling than in the matching ventral leg.
Figure 1.
Skin temperature on the chest & abdomen (a), armpit & upper arm (b), forearm & hand (c), anterior thigh & leg (d), posterior neck & upper back (e), middle back & lower back (f), buttocks & posterior thigh (g), and popliteal fossa & calf (h).
3.2. Color Mapping of the Skin Temperature
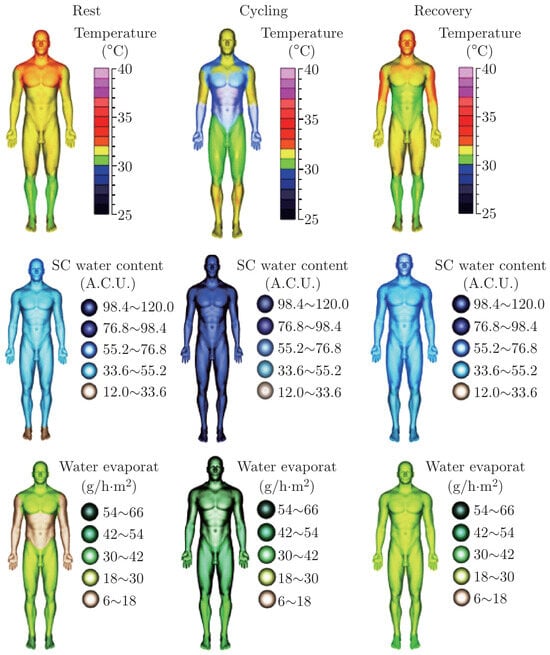
In order to visualize the skin temperature distribution state of a sportsman as realistic as possible for one consecutive cycle of rest-exercise-recovery, the color mapping was used to construct a virtual scene, which means a spectrum of colors can represent a range of skin temperature values [22]. As the most common rainbow color mapping was attractive, colorful, with easy to discriminate “regions” of the data which can then be associated with specific data values given a color bar key (low values with blue (25∼28 °C), medium-low with cyan (28∼30 °C), medium with green (30∼31 °C), etc.) [23], this study adopted the rainbow color mapping to map the temperature data (Figure 4, top). The color mapping also reflected the human thermal sensations such as hot, warm, cool and cold, and red represented for hot, yellow to green for warm, green to light blue for cool, and blue for cold [24]. Figure 3 revealed a dynamic change of the skin temperature for one consecutive cycle of rest-exercise-recovery. At the ventral area, the color of head, neck and chest changed from red (33∼34 °C) to yellow (30∼32 °C) and blue (28∼29 °C) to yellow and light red (31∼32 °C) form rest to recovery cycles. The color of trunk and thigh changed from yellow (about 32 °C) to blue (28∼29 °C) and green (about 31 °C) to yellow and green in these cycles. Similarly, the dorsal skin showed a change with high–low–high value range of color bar for one consecutive cycle of rest-exercise-recovery. The results also implied that a sportsman might feel cool and cold in cycling.
Figure 4.
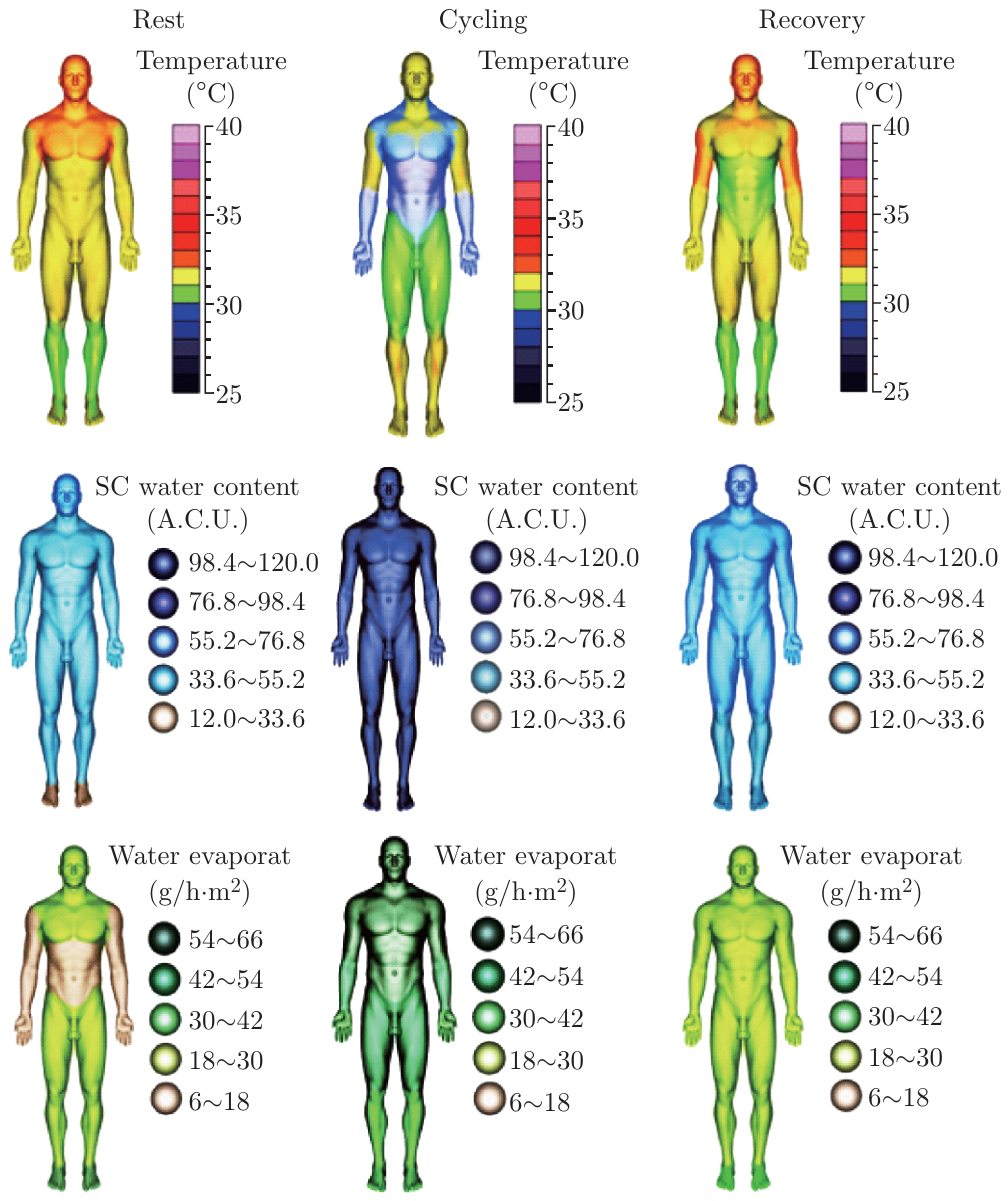
Color mapping of the skin temperature (top), stratum corneum water content (middle) and transepidermal water loss (bottom) for one consecutive cycle of rest-exercise-recovery.
Figure 3.
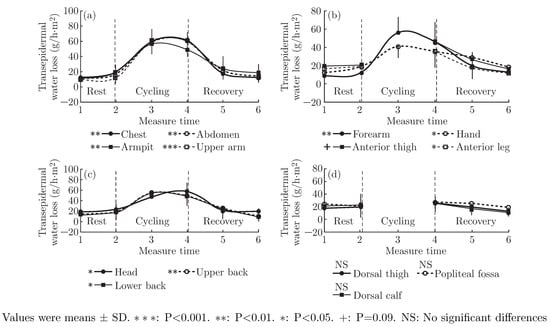
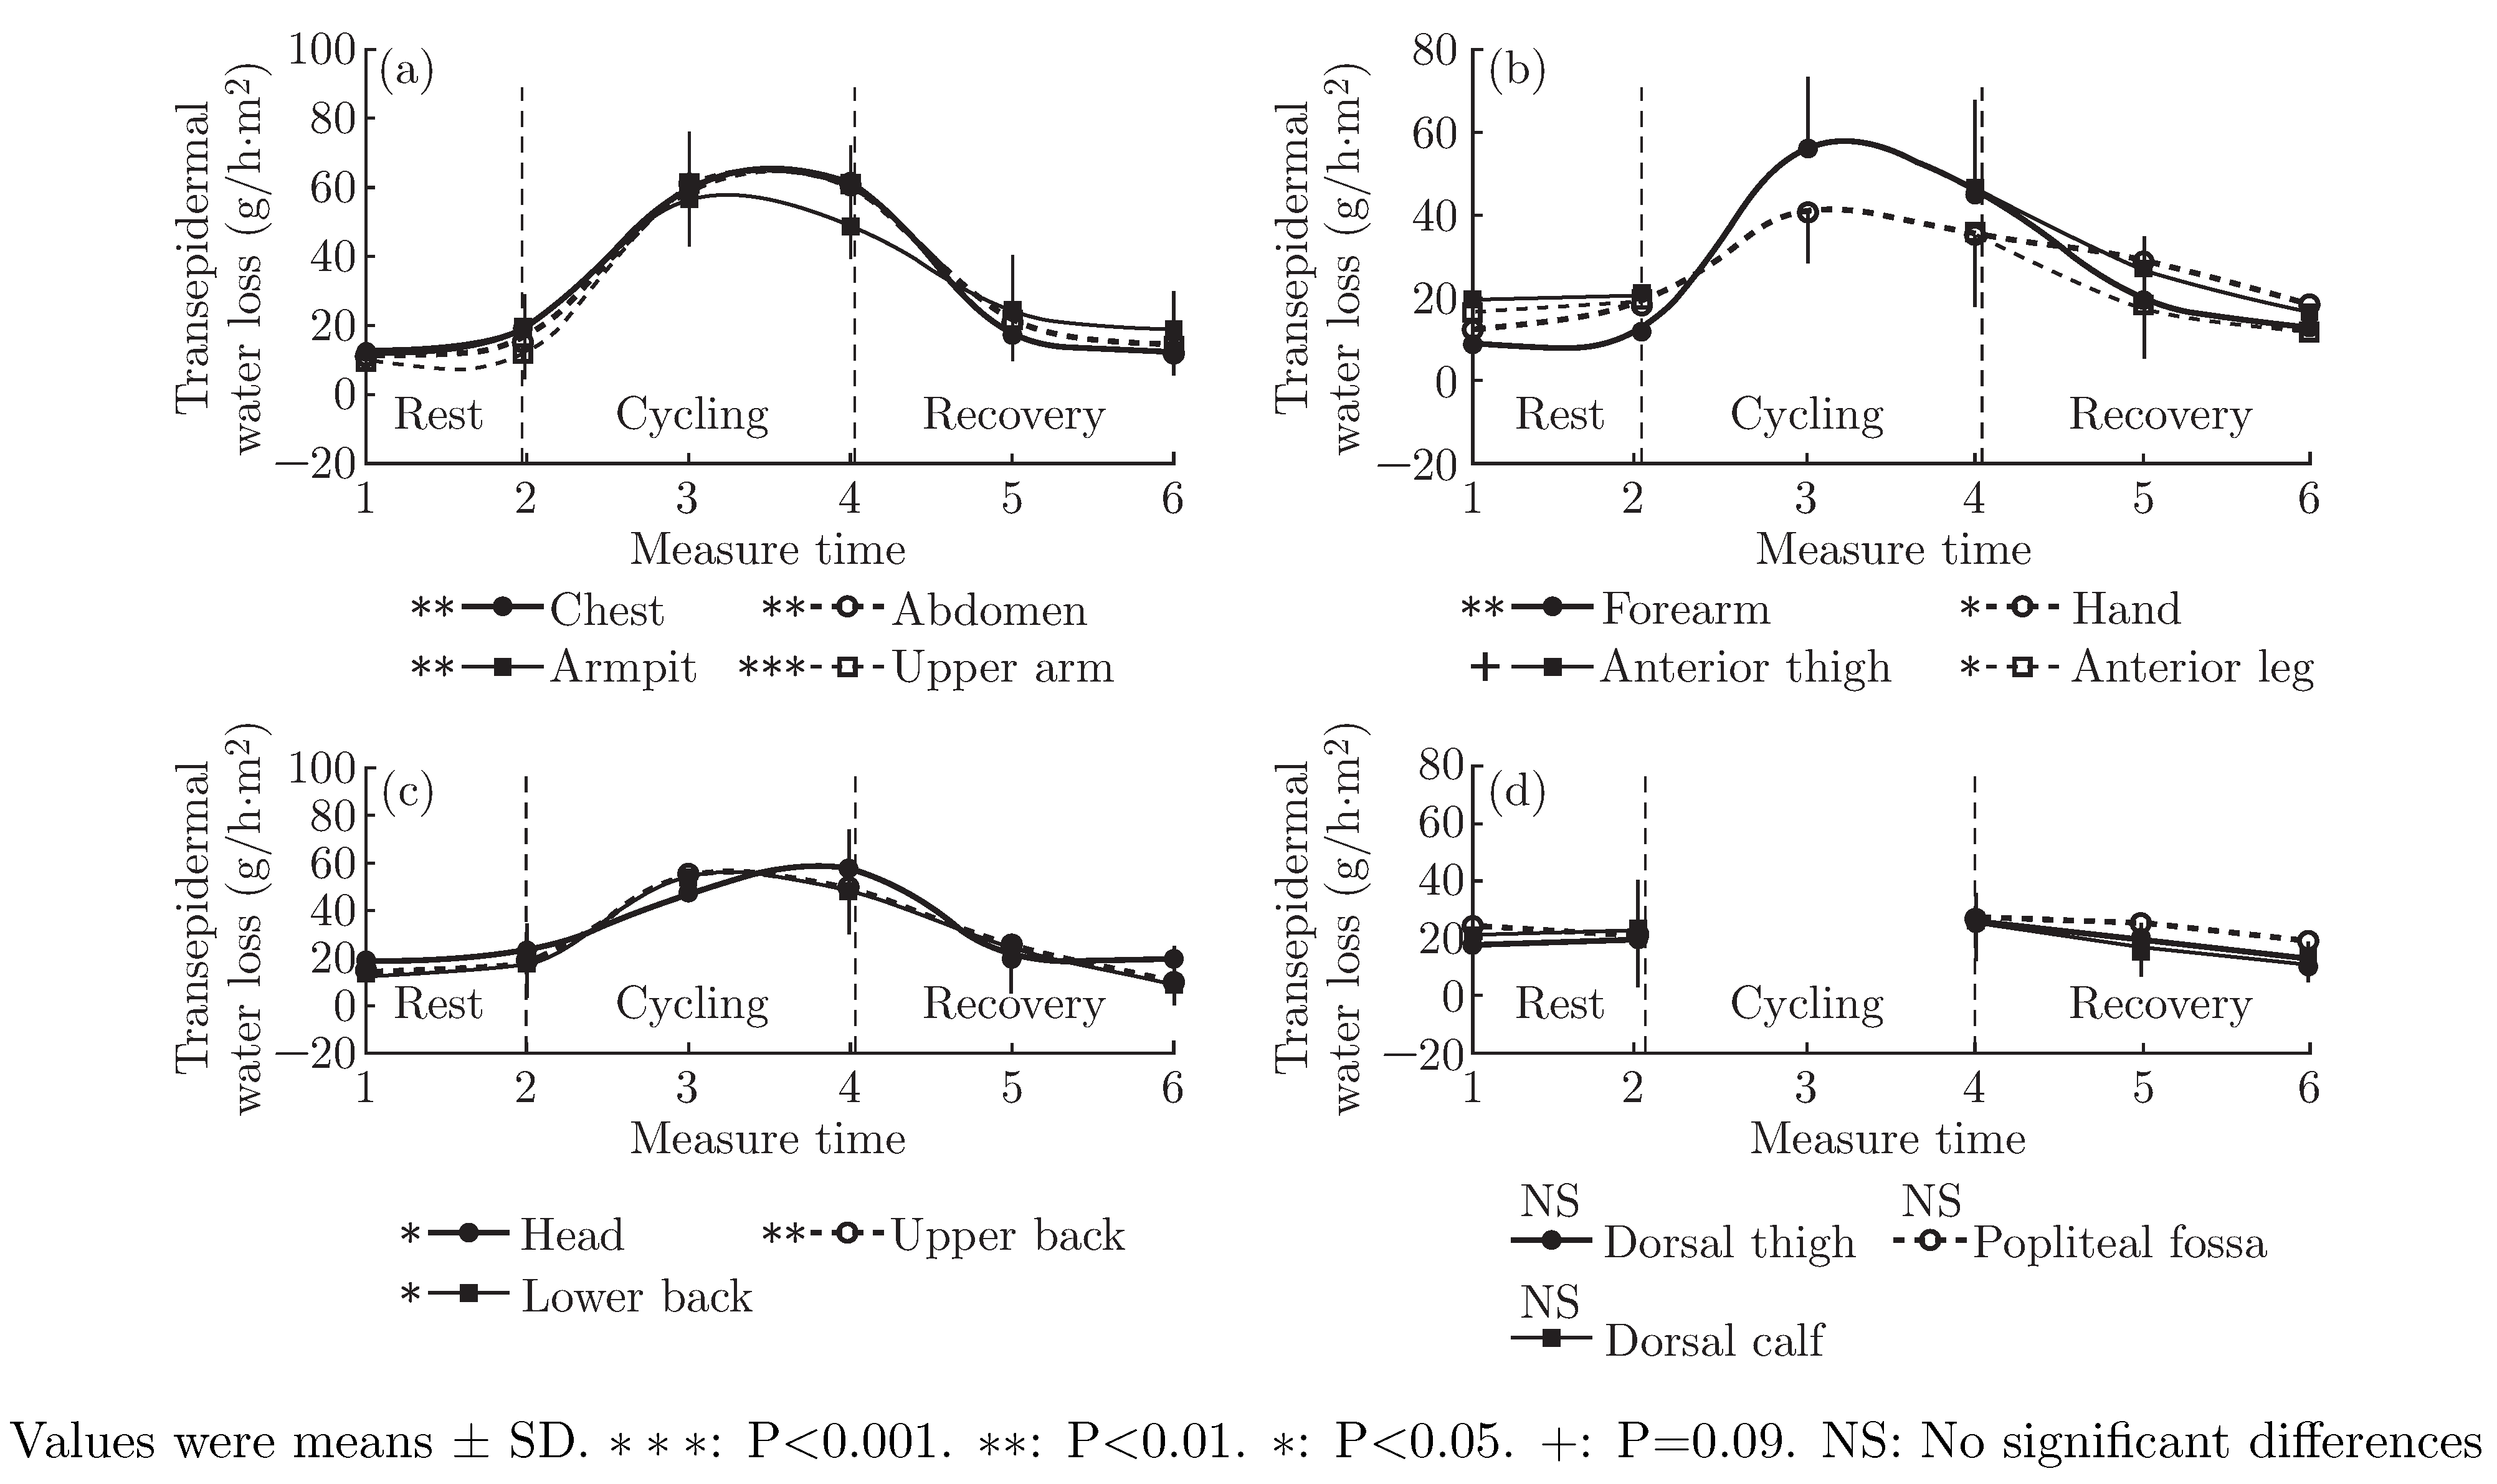
Transepidermal water loss on the chest, abdomen, armpit and upper arm (a); forearm, hand, anterior thigh and leg (b); head, upper back and lower back (c); posterior thigh, popliteal fossa and calf (d).
3.3. Stratum Corneum Water Content
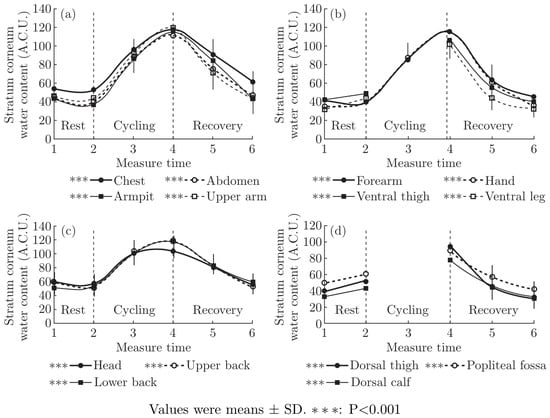
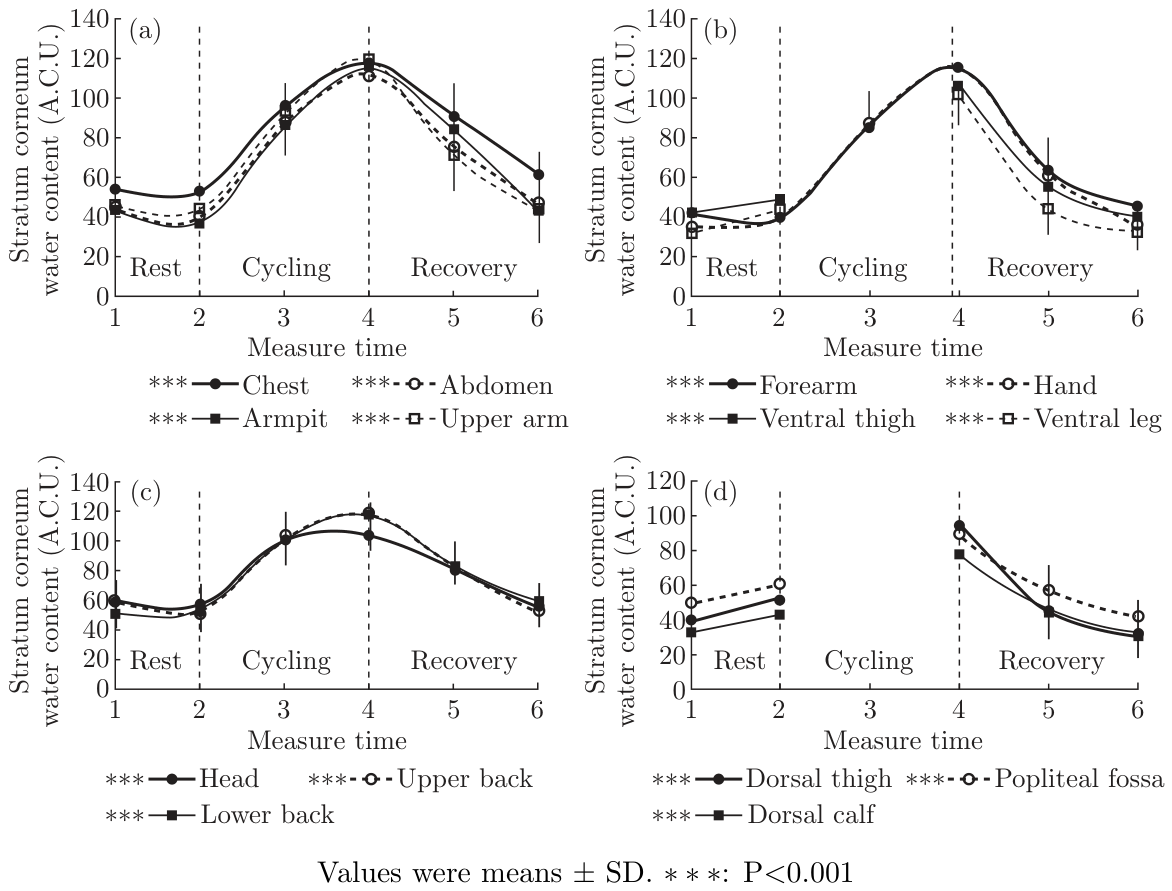
Cycling exposed to a wind velocity of 14.4 km/h caused a SCWC elevation of ventral and dorsal skin with the opposite trend with skin temperature (Figure 2). All ventral and dorsal skin SCWC were significantly higher than those measured at rest before cycling and recovery after cycling (P<0.001). At the ventral area, SCWC in head, chest, abdomen, armpit, upper arm, forearm, hand, ventral thigh and ventral leg increased significantly by 47.29, 65.12, 72.18, 78.23, 75.04, 76.34, 74.87, 57.96 and 59.39 from rest to cycling exercise, respectively. On the other hand, at the dorsal area, SCWC in upper back, lower back, dorsal thigh, popliteal fossa and dorsal calf increased significantly by 65.23, 64.73, 42.15, 29.47 and 32.75 from rest to cycling exercise, respectively.
Figure 2.
Skin stratum corneum water content on the chest, abdomen, armpit and upper arm (a); forearm, hand, anterior thigh and leg (b); head, upper back and lower back (c); posterior thigh, popliteal fossa and calf (d).
3.4. Color Mapping of the Skin Stratum Corneum Water Content
This study adopted the brown, blue and cyan to map SCWC data (low values with brown (12∼33.60 A.C.U.), medium-low values with blue (55.20∼76.80 A.C.U.) and high values with cyan (98.40∼120 A.C.U.), etc.) (Figure 4, middle). Figure 4 revealed a dynamic change of the skin SCWC for one consecutive cycle of rest-exercise-recovery. At the ventral area, the color of head, trunk and limbs changed from blue (55∼75 A.C.U.) and light blue (33∼55 A.C.U.) to cyan (98∼120 A.C.U.), and then recovered blue and light blue from rest to recovery cycles. At the dorsal area, the color of head, trunk, upper limbs and lower limbs changed from blue and light blue to light cyan (76∼98 A.C.U.) and blue, and then recovered blue and light blue from rest to recovery cycles.
3.5. Transepidermal Water Loss
Cycling exposed to a wind velocity of 14.4 km/h caused a TEWL elevation of ventral and dorsal skin with the opposite trend with skin temperature (Figure 3). At the ventral area, TEWL in head (P<0.05), chest (P<0.01), abdomen (P<0.01), armpit (P<0.01), upper arm (P<0.001), forearm (P<0.01), hand (P<0.05), ventral thigh (P=0.09) and ventral leg (P<0.05) increased significantly by 36.06, 41.59, 43.14, 29.80, 48.79, 34.29, 17.43, 24.40 and 16.24 g/h.m2 from rest to cycling exercise, respectively. On the other hand, at the dorsal area, TEWL in upper back (P<0.01) and lower back (P<0.05) increased significantly by 29.23 and 29.73 g/h.m2 from rest to cycling exercise, respectively. TEWL in dorsal thigh, popliteal fossa and dorsal calf at cycling was higher than that measured at rest before cycling exercise, but the differences were not significant.
3.6. Color Mapping of the Transepidermal Water Loss
This study adopted the brown and green with different degree to map TEWL data (low values with brown (6∼18 g/h.m2), medium-low values with light green (18∼30 g/h.m2) and green (42∼45 g/h.m2) and high values with dark green (54∼66 g/h.m2), etc.) (Figure 4, bottom). Figure 4 revealed a dynamic change of the skin TEWL from brown (6∼18 g/h.m2) and light green (18∼30 g/h.m2) to dark green (54∼66 g/h.m2), and then recovered light green for one consecutive cycle of restexercise-recovery.
3.7. Relationship between SCWC and TEWL
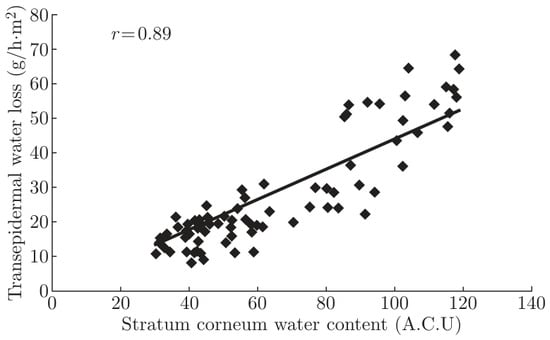
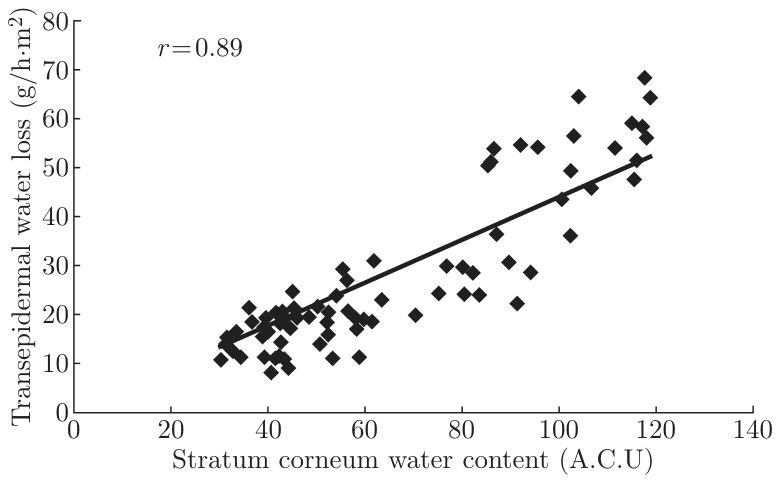
Figure 5 shows the plot of mean relationship between SCWC and TEWL (a & b), and SCWC and skin temperature (c) in cycling. There was a significantly positive relationship between SCWC and TEWL (r = 0.74, P<0.01 or r = 0.89, P<0.001 when all data during rest, cycling and recovery was included), showing that when skin stratum corneum water content increased, the transepidermal water loss increased. There was a significantly negative relationship between SCWC and skin temperature (r = −0.65, P<0.05), showing that when skin stratum corneum water content increased, the skin temperature decreased.
Figure 5.
The relationship between stratum corneum water content and transepidermal water loss.
3.8. The Amount of Sweating
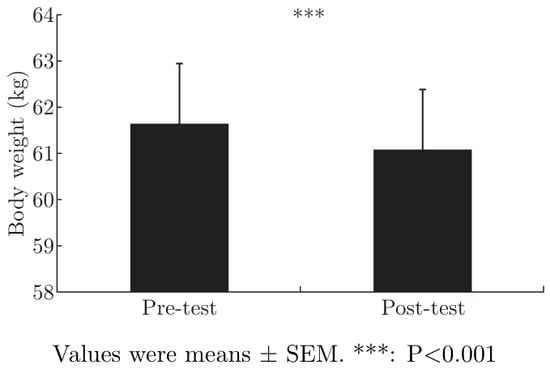
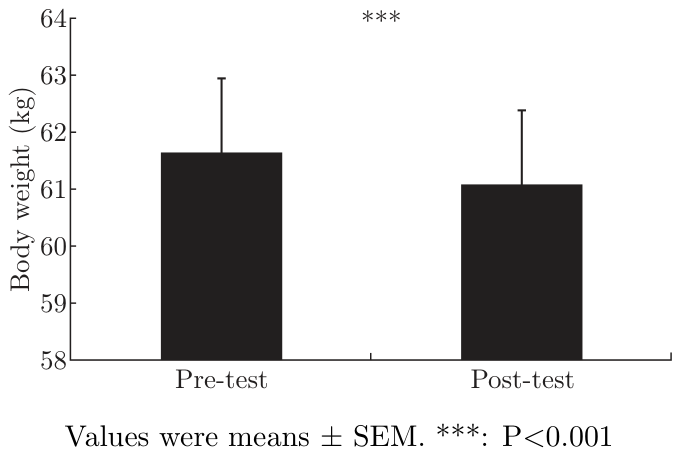
As seen in the Figure 6, the body weight decreased significantly by 569.30 g thoughout the experiment (P<0.001). According to the formula showed in the methods, 0.45 L/h sweating was produced (569.30 g/85 min).
Figure 6.
Body weight and the potential rates of sweating.
4. Discussion
The results observed demonstrate a fall in skin surface temperature and a rise in SCWC and TEWL in the dynamic cycling men. Meanwhile, sweating rate was significantly produced throughout the experiment. In previous studies, the decrease of skin temperature was found to be closely related to the evaporative heat loss [25,26], whereas the increase of evaporative heat loss was due to a markedly increased skin sweating rate as an increase of workload [17,18]. The present study agrees with the previous studies.
In the present study, all ventral and dorsal skin temperatures were significantly decreased from a minimum of 0.68 °C up to 3.48 °C than those measured at rest before cycling (Figure 1). In accordance with the regions of declines in skin temperatures, during cycling, the values of SCWC and TEWL almost attained 120 A.C.U. and 40∼60 g/h.m2 respectively (Figure 2 and Figure 3), which shows a high water content skin (sweating skin) and that the skin was hydrated [20]. In fact, the subjects produced 0.45 L/h sweating throughout the experiment. Therefore, a rise in skin sweating rate contributes to the reduction of skin temperature in the dynamic cycling men. The results of Pearson’s correlation analysis showed a significantly positive relationship between SCWC and TEWL, suggesting that when skin stratum corneum water content increases, the permeability of the stratum corneum increases, thus the transepidermal water loss increases.
This study also found that the skin temperatures decreased more profuse in the dorsal thigh, popliteal fossa and dorsal calf than in the ventral thigh and leg when subjects were exercising at the same environmental conditions and workloads. Nakayama [15] and Kashimura [27] suggested that the skin temperature during exercise depended on the competition between thermoregulatory vasodilation and reflex-induced vasoconstriction. Christensen and Nielsen reported that the onset of leg exercise induced the reduction in the finger blood flow and skin temperature [28]. Similarly, a reduction in forearm blood flow followed an intermittent 6-min period supine leg exercise [29]. Moreover, the highest skin temperatures were observed to be coincident with the surface markings of active muscle [30]. The authors suggested that the total peripheral resistance was better maintained by cutaneous vasoconstrictor response and therefore more blood was available for the working muscles. Our study showed a similar mechanism. In the cycling stroke, there is a higher activity in the muscles of ventral surfaces than in the muscles of dorsal surfaces because ventral surfaces encounter a facing wind. Muscular activity builds up metabolite, which directly induces the vasodilation of local arterioles and increases blood flow and skin temperature of ventral surfaces. Therefore, the muscle temperatures of ventral surfaces were significantly increased more than those measured at the dorsal surfaces, which might compromise the temperature declines of ventral thigh and leg. In consequence, more net temperature declines of dorsal thigh, popliteal fossa and dorsal calf were observed.
In summary, the present study observed a fall in skin surface temperature and a rise in SCWC and TEWL, as well as the production of skin sweat in the dynamic cycling men. The results obtained suggest that the reduction of skin surface temperature is associated with the evaporative heat loss due to skin sweat. The present study and our recent study [31] are the first to observe the effect of the evaporative heat loss of sweat on a fall in skin surface temperature by testing SCWC and TEWL. SCWC and TEWL first indicate the sweat and evaporation in specific areas.
Acknowledgments
The authors are grateful to the subjects for participation in this study. Additionally, we thank Liao Xiao for infrared skin temperature data output and Lam Song-song for data output of corneum water content and transepidermal water loss.
Grants
This work was supported by The Hong Kong Innovation Technology Commission and HKRITA though project ITP/014/08TP.
References
- Lotte, C.; Rougier, A.; Wilson, D.R.; Maibach, H.I. In vivo relationship between transepidermal water loss and percutaneous penetration of some organic compounds in man: effect of anatomic site. Dermatol. Res. 1987, 279, 351–356. [Google Scholar] [CrossRef] [Scilit]
- Nangia, A.; Berner, B.; Maibach, H.I. Transepidermal water loss measurements for assessing skin barrier function during in vitro percutaneous absorption experiments. In Percutaneous Absorption: Drugs, Cosmetics, Mechanisms, Methodology, 3rd edn; Bronaugh, R.L., Maibach, H.I., Eds.; Marcel Dekker: New York, 1999; Chapter 34. [Google Scholar]
- Blank, I.H. Factors which influence the water content of the stratum corneum. J. Invest Dermatol. 1952, 18, 433–440. [Google Scholar] [CrossRef] [Scilit]
- Singer, E.D.; Vinson, L.J. The water binding properties of skin. Proc. Sci. Sect. Toilet Goods Assoc. 1966, 46, 29. [Google Scholar]
- Spencer, T.S.; Linamen, C.E.; Akers, W.A.; Jones, H.E. Temperature dependence of water content of stratum corneum. Br. J. Dermatol. 1975, 93, 159–164. [Google Scholar] [CrossRef] [Scilit]
- Wildnauer, R.H.; Bothwell, J.W.; Douglass, A.B. Stratum corneum biomedical properties. I. Influence of Relative Humidity on normal and extracted human stratum corneum. J. Invest Dermatol. 1971, 56, 72–78. [Google Scholar] [CrossRef] [Scilit]
- Grice, K.A. Transepidermal water loss. In The Physiology and Pathophysiology of the Skin; Jarrett, A., Ed.; Academic Press: London, etc., 1980; Vol. 6, pp. 2115–2146. [Google Scholar]
- Grice, K.; Sattar, H.; Sharratt, M.; Baker, H. Skin temperature and transepidermal water loss. J. Invest Dermatol. 1971, 57, 108–110. [Google Scholar] [CrossRef] [Scilit]
- Yao, L.; Tokura, H.; Li, Y.; Edward, N.; Gohel, M.D.I. Effect of wearing cotton or polyester pajamas on stratum corneum water content under mild cold conditions. J. Am. Acad. Dermatol. 2006, 55, 910–912. [Google Scholar] [CrossRef] [Scilit]
- Yao, L.; Tokura, H.; Li, Y.; Edward, N.; Gohel, M.D.I.; Chung, W.J. Mechanism of pajama material on stratum corneum water content under mild cold conditions: explored by hierarchical linear regression. Skin. Res. Technol. 2007, 13, 412–416. [Google Scholar] [CrossRef] [Scilit] [PubMed]
- Saunders, A.G.; Dugas, J.P.; Tucker, R.; Lambert, M.I.; Noakes, T.D. The effects of different air velocities on heat storage and body temperature in humans cycling in a hot, humid environment. Acta Physiol. Scand. 2005, 183, 241–255. [Google Scholar] [CrossRef] [Scilit]
- Adams, W.C.; Mack, G.W.; Langhans, G.H.; Nadel, E.R. Effects of varied air velocity on sweating and evaporative rates during exercise. J. Appl. Physiol. 1992, 73, 2668–2674. [Google Scholar] [CrossRef] [Scilit]
- Kwon, A.; Kato, M.; Kawamura, H.; Yanai, Y.; Tokura, H. Physiological Significance of Hydrophilic and Hydrophobic Textile Materials During Intermittent Exercise in Humans Under the Influence of Warm Ambient Temperature With and Without Wind. Eur. J. Appl. Physiol. 1998, 78, 487–493. [Google Scholar] [CrossRef] [Scilit]
- Torii, M.; Yamasaki, M.; Sasaki, T.; Nakayama, H. Fall in skin temperature of exercising man. Br. J. Sp. Med. 1992, 26, 29–32. [Google Scholar] [CrossRef] [Scilit]
- Nakayama, T.; Ohnuki, Y.; Kanosue, K. Fall in skin temperature during exercise observed by thermography. Jpn. 1 Physiol. 1981, 31, 757–62. [Google Scholar] [CrossRef] [Scilit]
- Kashimura, O.; Ueda, G. Thermographic observations of the skin related with the arm exercise. In Fall in skin temperature of exercising man;Br J Sp Med; Torii, M., Yamasaki, M., Sasaki, T., Nakayama, H., Eds.; 1992; Volume 26, pp. 29–32. [Google Scholar]
- Kondo, N.; Nakadome, M.; Zhang, K.; Tomoyuki, Shiojiri; Shibasaki, M.; Iwata, K.H.A. The effect of change in skin temperature due to evaporative cooling on sweating response during exercise. Int. J. Biometeorol. 1997, 40, 99–102. [Google Scholar] [CrossRef] [Scilit]
- Miyagawa, T.; Ogawa, T.; Asayama, M.; Yamashita, Y. Sweating response to abrupt changes in work load. J. Physisol Soc. Jpn. 1985, 47, 17–24. [Google Scholar]
- Du Bois, D.B.S.; Du Bois, E.F. A Formula to estimate the approximate surface area if height and weight be known. Arch. Int. Med. 1916, 17, 963–971. [Google Scholar]
- Onlystar, Moisturizing effect evaluation of cosmetics. Information on http://www.onlystar.com/a_list_2.asp?arcID=73&parentID=62.
- Miller, W.C.; Wallace, J.; Eggert, K. Predicting max HR and the HR-[latin capital V with dot above] 2 relationship for exercise prescription in obesity. Med. Sci. Sports Exerc 1993, 25, 1077–1081. [Google Scholar]
- Cao ML, Mao AH, Wang RM & Li Y. Visualization of clothing thermal functional effects in virtual space. 2008 Proceedings of the 1st Textile Bioengineering and Informatics Symposium, 260-266.
- Kalvin AD, Rogowitz BE, Pelah A & Cohen A. Building perceptual color maps for visualizing interval data. 2000 Proceedings of SPIE Conference on Human Vision and Electronic Imaging, San Jose, CA, 323-33.
- Luo, X.N.; Hou, W.B.; Li, Y. Education–Oriented Virtual Environment for Clothing Thermal Functional Performance, ICCS 2007, Part III, LNCS 4489 2007, pp. 485–492.
- Torii M, Yamasaki M, Sasaki T. Thermoregulatory response of the initial stage of bicycling in a heat environment. In Fall in skin temperature of exercising man. Torii M, Yamasaki M, Sasaki T, Nakayama H. Br J Sp Med 1992; 26: 29-32.
- Torii, M.; Yamasaki, M.; Sasaki, T. Seasonal variation of sweating rate caused by exercise during thermal transient. I Hum. Ergol. 1985, 14, 53–6. [Google Scholar]
- Kashimura O, Ueda G. Thermographic observations of the skin related with the arm exercise. In Fall in skin temperature of exercising man. Torii M, Yamasaki M, Sasaki T, Nakayama H. Br J Sp Med 1992; 26: 29-32. 26.
- Christensen ElI Nielsen, M. Investigations of the circulation in the skin at beginning of muscular work. Acta Physiol. Scand. 1942, 4, 162–70. [Google Scholar] [CrossRef] [Scilit]
- Kashimura O, Ueda G. Thermographic observations of the skin related with the arm exercise. In Fall in skin temperature of exercising man. Torii M, Yamasaki M, Sasaki T, Nakayama H. Br J Sp Med 1992; 26: 29-32.
- Clark, R.P.; Mullan, B.J.; Pugh, L.G. Skin temperature during running–a study using infra-red colour thermography. J. Physiol. 1977, 267, 53–62. [Google Scholar] [CrossRef] [Scilit]
- Guo, Y.P.; Li, Y.; Yao, L.; Liu, R.; Cao, X.Y.; Cao, M.L. Skin temperature, stratum corneum water content and transepidermal water loss distributions during running. J. Fiber Bioeng. Inform. 2011, 4, 253–266. [Google Scholar] [CrossRef] [Scilit]
© 2013 Textile Bioengineering and Informatics Society. This article is an open access article distributed under the terms and conditions of the Creative Commons Attribution (CC BY) license (https://creativecommons.org/licenses/by/4.0/).