


Abstract
In computer vision applications, human detection occupies an important position. HOG (Histograms of Oriented Gradient) is a classical algorithm which was used in the area of object detection. But the complex background would greatly affect the test accuracy when taking HOG as a human characteristic for human detection. In order to improve the accuracy of human detection, this paper applied a new algorithm which was based on foreground segmentation. We could get each closed region by Oriented Watershed Transform and Ultrametric Contour Map, then the foreground and the background could be distinguished. Finally we removed the background and calculated the foreground characteristic. The experimental results show that this approach was effective in improving detection accuracy.
1. Introduction
In recent years, pedestrian detection and location are the topical issues in the field of computer vision and image processing, and is applied to many other fields. Pedestrian detection, location’s accuracy and speed directly affect the follow-up work, so the detection and location technology have a great deal of attention. The detected images always have noise because of weather, light and in particular the effects of complex environmental background, which creates a lot of difficulties in Pedestrian detection and location.
At present, human detection is usually based on statistical classification methods [10,11]. Hu-man detection is seen as a problem of classification of humans and non-humans, and its step is extracting the body characteristics and pattern recognition classification [1]. Existing feature extraction methods such as the wavelet feature, SIFT [2], Shape Context [3], PCA [4] and so on, makes some calculations on the dense, unified space unit, and in order to improve performance, there isneed to standardize the contrast of pixel in overlapping location. Dalai [5] and others pro-posed the HOG (Histograms of Oriented Gradient, HOG), which was used in target detection for pedestrians earlier. It is a better method in the field of pedestrian detection. It doesn’t consider characteristics from the overall image. The gradient and edge direction histogram of each pixel are calculated on a gradient according to the images. We then obtained some gradient vectors. This method has a better robustness for changes in the morphology of the human body. Due to the interference of complex image background, the accuracy of detection and location will be influenced.
In this paper, we use the foreground segmentation method to reduce the impact of complex background on final detection results during pedestrian detection process.
2. HOG Feature Extraction and SVM Classification
When pedestrian is detected, the characteristics of the human body needs to be extracted, which is a prerequisite for classification and pedestrian detection. The basic steps of traditional HOG feature extraction are as follows.
2.1. Enter Image
Enter the image which will be processed, then we calculate the grayscale value of each pixel. Gradient calculation formula is as follows:
where f (x, y) is the grayscale values of each pixel, dx(x, y) is derivative of the pixel (x, y) in the direction of x, dy(x, y) is derivative of the pixel (x, y) in the direction of y.
where G(x, y) is Gradient amplitudes on the pixel (x, y), θ (x, y) is Gradient direction on the pixel (x, y).
dx(x, y) = f(x + 1,y) − f(x − 1,y)
dy(x, y) = f(x, y + 1) − f(x, y − 1)
θ(x, y) = tan−1(dy(x, y)/dx(x, y))
2.2. Generating Eigenvectors
After we obtain the gradient amplitudes and gradient direction of each pixel, we build a block by 16×16 pixels. For each block, there are four 8×8 cells, and for each cell, there are nine bins. We divide 2π into 9 parts. Then we vote in the interval of 2π/9 by the gradient direction of each pixel, and assume the gradient amplitudes as weight. So there are 36 dimension eigenvectors in a block.
2.3. Normalization
Due to lighting effects, gradient has a great range of changes, and it’s difficult to adapt to the changes for a classifier [6]. Therefore we need to normalize the eigenvectors. As the choice of norm has little effect on the results and the L2-norm has a fastest computing speed, we select L2-norm
where x=[x1, …, x36] is not the normalized eigenvectors in the block. eis a small constant. Then we can calculate the 36 dimension normalized eigenvectors in the block by formula (5), (6).
3. Foreground Segmentation
Each image for a particular objective is made up of a foreground and background. When detecting pedestrian, we can obtain the initial contour of an image through contour detector, and then we will discover the closed regions in the image by Oriented Watershed Transform and Ultrametric Contour Map, so as to separate foreground from background.
3.1. Extracting Initial Contour
The current contour detection technologies have many uses. This paper uses the GPB (Global-ized Probability of Boundary) detectors to produce initial contour. GPB detector considers the features such as brightness, color, texture and gradient, where gpb (x, y, θ) is the probability of the pixel which is on the contour.
Thus, mpb (x, y, θ) is the possibility of the pixel which is on the edge. The formula is defined as follows:
In the formula, σ is the radius of the circle which assumes (x, y) as the centre. s is the size of radius; θ is the angle of circle’s diameter. We take eight directions during (0, π); i is the feature channels of brightness, color, texture and gradient; α is the weight; Gi,σ(s)(x, y, θ) is the histogram difference under the i feature channel. The circle whose centre is (x, y), radius is s divided into two parts by the diameter whose angle is θ, each part can generate a histogram by statistics the feature of i, the histogram difference is Gi,σ(s)(x, y, θ).
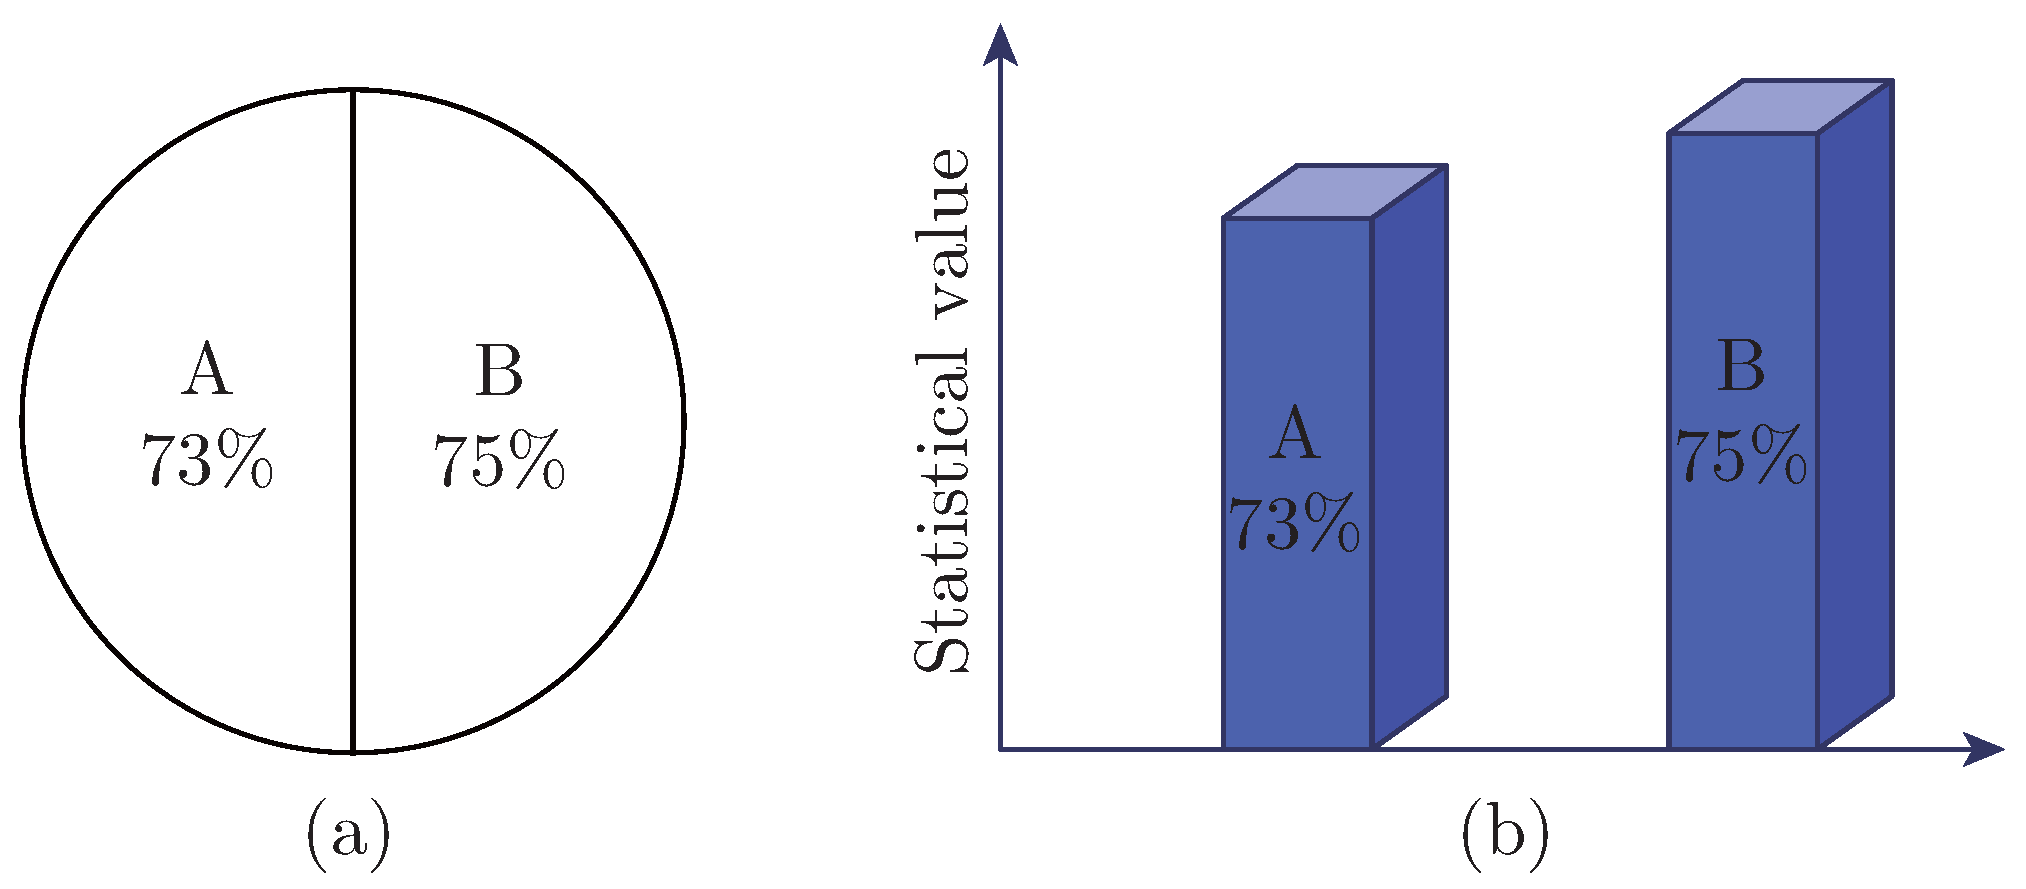
For examplethe circle whose centre is (x, y), radius is 5 is divided into two parts by the di-ameter whose angle is 90°. Each part can generate a histogram by statistics featuring colors. Gi,σ(s)(x, y, θ) is the difference of the two parts. Large difference indicates this pixel has a high probability that it is on the contour. Similarity computation based on (x, y) is shown in Figure 1. Note that Figure 1 (a) shows the circles are divided into two parts by the diameter whose angle is π/2. Figure 1 (b) shows the Statistical value of A and B parts.
In order to reflect the global information, we built a matrix W [6], and construct a symmetric matrix D, Dii = . By solving (D − W)v = λDv, we obtain n minimum eigenvalues. We can then calculate n eigenvecters {v1, …, vn} [7]. We make the value of eigenvectors as the value of pixel which is in the image as big as the original image. Then we can calculate spbvk (x, y, θ) by GDD (Gaussian Directional Derivatives) transform, and sum the n eigenvectors which have weight.
mpb contains edge information, spb extracts only the most salient curves in the image, gpb rep-resents the global information.
However, we obtained the contour which are not closed according to gpb(x, y, θ), and they can’t construct closed regions in the image.
gpb(x,y,θ) = mpb(x,y,θ) + γ·spb(x,y,θ)
3.2. Oriented Watershed Transform and Ultrametric Contour Map
In order to obtain the closed regions, we can get the initial contour by gpb(x, y) = maxθ gpb(x, y, θ). In the similar parts, we select the minimum gpb(x, y) as basis points, and we take p0 as the mini-mum gpb(x, y). From p0 in each region, we can generate closed regions by Watershed Transform. k0 represents the corresponding arcs. Then we use the approximate straight line instead of arc k0. If the distance from any point on the arc to the end point of the arc is longer than a fixed length, then we subdivide the arc from this point to the end of the arc [8].
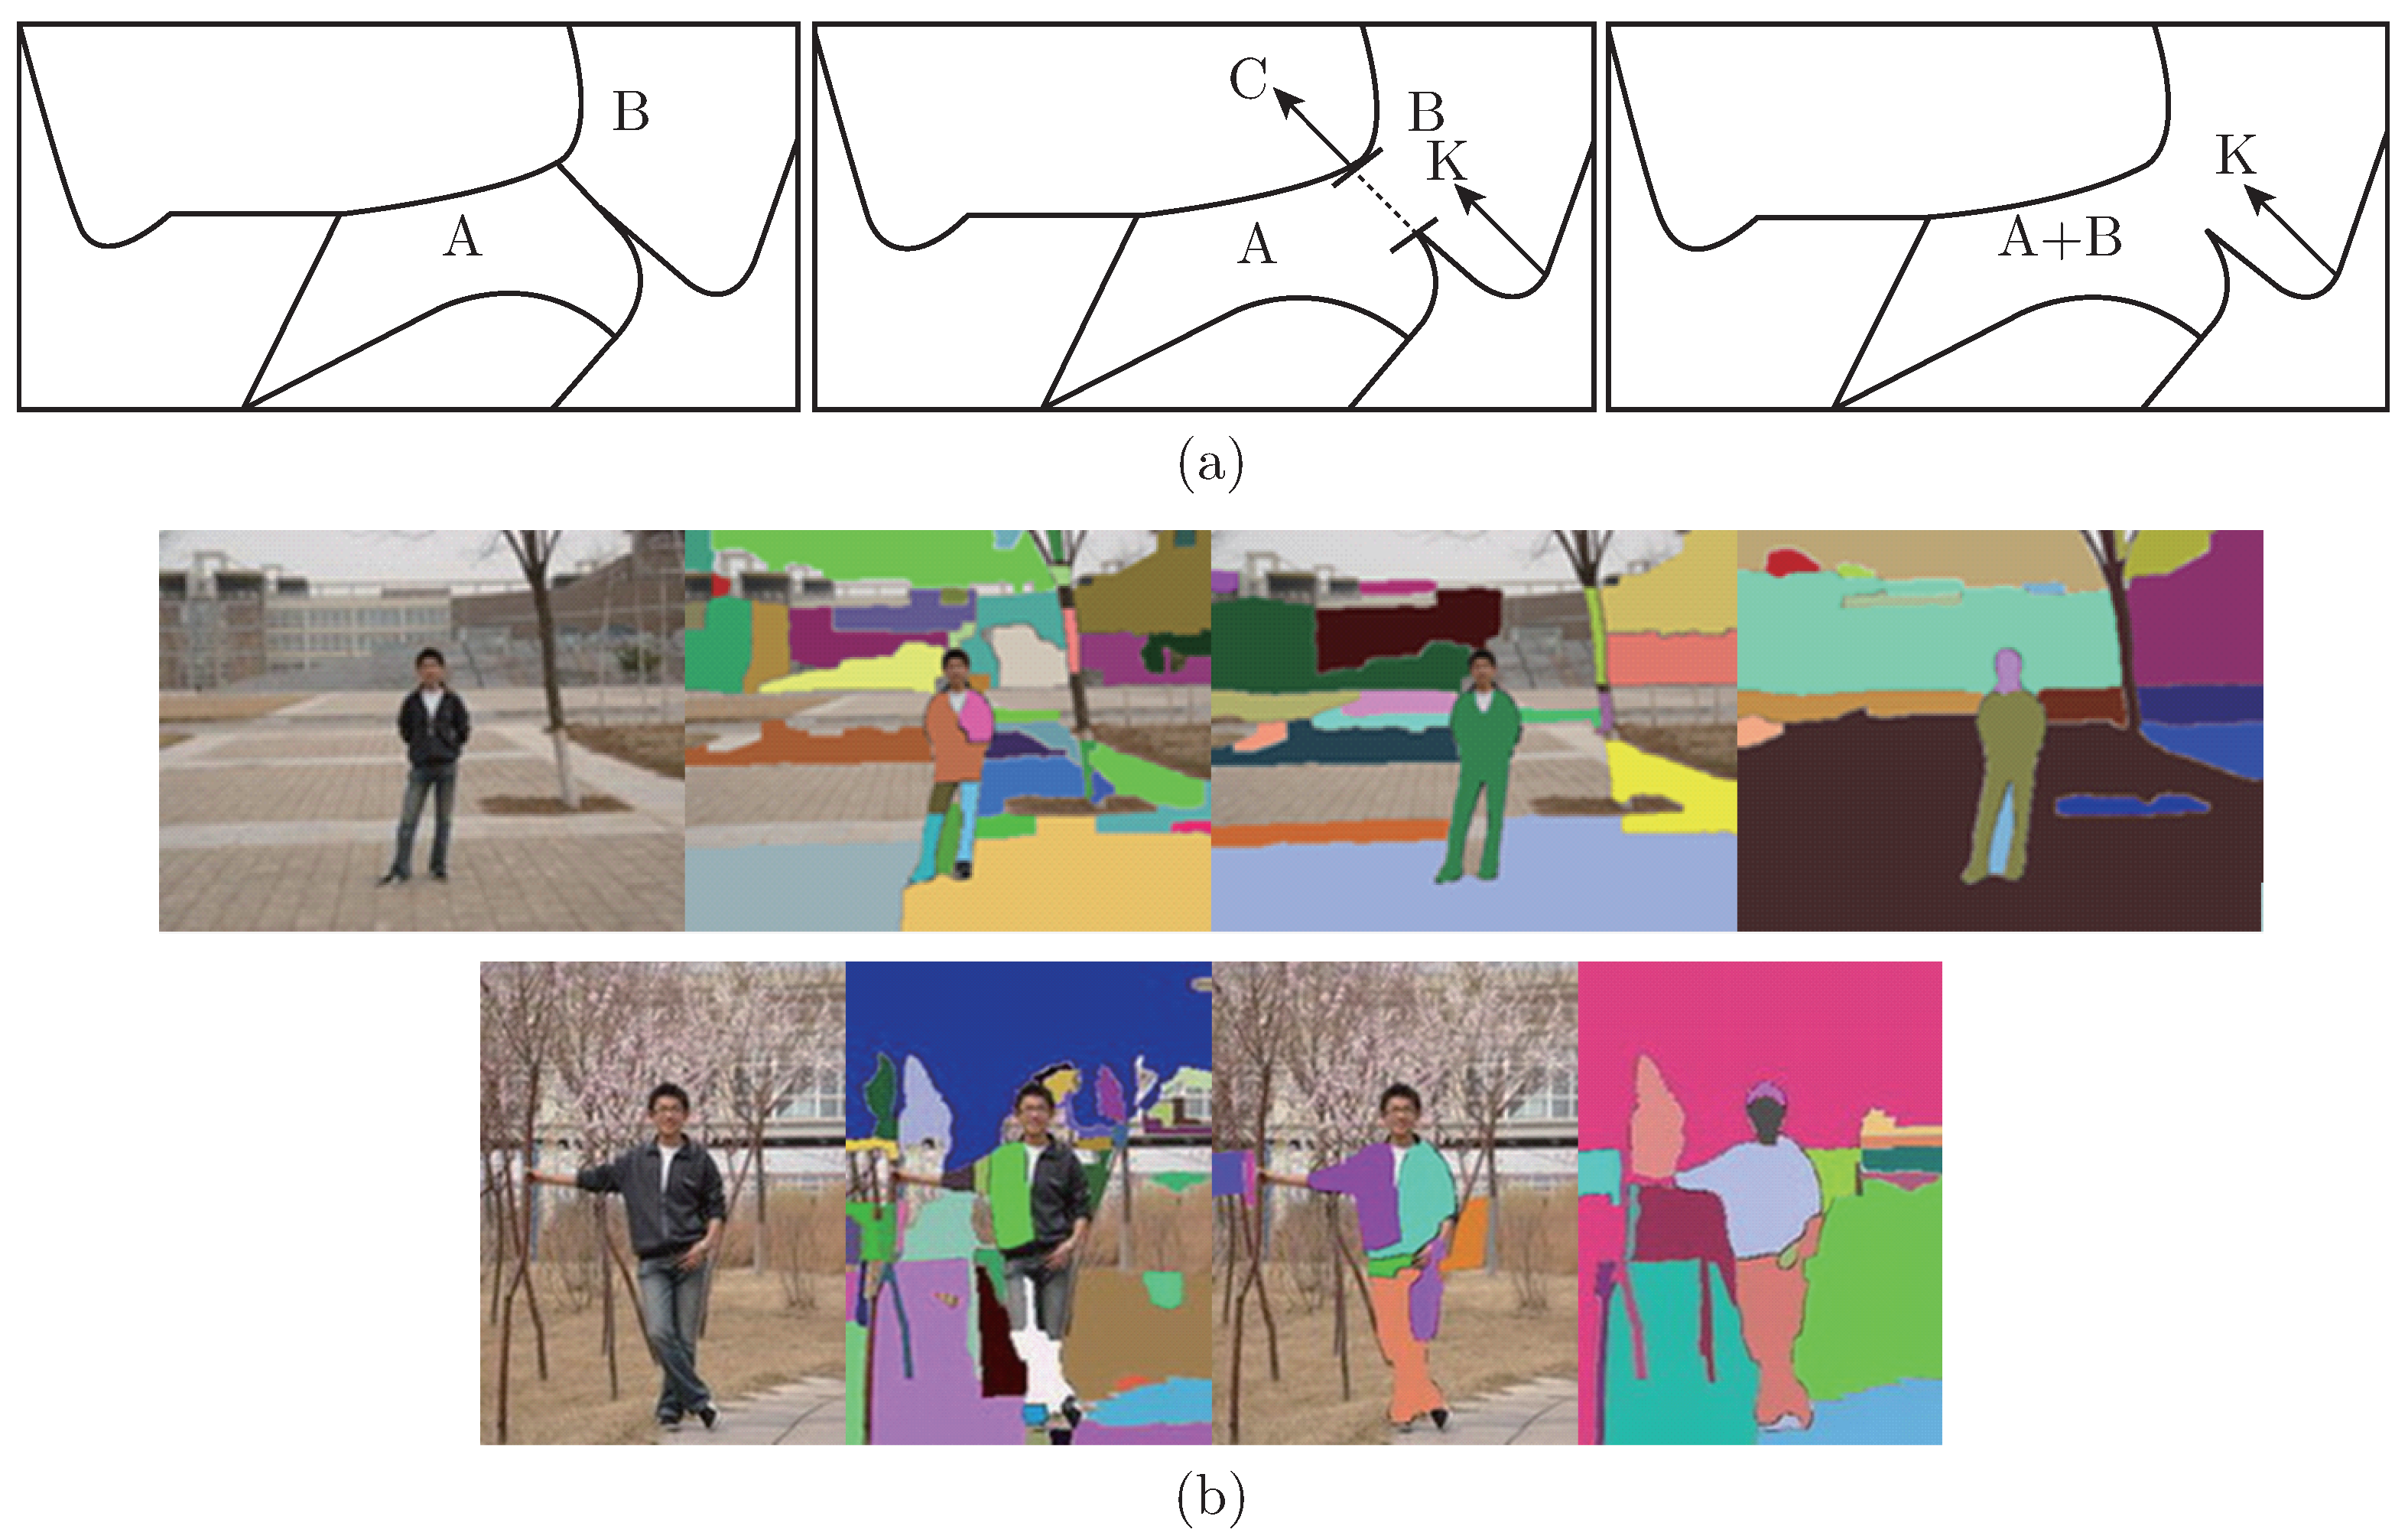
We can get over-segmentation by Oriented Watershed Transform. Next, we can get closed regions in different hierarchy by merging the similar regions. The steps are as follows:
(1) We select an arc c from the arc k0, and make weight w(c) minimum;
(2) Merge region A and region B which are divide by arc c;
(3) Update data, k0 = k0 − c, the new region is the collection of region A and region B;
Note that the Figure 2 (a) shows the processes of merging the similar regions; In Figure 2 (b), we selected 3 different images to specifically show the processes of Figure 2 (a). According to the results of Figure 2, we define all the regions which are over segmented as the first layerand defined the regions which are merged one time as the second layer, and so on. Finally we get an image which does not have similar regions, as shown in the last column of (d). So we get a region tree [9]. Leaves are the regions which are over segmented, and root is the image which has merged all the similar regions. Collecting all regions, we will get a bag of regions.
Figure 2.
Schematic diagram showing mergingof similar regions.
4. HOG Feature Extraction by Foreground Segmentation
As previously mentioned, we have got a bag of regions which contains a lot of closed regions. From each region, we can get an enclosing rectangle. Through these, we can separate the foreground from background in the image very well. At the time of training samples, we only need to frame the pedestrians with a 64×128 window in each image, as shown in Figure 3.
Figure 3.
Framing the human and confirm the region in the box.
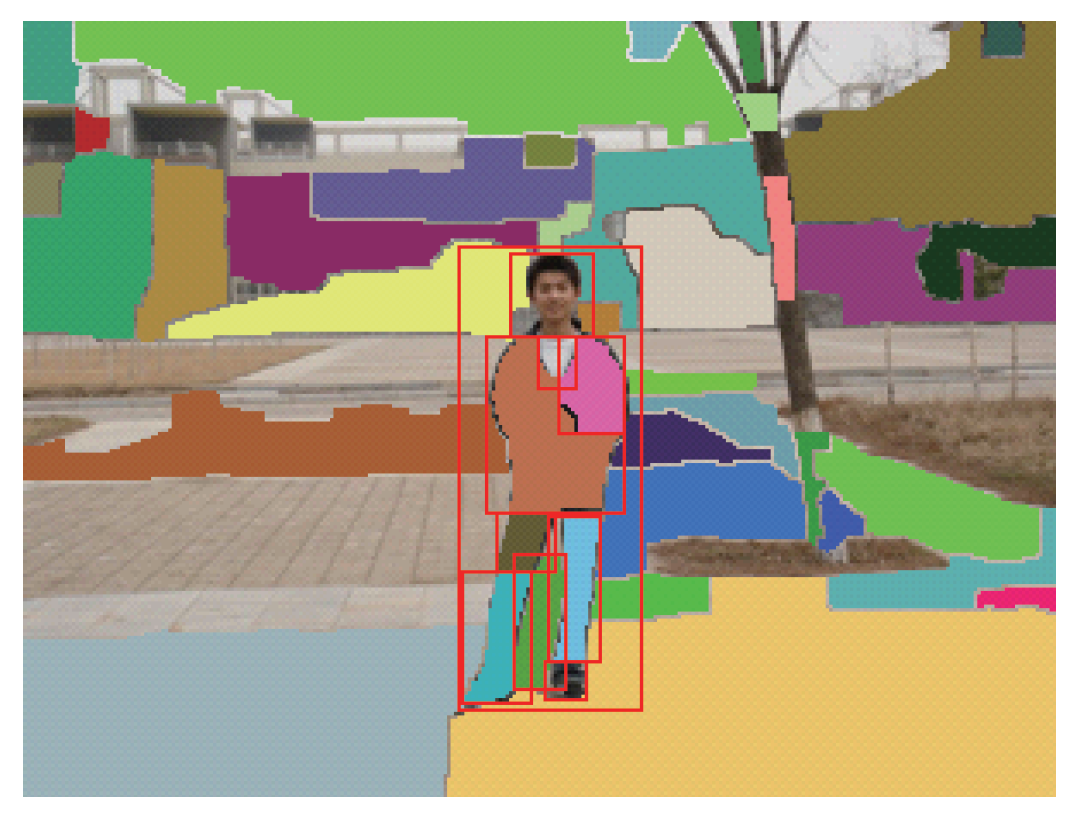
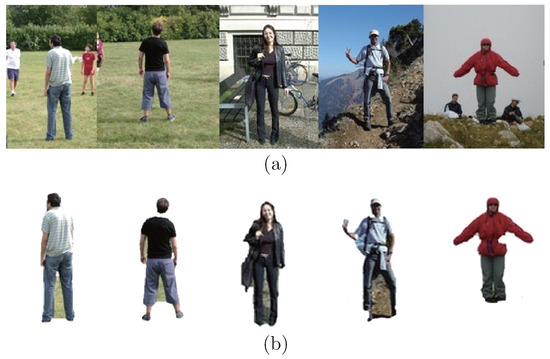
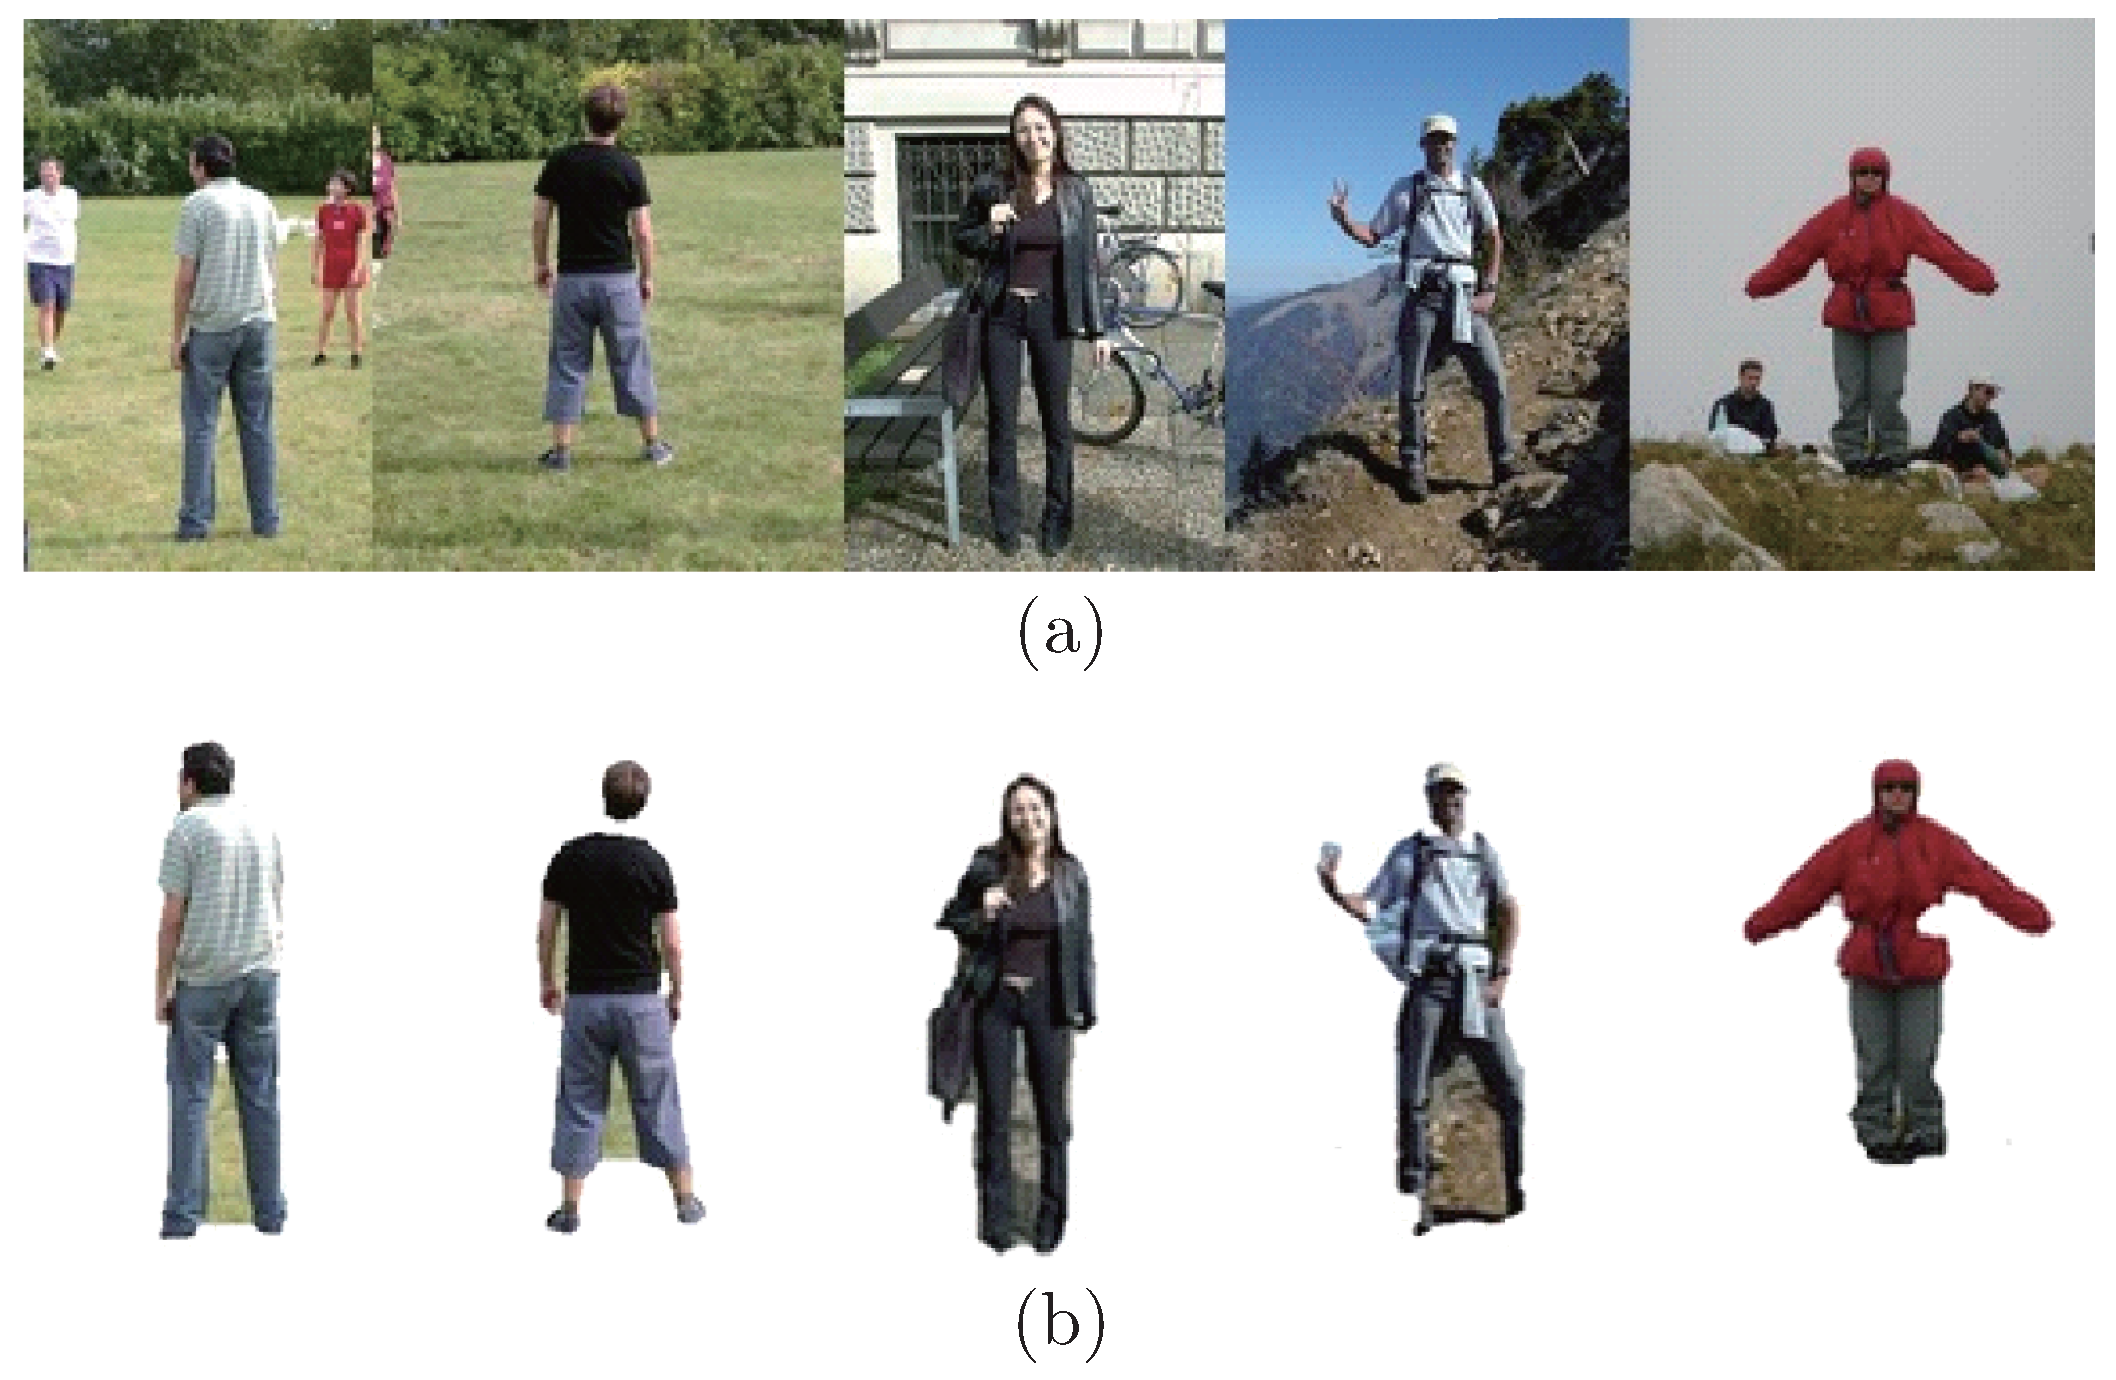
And then we compare the enclosing rectangle of each region and the window. If this region is complete in the window, we keep it, or else we remove it. So we can get an image which only contains pedestrians. Figure 4 indicates the processing results of part of the samples.
Thus we get a 64×128 image which only contains a pedestrian. In this image, we also define 16×16 pixels to a block, 8×8 pixels to a cell. From part II(a), each cell can generate 9 eigenvectors.
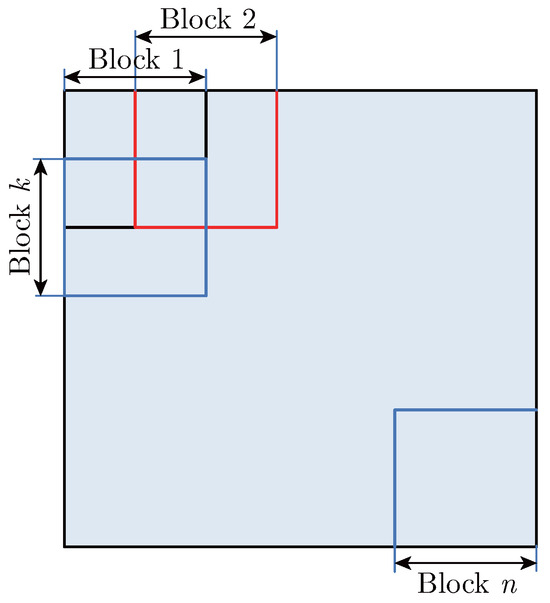
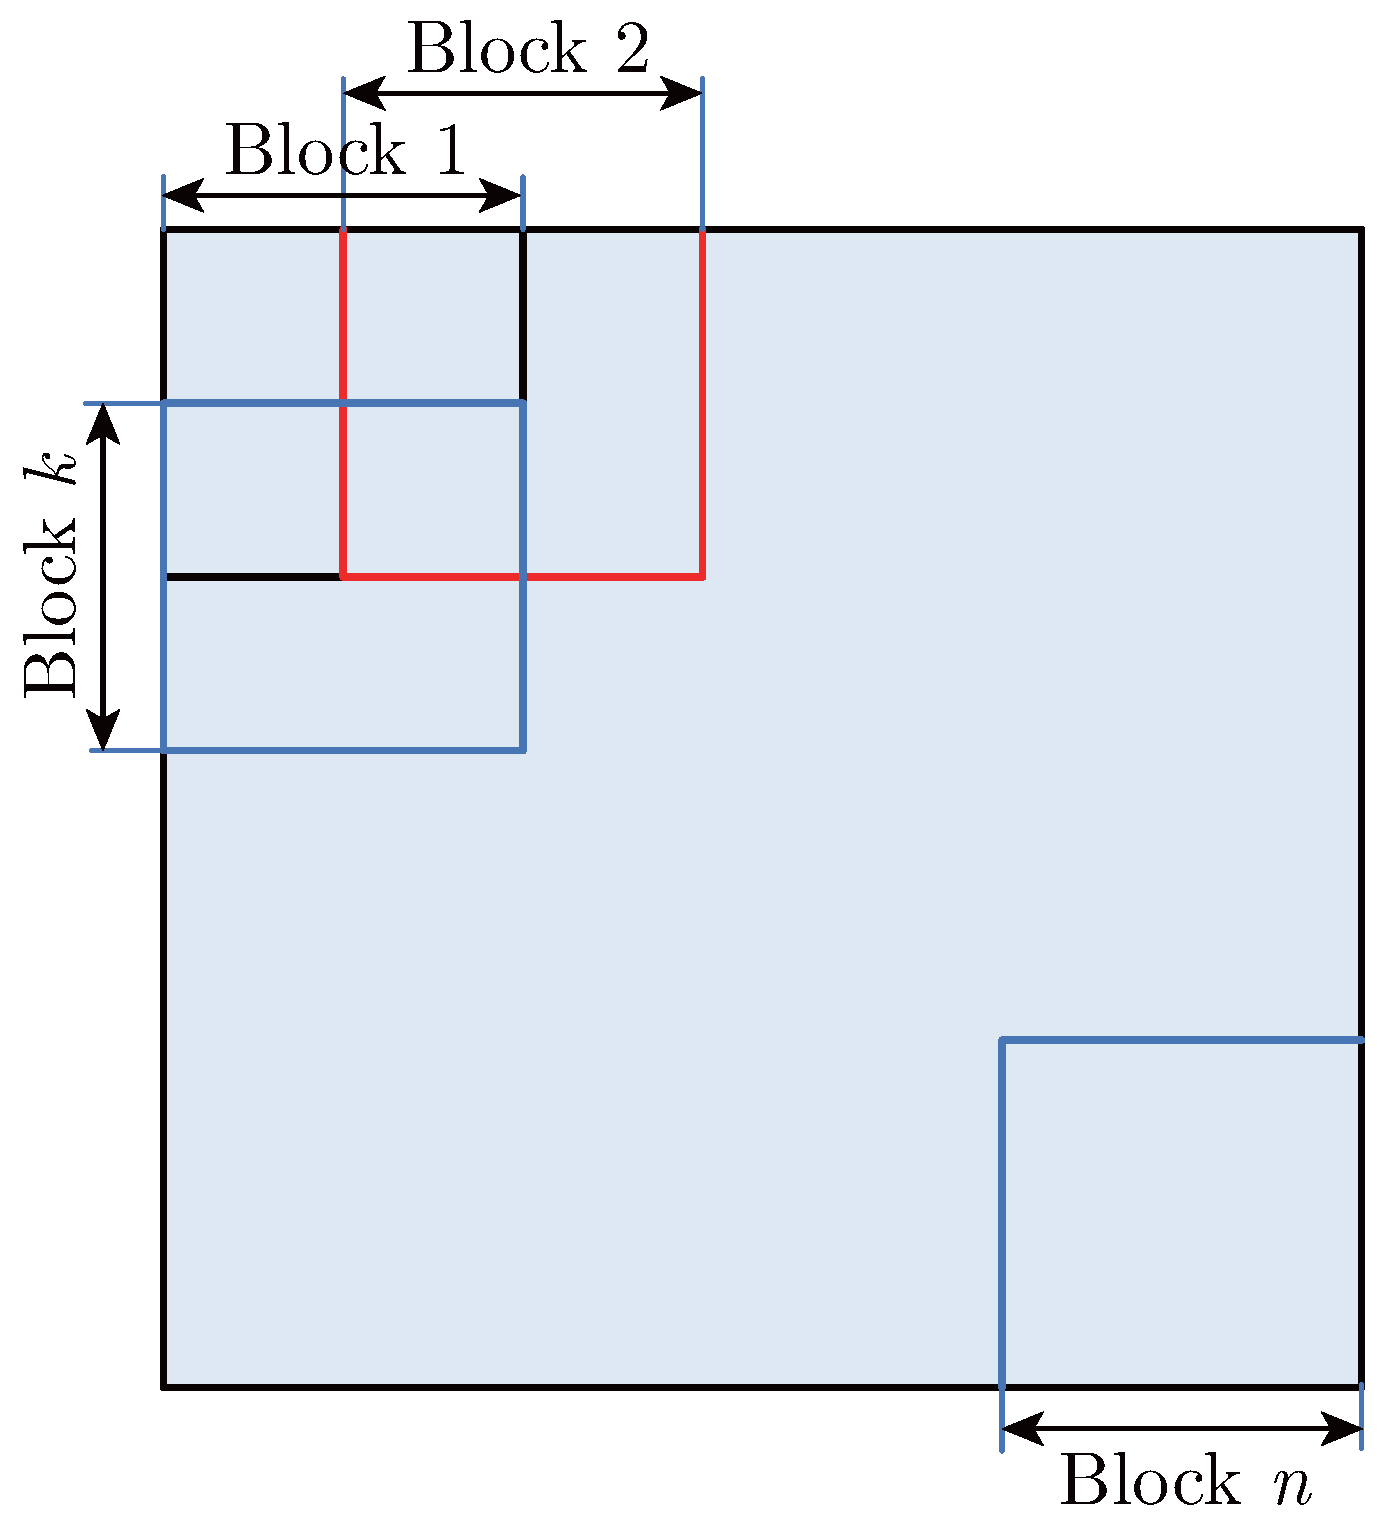
In order to get a full range of features, from the image’s horizontal and vertical, we build a block with interval of 8 pixels as shown in Figure 5.
Figure 5.
Distribution of the blocks in the image.
By formula (10), we calculate the eigenvectors of that pedestrian image.
The eigenvectors’ dimension of that pedestrian image is 3780. Sum is the dimension of eigen-vectors, width is the image’s width, height is the image’s height, and step is the interval. For negative samples, we selected samples of non-pedestrian, including motor vehicles, bicycles, cups and so on. We also separated foreground from background, and calculated the image’s HOG which is without background. Then we got the 3780 dimension eigenvectors and send them to the SVM for classification.
5. Experimental Procedure and Results
In order to verify the validity of this research method, we wrote a computer program in the matlab environment on the linux platform and did a large number of experiments. We trained the samples which are in the INRIAPerson detection sample library in order to compare with other algorithms. For the test images which need to test pedestrianthrough foreground segmentation, we can obtain all the regions of the entire image, as well as the upper-left coordinate and lower-right coordinate of each region’s enclosing rectangle.
First of all, we built an image which is 64x128pixel, each pixel’s gray scale values of the image for r, g, b channels are 255.
When a pedestrian is detected, we select a window whose size is 64x128. When we detect an image, the window begins to make horizontal and vertical movement from the upper-left corner. In order to avoid missing the pedestrian or if the number of detectionsare excessive which will affect the speed of the calculation, we select the 3 pixels. In each window, by comparing the window’s coordinates and the enclosing rectangle’s coordinates of each region, we can determine which region is in this window. For a region which is complete in this window, we make grayscale value of the pixel in the image which we build equal to the grayscale value of the corresponding position’s pixel in this region. If the total region of the human body is in the window, then the new image only contains a human. And then we can get the HOG of this new image, and compare it to the data which has been trained. We can then locate the human.
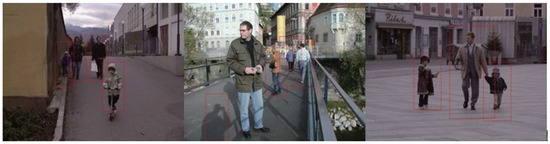
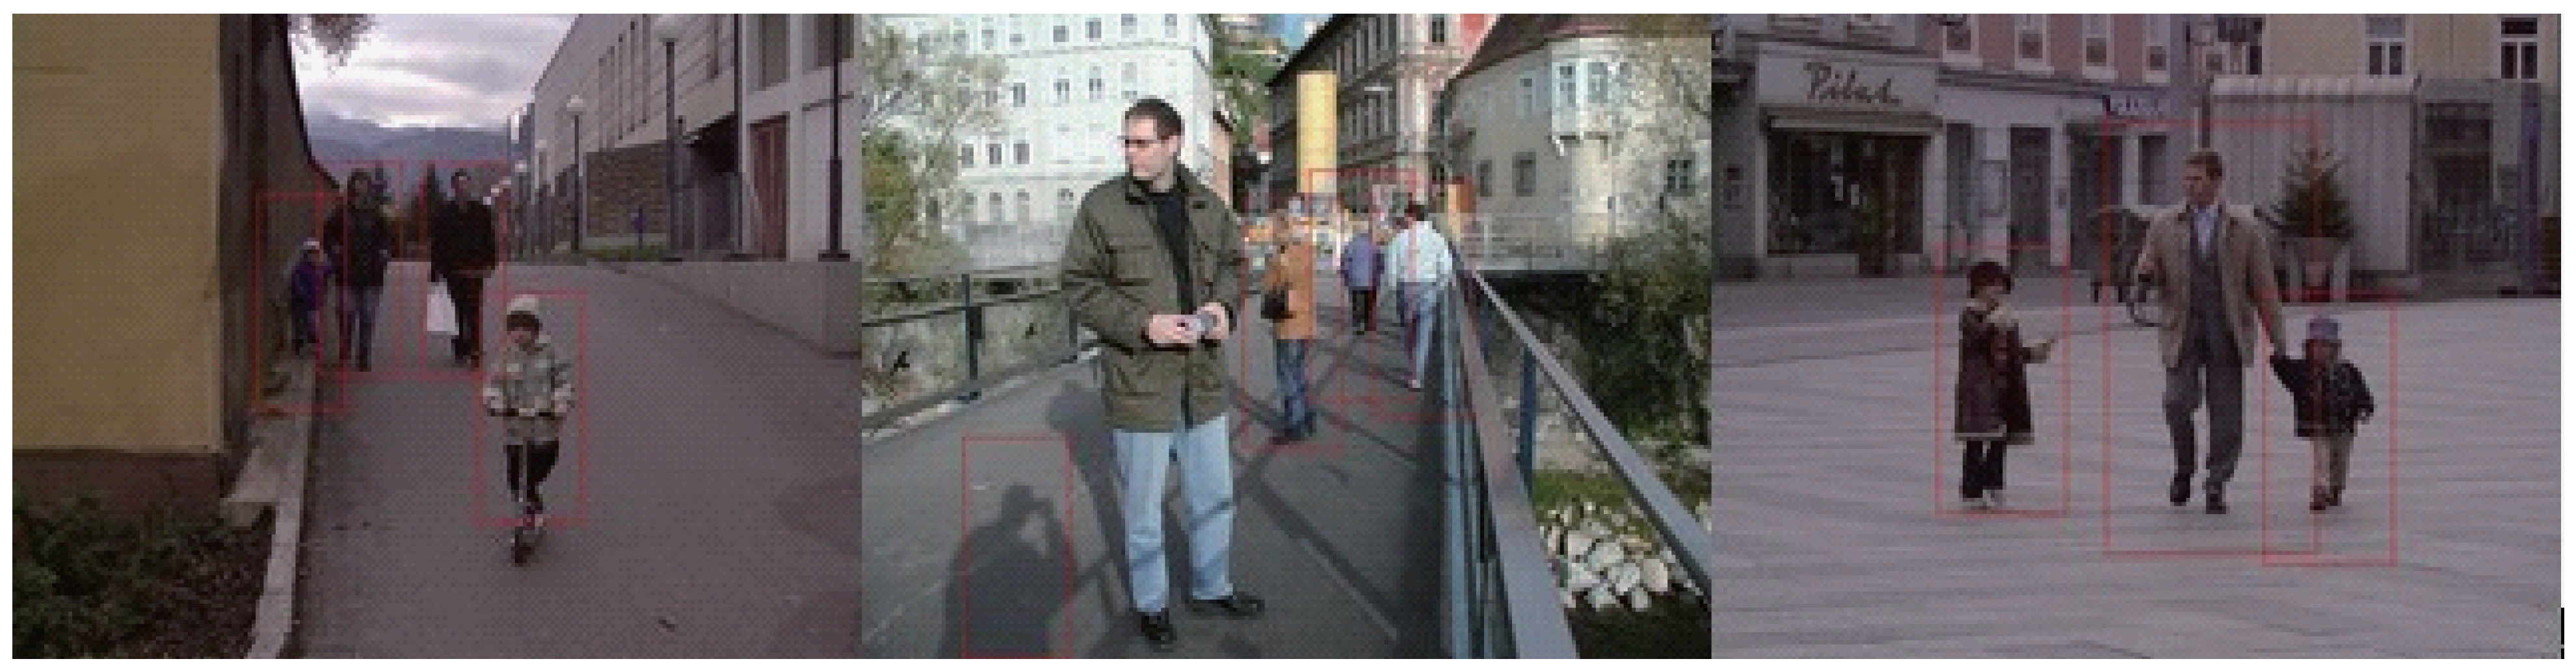
Since the impact of complex background has been removed, it improves detection accuracy, provides guarantee for follow-up target recognition. Figure 6 shows a part of the test results. The accuracy rate, miss rate and false rate of the traditional algorithms (SIFT, PCA, and HOG) and our methodin the area of pedestrian detection are listed in Table 1.
Figure 6.
The effect of human detection.
Table 1.
Comparison of traditional and our method.
6. Conclusion
This paper focuses on the impact of complex background on image detection accuracy, drawing on the method of HOG feature extraction and SVM classification techniques, which are now widely applied in human detection. We use the foreground segmentation technology to remove the impact of complex background for image detection accuracy. The experimental results show that the method highlights the human edge gradient feature. Compared with traditional detection methods, the proposed method has better detection rates.
Acknowledgments
This work is supported by the National Science Foundation of Liaoning Province of China (No. 201102180) and the National Nature Science Foundation of China (No. 61272253).
References
- Zhou, J.Z.; Wang, J. Improvement of human detection method based on HOG. Softw. Guide 2011, Vol. 10(No. 4), 76–78. [Google Scholar]
- Lowe, D.G. Distinctive image features from scale-invariant keypoints. Int. J. Com.-Puter Vis. 2004, Vol. 60(No. 2), 91–110. [Google Scholar] [CrossRef] [Scilit]
- Belongie, S.; MalikJ; Puzicha, J. Proceedings of IEEE International Conference on Computer Vision. 2001; pp. 454–46.
- Rencher, A.C.; Christensen, W.F. Methods of Multivariate Analysis; Wiley Press, 2012; pp. 405–433. [Google Scholar]
- Dalai, N.; TriggsB. Histograms of oriented gradients for human detection. Proceedings of IEEE Computer Society Conference on Computer Vision and Pattern Recognition, 2005; pp. 886–893. [Google Scholar]
- Ren, X.; Gu, C.C. Hand Gesture Recognition Based on HOG Characters and SVM. Bull. Sci. Technol. 2011, Vol. 27(No. 2), 211–214. [Google Scholar]
- Fowlkes, C.; Martin, D.; Malik, J. Learning affinity functions for image segmentation: combining patch-based and gradient-based approaches. Proceedings of IEEE Computer Society Conference on Computer Vision and Pattern Recognition, 2003; pp. 54–61. [Google Scholar]
- Arbelaze, P.; Maire, M.; Fowlkes, C. Contour Detection and Hierarchical Image Segmentation. Pattern Anal. Mach. Intell. 2011, Vol. 33(No. 5), 898–916. [Google Scholar] [CrossRef] [Scilit]
- Lim, J.J.; Arbelaze, P.; Malik, J. Recognition using Regions. Proceedings of IEEE Computer Society Conference on Computer Vision and Pattern Recognition, 2009; pp. 1030–1037. [Google Scholar]
- Liu, J.; Gong, Z.H.; Gao, E.Y.; Liu, Y.N. Research on Electrical Symbols Recognition of HOG. J. Shenyang Jianzhu Univ. (Natural Science) 2013, Vol. 29(No. 3), 571–576. [Google Scholar]
- Wu, C.D.; Zhang, C.B. Detecting and Locating Method of Human Face in Driver Fatigue Surveillance. J. Shenyang Jianzhu Univ. (Natural Science) 2009, Vol. 25(No. 2), 386–389. [Google Scholar]

© 2013 Textile Bioengineering and Informatics Society. This article is an open access article distributed under the terms and conditions of the Creative Commons Attribution (CC BY) license (https://creativecommons.org/licenses/by/4.0/).