


Abstract
Archeological glass has attracted significant attention in recent years. Its archaeometric study has proven to provide remarkable insights into technological development and relationships among ancient cultures. Thus, ancient glass remains have been recovered from oblivion, and their preservation has become a priority. An extraordinarily well-contextualized collection of ancient glass beads, comprising over 1200 pieces, has been recovered from the archeological site of Pintia (Padilla de Duero, Valladolid, Spain). A large fraction of this collection appears to be well preserved. However, recent detailed studies on its most relevant piece, a Phoenician glass pendant, evidenced the presence of carbonatation processes. Accordingly, an extensive analysis of the preservation state of this collection was required to safeguard it for future generations. Thus, 64 representative samples from this collection, including diverse chronologies, morphologies, and colors, were analyzed by micro-FTIR spectroscopy at the IRIS beamline of the BESSY-II synchrotron (Berlin, Germany), yielding ATR and reflectance spectra. This work, the first micro-FTIR spectroscopy study of a large set of pre-Roman glass beads, provided evidence about the preservation of the glass structure of these pieces, as well as about the presence of crystalline weathering products.
1. Introduction
Since its discovery, glass has been a relevant material for the cultural and technological history of humankind [1]. Notably, during Protohistory, glass was a luxury and prestige good [1,2]. Among other reasons, its exclusivity in the Mediterranean was related to its primary production, mainly constrained to Syria–Palestine and Egypt, and its subsequent distribution, in which Phoenicians played a major role [3,4,5]. This circumstance offers a unique perspective from which to delve into the relationships between Mediterranean cultures, necessitating the combination of typo-chronological classifications, archeological contexts, and archaeometric analysis to address this issue [6]. However, a common limitation encountered in such studies, necessarily non-invasive, could be the preservation state of the glass remains (e.g., loss of integrity, color, glassy nature, opaque weathering, pitting, etc.) [7]. In fact, ancient glasses tend to be unstable due to their original compositions, even raising questions about the sustainability of the environmental control required for their preservation in heritage institutions [8]. Therefore, addressing the weathering of ancient glass collections is a key step, on the one hand, to ensure the quality of the data obtained from their study and, on the other hand, to evaluate their preservation requirements for future generations.
Among other Protohistory glass collections, the pre-Roman glass bead collection recovered at the archeological site of Pintia (Padilla de Duero, Valladolid, Spain) stands out for its singularity [9,10]. Over 1200 glass pieces have been recovered from a site far from any coast accessible to the Phoenicians, in the westernmost territory of the Mediterranean, the Iberian Peninsula. Moreover, this collection presents significant variability in shape and color [11], including some exquisite polychrome beads, such as the outstanding Phoenician pendant recently studied in a previous work [12]. From a visual perspective, this collection appears to be in relatively good condition. However, noticeable dealkalinization and the presence of crystalline weathering products have been reported in a few pieces in previous works [12,13]. Therefore, a larger study focusing on the potential weathering of the glass pieces of this collection seems necessary to ensure their preservation.
Typical glass weathering phenomena include de-alkalinization (i.e., leaching of light elements such as Na or Mg from the surface, being replaced by hydrogen ions from solution), breakdown of Si-O-Si bonds of the glass surface in the presence of aqueous medium to form silanol groups (-Si-OH), and the precipitation of crystalline weathering products on the glass surface [14,15,16]. From a morphological perspective, dealkalinization and the breakdown of Si-O-Si bonds are associated with cracks on the glass surface, the detachment of small layers of corroded glass, and, frequently, an irisation effect, typically due to light interference within the layers of corroded glass [7,17].
The study of glass weathering is usually addressed through elemental composition analysis (e.g., XRF, SEM-EDS, PIXE/PIGE) and scanning electron microscopy (SEM) to evaluate the leaching of light elements and the presence of surface alterations (e.g., cracks, detachment, etc.) [7,13,16]. However, other techniques, such as vibrational spectroscopy, have also been employed to study the evolution of the glass network, the presence of crystalline weathering products, and the formation of silanol groups [17,18]. Regarding the glass network, vibrational spectroscopy techniques are essential to deepen the study of materials without long-range order. Although Raman spectroscopy is widely employed with that aim [13,19,20], FTIR spectroscopy has also been proposed as an alternative [15,18,21,22,23]. By means of FTIR spectroscopy, it is possible to study the stretching (at about 1000 cm−1) and bending vibrations (at about 500 cm−1) of Si-O-Si units [18,22], even carrying out deconvolution of the obtained spectra, as in Raman spectroscopy studies of ancient glasses [13,19,20]. In fact, a micro-FTIR spectroscopy study of glass beads, combined with deconvolution of the stretching and bending bands of the Si-O-Si network, has shown that the approach is sensitive to the depolymerization of the glass [22]. Moreover, specific FTIR spectroscopy setups, such as reflectance FTIR spectroscopy or diffuse reflectance infrared Fourier transform spectroscopy (DRIFTS), allow non-invasive analysis of archeological pieces and have been successfully used to monitor corrosion mechanisms in glass, as well as to study standard glasses and historical glass tesserae [15,18].
In addition, FTIR spectroscopy is a technique capable of identifying crystalline weathering products in the corrosion layers [17]. Also, FTIR spectroscopy is helpful for studying the presence of hydroxyl bonds in the 2500–3800 cm−1 range, and is employed to evaluate the effectiveness of water cleaning in mitigating the degradation of heritage glass [23]. Moreover, the capability of FTIR spectroscopic imaging to produce hyperspectral maps with high lateral resolution has been highlighted as a powerful tool for the study of cultural heritage [24,25]. Therefore, FTIR spectroscopy, particularly in reflectance mode, is a suitable technique for studying glass weathering on archeological objects. However, it should be noted that the study of actual heritage materials by FTIR spectroscopy, using reflectance modes (either specular or diffuse), is often complicated by distortions in the resulting spectra [25,26]. These distortions usually arise from the detection of specular reflectance when working with diffuse reflectance, and vice versa, when the surfaces of the studied materials are not homogeneous and smooth [26].
Herein, the first completely non-invasive micro-FTIR reflectance spectroscopy study of a large set of pre-Roman glass beads is presented. The study was performed on 64 glass pieces recovered from the archeological site of Pintia (Padilla de Duero, Valladolid, Spain), aiming to evaluate the capability of this non-invasive approach to assess the preservation state of this glass collection.
2. Materials and Methods
2.1. Samples
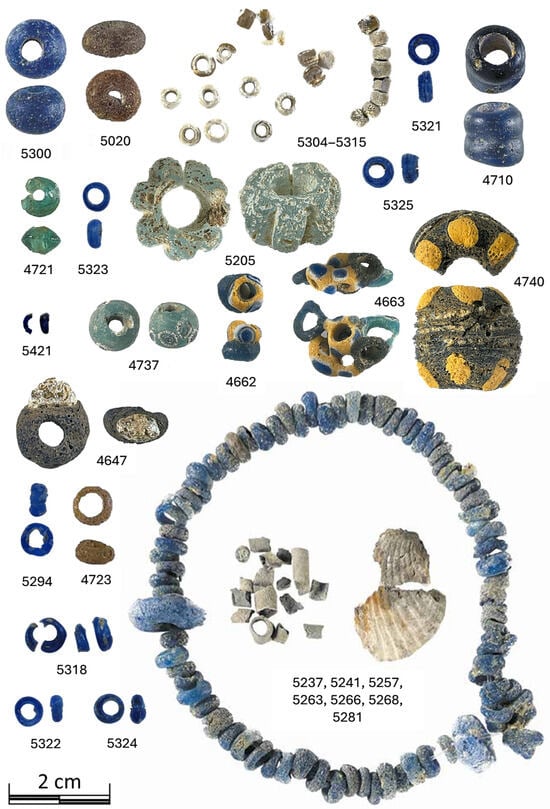
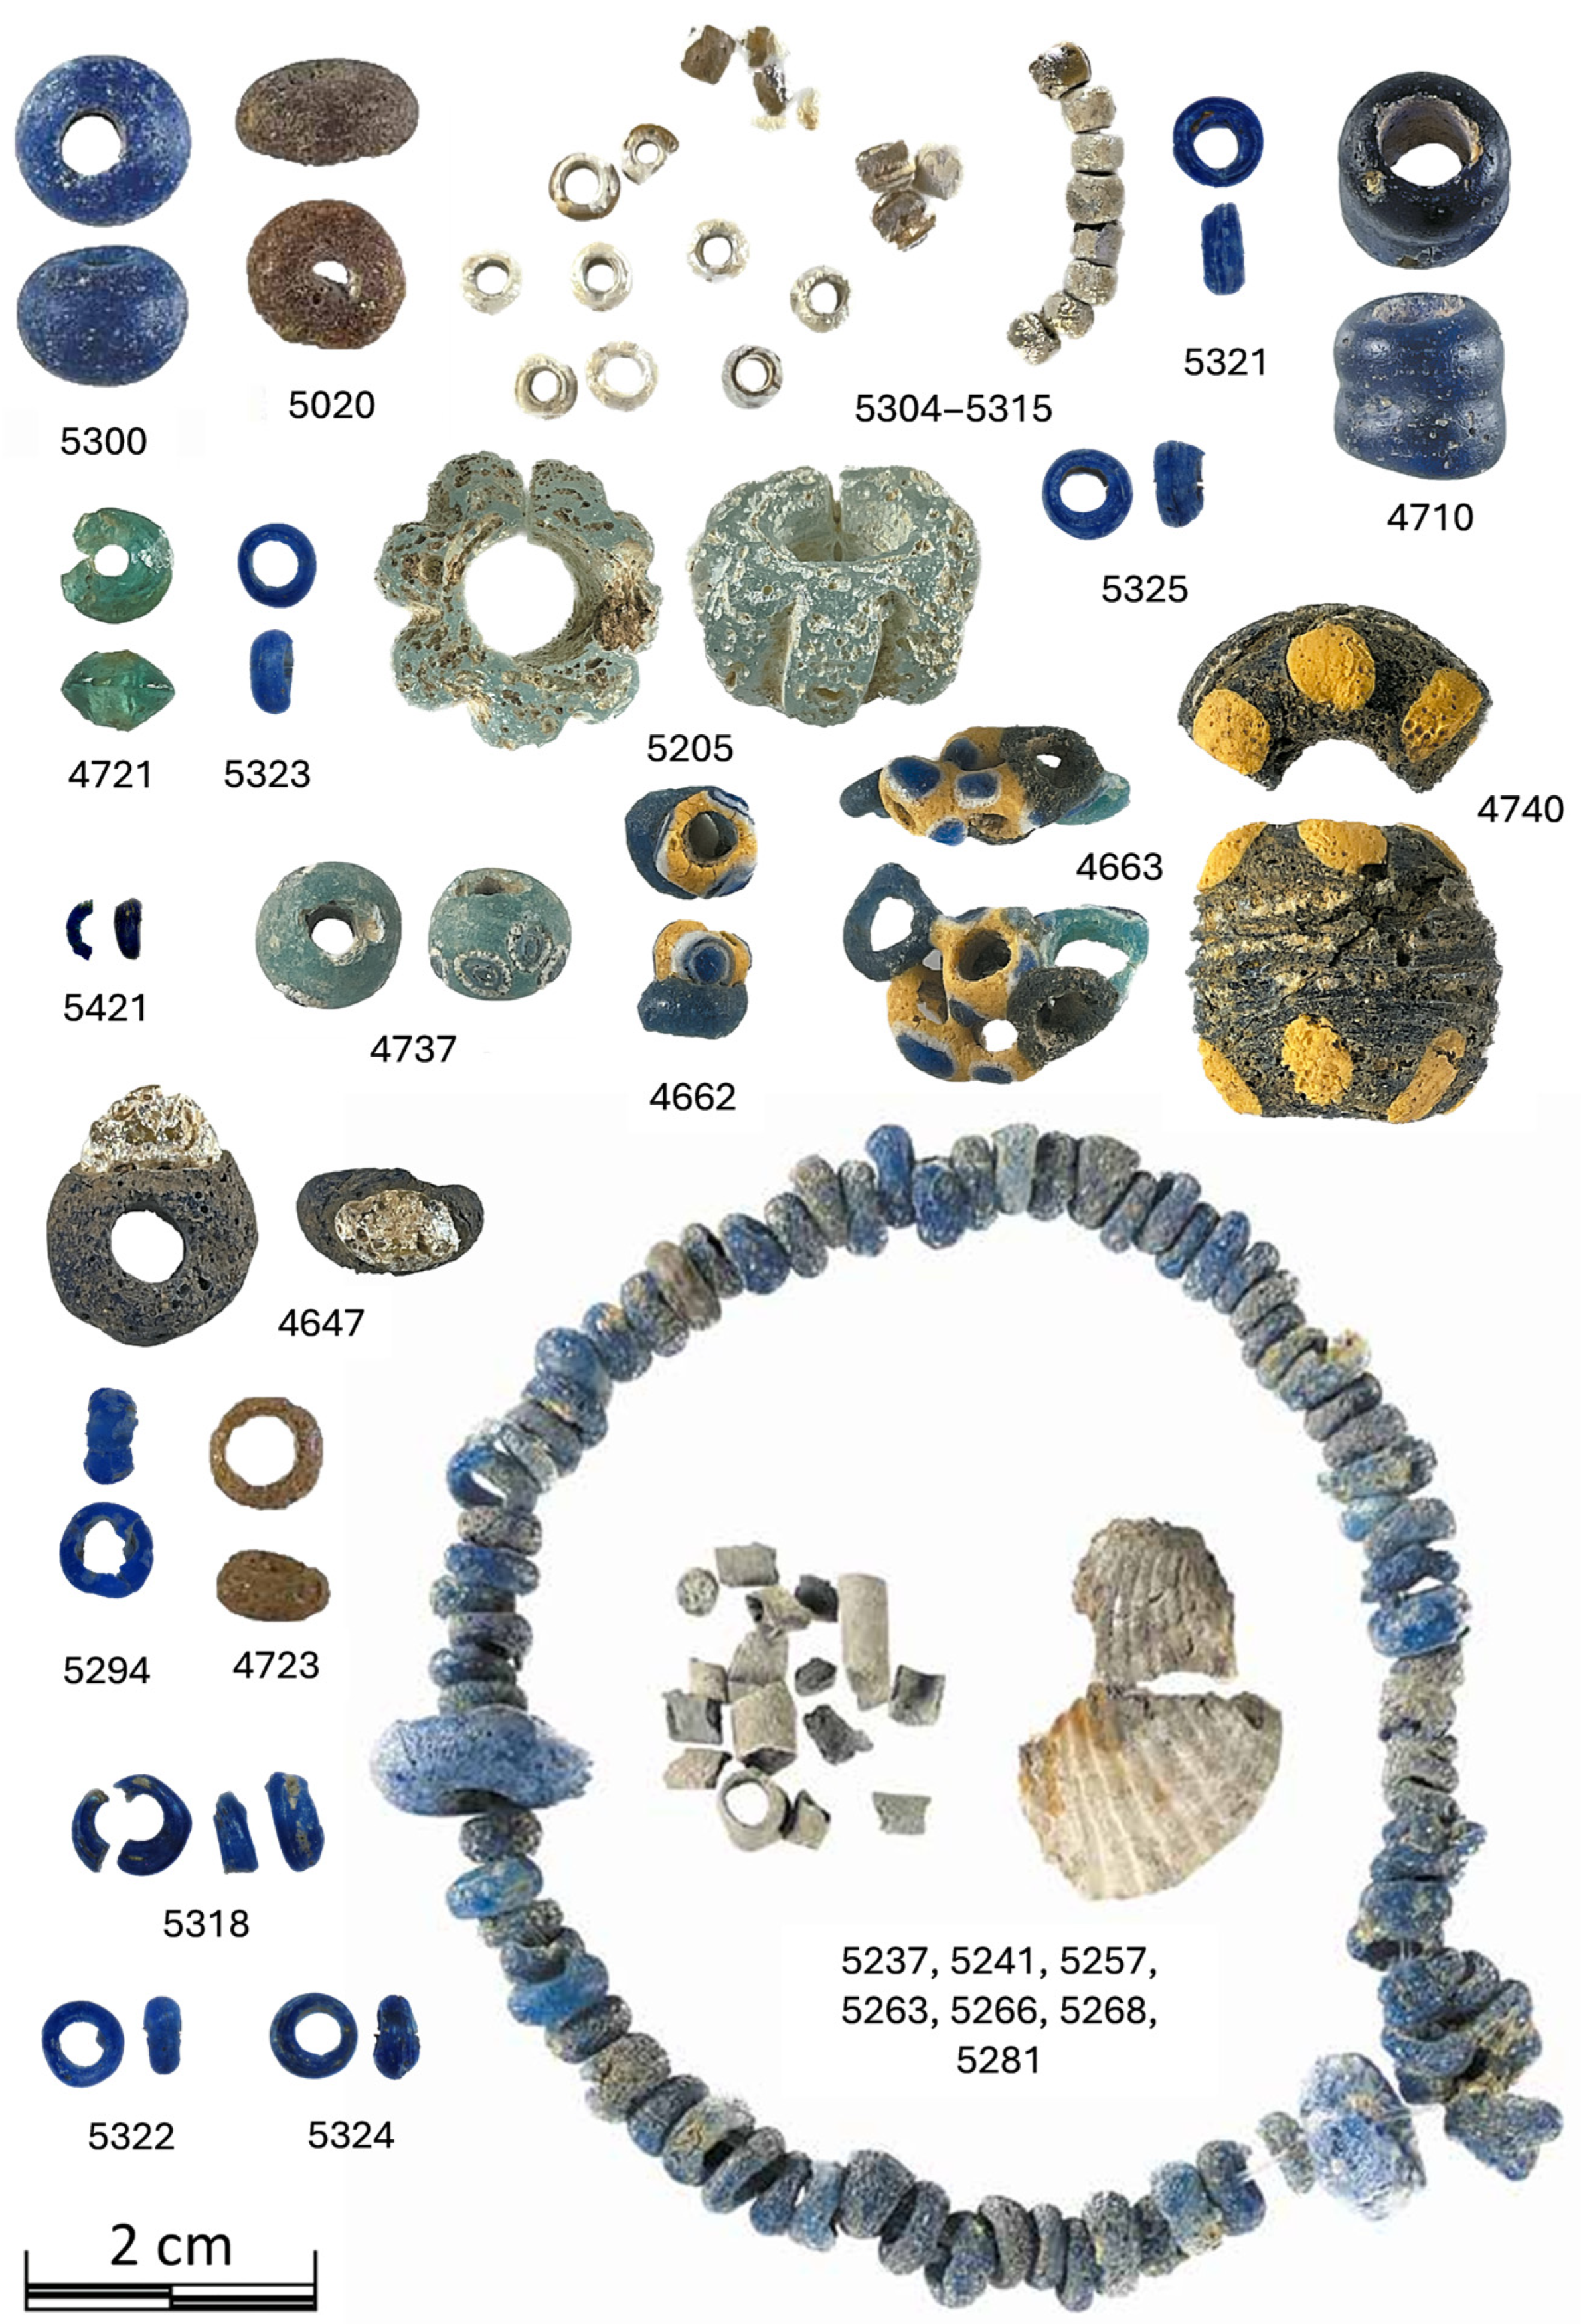
Sixty-four glass pieces, comprising mainly glass beads and two glass chips, were selected for this study (Table 1 and Figure 1). All these archeological pieces were recovered from the archeological site of Pintia (Padilla de Duero, Valladolid, Spain), inhabited by the Vaccaei and dating to the fourth to first centuries BC [27,28,29]. Most of the pieces were found at the necropolis of “Las Ruedas”, including pieces recovered in a closed context (e.g., tombs), as well as in a secondary position (indicated as “sec. pos.” in Table 1). In contrast, a few pieces were recovered from the city of “Las Quintanas”. The selection of studied pieces was intended to encompass a diverse range of preservation states and to be representative of the colors and shapes found in the ancient glass recovered from Pintia. Accordingly, blue hues and toroidal shapes are predominant, but other complex shapes and colors are included in this selection (Table 1 and Figure 1). The surfaces of these samples exhibit diverse degrees of preservation, ranging from smooth, well-preserved surfaces to pitted or even iridescent surfaces (Figure S1, see Supplementary Materials). As precious archeological remains, these samples cannot be subjected to any physical or chemical treatment, nor to any damage during their study, regardless of the difficulties encountered in their analysis.
Table 1.
Context and description of the studied glass beads found in the necropolis of “Las Ruedas” or the city of “Las Quintanas” of the archeological site of Pintia (Padilla de Duero, Valladolid, Spain). Typological classification is based on the work of Sanz-Minguez et al. [11].
Figure 1.
Photographs of some representative glass beads included in this study (identified by its inventory number). The necklace was found in Tomb 247a and comprised not only glass beads (including the beads indicated and included in this study) but also other materials [9,10].
2.2. Infrared Spectroscopy Analysis
FTIR spectroscopy was performed on these samples using a Thermo Scientific Nicolet iN10 infrared microscope (Thermofisher, Waltham, MA, USA), located at the IRIS infrared beamline of BESSY II (Helmholtz-Zentrum Berlin für Materialien und Energie research center in Berlin, Germany). All measurements were performed in the mid-IR spectral range (4000–650 cm−1) using a nitrogen-cooled MCT detector (Thermofisher, Waltham, MA, USA), while the spectral resolution was set to 2 cm−1. Spectra were acquired by averaging 256–512-sample and background (i.e., air) scans, which were adjusted for each sample to improve the quality of the obtained spectra. Background scans for reflectance measurements were obtained employing a gold substrate, and the microscope was purged with dry air to minimize the atmospheric contribution. To ensure representativeness, we introduce some changes. Our aim is to mean that in monochrome pieces, were studied at least three different points, and that for polychrome pieces we studied three points for each color. Also, in all cases, two spectra were recorded by each studied point.
FTIR-ATR measurements were performed on the fragmented sample 5421 using a slide-on MicroTip Ge ATR crystal (Thermofisher, Waltham, MA, USA) (27° opening angle and 4 µm spatial resolution). In particular, a hyperspectral map could be obtained from this sample (covering an area of 800 × 2400 µm with 200 µm steps). The employed infrared microscope includes a built-in pressure-monitoring sensor, enabling the application of the minimum pressure required to obtain spectra without damaging the samples. Nevertheless, further ATR measurements on intact pieces were not made due to the potential risks of damaging the samples.
Then, FTIR reflectance measurements (20 µm spatial resolution) were performed on the entire set of samples, yielding 582 spectra from 291 analyzed points across the 64 selected samples. Spectra treatment and analysis were performed using F. Menges’ “Spectragryph—optical spectroscopy software”, Version 1.2.17d, 2023 (http://www.effemm2.de/spectragryph/, accessed on 20 December 2025) and Quasar 1.9.2 [30,31]. In particular, Quasar was employed to perform unsupervised analysis (e.g., Principal Component Analysis (PCA), Louvain Clustering, k-Means) to identify clusters of similar spectra. A summary of the peak assignments related to spectrum interpretation can be found in Table S1 (see Supplementary Materials).
3. Results and Discussion
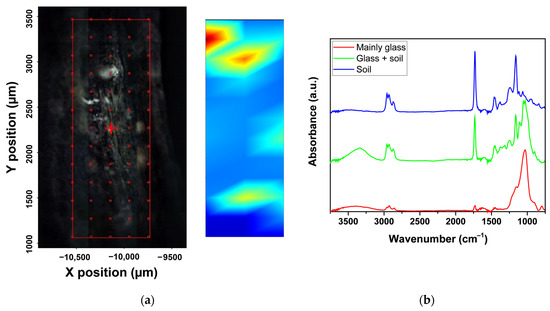
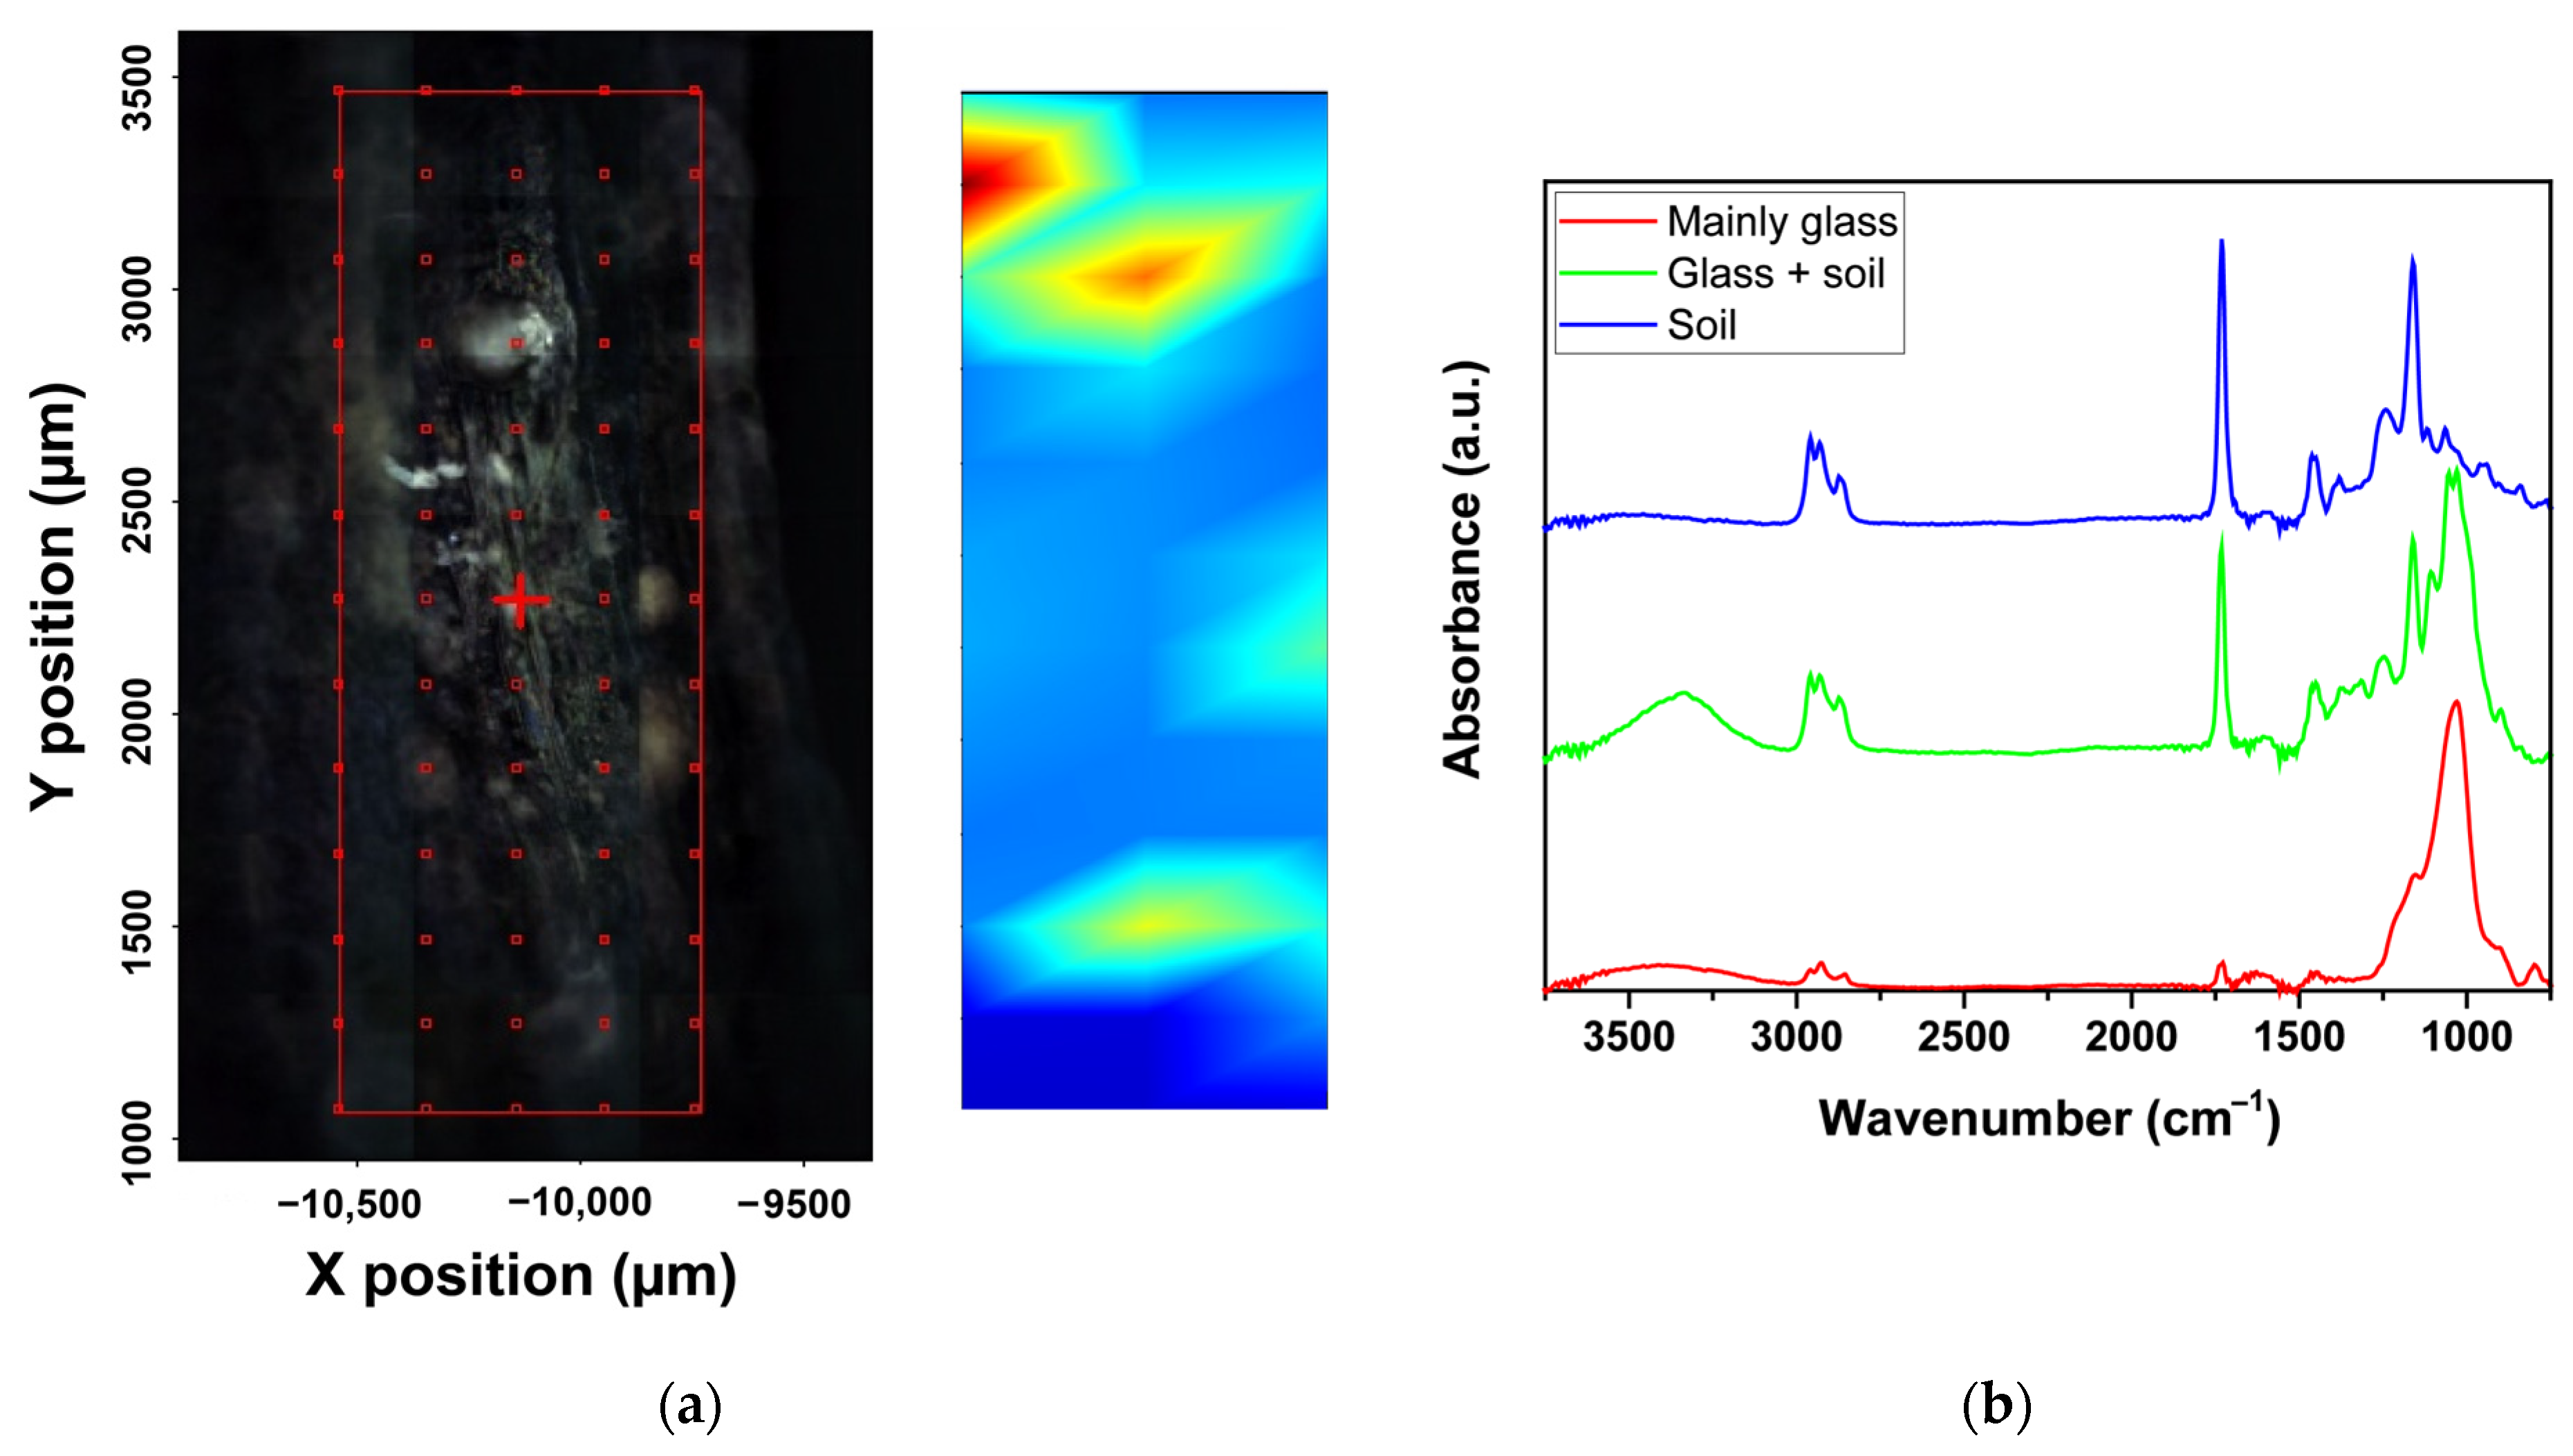
Fragmented sample 5421 (Figure 1 and Table 1), corresponding to a common blue annular toroidal glass bead recovered in a closed context from tomb 144, was selected to be studied by FTIR-ATR. The surface of this sample shows some pitting, with the pits showing a different color (brownish instead of blue) due to glass alteration or the presence of dirt (Figure S1a, see Supplementary Materials). A 5- × 13-point FTIR-ATR map was constructed on the surface of the sample with steps of 200 µm (Figure 2a). The obtained spectra can be classified into three main groups (Figure 2). Only a small area covered by the hyperspectral map shows a glass signal (represented by red areas in the 2D map in Figure 2a, with a corresponding spectrum shown in red in Figure 2b). The rest of the map reveals a well-defined complex spectrum (blue areas in Figure 2). The representative spectrum taken from a spot from the blue areas (in blue in Figure 2b) is characterized by a main sharp peak at 1730 cm−1, corresponding to the stretching vibrations of C=O bonds. Also, it presents another intense sharp peak at 1160 cm−1 and a less intense peak at 1060 cm−1, related, respectively, to the stretching vibrations of C-O-C and C-O in polysaccharides. Moreover, bands at 2960, 2930, 2870, and 2860 cm−1 are related to the stretching vibrations of CH2 and CH3 groups, while bands at 1460 and 1450 cm−1 are usually associated with aliphatic CH2 and CH3 deformations [32,33,34,35]. Accordingly, these spectra can be related to the organic matter that may be present in soil and adhere to the glass surface.
Figure 2.
A micrograph of the surface of sample 5421 and a hyperspectral map indicating the prevalence of the glass signal (red) or soil remains (blue) according to the obtained FTIR-ATR spectra (a). The hyperspectral map is produced by integrating the area under the C=O bonds’ stretching vibration absorption band (i.e., red represents low absorption intensity and blue high absorption intensity within that spectral region). Representative FTIR-ATR spectra from the red, green, and blue regions of the hyperspectral map (b).
The spectrum taken from one of the few red spots in the hyperspectral map (Figure 2a) shows a nearly clean glass spectrum (represented in red in Figure 2b). In particular, the main signal of the spectrum corresponds to the broad band associated with the stretching vibrations (from about 900 to 1250 cm−1) of Si-O-Si units [18,22]. Also, the presence of hydroxyl bonds in the range of 3000–3800 cm−1 is detected, which could be related to glass degradation (i.e., formation of -Si-OH) [23] or to the residual presence of dirt, indicated by the low-intensity peaks around 2900, 1730, and 1160 cm−1.
Finally, transition regions between these two main signals clearly present a mixed signal combining both glass and organic matter/soil spectra (in green in Figure 2). These first results provide some perspective on what could be expected to be found in the study of this glass bead collection: signals from glass with diverse levels of preservation, as well as from alterations covering the glass surface.
However, the use of a completely non-invasive approach for the extensive study of the collection, e.g., FTIR spectroscopy in reflectance mode, introduces an additional complexity to this work. In general, reflectance FTIR spectroscopy setups are designed primarily to collect specular or diffuse reflectance. This study employs an optical geometry that operates with an angle of incidence and emergence of almost 0°; thus, it is designed to collect specular reflections. Specular reflectance is governed by Fresnel’s equation and, therefore, depends only on the material parameters, namely the refractive index and the absorption index (n and k, respectively). Depending on n and k, compounds under study provide rather complex and strongly distorted spectra with derivative bands for weaker absorption sites and may show the Reststrahlen effect. The latter will lead to inverted bands [25,26,36]. Moreover, on samples with potentially layered and/or rough surfaces, such as these glass beads, diffuse reflection will also be collected. The combination of both effects is the primary source of spectral distortion [26,37]. Accordingly, interpreting FTIR reflectance spectroscopy on heterogeneous rough/multilayer samples poses several challenges, sometimes requiring identification of compounds based on distortions (e.g., inverted bands) rather than the absorption bands conventionally identified by absorption/transmission FTIR spectroscopy [26].
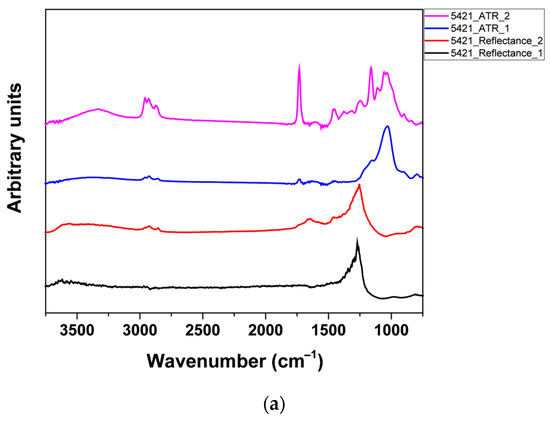
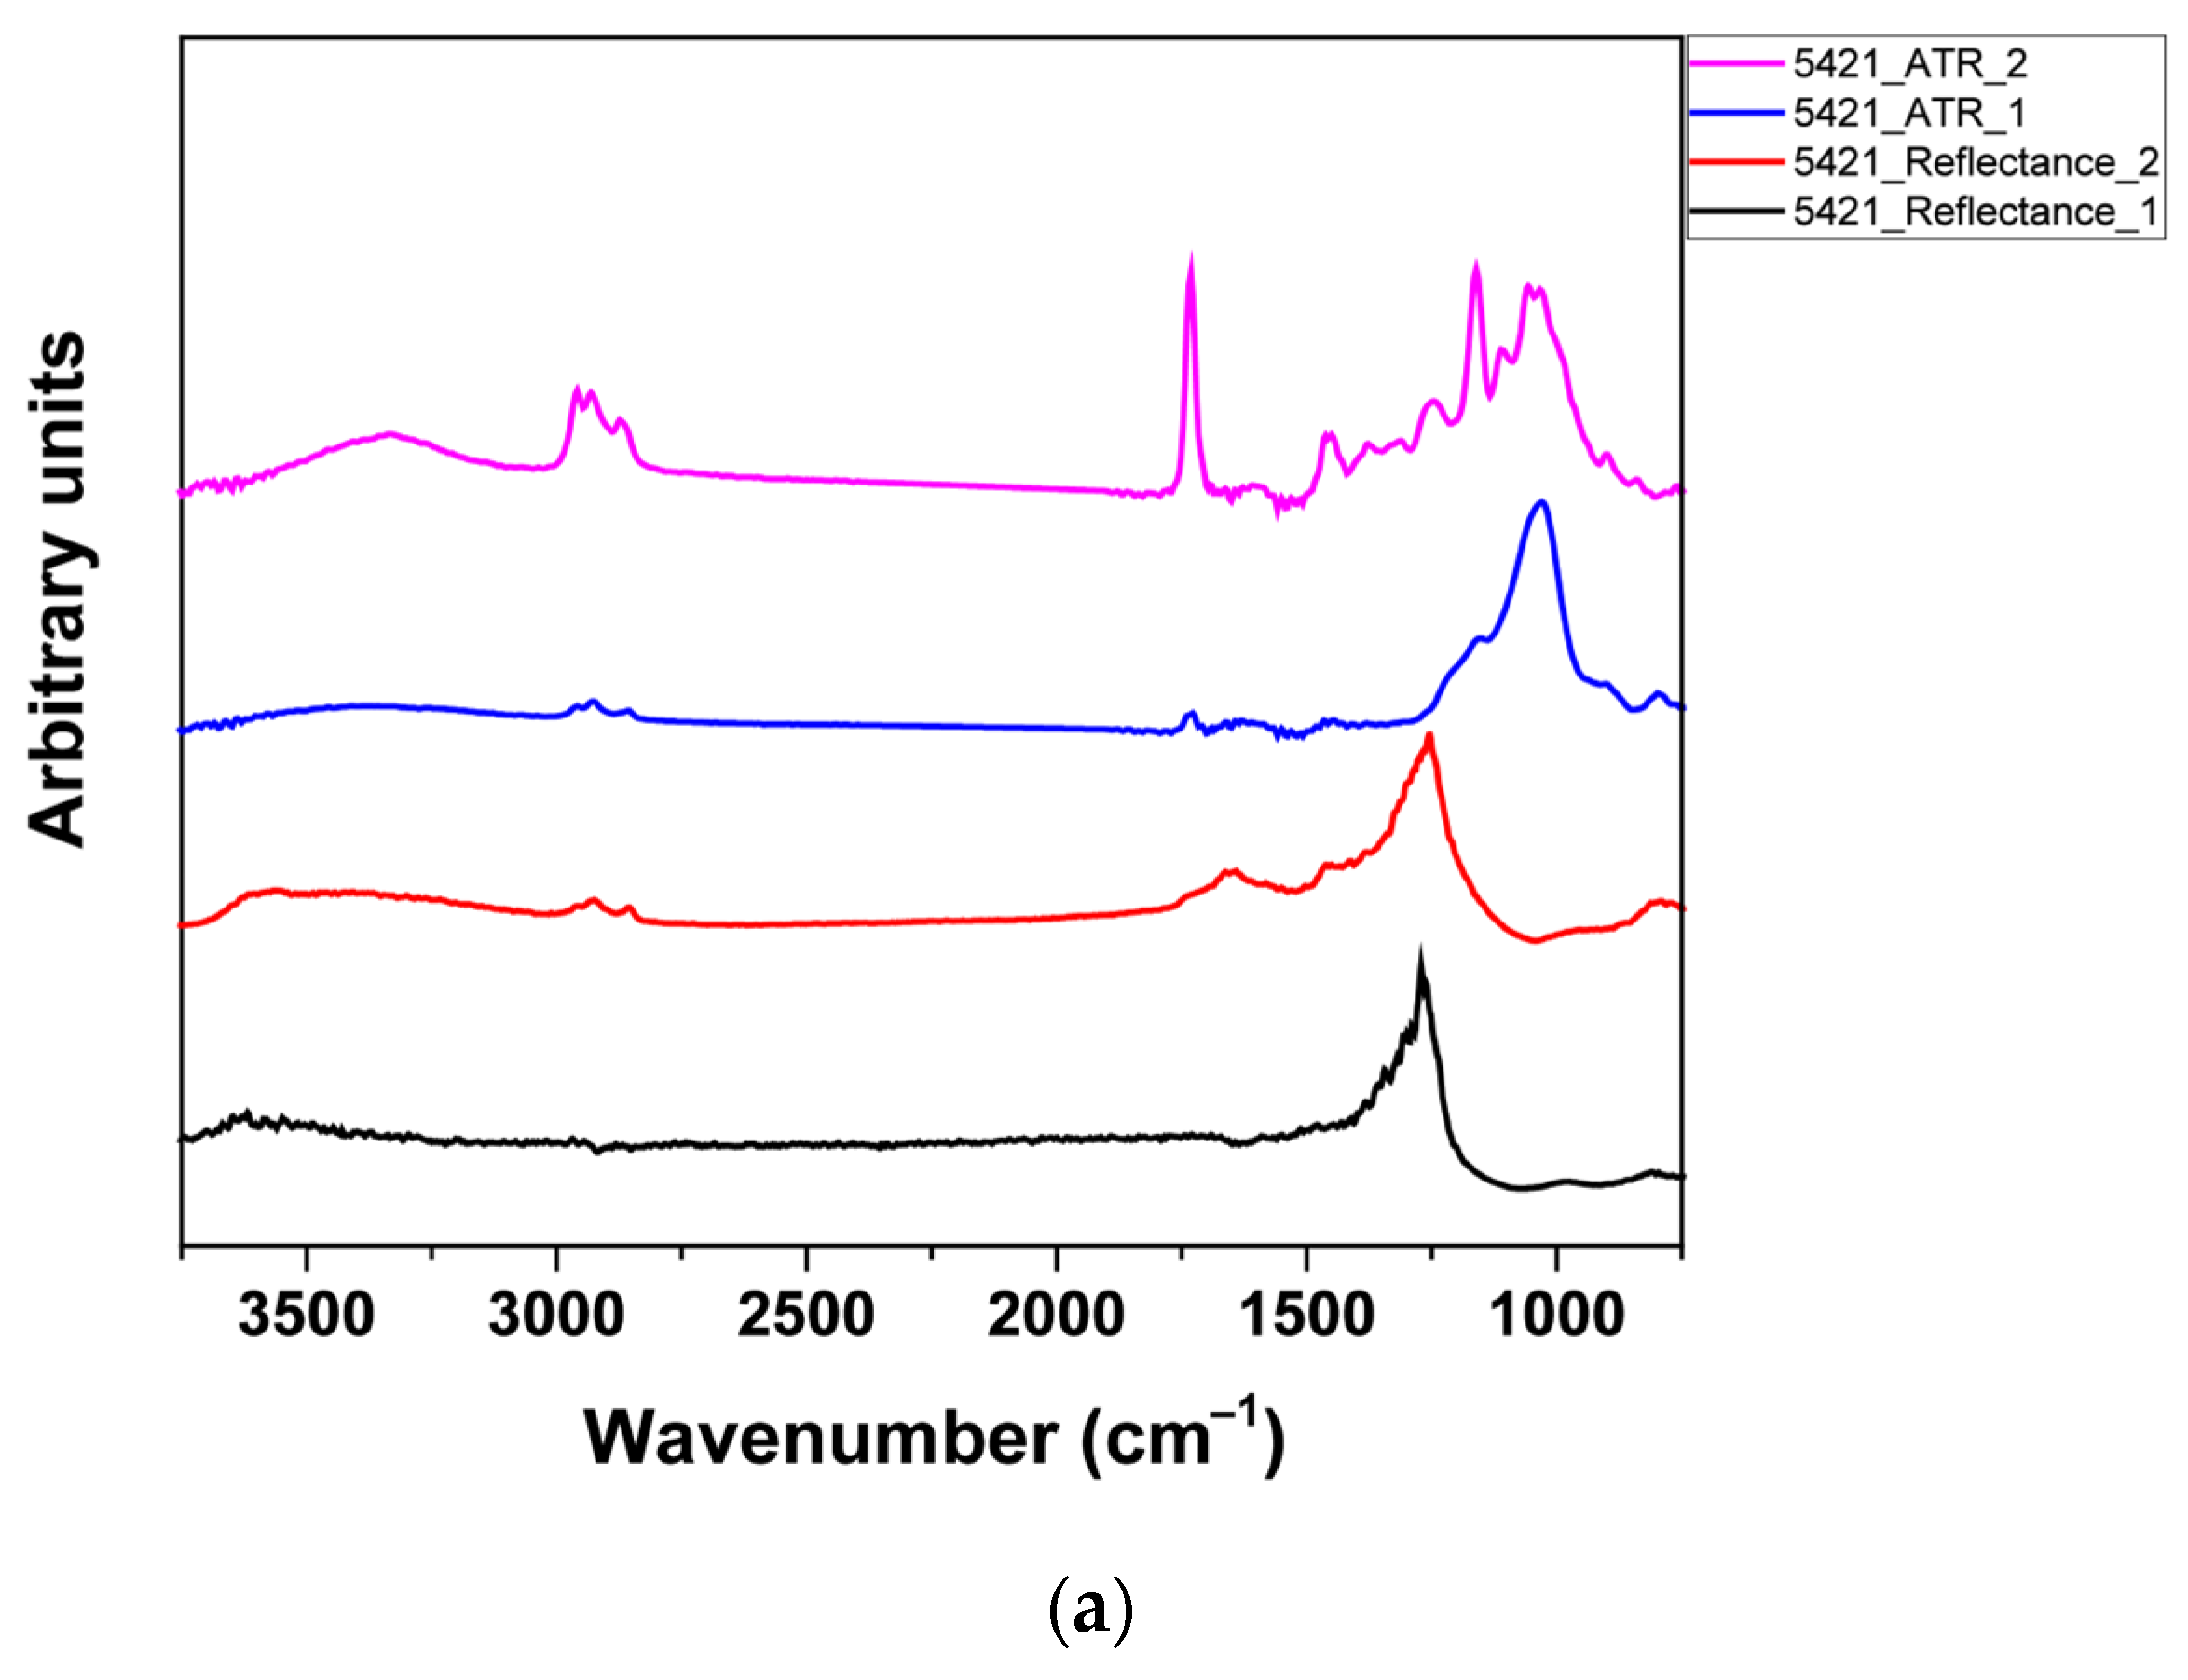
Therefore, taking advantage of the FTIR-ATR results from sample 5421, a comparison between ATR and reflectance FTIR spectra was carried out to facilitate the interpretation of the reflectance spectra (Figure 3a). Reflectance spectra of this glass bead show almost undistorted absorption features at higher wavenumbers, indicating the presence of hydroxyl bonds (3000–3800 cm−1) and the stretching vibrations of CH2 and CH3 (2960, 2930, 2870, 2860 cm−1). Also, a sharp absorption peak at 1730 cm−1 is observed in some reflectance spectra, indicative of C=O bonds. At lower wavenumbers, where contributions from diverse compounds overlap, reflectance spectra show clear signs of distortion. Although in particular cases the aliphatic CH2 and CH3 deformations can be identified (1460 and 1450 cm−1, see Figure 3a), in general, the distortions and Reststrahlen effect in that range will hinder further identification. Therefore, the identification of organic matter in reflectance spectra would generally be limited to high wavenumbers. Regarding the presence of glass, the studied areas entirely covered by soil remains show no clear signal corresponding to Si-O-Si units (1250–900 cm−1) (Figure 3a). However, other spots evidence a strong Reststrahlen effect in that range, whose presence in these spectra could be related to the signal from glass (Figure 3a).
Figure 3.
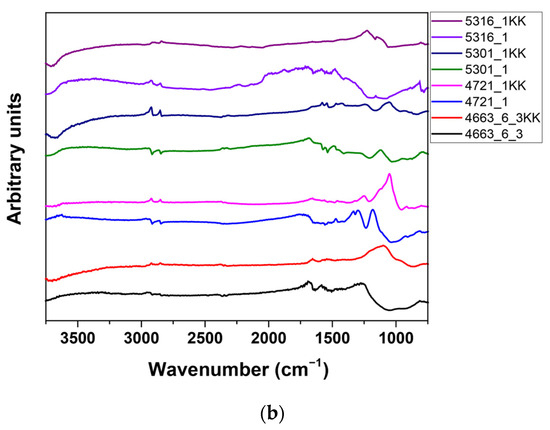
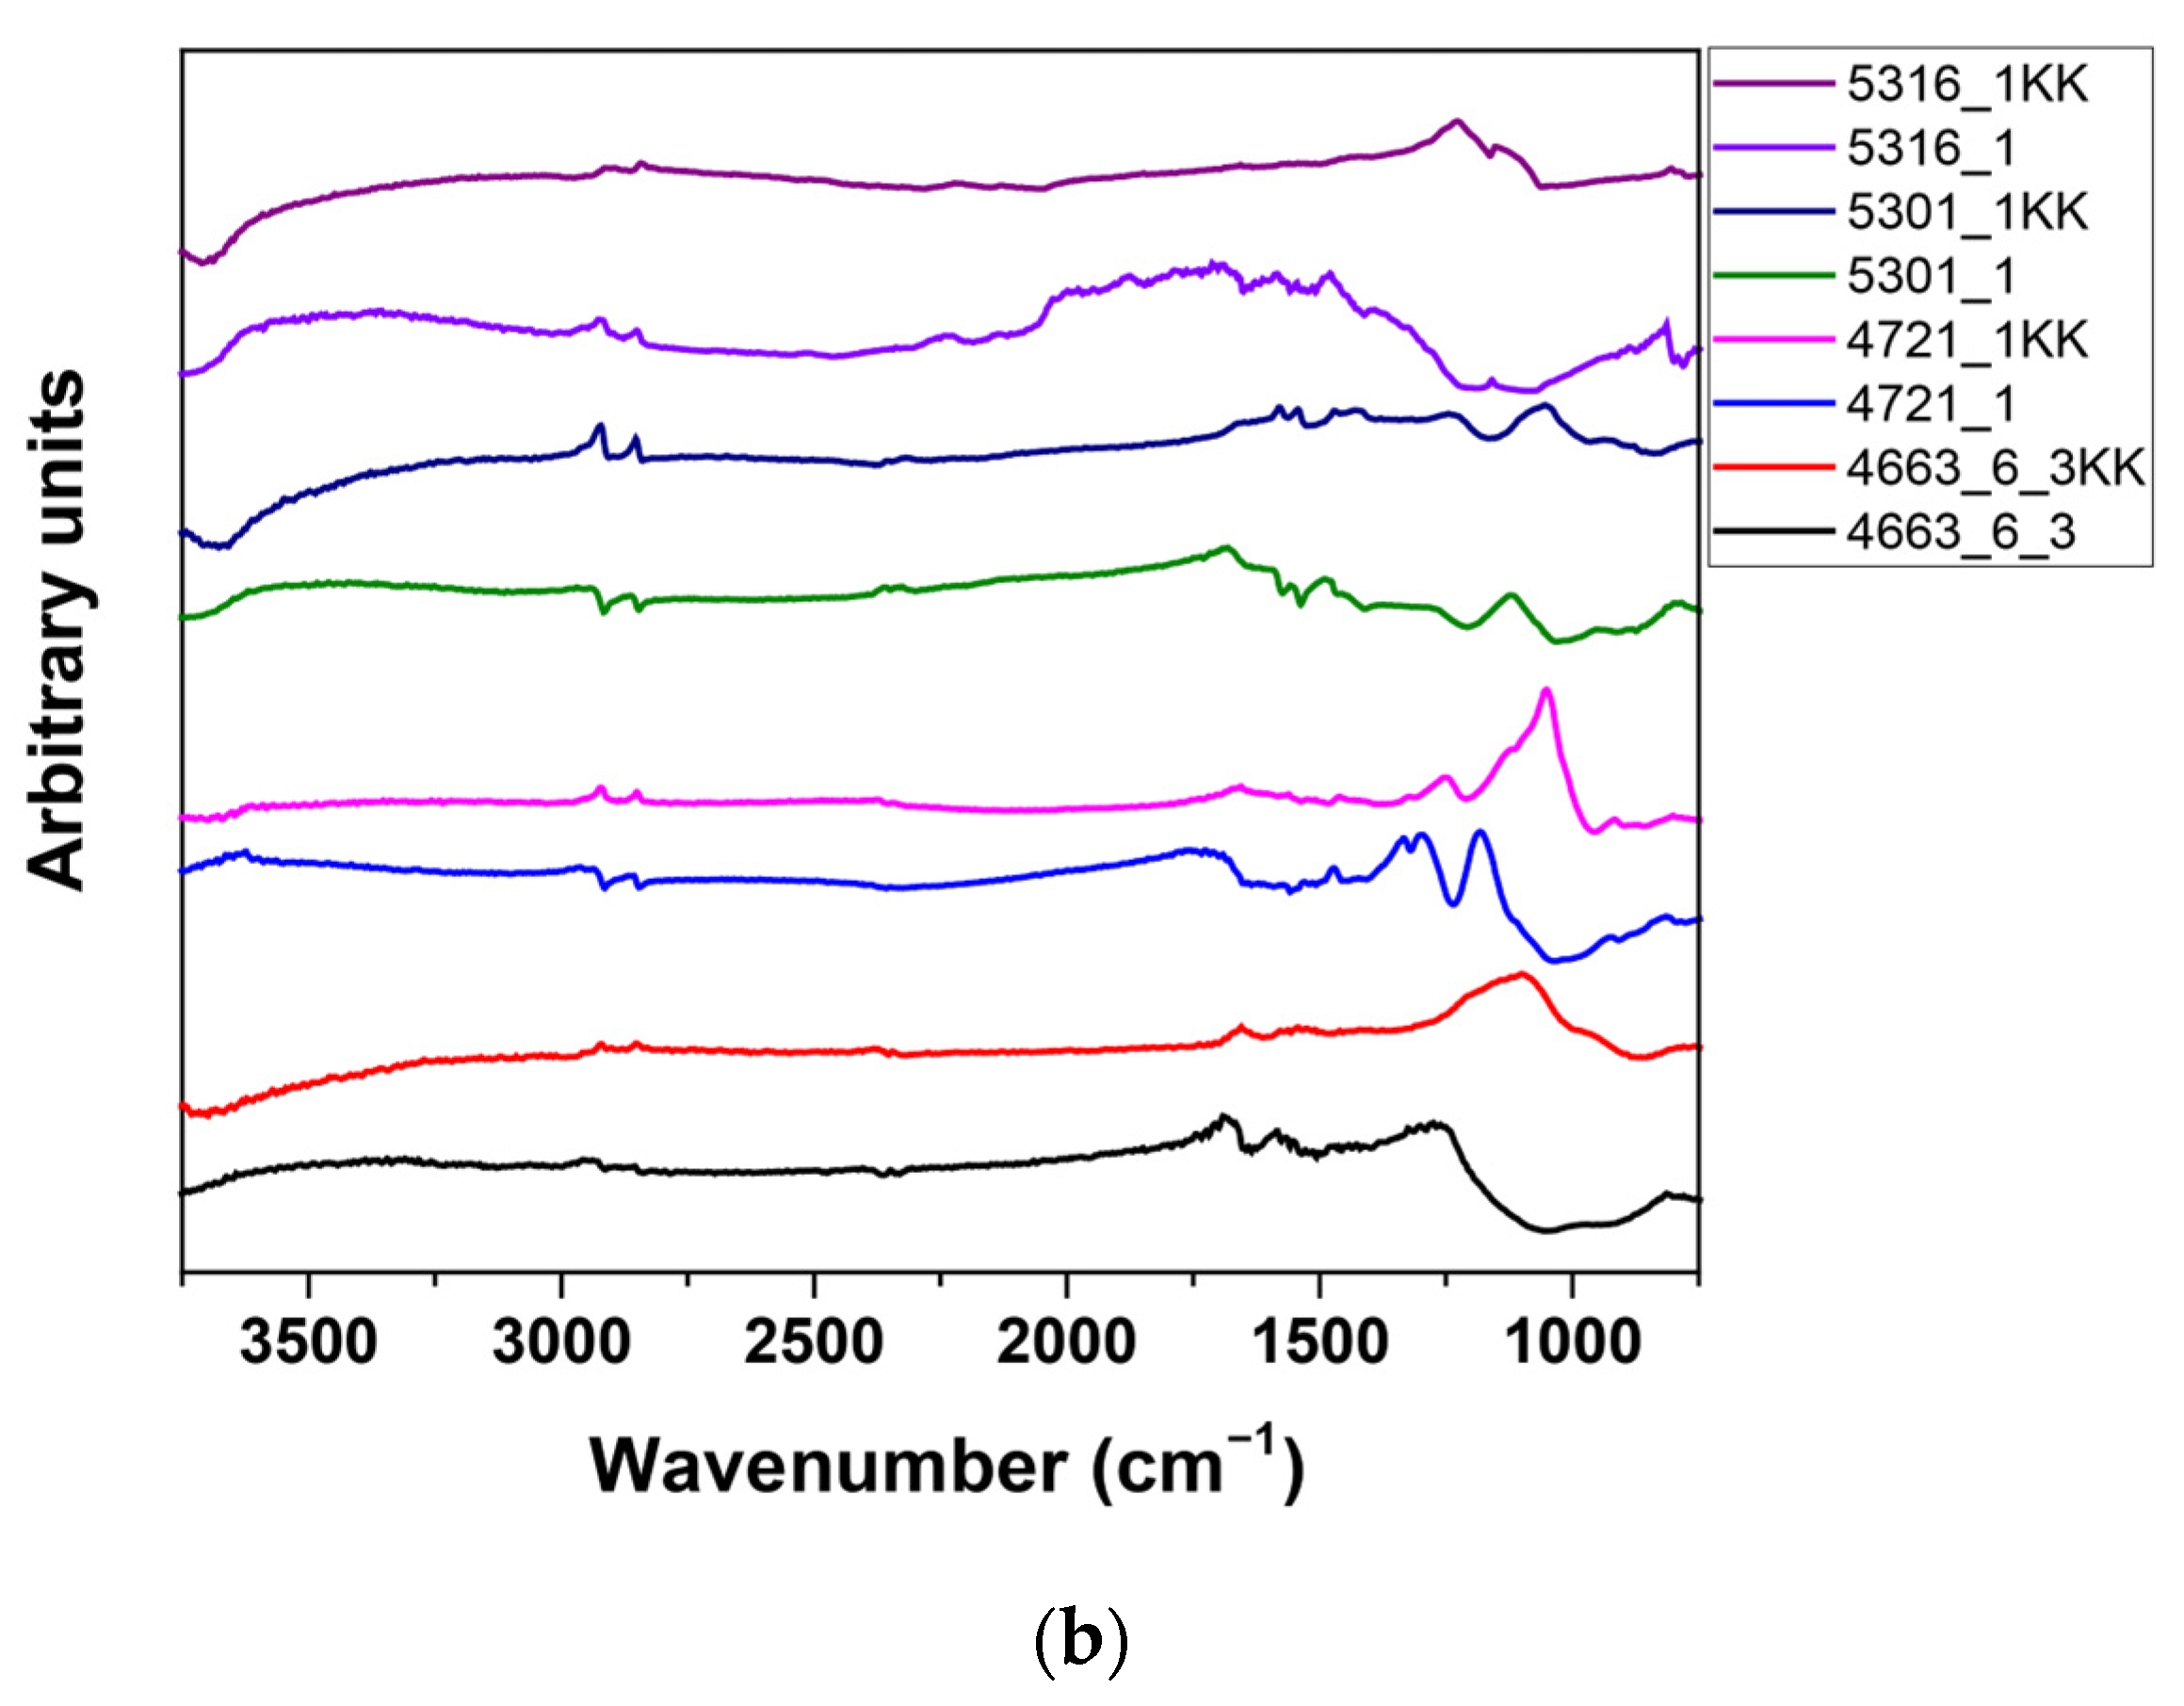
Representative FTIR ATR and reflectance spectra obtained from sample 5421 (a). Examples of reflectance spectra as obtained and transformed with the Kramers–Kronig (KK) transformation (b).
If this assessment of the potential distortions and challenges of the interpretation of the obtained reflectance spectra is extended to other glass beads, it is possible to realize that these main features will be generally found (Figure 3b). On the one hand, the presence of glass would be related to the Reststrahlen effect in the range of 1250–900 cm−1. In contrast, the presence of organic matter and hydroxyl bonds would be easily identified at higher wavenumbers, non-affected by this strong Reststrahlen effect (Figure 3b). In addition, derivative or inverse bands are obtained even for the higher wavenumbers in some spectra (Figure 3b). In summary, as expected, the obtained reflectance spectra from the glass beads are strongly affected by the aforementioned distortions.
The challenges in identifying compounds arising from reflectance spectral distortion can sometimes be eased by applying mathematical transformations provided by the spectrometer software to the obtained spectra. Specifically, the Kramers–Kronig (KK) and Kubelka–Munk (KM) transformations are employed to correct distortions induced by specular and diffuse reflectance, respectively [38,39]. However, no transformation has been developed to address both effects simultaneously, which are often combined in cultural heritage objects such as these glass beads [38]. Moreover, the results from the KK transformation can vary depending on the software used to calculate it and are not recommended for heterogeneous samples [40,41]. Nevertheless, the KK transformation was tentatively applied to a selection of reflectance spectra (Figure 3b). It was found that the KK transformation was able to correct the derivative or inverted bands at high wavenumbers, and even in some cases retrieve features related to Si-O-Si units (1250–900 cm−1) (Figure 3b). However, in general, the KK transformation failed to correct the substantial and diverse distortions found on the obtained spectra. Therefore, there is no other option but to work directly with the obtained FTIR reflectance spectra.
The first variable within this glass bead collection that can be addressed is their polychromy. Ancient glass’s composition is known to be a key factor in its stability [16,17,23], whereas the composition of glasses with different colors can be expected to differ. For instance, the composition of the glasses in sample 4662 (Figure 1) was studied by SEM-EDS in a previous work [13], which revealed clear differences. The glasses of the polychrome bead from sample 4662 show SiO2 contents ranging from about 71.5% (blue) to 58.3% (yellow), K2O contents from 1.9% (white) to 3.7% (yellow), Sb2O3 from 0.0% (blue) to 5.6% (white), and the presence of 14.6% of PbO, only on the yellow glass [13].
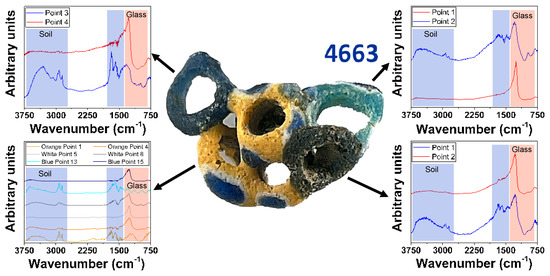
However, the study of this glass bead collection suggested no significant differences with respect to the color of the glass. The study of sample 4663, presenting the highest color variability of this collection (Figure 4), evidenced that it is possible to find areas where the glass signal (i.e., Reststrahlen band 1250–900 cm−1) dominates the spectra, whereas other areas present strong signals from hydroxyl bonds and organic matter (Figure 4). Accordingly, it seems that the exact composition of these glasses has not been a key factor in the weathering processes identified by this technique. Further consideration of the potential color influence on the weathered glass spectra was attempted by means of PCA (Figure S2, see Supplementary Materials). Five principal components, accounting for 84% of the variability in the obtained results, were considered. Biplots considering each possible pair of principal components confirm that glass color does not relate to the obtained spectra from these glass beads (Figure S2, see Supplementary Materials). However, the scarce number of results corresponding to colors other than blue should be noted (i.e., only yellow could present some significance). Therefore, due caution should be considered regarding this result, as it may reflect only the prevalence of glass surface alterations rather than the potential influence of the chromophores, requiring further work to fully address this hypothesis.
Figure 4.
FTIR reflectance spectra obtained from sample 4663 (IV BC), composed of 7 merged glass beads. Reflectance spectra showed the presence of well-preserved glass areas and soil remains, but not of crystalline weathering products (e.g., sulphates or carbonates).
As color does not appear to affect the results, further spectral clustering and analysis can be performed on the data regardless of glass color.
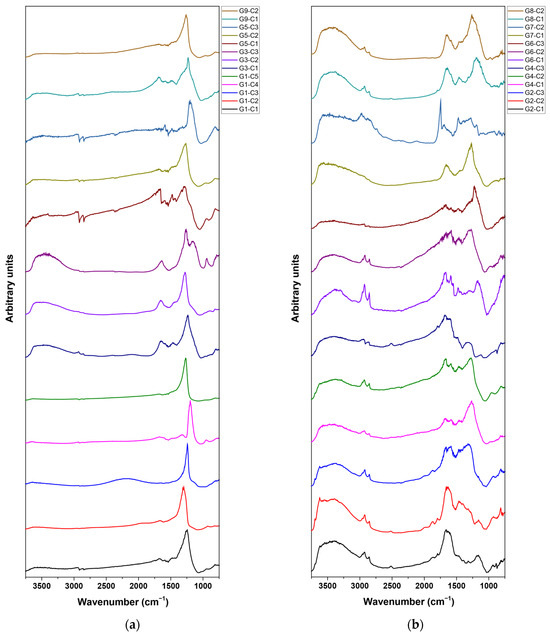
Given the large volume of data, nearly 600 spectra, unsupervised learning algorithms were employed to group the spectra into clusters with equivalent features. First, a Louvain Clustering algorithm implemented in the Quasar software 1.9.2 [30,31] was performed. This algorithm automatically determines the optimal number of clusters to segment the data, thereby avoiding researcher bias in this step. The algorithm identified nine main clusters (Figure 5). Although the spectra within each cluster shared some main features, the resulting clusters remained too diverse to identify common features (Figure S3, see Supplementary Materials). Therefore, each cluster was processed using the k-Means clustering algorithm, implemented in Quasar [30,31]. In this case, the number of clusters was selected to achieve sub-clusters that share all the main features and exhibit narrow dispersion. This objective was achieved by identifying five sub-clusters for cluster 1 (G1); four for cluster 3 (G3); three for clusters 2, 3, 5, and 6 (G2, G3, G5, and G6, respectively); and two for clusters 7, 8, and 9 (G7, G8, and G9, respectively) (Figure 5 and Figure S3, see Supplementary Materials).
Figure 5.
Average FTIR reflectance spectra corresponding to each sub-cluster from clusters G1, G3, G5, and G9 (a), and G2, G4, G6, G7, and G8 (b).
Accordingly, 26 representative sub-clusters were identified (Figure 5 and Table 2). The relative relevance of each cluster ranges from 7.6% (G9) to 15.5% (G1) (Table 2). Moreover, a visual inspection of the sub-clusters’ average spectra evidences that the obtained data range approximately from spectra such as those of sub-cluster G1-C5 to those of sub-cluster G7-C2 (which correspond to clean, relatively well-preserved glass (G1-C5) and soil remains (G7-C2), as explained later). Therefore, each cluster and sub-cluster would probably correspond to different step of weathering or degree of presence of soil remains instead of the presence of quite different compounds. This interpretation agrees with the PCA, where no apparent clustering but a rather progressive evolution was evidenced (Figure S2, see Supplementary Materials).
Table 2.
Spectral cluster and sub-cluster distribution.
Because the spectra of each sub-cluster shared their main features, it was possible to analyze each sub-cluster by studying its average spectrum (i.e., nearly 600 spectra were reduced to 26 representative average spectra). The Reststrahlen band previously associated with the glass signal (i.e., Reststrahlen band at about 1250–900 cm−1) appears on almost all the sub-clusters, except for sub-clusters G2-C1, G2-C2, G4-C3, and G7-C2 (Figure 5). Therefore, glass is identified in 86.6% of the studied points, with only 13.4% showing severe weathering or soil-crust remnants hindering glass detection. Of the studied glass pieces, only one, sample 5425, showed no glass detection at any of the studied points (Table S1, see Supplementary Materials). Accordingly, it was possible to detect the presence of the glass network in the surface of 98.4% of the studied samples, even on samples showing noticeable weathering, such as samples 4723 and 5020 and the pearly beads (e.g., 5304, 5306, 5309, and 5313) (Figure 1 and Figure S1, see Supplementary Materials). Cluster G1 presents spectra with almost only the glass signal, with weak features corresponding to -CH2/-CH3 groups (as derivative or reverse peaks at 2846 and 2914 cm−1) and -OH groups (as a tongue between 3200 and 3750 cm−1) (Figure 5). Sub-cluster G9-C2 also shares these characteristics (Figure 5), accounting for 21.6% of measured points with FTIR reflectance spectra that could be associated with glass showing scarce weathering. No sample presents, in all its studied areas, only spectra corresponding to cluster G1 and sub-cluster G9-C2, but 33 of the studied samples (i.e., 51.6%) contain areas with this good degree of preservation (Table S2, see Supplementary Materials). It can be highlighted that in some of the visually more degraded samples, those showing a brown or pearly aspect (i.e., 4723, 4758, 5020, 5304, 5306, 5309, and 5313), it is possible to find well-preserved glass in some spots (in particular in samples 4723 and 5020).
The rest of the clusters and sub-clusters share a strong distortion of the spectra in the range 1300–1650 cm−1, probably corresponding to the presence of organic matter or a soil remains crust, that hinders any attempt to identify compounds within this wavenumber range. The spectral distortions observed between 1650 and 900 cm−1 pose a challenge for identifying the main bands associated with crystalline weathering products, such as carbonates and sulphates. However, as previous works stated [26], other minor bands and overtones can be used to identify these compounds in similar scenarios. No sign of sulphates was found in this study, but a few samples evidenced the presence of carbonates, weathering products already reported in a remarkable piece of this ancient glass collection [12].
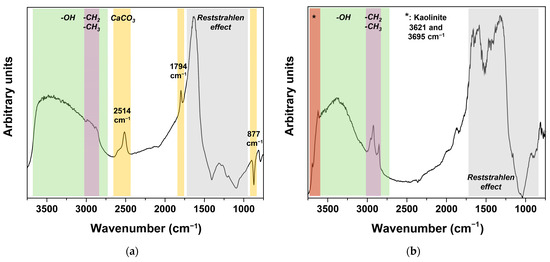
In particular, sub-clusters G2-C1 and G2-C2, as well as a few spectra from G4-C3 (four spectra) and G8-C1 (four spectra), present signs of the presence of calcium carbonate, such as a derivative peak at 877 cm−1, a peak at 1794 cm−1, and a peak at 2514 cm−1 (Figure 5 and Figure 6) [26]. Overall, 12.0% of the studied points showed the presence of calcium carbonate, accounting for 21 samples (32.8% of the analyzed samples), although none of them showed carbonate at all the studied points.
Figure 6.
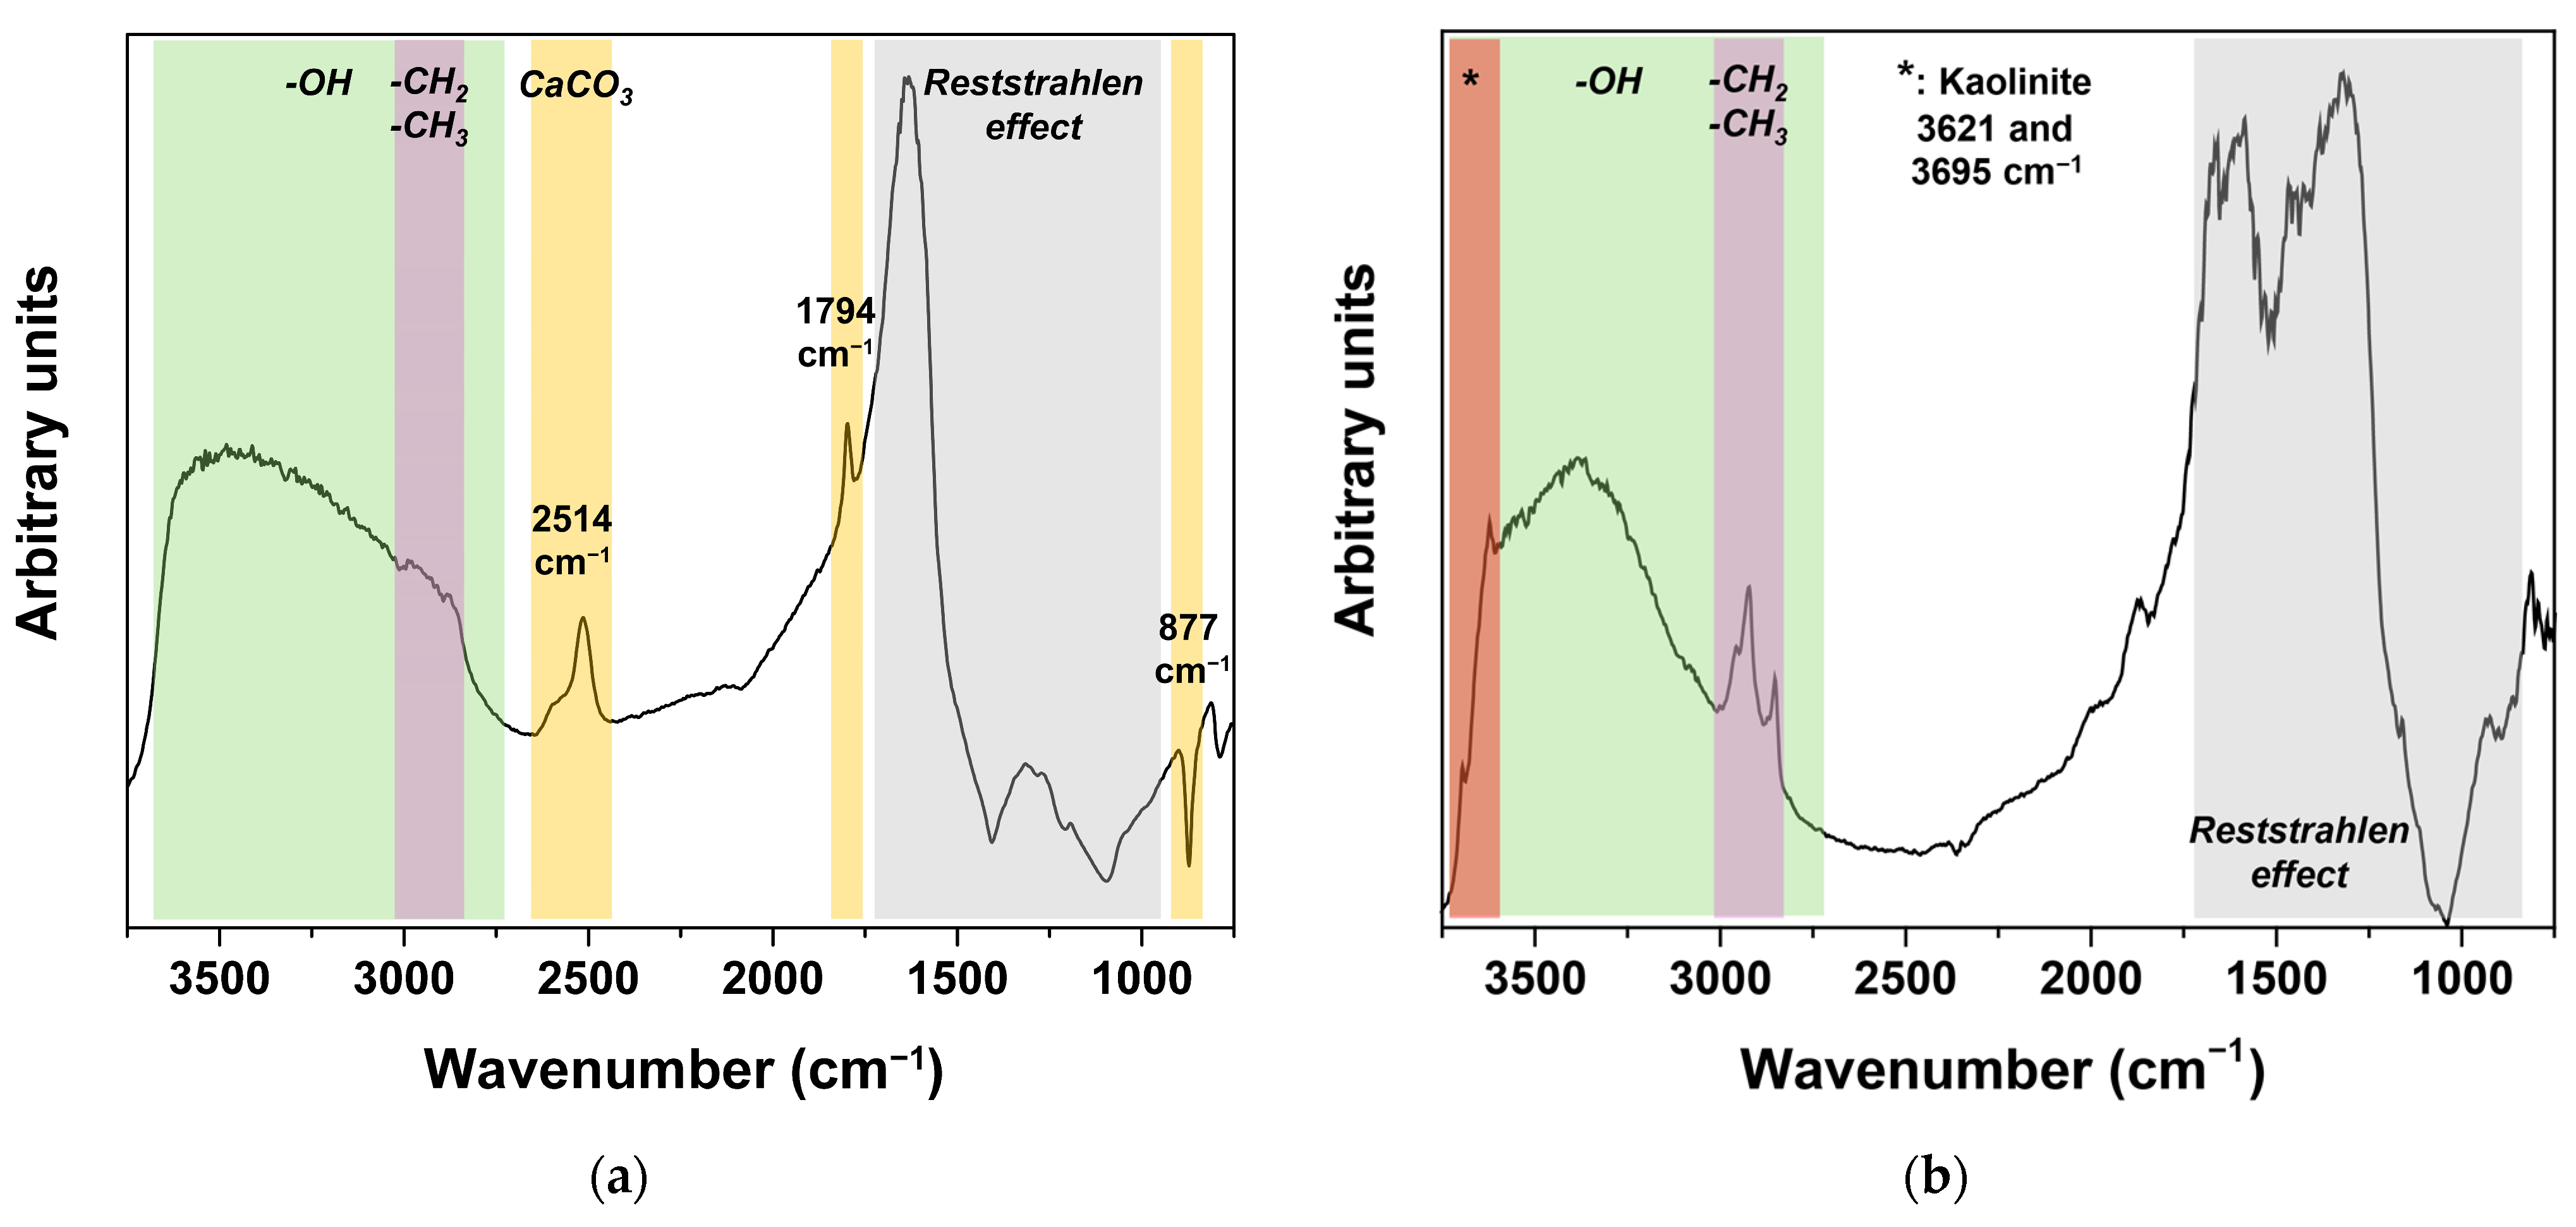
Representative FTIR reflectance spectra of samples containing calcium carbonate as a weathering product (a) and kaolinite (b). Peaks and regions corresponding to calcium carbonate and kaolinite, as well as the Reststrahlen effect and the presence of -CH2/-CH3 and -OH groups, are indicated (see Table S1, Supplementary Materials).
The presence of organic matter, identified from the stretching vibrations of -CH2 and -CH3 (2960, 2930, 2870, 2860 cm−1), is noticeable in most of the sub-clusters. In some cases, these peaks appear distorted as reverse or derivative signals (Figure 5). Strong peaks corresponding to these functional groups are found in sub-clusters G6-C1 (corresponding to 6.5% of the studied points), whereas medium peaks appear in clusters G2, G4, G5, and G8, as well as sub-clusters G6-C2 and G9-C1 (about 48.1% of the studied points). Weak signals appear in sub-clusters G1-C1, G1-C4, G1-C5, G3-C2, G3-C3, G6-C3, and G7-C2 (23.4% of the studied points), being almost negligible on sub-clusters G1-C2, G1-C3, and G9-C2 (10.4% of the studied points). A particular scenario is found in sub-cluster G7-C2, representing only 1.0% of the studied points, which, in addition to a strong signal from CH2 and CH3 groups, seems to present the Reststrahlen effect up to 1800 cm−1, potentially related to a notable presence of soil remains, as suggested in the study of sample 5421 (Figure 3).
Another common feature is the tongue corresponding to -OH groups (Figure 5). A strong signal is found on clusters G2, G3, G4, G7, and G8, as well as on sub-clusters G6-C1 and G6-C2, accounting for 64.3% of the studied points. A medium-intensity signal can be observed in cluster G5 and sub-clusters G6-C3 and G9-C1, corresponding to 14.1% of the studied points. As previously stated, a weak signal from -OH groups corresponds to the relatively well-preserved glass identified in cluster G1 and sub-cluster G9-C2. It can be noticed that the relative intensities corresponding to -CH2/-CH3 and -OH groups are not directly related. In fact, sub-clusters such as G3-C2, G3-C3, and G7-C1 exhibit a strong -OH signal, while a weak -CH2/-CH3 signal is observed (Figure 5). This behavior suggests that the detected -OH signal would be mainly related to glass degradation (i.e., formation of -Si-OH) [23], which will be affecting, to a greater or lesser extent, areas of all the studied samples. The formation of these bonds results from the breakage of Si-O-Si bonds in the presence of high humidity, which can also promote the dealkalinization of the glass surface, another degradation phenomenon previously documented in samples from this collection [13]. It should be noted that the relative intensities at high wavenumbers in the reflectance spectra are typically exaggerated compared to those in the equivalent ATR spectra. (Figure 3). Also, it should be remembered that half of the studied samples also showed relatively well-preserved areas. Moreover, as the primary degradation mechanism identified is the formation of -Si-OH, with a lower incidence of crystalline weathering compounds, their preservation in controlled, low-humidity conditions should prevent further degradation over medium- to long-term time scales.
Finally, spectra corresponding to cluster G2 and sub-cluster G4-C2 evidence the presence of kaolinite by peaks at 3621 and 3695 cm−1 [32,42,43], related to the composition of the soil remains found on the surface of these samples. This feature appears in 18.2% of the studied points, finding kaolinite in 30 samples (46.9% of the analyzed samples). Taking into account that the necropolis is located on a sedimentary plain, the presence of clays in the soil remains is expectable. Moreover, the presence of clays could also contribute to the detected -OH signal, meaning a lower extent of glass degradation, although further work would be necessary to address that possibility.
As a final remark, it can be highlighted that a few of the studied glass beads were previously studied by Raman spectroscopy and SEM-EDS [13]. These techniques only provided visual evidence of the presence of organic matter or -OH groups (i.e., SEM micrographs showed the presence of organic residues and surface cracks [13], which could be related to degradation mechanisms, such as the formation of -Si-OH [7,17]). However, no evidence at all was provided regarding the presence of calcium carbonate, nor of kaolinite, which have been found in samples 5326, 5299, 5301, and 5302 (referred to in our previous work as samples 1, 9, 11, and 12). Thus, micro-FTIR reflectance spectroscopy proved to be more sensitive to the presence of these compounds on the surface of ancient glass. On the contrary, detailed information about inorganic pigments or the glass network, typically provided by the combination of Raman spectroscopy and SEM-EDS or XRF [12,13] was not retrieved by this technique. Accordingly, this work demonstrates the complementary capabilities and suitability of non-invasive micro-FTIR reflectance spectroscopy for the study of ancient glass.
4. Conclusions
A representative selection of sixty-four samples with diverse characteristics (e.g., shape, color, apparent degree of preservation) from the extensive pre-Roman glass bead collection recovered from Pintia (Padilla de Duero, Valladolid, Spain) was successfully studied by micro-FTIR spectroscopy. This work demonstrated that micro-FTIR in reflectance mode, a completely non-invasive technique, can be helpful in assessing the preservation state of ancient glass, evidencing its complementarity with other techniques widely employed in the study of glass (e.g., Raman spectroscopy, SEM-EDS), although some limitations have been identified.
Micro-FTIR ATR measurements performed on a fragmented sample allowed for the identification, by comparison with the reflectance spectra of the sample, of the distortions present on the obtained reflectance spectra as a consequence of the simultaneous detection of specular and diffuse reflectance. Although the experimental setup was designed to operate on specular reflectance, the roughness of the surfaces of the glass beads inevitably introduced a diffuse component. In particular, a strong Reststrahlen effect was generally observed between 1650 and 900 cm−1, sometimes extending to higher wavenumbers. However, by comparison with the ATR spectra, it was possible to relate a Reststrahlen band commonly found between 1250 and 900 cm−1 with the glass signal. Moreover, the presence of organic matter, as evidenced by -CH2, -CH3, and C=O bonds, was associated with soil remains or crusts frequently found on the surface of the glass beads. Also, the presence of -OH groups, related both to the organic matter and to the formation of -Si-OH bonds due to glass degradation under high humidity, was identified in both ATR and reflectance spectra.
As the distortions in the obtained spectra result from the superposition of specular and diffuse reflectance, it was found that spectral treatment procedures such as the Kramers–Kronig transformation do not yield suitable results. Therefore, the reflectance spectra should be analyzed without further processing.
First, the influence of glass color on the micro-FTIR reflectance measurements was discarded by comparing within-polychrome samples and by Principal Component Analysis (PCA) of the almost 600 spectra obtained. However, given the small number of samples with colors other than blue available for this analysis, further work is advisable to confirm this conclusion.
Second, the micro-FTIR reflectance spectra dataset was clustered into nine clusters and 26 sub-clusters to enable identification of common features. The representative spectra from these clusters evidence that results ranging from relatively well-preserved glass to weathered surfaces are obtained, similar to those previously obtained for polychrome sample 4663. In 98.4% of the samples, a glass signal could be identified. Also, in a few cases, spots of relatively well-preserved glass were found even in samples with visual signs of heavy alteration (i.e., pitting and brownish hues). No sample was found to present a rather good level of preservation across all the studied points, but half of the studied samples contained well-preserved areas.
Regarding the weathering evidence, the presence of organic matter (-CH2 and -CH3) is evident on about 90% of the studied points, as well as all the studied samples, but only a 6.5% of the studied points present a strong signal corresponding to those functional groups, and only 1.0% of the studied points show highly distorted spectra (i.e., Reststrahlen up to 1800 cm−1) potentially related to a significant presence of C=O bonds. No sulphates are found in any sample, but calcium carbonate is found punctually in 32.8% of the studied samples. The identification of carbonates was based on secondary peaks and overtones, as previously reported in the literature, since the main peaks were unusable due to spectral distortion. Kaolinite, as part of the soil, remains common in sedimentary plains such as those in which Pintia is located, and is clearly found in almost half of the studied samples. Last but not least, -OH groups are identified in all the studied samples, with only about 10% of the points showing a weak signal. These -OH groups could be related to organic matter, the presence of kaolinite or other unidentified clays in the soil remains, or the formation of -Si-OH groups from the degradation of Si-O-Si bonds. The results suggest that they could be mainly related to the first hypothesis, although further work will be necessary to evaluate the potential influence of the presence of clays.
Accordingly, the primary degradation process identified in these samples is the formation of -Si-OH, which occurs, as well as the dealkalinization previously reported for some of these samples, under high-humidity conditions. These are common degradation procedures widely reported in ancient glass. However, the presence of relatively well-preserved glass regions on half of the studied samples confirms the overall good state of preservation of this exceptional glass bead collection. Moreover, identifying the formation of -Si-OH as the main degradation mechanism, probably combined with dealkalinization, as well as the presence of carbonatation, would help to determine the optimal preservation conditions for this collection, ensuring its preservation for future generations.
Supplementary Materials
The following supporting information can be downloaded at: https://www.mdpi.com/article/10.3390/heritage9030094/s1, Figure S1. Representative micrographs of the studied surfaces of the glass beads shown in Figure 2. Table S1. FTIR peak assignments. Figure S2: PCA biplots: PC1 vs. PC2 (a), PC1 vs. PC3 (b), PC1 vs. PC4 (c), PC1 vs. PC5 (d), PC2 vs. PC3 (e), PC2 vs. PC4 (f), PC2 vs. PC5 (g), PC3 vs. PC4 (h), PC3 vs. PC5 (i), and PC4 vs. PC5 (j); Figure S3: FTIR reflectance spectra corresponding to clusters G1 (a), G2 (b), G3 (c), G4 (d), G5 (e), G6 (f), G7 (g), G8 (h), and G9 (i). Average values (solid line) and dispersion (shadowed regions) are shown in the graphs for each sub-cluster. Table S2: Studied glass beads showing blue or pearly hues and their corresponding FTIR reflectance spectra clusters.
Author Contributions
Conceptualization, A.C.P., S.B.-S. and J.P.; methodology, S.B.-S., U.S., L.P. and J.P.; formal analysis, S.B.-S. and J.P.; investigation, S.B.-S., U.S., L.P., E.R.-G. and J.P.; resources, E.R.-G. and C.S.-M.; writing—original draft preparation, S.B.-S.; writing—review and editing, A.C.P., U.S., L.P., C.S.-M. and J.P.; supervision, A.C.P., C.S.-M. and J.P.; project administration, A.C.P., C.S.-M. and J.P.; funding acquisition, C.S.-M., A.C.P. and J.P. All authors have read and agreed to the published version of the manuscript.
Funding
Financial assistance from MCIN/AEI/10.13039/501100011033/ and the EU FEDER “Una manera de hacer Europa” program (PID2022-142495NB-I0), as well as from the regional Government of Castilla y León and the EU-FEDER program (CLU-2025-05 and VA210P20), is acknowledged. This project also received funding from the European Union’s Horizon 2020 research and innovation program under grant agreement No 730872. The authors also acknowledge the TEMPOS Vega Sicilia group (Valladolid, Spain) for sponsoring the “Federico Wattenberg Center for Vaccean Studies”.
Data Availability Statement
The dataset is available on request from the authors.
Acknowledgments
The authors thank the Helmholtz-Zentrum Berlin für Materialien und Energie for the allocation of beamtime at the IRIS beamline of BESSY II.
Conflicts of Interest
The authors declare no conflicts of interest. The funders had no role in the design of the study; in the collection, analysis, or interpretation of data; in the writing of the manuscript; or in the decision to publish the results.
References
- Fiorentino, S.; Chinni, T. The Persistence of Memory. Exploring the Significance of Glass from Materiality to Intangible Values. Heritage 2023, 6, 4834–4842. [Google Scholar] [CrossRef] [Scilit]
- Henderson, J. Ancient Glass: An Interdisciplinary Exploration; Cambridge University Press: Cambridge, UK, 2013. [Google Scholar]
- Gratuze, B. Provenance Analysis of Glass Artefacts. In Modern Methods for Analysing Archaeological and Historical Glass; John Wiley & Sons, Ltd.: Hoboken, NJ, USA, 2013; Volume I, pp. 311–343. [Google Scholar] [CrossRef] [Scilit]
- Costa, M.; Barrulas, P.; Arruda, A.M.; Dias, L.; Barbosa, R.; Vandenabeele, P.; Mirão, J. An insight into the provenance of the Phoenician-Punic glass beads of the necropolis of Vinha das Caliças (Beja, Portugal). Archaeol. Anthropol. Sci. 2021, 13, 149. [Google Scholar] [CrossRef] [Scilit]
- García-Heras, M.; Rincón, J.M.; Jimeno, A.; Villegas, M.A. Pre-Roman coloured glass beads from the Iberian Peninsula: A chemico-physical characterisation study. J. Archaeol. Sci. 2005, 32, 727–738. [Google Scholar] [CrossRef] [Scilit]
- Lončarić, V.; Costa, M. Known Glass Compositions in Iron Age Europe—Current Synthesis and Emerging Questions. Heritage 2023, 6, 3835–3863. [Google Scholar] [CrossRef] [Scilit]
- Kaparou, M.; Oikonomou, A.; Karydas, A.G. Investigating the Degradation of Mycenaean Glass Artifacts Using Scientific Methods. Heritage 2024, 7, 1769–1783. [Google Scholar] [CrossRef] [Scilit]
- Thickett, D.; Mėlinis, A. Sustainability of Maintaining Glass Collections. Heritage 2025, 8, 251. [Google Scholar] [CrossRef] [Scilit]
- Sanz Mínguez, C.; Pinto, J.; Coria, J.C.; Barroso-Solares, S.; Rodriguez, E.; Loro, Ó.F.; Hurtado, V.; Ordás, J.T.; Colorado, C.P. Pintia: Glass Jewels for Eternity; Vaccea Editorial: Valladolid, Spain, 2024. [Google Scholar]
- Barroso-Solares, S.; Rodriguez-Gutierrez, E.; Coria-Noguera, J.C.; Prieto, A.C.; Sanz-Minguez, C.; Pinto, J. The footprint of Mediterranean glass artisans in Pintia (Padilla de Duero, Valladolid, Sàin): A masterpiece and a key collection to understand pre-Roman Iberia. In PERLE 3.0: The Bead Collections of International Museums; Panini, A., Squarcina, C., Stocco, M., Eds.; Fondazione Musei Civici di Venezia: Venice, Italy, 2024; pp. 57–74. [Google Scholar]
- Sanz Mínguez, C.; Coria Noguera, J.C.; Rodríguez Gutiérrez, E.; Pinto Sanz, J.; Barroso Solares, S.; Hurtado García, V. Lithinos chytos: Abalorios y collares de vidrio de Pintia (Valladolid). Estudio contextual y analítico. SPAL 2024, 33, 86–125. [Google Scholar] [CrossRef] [Scilit]
- Barroso-Solares, S.; Estalayo, E.; Aramendia, J.; Rodriguez-Gutierrez, E.; Sanz-Minguez, C.; Prieto, A.C.; Madariaga, J.M.; Pinto, J. A multi-technique approach to unveil the composition and fabrication of a pre-Roman glass masterpiece: A double-faced human-head shape polychrome glass pendant (2nd-1st c. BC). Archaeol. Anthropol. Sci. 2024, 16, 153. [Google Scholar] [CrossRef] [Scilit]
- Pinto, J.; Prieto, A.C.; Coria-Noguera, J.C.; Sanz-Minguez, C.; Souto, J. Investigating glass beads and the funerary rituals of ancient Vaccaei culture (S. IV-I BC) by Raman spectroscopy. J. Raman Spectrosc. 2021, 52, 170–185. [Google Scholar] [CrossRef] [Scilit]
- Papadopoulos, N.; Drosou, C.-A. Influence of weather conditions on glass properties. J. Univ. Chem. Technol. Metall. 2012, 47, 429–439. [Google Scholar]
- Lynch, M.E.; Folz, D.C.; Clark, D.E. Use of FTIR reflectance spectroscopy to monitor corrosion mechanisms on glass surfaces. J. Non-Cryst. Solids 2007, 353, 2667–2674. [Google Scholar] [CrossRef] [Scilit]
- Zanini, R.; Franceschin, G.; Cattaruzza, E.; Traviglia, A. A review of glass corrosion: The unique contribution of studying ancient glass to validate glass alteration models. npj Mater. Degrad. 2023, 7, 38. [Google Scholar] [CrossRef] [Scilit]
- Greiner-Wronowa, E.; Glass, L.S.; Departmenr, E. Influence of environment on surface of the ancient glasses. J. Non-Cryst. Solids 1996, 196, 118–127. [Google Scholar] [CrossRef] [Scilit]
- Caggiani, M.C.; Barone, G.; Mazzoleni, P. Non-invasive analysis of reference glass and historical mosaic tesserae by means of reflectance infrared spectroscopy. Spectrochim. Acta Part A Mol. Biomol. Spectrosc. 2024, 308, 123675. [Google Scholar] [CrossRef] [Scilit] [PubMed]
- Colomban, P. Non-Destructive Raman Analysis of Ancient Glasses and Glazes. In Modern Methods for Analysing Archaeological and Historical Glass; John Wiley & Sons, Ltd.: Hoboken, NJ, USA, 2013; Volume I, pp. 275–300. [Google Scholar] [CrossRef] [Scilit]
- Koleini, F.; Colomban, P.; Pikirayi, I. Post-15th century European glass beads in southern Africa: Composition and classification using pXRF and Raman spectroscopy. J. Archaeol. Sci. Rep. 2020, 29, 102183. [Google Scholar] [CrossRef] [Scilit]
- Macdonald, S.A.; Schardt, C.R.; Masiello, D.J.; Simmons, J.H. Dispersion analysis of FTIR reflection measurements in silicate glasses. J. Non-Cryst. Solids 2000, 275, 72–82. [Google Scholar] [CrossRef] [Scilit]
- Kadikova, I.F.; Morozova, E.A.; Yuryeva, T.V.; Grigorieva, I.A.; Yuryev, V.A. Glass depolymerization in the process of long-term corrosion: A study of deteriorating semiopaque turquoise glass beads using micro-FTIR spectroscopy. Mater. Res. Express 2020, 7, 025203. [Google Scholar] [CrossRef] [Scilit]
- Law, T.; Majérus, O.; Godet, M.; Moskura, M.; Charpentier, T.; Seyeux, A.; Caurant, D. Does Water Cleaning Mitigate Atmospheric Degradation of Unstable Heritage Glass? An Experimental Study on Glass Models. Heritage 2025, 8, 276. [Google Scholar] [CrossRef] [Scilit]
- Liu, G.L.; Kazarian, S.G. Recent advances and applications to cultural heritage using ATR-FTIR spectroscopy and ATR-FTIR spectroscopic imaging. Analyst 2022, 147, 1777–1797. [Google Scholar] [CrossRef] [Scilit]
- Derrick, M.R.; Stulik, D.C.; Landry, J.M. Infrared Spectroscopy in Conservation Science; Getty Conservation Institute: Los Angeles, CA, USA, 1999. [Google Scholar]
- Arrizabalaga, I.; Gómez-Laserna, O.; Carrero, J.A.; Bustamante, J.; Rodríguez, A.; Arana, G.; Madariaga, J.M. Diffuse reflectance FTIR database for the interpretation of the spectra obtained with a handheld device on built heritage materials. Anal. Methods 2015, 7, 1061–1070. [Google Scholar] [CrossRef] [Scilit]
- Sanz Mínguez, C. Los Vacceos: Cultura y Ritos Funerarios de un Pueblo Prerromano del Valle Medio del Duero. La Necrópolis de Las Ruedas, Padilla de Duero (Valladolid); Junta de Castilla y León: Valladolid, Spain, 1997. [Google Scholar]
- Rubiales, J.M.; Hernández, L.; Romero, F.; Sanz, C. The use of forest resources in central Iberia during the Late Iron Age. Insights from the wood charcoal analysis of Pintia, a Vaccaean oppidum. J. Archaeol. Sci. 2011, 38, 1–10. [Google Scholar] [CrossRef] [Scilit]
- Coria-Noguera, J.C.; Badreshany, K.P.; Sanz Mínguez, C. Archaeometric characterization of pottery from the Iron Age hillfort of Pintia (Valladolid, Spain). J. Archaeol. Sci. Rep. 2022, 41, 103313. [Google Scholar] [CrossRef] [Scilit]
- Toplak, M.; Read, S.T.; Sandt, C.; Borondics, F. Quasar: Easy machine learning for biospectroscopy. Cells 2021, 10, 2300. [Google Scholar] [CrossRef] [Scilit]
- Gassner, C.; Vongsvivut, J.; Ryu, M.; Ng, S.H.; Toplak, M.; Anand, V.; Takkalkar, P.; Fac, M.L.; Sims, N.A.; Wood, B.R.; et al. Bridging spectroscopy and advanced molecular orientation analysis with new 4+ angle polarization toolbox in Quasar. Comput. Biol. Med. 2025, 196, 110573. [Google Scholar] [CrossRef] [Scilit]
- Simkovic, I.; Dlapa, P.; Doerr, S.H.; Mataix-Solera, J.; Sasinkova, V. Thermal destruction of soil water repellency and associated changes to soil organic matter as observed by FTIR spectroscopy. CATENA 2008, 74, 205–211. [Google Scholar] [CrossRef] [Scilit]
- Heller, C.; Ellerbrock, R.H.; Roßkopf, N.; Klingenfuß, C.; Zeitz, J. Soil organic matter characterization of temperate peatland soil with FTIR-spectroscopy: Effects of mire type and drainage intensity. Eur. J. Soil Sci. 2015, 66, 847–858. [Google Scholar] [CrossRef] [Scilit]
- Shi, J.; Xing, D.; Li, J. FTIR studies of the changes in wood chemistry from wood forming tissue under inclined treatment. Energy Procedia 2012, 16, 758–762. [Google Scholar] [CrossRef] [Scilit]
- Guo, Y.; Marc Bustin, R. Micro-FTIR spectroscopy of liptinite macerals in coal. Int. J. Coal Geol. 1998, 36, 259–275. [Google Scholar] [CrossRef] [Scilit]
- Ricci, C.; Miliani, C.; Brunetti, B.G.; Sgamellotti, A. Non-invasive identification of surface materials on marble artifacts with fiber optic mid-FTIR reflectance spectroscopy. Talanta 2006, 69, 1221–1226. [Google Scholar] [CrossRef] [Scilit]
- Armaroli, T.; Bécue, T.; Gautier, S. Diffuse Reflection Infrared Spectroscopy (DRIFTS): Application to the in situ Analysis of Catalysts. Oil Gas Sci. Technol. 2004, 59, 215–237. [Google Scholar] [CrossRef] [Scilit]
- Angelin, E.M.; de Sá, S.F.; Soares, I.; Callapez, M.E.; Ferreira, J.L.; Melo, M.J.; Bacci, M.; Picollo, M. Application of Infrared Reflectance Spectroscopy on Plastics in Cultural Heritage Collections: A Comparative Assessment of Two Portable Mid-Fourier Transform Infrared Reflection Devices. Appl. Spectrosc. 2021, 75, 818–833. [Google Scholar] [CrossRef] [Scilit] [PubMed]
- Estupiñán Méndez, D.; Allscher, T. Advantages of External Reflection and Transflection over ATR in the Rapid Material Characterization of Negatives and Films via FTIR Spectroscopy. Polymers 2022, 14, 808. [Google Scholar] [CrossRef] [Scilit]
- Mayerhöfer, T.G.; Ivanovski, V.; Popp, J. Infrared refraction spectroscopy—Kramers-Kronig analysis revisited. Spectrochim. Acta Part A Mol. Biomol. Spectrosc. 2022, 270, 120799. [Google Scholar] [CrossRef] [Scilit]
- BRUKER OPTIK GmbH. OPUS Spectroscopy Software: User Manual; BRUKER OPTIK GmbH: Ettlingen, Germany, 2006. [Google Scholar]
- Saikia, B.J.; Parthasarathy, G. Fourier Transform Infrared Spectroscopic Characterization of Kaolinite from Assam and Meghalaya, Northeastern India. J. Mod. Phys. 2010, 1, 206–210. [Google Scholar] [CrossRef]
- Madejová, J. FTIR techniques in clay mineral studies. Vib. Spectrosc. 2003, 31, 1–10. [Google Scholar] [CrossRef] [Scilit]

Disclaimer/Publisher’s Note: The statements, opinions and data contained in all publications are solely those of the individual author(s) and contributor(s) and not of MDPI and/or the editor(s). MDPI and/or the editor(s) disclaim responsibility for any injury to people or property resulting from any ideas, methods, instructions or products referred to in the content. |
© 2026 by the authors. Licensee MDPI, Basel, Switzerland. This article is an open access article distributed under the terms and conditions of the Creative Commons Attribution (CC BY) license.