Next Issue
Volume 7, March
Previous Issue
Volume 6, September


Stats, Volume 6, Issue 4 (December 2023) – 23 articles

Cover Story (view full-size image): 
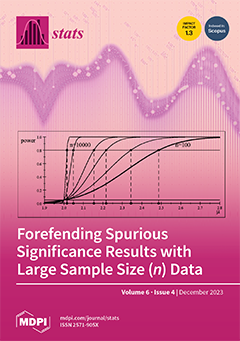
Although large sample size (n) data are generally viewed as a blessing for yielding more precise and reliable evidence, it is often overlooked that such gains are contingent upon certain conditions being met. The primary condition is the statistical adequacy of the invoked statistical model Mθ(x). For a statistically adequate Mθ(x) and a given significance level α, as n increases, the power of a test increases and the p-value decreases, due to the inherent trade-off between type I and type II error probabilities. This raises concerns about the veracity of declaring ‘statistical significance’ using α = 0.05, 0.025, 0.01, when n is very large. This problem can be addressed using the post-data severity evaluation of the testing results, which converts them into evidence for germane inferential claims. View this paper
  • Issues are regarded as officially published after their release is announced to the table of contents alert mailing list.
  • You may sign up for e-mail alerts to receive table of contents of newly released issues.
  • PDF is the official format for papers published in both, html and pdf forms. To view the papers in pdf format, click on the "PDF Full-text" link, and use the free Adobe Reader to open them.
Order results
Result details
Section
Select all
Export citation of selected articles as:
32 pages, 1582 KiB  
Article
Jump-Robust Realized-GARCH-MIDAS-X Estimators for Bitcoin and Ethereum Volatility Indices
by Julien Chevallier and Bilel Sanhaji
Stats 2023, 6(4), 1339-1370; https://doi.org/10.3390/stats6040082 - 12 Dec 2023
Viewed by 1582
Abstract
In this paper, we conducted an empirical investigation of the realized volatility of cryptocurrencies using an econometric approach. This work’s two main characteristics are: (i) the realized volatility to be forecast filters jumps, and (ii) the benefit of using various historical/implied volatility indices [...] Read more.
In this paper, we conducted an empirical investigation of the realized volatility of cryptocurrencies using an econometric approach. This work’s two main characteristics are: (i) the realized volatility to be forecast filters jumps, and (ii) the benefit of using various historical/implied volatility indices from brokers as exogenous variables was explicitly considered. We feature a jump-robust extension of the REGARCH-MIDAS-X model incorporating realized beta GARCH processes and MIDAS filters with monthly, daily, and hourly components. First, we estimated six jump-robust estimators of realized volatility for Bitcoin and Ethereum that were retained as the dependent variable. Second, we inserted ten Bitcoin and Ethereum volatility indices gathered from various exchanges as an exogenous variable, each at a time. Third, we explored their forecasting ability based on the MSE and QLIKE statistics. Our sample spanned the period from May 2018 to January 2023. The main result featured the best predictors among the volatility indices for Bitcoin and Ethereum derived from 30-day implied volatility. The significance of the findings could mostly be attributable to the ability of our new model to incorporate financial and technological variables directly into the specification of the Bitcoin and Ethereum volatility dynamics. Full article
(This article belongs to the Section Time Series Analysis)
Show Figures

Figure 1

16 pages, 402 KiB  
Article
Revisiting the Large n (Sample Size) Problem: How to Avert Spurious Significance Results
by Aris Spanos
Stats 2023, 6(4), 1323-1338; https://doi.org/10.3390/stats6040081 - 05 Dec 2023
Cited by 1 | Viewed by 1418
Abstract
Although large data sets are generally viewed as advantageous for their ability to provide more precise and reliable evidence, it is often overlooked that these benefits are contingent upon certain conditions being met. The primary condition is the approximate validity (statistical adequacy) of [...] Read more.
Although large data sets are generally viewed as advantageous for their ability to provide more precise and reliable evidence, it is often overlooked that these benefits are contingent upon certain conditions being met. The primary condition is the approximate validity (statistical adequacy) of the probabilistic assumptions comprising the statistical model Mθ(x) applied to the data. In the case of a statistically adequate Mθ(x) and a given significance level α, as n increases, the power of a test increases, and the p-value decreases due to the inherent trade-off between type I and type II error probabilities in frequentist testing. This trade-off raises concerns about the reliability of declaring ‘statistical significance’ based on conventional significance levels when n is exceptionally large. To address this issue, the author proposes that a principled approach, in the form of post-data severity (SEV) evaluation, be employed. The SEV evaluation represents a post-data error probability that converts unduly data-specific ‘accept/reject H0 results’ into evidence either supporting or contradicting inferential claims regarding the parameters of interest. This approach offers a more nuanced and robust perspective in navigating the challenges posed by the large n problem. Full article
(This article belongs to the Section Statistical Methods)
Show Figures

Figure 1

27 pages, 450 KiB  
Article
Process Monitoring Using Truncated Gamma Distribution
by Sajid Ali, Shayaan Rajput, Ismail Shah and Hassan Houmani
Stats 2023, 6(4), 1298-1322; https://doi.org/10.3390/stats6040080 - 01 Dec 2023
Viewed by 1214
Abstract
The time-between-events idea is commonly used for monitoring high-quality processes. This study aims to monitor the increase and/or decrease in the process mean rapidly using a one-sided exponentially weighted moving average (EWMA) chart for the detection of upward or downward mean shifts using [...] Read more.
The time-between-events idea is commonly used for monitoring high-quality processes. This study aims to monitor the increase and/or decrease in the process mean rapidly using a one-sided exponentially weighted moving average (EWMA) chart for the detection of upward or downward mean shifts using a truncated gamma distribution. The use of the truncation method helps to enhance and improve the sensitivity of the proposed chart. The performance of the proposed chart with known and estimated parameters is analyzed by using the run length properties, including the average run length (ARL) and standard deviation run length (SDRL), through extensive Monte Carlo simulation. The numerical results show that the proposed scheme is more sensitive than the existing ones. Finally, the chart is implemented in real-world situations to highlight the significance of the proposed chart. Full article
(This article belongs to the Special Issue Advances in Probability Theory and Statistics)
Show Figures

Figure 1

18 pages, 609 KiB  
Article
Social Response and Measles Dynamics
by Atinuke O. Adebanji, Franz Aschl, Ednah Chepkemoi Chumo, Emmanuel Odame Owiredu, Johannes Müller and Tukae Mbegalo
Stats 2023, 6(4), 1280-1297; https://doi.org/10.3390/stats6040079 - 29 Nov 2023
Viewed by 1154
Abstract
Measles remains one of the leading causes of death among young children globally, even though a safe and cost-effective vaccine is available. Vaccine hesitancy and social response to vaccination continue to undermine efforts to eradicate measles. In this study, we consider data about [...] Read more.
Measles remains one of the leading causes of death among young children globally, even though a safe and cost-effective vaccine is available. Vaccine hesitancy and social response to vaccination continue to undermine efforts to eradicate measles. In this study, we consider data about measles vaccination and measles prevalence in Germany for the years 2008–2012 in 345 districts. In the first part of the paper, we show that the probability of a local outbreak does not significantly depend on the vaccination coverage, but—if an outbreak does take place—the scale of the outbreak depends significantly on the vaccination coverage. Additionally, we show that the willingness to be vaccinated is significantly increased by local outbreaks, with a delay of about one year. In the second part of the paper, we consider a deterministic delay model to investigate the consequences of the statistical findings on the dynamics of the infection. Here, we find that the delay might induce oscillations if the vaccination coverage is rather low and the social response to an outbreak is sufficiently strong. The relevance of our findings is discussed at the end of the paper. Full article
(This article belongs to the Special Issue Advances in Probability Theory and Statistics)
Show Figures

Figure 1

20 pages, 936 KiB  
Article
The Logistic Burr XII Distribution: Properties and Applications to Income Data
by Renata Rojas Guerra, Fernando A. Peña-Ramírez and Gauss M. Cordeiro
Stats 2023, 6(4), 1260-1279; https://doi.org/10.3390/stats6040078 - 21 Nov 2023
Viewed by 1192
Abstract
We define and study the four-parameter logistic Burr XII distribution. It is obtained by inserting the three-parameter Burr XII distribution as the baseline in the logistic-X family and may be a useful alternative method to model income distribution and could be applied to [...] Read more.
We define and study the four-parameter logistic Burr XII distribution. It is obtained by inserting the three-parameter Burr XII distribution as the baseline in the logistic-X family and may be a useful alternative method to model income distribution and could be applied to other areas. We illustrate that the new distribution can have decreasing and upside-down-bathtub hazard functions and that its density function is an infinite linear combination of Burr XII densities. Some mathematical properties of the proposed model are determined, such as the quantile function, ordinary and incomplete moments, and generating function. We also obtain the maximum likelihood estimators of the model parameters and perform a Monte Carlo simulation study. Further, we present a parametric regression model based on the introduced distribution as an alternative to the location-scale regression model. The potentiality of the new distribution is illustrated by means of two applications to income data sets. Full article
Show Figures

Figure 1

19 pages, 4728 KiB  
Article
Self-Organizing Topological Multilayer Perceptron: A Hybrid Method to Improve the Forecasting of Extreme Pollution Values
by Javier Linkolk López-Gonzales, Ana María Gómez Lamus, Romina Torres, Paulo Canas Rodrigues and Rodrigo Salas
Stats 2023, 6(4), 1241-1259; https://doi.org/10.3390/stats6040077 - 11 Nov 2023
Viewed by 1328
Abstract
Forecasting air pollutant levels is essential in regulatory plans focused on controlling and mitigating air pollutants, such as particulate matter. Focusing the forecast on air pollution peaks is challenging and complex since the pollutant time series behavior is not regular and is affected [...] Read more.
Forecasting air pollutant levels is essential in regulatory plans focused on controlling and mitigating air pollutants, such as particulate matter. Focusing the forecast on air pollution peaks is challenging and complex since the pollutant time series behavior is not regular and is affected by several environmental and urban factors. In this study, we propose a new hybrid method based on artificial neural networks to forecast daily extreme events of PM2.5 pollution concentration. The hybrid method combines self-organizing maps to identify temporal patterns of excessive daily pollution found at different monitoring stations, with a set of multilayer perceptron to forecast extreme values of PM2.5 for each cluster. The proposed model was applied to analyze five-year pollution data obtained from nine weather stations in the metropolitan area of Santiago, Chile. Simulation results show that the hybrid method improves performance metrics when forecasting daily extreme values of PM2.5. Full article
(This article belongs to the Special Issue Statistical Learning for High-Dimensional Data)
Show Figures

Figure 1

15 pages, 380 KiB  
Article
On Underdispersed Count Kernels for Smoothing Probability Mass Functions
by Célestin C. Kokonendji, Sobom M. Somé, Youssef Esstafa and Marcelo Bourguignon
Stats 2023, 6(4), 1226-1240; https://doi.org/10.3390/stats6040076 - 04 Nov 2023
Cited by 1 | Viewed by 1291
Abstract
Only a few count smoothers are available for the widespread use of discrete associated kernel estimators, and their constructions lack systematic approaches. This paper proposes the mean dispersion technique for building count kernels. It is only applicable to count distributions that exhibit the [...] Read more.
Only a few count smoothers are available for the widespread use of discrete associated kernel estimators, and their constructions lack systematic approaches. This paper proposes the mean dispersion technique for building count kernels. It is only applicable to count distributions that exhibit the underdispersion property, which ensures the convergence of the corresponding estimators. In addition to the well-known binomial and recent CoM-Poisson kernels, we introduce two new ones such the double Poisson and gamma-count kernels. Despite the challenging problem of obtaining explicit expressions, these kernels effectively smooth densities. Their good performances are pointed out from both numerical and comparative analyses, particularly for small and moderate sample sizes. The optimal tuning parameter is here investigated by integrated squared errors. Also, the added advantage of faster computation times is really very interesting. Thus, the overall accuracy of two newly suggested kernels appears to be between the two old ones. Finally, an application including a tail probability estimation on a real count data and some concluding remarks are given. Full article
(This article belongs to the Special Issue Statistics, Analytics, and Inferences for Discrete Data)
Show Figures

Figure 1

28 pages, 481 KiB  
Article
Pivot Clustering to Minimize Error in Forecasting Aggregated Demand Streams Each Following an Autoregressive Moving Average Model
by Vladimir Kovtun, Avi Giloni, Clifford Hurvich and Sridhar Seshadri
Stats 2023, 6(4), 1198-1225; https://doi.org/10.3390/stats6040075 - 02 Nov 2023
Viewed by 1317
Abstract
In this paper, we compare the effects of forecasting demand using individual (disaggregated) components versus first aggregating the components either fully or into several clusters. Demand streams are assumed to follow autoregressive moving average (ARMA) processes. Using individual demand streams will always lead [...] Read more.
In this paper, we compare the effects of forecasting demand using individual (disaggregated) components versus first aggregating the components either fully or into several clusters. Demand streams are assumed to follow autoregressive moving average (ARMA) processes. Using individual demand streams will always lead to a superior forecast compared to any aggregates; however, we show that if several aggregated clusters are formed in a structured manner, then these subaggregated clusters will lead to a forecast with minimal increase in mean-squared forecast error. We show this result based on theoretical MSFE obtained directly from the models generating the clusters as well as estimated MSFE obtained directly from simulated demand observations. We suggest a pivot algorithm, which we call Pivot Clustering, to create these clusters. We also provide theoretical results to investigate sub-aggregation, including for special cases, such as aggregating demand generated by MA(1) models and aggregating demand generated by ARMA models with similar or the same parameters. Full article
(This article belongs to the Section Time Series Analysis)
Show Figures

Figure 1

19 pages, 366 KiB  
Article
Adjustment of Anticipatory Covariates in Retrospective Surveys: An Expected Likelihood Approach
by Gebrenegus Ghilagaber and Rolf Larsson
Stats 2023, 6(4), 1179-1197; https://doi.org/10.3390/stats6040074 - 01 Nov 2023
Viewed by 1124
Abstract
We address an inference issue where the value of a covariate is measured at the date of the survey but is used to explain behavior that has occurred long before the survey. This causes bias because the value of the covariate does not [...] Read more.
We address an inference issue where the value of a covariate is measured at the date of the survey but is used to explain behavior that has occurred long before the survey. This causes bias because the value of the covariate does not follow the temporal order of events. We propose an expected likelihood approach to adjust for such bias and illustrate it with data on the effects of educational level achieved by the time of marriage on risks of divorce. For individuals with anticipatory educational level (whose reported educational level was completed after marriage), conditional probabilities of having attained the reported level before marriage are computed. These are then used as weights in the expected likelihood to obtain adjusted estimates of relative risks. For our illustrative data set, the adjusted estimates of relative risks of divorce did not differ significantly from those obtained from anticipatory analysis that ignores the temporal order of events. Our results are slightly different from those in two other studies that analyzed the same data set in a Bayesian framework, though the studies are not fully comparable to each other. Full article
(This article belongs to the Special Issue Advances in Probability Theory and Statistics)
Show Figures

Figure A1

19 pages, 672 KiB  
Article
Implementation Aspects in Invariance Alignment
by Alexander Robitzsch
Stats 2023, 6(4), 1160-1178; https://doi.org/10.3390/stats6040073 - 25 Oct 2023
Cited by 1 | Viewed by 1229
Abstract
In social sciences, multiple groups, such as countries, are frequently compared regarding a construct that is assessed using a number of items administered in a questionnaire. The corresponding scale is assessed with a unidimensional factor model involving a latent factor variable. To enable [...] Read more.
In social sciences, multiple groups, such as countries, are frequently compared regarding a construct that is assessed using a number of items administered in a questionnaire. The corresponding scale is assessed with a unidimensional factor model involving a latent factor variable. To enable a comparison of the mean and standard deviation of the factor variable across groups, identification constraints on item intercepts and factor loadings must be imposed. Invariance alignment (IA) provides such a group comparison in the presence of partial invariance (i.e., a minority of item intercepts and factor loadings are allowed to differ across groups). IA is a linking procedure that separately fits a factor model in each group in the first step. In the second step, a linking of estimated item intercepts and factor loadings is conducted using a robust loss function L0.5. The present article discusses implementation alternatives in IA. It compares the default L0.5 loss function with Lp with other values of the power p between 0 and 1. Moreover, the nondifferentiable Lp loss functions are replaced with differentiable approximations in the estimation of IA that depend on a tuning parameter ε (such as, e.g., ε=0.01). The consequences of choosing different values of ε are discussed. Moreover, this article proposes the L0 loss function with a differentiable approximation for IA. Finally, it is demonstrated that the default linking function in IA introduces bias in estimated means and standard deviations if there is noninvariance in factor loadings. Therefore, an alternative linking function based on logarithmized factor loadings is examined for estimating factor means and standard deviations. The implementation alternatives are compared through three simulation studies. It turned out that the linking function for factor loadings in IA should be replaced by the alternative involving logarithmized factor loadings. Furthermore, the default L0.5 loss function is inferior to the newly proposed L0 loss function regarding the bias and root mean square error of factor means and standard deviations. Full article
(This article belongs to the Section Computational Statistics)
13 pages, 515 KiB  
Article
Asymptotic Relative Efficiency of Parametric and Nonparametric Survival Estimators
by Szilárd Nemes
Stats 2023, 6(4), 1147-1159; https://doi.org/10.3390/stats6040072 - 25 Oct 2023
Cited by 1 | Viewed by 1278
Abstract
The dominance of non- and semi-parametric methods in survival analysis is not without criticism. Several studies have highlighted the decrease in efficiency compared to parametric methods. We revisit the problem of Asymptotic Relative Efficiency (ARE) of the Kaplan–Meier survival [...] Read more.
The dominance of non- and semi-parametric methods in survival analysis is not without criticism. Several studies have highlighted the decrease in efficiency compared to parametric methods. We revisit the problem of Asymptotic Relative Efficiency (ARE) of the Kaplan–Meier survival estimator compared to parametric survival estimators. We begin by generalizing Miller’s approach and presenting a formula that enables the estimation (numerical or exact) of ARE for various survival distributions and types of censoring. We examine the effect of follow-up time and censoring on ARE. The article concludes with a discussion about the reasons behind the lower and time-dependent ARE of the Kaplan–Meier survival estimator. Full article
(This article belongs to the Section Survival Analysis)
Show Figures

Figure 1

21 pages, 407 KiB  
Article
The Semi-Hyperbolic Distribution and Its Applications
by Roman V. Ivanov
Stats 2023, 6(4), 1126-1146; https://doi.org/10.3390/stats6040071 - 21 Oct 2023
Viewed by 1361
Abstract
This paper studies a subclass of the class of generalized hyperbolic distribution called the semi-hyperbolic distribution. We obtain analytical expressions for the cumulative distribution function and, specifically, their first and second lower partial moments. Using the received formulas, we compute the value at [...] Read more.
This paper studies a subclass of the class of generalized hyperbolic distribution called the semi-hyperbolic distribution. We obtain analytical expressions for the cumulative distribution function and, specifically, their first and second lower partial moments. Using the received formulas, we compute the value at risk, the expected shortfall, and the semivariance in the semi-hyperbolic model of the financial market. The formulas depend on the values of generalized hypergeometric functions and modified Bessel functions of the second kind. The research illustrates the possibility of analysis of generalized hyperbolic models using the same methodology as is employed for the well-established variance-gamma model. Full article
(This article belongs to the Special Issue Advances in Probability Theory and Statistics)
Show Figures

Figure 1

12 pages, 2005 KiB  
Article
An Archimedean Copulas-Based Approach for m-Consecutive-k-Out-of-n: F Systems with Exchangeable Components
by Ioannis S. Triantafyllou
Stats 2023, 6(4), 1114-1125; https://doi.org/10.3390/stats6040070 - 20 Oct 2023
Viewed by 1182
Abstract
It is evident that several real-life applications, such as telecommunication systems, call for the establishment of consecutive-type networks. Moreover, some of them require more complex connectors than the ones that exist already in the literature. Thereof, in the present work we provide a [...] Read more.
It is evident that several real-life applications, such as telecommunication systems, call for the establishment of consecutive-type networks. Moreover, some of them require more complex connectors than the ones that exist already in the literature. Thereof, in the present work we provide a signature-based study of a reliability network consisting of identical m-consecutive-k-out-of-n: F structures with exchangeable components. The dependency of the components of each system is modeled with the aid of well-known Archimedean copulas. Exact formulae for determining the expected lifetime of the underlying reliability scheme are provided under different Archimedean copulas-based assumptions. Several numerical results are carried out to shed light on the performance of the resulting consecutive-type design. Some thoughts on extending the present study to more complex consecutive-type reliability structures are also discussed. Full article
(This article belongs to the Section Reliability Engineering)
Show Figures

Figure 1

19 pages, 579 KiB  
Article
Exploring the Consumer Acceptance of Nano Clothing Using a PLS-SEM Analysis
by Andreea-Ionela Puiu, Rodica Ianole-Călin and Elena Druică
Stats 2023, 6(4), 1095-1113; https://doi.org/10.3390/stats6040069 - 19 Oct 2023
Cited by 1 | Viewed by 1392
Abstract
We use an extended framework of the technology acceptance model (TAM) to identify the most significant drivers behind the intention to buy clothes produced with nano fabrics (nano clothing). Based on survey data, we estimate an integrated model that explains this intention as [...] Read more.
We use an extended framework of the technology acceptance model (TAM) to identify the most significant drivers behind the intention to buy clothes produced with nano fabrics (nano clothing). Based on survey data, we estimate an integrated model that explains this intention as being driven by attitudes, perceived usefulness, and perceived ease of use. The influences of social innovativeness, relative advantage, compatibility, and ecologic concern on perceived usefulness are tested using perceived ease of use as a mediator. We employ a partial least squares path model in WarpPLS 7.0., a predictive technique that informs policies. The results show positive effects for all the studied relationships, with effect sizes underscoring perceived usefulness, attitude, and compatibility as the most suitable targets for practical interventions. Our study expands the TAM framework into the field of nano fashion consumption, shedding light on the potential drivers of the adoption process. Explorations of the topic hold the potential to make a substantial contribution to the promotion of sustainable fashion practices. Full article
Show Figures

Figure 1

13 pages, 743 KiB  
Article
Comparison between Two Algorithms for Computing the Weighted Generalized Affinity Coefficient in the Case of Interval Data
by Áurea Sousa, Osvaldo Silva, Leonor Bacelar-Nicolau, João Cabral and Helena Bacelar-Nicolau
Stats 2023, 6(4), 1082-1094; https://doi.org/10.3390/stats6040068 - 13 Oct 2023
Cited by 1 | Viewed by 1016
Abstract
From the affinity coefficient between two discrete probability distributions proposed by Matusita, Bacelar-Nicolau introduced the affinity coefficient in a cluster analysis context and extended it to different types of data, including for the case of complex and heterogeneous data within the scope of [...] Read more.
From the affinity coefficient between two discrete probability distributions proposed by Matusita, Bacelar-Nicolau introduced the affinity coefficient in a cluster analysis context and extended it to different types of data, including for the case of complex and heterogeneous data within the scope of symbolic data analysis (SDA). In this study, we refer to the most significant partitions obtained using the hierarchical cluster analysis (h.c.a.) of two well-known datasets that were taken from the literature on complex (symbolic) data analysis. h.c.a. is based on the weighted generalized affinity coefficient for the case of interval data and on probabilistic aggregation criteria from a VL parametric family. To calculate the values of this coefficient, two alternative algorithms were used and compared. Both algorithms were able to detect clusters of macrodata (aggregated data into groups of interest) that were consistent and consonant with those reported in the literature, but one performed better than the other in some specific cases. Moreover, both approaches allow for the treatment of large microdatabases (non-aggregated data) after their transformation into macrodata from the huge microdata. Full article
(This article belongs to the Special Issue Statistics, Analytics, and Inferences for Discrete Data)
Show Figures

Figure 1

10 pages, 794 KiB  
Brief Report
On the Vector Representation of Characteristic Functions
by Wolf-Dieter Richter
Stats 2023, 6(4), 1072-1081; https://doi.org/10.3390/stats6040067 - 10 Oct 2023
Cited by 1 | Viewed by 966
Abstract
Based upon the vector representation of complex numbers and the vector exponential function, we introduce the vector representation of characteristic functions and consider some of its elementary properties such as its polar representation and a vector power expansion. Full article
(This article belongs to the Special Issue Advances in Probability Theory and Statistics)
19 pages, 38187 KiB  
Article
Newcomb–Benford’s Law in Neuromuscular Transmission: Validation in Hyperkalemic Conditions
by Adriano Silva, Sergio Floquet and Ricardo Lima
Stats 2023, 6(4), 1053-1071; https://doi.org/10.3390/stats6040066 - 09 Oct 2023
Viewed by 1224
Abstract
Recently, we demonstrated the validity of the anomalous numbers law, known as Newcomb–Benford’s law, in mammalian neuromuscular transmission, considering different extracellular calcium. The present work continues to examine how changes in extracellular physiological artificial solution can modulate the first digit law in the [...] Read more.
Recently, we demonstrated the validity of the anomalous numbers law, known as Newcomb–Benford’s law, in mammalian neuromuscular transmission, considering different extracellular calcium. The present work continues to examine how changes in extracellular physiological artificial solution can modulate the first digit law in the context of spontaneous acetylcholine release at the neuromuscular junction. Using intracellular measurements, we investigated if the intervals of miniature potentials collected at the neuromuscular junction obey the law in a hyperkalemic environment. When bathed in standard Ringer’s solution, the experiments provided 22,582 intervals extracted from 14 recordings. On the other hand, 690,385 intervals were obtained from 12 experiments in a modified Ringer’s solution containing a high potassium concentration. The analysis showed that the intervals, harvested from recordings at high potassium, satisfactorily obeyed Newcomb–Benford’s law. Furthermore, our data allowed us to uncover a conformity fluctuation as a function of the number of intervals of the miniature potentials. Finally, we discuss the biophysical implications of the present findings. Full article
(This article belongs to the Section Time Series Analysis)
Show Figures

Figure 1

16 pages, 339 KiB  
Article
Computationally Efficient Poisson Time-Varying Autoregressive Models through Bayesian Lattice Filters
by Yuelei Sui, Scott H. Holan and Wen-Hsi Yang
Stats 2023, 6(4), 1037-1052; https://doi.org/10.3390/stats6040065 - 09 Oct 2023
Viewed by 1103
Abstract
Estimation of time-varying autoregressive models for count-valued time series can be computationally challenging. In this direction, we propose a time-varying Poisson autoregressive (TV-Pois-AR) model that accounts for the changing intensity of the Poisson process. Our approach can capture the latent dynamics of the [...] Read more.
Estimation of time-varying autoregressive models for count-valued time series can be computationally challenging. In this direction, we propose a time-varying Poisson autoregressive (TV-Pois-AR) model that accounts for the changing intensity of the Poisson process. Our approach can capture the latent dynamics of the time series and therefore make superior forecasts. To speed up the estimation of the TV-AR process, our approach uses the Bayesian Lattice Filter. In addition, the No-U-Turn Sampler (NUTS) is used, instead of a random walk Metropolis–Hastings algorithm, to sample intensity-related parameters without a closed-form full conditional distribution. The effectiveness of our approach is evaluated through model-based and empirical simulation studies. Finally, we demonstrate the utility of the proposed model through an example of COVID-19 spread in New York State and an example of US COVID-19 hospitalization data. Full article
Show Figures

Figure 1

18 pages, 1341 KiB  
Article
Effective Sample Size with the Bivariate Gaussian Common Component Model
by Letícia Ellen Dal Canton, Luciana Pagliosa Carvalho Guedes, Miguel Angel Uribe-Opazo and Tamara Cantu Maltauro
Stats 2023, 6(4), 1019-1036; https://doi.org/10.3390/stats6040064 - 08 Oct 2023
Viewed by 888
Abstract
Effective sample size (ESS) consists of an equivalent number of sampling units of a georeferenced variable that would produce the same sampling error, as it considers the information that each georeferenced sampling unit contains about itself as well as in relation to its [...] Read more.
Effective sample size (ESS) consists of an equivalent number of sampling units of a georeferenced variable that would produce the same sampling error, as it considers the information that each georeferenced sampling unit contains about itself as well as in relation to its neighboring sampling units. This measure can provide useful information in the planning of future georeferenced sampling for spatial variability experiments. The objective of this article was to develop a bivariate methodology for ESS (ESSbi), considering the bivariate Gaussian common component model (BGCCM), which accounts both for the spatial correlation between the two variables and for the individual spatial association. All properties affecting the univariate methodology were verified for ESSbi using simulation studies or algebraic methods, including scenarios to verify the impact of the BGCCM common range parameter on the estimated ESSbi values. ESSbi was applied to real organic matter (OM) and sum of bases (SB) data from an agricultural area. The study found that 60% of the sample observations of the OM–SB pair contained spatially redundant information. The reduced sample configuration proved efficient by preserving spatial variability when comparing the original and reduced OM maps, using SB as a covariate. The Tau concordance index confirmed moderate accuracy between the maps. Full article
(This article belongs to the Section Applied Stochastic Models)
Show Figures

Figure 1

11 pages, 335 KiB  
Article
A Shared Frailty Model for Left-Truncated and Right-Censored Under-Five Child Mortality Data in South Africa
by Tshilidzi Benedicta Mulaudzi, Yehenew Getachew Kifle and Roel Braekers
Stats 2023, 6(4), 1008-1018; https://doi.org/10.3390/stats6040063 - 06 Oct 2023
Viewed by 1064
Abstract
Many African nations continue to grapple with persistently high under-five child mortality rates, particularly those situated in the Sub-Saharan region, including South Africa. A multitude of socio-economic factors are identified as key contributors to the elevated under-five child mortality in numerous African nations. [...] Read more.
Many African nations continue to grapple with persistently high under-five child mortality rates, particularly those situated in the Sub-Saharan region, including South Africa. A multitude of socio-economic factors are identified as key contributors to the elevated under-five child mortality in numerous African nations. This research endeavors to investigate various factors believed to be associated with child mortality by employing advanced statistical models. This study utilizes child-level survival data from South Africa, characterized by left truncation and right censoring, to fit a Cox proportional hazards model under the assumption of working independence. Additionally, a shared frailty model is applied, clustering children based on their mothers. Comparative analysis is performed between the results obtained from the shared frailty model and the Cox proportional hazards model under the assumption of working independence. Within the scope of this analysis, several factors stand out as significant contributors to under-five child mortality in the study area, including gender, birth province, birth year, birth order, and twin status. Notably, the shared frailty model demonstrates superior performance in modeling the dataset, as evidenced by a lower likelihood cross-validation score compared to the Cox proportional hazards model assuming independence. This improvement can be attributed to the shared frailty model’s ability to account for heterogeneity among mothers and the inherent association between siblings born to the same mother, ultimately enhancing the quality of the study’s conclusions. Full article
(This article belongs to the Section Survival Analysis)
Show Figures

Figure 1

18 pages, 1899 KiB  
Article
Ensemble Algorithms to Improve COVID-19 Growth Curve Estimates
by Raydonal Ospina, Jaciele Oliveira, Cristiano Ferraz, André Leite and João Gondim
Stats 2023, 6(4), 990-1007; https://doi.org/10.3390/stats6040062 - 29 Sep 2023
Viewed by 844
Abstract
In January 2020, the world was taken by surprise as a novel disease, COVID-19, emerged, attributed to the new SARS-CoV-2 virus. Initial cases were reported in China, and the virus rapidly disseminated globally, leading the World Health Organization (WHO) to declare it a [...] Read more.
In January 2020, the world was taken by surprise as a novel disease, COVID-19, emerged, attributed to the new SARS-CoV-2 virus. Initial cases were reported in China, and the virus rapidly disseminated globally, leading the World Health Organization (WHO) to declare it a pandemic on 11 March 2020. Given the novelty of this pathogen, limited information was available regarding its infection rate and symptoms. Consequently, the necessity of employing mathematical models to enable researchers to describe the progression of the epidemic and make accurate forecasts became evident. This study focuses on the analysis of several dynamic growth models, including the logistics, Gompertz, and Richards growth models, which are commonly employed to depict the spread of infectious diseases. These models are integrated to harness their predictive capabilities, utilizing an ensemble modeling approach. The resulting ensemble algorithm was trained using COVID-19 data from the Brazilian state of Paraíba. The proposed ensemble model approach effectively reduced forecasting errors, showcasing itself as a promising methodology for estimating COVID-19 growth curves, improving data forecasting accuracy, and providing rapid responses in the early stages of the pandemic. Full article
Show Figures

Figure 1

10 pages, 621 KiB  
Article
Confounder Adjustment in Shape-on-Scalar Regression Model: Corpus Callosum Shape Alterations in Alzheimer’s Disease
by Harshita Dogra, Shengxian Ding, Miyeon Yeon, Rongjie Liu and Chao Huang
Stats 2023, 6(4), 980-989; https://doi.org/10.3390/stats6040061 - 28 Sep 2023
Viewed by 990
Abstract
Large-scale imaging studies often face challenges stemming from heterogeneity arising from differences in geographic location, instrumental setups, image acquisition protocols, study design, and latent variables that remain undisclosed. While numerous regression models have been developed to elucidate the interplay between imaging responses and [...] Read more.
Large-scale imaging studies often face challenges stemming from heterogeneity arising from differences in geographic location, instrumental setups, image acquisition protocols, study design, and latent variables that remain undisclosed. While numerous regression models have been developed to elucidate the interplay between imaging responses and relevant covariates, limited attention has been devoted to cases where the imaging responses pertain to the domain of shape. This adds complexity to the problem of imaging heterogeneity, primarily due to the unique properties inherent to shape representations, including nonlinearity, high-dimensionality, and the intricacies of quotient space geometry. To tackle this intricate issue, we propose a novel approach: a shape-on-scalar regression model that incorporates confounder adjustment. In particular, we leverage the square root velocity function to extract elastic shape representations which are embedded within the linear Hilbert space of square integrable functions. Subsequently, we introduce a shape regression model aimed at characterizing the intricate relationship between elastic shapes and covariates of interest, all while effectively managing the challenges posed by imaging heterogeneity. We develop comprehensive procedures for estimating and making inferences about the unknown model parameters. Through real-data analysis, our method demonstrates its superiority in terms of estimation accuracy when compared to existing approaches. Full article
Show Figures

Figure 1

24 pages, 6570 KiB  
Article
Terroir in View of Bibliometrics
by Christos Stefanis, Elpida Giorgi, Giorgios Tselemponis, Chrysa Voidarou, Ioannis Skoufos, Athina Tzora, Christina Tsigalou, Yiannis Kourkoutas, Theodoros C. Constantinidis and Eugenia Bezirtzoglou
Stats 2023, 6(4), 956-979; https://doi.org/10.3390/stats6040060 - 27 Sep 2023
Cited by 4 | Viewed by 1430
Abstract
This study aimed to perform a bibliometric analysis of terroir and explore its conceptual horizons. Advancements in terroir research until 2022 were investigated using the Scopus database, R, and VOSviewer. Out of the 907 results, the most prevalent document types were articles (771) [...] Read more.
This study aimed to perform a bibliometric analysis of terroir and explore its conceptual horizons. Advancements in terroir research until 2022 were investigated using the Scopus database, R, and VOSviewer. Out of the 907 results, the most prevalent document types were articles (771) and reviews (70). The annual growth rate of published manuscripts in this field was 7.8%. The research on terroir encompassed a wide range of disciplines, with significant contributions from Agricultural and Biological Sciences, Social Sciences, Environmental Science, Biochemistry, Genetics, and Molecular Biology. Through keyword analysis, the study identified the most frequently occurring terms in titles, abstracts, and keywords fields, including ‘terroir’, ‘wine’, ‘soil’, ‘wines’, ‘grape’, ‘analysis’, ‘vineyard’, ‘composition’, and ‘climate’. A trend topic analysis revealed that research in terroir primarily focused on the geo-ecology and physiology of grapes. Furthermore, considerable attention was given to methods and techniques related to the physicochemical, sensory, and microbial characterization of terroir and various aspects of the wine industry. Initially, the research in this domain was focused on terroir, authenticity, grapevine, soils, soil moisture, and wine quality. However, over time, the research agenda expanded to include topics such as food analysis, viticulture, wine, taste, sustainability, and climate change. New research areas emerged, including phenolic compounds, anthocyanin, phenols, sensory analysis, and precision agriculture—all of which became integral components of the scientific studies on terroir. Overall, this study provided valuable insights into the historical trends and current developments in terroir research, contributing to our understanding of the frontiers in this field. Full article
Show Figures

Figure 1

Previous Issue
Next Issue
Back to TopTop