

Stats, Volume 8, Issue 3 (September 2025) – 35 articles
Cover Story (view full-size image):
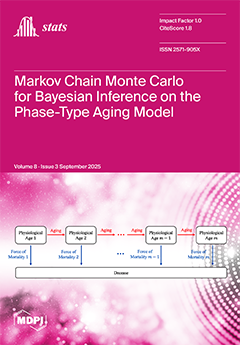
A Markov chain Monte Carlo (MCMC)-based Bayesian methodology is proposed and applied to the phase-type aging model (PTAM), with a view to improving parameter estimability. The proposed method provides two methodological extensions based on an existing MCMC inference method. First, we propose a two-level MCMC sampling scheme that is applicable to scenarios where the posterior distributions do not take simple forms after data augmentation. Secondly, an existing data augmentation technique for Bayesian inference on continuous phase-type distributions is further developed in order to incorporate left-truncated data. The proposed methodology improves parameter estimability via sound prior distributions and may also be utilized as a stand-alone statistical model-fitting technique. View this paper
- Issues are regarded as officially published after their release is announced to the table of contents alert mailing list.
- You may sign up for e-mail alerts to receive table of contents of newly released issues.
- PDF is the official format for papers published in both, html and pdf forms. To view the papers in pdf format, click on the "PDF Full-text" link, and use the free Adobe Reader to open them.
Previous Issue
Next Issue