


Abstract
Frailty is a geriatric syndrome associated with adverse outcomes, particularly in super-aged societies. Hospitalization-related inactivity may contribute to frailty progression and worsen prognosis and post-discharge quality of life; however, frailty identification at admission is challenging. This study used diagnosis procedure combination (DPC) data to examine associations between patient and medication factors at admission and hospitalization-induced frailty. The cohort comprised patients aged ≥65 years hospitalized at Shonantobu General Hospital with records of oral medication prescribed or brought in at admission. Four PRISMA-7 frailty risk index items were evaluated. Patients meeting at least three criteria were defined as the frailty risk group. Bivariate and multivariate analyses assessed the influence of patient background and medication categories on frailty risk. The frailty risk group included 888/1948 cases. Risk and nonrisk groups differed significantly in sex, age, and body mass index (BMI). Logistic regression analysis showed that low BMI, antithrombotics, mineral supplements, and antiparkinsonian drugs were associated with frailty risk, although the findings for male sex and advanced age should be interpreted cautiously because these variables were included as components of the modified frailty-risk definition. Patient background and medication information from DPC data at admission may contribute to future frailty risk estimation. Future prospective studies using detailed clinical data and machine learning models are needed to clarify the relationship between medication use and frailty.
1. Introduction
Japan is experiencing an unprecedented rate of aging. In 2024, the proportion of the population aged ≥65 years was 29.3%, ranking second globally behind Monaco [1]. Although Japan had the highest average life expectancy worldwide in 2022 (men, 81.05 years; women, 87.09 years), a gap of approximately 9 years for men and 12 years for women remains between life expectancy and healthy life expectancy. Thus, there is an urgent need to maintain quality of life (QOL) while ensuring the efficient use of medical resources. In 2019, Japan’s Ministry of Health, Labour and Welfare launched a Healthy Life Expectancy Extension Plan, aiming to prevent long-term care dependency, address frailty, and prevent dementia [2].
Frailty is a state of vulnerability resulting from age-related cumulative deficits in multiple physiological functions, leading to impaired restoration of homeostasis following exposure to stressors [3]. It is considered an intermediate state between active living and long-term care dependency. Increasing evidence shows that frailty is a multifaceted concept, encompassing physical, mental, and social dimensions. Consequently, it is associated with numerous adverse health outcomes, including falls, hospitalization, fractures, institutionalization, disability, dementia, and reduced QOL. Thus, early detection and preventive interventions are crucial for extending healthy life expectancy [4,5,6,7,8,9,10].
Most research on frailty has focused on identifying risk factors and developing prediction models. Several frailty risk estimation models based on administrative or claims data have been developed outside Japan. Gilbert et al. developed and validated the Hospital Frailty Risk Score using ICD-10 diagnostic codes derived from electronic hospital records in the United Kingdom, which enabled the systematic identification of frailty risk in acute care settings. Kim et al. developed a Claims-Based Frailty Index using Medicare claims data in the United States, with a survey-based frailty index serving as the reference standard [11,12]. These studies demonstrate the feasibility of estimating frailty risk from administrative data collected routinely. However, such studies are scarce in Japan, and large-scale studies using Japanese clinical data are lacking. Furthermore, studies evaluating frailty risk using diagnosis procedure combination (DPC) data or medication information available at admission are scarce, and few Japanese studies have comprehensively investigated the association between medications and frailty using real-world clinical data from hospitalized older patients.
Medication use is an important factor in frailty. Polypharmacy is associated with frailty and fall risk [13], and specific drug classes may affect physical and cognitive functions [14]. Thus, integrating medication use data and patient information may improve frailty prediction.
DPC data are widely generated and accumulated in acute care hospitals in Japan, comprehensively capturing patient information, medical procedures, and prescribed medications. Although primarily used for healthcare economics and clinical practice analysis, DPC data are also helpful in assessing QOL-related risk factors. Identifying factors associated with frailty risk from information available at hospital admission may provide a basis for early intervention strategies, with the potential to contribute to improved prognoses and reduced healthcare burden in future studies.
This study retrospectively analyzed the association of patient background and medication use at admission with frailty risk using DPC data from patients at Shonantobu General Hospital. This study aimed to identify factors associated with frailty risk based on admission information to inform future prediction and intervention strategies. Our findings may contribute to the development of future frailty prediction models using DPC data at other institutions.
2. Materials and Methods
2.1. Database Construction
The DPC database is a Japanese administrative claims and discharge electronic database generated by hospitals for health insurance reimbursement purposes, and it also serves as a clinical epidemiology database [15]. Form 1 records patient attributes, admission and discharge information, and basic details of diagnoses and surgeries. The EF file, an integrated file combining the E file (medical fee itemization information) and the F file (procedure itemization information), contains detailed daily records of medical procedures, including tests, procedures, medications (type, dose, and date), medical supplies, anesthesia duration, blood transfusion volume, and costs.
This study analyzed the DPC data of patients hospitalized at Shonantobu General Hospital from April 2022 to March 2024 using data extracted from Form 1 and the EF file for each patient. For the EF file, only drug-related data were analyzed, and each drug was assigned an Anatomical Therapeutic Chemical (ATC) code according to the World Health Organization 2025 classification [16]. After removing duplicate records, the Form 1 and processed EF file data were linked using anonymized patient identification numbers, creating a unified database of patient demographics, clinical information, and medication use. From this database, we extracted cases of patients aged ≥65 years with records of oral medication prescriptions or medications brought in at admission. This dataset was designated as the analysis table.
2.2. Definition of Frailty Risk Groups
Several frailty assessment scales exist, such as the Cardiovascular Health Study (CHS) criteria [17] and the Clinical Frailty Scale [18]. The Japanese version of the CHS is widely used in Japan [19]. Although these criteria are validated and in clinical use, the lack of rehabilitation assessments in DPC data makes their application difficult. Therefore, we evaluated frailty risk groups based on the Program of Research to Integrate Services for the Maintenance of Autonomy 7 (PRISMA-7), a seven-item screening tool for older adults, in which individuals meeting at least three criteria are considered at risk for frailty [20]. Because of the limited information obtainable from DPC Form 1, we only evaluated the following four PRISMA-7 items: (1) age ≥85 years, (2) male sex, (3) requiring assistance with daily living, and (4) requiring a cane, walker, or wheelchair for mobility. Eligibility for items (3) and (4) was determined using the Activities of Daily Living (ADL) score recorded at admission in Form 1. Patients who met at least three of the four criteria were included in the frailty risk group. For binary classification, the frailty risk group was coded as 1 and the nonrisk group as 0.
To validate our frailty risk definition, we used in-hospital incident/accident reports to identify patients in the cohort who experienced a fall during hospitalization. These cases were analyzed to determine the association between frailty risk (outcome variable) and in-hospital falls (explanatory variable).
2.3. Analysis of Patient Information
To identify patient characteristics associated with frailty risk, we performed bivariate analyses with frailty risk as the dependent variable and sex, age, and body mass index (BMI) (calculated from height and weight) as the explanatory variables. Sex was dichotomized (male = 1, female = 0) and compared using Fisher’s exact test. Age and BMI were treated as continuous variables, and differences were assessed using the unpaired t-test. Cases with missing age or BMI values were excluded. No imputation was performed for missing values. For patients with multiple admissions during the study period, each admission was treated as an independent case. If a patient had multiple recorded values for age (e.g., due to a birthday) or BMI (e.g., due to weight changes) during a single hospitalization period, the maximum value was used as the representative value for that case.
2.4. Drug Signal Analysis
The medications used by the patients were identified by their generic names and assigned ATC classifications. Subsequently, they were aggregated according to ATC Level 2 categories (e.g., A01, Stomatological Preparations), hereafter “drug groups.” To identify drug groups associated with frailty risk (dependent variable), 2 × 2 cross-tabulation tables were created for the use/non-use of each drug group (explanatory variables). Fisher’s exact test was performed to calculate p-values and odds ratios (ORs) (Table 1).
Table 1.
Cross-tabulation and formula used to calculate the ROR (Reported odds ratio) for an adverse event.
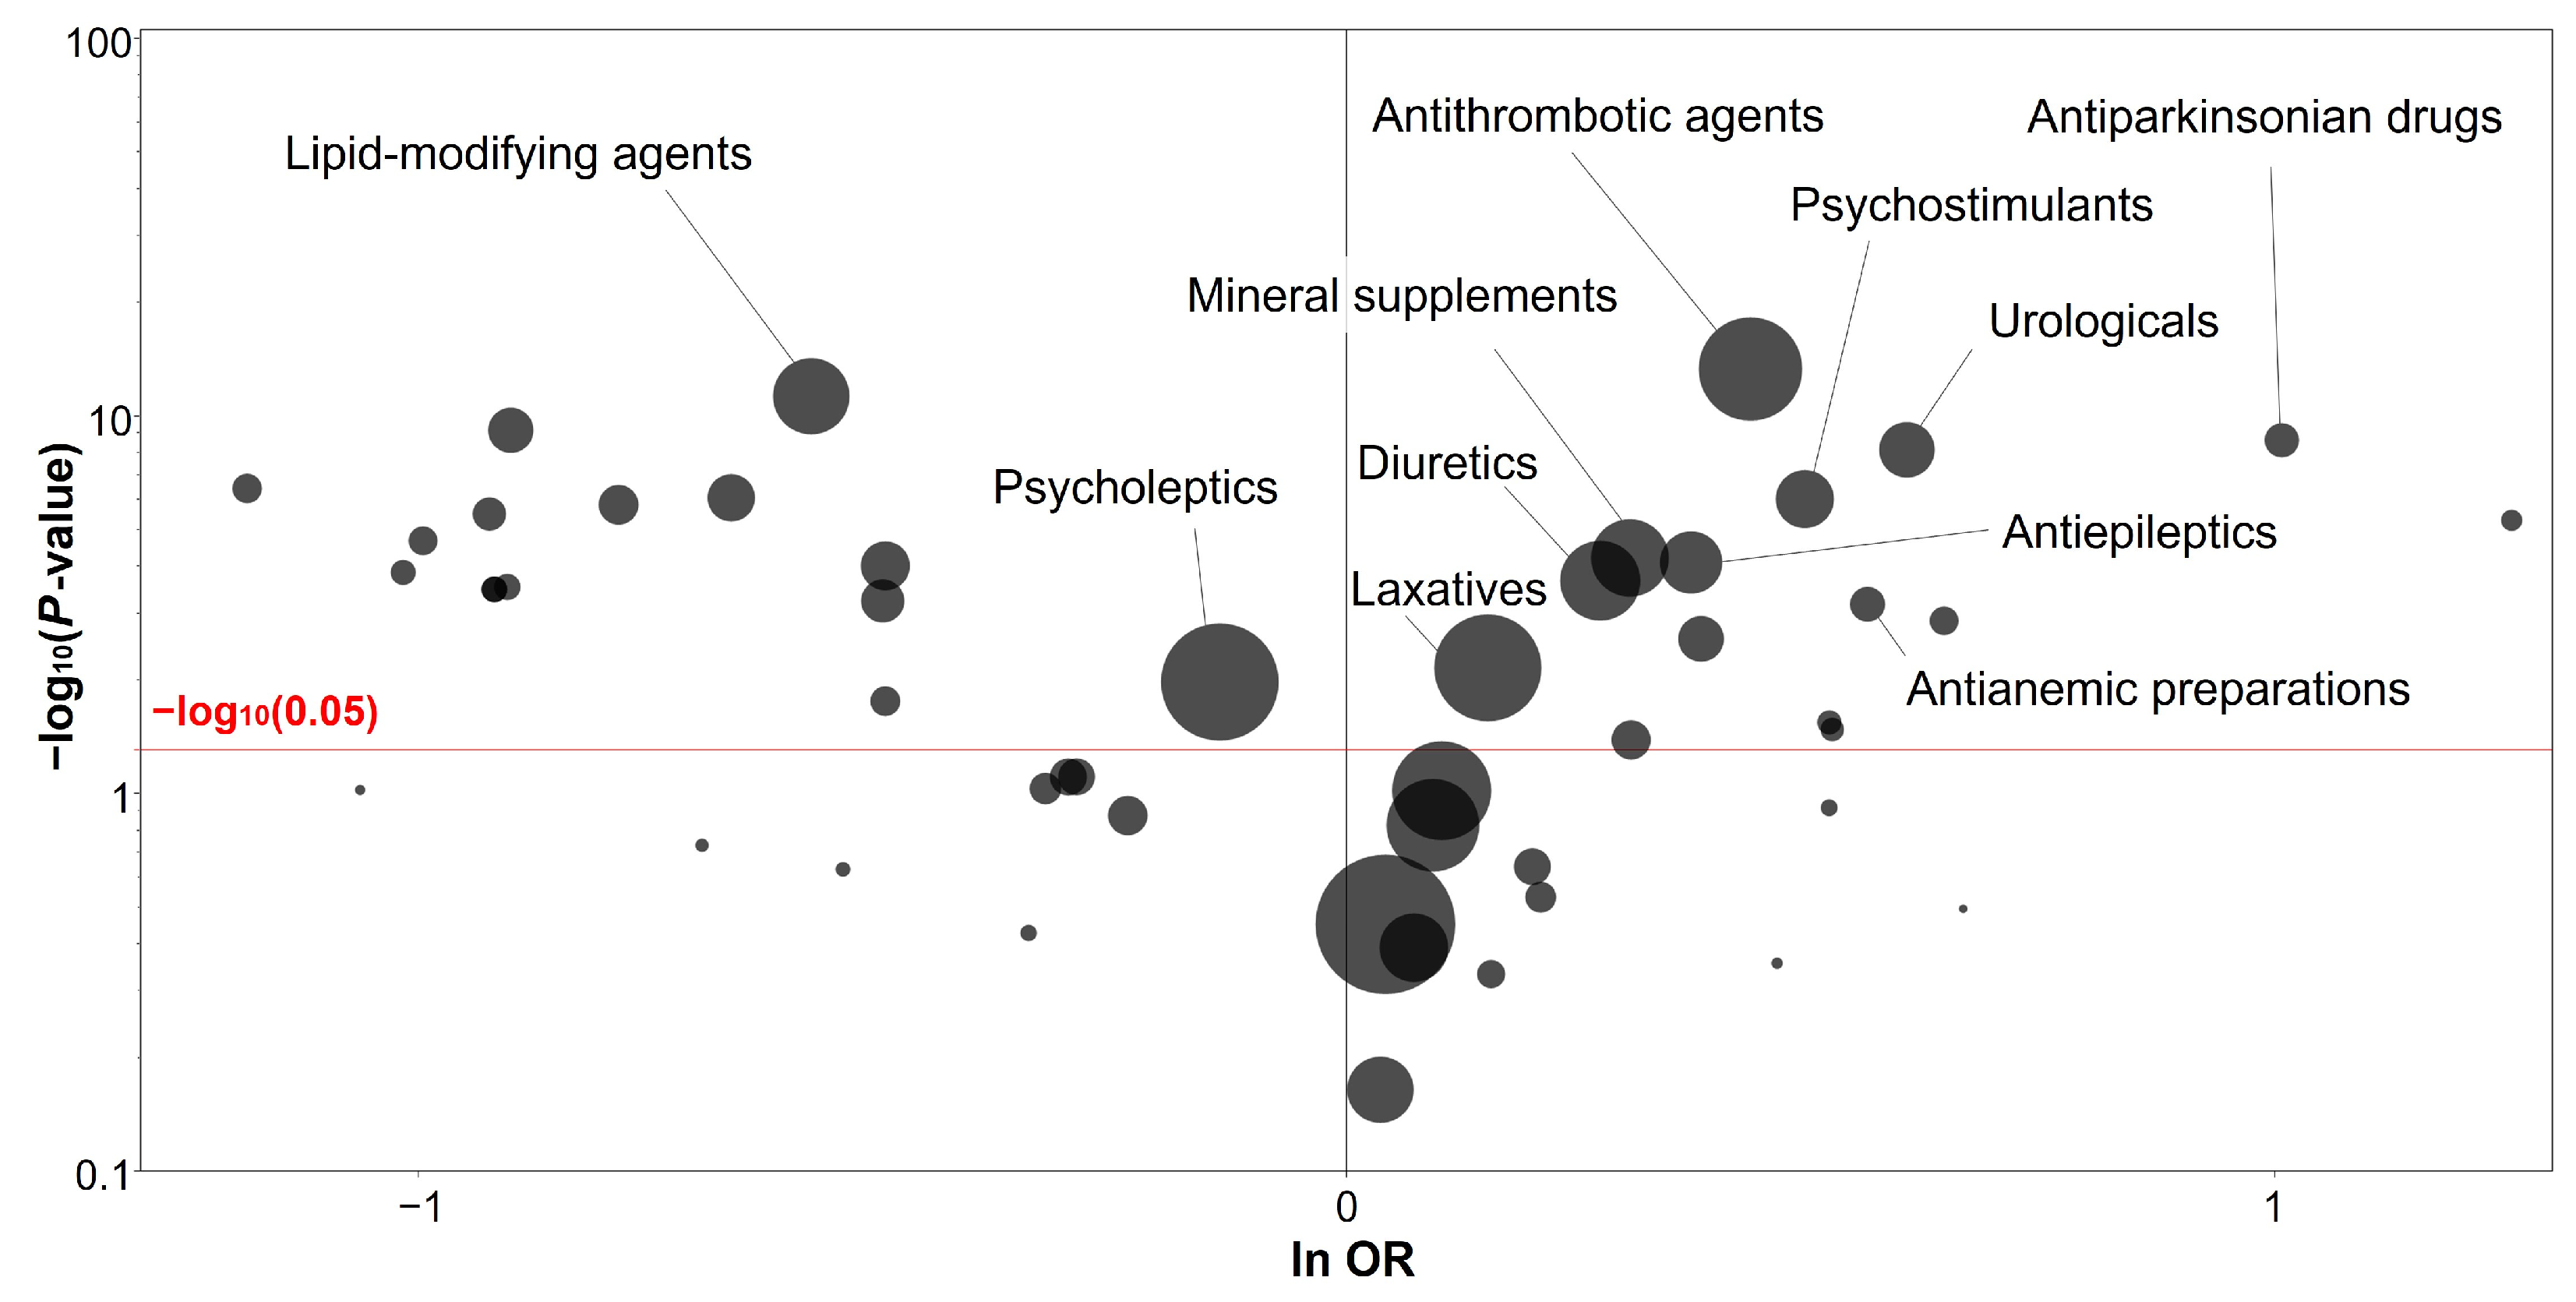
The volcano plot is a visualization tool commonly used in bioinformatics studies, such as gene expression analysis [21]. To visually illustrate the risk trends of drug groups, we constructed a volcano plot using the natural logarithm of the OR (ln[OR]) and the negative base-10 logarithm of the p-value (−log10[p-value]). Drug groups with ln(OR) > 0, −log10(p-value) > 3, and ≥100 prescriptions during the study period were considered highly associated with frailty risk (high signal).
2.5. Multivariate Analysis
We performed multivariate analysis to identify independent risk factors for frailty. Logistic regression analysis was performed with frailty risk (present/absent) as the dependent variable. Explanatory variables were selected a priori based on the following criteria: patient background factors demonstrating a statistically significant association with frailty risk in the bivariate analysis (p < 0.05) and drug groups identified as high signal in the volcano plot analysis (ln(OR) > 0, −log10p-value > 3, and ≥100 prescriptions during the study period). Based on these criteria, sex, age, and BMI were included as patient background variables, whereas eight drug groups were included as medication-related variables. Cases with missing BMI values were excluded from the multivariate analysis.
2.6. Statistical Analysis
All statistical analyses were performed using JMP Pro 18 software (SAS Institute Inc., Cary, NC, USA). p-values < 0.05 were considered statistically significant. In all bivariate analyses, the dependent variable was frailty risk (present/absent). The unpaired t-test the continuous and Fisher’s exact test were used for continuous and nominal explanatory variables, respectively. The results of bivariate analyses using continuous variables were expressed as mean ± standard deviation. For the multivariate analysis, nominal logistic regression analysis was performed using frailty risk (present/absent) as the dependent variable. ORs and 95% confidence intervals (CIs) were calculated to identify independent risk factors. Multicollinearity was assessed using pairwise correlations. Spearman’s rank correlation coefficient > 0.9 was considered indicative of high correlation, prompting variable selection adjustment.
3. Results
3.1. Analysis Table
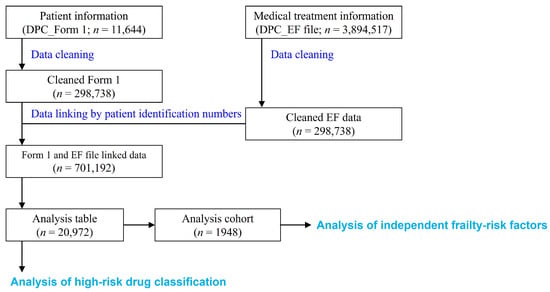
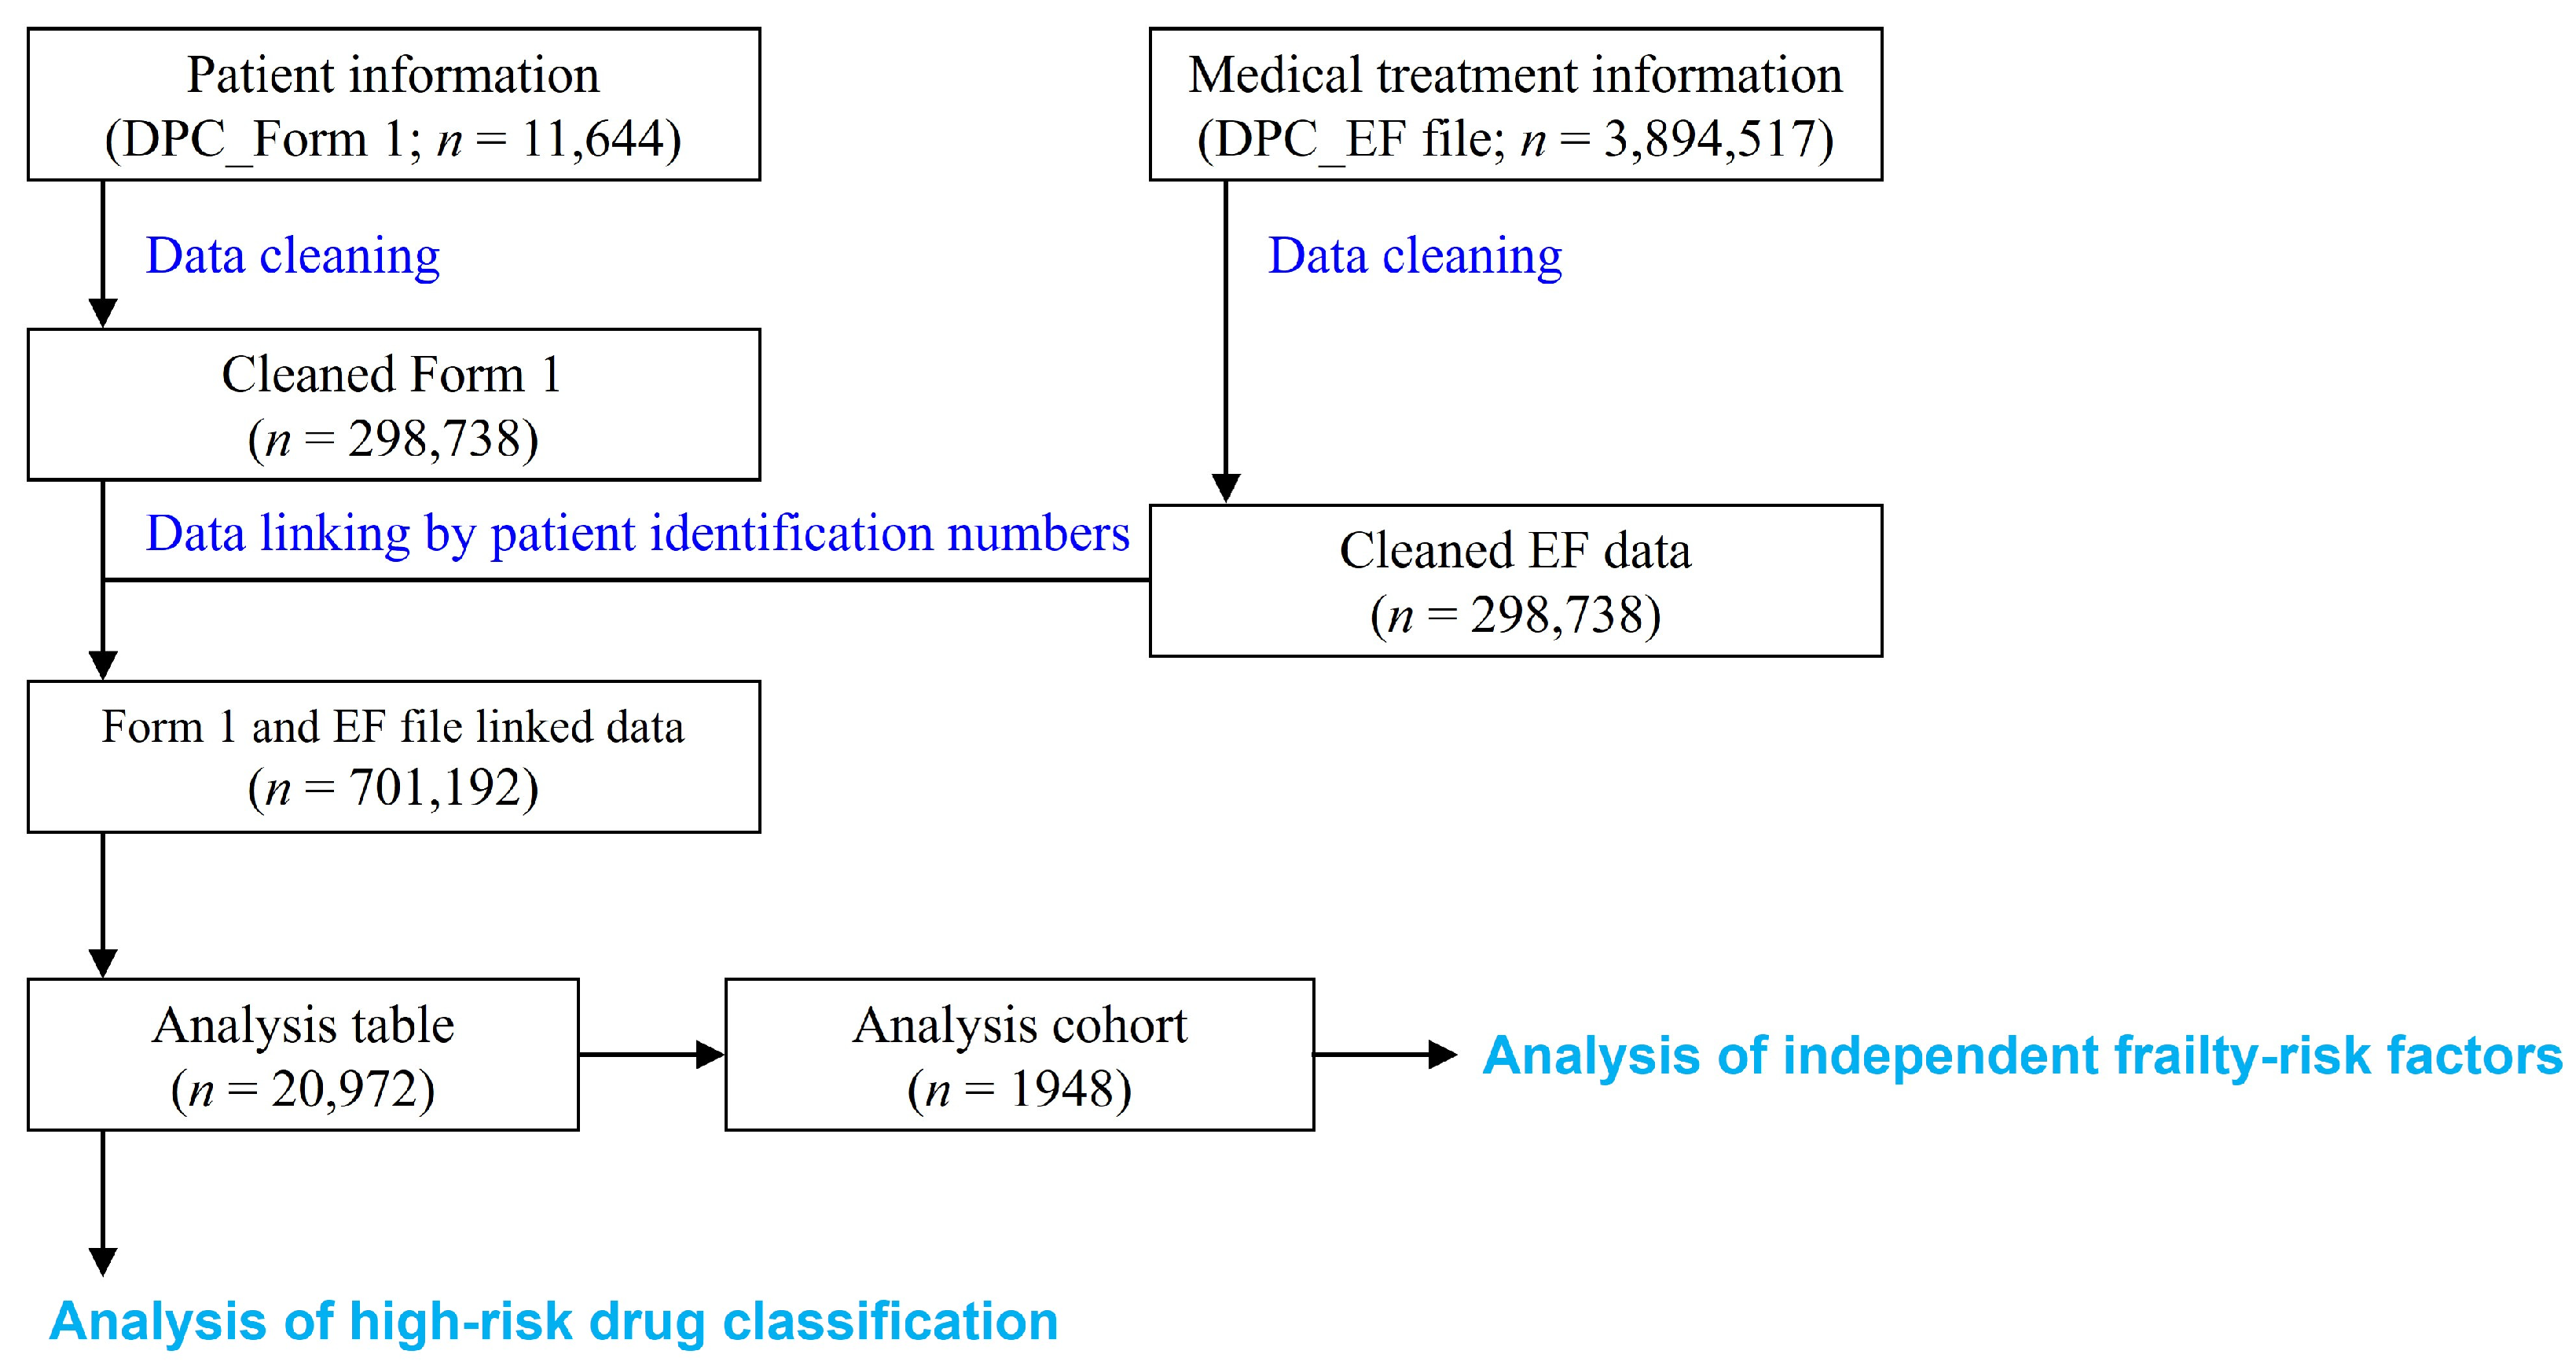
There were 11,644 Form 1 submissions during the study period. After removing duplicate records, 10,004 hospitalizations remained. The number of unique patients was 7245. There were 3,894,517 entries in the EF files for the same period. After extracting only medication information, linking drug names based on ATC classification, and removing duplicates, 298,738 entries remained (7029 patients). Linking the cleaned Form 1 and EF data using patient identification numbers yielded 701,192 records (6032 patients). Filtering for patients aged ≥65 years with oral medication prescriptions or medications brought in at admission yielded 20,972 records (1658 patients) for the analysis table. Subsequently, these records were consolidated by grouping each patient according to frailty risk status (1 or 0). For patients with multiple admissions during the study period, each admission was considered an independent case. This consolidation process resulted in a final analysis cohort of 1948 records (1658 patients) (Figure 1).
Figure 1.
Data analysis flowchart for this study. DPC Form 1 and EF files were extracted from the DPC database. After cleaning each file, they were linked using encrypted patient identification numbers to create a combined data analysis table, from which patients aged ≥65 years with oral medication prescriptions or medications brought in on the first day of admission were extracted (20,972 records; 1658 patients). Subsequently, these records were consolidated by grouping each patient according to frailty risk status (1 or 0). Patients with multiple admissions were treated as independent cases, resulting in a final analysis cohort of 1948 records (1658 patients). n indicates the number of data records.
3.2. Frailty Risk and Patient Information
After removing duplicate patients across multiple drug classifications, the final analysis cohort comprised 1948 records, of which 888 (45.6%) met at least three of the four items selected from the PRISMA-7 criteria and were subsequently classified into the frailty risk group. Bivariate analysis revealed significant differences in sex, age, and BMI (Table 2). The frailty risk group had a significantly higher proportion of males, older patients, and patients with a lower BMI. Furthermore, 979 fall events occurred in the frailty risk group during hospitalization, which was significantly higher than that in the non-frailty risk group (p < 0.0001, OR: 2.88 [95% CI: 2.18–3.82]).
Table 2.
Results of the univariate analysis of patient characteristics.
3.3. Association Between Frailty Risk and Drug Groups
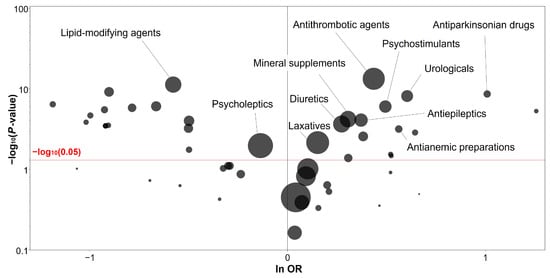
The association between frailty risk and ATC Level 2 classifications of oral medications prescribed during hospitalization or brought in at admission was comprehensively analyzed. Eight drug groups showed high signals (ln[OR] > 0, −log10[p-value] > 3, and ≥100 prescriptions in the category): antiparkinsonian drugs, urologicals, antianemic preparations, psychostimulants, antithrombotic agents, antiepileptics, mineral supplements, and diuretics. Figure 2 shows a volcano plot visualizing the bivariate analysis results. Drug categories located in the upper-right region of the volcano plot were considered to have a strong association with frailty risk.
Figure 2.
Drug classification associated with frailty risk. Although systemic antiviral drugs had an ln(OR) > 0 and a −log10p-value > 3, there were only 55 prescriptions, so this category was not considered high signal. Volcano plot showing the association between drug groups (ATC Level 2 classification) and frailty risk. Y-axis: negative common logarithm of the p-value (−log10p-value) based on Fisher’s exact test for each drug category. X-axis: natural logarithm of the odds ratio (ln(OR)). Bubble size represents the number of prescriptions per drug category, with larger sizes indicating a higher reported frequency. The red line on the Y-axis indicates p = 0.05; drug classes positioned above this line show a statistically significant association with frailty risk. Drug groups plotted in the upper-right region (first quadrant) show a robust association with frailty risk.
3.4. Independent Risk Factors for Frailty Risk
Logistic regression analysis (dependent variable, frailty risk; explanatory variables, characteristics identified as significant in the patient information analysis and drug classes with high signals) showed that low BMI (OR: 0.92 [95% CI: 0.89–0.95]), antithrombotics (OR: 1.60 [95% CI: 1.21–2.13]), antiepileptics (OR: 2.01 [95% CI: 1.29–3.12]), mineral supplements (OR: 1.68 [95% CI: 1.18–2.38]), and antiparkinsonian drugs (OR: 2.08 [95% CI: 1.00–4.31]) were significantly associated with frailty risk (Table 3). Advanced age (OR: 1.23 [95% CI: 1.20–1.26]) and male sex (OR: 11.92 [95% CI: 8.76–16.23]) also showed significant associations; however, these findings should be interpreted cautiously because these variables were included as components of the modified frailty-risk definition. Multicollinearity was not detected among the explanatory variables. The maximum Spearman’s rank correlation coefficient between any two variables was ρ = 0.16 (BMI and sex), which was well below the predefined threshold of 0.9.
Table 3.
Results of a multiple logistic regression.
4. Discussion
This exploratory, retrospective single-center study used DPC data collected at admission to investigate patient background characteristics and medication groups associated with frailty risk at a single institution. DPC data are collected and accumulated at many medical institutions in Japan, providing a valuable data source for comprehensively evaluating factors associated with patient QOL. The number of cases obtained during the 2-year study period was adequate to conduct the planned analyses. Globally, studies using hospital discharge data are common [22], and analyses using DPC data are increasingly being conducted in Japan [23]. DPC data, which contain detailed information on acute-phase severity and clinical interventions, are well suited for evaluating treatment effects and conducting quasi-experimental studies [15,23,24]. Thus, DPC data obtained during hospitalization are helpful for analyzing patient characteristics and adverse events. Our findings may provide a foundation for the future development of frailty risk estimation models in clinical practice and for the implementation of preventive measures for adverse in-hospital events.
To assess frailty, we used only four items from the PRISMA-7 index that were obtainable from DPC data (i.e., age, sex, ADL, and mobility) and defined frailty risk as meeting at least three criteria. Although such item restriction is a limitation, applying this approach to a high-severity inpatient population may represent a rigorous risk assessment. Furthermore, because DPC data are collected at admission, screening at this time facilitates the early identification of frailty risk during the hospitalization period. This provides healthcare professionals with potentially useful information for considering early intervention. Our study revealed a significantly higher frequency of falls during hospitalization in the frailty risk group than in the non-frailty risk group (p < 0.0001). This finding supports the clinical validity of our frailty risk group definition, strengthening the reliability of our frailty assessment approach. Frail older adults have been reported to have a high risk of falls due to underlying physical function decline and cognitive impairment [25], consistent with our findings. Therefore, the results of our frailty risk group assessment may serve as a practical indicator for identifying patients at risk of adverse events during hospitalization.
Low BMI was associated with frailty risk in the logistic regression analysis. Advanced age and male sex also showed significant associations; however, these findings should be interpreted cautiously because these variables were included as components of the modified frailty-risk definition. Although the observed association with male sex may have been influenced by its inclusion in the frailty-risk definition, large-scale cohort studies have consistently reported a higher prevalence of frailty and prefrailty in women [26]. However, men with comparable frailty levels face higher risks of mortality and more severe outcomes than women, reflecting the male–female health–survival paradox, in which men experience more rapid deterioration once frailty develops. Furthermore, because our study population was restricted to patients requiring hospitalization, these characteristics may have collectively contributed to the identification of male sex as a risk factor [26]. Because our cohort was restricted to hospitalized patients aged ≥65 years, the observed association with male sex may have been influenced by the characteristics of this specific population. Furthermore, we used hospital data from a single region in Japan, which may have been influenced by regional characteristics and the local healthcare system. In particular, facility-specific prescribing practices may have influenced our findings. For example, at our institution, antithrombotic agents are frequently prescribed on the first day of hospitalization for neurosurgical procedures, which may partly explain the observed association between antithrombotic use and frailty risk. Accordingly, such differences must be considered in addition to general risk factors when assessing frailty risk in hospitalized patients. Analyses specific to a particular hospital reflect that facility’s unique patient background and clinical care system, making them valuable when developing in-hospital frailty prediction and intervention strategies. The patients in our study were aged ≥65 years, and advanced age was significantly associated with the modified frailty-risk definition (p < 0.0001). The increasing prevalence of frailty with age is well established [3], which supports our findings.
However, both male sex and age (≥85 years) were included as components of the modified PRISMA-7 criteria used to define frailty risk in this study. This overlap between the frailty definition and explanatory variables raises the possibility of circularity bias. In particular, the notably high OR for male sex (11.92) may partly reflect this structural issue, as male sex is included both as a defining component of the modified PRISMA-7 criteria and as an independent predictor in the regression model. Although age was entered as a continuous variable in the regression analysis, limiting the degree of overlap with the binary threshold (≥85 years) used in the frailty definition, partial circularity cannot be excluded. Therefore, these findings should be interpreted cautiously. We also considered excluding these variables from the frailty definition to eliminate circularity bias. However, this approach would have left only ADL dependence and mobility impairment as the defining criteria, substantially compromising the clinical utility of frailty screening using DPC data at admission. Therefore, this study is best regarded as a proof of concept demonstrating the potential of admission-based DPC data for frailty risk estimation. Furthermore, future studies incorporating objective measures independent of age and sex, such as nutritional status, grip strength, and cognitive function, are warranted.
Our study identified low BMI, but not high BMI, as an independent risk factor for frailty. However, a U-shaped relationship between BMI and frailty has been reported, suggesting an increased risk of frailty in individuals with both low and high BMIs [26]. Furthermore, a longitudinal analysis of the same cohort revealed that frailty was associated with prolonged survival with disability in the high-BMI group, suggesting that the combination of BMI and frailty modifies lifespan [27]. In our study, high BMI was not identified as a frailty risk factor, likely because the study population comprised hospitalized patients, potentially reflecting weight loss due to acute illness or changes in nutritional status. Additionally, the relatively low proportion of Japanese older adults with a high BMI may have limited statistical power.
A systematic review suggested that central nervous system–active drugs and anticholinergic drugs promote frailty through reduced muscle strength (increasing fall risk) and cognitive decline. Moreover, the review confirmed that the number of medications taken by an individual (polypharmacy) was an independent risk factor for frailty [28]. The ATC drug groups identified as independent frailty risk factors in our study included antiparkinsonian drugs, antiepileptics, antithrombotic agents, and mineral supplements. In the aforementioned review, antiepileptics were included in the central nervous system–active drug category, supporting our finding that they were risk factors for frailty. Sousa-Fraguas et al. reported no significant association between antiparkinsonian drug use and frailty [29]. However, people with Parkinson’s disease exhibit cognitive decline, motor dysfunction, and a high risk of falls, all of which promote frailty progression [29]. Considering these findings, our identification of Parkinson’s disease medications as a frailty risk factor is likely attributable to indirect effects mediated by side effects or drug interactions rather than a direct effect of the medications themselves. These findings indicate that confounding by indication may partly explain the observed associations, as the conditions for which these medications are prescribed are themselves associated with functional decline and frailty progression.
Regarding antithrombotic drugs, no direct association with frailty has been reported. The association between antithrombotic agents and frailty risk may similarly reflect confounding by indication, as these drugs are commonly prescribed for patients with cardiovascular or cerebrovascular diseases, which are inherently associated with functional decline. At the facility in our study, antithrombotic drugs are frequently prescribed on the first day of hospitalization for neurosurgical procedures, and this facility-specific practice may have influenced our results. Regarding the identification of mineral supplements as a risk factor, a detailed analysis revealed that most were magnesium preparations. Magnesium preparations are commonly used as laxatives and are prescribed for patients with constipation or reduced intestinal motility. Therefore, patients receiving magnesium preparations are likely to have underlying decreased intestinal motility. Reduced intestinal motility can contribute to the progression of frailty through its effects on nutritional status and physical activity. Research on the association between frailty and reduced intestinal motility is ongoing, and the relationship is still considered hypothetical without definitive conclusions [30]. Liu et al. reported that the association between constipation and frailty was not significant after multivariate adjustment [31]. Thus, the association between magnesium supplements and frailty observed in our study may reflect an indirect effect of reduced intestinal motility or the likelihood that long-term use leads to hypermagnesemia, causing symptoms such as weakness and somnolence, which increase the risk of frailty through functional decline. However, in Japan, magnesium supplements are frequently prescribed for various conditions, making it difficult to assess their specific effects on frailty at this time.
Our study has several limitations. First, the data were limited to DPC data (Form 1 and EF files) from a single institution, restricting external validity. The findings may reflect characteristics specific to the hospital’s inpatient population, including institution-specific prescribing practices and regional patient demographics, rather than national or international trends. Multicenter studies across diverse institutions and regions are warranted to validate and enhance the generalizability of our findings. Second, we only used four items from PRISMA-7 to evaluate frailty risk. Although simple and practical for screening, this approach has limitations as a proxy measure and may not directly reflect clinical frailty. Furthermore, the inclusion of male sex as one of the PRISMA-7 risk items may have influenced our findings. Furthermore, both male sex and age (≥85 years) were included as components of the frailty definition and were used as explanatory variables in the regression model, raising the possibility of circularity bias. In particular, the markedly elevated OR for male sex (11.92) may partly reflect this structural issue and should be interpreted cautiously. Although age was entered as a continuous variable, thereby limiting the degree of overlap with the binary threshold (≥85 years) used in the frailty definition, a partial circularity cannot be excluded. To eliminate circularity bias, these variables were excluded from the frailty definition; however, doing so would have left only ADL dependence and mobility impairment as defining criteria, markedly compromising the clinical utility of frailty screening using admission-based DPC data. Therefore, a sensitivity analysis was deemed inappropriate, and future studies are warranted to develop definitions of frailty incorporating objective measures independent of age and sex. Third, owing to its retrospective and observational design, this study cannot establish a definitive causal relationship between medication use and frailty. In other words, it cannot determine whether medications contributed to frailty or whether specific medications were preferentially prescribed to patients with frailty-related tendencies. Furthermore, confounding by indication cannot be excluded, as the observed associations between certain medication classes and frailty risk may reflect the severity of the underlying conditions for which they are prescribed rather than direct pharmacological effects on frailty. In addition, each admission was treated as an independent case for patients with multiple admissions, which may have introduced clustering effects and influenced the precision of the estimates. Therefore, this study is considered hypothesis-generating, exploratory research, and all findings should be interpreted within the context of its proof-of-concept nature.
The DPC database is a large-scale clinical database unique to Japan. As an exploratory, proof-of-concept study, this study is among the few reports demonstrating the feasibility of estimating frailty risk in hospitalized patients using DPC data. Although the clinical information provided by DPC data is limited, the database comprehensively collects nationwide standardized medical information, making it a valuable resource for frailty research. Furthermore, our demonstration of the potential utility of DPC data collected at admission for estimating frailty risk has important clinical implications for early screening and preventive interventions. Our findings may also serve as a basis for generating hypotheses in future research. Furthermore, prospective studies incorporating more detailed clinical information and functional assessments and studies directly evaluating frailty indicators are warranted to clarify the causal relationship between medications and frailty. In addition, the application of analytical approaches such as machine learning to develop frailty risk estimation models tailored to the characteristics of individual medical facilities may enable more accurate identification of at-risk patients. The use of such facility-specific models is expected to support the development of targeted countermeasures and preventive interventions aligned with the patient populations and clinical systems of each facility. Furthermore, future studies should consider developing separate models for individual predictors in addition to a combined model and exploring complex intervariable relationships using structural equation modeling to provide deeper insights into the mechanisms underlying frailty development.
Author Contributions
Conceptualization: Y.I., R.H. and T.T.; Data curation: R.H. and A.O.; Formal analysis: R.H. and T.T.; Funding acquisition: Y.I.; Investigation: R.H., T.S. (Tetuzi Suzuki), T.S. (Takashi Saita), T.O. and A.O.; Methodology: R.H. and T.T.; Project administration: Y.I.; Supervision: S.Y., M.K. and H.K.; Validation: R.H. and T.T.; Visualization: R.H. and T.T.; Writing—original draft: Y.I., R.H. and T.T.; Writing—review & editing: T.O., S.Y., M.K. and H.K. All authors have read and agreed to the published version of the manuscript.
Funding
This research received no external funding.
Institutional Review Board Statement
This study was performed in line with the principles of the Declaration of Helsinki. Approval was granted by the Ethics Committee of Shonantobu General Hospital (Date: 31 July 2023/No. 20230728-001).
Informed Consent Statement
Informed consent for participation is not required, as this was a retrospective study using anonymized data.
Data Availability Statement
Data are contained within the article.
Conflicts of Interest
The authors declare no conflicts of interest.
Abbreviations
The following abbreviations are used in this manuscript:
| ADL | Activities of daily living |
| ATC | Anatomical therapeutic chemical |
| BMI | Body mass index |
| DPC | Diagnosis procedure combination |
| OR | Odds ratio |
| QOL | Quality of life |
References
- Japan Statistical Yearbook. Available online: https://www.stat.go.jp/english/data/nenkan/index.html (accessed on 20 March 2026).
- Statistical Handbook of Japan. Available online: https://www.stat.go.jp/english/data/handbook/pdf/2024all.pdf (accessed on 20 March 2026).
- Clegg, A.; Young, J.; Iliffe, S.; Rikkert, M.O.; Rockwood, K. Frailty in Elderly People. Lancet 2013, 381, 752–762. [Google Scholar] [CrossRef] [Scilit]
- Kojima, G. Frailty as a Predictor of Future Falls among Community-Dwelling Older People: A Systematic Review and Meta-Analysis. J. Am. Med. Dir. Assoc. 2015, 16, 1027–1033. [Google Scholar] [CrossRef] [Scilit]
- Kojima, G. Frailty as a Predictor of Hospitalisation among Community-dwelling Older People: A Systematic Review and Meta-analysis. J. Epidemiol. Community Health 2016, 70, 722–729. [Google Scholar] [CrossRef] [Scilit]
- Kojima, G. Frailty as a Predictor of Fractures among Community-dwelling Older People: A Systematic Review and Meta-analysis. Bone 2016, 90, 116–122. [Google Scholar] [CrossRef] [Scilit]
- Kojima, G. Frailty as a Predictor of Disabilities among Community-dwelling Older People: A Systematic Review and Meta-analysis. Disabil. Rehabil. 2017, 39, 1897–1908. [Google Scholar] [CrossRef] [Scilit] [PubMed]
- Kojima, G. Frailty as a Predictor of Nursing Home Placement among Community-Dwelling Older Adults: A Systematic Review and Meta-analysis. J. Geriatr. Phys. Ther. 2018, 41, 42–48. [Google Scholar] [CrossRef] [Scilit] [PubMed]
- Kojima, G.; Iliffe, S.; Morris, R.W.; Taniguchi, Y.; Kendrick, D.; Skelton, D.A.; Masud, T.; Bowling, A. Frailty Predicts Trajectories of Quality of Life Over Time among British Community-dwelling Older People. Qual. Life Res. 2016, 25, 1743–1750. [Google Scholar] [CrossRef] [Scilit] [PubMed]
- Kojima, G.; Taniguchi, Y.; Iliffe, S.; Walters, K. Frailty as a Predictor of Alzheimer Disease, Vascular Dementia, and All Dementia Among Community-Dwelling Older People: A Systematic Review and Meta-Analysis. J. Am. Med. Dir. Assoc. 2016, 17, 881–888. [Google Scholar] [CrossRef] [Scilit]
- Gilbert, T.; Neuburger, J.; Kraindler, J.; Keeble, E.; Smith, P.; Ariti, C.; Arora, S.; Street, A.; Parker, S.; Roberts, H.C.; et al. Development and Validation of a Hospital Frailty Risk Score Focusing on Older People in Acute Care Settings Using Electronic Hospital Records: An Observational Study. Lancet 2018, 391, 1775–1782. [Google Scholar] [CrossRef] [Scilit]
- Kim, D.H.; Schneeweiss, S.; Glynn, R.J.; Lipsitz, L.A.; Rockwood, K.; Avorn, J. Measuring Frailty in Medicare Data: Development and Validation of a Claims-Based Frailty Index. J. Gerontol. A Biol. Sci. Med. Sci. 2018, 73, 980–987. [Google Scholar] [CrossRef] [Scilit]
- Yuki, A.; Otsuka, R.; Tange, C.; Nishita, Y.; Tomida, M.; Ando, F.; Shimokata, H. Polypharmacy is Associated with Frailty in Japanese Community-dwelling Older Adults. Geriatr. Gerontol. Int. 2018, 18, 1497–1500. [Google Scholar] [CrossRef] [Scilit]
- Wyman-Chick, K.A.; Barrett, M.J.; Miller, M.J.; Sargent, L.; Chrenka, E.A.B.; Kane, J.P.M.; Crowley, S.J.; Kuntz, J.L.; Parashos, S.A.; Schousboe, J.T.; et al. The Relationship between Anticholinergic Burden and Frailty in the Year Preceding a Diagnosis of Dementia with Lewy Bodies. Alzheimer’s Dement. Diagn. Assess. Dis. Monit. 2024, 16, e70034. [Google Scholar] [CrossRef] [Scilit]
- Hayashida, K.; Murakami, G.; Matsuda, S.; Fushimi, K. History and Profile of Diagnosis Procedure Combination (DPC): Development of a Real Data Collection System for Acute Inpatient Care in Japan. J. Epidemiol. 2021, 31, 1–11. [Google Scholar] [CrossRef] [Scilit] [PubMed]
- Anatomical Therapeutic Chemical (ATC) Classification. Available online: https://www.who.int/tools/atc-ddd-toolkit/atc-classification (accessed on 20 March 2026).
- Fried, L.P.; Tangen, C.M.; Walston, J.; Newman, A.B.; Hirsch, C.; Gottdiener, J.; Seeman, T.; Tracy, R.; Kop, W.J.; Burke, G.; et al. Frailty in Older Adults: Evidence for a Phenotype. J. Gerontol. Ser. A Biol. Sci. Med. Sci. 2001, 56, 146–157. [Google Scholar] [CrossRef] [Scilit] [PubMed]
- Rockwood, K.; Song, X.; MacKnight, C.; Bergman, H.; Hogan, D.B.; McDowell, I.; Mitnitski, A. A Global Clinical Measure of Fitness and Frailty in Elderly People. Can. Med. Assoc. J. 2005, 173, 489–495. [Google Scholar] [CrossRef] [Scilit] [PubMed]
- Watanabe, D.; Yoshida, T.; Watanabe, Y.; Yamada, Y.; Miyachi, M.; Kimura, M. Validation of the Kihon Checklist and the Frailty Screening Index for Frailty Defined by the Phenotype Model in Older Japanese Adults. BMC Geriatr. 2022, 22, 478. [Google Scholar] [CrossRef] [Scilit]
- Higginbotham, O.; O’Neill, A.; Barry, L.; Leahy, A.; Robinson, K.; O’Connor, M.; Galvin, R. The Diagnostic and Predictive Accuracy of the PRISMA-7 Screening Tool for Frailty in Older Adults: A Systematic Review Protocol. HRB Open Res. 2020, 3, 26. [Google Scholar] [CrossRef] [Scilit]
- Kane, A.E.; Howlett, S.E. Sex Differences in Frailty: Comparisons between Humans and Preclinical Models. Mech. Ageing Dev. 2021, 198, 111546. [Google Scholar] [CrossRef] [Scilit]
- Nehra, M.S.; Ma, Y.; Clark, C.; Amarasingham, R.; Rockey, D.C.; Singal, A.G. Use of Administrative Claims Data for Identifying Patients with Cirrhosis. J. Clin. Gastroenterol. 2013, 47, e50–e54. [Google Scholar] [CrossRef] [Scilit]
- Fujinaga, J.; Fukuoka, T. A Review of Research Studies Using Data from the Administrative Claims Databases in Japan. Drugs-Real. World Outcomes 2022, 9, 543–550. [Google Scholar] [CrossRef] [Scilit]
- Tamiya, M.; Iwasawa, S.; Sasaki, Y.; Tajima, K.; Chiba, Y. A DPC Database Study on the Safety of Atezolizumab/Carboplatin/Etoposide in Extensive-Disease Small Cell Lung Cancer in Japanese Patients. Adv. Ther. 2024, 41, 3539–3556. [Google Scholar] [CrossRef] [Scilit] [PubMed]
- Makino, K.; Lee, S.; Bae, S.; Chiba, I.; Harada, K.; Katayama, O.; Shinkai, Y.; Makizako, H.; Shimada, H. Prospective Associations of Physical Frailty with Future Falls and Fear of Falling: A 48-Month Cohort Study. Phys. Ther. Rehabil. J. 2021, 101, pzab059. [Google Scholar] [CrossRef] [Scilit]
- Watanabe, D.; Yoshida, T.; Watanabe, Y.; Yamada, Y.; Kimura, M. A U-shaped Relationship between the Prevalence of Frailty and Body Mass Index in Community-dwelling Japanese Older Adults: The Kyoto–kameoka study. J. Clin. Med. 2020, 9, 1367. [Google Scholar] [CrossRef] [Scilit]
- Watanabe, D.; Yoshida, T.; Watanabe, Y.; Yamada, Y.; Kimura, M. Is a Higher Body Mass Index Associated with Longer Duration of Survival with Disability in Frail than in Non-frail Older Adults? Int. J. Obes. 2025, 49, 348–356. [Google Scholar] [CrossRef] [Scilit] [PubMed]
- Thanapluetiwong, S.; Chattaris, T.; Shi, S.M.; Park, C.M.; Sison, S.D.M.; Kim, D.H. Association between Drug Therapy and Risk of Incident Frailty: A Systematic Review. Ann. Geriatr. Med. Res. 2024, 28, 247–256. [Google Scholar] [CrossRef] [Scilit]
- Sousa-Fraguas, M.C.; Rodríguez-Fuentes, G.; Lastra-Barreira, D.; Conejo, N.M. Associations between Frailty and Cognitive Impairment in Parkinson’s Disease: A Cross-sectional Study. Aging Clin. Exp. Res. 2025, 37, 19. [Google Scholar] [CrossRef] [Scilit] [PubMed]
- Tenison, E.; Henderson, E.J. Multimorbidity and Frailty: Tackling Complexity in Parkinson’s Disease. J. Park. Dis. 2020, 10, S85–S91. [Google Scholar] [CrossRef] [Scilit]
- Liu, X.; Wang, Y.; Shen, L.; Sun, Y.; Zeng, B.; Zhu, B.; Dai, F. Association between Frailty and Chronic Constipation and Chronic Diarrhea among American Older Adults: National Health and Nutrition Examination Survey. BMC Geriatr. 2023, 23, 745. [Google Scholar] [CrossRef] [Scilit]

Disclaimer/Publisher’s Note: The statements, opinions and data contained in all publications are solely those of the individual author(s) and contributor(s) and not of MDPI and/or the editor(s). MDPI and/or the editor(s) disclaim responsibility for any injury to people or property resulting from any ideas, methods, instructions or products referred to in the content. |
© 2026 by the authors. Licensee MDPI, Basel, Switzerland. This article is an open access article distributed under the terms and conditions of the Creative Commons Attribution (CC BY) license.