


Abstract
Growing concerns about tebuconazole pollution in the aquatic ecosystem have spurred the development of clean technologies. Tomato stem biochar (TBC) has shown great potential for environmental remediation. However, information on the removal of tebuconazole by TBC remains scarce. Herein, TBCs were prepared at 300–600 °C by oxygen-limited pyrolysis to assess the effect of pyrolysis temperature on properties of TBC, and to evaluate the adsorption capacity of TBC for tebuconazole. Results showed that TBC was a mesoporous material with an average pore size of 4.7–15.1 nm. The amount of tebuconazole adsorbed by TBCs decreased with the increase in pyrolysis temperatures, the biochar produced at a low temperature of 300 °C (TBC300) had the greatest adsorption capacity for tebuconazole with the highest initial adsorption rate. The adsorption kinetics and isotherm of tebuconazole on TBC300 were better described by the pseudo-second-order and Langmuir models, respectively. The chemisorption primarily governed the adsorption process, and hydrogen bonding and π–π interactions mainly involved adsorption. Our results suggest that TBC300 may strike a good balance between preservation of functional groups and development of porous structures that favor the adsorption of tebuconazole, making it an attractive adsorbent material for tebuconazole removal and a sustainable valorization approach for reusing tomato waste resources.
1. Introduction
Pesticides have played a major role in controlling crop diseases, insect pests, and weeds. Because of the intensive and widespread application, pesticides will inevitably disperse into the environment through various pathways, such as surface runoff and subsurface leaching, posing potential threats to human health and ecosystems [1].
Tebuconazole, a broad-spectrum triazole fungicide, has been commonly applied on diverse crops globally [2]. It was easily absorbed by soil particles and mainly concentrated in the topsoil layer due to its medium-to-high lipophilicity [3,4]. Its persistence in soil increased with increasing dose rates with a half-life of 43–170 days [5,6], sometimes even up to 263 days under certain conditions [7]. It was also one of the most detected pesticides in aquatic ecosystems with typical concentrations ranging from ng·L−1 to μg·L−1 [8], and some detected concentrations in streams, wastewaters and lakes exceeded the EU’s limit [3]. The toxicological risk to non-target organisms of tebuconazole present in the soil and water environment has raised great ecological concerns. Many studies have suggested that tebuconazole has a significant ecotoxicological impact on the abundance of all prokaryotic and functional microbial groups in soil [6], and could produce endocrine-disrupting effects on aquatic organisms at environmental doses [9]. Moreover, tebuconazole can also promote the selection of resistant fungal populations, posing a threat to food security and ecosystem stability [10]. In this scenario, effective approaches were urgently required to remove tebuconazole residue from the environment.
To address this problem, various eliminating technologies, including physical adsorption [11], catalytic oxidation [12], microbial degradation [13], and phytoremediation [14], have been extensively studied. Among these, biochar stands out as an economical and eco-friendly alternative for the mitigation of pesticide risks in soil and water owing to its superior adsorption performance and high stability [15,16]. More attractively, biochar production and application in environmental remediation presents a promising avenue to achieve dual benefits of waste resource optimization and environmental quality improvement. “From waste to wealth” is the most prominent advantage of using biochar to remove pesticide residues from the environment.
Tomato (Solanum lycopersicum L.) is a widely cultivated and economically important vegetable crop worldwide [17]. According to recent data from FAOSTAT, world tomato production reached 188.5 million tons in 2024, showing a continuously increasing trend from 1961. Along with the increase in production, a large amount of organic agricultural waste was generated. The improper disposal of tomato waste, such as burning after being sun-dried, has led to environmental and visual pollution [18]. Therefore, utilizing this biomass is vital for minimizing its environmental impact and improving the economic sustainability of tomato production within a circular economy framework [19,20]. The tomato stem contains lignin, cellulose, and hemicellulose, making it a suitable biochar feedstock, and the specific energy consumption of biochar preparation increases with increasing pyrolysis temperature and duration [18]. Llorach-Massana et al. (2017) [21] analyzed the technical and environmental feasibility of using tomato plant waste to produce biochar for sequester carbon, and pointed out that low pyrolysis temperatures (350–400 °C), yields above 40%, and 50% carbon stabilization would be required. Moreover, this study found a salient advantage of this waste as a biochar feedstock, namely its low content of heavy metals, which are potentially toxic metals, meaning that applications of the biochar prepared from these wastes would be safe under current European Certification. Additionally, biochar prepared from tomato green waste can be used as a substrate for soilless and hydroponic tomato production, providing a sustainable solution for waste management based on the concept of creating a closed-loop system [20]. Using tomato harvest waste (leaves and stems) as feedstock, biochar prepared at 500 °C for 4 h significantly reduced cumulative soil CO2 emissions when mixed with soil [18]. Biochar obtained from tomato stems at 500 °C for 4 h could be used as a sustainable filler in poly(lactic acid) composites for 3D printing [22]. In addition, tomato processing waste has also been used as precursor material. Biochar obtained from tomato skin displayed comparable adsorption capacity of paracetamol and ciprofloxacin relative to similar materials derived from agricultural waste [23,24]. Therefore, the production of biochar is an environmentally beneficial alternative to tomato waste management practices, and biochar exhibits great potential for various environmental applications and the circular economy.
Overall, the few initial studies to date generally indicate that biochar from tomato waste shows promise as a soil amendment for improving soil structure, fertility and water retention and for reducing soil CO2 emission [18,21], as an adsorbent for removing pharmaceutical and antibiotic pollutants from wastewater [23,24], as a soilless substrate for hydroponic tomato production [20], and as a filler in polymer composites for 3D printing [22,25]. In particular, biochar’s application in environmental remediation has increasingly attracted attention. Yet, to our knowledge, no report has been published regarding the utilization of tomato stem biochar (TBC) in removing pesticide pollutants, and the capacity and underlying mechanisms of tebuconazole adsorption by TBC remain unclear.
In the present study, TBCs were prepared at four pyrolysis temperatures of 300, 400, 500, and 600 °C, and the effects of pyrolysis temperature on the physicochemical properties of the obtained biochar were assessed. Finally, the adsorption performance and mechanism of the biochar for tebuconazole were evaluated.
2. Materials and Methods
2.1. Materials and Chemicals
The feedstock of biochar, tomato stem, was obtained from the greenhouse at Beijing Academy of Agriculture and Forestry Sciences, Beijing, China.
All reagents used in the present study were of analytical grade. Tebuconazole (purity > 99%) was purchased from ANPEL Laboratory Technologies Inc. (Shanghai, China).
2.2. Preparation and Characterization of Biochar
2.2.1. Preparation of Biochar
The collected tomato stems were thoroughly rinsed with deionized water and then oven-dried at 80 °C to a constant weight. The dried stems were cut into 3–5 cm segments. The weighed segments were placed in a muffle furnace and then N2 was introduced until the furnace cavity was fully filled to maintain an oxygen-limited environment. The pyrolysis was programmed to drive temperature to 300, 400, 500, and 600 °C at a heating rate of 10 °C·min−1, and the peak temperature was held for 4 h; then, the furnace was cooled naturally to room temperature. Based on the pyrolysis temperature, the biochars were labeled as TBC300, TBC400, TBC500, and TBC600, respectively.
All biochar samples were washed with distilled water until the elute was nearly neutral and then dried in the oven at 60 °C, and then weighed and ground to pass through a 300-mesh sieve prior to further use.
2.2.2. Characterization of Biochar
The TBC yield was calculated according to Equation (1).
η (%): the biochar yield;
m (g): the mass of the obtained biochar;
mo (g): the mass of the dried tomato stem feedstock.
The elemental contents of C, O, H, N, and S were measured by an elemental analyzer (Vario EL cube, Elementar, Langenselbold, Germany). The elemental composition was then used to calculate the molar element ratios H/C, O/C, and (O + N)/C. The pore structures and specific surface area (SSA) of the biochar samples were investigated through BET (Micromeritics 3Flex, Norcross, GA, USA) analyses based on measured N2 adsorption–desorption isotherms. Fourier-transform infrared spectra (FTIR) were utilized to depict the changes in the surface functional groups of the biochar before and after adsorption, covering a wavenumber range of 400–4000 cm−1. The evolution of oxygen-containing groups in TBC was analyzed by X-ray photoelectron spectroscopy (XPS, Thermo Scientific Escalab 250Xi, Waltham, MA, USA). In addition, the pH at the point of zero charge (pHpzc) of TBCs was determined using a solid addition method.
2.3. Adsorption Experiments
2.3.1. Adsorption Kinetics Experiment
Each 100 mL centrifuge tube contained 50 mL solution including tebuconazole (initial concentration: 10 mg·L−1), 100 mg of biochar, and Proclin 300 (10 μg·mL−1) used as the bacteriostatic agent to eliminate the degrading effect of the microbes [26]. The tube was placed in a thermostatic shaker protected from light, operating at 180 rpm and 25 ± 2 °C.
At 0.25, 0.5, 1, 2, 4, 6, 12, and 24 h, solution samples were collected. The biochar was separated by centrifugation (4000 rpm, 15 min). The supernatant was then filtered through a 0.22 μm filter membrane, and the filtrate was collected in 2 mL sample vials and stored at −4 °C prior to analysis. The treatment without biochar addition was set as the control. All experiments were performed in triplicate.
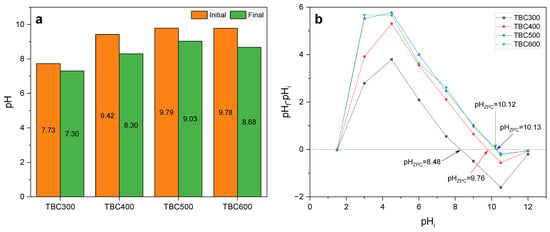
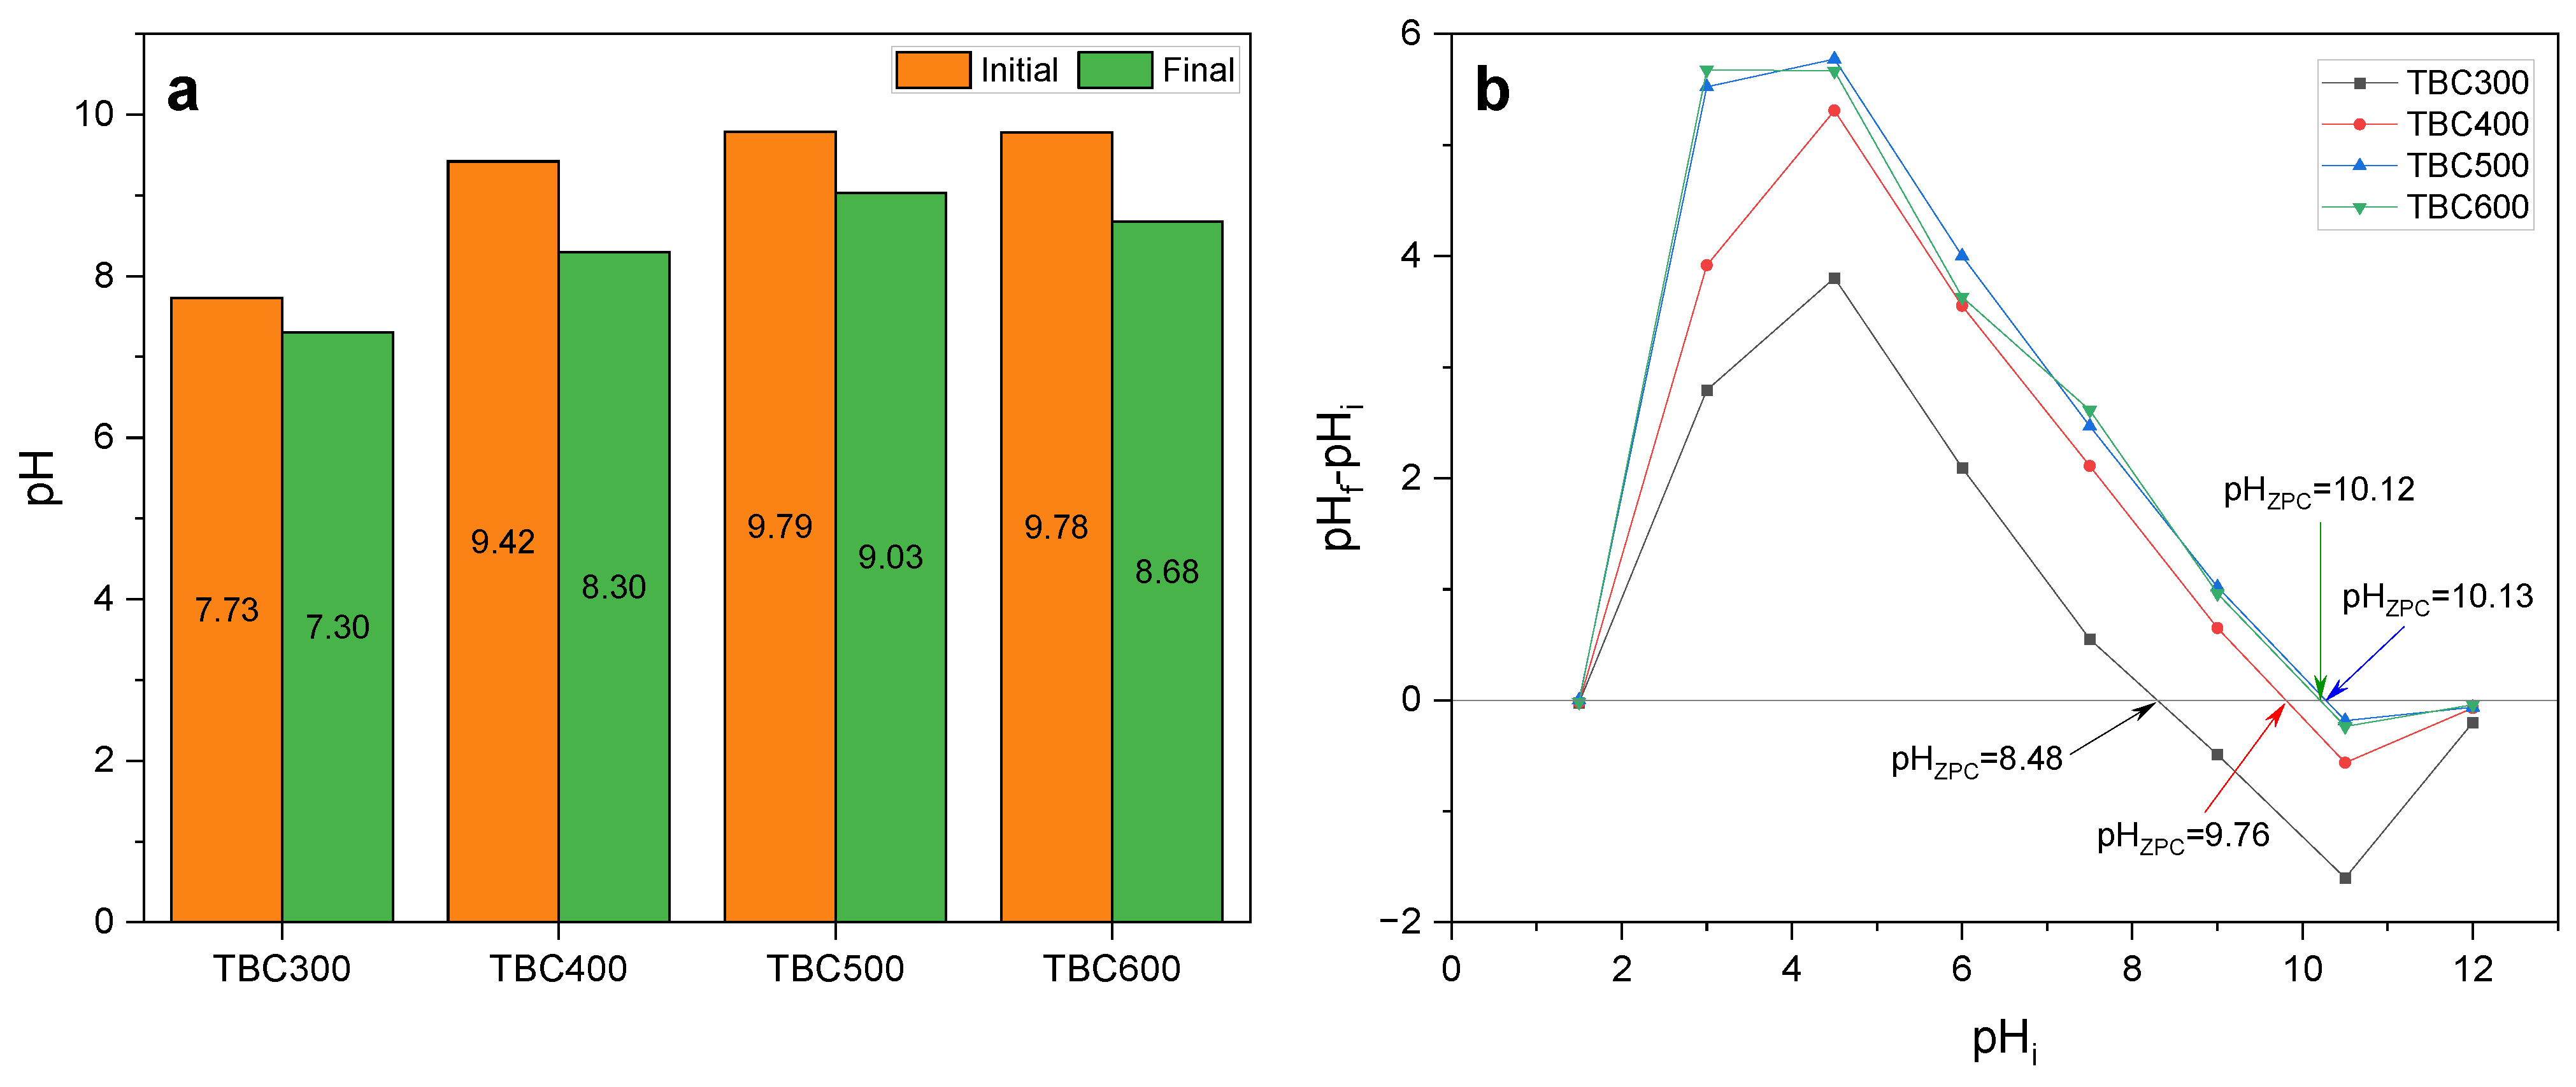
The adsorption kinetic data were fitted using the pseudo-first-order (PFO, Equation (2)), pseudo-second-order (PSO, Equation (3)), Elovich (Equation (4)), and intraparticle diffusion (IPD, Equation (5)) models [27]. The initial and final pH values of the experimental systems were 7.73–9.79 and 7.30–9.03, respectively (Figure 1a).
Figure 1.
(a) The initial and final pH values of the adsorption kinetic experimental systems and (b) pHpzc of TBCs.
qt (mg·g−1): the adsorption amount towards tebuconazole at time t;
qe (mg·g−1): the adsorption amount towards tebuconazole at equilibrium;
k1 (h−1): the rate constant of the PFO model;
k2 [g·(mg·h)−1]: the rate constant of the PSO model;
α [mg·(g·h)−1]: the initial adsorption rate for the Elovich model;
β (g·mg−1): Elovich parameters related to the surface coverage and activation energy;
kp [mg (g·h0.5)−1]: the ion diffusion constant of the IPD model;
C: the boundary layer parameter, which reflects the thickness of the boundary layer.
2.3.2. Adsorption Isotherm Experiment
Tebuconazole concentrations were set at 5, 10, 20, 30, 40, 50, and 60 mg·L−1, with 100 mg biochar and Proclin 300 (10 μg·mL−1). The centrifuge tubes with 50 mL solution containing tebuconazole, biochar and Proclin 300 were shaken in the dark at 180 rpm and 25 ± 2 °C for 24 h. The treatment without biochar addition was set as the control. All experiments were conducted in triplicate. The adsorption isotherm data were fitted using the Langmuir (Equation (6)) and Freundlich (Equation (7)) isotherm models to describe the adsorption characteristics and elucidate the interaction mechanisms between tebuconazole and the biochar [27].
qe (mg·g−1): the equilibrium adsorption capacity;
qm (mg·g−1): the maximum adsorption capacity;
ce (mg·L−1): the equilibrium concentration of tebuconazole;
kL (L·mg−1): the Langmuir affinity constant;
kF [(mg·g−1) (mg·L−1)−n]: the Freundlich capacity factor;
n: Freundlich intensity parameter.
2.3.3. Pesticide Analysis
The concentration of tebuconazole in the solution was determined by HPLC (Shimadzu LC-2050, Kyoto, Japan) equipped with a Shim-pack GIST C18-AQ column (4.6 × 250 mm, 5 μm). The injection volume was 10 μL. The separation was achieved isocratically at 30 °C using a mobile phase of methanol/ultrapure water (70:30, v/v) at a flow rate of 1.0 mL·min−1, with UV detection at 220 nm. The retention time for tebuconazole was 14.5 min under these conditions. Based on the designed initial concentrations of tebuconazole, the standard calibration curve was prepared at nine levels in the range of 0.2–60 mg L−1, and showed high degrees of linearity (R2 = 0.9996). The detection limit of the method was 0.03 mg L−1. The recoveries ranged from 97.25% to 101.71% with relative standard deviations from 0.28% to 3.44%.
3. Results and Discussion
3.1. Biochar Characterization
3.1.1. pHpzc, Yield and Elemental Compositions
The pHpzc values of TBC300, TBC400, TBC500, and TBC600 were 8.48, 9.76, 10.12, and 10.13, respectively (Figure 1b); all of them exceeded the initial and final pH of their respective kinetic experimental systems. Thus, the TBC surface tended to be positively charged.
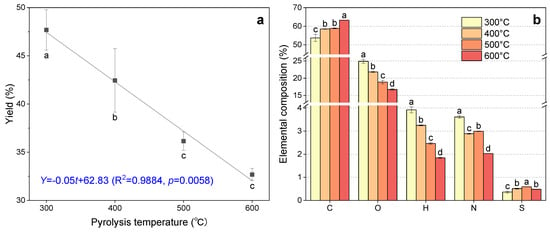
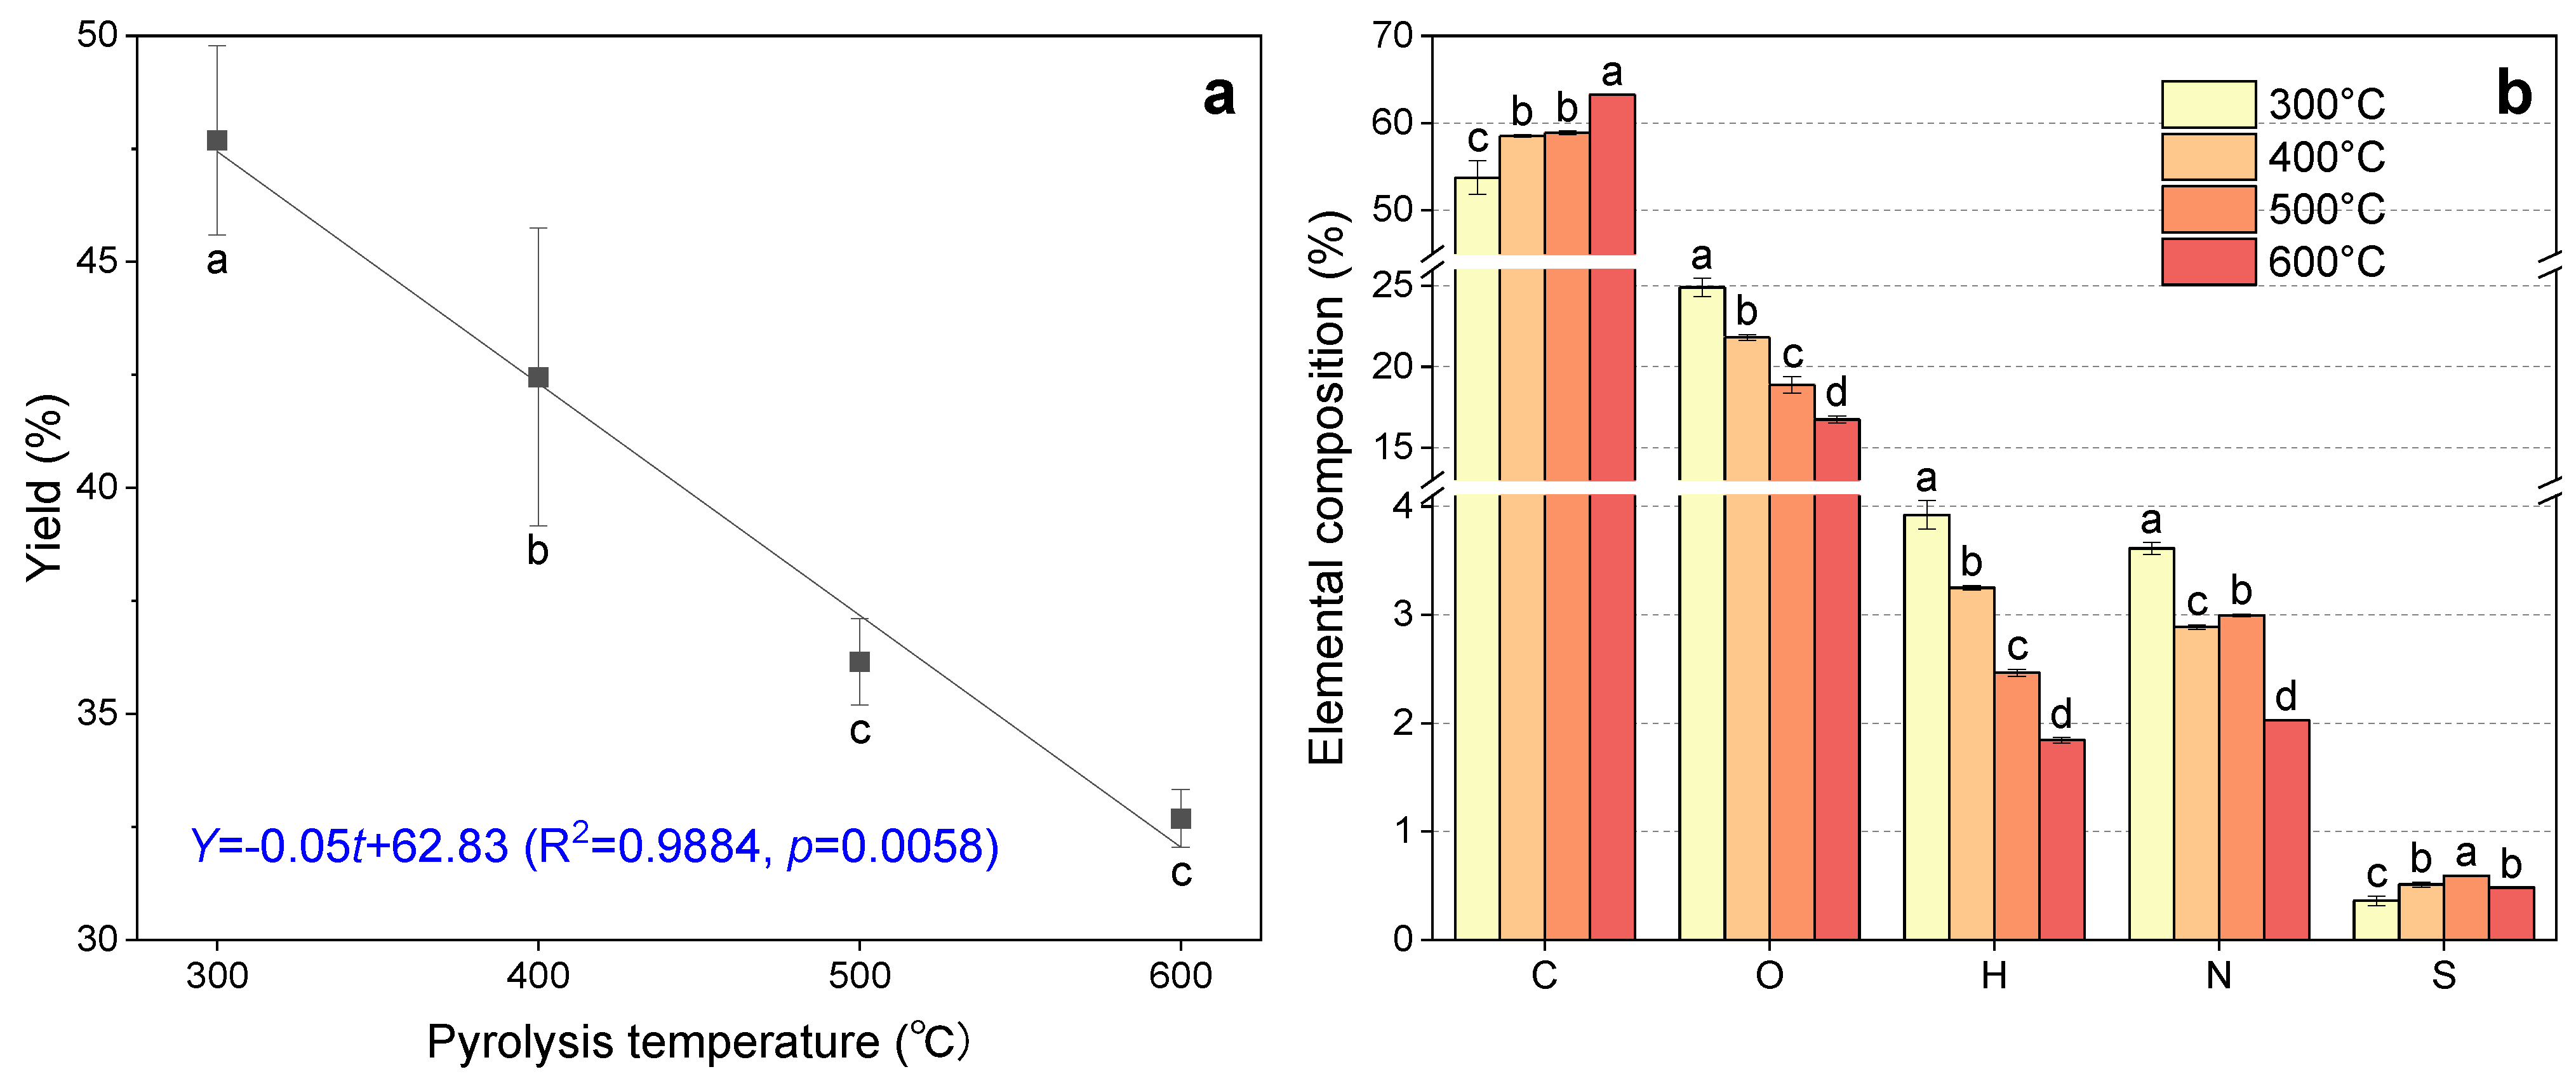
The yield of TBC decreased with increasing pyrolysis temperature, and there was a strong negative relationship between biochar yield and pyrolysis temperature (Figure 2a). This finding confirmed the results of many previous studies [28,29,30]. TBC yield significantly decreased from 47.7% to 32.7% as the pyrolysis temperature increased from 300 to 600 °C. This decrease mainly resulted from the promoted conversion of biomass into volatile components that were emitted as gases at higher temperatures [30]. Based on a thermogravimetric analysis, 350–400 °C was recommended as the optimal maximum temperature for producing biochar from tomato plants, corresponding to solid yields of 38–45% [21]. The increase in pyrolysis temperature resulted in an increase in C content, a decrease in N, O and H contents, and a first-increase-then-decrease trend in S content (Figure 2b). Under conditions of high pyrolysis temperatures, the losses in H and O were largely due to the cleavage of weak bonds within the feedstock structure [31], which also caused the lower yield of TBC [30]. Consistent with our results, Lee et al. (2021) [32] found that the S content of biochar prepared by pyrolyzing a brown alga rose until 500 °C and subsequently decreased at 600 °C. This decrease in S content was probably attributed to the pyrolysis decomposition of organic S at this temperature. The atomic ratios of O/C, H/C, and (O + N)/C decreased with rising pyrolysis temperature (Table 1), suggesting the enhanced aromaticity and weakened polarity of TBCs at high temperatures [33].
Figure 2.
(a) Biochar yield and (b) elemental composition after 4 h of pyrolysis at different temperatures. Different letters indicate significant differences according to Duncan’s test (p < 0.05).
Table 1.
Surface area, pore structure characteristics, and elemental atomic ratio of TBCs produced at different pyrolysis temperatures.
3.1.2. Pore Characteristics
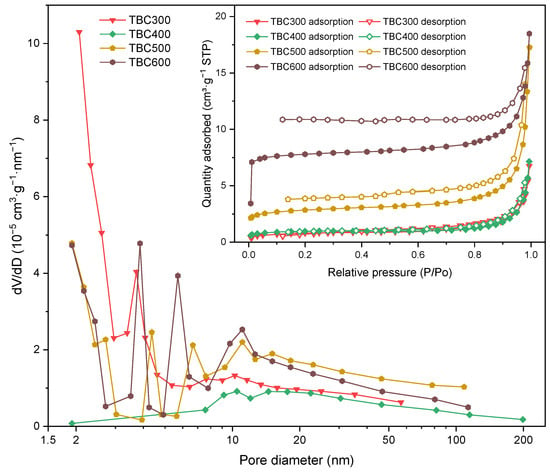
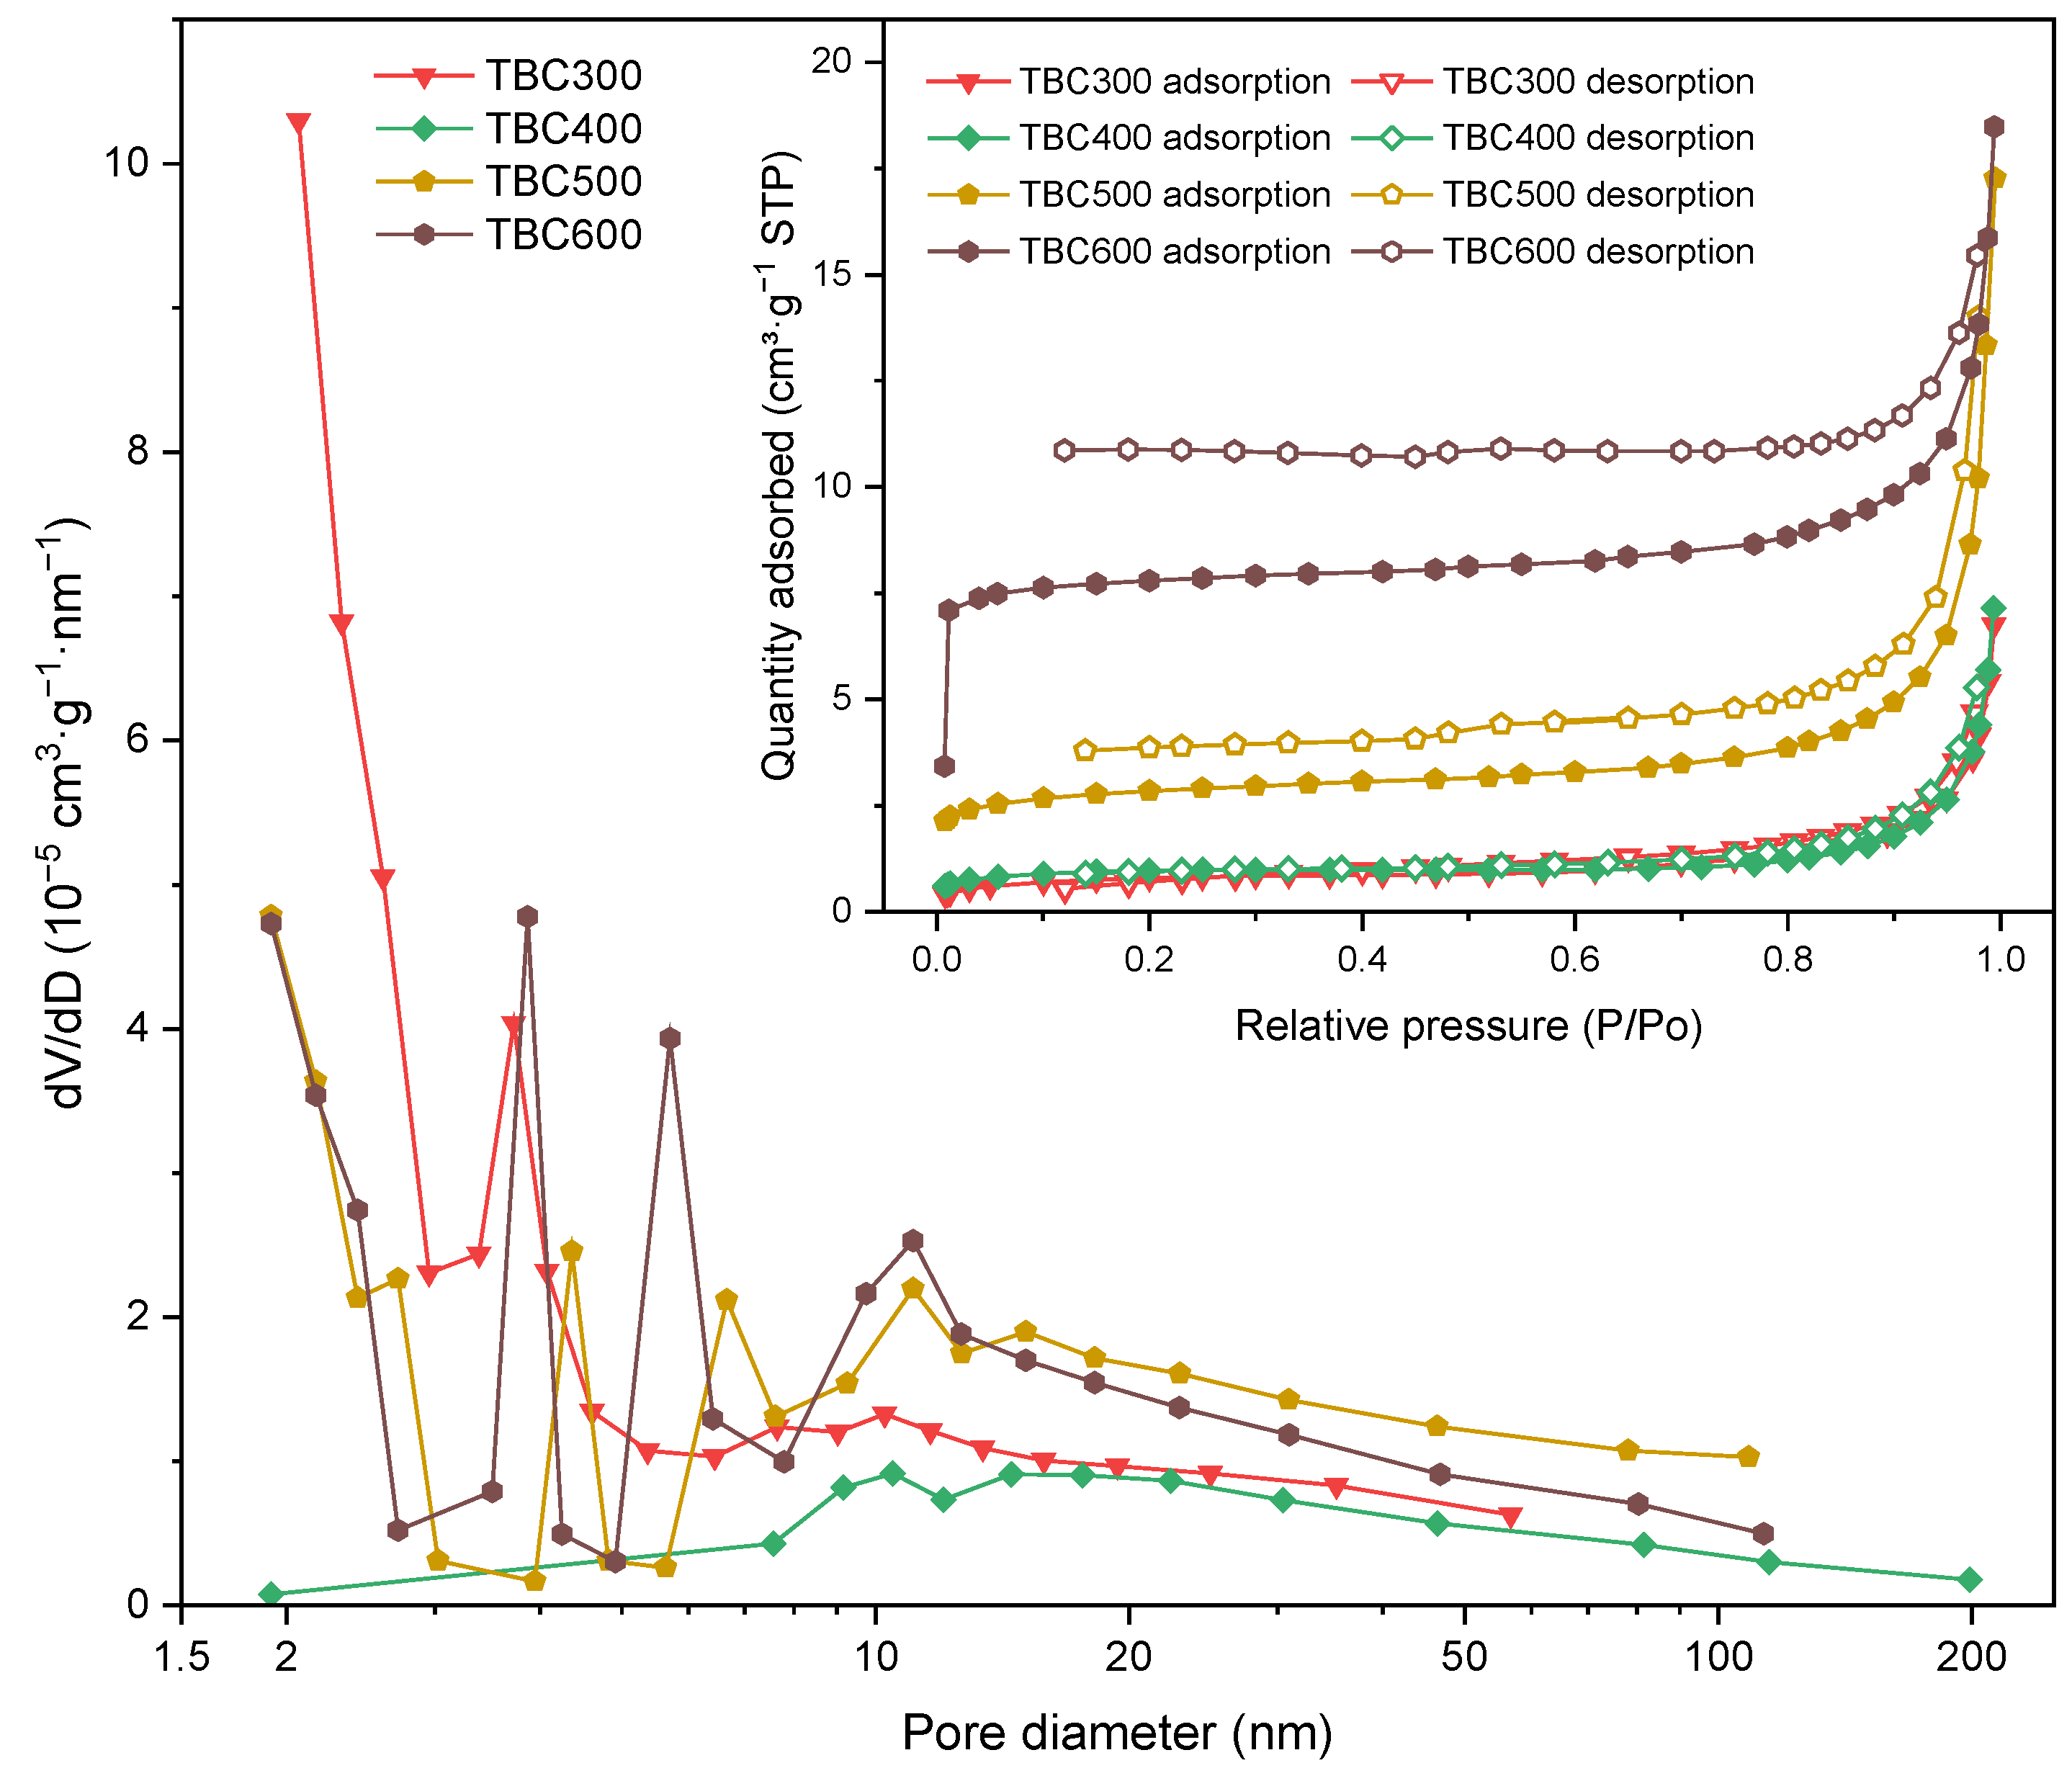
As presented in Figure 3, the pore size distribution curve of TBCs showed that most pores fell within the range of 2–20 nm, and the average pore diameter ranged from 4.7 to 15.1 nm (Table 1), indicating that TBC was a mesoporous material. TBC300 exhibited a narrower range of pore widths than TBC400, TBC500 and TBC600. The N2 adsorption–desorption isotherms of TBCs were type IV with H3-type hysteresis loops according to the IUPAC classification (Figure 3 insert), which further confirmed the presence of the mesoporous structure in TBCs [34]. In addition, the hysteresis loops in the isotherms of TBC500 and TBC600 did not close even as P/P0 approached 0. This incomplete closure should be attributed to the formation of diffusion traps in the adsorbent upon adsorption due to a larger increase in the desorption potential barrier relative to the adsorption potential barrier [35]. Diffusion traps arose from deformation of the adsorbent upon adsorption [36]. In this study, the deformation likely resulted from the collapse of the pore structure originating from the improved carbonation under higher pyrolysis temperatures.
Figure 3.
Pore size distribution and (insert) N2 adsorption/desorption isotherm of TBCs prepared at different temperatures.
As pyrolysis temperature increased from 300 to 600 °C, SSA, SSA for micropores (SSAmicro), total pore volume (Vtot), micropore volume (Vmicro), and the ratio of Vmicro to Vtot (Vmicro/Vtot) increased, while the average pore diameter gradually decreased (Table 1). The increases in surface area and pore volume were primarily attributed to the degradation of organic materials and the formation of vascular bundles or channel structures, as well as the release of volatile matter [37]. Similar to previous results [38], the average pore diameter showed an opposite trend to the Vmicro/Vtot ratio. SSAmicro and Vmicro in TBC600 were 8.9 and 9.4 times higher than those of TBC300, respectively. Additionally, SSAmicro increased rapidly from 2.2 m2·g−1 for TBC300 to 21.9 m2·g−1 for TBC600, indicating a transition from mesoporous to microporous structure with the pyrolysis temperature increase and that higher temperatures promote the development of porous structures. This observation was consistent with previous results indicating that biochar obtained at higher pyrolysis temperatures displayed a greater proportion of microporous structures [39], but the micropore number and its contribution to SSA of biochars decreased when the temperature exceeded a certain critical value [40].
3.1.3. Fourier-Transform Infrared Spectroscopy (FTIR) Analysis
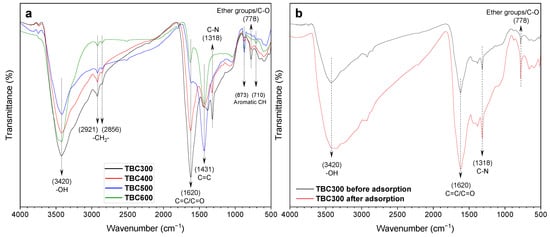
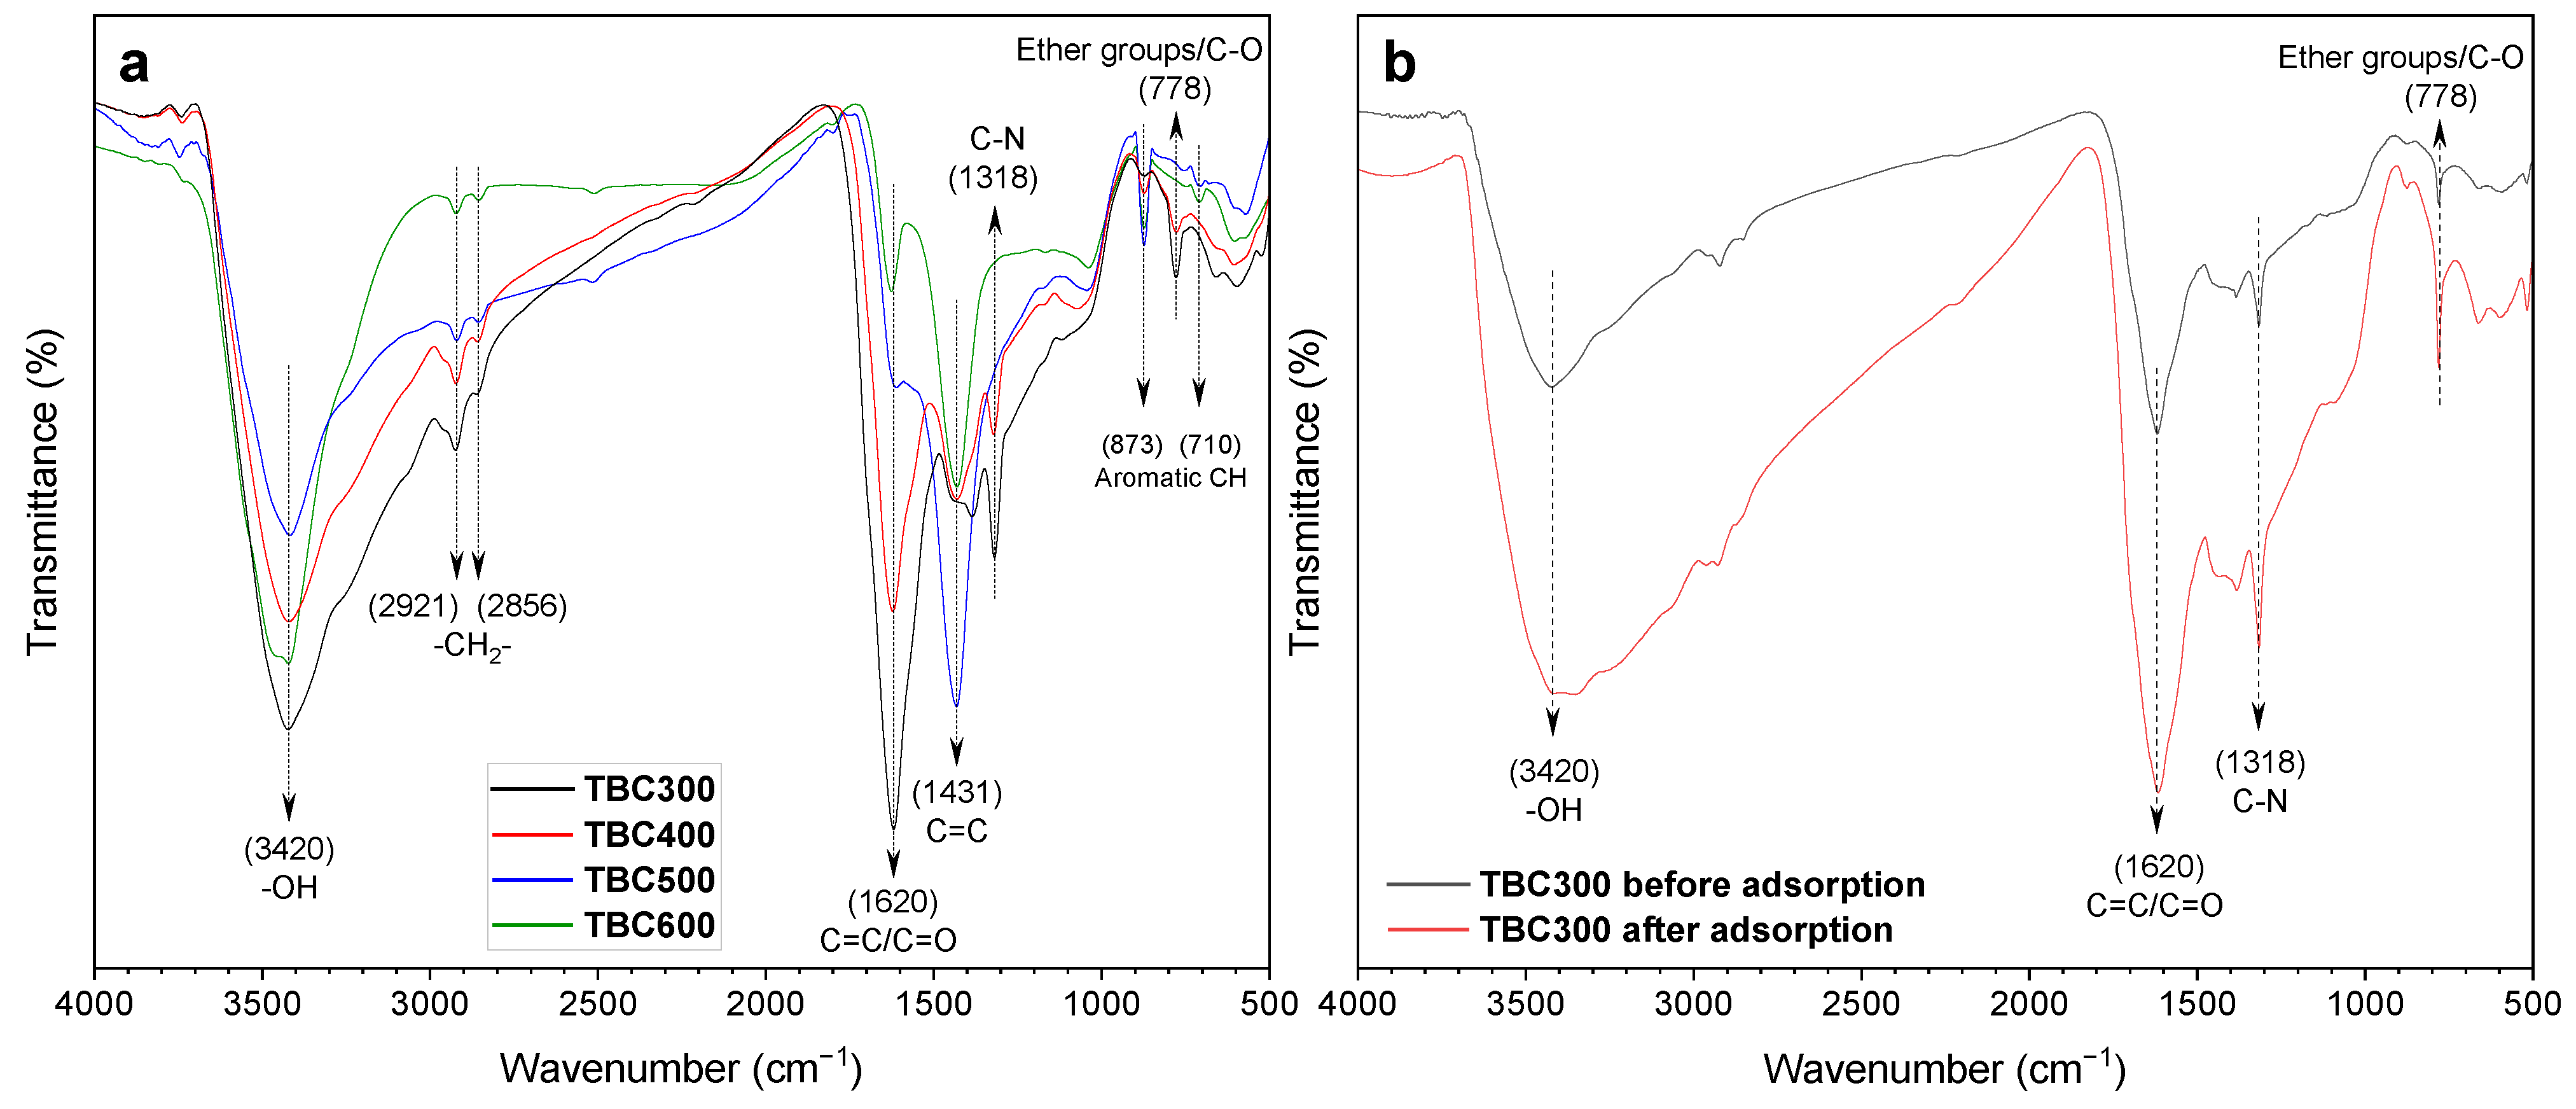
The FTIR spectra of TBCs prepared at different pyrolysis temperatures are presented in Figure 4a. The broad band at approximately 3420 cm−1 represented the stretching vibration of –OH, indicating the presence of hydroxyl groups on TBC surfaces [41]. The intensity of bands for aliphatic CH2 groups (2921 and 2856 cm−1) and bands for aromatic C=C and C=O (1620 cm−1) diminished with increasing pyrolysis temperatures, which resulted from a decrease in the surface functional groups and the nonpolar groups [42,43,44]. The loss of aliphatic and nonpolar groups reflected enhanced dehydrogenation reactions at higher pyrolysis temperatures, leading to increased aromaticity and polarity of TBCs. Compared to TBC300 and TBC400, TBC500 and TBC600 exhibited an obvious increase in the intensity of the band at 1431 cm−1 (the stretching vibration of the aromatic C=C skeleton), suggesting that higher temperatures enhanced thermal stability of the lignin-derived aromatic skeleton [45]. The spectral peak generated at 1318 cm−1 was associated with primary and secondary aromatic amines [46]. The peak diminished with increasing pyrolysis temperature, reflecting denitrogenation [47]. The peak at 900–650 cm−1 provided essential identification information for the position and number of substituents on the aromatic ring. The intensities of peaks at 778 cm−1 of TBC300 and TBC400 were stronger than those of TBC500 and TBC600, suggesting a decline in functional groups, like ether groups and C–O bonds, on the surfaces of TBC500 and TBC600 [48]. The peaks at 873 and 710 cm−1 were assigned to out-of-plane C–H bending vibrations in aromatic compounds [49]. The bands at 710 cm−1 appeared in TBC500 and TBC600, but were not found in TBC300 and TBC400. Furthermore, there was an obvious intensity enhancement of the peak at 873 cm−1 for TBC500 and TBC600. These findings suggested that the aromatization degree of TBC increased with the rise in pyrolysis temperatures.
Figure 4.
FTIR spectra of (a) TBCs prepared at different pyrolysis temperatures and (b) TBC300 before and after adsorption.
3.2. Adsorption of Tebuconazole onto TBC
3.2.1. Adsorption Kinetics
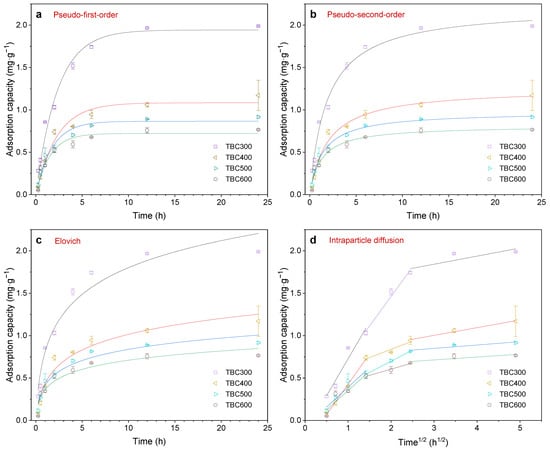
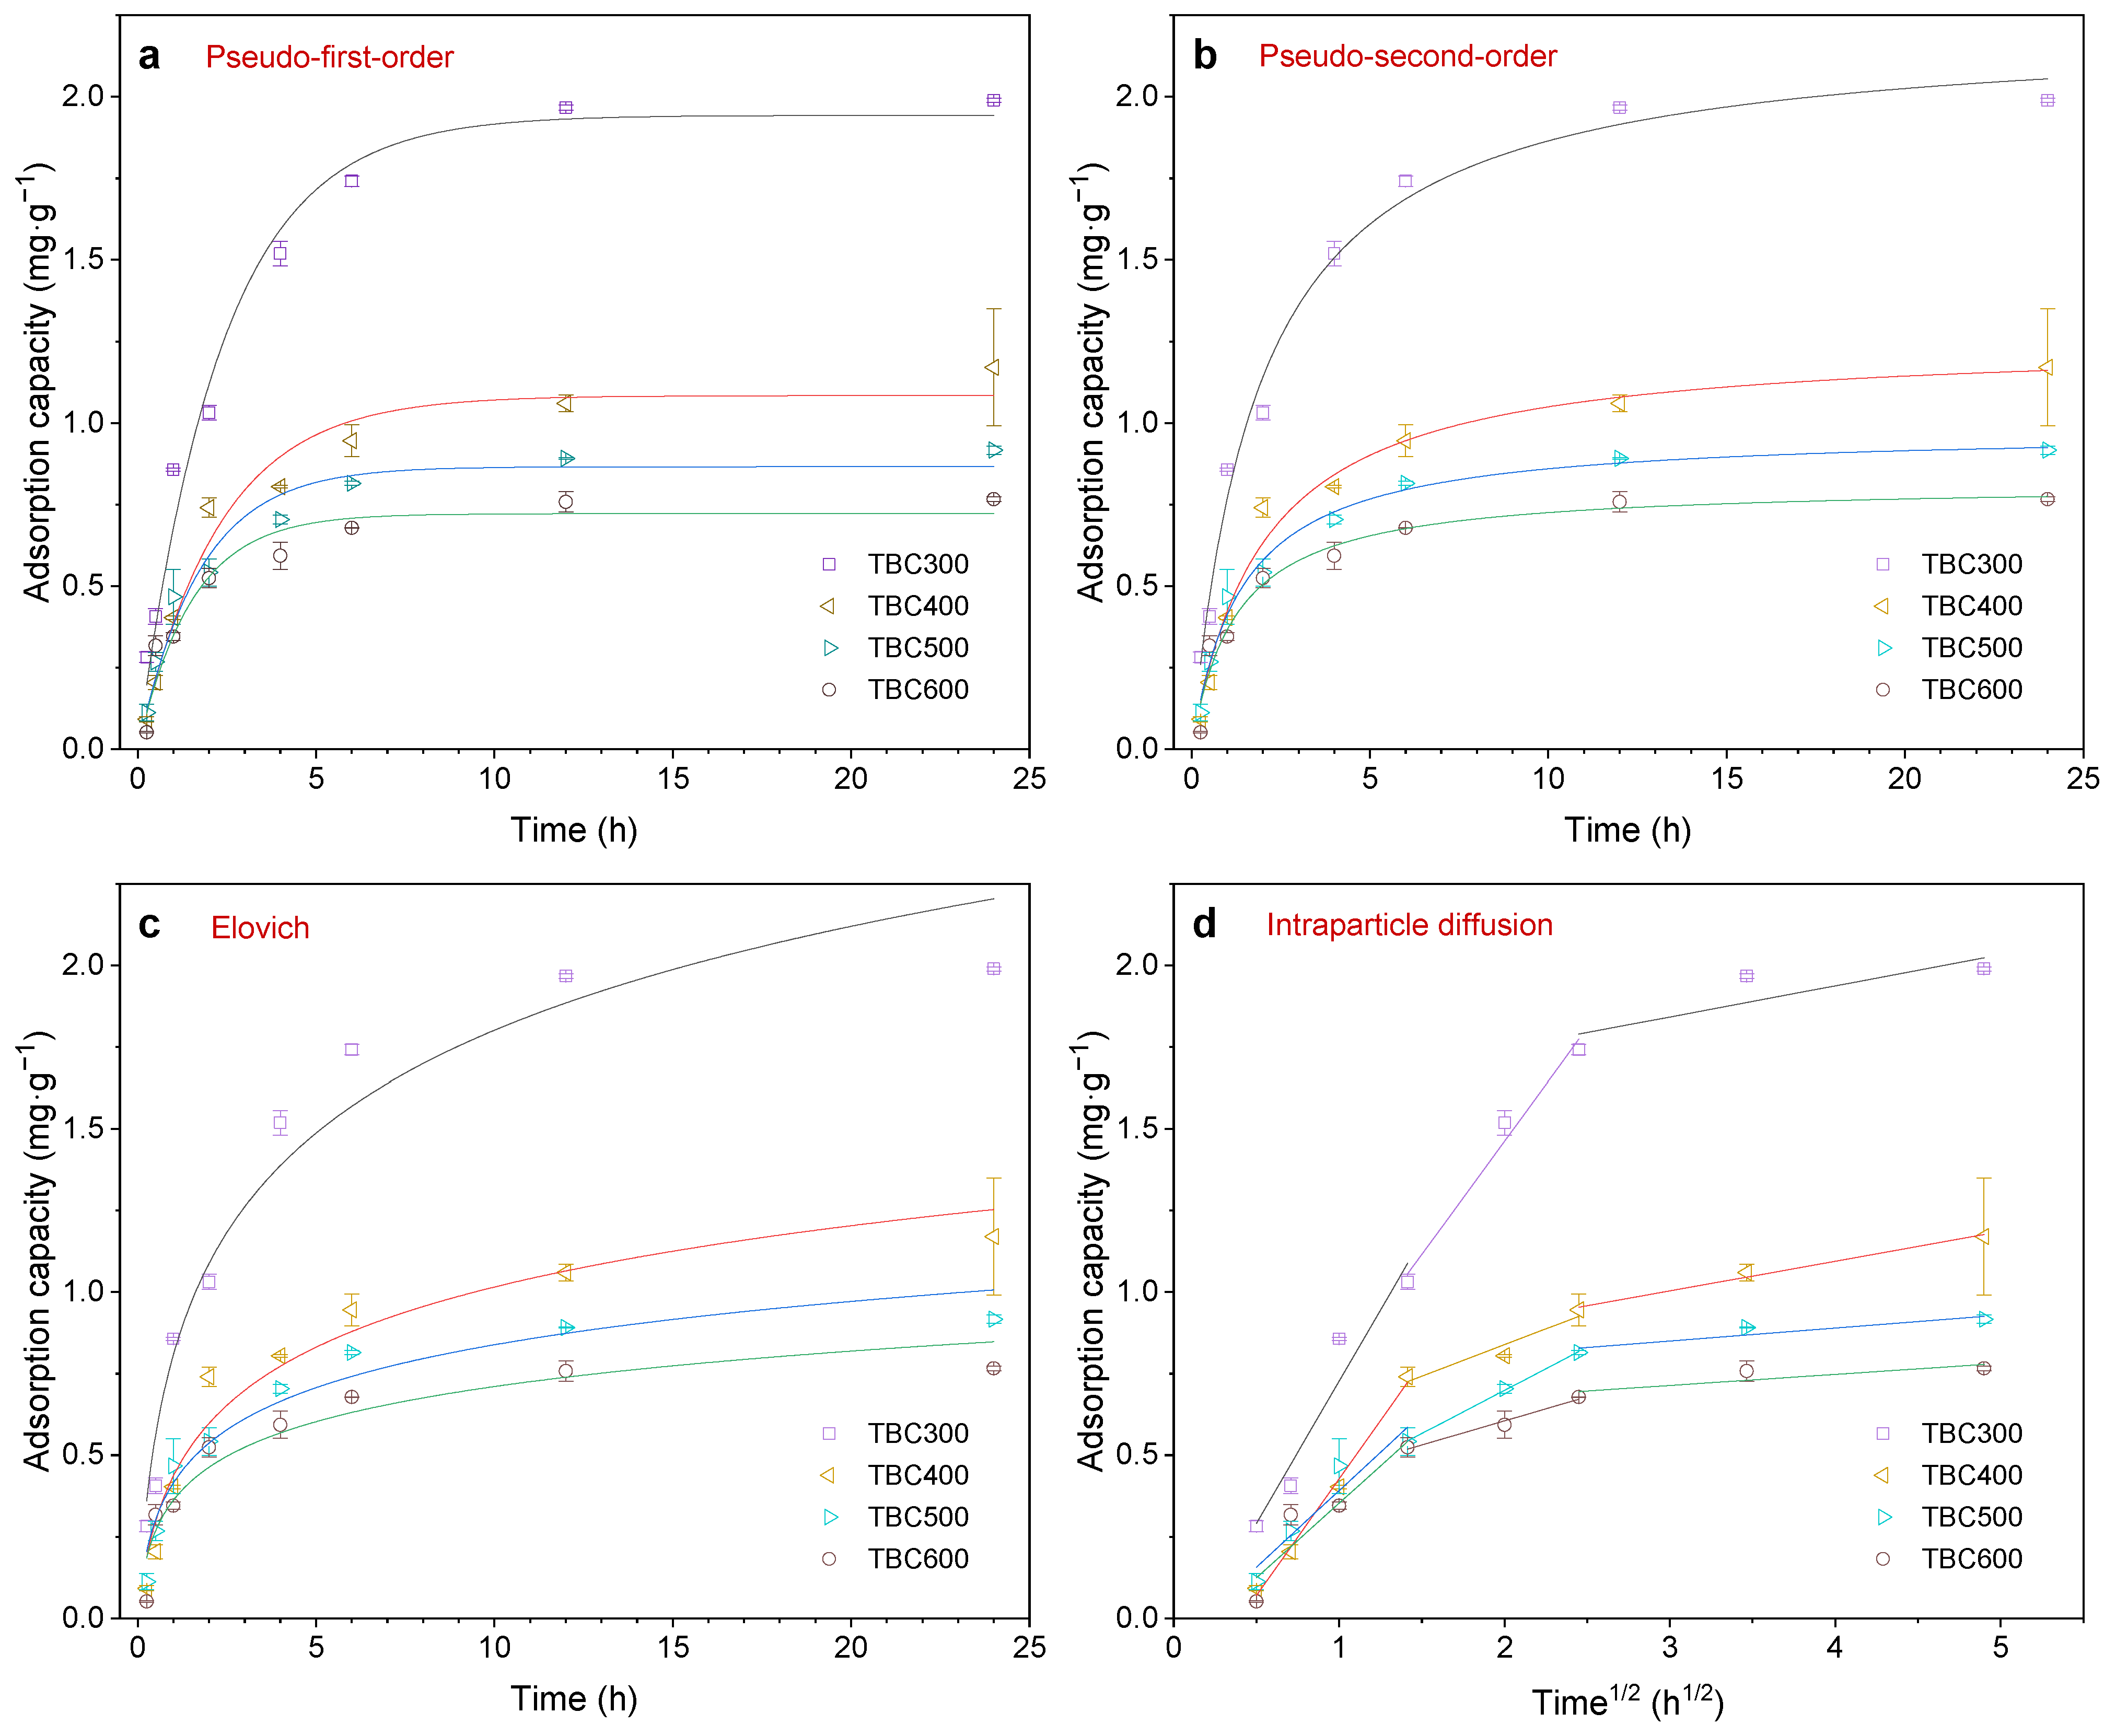
The tebuconazole adsorption quantity by TBCs prepared at different temperatures increased rapidly within the first 2 h, then showed a slow increasing trend, and eventually reached equilibrium at approximately 12 h (Figure 5). The tebuconazole adsorption by TBCs was simulated well by both the PFO and PSO models, with correlation coefficients (R2) exceeding 0.94 (Figure 5a,b; Table 2), suggesting that the adsorption process involved both physical and chemical adsorption mechanisms [50]. The equilibrium adsorption capacity (qe) of tebuconazole on TBC decreased with increasing pyrolysis temperature, and the biochar prepared at the low temperature of 300 °C (TBC300) possessed the highest qe (Table 2), which could probably be attributed to its more abundant surface functional groups, because the number of functional groups reduced with the rise in the pyrolysis temperature [51]. By testing 92 biochars from different feedstocks, a study also showed that the functional groups were better preserved in plant-based biochars produced at low temperatures than at higher temperatures, and functional groups were lost when the pyrolysis temperature reached 500 °C, with 750 °C leading to nearly complete loss [52].
Figure 5.
Adsorption kinetics of tebuconazole on TBCs prepared at different pyrolysis temperatures: (a) PFO model; (b) PSO model; (c) Elovich model; (d) IPD model. Experiments were performed with an initial tebuconazole concentration of 10 mg·L−1, using 2 g·L−1 biochar, at 25 °C.
Table 2.
Fitting parameters of adsorption kinetics and adsorption isotherm for tebuconazole on biochars produced at different pyrolysis temperatures.
The Elovich model has been extensively used to describe adsorption kinetics, reflecting the chemisorption nature of adsorption [53]. The good fit of the Elovich model indicated that the TBC surface was heterogeneous and that chemisorption was involved in tebuconazole adsorption (Figure 5c). The higher value of parameter α and lower value of parameter β for TBC300 (Table 2) suggested that TBC300 exhibited a higher initial adsorption rate, and was less affected by site coverage effects and activation energy barriers in achieving the same adsorption capacity as the other three TBCs (TBC400, TBC500 and TBC600) [54].
Generally, the liquid-phase adsorption process consists of three stages: external membrane diffusion, intraparticle diffusion, and adsorption equilibrium [55]. The IPD model has been widely applied to determine the rate-controlling step and the diffusion behavior of the adsorbate in the adsorption process. Fitting the data to the model illustrated that the adsorption process of tebuconazole exhibited three distinct linear segments, and the first segment did not pass through the origin point (C ≠ 0) (Figure 5d), suggesting that intraparticle diffusion was not the only step governing the adsorption rate, and other control processes, such as initial external diffusion or chemical reactions, also contributed to the adsorption [56,57,58]. The first linear segment corresponded to the instantaneous adsorption stage, which exhibited the fastest adsorption rate because of the greater available active sites and the substantial tebuconazole concentration gradient between the liquid phase and the biochar surface. The second segment represented the gradual adsorption phase, where tebuconazole molecules diffused from the external surface into the interior pores of TBCs and gradually reached equilibrium. During this stage, the concentration driving force and available adsorption sites diminished, thus resulting in a slower adsorption rate relative to the first stage. The third segment was the final equilibrium phase, in which the adsorption rate dropped because the concentration gradient had become small and most easily accessible adsorption sites were already occupied, and the adsorption process eventually reached equilibrium.
3.2.2. Adsorption Isotherms
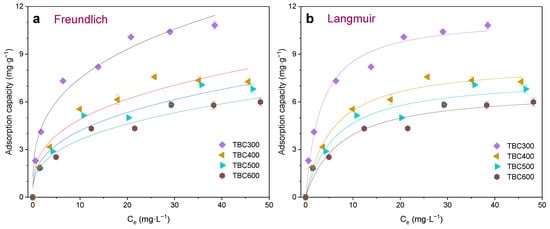
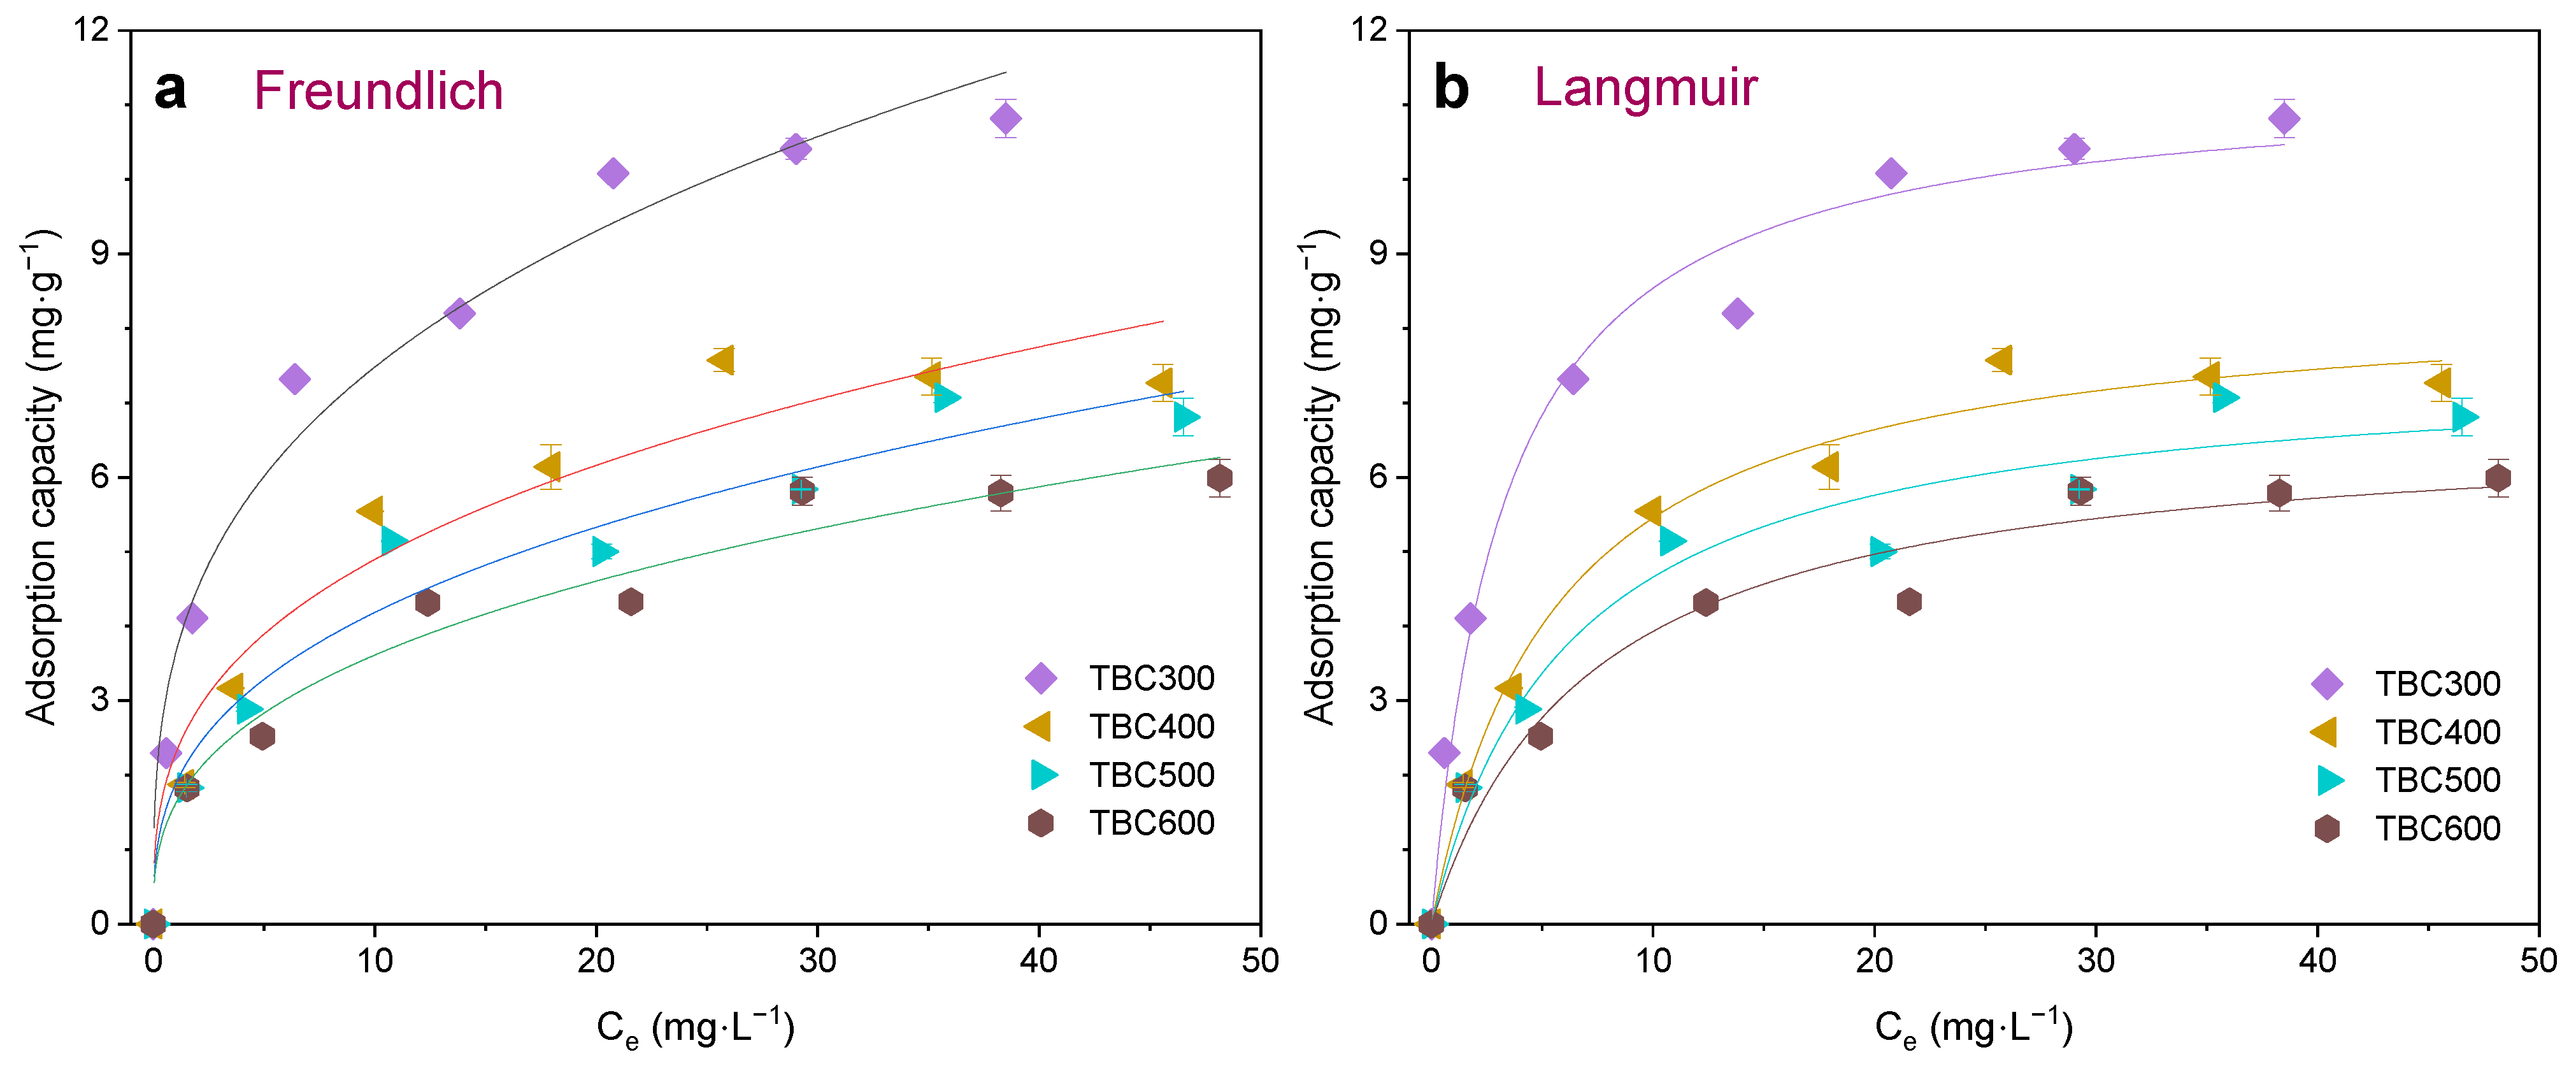
The Langmuir and Freundlich isotherm models were applied to fit the equilibrium adsorption data, and the corresponding fitting results are presented in Figure 6 and Table 2. Both models adequately described the adsorption process with R2 exceeding 0.92 for all tested TBCs, implying that physisorption and chemisorption mechanisms contributed to tebuconazole’s adsorption onto TBCs, and the adsorption occurred on heterogeneous surfaces and was affected by monolayer and multilayer adsorption [58,59], which was consistent with the results of the adsorption kinetics.
Figure 6.
Adsorption isotherms of tebuconazole on TBCs prepared at different pyrolysis temperatures: (a) Freundlich model; (b) Langmuir model. Experiments were performed with initial tebuconazole concentrations of 5, 10, 20, 30, 40, 50, and 60 mg·L−1, using 2 g·L−1 biochar, at 25 °C.
The Langmuir model parameters, qm and KL, decreased with increasing pyrolysis temperature, and TBC300 had the best adsorption capacity and affinity for tebuconazole among the tested TBCs with qm of 11.37 mg·g−1 (Table 2). The Freundlich constant KF, which has often been used as an indicator of the adsorption capacity of the adsorbent, also decreased as the pyrolysis temperature increased (Table 2), further confirming that TBC300 possessed the strongest adsorption capacity. This was an interesting result owing to the fact that much of the research has shown that biochars prepared at higher pyrolysis temperatures usually possessed greater adsorption capacity for pesticides [59,60]. Furthermore, the parameter 1/n of the Freundlich model, which reflects the favorability of adsorption and the shape of the isotherm, fell in the range of 0.1–0.5, indicating that tebuconazole was easily adsorbed by TBCs [59]. These findings suggested that the tomato stem is one of the most favorable feedstocks for biochar to remove tebuconazole in aqueous solutions.
3.3. Comparison with Other Biochars
The comparison of the adsorption capacity of TBC for tebuconazole with that of other biochars is presented in Table 3. Based on qm of biochar, TBC300 exhibited a higher value than sludge biochar [11] and biochar prepared from Paulownia tomentosa leaves [61], while demonstrating a lower value than peanut shell biochar (PSB) and modified PSB [62], calcium-modified biochar prepared from water hyacinth [63] and P-doped corn straw biochar [57]. Compared with previously reported pristine biochars for removal of tebuconazole, TBC300 offered a prominent advantage of low energy consumption because it can achieve comparable or even superior adsorption performance at a relatively low preparation temperature. However, the modified biochar demonstrated higher adsorption capacity toward tebuconazole. Hence, future work should explore appropriate modification strategies for TBC300 to improve its adsorption capacity.
Table 3.
Comparison of the adsorption capacity of TBC300 for tebuconazole with other biochars.
3.4. Adsorption Mechanism Analysis
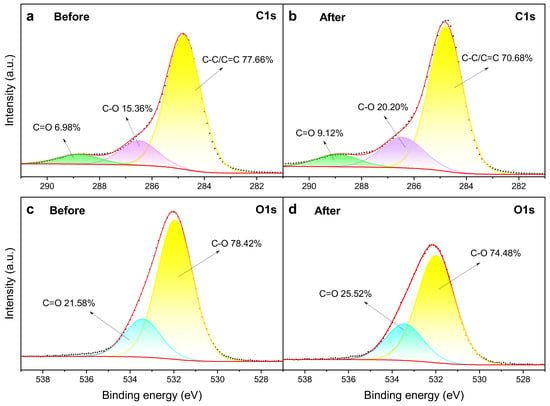
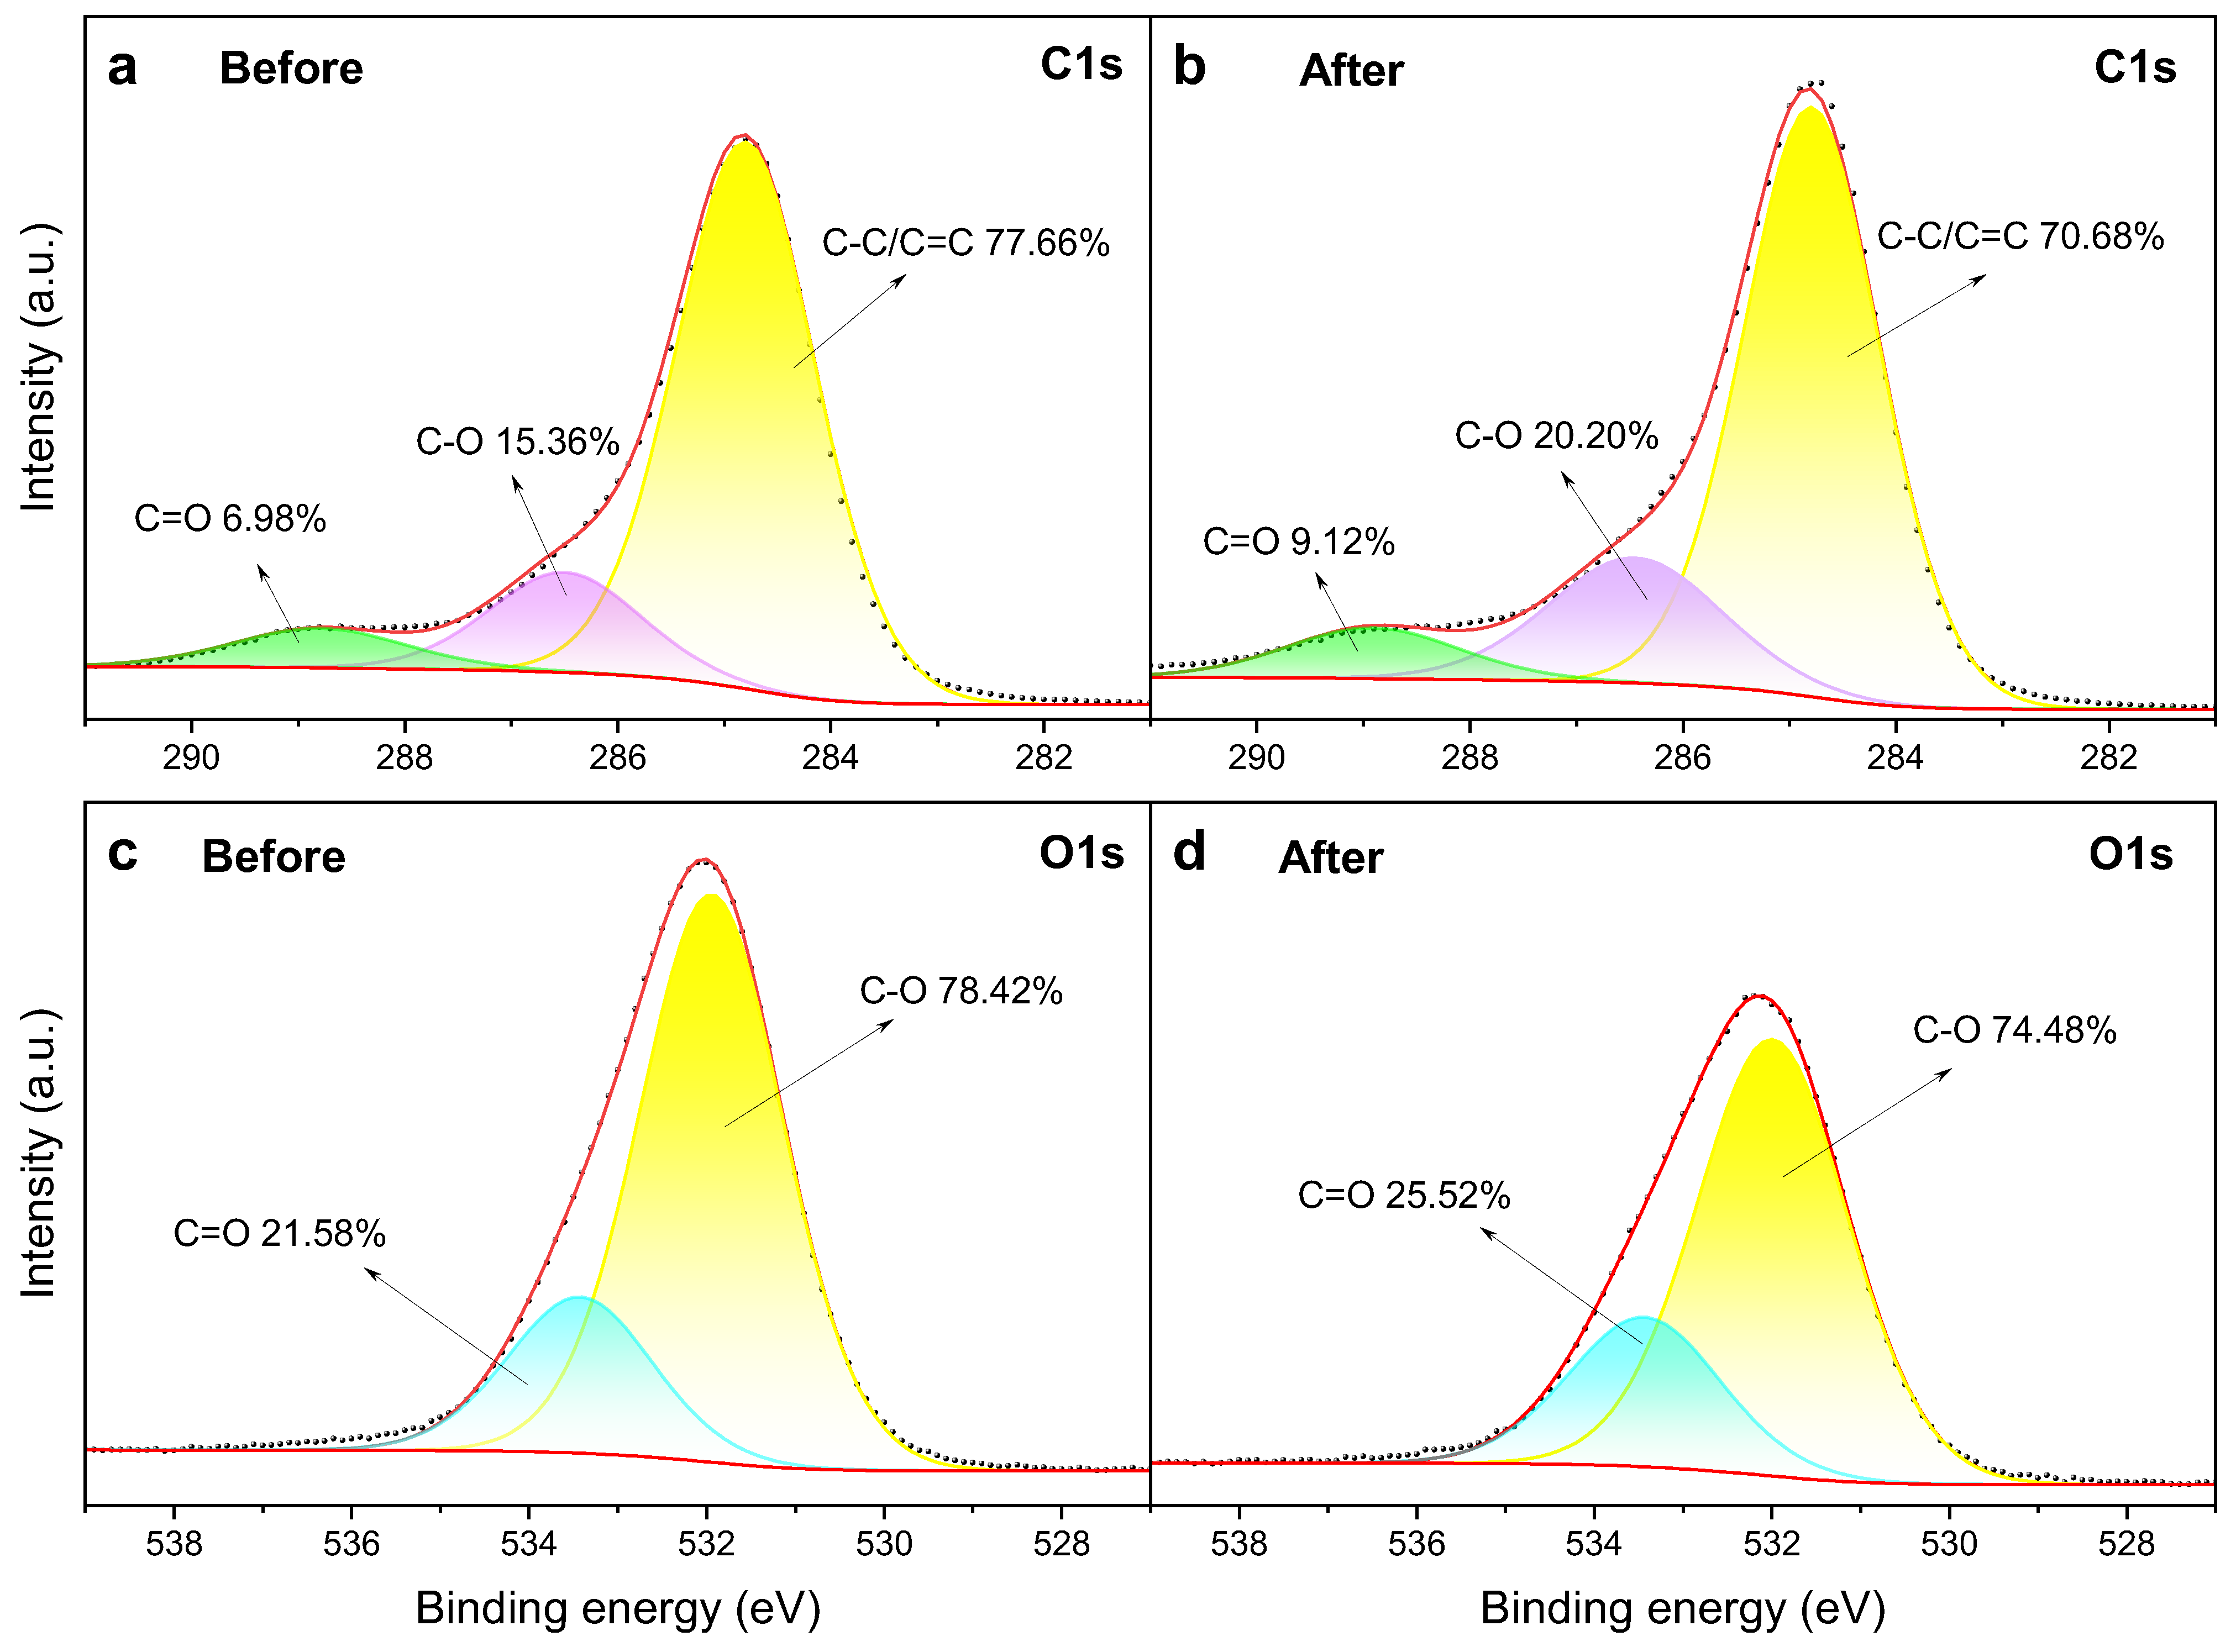
The physiochemical properties of biochars, including physical structure and surface functional groups, significantly influenced their adsorption performance [15]. Tebuconazole was a neutral organic molecule under typical environmental conditions (pH 5–9). Only in strongly basic conditions (pH > 12) could it, in theory, lose a proton, resulting in a negatively charged form. Therefore, no electrostatic adsorption was expected between TBC and tebuconazole under the conditions of this study. The pore filling, depended on the surface area and pore structure of biochars, and the larger SSA and porous structure could accommodate more adsorbate molecules through physical interactions [27,64]. The tebuconazole molecule had a smaller size (1.3 nm in length and 0.5 nm in width [65]) than the average pore diameter of TBC, which facilitated its diffusion within the mesoporous structure of TBC. Therefore, pore filling was a possible mechanism for tebuconazole adsorption. Moreover, this adsorption pathway has previously been confirmed by the decrease in SSA of biochars after tebuconazole adsorption [57,66]. However, compared to TBC400, TBC500, and TBC600, although TBC300 had a constrained pore structure and smaller surface area, it exhibited a higher adsorption capacity for tebuconazole. Hence, the pore-filling mechanism alone could not explain the comparatively greater adsorption capacity of TBC300, and several other processes, such as chemisorption, probably made an important contribution to adsorption. Chemisorption involved π–π conjugation, hydrogen bonding, and other interactions between pesticides and biochar [15]. The surface functional groups played a crucial role in chemisorption, and biochar containing more functional groups exhibited enhanced adsorption capacity [27,64]. Furthermore, functional groups were preferentially formed at lower pyrolysis temperatures [11]. This exactly explained the relatively strong adsorption capacity of TBC300. To verify this adsorption mechanism, FTIR and XPS analyses were conducted to examine the changes in surface functional groups before and after tebuconazole adsorption on TBC300. After adsorption, the most pronounced spectral variations were observed at 3420 cm−1 (–OH) and 1620 cm−1 (C=C) for TBC300 (Figure 4b), which suggested the presence of hydrogen bonding and π–π interactions between the functional groups on the TBC300 surface and tebuconazole molecule [63]. Meanwhile, the decreased relative intensities of C-C/C=C in TBC300 (Figure 7a,b) indicated that the aromatic carbon skeleton might be involved in π–π electron donor–acceptor interactions. The pronounced reduction in C-O and C=O intensities after tebuconazole adsorption (Figure 7c,d) suggested that the oxygen-containing functional groups in TBC300 participated in the adsorption mechanism by forming H bonds with the hydroxyl and amino groups of tebuconazole [57]. These findings indicated that π–π interactions and hydrogen bonding may have contributed to tebuconazole adsorption on TBC300.
Figure 7.
XPS spectra of TBC300 before and after adsorption: (a) C1s before adsorption; (b) C1s after adsorption; (c) O1s before adsorption; (d) O1s after adsorption.
3.5. Limitations and Perspectives
In order to provide a controlled basis for understanding the adsorption performance and mechanism of TBC, the experiments were conducted under ideal conditions using tebuconazole solutions, without considering the impact of complex environmental factors such as natural organic matter, salts, and other coexisting contaminants. These factors may influence adsorption performance of TBC through pore blocking, charge screening, and competitive binding. For the purposes of clearly discriminating adsorption capacity and affinity of TBCs and reflecting saturation behavior of active sites, tebuconazole concentrations at the mg/L level were selected in the present study. The selected concentrations were much higher than the actual environmental concentration, and the adsorption performance of TBC for tebuconazole at the environmentally relevant concentrations cannot be directly extrapolated from the obtained results in this work. In addition, the adsorption capacity of TBCs at different pH values and temperatures was helpful in elucidating the adsorption mechanism, and desorption, regeneration, and reuse are important for the practical viability of an adsorbent, but these factors were not covered in this study. Therefore, these research limitations should be addressed under complex environmental matrices with low levels of tebuconazole in our future work to further elucidate the underlying mechanisms and to establish the practical applicability of TBC300. Specifically, the adsorption mechanism of TBC was crucial for advancing its application in mitigating environmental risks from pesticides, and in-depth studies are needed to provide quantitative insights into the contributions of different adsorption pathways to pesticide removal.
4. Conclusions
In the present study, TBCs were produced by pyrolyzing tomato stems at 300, 400, 500, and 600 °C. The results indicated that pyrolysis temperature significantly affected the properties of TBC. As pyrolysis temperature increased, the carbonization degree, C content, and SSA of TBC increased while its yield and contents of H, O, and N decreased. Low-temperature biochar (TBC300) exhibited a high adsorption capacity for tebuconazole with the maximum adsorption capacity of 11.37 mg g−1. This work provided a cost-effective biochar from tomato stem that could be a promising adsorbent capable of eliminating tebuconazole residues from environmental water and paved a sustainable valorization approach for reusing tomato waste resources. Because this work was conducted under ideal conditions using solutions with high tebuconazole levels, the adsorption performance of TBC for tebuconazole in real environmental matrices should be addressed in the future to establish its practical applicability.
Author Contributions
Conceptualization and methodology, C.C. and Q.W.; validation, R.Z. (Ruliang Zhao), Z.J. and R.Z. (Ruilun Zheng); formal analysis, Z.W., R.Z. (Ruilun Zheng) and Q.W.; investigation, Z.W., R.Z. (Ruliang Zhao), Z.J., X.Y. and R.Z. (Ruilun Zheng); resources, Z.W., R.Z. (Ruliang Zhao) and R.Z. (Ruilun Zheng); writing—original draft preparation, Z.W., R.Z. (Ruliang Zhao) and Z.J.; writing—review and editing, C.C. and Q.W.; visualization, Z.W., R.Z. (Ruilun Zheng) and Q.W.; funding acquisition, Q.W. All authors have read and agreed to the published version of the manuscript.
Funding
This research was funded by the National Key Research and Developmental Program of China (2022YFD1700700) and the National Natural Science Foundation of China (32071502).
Data Availability Statement
Data is contained within the article.
Conflicts of Interest
The authors declare no conflicts of interest.
References
- Wang, J.; Norgaard, T.; Kisielius, V.; Nielsen, A.B.; Carvalho, P.N.; Nielsen, N.C.; Wu, S. Biochar–calcium peroxide composite for sustained tebuconazole removal via adsorption and surface-mediated oxidative degradation. J. Hazard. Mater. 2026, 501, 140943. [Google Scholar] [CrossRef] [Scilit] [PubMed]
- Song, R.; Qi, C.; Fei, Y.; Wang, B.; Zhou, W.; Gao, H. Phosphoric acid-activated shrimp shell biochar-chitosan for mitigating soil sodicity and tebuconazole contamination. J. Polym. Environ. 2025, 33, 4777–4794. [Google Scholar] [CrossRef] [Scilit]
- Herrero-Hernández, E.; Andrades, M.S.; Marín-Benito, J.M.; Sánchez-Martín, M.J.; Rodríguez-Cruz, M.S. Field-scale dissipation of tebuconazole in a vineyard soil amended with spent mushroom substrate and its potential environmental impact. Ecotoxicol. Environ. Saf. 2011, 74, 1480–1488. [Google Scholar] [CrossRef] [Scilit] [PubMed]
- Sun, T.; Miao, J.; Saleem, M.; Zhang, H.; Yang, Y.; Zhang, Q. Bacterial compatibility and immobilization with biochar improved tebuconazole degradation, soil microbiome composition and functioning. J. Hazard. Mater. 2020, 398, 122941. [Google Scholar] [CrossRef] [Scilit] [PubMed]
- Rabiet, M.; Margoum, C.; Gouy, V.; Carluer, N.; Coquery, M. Assessing pesticide concentrations and fluxes in the stream of a small vineyard catchment—Effect of sampling frequency. Environ. Pollut. 2010, 158, 737–748. [Google Scholar] [CrossRef] [Scilit] [PubMed]
- El Azhari, N.; Dermou, E.; Barnard, R.L.; Storck, V.; Tourna, M.; Beguet, J.; Karas, P.A.; Lucini, L.; Rouard, N.; Botteri, L.; et al. The dissipation and microbial ecotoxicity of tebuconazole and its transformation products in soil under standard laboratory and simulated winter conditions. Sci. Total Environ. 2018, 637–638, 892–906. [Google Scholar] [CrossRef] [Scilit] [PubMed]
- Roman, D.L.; Voiculescu, D.I.; Filip, M.; Ostafe, V.; Isvoran, A. Effects of Triazole Fungicides on Soil Microbiota and on the Activities of Enzymes Found in Soil: A Review. Agriculture 2021, 11, 893. [Google Scholar] [CrossRef] [Scilit]
- Ihle, V.; Flach, H.; Kaminski, F.; Dietmann, P.; Pfeffer, S.; Kühl, S.J. Tebuconazole-based fungicide impairs embryonic development of the South African Clawed Frog Xenopus laevis. Environ. Toxicol. Pharmacol. 2025, 116, 104708. [Google Scholar] [CrossRef] [Scilit] [PubMed]
- Li, S.; Sun, Q.; Wu, Q.; Gui, W.; Zhu, G.; Schlenk, D. Endocrine disrupting effects of tebuconazole on different life stages of zebrafish (Danio rerio). Environ. Pollut. 2019, 249, 1049–1059. [Google Scholar] [CrossRef] [Scilit] [PubMed]
- Roohi, B.; Tyndall, J.D.A.; Svoboda, T.; de Hoog, S.; Crous, P.W.; Monk, B.C.; Strobl, B.; Weissenbacher, A.; Strauss, J.; Verweij, P.E.; et al. The dual role of azoles: Lifesaving antifungals and drivers of resistance—A One Health perspective. Nat. Commun. 2026, 17, 5407. [Google Scholar] [CrossRef] [Scilit] [PubMed]
- Yang, J.; Sun, H.; Liu, Y.; Wang, X.; Valizadeh, K. The sorption of tebuconazole and linuron from an aqueous environment with a modified sludge-based biochar: Effect, mechanisms, and its persistent free radicals study. J. Chem. 2021, 2021, 2912054. [Google Scholar] [CrossRef] [Scilit]
- Dominguez, J.R.; González, T.; Simón-García, D. Greener catalytic oxidation of azole fungicides: Coupling EO–O3 on BDD with kinetics and mineralization targets. Catalysts 2025, 15, 1136. [Google Scholar] [CrossRef] [Scilit]
- Youness, M.; Sancelme, M.; Combourieu, B.; Besse-Hoggan, P. Identification of new metabolic pathways in the enantioselective fungicide tebuconazole biodegradation by Bacillus sp. 3B6. J. Hazard. Mater. 2018, 351, 160–168. [Google Scholar] [CrossRef] [Scilit] [PubMed]
- Lv, T.; Zhang, Y.; Casas, M.E.; Carvalho, P.N.; Arias, C.A.; Bester, K.; Brix, H. Phytoremediation of imazalil and tebuconazole by four emergent wetland plant species in hydroponic medium. Chemosphere 2016, 148, 459–466. [Google Scholar] [CrossRef] [Scilit] [PubMed]
- Dong, X.; Chu, Y.; Tong, Z.; Sun, M.; Meng, D.; Yi, X.; Gao, T.; Wang, M.; Duan, J. Mechanisms of adsorption and functionalization of biochar for pesticides: A review. Ecotoxicol. Environ. Saf. 2024, 272, 116019. [Google Scholar] [CrossRef] [Scilit] [PubMed]
- Ogura, A.P.; Lima, J.Z.; Marques, J.P.; Massaro Sousa, L.; Rodrigues, V.G.E.S.; Espíndola, E.L.G. A review of pesticides sorption in biochar from maize, rice, and wheat residues: Current status and challenges for soil application. J. Environ. Manag. 2021, 300, 113753. [Google Scholar] [CrossRef] [Scilit] [PubMed]
- Kpodo, F.M.; Adzinyo, O.A.; Agbenorhevi, J.K.; Hattoh, D.P.; Dzieketey, R.K.; Amanttesse, S.; Agbosoo, B.D. Physicochemical, rheological, and sensory properties of tomato ketchup stabilized by thickener blends. J. Food Process. Preserv. 2026, 2026, 5174738. [Google Scholar] [CrossRef] [Scilit]
- Memici, M.; Ekinci, K. Pyrolysis of tomato harvest waste as a function of temperature and duration: Characteristics, production energy, and carbon dioxide emission in field conditions. Soil Tillage Res. 2020, 202, 104652. [Google Scholar] [CrossRef] [Scilit]
- Stylianou, M.; Laifi, T.; Bennici, S.; Dutournie, P.; Limousy, L.; Agapiou, A.; Papamichael, I.; Khiari, B.; Jeguirim, M.; Zorpas, A.A. Tomato waste biochar in the framework of circular economy. Sci. Total Environ. 2023, 871, 161959. [Google Scholar] [CrossRef] [Scilit] [PubMed]
- Dunlop, S.J.; Arbestain, M.C.; Bishop, P.A.; Wargent, J.J. Closing the loop: Use of biochar produced from tomato crop green waste as a substrate for soilless, hydroponic tomato production. Hortscience 2015, 50, 1572–1581. [Google Scholar] [CrossRef] [Scilit]
- Llorach-Massana, P.; Lopez-Capel, E.; Peña, J.; Rieradevall, J.; Montero, J.I.; Puy, N. Technical feasibility and carbon footprint of biochar co-production with tomato plant residue. Waste Manag. 2017, 67, 121–130. [Google Scholar] [CrossRef] [Scilit] [PubMed]
- Gkiliopoulos, D.; Pemas, S.; Torofias, S.; Triantafyllidis, K.; Bikiaris, D.N.; Terzopoulou, Z.; Pechlivani, E.M. Valorization of tomato stem waste: Biochar as a filler in three-dimensional printed PLA composites. Polymers 2025, 17, 2565. [Google Scholar] [CrossRef] [Scilit] [PubMed]
- Stegarescu, A.; Lung, I.; Cârdan, A.; Bocșa, M.; Turza, A.; Lazar, M.D.; Dan, M.; Tripon, S.; Kacso, I.; Pintea, S.; et al. Composite materials based on biochar obtained from tomato wastes and Fe3O4/MnO2 used for paracetamol adsorption. Materials 2025, 18, 3914. [Google Scholar] [CrossRef] [Scilit] [PubMed]
- Cârdan, A.; Stegarescu, A.; Lung, I.; Opriş, O.; Chiș, A.M.R.A.; Kacso, I.; Lazar, M.D.; Gligor, D.L.A.M.R.A.; Turza, A.; Tripon, S.; et al. Assessment of biochar from tomato waste modified by acid activation and Fe3O4 modification for ciprofloxacin removal from wastewater. Anal. Lett. 2026, 1–18. [Google Scholar] [CrossRef] [Scilit]
- Pemas, S.; Gkiliopoulos, D.; Samiotaki, C.; Bikiaris, D.N.; Terzopoulou, Z.; Pechlivani, E.M. Valorization of tomato agricultural waste for 3D-printed polymer composites based on Poly(lactic acid). Polymers 2024, 16, 1536. [Google Scholar] [CrossRef] [Scilit] [PubMed]
- Feng, F.; Sun, X.; Jiang, W.; Ma, L.; Wang, Y.; Sheng, H.; Li, Y.; Yu, X. Stenotrophomonas pavanii DJL-M3 inoculated biochar stabilizes the rhizosphere soil homeostasis of carbendazim-stressed rice. Environ. Pollut. 2023, 329, 121723. [Google Scholar] [CrossRef] [Scilit] [PubMed]
- Liu, Y.; Ji, X.; Gao, Z.; Wang, Y.; Zhu, Y.; Zhang, Y.; Zhang, Y.; Sun, H.; Li, W.; Duan, J. Adsorption characteristics and removal mechanism of malathion in water by high and low temperature calcium–modified water hyacinth–based biochar. J. Clean. Prod. 2023, 411, 137258. [Google Scholar] [CrossRef] [Scilit]
- Khater, E.S.; Bahnasawy, A.; Hamouda, R.; Sabahy, A.; Abbas, W.; Morsy, O.M. Biochar production under different pyrolysis temperatures with different types of agricultural wastes. Sci. Rep. 2024, 14, 2625. [Google Scholar] [CrossRef] [Scilit] [PubMed]
- Pérez, S.; Fernandez-Ferreras, J.; Fernandez, I.; Pérez, L. Estimating biochar yield per hectare from logging residues in Eucalyptus globulus stands. Ind. Crops Prod. 2025, 230, 121098. [Google Scholar] [CrossRef] [Scilit]
- Rambhatla, N.; Panicker, T.F.; Mishra, R.K.; Manjeshwar, S.K.; Sharma, A. Biomass pyrolysis for biochar production: Study of kinetics parameters and effect of temperature on biochar yield and its physicochemical properties. Results Eng. 2025, 25, 103679. [Google Scholar] [CrossRef] [Scilit]
- Zhang, J.; Liu, J.; Liu, R. Effects of pyrolysis temperature and heating time on biochar obtained from the pyrolysis of straw and lignosulfonate. Bioresour. Technol. 2015, 176, 288–291. [Google Scholar] [CrossRef] [Scilit] [PubMed]
- Lee, Y.E.; Jeong, Y.; Shin, D.C.; Ahn, K.H.; Jung, J.H.; Kim, I.T.E. Fabrication of Mg-doped sargassum biochar for phosphate and ammonium recovery. Sustainability 2021, 13, 12752. [Google Scholar] [CrossRef] [Scilit]
- Zhao, B.; Xu, H.; Zhang, T.; Nan, X.; Ma, F. Effect of pyrolysis temperature on sulfur content, extractable fraction and release of sulfate in corn straw biochar. Rsc. Adv. 2018, 8, 35611–35617. [Google Scholar] [CrossRef] [Scilit] [PubMed]
- Li, X.; Shi, J.; Luo, X. Enhanced adsorption of rhodamine B from water by Fe-N co-modified biochar: Preparation, performance, mechanism and reusability. Bioresour. Technol. 2022, 343, 126103. [Google Scholar] [CrossRef] [Scilit] [PubMed]
- Zhang, P.; Sun, H.; Yu, L.; Sun, T. Adsorption and catalytic hydrolysis of carbaryl and atrazine on pig manure-derived biochars: Impact of structural properties of biochars. J. Hazard. Mater. 2013, 244–245, 217–224. [Google Scholar] [CrossRef] [Scilit] [PubMed]
- Kutarov, V.V.; Robens, E.; Tarasevich, Y.I.; Aksenenko, E.V. Adsorption hysteresis at low relative pressures. Theor. Exp. Chem. 2011, 47, 163–168. [Google Scholar] [CrossRef] [Scilit]
- Tomczyk, A.; Sokołowska, Z.; Boguta, P. Biochar physicochemical properties: Pyrolysis temperature and feedstock kind effects. Rev. Environ. Sci. Biotechnol. 2020, 19, 191–215. [Google Scholar] [CrossRef] [Scilit]
- Tan, H.; Huang, H.; Guan, Z.; Qian, Y.; Deng, Y.; Chen, G. Understanding of the effect of nitrogen-doping level and micropore volume ratio on the capacitive performance of N,S-codoped hierarchically porous carbon. Electrochim. Acta 2020, 354, 136639. [Google Scholar] [CrossRef] [Scilit]
- Zeng, X.Y.; Wang, Y.; Li, R.X.; Cao, H.L.; Li, Y.F.; Lü, J. Impacts of temperatures and phosphoric-acid modification to the physicochemical properties of biochar for excellent sulfadiazine adsorption. Biochar 2022, 4, 14. [Google Scholar] [CrossRef] [Scilit]
- Xiong, Z.; Huanhuan, Z.; Jing, W.; Wei, C.; Yingquan, C.; Gao, X.; Haiping, Y.; Hanping, C. Physicochemical and adsorption properties of biochar from biomass-based pyrolytic polygeneration: Effects of biomass species and temperature. Biochar 2021, 3, 657–670. [Google Scholar] [CrossRef] [Scilit]
- Zhou, X.; Huang, Q.; Yang, C.; Li, J.; Chen, M.; Wu, S. Aging mitigation mechanism of biochar modified bio-asphalt using FT-IR microscope and machine learning. J. Clean. Prod. 2026, 557, 148260. [Google Scholar] [CrossRef] [Scilit]
- Chen, B.; Zhou, D.; Zhu, L. Transitional Adsorption and Partition of Nonpolar and Polar Aromatic Contaminants by Biochars of Pine Needles with Different Pyrolytic Temperatures. Environ. Sci. Technol. 2008, 42, 5137–5143. [Google Scholar] [CrossRef] [Scilit] [PubMed]
- Qian, L.; Chen, B. Interactions of Aluminum with biochars and oxidized biochars: Implications for the Biochar Aging Process. J. Agric. Food Chem. 2014, 62, 373–380. [Google Scholar] [CrossRef] [Scilit] [PubMed]
- Wang, P.; Liu, X.; Wu, X.; Xu, J.; Dong, F.; Zheng, Y. Evaluation of biochars in reducing the bioavailability of flubendiamide in water/sediment using passive sampling with polyoxymethylene. J. Hazard. Mater. 2018, 344, 1000–1006. [Google Scholar] [CrossRef] [Scilit] [PubMed]
- Cen, K.; Li, X.; Ni, X.; Qiu, L.; Chen, D. Torrefaction pretreatment for regulating the co-production of gaseous and biochar during lignin pyrolysis. Ind. Crops Prod. 2026, 246, 123383. [Google Scholar] [CrossRef] [Scilit]
- Majee, P.; Periyavaram, S.R.; Uppala, L.; Reddy, P.H.P. Physicochemical and energy characteristics of biochar and hydrochar derived from cotton stalks: A comparative study. Bioenerg. Res. 2025, 18, 20. [Google Scholar] [CrossRef] [Scilit]
- Huo, R.; Di, Y.; Li, W.; Wu, C.; Cui, Y.; Zhou, S. Denitrification performance in low C/N water by aerobic denitrifying bacterial consortia coupled with biochar: Effects of pyrolysis temperature and dissolved oxygen. J. Environ. Chem. Eng. 2026, 14, 123603. [Google Scholar] [CrossRef] [Scilit]
- Wu, J.; Huang, M.; Zhao, X.; Liao, X.; Hou, Z.; Li, B. Efficiency of peanut shell biochar for cadmium and lead adsorptive immobilization in aqueous solution and contaminated soil. J. Soil Sediments 2026, 26, 195. [Google Scholar] [CrossRef] [Scilit]
- Rajammal, T.S.J.; Pandurangan, V.; Murugaiyan, B.; Chockalingam, V.; Ramjani, S.A. Metabolomic profiling of paper board sludge biochar for agricultural use. Environ. Monit. Assess. 2025, 197, 244. [Google Scholar] [CrossRef] [Scilit] [PubMed]
- Lee, W.H.E.; Kim, J.O. Mechanisms and novel performance of ZrO2/Fe3O4 composite for phosphate recovery from wastewater. Chem. Eng. J. 2023, 453, 139817. [Google Scholar] [CrossRef] [Scilit]
- Li, H.; Tan, Z. Preparation of high water-retaining biochar and its mechanism of alleviating drought stress in the soil and plant system. Biochar 2021, 3, 579–590. [Google Scholar] [CrossRef] [Scilit]
- Janu, R.; Mrlik, V.; Ribitsch, D.; Hofman, J.; Sedláček, P.; Bielská, L.; Soja, G. Biochar surface functional groups as affected by biomass feedstock, biochar composition and pyrolysis temperature. Carbon Resour. Convers. 2021, 4, 36–46. [Google Scholar] [CrossRef] [Scilit]
- Wu, F.C.; Tseng, R.L.; Juang, R.S. Characteristics of Elovich equation used for the analysis of adsorption kinetics in dye-chitosan systems. Chem. Eng. J. 2009, 150, 366–373. [Google Scholar] [CrossRef] [Scilit]
- Sukor, N.F.; Jusoh, R. Hybrid activated carbon/ maltodextrin-functionalized fibrous silica for acetaminophen and amoxicillin adsorption: Advanced statistical physics modelling. Environ. Res. 2025, 278, 121691. [Google Scholar] [CrossRef] [Scilit] [PubMed]
- Meng, Q.; Zhang, Y.; Meng, D.; Liu, X.; Zhang, Z.; Gao, P.; Lin, A.; Hou, L. Removal of sulfadiazine from aqueous solution by in-situ activated biochar derived from cotton shell. Environ. Res. 2020, 191, 110104. [Google Scholar] [CrossRef] [Scilit] [PubMed]
- Li, R.; Zhang, C.; Chen, W.H.; Kwon, E.E.; Rajendran, S.; Zhang, Y. Multistage utilization of soybean straw-derived P-doped biochar for aquatic pollutant removal and biofuel usage. Bioresour. Technol. 2023, 387, 129657. [Google Scholar] [CrossRef] [Scilit] [PubMed]
- Xu, C.; Wang, Y.; Ma, X.; Wang, X.; Yang, Y.; Zhang, Q. High-efficient removal of tebuconazole from aqueous solutions using P-doped corn straw biochar: Performance, mechanism and application. Bioresour. Technol. 2024, 412, 131387. [Google Scholar] [CrossRef] [Scilit] [PubMed]
- Ding, H.; Zhang, Z.; Li, Y.; Ding, L.; Sun, D.; Dong, Z. Fabrication of novel Fe/Mn/N co-doped biochar and its enhanced adsorption for bisphenol a based on π–π electron donor–acceptor interaction. Bioresour. Technol. 2022, 364, 128018. [Google Scholar] [CrossRef] [Scilit] [PubMed]
- Zhang, P.; Li, Y.; Cao, Y.; Han, L. Characteristics of tetracycline adsorption by cow manure biochar prepared at different pyrolysis temperatures. Bioresour. Technol. 2019, 285, 121348. [Google Scholar] [CrossRef] [Scilit] [PubMed]
- Jiang, J.; Peng, Y.; Yuan, M.; Hong, Z.; Wang, D.; Xu, R. Rice Straw-Derived Biochar Properties and Functions as Cu(II) and Cyromazine Sorbents as Influenced by Pyrolysis Temperature. Pedosphere 2015, 25, 781–789. [Google Scholar] [CrossRef] [Scilit]
- Ščasná, M.; Hebnár, M.; Kucmanová, A.; Sirotiak, M.; Kvorková, V.; Soldán, M.; Hajzler, J.; Ludrovcová, B.; Palcut, M. Thermal Conversion of Paulownia tomentosa Leaves into Carbonaceous Materials: Effects on Physicochemical Properties and Sorption of Metribuzin and Tebuconazole from Water. Technologies 2026, 14, 396. [Google Scholar] [CrossRef] [Scilit]
- Lee, Y.G.; Shin, J.; Kwak, J.; Kim, S.; Son, C.; Kim, G.Y.; Lee, C.H.; Chon, K. Enhanced Adsorption Capacities of Fungicides Using Peanut Shell Biochar via Successive Chemical Modification with KMnO4 and KOH. Separations 2021, 8, 52. [Google Scholar] [CrossRef] [Scilit]
- Liu, Y.; Gao, Z.; Ji, X.; Wang, Y.; Zhang, Y.; Sun, H.; Li, W.; Wang, L.; Duan, J. Efficient Adsorption of Tebuconazole in Aqueous Solution by Calcium Modified Water Hyacinth-Based Biochar: Adsorption Kinetics, Mechanism, and Feasibility. Molecules 2023, 28, 3478. [Google Scholar] [CrossRef] [Scilit] [PubMed]
- Pathy, A.; Krishnamoorthy, N.; Chang, S.X.; Paramasivan, B. Malachite green removal using algal biochar and its composites with kombucha SCOBY: An integrated biosorption and phycoremediation approach. Surf. Interfaces 2022, 30, 101880. [Google Scholar] [CrossRef] [Scilit]
- Tang, J.; Ding, G.; Niu, J.; Zhang, W.; Tang, G.; Liang, Y.; Fan, C.; Dong, H.; Yang, J.; Li, J.; et al. Preparation and characterization of tebuconazole metal-organic framework-based microcapsules with dual-microbicidal activity. Chem. Eng. J. 2019, 359, 225–232. [Google Scholar] [CrossRef] [Scilit]
- Song, R.; Fei, Y.; Meng, Z.; Liu, B.; Wang, B.; Li, C.; Gao, H.; Lu, R.; Zhou, W. Efficient removal of tebuconazole from wastewater by zinc-modified passion fruit peels: Adsorption behaviour and mechanism. Can. J. Chem. Eng. 2025, 103, 2541–2554. [Google Scholar] [CrossRef] [Scilit]

Disclaimer/Publisher’s Note: The statements, opinions and data contained in all publications are solely those of the individual author(s) and contributor(s) and not of MDPI and/or the editor(s). MDPI and/or the editor(s) disclaim responsibility for any injury to people or property resulting from any ideas, methods, instructions or products referred to in the content. |
© 2026 by the authors. Licensee MDPI, Basel, Switzerland. This article is an open access article distributed under the terms and conditions of the Creative Commons Attribution (CC BY) license.