


Abstract
Remote islands face interconnected challenges of high dependence on diesel, expensive electricity, and limited freshwater availability. This study develops an integrated renewable energy–seawater reverse osmosis (SWRO) system for the Cocos (Keeling) Islands, Australia, and evaluates its technical, economic, and carbon performance using HOMER Pro. The proposed system simultaneously supplies community electricity demand and a 240 m3/day SWRO plant with a specific energy consumption of 3.5 kWh/m3. The optimal configuration consists of 2656 kW Flat-plate PV, three 100 kW wind turbines, 6640 Li-ion battery units, an 870 kW converter, and diesel backup, achieving a renewable fraction of 98.3%. Compared with the diesel-based system, the proposed configuration reduces the net present cost from A$51.7 million to A$7.55 million and the levelized cost of electricity from A$1.30/kWh to A$0.189/kWh. Annual diesel consumption decreases from 1,107,017 to 13,579 L, while CO2 emissions decline from 2,923,510 to 35,860 kg/year, corresponding to approximately 98.8% reductions in both indicators. The system provides a 1.12-year payback period, a 92.1% return on investment, an 89.9% internal rate of return, a A$46.8 million net present value, and A$2.44 million in annualized savings. Sensitivity analysis across diesel prices of A$2–4/L and discount rates of 4–12% confirms high renewable penetration (93.5–98.8%) across the investigated conditions. The novelty of this work is an integrated, renewable-dominated electricity and desalination pathway for a remote Australian island community that addresses energy security, freshwater security, lifecycle cost, and operational carbon emissions.
1. Introduction
The global water crisis has become one of the most urgent and complex challenges of our time. As essential to life, water is vital to many aspects of human existence, from drinking and sanitation to agriculture, industry, and healthy ecosystems. However, population growth, urbanization, pollution, climate change, and inefficient water management have worsened water scarcity, reduced water quality, and increased unequal access to clean water worldwide. Today, billions of people face water-related challenges that affect their health, livelihoods, and overall well-being. The United Nations reports that more than two billion people live in countries facing high water stress. By 2030, nearly half of the world’s population is expected to live in areas with limited access to clean water [1]. Poor sanitation and contaminated water sources also spread waterborne diseases, causing serious public health crises.
Water scarcity extends beyond human welfare because it also threatens ecosystem integrity, biodiversity, and food security. Declining water availability can alter river flows, degrade wetlands and freshwater habitats, and reduce the ecological functions that support aquatic and terrestrial species. Freshwater ecosystems are particularly vulnerable; they support substantial biodiversity despite occupying only a small fraction of the Earth’s surface, while many rivers, lakes, and wetlands are undergoing rapid ecological change [2]. UN Water: Agriculture is especially exposed to water scarcity because it accounts for approximately 70–72% of global freshwater withdrawals, making reliable water availability fundamental to agricultural productivity and food security [3]. UNESCO: Increasing competition for limited freshwater resources, together with climate change and population growth, therefore requires integrated water-management strategies that combine efficient resource use, technological innovation, ecosystem protection, improved governance, and investment in resilient water infrastructure. International cooperation and inclusive water governance are also essential for improving water security while supporting economic development, food production, and environmental sustainability [4].
Furthermore, achieving United Nations Sustainable Development Goal 6—which seeks to ensure access to water and sanitation for all and their sustainable management—requires a collective effort from governments, businesses, civil society, and individuals [5,6,7]. This includes promoting water conservation, implementing efficient irrigation techniques, adopting innovative water treatment and desalination technologies, and prioritizing the protection and restoration of water ecosystems. This paper evaluates a renewable-powered SWRO system for Cocos Island and potential solutions. By understanding the scale and complexity of this global challenge and exploring ways to address it, we can work toward a more sustainable, equitable, and water-secure future for everyone. The complex relationship between water and energy, known as the “water and energy nexus,” has become an important area of study and concern in our rapidly changing world. Water and energy are vital, closely connected resources: water is essential for producing energy, while energy is needed to extract, treat, and distribute water. This interdependence has profound implications for sustainable development, environmental conservation, and economic stability.
The water–energy nexus centers on how closely water availability and management are linked to energy production and consumption and vice versa. Energy generation, including hydroelectric power, fossil fuel extraction, and nuclear power, often requires substantial amounts of water for cooling and processing. Conversely, water supply and treatment facilities require energy for pumping, purification, and distribution. Climate change and population growth further complicate the water–energy nexus. The increasing demand for both water and energy, coupled with changing precipitation patterns and rising global temperatures, creates a complex web of challenges and trade-offs. As water becomes scarcer or more polluted, energy production and efficiency may suffer, while energy choices and consumption patterns can strain water resources and exacerbate water stress.
Understanding and managing the water–energy nexus is essential to tackling today’s most pressing global challenges. Achieving sustainable development goals, including universal access to clean water and affordable energy, reducing greenhouse gas emissions, and protecting ecosystems requires an integrated approach that recognizes the complex connections between water and energy [8]. Reverse osmosis (RO) is a transformative technology with broad applications, especially in water treatment and purification. Based on selective permeability, RO has transformed impurity removal from water. It is now a vital tool for addressing water scarcity, improving water quality, and ensuring access to safe drinking water. RO uses pressure to push water molecules to pass through a semipermeable membrane while blocking contaminants such as salts, minerals, bacteria, viruses, and other pollutants [9,10,11]. This mechanism effectively separates pure water from impurities in the source water, producing clean, potable water suitable for various uses.
RO is significant because it can treat a wide range of water sources, including seawater, brackish water, and wastewater, to produce freshwater for drinking, industrial use, and irrigation. By removing harmful substances, including chemicals, heavy metals, and pathogens, RO plays a crucial role in protecting public health and preventing waterborne diseases [12,13,14]. RO technology has played a key role in addressing water scarcity in regions with limited or contaminated freshwater resources. Desalination, which removes salt and other minerals from seawater, is now a major RO application, giving coastal areas a reliable source of freshwater for drinking and irrigation.
Moreover, RO has also been used to treat brackish water, which contains less salt than seawater but still requires purification [15]. Additionally, RO is widely used in various industries, including pharmaceuticals, food and beverage production, and electronics manufacturing, where removing impurities is critical for product quality and process efficiency [16,17,18,19]. Its efficiency and versatility make it an indispensable tool for water treatment in both large-scale facilities and small-scale, decentralized systems. Despite its numerous benefits, RO does face certain challenges. It requires significant energy to generate the pressure needed for water filtration, and the process can produce wastewater, known as brine, that requires proper disposal to avoid environmental harm [20]. Additionally, feed water quality and membrane system maintenance affect RO effectiveness.
This study will examine the intricacies of RO technology, exploring its principles, applications, advantages, limitations, and ongoing advancements. By understanding RO’s capabilities and considerations, we can appreciate its role in improving water quality, supporting sustainable development, and providing a vital resource for communities worldwide. Combining renewable energy with RO technology offers a promising way to address two critical global challenges: the need for clean, sustainable energy and the growing demand for freshwater [21,22,23,24]. Renewable energy sources like solar and wind provide a clean, abundant alternative to fossil fuels. RO, meanwhile, is a leading method for desalinating seawater into freshwater. Using renewable energy to power RO can create a sustainable path to both energy production and freshwater generation.
Integrating renewable energy sources, such as solar photovoltaics and wind turbines, into the RO process offers several advantages. First, it reduces dependence on fossil-fuel-powered electricity grids, lowering greenhouse gas emissions and helping mitigate climate change. Second, because renewable energy systems are typically decentralized, they can enable desalination plants to operate in remote areas with limited access to freshwater. This approach can strengthen water security and resilience in regions facing water scarcity or lacking reliable infrastructure. Integrating renewables with RO also creates economic opportunities. As renewable energy technologies become more affordable, using clean energy for desalination can lower costs and make freshwater production more accessible [21].
Additionally, it can create jobs in the renewable energy sector, supporting economic growth and energy security. However, realizing the full potential of renewable energy and RO requires addressing several challenges and barriers. These include advancing technologies to optimize energy use and improve RO process efficiency, and developing energy storage systems to maintain continuous water production when renewable energy generation is intermittent. Figure 1 presents the country’s electricity generation mix by source in 2020.
Figure 1.
Electricity generation mix by source in Australia and the Cocos (Keeling) Islands [25,26].
This study evaluates a renewable-dominated hybrid power-supply system for the Cocos (Keeling) Islands, Australia, designed to meet community electricity demand and the predefined electrical demand of a seawater reverse osmosis (SWRO) plant. Using HOMER Pro, it identifies the optimal mix and capacity of solar PV, wind turbines, battery storage, converters, and diesel backup needed to serve the combined loads. It also assesses renewable penetration, economic performance, diesel dependence, and operational emissions under selected sensitivity scenarios. The economic analysis focuses on the hybrid power-supply system; detailed desalination-specific capital and operating costs are outside the study’s scope.
This study’s novelty lies not in proposing a new SWRO technology or HOMER optimization algorithm, but in developing an integrated, location-specific water–energy planning framework for the Cocos (Keeling) Islands. Whereas previous studies often assess renewable microgrids and desalination systems separately, this work brings community electricity demand and SWRO electricity demand into a single optimization framework. It simultaneously evaluates renewable penetration, lifecycle electricity costs, investment performance, diesel dependence, and operational emissions. The study also tests the robustness of the optimized configuration under multiple diesel-price and discount-rate scenarios. The practical contribution is an island-specific transition pathway linking renewable-energy system design to freshwater-production needs and investment decisions in a remote community dependent on diesel.
2. Methodology
The evaluation of renewable energy projects typically involves applying suitable criteria to site-specific data in order to examine how each candidate scenario would operate. The analytical framework adopted in this research is as follows [27]:
- (a)
- Location details.
- (b)
- The data required for modeling, namely:
- (i)
- The average electrical load demand,
- (ii)
- The location’s clearness index and daily radiation,
- (iii)
- The location’s daily temperature.
- (c)
- System Architecture.
The collected site data was plotted and examined against these criteria. Each criterion was addressed in turn to characterize the overall system design, paying special attention to the choice of renewable energy components. Simulations were run in HOMER Pro version 3.18.5, developed and distributed by HOMER Energy, LLC (Boulder, CO, USA). The program originated at the US Department of Energy’s National Renewable Energy Laboratory (NREL) in 1992 as a more efficient means of modeling hybrid energy systems and finding ways to lower electricity costs in stand-alone renewable installations.
The software is widely used to perform techno-economic analyses of renewable energy simulations in off-grid systems [28,29,30,31,32]. It combines engineering and economic inputs in one model, so it can run complex calculations quickly to evaluate self-consumption value, optimization, sensitivity analysis, and energy arbitrage. Users can compare components and design outputs, find cost-competitive break-even points for alternative technologies, test strategies to reduce project risk, and identify the cheapest design. Because it mimics real-world behavior, it also helps system designers and optimizers decide with greater confidence. Figure 2 outlines the methodology flowchart.
Figure 2.
Methodology framework.
2.1. Location Details
The Territory of the Cocos (Keeling) Islands lies at 96°50′ E, 12°10′ S and is Australia’s westernmost tropical territory. It comprises 27 coral islands arranged in two atolls in the Indian Ocean, roughly 2770 km northwest of Perth. Together they cover 15.6 square kilometers of land and are home to 593 people, most of whom live on Home Island and West Island [33]. The northern atoll contains North Keeling Island; the surrounding waters out to 1.5 km form Pulu Keeling National Park, Australia’s most remote Commonwealth national park. The islands sit in the Indian Ocean 2936 km northwest of Perth and 1270 km southwest of Jakarta, Indonesia. Table 1 summarizes the present population. Figure 3 maps the islands and marks the facility’s location on a map of Australia.
Table 1.
Current population overview [33].
Figure 3.
(A) Facility location on the map of Australia and (B) the topographic view of the location [18].
2.2. Modeling Data
2.2.1. Average Electrical Load Demand
Some input data are needed to determine the optimal system configuration that delivers the best output at the lowest cost for this hybrid renewable energy system. Australian household electricity consumption varies with household size, location, climate, appliances, and occupant behavior. Australian Government benchmark data indicate daily electricity use ranging from approximately 8 to 23 kWh/day across household sizes [34], with values around 17–19 kWh/day reported for three- to four-person households. Therefore, this study adopted 18 kWh/household/day as a representative design value. The Australian Bureau of Statistics reported an average household size of 2.5 persons in Australia based on the 2021 Census. However, since the project is designed for 25 years, it is projected to be around 1000 residents; therefore (Equations (1) and (2)):
where Nh is the total household population size and Ecommunity is the total electricity consumption by the entire community. This gives approximately a daily electricity consumption (Edaily) and average power (Paverage) as shown in Equations (3) and (4):
Ecommunity = 400 × 18 = 7200 kWh/day
Edaily = 7200 kWh/day
The shape assumes relatively low overnight consumption, a morning increase between 06:00 and 09:00, moderate daytime demand, and the highest residential demand in the evening. The hourly values below are a synthetic engineering load profile scaled to exactly 7200 kWh/day. HOMER Pro uses these data to project the system’s load demand from the commercial electric load. One shortcoming of this approach is that no measured hourly electricity-demand data exists for the islands. The synthetic load profile reproduces a representative daily residential pattern, but it may not fully capture future variations in peak demand, peak timing, weekday–weekend differences, seasonal changes, tourism-related demand, or short-duration load fluctuations. These uncertainties can affect how the simulation sizes and dispatches PV, wind, battery storage, converters, and diesel generators, and may therefore alter estimates of renewable fraction, fuel consumption, NPC, and LCOE. Consequently, read the results as a planning-level assessment, not a forecast of actual hourly operation. Future work should incorporate measured hourly electricity-demand data over at least one full year to improve the accuracy of load characterization, component sizing, operational scheduling, and economic performance.
2.2.2. Electric Load Demand for Reverse Osmosis
The island has limited clean water sources; therefore, renewable energy will be used not only to generate electricity but also to produce clean water. The clean-water system relies on RO, a purification process in which a semi-permeable membrane removes ions, unwanted molecules, and larger particles from the water. To determine the electricity load, the island’s water consumption must be identified first. Although the current population is only 593 (Table 1), the design is for the next 25 years. Because of the island’s small area, the facilities are designed for a population of 1000, and the remaining water-consumption data are calculated and presented in Table 2.
Table 2.
Water consumption on the island [35,36,37].
For this system, 240 m3/day is selected, including a 25.8% design reserve above 190.795 m3/day. The adopted SEC of 3.5 kWh/m3 [38] represents the total plant-level electricity requirement, not just the membrane high-pressure pumping energy. This value falls within the range reported in several references for full-scale SWRO plants and is consistent with modern systems incorporating efficient pumps and energy-recovery devices [39,40,41]. For a freshwater production capacity of 240 m3/day, the corresponding daily electricity requirement was 840 kWh/day. Assuming continuous 24 h operation, this is equivalent to an average RO electrical load of 35 kW. If both loads were operating simultaneously, the total system demand would range from about 192 kW to 612 kW, with a total daily electrical energy requirement of approximately 7200 + 840 = 8040 kWh/day. This is for the Cocos (Keeling) Islands renewable-energy system modeling. The RO electrical load is assumed to remain constant throughout the year, whereas the community load varies hourly. Figure 4 shows both load profiles. Figure 4 shows both load profiles.
Figure 4.
Predicted average electric load profile of the island.
2.2.3. Radiation, Clearness Index and Temperature
The clearness index, reported with daily radiation, reflects atmospheric transparency. It expresses the fraction of incoming solar energy that traverses the atmosphere and arrives at ground level, and is a dimensionless value from 0 to 1 obtained by dividing surface radiation by extraterrestrial radiation. Clear, sunny conditions produce a high index, whereas overcast skies produce a low one [42]. Figure 5 plots the daily solar radiation, clearness index, and mean wind speed at the site [43,44].
Figure 5.
Mean daily radiation, wind speed, and clearness index at the site.
2.3. Base Case and Proposed System Architecture
Before simulating the renewable energy system, its architecture must be defined. The candidate system includes solar PV, wind turbines, Li-ion battery storage, converters, and the generators already on the islands, and the software selects the best configuration. Figure 6 sketches the proposed architecture, and Table 3 lists the proposed system details. Here, solar PV, wind turbines, and a battery energy storage system serve the load, all connected to the microgrid along with the two generators that make up the base system.
Figure 6.
Proposed system architecture.
Table 3.
Detailed information about the proposed system architecture.
2.3.1. Photovoltaic
A derating factor, a scaling factor applied to the PV array output, is included to account for these losses, including those attributable to PV panel soiling [48]. Equation (5) gives the PV array’s energy output [42]:
where fPV is the derating factor, YPV is the total installed capacity of the PV panel, IT is the solar irradiation and IS = 1 kW/m2. The price of solar PV will decrease as installation capacity increases (in kW). The project price will decrease by 93% for 10 kW, 66% for 1000 kW, and 54% for 2000 kW [49]. The solar PV price used for this calculation is shown in Table 4.
Table 4.
Solar PV cost is based on the installed capacity.
2.3.2. Wind Turbine
The software models a wind turbine as a device that converts wind’s kinetic energy into AC or DC electricity. It estimates hourly electricity production using a power curve (power output versus wind speed at hub height) in four steps. First, wind resource data determines the average wind speed at anemometer height for the hour. Second, the software uses either the logarithmic or power-law method to calculate wind speed at the turbine’s hub height. Third, it uses the turbine’s power curve to determine power output at that wind speed, assuming standard air density. Fourth, it applies the ratio of actual to standard air density to the total power output. The software extrapolates wind speed data using the power-law formula below (Equation (6)):
where Uhub is the wind speed at the wind turbine hub height [m/s], Uanem is the wind speed at anemometer height [m/s], Zhub is the wind turbine hub height [36 m], Zanem is the anemometer height [m], and α is the power-law exponent. When corrected for air density, power curves generally describe wind turbine performance under standard temperature and pressure (STP) conditions. To account for real-world conditions, the program multiplies the power value estimated from the curve by the air density ratio, as shown in Equation (7):
where PWTG is the wind turbine power output [kW], PWTG,STP is the wind turbine power output at standard temperature and pressure [kW], ρ is the actual air density [kg/m3], and ρo is the air density at standard temperature and pressure (1.225 kg/m3). According to the IRENA report on Renewable Power Generation Costs in 2025, the weighted-average total installed cost (TIC) for onshore wind in Australia is US$1787/kW, which corresponds to US$178,700, or approximately A$251,690 for 100 kW [46].
2.3.3. Battery
In the software, a battery is modeled as a unit that holds a given amount of DC energy at a constant efficiency and is limited in how fast it can charge and discharge, and how much energy can pass through it before replacement is needed. The program assumes that these battery characteristics stay constant over time and do not respond to environmental factors such as temperature. Several batteries grouped together form a battery bank. HOMER estimates the bank’s lifetime by tracking the energy cycled through it because, in this model, lifetime throughput does not depend on depth of discharge. The lifetime of the bank in years follows from the equation below (Equation (8)):
where Rbatt is the storage bank life [year], Nbatt is the number of storage bank batteries, Qlifetime is the single-storage lifetime throughput [kWh], Qthrpt is the annual storage throughput [kWh/year], and Rbatt,f is the storage float life [year]. The cost of cycling energy through the storage bank reflects battery wear. If the storage characteristics indicate that throughput limits storage life, the program estimates that the bank must be replaced once its total throughput reaches its lifetime throughput. Thus, each kWh of throughput brings the bank closer to replacement. The software uses Equation (9) to calculate the cost of storage wear:
where Crep,batt is the storage bank replacement cost [A$], Nbatt is the number of batteries in the storage bank, Qlifetime is the single storage lifetime throughput [kWh], and ηrt is the storage round-trip efficiency [fractional]. As installed capacity increases, the price of a 1 kWh Li-Ion [ASM] battery will decrease. For this project, it will fall to 73%, 61%, 57%, and 54% of its initial price at capacities of 200 kWh, 2000 kWh, 8000 kWh, and 16,000 kWh, respectively [49]. Table 5 tabulates the generic 1 kWh Li-Ion battery capacity and price.
Table 5.
The generic 1 kWh Li-Ion battery capacity and price.
2.3.4. Converter
A converter changes electrical power from DC to AC when inverting and from AC to DC when rectifying. Its rated size is the inverter capacity, meaning the largest AC output obtainable from DC input. Rectifier capacity is expressed as a percentage of inverter capacity and reflects the largest DC output obtainable from AC input. Inverter and rectifier operation are both continuous rather than limited to surge periods, so the device can follow the load demand set in the software. To work properly, the inverter must be synchronized with the AC frequency, a capability that some inverters do not have. The software treats the inversion and rectification efficiencies as the main physical characteristics and holds them constant. Economically, converter costs include initial capital, replacement cost (dollars per year), and expected lifespan (years).
2.3.5. Generator
In the base system, diesel generators are the conventional generation technology, and in the proposed hybrid system they supply dispatchable backup power. During optimization, the software tests the generator capacities provided and computes the capital, replacement, operation and maintenance, and fuel costs of each feasible configuration. A linear fuel curve that relates fuel use to electrical output describes the fuel consumption of a diesel generator, and the hourly consumption is computed as:
where F is the fuel consumption rate (L/h), F0 is the fuel-curve intercept coefficient (L/h/kW rated), F1 is the fuel-curve slope (L/h/kW output), Ygen is the rated generator capacity (kW), and Pgen is the generator electrical output (kW). When the generator is not operating, its fuel consumption is zero. The annual specific fuel consumption can subsequently be determined from:
where Ftot is the total annual diesel consumption (L/year) and Egen is the annual electrical energy generated (kWh/year). These relationships are particularly important in the present study because generator fuel consumption directly influences operating expenditure, the levelised cost of electricity, renewable-energy penetration, and emissions. The generator electrical efficiency can be calculated as follows:
where ηgen is the average generator electrical efficiency, Egen is annual electrical production (kWh/year), mfuel is annual fuel consumption by mass (kg/year), and LHVfuel is the lower heating value of diesel (43.2 MJ/kg). The conversion factor 3.6 is used to convert kWh to MJ.
F = F0Ygen + F1Pgen
2.4. Economic Analysis
Several economic inputs are needed to conduct the techno-economic analysis of this renewable energy engineering system, including the nominal discount rate, expected inflation rate, and project lifetime. Table 6 lists the data required for the analysis.
Table 6.
Economic data inputs.
2.4.1. Interest Rate
The annual real interest rate, also called the real discount rate or simply the interest rate, is an input to the program. It converts one-time costs into annualized costs. The yearly real interest rate is linked to the nominal interest rate by the following equation [42]:
In this equation, the real interest rate is i, the nominal interest rate is i′ (the rate at which the project may obtain a loan), and the annual inflation rate is f.
2.4.2. Levelized Cost of Energy
The software defines the levelized cost of energy (LCOE) as the mean cost of each kWh of useful electricity the system generates. It is computed by dividing the annual cost of generation, which equals the total annualized cost minus the cost of serving the thermal load, by the total useful electrical energy delivered. The calculation uses the following equation [42]:
In this equation: Cann,tot is the total annualized cost [$/year], Eprim,AC is the AC primary load served [kWh/year], Eprim,DC is the DC primary load served [kWh/year], and Egrid,sales is the total grid sales [kWh/year]. The total annualized cost is the sum of the annualized costs of each system component and any other annualized expenses.
2.4.3. Net Present Cost (NPC)
A system’s total net present cost (NPC) is the present value of all expenditures over its lifespan minus the present value of all income earned during that period. Costs include capital expenses, replacement costs, operations and maintenance, fuel, pollution fines, and grid electricity. Revenue includes salvage value and income from grid sales. The total NPC is calculated by summing the discounted cash flows for each year of the project lifecycle, as shown below [42]:
In this equation, Cann,tot is the total annualized cost [A$/year], CRF is the capital recovery factor, i is the real interest rate [%], and Rproj is the project lifetime [year], which is 25 years in this study. The capital recovery factor is the ratio that converts an annuity, meaning a stream of equal yearly cash flows, into its present value, and it is given by [42]:
where i is the real interest rate (%), and N is the number of years.
2.4.4. Salvage Value
Salvage value is the worth attributed to a power-system component that is still serviceable when the project ends. The software estimates the residual value of each component at the end of the project life with the following equation:
where S is the salvage value, Crep is the component replacement cost, Rrem is the remaining life, and Rcomp is the component lifespan.
2.4.5. Internal Rate of Return (IRR)
The internal rate of return (IRR) is the discount rate that sets the net present value (NPV) of the incremental cash flows of the optimized system relative to the base system to zero. Here, the incremental cash flow is the yearly difference between the cash flows of the optimized and base systems across the project lifetime. IRR thus measures how financially attractive it is to invest in the optimized system instead of keeping the base system, and it can be expressed as:
where Ccap is the capital cost of the optimized system (A$), Ccap,ref is the capital cost of the base (reference) system (A$); Ci,ref is the nominal annual cash flow of the base (reference) system in year i(A$), and Ci is the nominal annual cash flow of the optimized system in year i(A$).
2.4.6. Return on Investment (ROI)
Return on investment (ROI) expresses the mean yearly cost saving delivered by the optimized system relative to the extra up-front capital it requires over the base system. The software obtains ROI by dividing the mean annual difference between the nominal cash flows of the base and optimized systems over the project lifetime by the difference in their initial capital costs. A larger ROI means a greater economic payoff from the optimized system. ROI is evaluated with the equation below:
where Ci,ref is the annual nominal cash flow of the base (reference) system, Ci is that of the current system, and Rproj is the project lifetime in years; Ccap is the capital cost of the current system and Ccap,ref is that of the base (reference) system.
2.4.7. Simple Payback
Simple payback is the length of time in which the mean annual savings of the optimized system over the base system repay the extra initial investment. It equals the gap in initial capital cost between the two systems divided by the mean yearly gap in their nominal cash flows across the project lifetime. This calculation ignores the time value of money and is written as:
2.4.8. Total Annualized Cost
A component’s total annualized cost is the uniform yearly amount that, spread across the project lifespan, gives the same net present cost as the component’s real sequence of cash flows. It is obtained by multiplying the net present cost by the capital recovery factor:
Cann, tot = CRF(i,Rproj) × CNPC,tot
Here CNPC,tot is the total net present cost (A$), i is the annual real discount rate (%), Rproj is the project lifetime (year), and CRF is a function that returns the capital recovery factor. HOMER bases the levelized cost of energy calculation on the entire annualized cost.
2.4.9. Diesel Generator Emissions
The environmental effect of generator operation was assessed from annual diesel consumption and the associated emission factors. The pollutants considered were carbon dioxide, carbon monoxide, unburned hydrocarbons, particulate matter, sulphur dioxide, and nitrogen oxides. The yearly emission of each pollutant was computed as:
where Ej is the annual emission of pollutant j (g/year), FC is the annual diesel fuel consumption (L/year), and EFj is the emission factor for pollutant j (g/L). Table 7 presents the emission factors used in the analysis. This approach enables direct comparison of emissions from the diesel-based reference system and the diesel backup generation required by the proposed renewable-energy system.
Ej = FC × EFj
Table 7.
Emissions from diesel generator [42].
2.5. Sensitivity Analysis Calculations
A sensitivity analysis assessed the influence of two economic parameters expected to most affect the proposed hybrid system’s comparative performance: the delivered diesel fuel price and the nominal discount rate. These parameters were selected because they directly affect the two dominant economic characteristics of the competing systems. The diesel-based reference system is highly exposed to fuel-price variation because it depends continuously on imported diesel, whereas the renewable-dominated system is characterized by high upfront capital investment and is therefore particularly sensitive to financing conditions and discounting.
Other parameters, including renewable-system CAPEX, battery replacement cost, electricity demand, and water demand, are also important. However, these were held constant in the present sensitivity analysis for three reasons. First, their base values were derived from defined technology-cost assumptions, projected demand, and the specified SWRO design requirement and were treated as system-design inputs rather than external market variables. Second, varying several technical and demand parameters simultaneously would change the system’s physical design basis, making it harder to isolate the economic effects being investigated.
Third, this sensitivity analysis tested whether the main economic conclusion holds under changes in the two external variables most likely to fluctuate over the project lifetime: fuel cost and financing conditions. Diesel prices are especially important for remote islands because fuel must be transported to the site, making operating costs highly exposed to market and logistics uncertainty. The discount rate, in contrast, affects the present value of capital, replacement, fuel, and O&M expenditure over the project lifetime and therefore strongly influences the comparison between capital-intensive renewable systems and fuel-intensive diesel systems. For this reason, the selected variables provide a focused test of the proposed system’s economic robustness.
The software evaluates each value of one sensitivity variable against every value of the other; in this case, LCOE and NPC. Therefore, the five diesel-price levels and five discount-rate levels generated 25 combinations of independent sensitivity cases. For each of the 25 combinations, the software repeated the system simulation and optimization, keeping the electrical demand, SWRO load, renewable-resource data, component characteristics, technical constraints, and project lifetime constant. Thus, the observed variation in economic performance can be attributed primarily to changes in fuel prices and financing assumptions rather than to changes in underlying demand or resource profiles. Table 8 presents the sensitivity values used in this analysis.
Table 8.
Sensitivity-analysis input parameters.
3. Results and Discussion
The software supports the modeling and optimization of low-cost renewable energy systems and risk mitigation strategies by simulating the technical and economic feasibility of microgrids and distributed energy systems, whether operating on-grid or connected to unreliable grids. Through techno-economic analysis, it shows how conventional generation, renewable energy, storage, available grid resources, and load control can work together. The software evaluates and optimizes system architecture, load profiles, components, and environmental factors by simulating a hybrid microgrid or distributed energy system over a defined period. The results offer key insights into technical performance, risk mitigation, and potential cost savings. This section summarizes the results, beginning with the optimization outcomes and followed by the economic evaluation.
3.1. Optimization Results
Table 9 shows that for the plant location on the South Island of Bantam Shire of Cocos (Keeling) Islands (12°11.3′ S, 96°55.3′ E), both generators were included because, under the assumed system architecture, they did not affect system cost given their zero initial capital cost. The software ranks feasible configurations primarily by economic performance while satisfying the specified technical and renewable-energy constraints. This simulation proposes more than 100 architectural designs; however, it selects only the top 10 with the lowest NPCs for comparison with the base system. Table 9 presents the proposed system’s optimization results, with the base system highlighted in light gray. Table 10 details the optimized components and electricity production.
Table 9.
Optimization results, economic metrics, and potential emissions reduction.
Table 10.
Optimized component details and electricity production.
3.2. Electricity Generation
The optimized system produces 5.73 GWh/year, with 77.7% from PV, 21.4% from wind, and only 0.9% from diesel generation. This mix indicates that the system is not simply renewable-assisted but effectively renewable-dominated, with diesel retained primarily as a reliability resource. The CAT-1600 generator produces only 51.25 MWh/year, while the CAT-910 is not dispatched. This result matters because it shows that the island’s community and SWRO electrical loads can be supplied almost entirely by variable renewable sources when storage and conversion capacity are sufficient. The monthly generation profile, as shown in Figure 7, further illustrates a complementary relationship between solar and wind resources. PV output decreases to approximately 307–319 MWh in June–July, while wind generation rises to approximately 120–129 MWh during the same period.
Figure 7.
The electricity generation of the optimized system.
Conversely, PV generation increases to approximately 416 MWh in October, when the need for supplementary generation is lower. This seasonal complementarity reduces the need for diesel dispatch and improves system resilience because low production from one renewable source can be partially offset by the other. Similar benefits of combining solar and wind generation have been reported for island and remote microgrids, where resource complementarity reduces dependence on dispatchable fossil-fuel generation and improves storage utilization. A HOMER-based study for Koh Samui, Thailand, for example, identified a PV–wind–diesel–battery configuration with an 89.4% fraction of renewable energy, demonstrating the value of hybrid renewable generation for island applications [53]. The 98.3% renewable fraction in the present study exceeds values reported for several comparable remote-island systems. A HOMER analysis for Legundi Island, Indonesia, achieved a renewable fraction of 79.9% with a PV–battery–diesel configuration and reduced diesel consumption by 79.3% [54]. Similarly, a previous HOMER-based study for a remote Indian Ocean island reported an optimized renewable fraction of only 29.2%, with continued substantial dependence on diesel generation [32].
The PV subsystem is the primary driver of this result. The 2656 kW PV array generates 4.45 GWh/year, with a 19.1% capacity factor, and supplies more than three-quarters of total annual electricity generation. This PV dominance is consistent with other HOMER studies in high-solar-resource island environments. For example, a recent island microgrid optimization identified a fully solar-battery configuration as the least-cost solution under strong solar-resource conditions, showing that PV can become the principal generation technology when resource quality and storage economics are favorable [55].
Wind nevertheless provides an important balancing function, not merely an additional energy source. The three 100 kW turbines generate approximately 1.23 GWh/year, corresponding to a 46.6% capacity factor, and operate about 89% of the year. The relatively high wind contribution is particularly valuable during periods of lower solar output and at night, thereby reducing battery cycling and the frequency of diesel operation. This finding aligns with previous water–energy studies showing that hybrid PV–wind systems provide a more reliable supply for isolated islands and desalination loads than single-source renewable configurations [56].
The generation profile also directly affects the SWRO load. Unlike studies that optimize renewable generation solely for community electricity demand, the present system must also meet continuous desalination demand. The renewable generation and storage system therefore serves a combined electricity–water function. This aligns with recent work on desalination in Western Australia, where hybrid renewable generation and battery storage were more economical than diesel-only supply for remote desalination applications [57]. Likewise, studies of renewable-powered desalination in island settings have shown that high renewable penetration can substantially reduce the costs and emissions associated with freshwater production [58].
The optimized PV subsystem is rated at 2656 kW and generates approximately 4.45 GWh per year, making it the hybrid system’s largest source of electricity. Its 19.1% capacity factor aligns with expected PV performance in high-solar-resource island environments and confirms that the substantial annual energy contribution comes from the large installed capacity rather than unusually high conversion efficiency. The 152% PV penetration indicates deliberate oversizing relative to average electrical demand, necessary in an isolated renewable system to compensate for solar intermittency and provide sufficient surplus energy for battery charging and the continuous SWRO load. Importantly, the model reports zero clipped PV production, suggesting that the battery-storage and converter capacities are large enough to absorb available PV generation rather than curtail it.
This contrasts with some previous remote-island studies, where high renewable penetration was accompanied by substantial excess or dumped electricity. For example, Ma et al. reported that a PV–wind–battery system supplying a remote island achieved 100% renewable operation, but dumped approximately 48.6% of generated energy, highlighting the importance of appropriate storage and component sizing [59]. The dominance of PV in the current configuration also aligns with previous island optimization studies. For Huraa Island in the Maldives, a high-rated PV system was economically preferable because of its strong contribution to renewable penetration and low LCOE; when combined with wind and battery storage, renewable penetration reached approximately 96% [60]. The calculated PV generation cost of A$0.036/kWh in this study reinforces the economic rationale for assigning PV the dominant generation role. However, this value represents a component-level generation cost under the adopted HOMER assumptions, not the full system LCOE, because the system-level economic assessment accounts separately for storage, conversion, backup generation, and replacement costs. Figure 8 shows the generic flat-plate PV output profile.
Figure 8.
Generic flat-plate PV output (kW).
The optimized wind subsystem consists of three 100 kW Norv 24 turbines, producing about 1.226 GWh/year with a capacity factor of 46.6%. Rather than serving only as an additional renewable source, wind provides an important balancing function because it generates power day and night, complements the diurnal PV profile, and reduces battery discharge and diesel-generator use. This role is particularly important for the continuous SWRO load. Similar benefits of PV–wind complementarity have been reported for stand-alone desalination systems, where combined renewable resources improve supply continuity and reduce dependence on fossil backup [61]. The high operating duration of about 7795 h/year confirms that wind contributes across most of the year, while the calculated generation cost of A$0.0572/kWh indicates that this balancing contribution is also economically competitive. The Norv 24 [100 kW] wind turbine output (kW) is shown in Figure 9.
Figure 9.
Norv 24 [100 kW] wind turbine output (kW).
The optimized system uses 6.64 MWh of Li-ion battery storage, with 5.43 MWh usable capacity and 18.2 h of autonomy. The battery receives 1162 MWh/year and delivers 1065 MWh/year, giving an effective round-trip efficiency of about 91.7%. Its main role is to shift surplus PV and wind generation to periods of low renewable output, thereby reducing diesel operation. The battery undergoes about 164 equivalent full cycles per year, indicating moderate utilization rather than intensive daily cycling. This operating pattern is consistent with renewable microgrid studies in which battery storage improves renewable penetration and reduces backup-generator dependence [62].
Similar findings have also been reported for renewable-powered desalination systems, where batteries help decouple intermittent PV/wind generation from the more continuous electricity demand of SWRO plants [63]. However, the assumed 10-year battery lifetime means the long-term economic assessment must include replacement costs. Previous SWRO studies likewise show that Li-ion storage improves reliability and renewable utilization but can increase lifecycle cost because of battery capital and replacement requirements [64]. Figure 10 shows the battery state-of-charge profile.
Figure 10.
Generic 1 kWh Li-Ion [ASM] State of Charge (%).
The optimized system uses an 870 kW bidirectional converter, operating for 7643 h/year and transferring 1855 MWh/year of input energy to 1762 MWh/year of output energy. This corresponds to an effective conversion efficiency of approximately 95.0%, with losses of about 92.8 MWh/year. Rather than serving only as an interface between the AC and DC buses, the converter is a critical balancing component because it coordinates PV generation, battery charging/discharging, and AC load supply across most of the year. Its 23.1% capacity factor therefore reflects variable power-processing demand rather than underutilization. The calculated efficiency aligns with values commonly used in HOMER-based microgrid studies.
For example, Ishraque et al. used 95% inverter efficiency in a PV–battery–diesel microgrid, while another HOMER-based PV-storage study also assumed 95% converter efficiency [65]. Thus, the converter contributes not only to energy conversion but also to maintaining efficient power exchange among renewable generation, storage, and the island load, supporting the optimized system’s high renewable fraction. The inverter/rectifier output profile is presented in Figure 11.
Figure 11.
The converter inverter/rectifier output (kW).
The CAT-1600 diesel generator functions primarily as a reliability reserve rather than a regular energy source. It produces only 51,247 kWh/year and operates for 43 h/year, corresponding to a capacity factor of just 0.457%. However, when dispatched, its mean output is 1192 kW, about 93% of rated capacity, indicating infrequent use but high loading when renewable generation and battery storage cannot fully meet demand. This operating strategy is preferable to frequent low-load diesel operation, which is generally associated with poorer fuel efficiency and higher specific emissions. The resulting specific fuel consumption of 0.265 L/kWh and electrical efficiency of 38.4% are consistent with efficient operation at high generator loading.
This dispatch pattern agrees with previous HOMER-based hybrid microgrid studies, where diesel generators are retained mainly as backup resources to maintain reliability while PV, wind, and battery storage supply most of the annual demand. Such hybrid configurations reduce generator operating hours and fuel consumption compared with diesel-dominated systems [66]. In the present system, the CAT-910 is not dispatched, indicating that renewable generation and storage are sufficient to make the second generator operationally redundant under the optimized conditions. Consequently, annual diesel consumption is limited to 13,579 L/year, while CO2 emissions decrease from 2,923,510 to 35,860 kg CO2/year, representing an approximately 98.8% reduction. This confirms that the principal benefit of retaining diesel generation is system resilience rather than energy contribution. Figure 12 shows the CAT-1600 operating profile, while Table 11 summarizes diesel-related emissions.
Figure 12.
CAT-1600kVA-50Hz-CP Output (kW).
Table 11.
Pollutants from diesel generators.
Taken together, the results show that the proposed configuration’s key technical advantage lies not simply in its high annual renewable fraction, but in how the energy sources divide their roles: PV provides the bulk of annual electricity, wind reduces seasonal and diurnal variability, battery storage balances short-term mismatches, and diesel provides residual reliability. This coordinated operation explains why diesel contributes less than 1% of annual generation while the system can still supply both community electricity and the predefined SWRO load. The results therefore support the feasibility of replacing continuous diesel operation with a predominantly PV–wind–battery architecture for a remote island water–energy system.
3.3. Economic Evaluation Results
The cost structure of the optimized hybrid system indicates a clear transition from fuel-intensive expenditure to capital-intensive renewable infrastructure. Of the approximately A$4.88 million total system cost, capital expenditure dominates at A$3.92 million, mainly associated with PV (A$1.74 million) and Li-ion battery storage (A$1.01 million), followed by wind turbines and the converter. This pattern is typical of renewable-dominated microgrids, where higher upfront investment is compensated by lower recurring fuel expenditure over the project lifetime. In contrast, diesel-based systems generally require lower initial capital but incur substantially higher lifecycle fuel costs.
HOMER-based studies of isolated microgrids report the same trend: renewable systems have higher capital intensity but markedly lower NPC than diesel-dominated alternatives [67]. The A$553,666 diesel resource cost is relatively small because the CAT-1600 operates only as backup, while the CAT-910 is not dispatched. This confirms that the optimized system’s economic benefit largely comes from replacing continuous diesel consumption with renewable generation and storage. Similar findings have been reported for renewable-powered desalination systems, where PV–wind–battery configurations reduce both fuel expenditure and emissions relative to conventional diesel supply [68]. The A$452,566 replacement cost also highlights the importance of accounting for component aging, particularly battery replacement, while the A$850,623 salvage value partially offsets lifecycle expenditure. Thus, Figure 13 shows that the optimized system shifts lifecycle expenditure toward assets with long-term energy value rather than recurring fossil-fuel consumption, consistent with previous island water–energy optimization studies [56].
Figure 13.
The cost summary of the project components.
The annualized-cost profile confirms that the optimized system is capital-intensive but operationally inexpensive, with a total annualized cost of A$359,172/year. Capital recovery dominates at A$288,403/year, mainly from PV, battery storage, wind turbines, and the converter, whereas annual diesel expenditure is limited to A$40,737/year. This cost structure is characteristic of renewable-dominated island microgrids, where higher upfront investment replaces recurring fuel expenditure. Comparable HOMER studies likewise report that hybrid renewable systems can have substantially higher initial CAPEX than diesel-only systems but achieve lower lifecycle cost because of reduced fuel consumption [69]. The cash-flow profile also highlights the importance of lifecycle planning. Replacement expenditures around Years 15 and 20 reflect the finite service lives of major components, while the A$62,586/year salvage credit reduces the effective lifecycle burden by accounting for residual component value.
Similar long-term microgrid studies show that replacement and salvage values can materially influence economic performance over 20–25-year project horizons [70]. Thus, the principal economic advantage of the proposed system is not eliminating expenditure but shifting from uncertain recurring diesel costs to predictable capital and replacement costs. This transition improves long-term cost stability and is consistent with recent analyses showing that renewable islanded microgrids can achieve markedly lower annualized costs than diesel-based alternatives [71]. The chronological component cash flows are presented in Figure 14.
Figure 14.
The (A) economic and (B) component chronological cash flow.
Meanwhile, Table 12 shows that the optimized system’s economic advantage comes primarily from replacing high recurring diesel expenditure with upfront investment in renewable generation and storage. Although the optimized configuration requires an additional capital investment of A$3.92 million, the model estimates a 1.12-year payback period, 92.1% ROI, and 89.9% IRR, together with a strongly positive NPV of A$46.8 million and annualized savings of approximately A$2.44 million/year. These results imply that the high initial capital requirement is rapidly offset by avoided fuel and operating costs over the project lifetime. The financial performance is considerably stronger than that reported in many comparable remote-island studies.
Table 12.
Economic metrics.
For example, a HOMER-based analysis for a remote Indian Ocean island reported an IRR of 14%, ROI of 10%, and payback period of 6.7 years for a hybrid diesel–renewable system [32]. Another recent study of off-grid islands in the Philippines reported IRRs of around 17% for larger hybrid renewable microgrids, while emphasizing that higher upfront renewable investment can still be justified by long-term fuel savings [69]. The substantially higher returns obtained here are mainly attributable to the very high displacement of diesel generation and the resulting reduction in recurring fuel expenditure.
The comparison between the base and optimized systems demonstrates that the main advantage of the proposed configuration arises from replacing fuel-intensive diesel generation with capital-intensive renewable infrastructure. Although the optimized system requires an initial CAPEX of A$3.92 million, its NPC decreases from A$51.7 million to A$7.55 million, while LCOE falls from A$1.30/kWh to A$0.189/kWh, corresponding to reductions of approximately 85.4% and 85.5%, respectively. The sharp OPEX reduction, from A$3.80 million to A$266,839, confirms that avoided diesel expenditure is the primary driver of the lifecycle economic benefit.
This trend is consistent with previous HOMER-based island studies, although the improvement here is substantially greater. Riayatsyah et al. reported that a hybrid renewable system for a remote Indian Ocean island reduced NPC from USD 1.65 million to USD 1.39 million and LCOE from USD 0.292/kWh to USD 0.246/kWh, with a renewable fraction of only 29.2% [32]. In contrast, the present system achieves much deeper diesel displacement, which explains the larger economic benefit. The environmental results follow the same pattern. Diesel consumption decreases by 98.8%, from 1,107,017 to 13,579 L/year, reducing annual CO2 emissions from 2,923,510 to 35,860 kg CO2/year. Table 13 compares the economics of the base and optimized systems.
Table 13.
Economic comparison between the base and proposed systems.
Although the renewable configuration requires an initial investment of approximately A$3.9 million, its cumulative expenditure increases only gradually thereafter because recurring fuel and operating costs are comparatively low. In contrast, the diesel-based system shows a steep, continuous increase in cumulative cost, approaching A$52 million by Year 25, primarily because fuel expenditure continues throughout the project lifetime. The early intersection of the two cash-flow curves is therefore not simply a graphical feature; it reflects the rapid recovery of the renewable-system premium through avoided diesel expenditure and is consistent with the calculated 1.12-year simple payback period.
This behavior agrees with previous HOMER-based studies of remote islands, which also show that renewable hybrid systems typically require greater upfront capital but achieve lower cumulative lifecycle expenditure than diesel-dominated systems. Similar cash-flow comparisons in isolated microgrid studies show that diesel-based systems become increasingly expensive over time because of recurring fuel costs, whereas renewable systems concentrate expenditure in the initial investment and periodic component replacement [72]. The markedly shorter payback in the present study is attributable to greater displacement of diesel generation and higher avoided fuel expenditure under the adopted assumptions. Figure 15 presents the simple payback of cumulative cash flow over the project’s lifetime.
Figure 15.
Simple payback of cumulative cash flow over the project’s lifetime.
Taken together, the economic results show that the optimized system’s main advantage is a shift from recurring diesel expenditure to upfront renewable investment. Although the system requires A$3.92 million in initial capital, NPC falls from A$51.7 million to A$7.55 million and LCOE from A$1.30/kWh to A$0.189/kWh. The 1.12-year payback, 92.1% ROI, 89.9% IRR, A$46.8 million NPV, and A$2.44 million/year savings indicate strong financial performance under the adopted assumptions. These results are stronger than many comparable island studies. Riayatsyah et al. reported an IRR of 14%, ROI of 10%, and a 6.7-year payback for a remote-island hybrid system [32]. A study of off-grid Philippine islands reported IRRs of around 17%, while other island analyses also found substantial LCOE reductions after replacing diesel with solar-based hybrid systems [69,73]. Thus, the key economic benefit is replacing a fuel-intensive operating model with a capital-intensive system with much lower recurring costs. However, the very short payback and high IRR should be interpreted within the assumed diesel price, component costs, lifetimes, and discount rate.
3.4. Sensitivity Analysis
Figure 16 shows that the LCOE is more sensitive to the nominal discount rate than to diesel price, reflecting the capital-intensive nature of the PV–wind–battery system. At a diesel price of A$3.00/L, increasing the discount rate from 4% to 12% raises LCOE from A$0.152 to A$0.230/kWh, whereas at the base 8% discount rate, increasing the diesel price from A$2.00/L to A$4.00/L changes LCOE only from A$0.177 to A$0.192/kWh. This confirms that financing conditions influence project economics more than fuel-price variation because diesel contributes only a small fraction of total generation.
Figure 16.
Sensitivity of LCOE to nominal discount rate and diesel fuel price.
This trend is consistent with HOMER-based microgrid studies showing that systems with high renewable penetration become less exposed to diesel-price volatility, while capital and financing assumptions increasingly dominate lifecycle cost. For example, a techno-economic study of an off-grid PV–wind–diesel–battery microgrid found that fuel-price changes altered system costs and component sizing, but the effect depended strongly on the degree of diesel utilization [66]. The non-monotonic LCOE variations observed in Figure 17 are also reasonable because each sensitivity case is re-optimized; higher diesel prices can trigger different combinations of PV, wind, battery, converter, and generator capacities rather than producing a purely linear response. Importantly, even the highest LCOE values within the investigated sensitivity range remain far below the diesel-only base-system value of A$1.30/kWh. This indicates that the optimized renewable system is economically robust across the tested fuel-price and financing conditions, although its performance is particularly dependent on the cost of capital.
Figure 17.
Sensitivity of net present cost (NPC) to diesel fuel price and nominal discount rate.
Figure 17 shows that financing conditions and the degree of diesel dependence jointly control NPC, with values ranging from approximately A$6.48–9.41 million. NPC generally declines as discount rates rise because future fuel, replacement, and O&M costs are assigned a lower present value. However, the sensitivity surface is not uniform because HOMER re-optimizes the system at each combination of discount rate and diesel price.
The dominance of the dark-blue region indicates that one configuration remains optimal across most of the sensitivity space, demonstrating strong economic robustness. The smaller green and red regions represent threshold conditions at which alternative component combinations become more economical. These regime changes align with previous HOMER-based studies, where changes in fuel price, load, or financing assumptions altered both system cost and optimal component sizing rather than producing a simple linear response [66]. This behavior is also consistent with broader hybrid-system literature showing that NPC depends strongly on lifecycle fuel expenditure, replacement costs, and discounting, and that optimized renewable systems can achieve major NPC reductions relative to fossil-dominated alternatives. For example, one hybrid PV–wind–diesel study reported an NPC reduction of about 62% compared with conventional supply [74]. Therefore, Figure 17 shows that the proposed system remains economically competitive across most investigated conditions, while only limited regions require a different optimal configuration.
4. Conclusions
This study assessed a renewable-dominated hybrid power supply system for the Cocos (Keeling) Islands, designed to meet both community electricity demand and the SWRO plant’s predefined electricity requirements. The results lead to the following conclusions:
- The simulation optimization identified 2656 kW of PV, three 100 kW wind turbines, 6640 kWh of battery storage, an 870 kW converter, and diesel backup, achieving a 98.3% renewable fraction.
- Compared with the diesel-based system, NPC decreases from A$51.7 million to A$7.55 million, while LCOE decreases from A$1.30/kWh to A$0.189/kWh, an 85% reduction. The investment also provides a 1.12-year payback period, 92.1% ROI, 89.9% IRR, and A$46.8 million NPV.
- Annual diesel consumption falls from 1,107,017 to 13,579 L/year, while operational CO2 emissions decline from 2,923,510 to 35,860 kg/year, representing approximately 98.8% reductions in both indicators.
- Across diesel prices of A$2–4/L and nominal discount rates of 4–12%, renewable penetration remains approximately 93.5–98.8%, confirming that the renewable-dominated configuration remains robust under the investigated economic conditions.
- The SWRO plant is modeled as a predefined electrical load rather than an independently optimized process. Its electricity requirement is included in the combined island load, allowing HOMER Pro to determine the renewable-generation, storage, conversion, and diesel-backup capacities needed to support both electricity and freshwater production.
Therefore, the main contribution is the location-specific integration of community electricity demand, SWRO electrical demand, solar and wind resources, battery storage, diesel backup, economic performance, and operational emissions for a remote Australian island. The study provides a practical water–energy planning framework rather than claiming a new SWRO technology or optimization method. The economic indicators in this study apply primarily to the hybrid power-supply system; detailed SWRO-specific CAPEX and OPEX are outside the study’s current scope. Future studies should incorporate measured hourly electricity and water-demand data, variable SWRO operation, broader sensitivity analysis, and complete desalination costs, including the levelized cost of water.
Author Contributions
B.S.Z.: Writing—Original draft, Writing—review and editing, Visualization; N.F.C.H.: Writing—review and editing; N.P.: Supervision; T.M.I.M.: Methodology, Data collection, Conceptualization, Visualization, Formal analysis, Supervision, Writing—review and editing. All authors have read and agreed to the published version of the manuscript.
Funding
This research was conducted with the support of Universiti Kuala Lumpur (UniKL) through the Global Research Fellow Scheme (GloRE) administered by the Center for Research and Innovation (CoRI). The author expresses sincere gratitude to UniKL and CoRI for their academic support, financial support for APC, research collaboration opportunities, and commitment to promoting high-quality scholarly research. Their support has contributed significantly to the successful completion of this work.
Data Availability Statement
The original contributions presented in this study are included in the article. Further inquiries can be directed to the corresponding author.
Acknowledgments
This research was supported by the University of Malaya Postdoctoral Research Fellowship Awards. Also, during the preparation of this work, the author(s) used ChatGPT 5.2 to improve clarity and tone while maintaining consistency. After using this tool/service, the author(s) reviewed and edited the content as needed and took full responsibility for the content of the published article.
Conflicts of Interest
The authors declare no conflicts of interest. The funders had no role in the design of the study; in the collection, analysis, or interpretation of data; in the writing of the manuscript; or in the decision to publish the results.
Abbreviations
The following abbreviations are used in this manuscript:
| AC | Alternating current |
| ASM | Advanced storage model |
| CAPEX | Capital expenditure [A$] |
| CO | Carbon monoxide [kg/year] |
| CO2 | Carbon dioxide [kg/year] |
| Cann,tot | Total annualized cost [A$/year] |
| Ccap | Capital cost of the current system [A$] |
| Ccap,ref | Capital cost of the reference system [A$] |
| Ci,ref | Nominal annual cash flow for reference system [A$] |
| Ci | Nominal annual cash flow for current system [A$] |
| CNPC,tot | Total net present cost [A$] |
| CRF | Capital recovery factor |
| Crep | Component replacement cost [A$] |
| Crep,batt | Storage bank replacement cost [A$] |
| DC | Direct current |
| Ej | Annual emission of pollutant j [g/year] |
| EFj | Emission factor of pollutant j [g/L] |
| ERD | Energy recovery device |
| Eprim,AC | AC primary load served [kWh/year] |
| Eprim,DC | DC primary load served [kWh/year] |
| Egrid,sales | Total grid sales [kWh/year] |
| FC | Annual diesel fuel consumption [L/year] |
| f | Yearly inflation rate [%] |
| fPV | Derating factor [%] |
| H | Freshwater tank elevation/head [m] |
| HOMER | Hybrid Optimization of Multiple Energy Resources |
| HP | High pressure |
| i | Nominal interest rate [%] |
| i0 | Rate at which you may acquire a loan [%] |
| IT | Solar irradiation [kW/m2] |
| Is | Standard amount of radiation [kW/m2] |
| IRR | Internal rate of return [%] |
| LCOE | Levelized cost of electricity [A$/kWh] |
| LHV | Lower heating value of diesel [MJ/kg] |
| Li-ion | Lithium-ion |
| N | Lifetime of the system [year] |
| Nbatt | Storage bank number of batteries |
| NPC | Total net present cost [A$] |
| NOx | Nitrogen oxides [kg/year] |
| NPV | Net present value [A$] |
| PWTG | Wind turbine power output [kW] |
| PWTG,STP | Wind turbine power output at standard temperature and pressure [kW] |
| RF | Renewable energy fraction [%] |
| O&M | Operation and maintenance [A$/year] |
| OPEX | Operating expenditure [A$/year] |
| Qlifetime | Single storage lifetime throughput [kWh] |
| P | RO operating pressure [bar] |
| PM | Particulate matter [kg/year] |
| PV | Photovoltaic |
| Qthrpt | Storage throughput annually [kWh/year] |
| R | RO recovery ratio [%] |
| Rbatt | Life of storage bank [year] |
| Rbatt,f | Storage float life [year] |
| Rcomp | Component lifetime [year] |
| RO | Reverse osmosis |
| ROI | Return on investment [%] |
| Rproj | Project lifetime [year] |
| Rrem | Component remaining life [year] |
| S | Salvage value [A$] |
| SEC | Specific energy consumption [kWh/m3] |
| SOC | State of charge [%] |
| SO2 | Sulphur dioxide [kg/year] |
| SWRO | Seawater reverse osmosis |
| Uanem | Wind speed at anemometer height [m/s] |
| Uhub | Wind speed at the wind turbine hub height [m] |
| UHC | Unburned hydrocarbons [kg/year] |
| YPV | Total installed capacity of the PV panel [kW] |
| Zhub | Wind turbine hub height [m] |
| Zanem | Anemometer height [m] |
| α | Power-law exponent |
| ρ | Actual air density [kg/m3] |
| ρo | Air density at standard temperature and pressure (1.225 kg/m3) |
| η | Pump efficiency [%] |
| ηrt | Storage round-trip efficiency [%] |
References
- Chigor, V.N.; Nwankwo, C.E.I.; Chigor, C.B.; Ozochi, C.A.; Nweze, N.O.; Amaechina, E.C.; Agunwamba, J.C. Towards successful delivery of clean water by 2030 in Nigeria: Dealing with the challenges of climate change and poor environmental practices. In Implementing the Sustainable Development Goals in Nigeria: Barriers, Prospects and Strategies; Routledge: Abingdon, UK; New York, NY, USA, 2021; pp. 78–97. [Google Scholar]
- Crane, S.; Tøttrup, C. Progress on Water-Related Ecosystems: Mid-Term Status of SDG Indicator 6.6.1 and Acceleration Needs with a Special Focus on Biodiversit; United Nations Environment Programme: Nairobi, Kenya, 2024.
- UNESCO. Food Security, a Key Driver of Peace and Prosperity. Available online: https://www.unesco.org/reports/wwdr/en/2024/agriculture (accessed on 13 October 2026).
- UNESCO. The United Nations World Water Development Report 2024, Water for Prosperity and Peace. Available online: https://www.unesco.org/en/articles/united-nations-world-water-development-report-2024-water-prosperity-and-peace (accessed on 13 October 2026).
- Ferdous, S.; Chowdhury, F.N.; Ali, M.L.; Bodrud-Doza, M.; Rahman, M.M. Assessment of urban sanitation status and management gaps in a metropolitan city, Bangladesh: Potential challenges to achieve SDG 6. Front. Water 2022, 4, 950887. [Google Scholar] [CrossRef] [Scilit]
- Qiu, R.; Wang, S.; Shi, J.; Shen, W.; Zhang, W.; Zhang, F.; Li, J. Sentinel-2 MSI Observations of Water Clarity in Inland Waters across Hainan Island and Implications for SDG 6.3.2 Evaluation. Remote Sens. 2023, 15, 1600. [Google Scholar] [CrossRef] [Scilit]
- Sufiani, O.; Sahini, M.G.; Elisadiki, J. Towards attaining SDG 6: The opportunities available for capacitive deionization technology to provide clean water to the African population. Environ. Res. 2023, 216, 114671. [Google Scholar] [CrossRef] [Scilit] [PubMed]
- Vahabzadeh, M.; Afshar, A.; Molajou, A. Framing a novel holistic energy subsystem structure for water-energy-food nexus based on existing literature (basic concepts). Sci. Rep. 2023, 13, 6289. [Google Scholar] [CrossRef] [Scilit] [PubMed]
- Srivastava, A.; Singh, R.; Rajput, V.D.; Minkina, T.; Agarwal, S.; Garg, M.C. A systematic approach towards optimization of brackish groundwater treatment using nanofiltration (NF) and reverse osmosis (RO) hybrid membrane filtration system. Chemosphere 2022, 303, 135230. [Google Scholar] [CrossRef] [Scilit] [PubMed]
- Chaudhuri, A.; Jogdand, A. Permeate flux decrease due to concentration polarization in a closed roto-dynamic reverse osmosis filtration system. Desalination 2017, 402, 152–161. [Google Scholar] [CrossRef] [Scilit]
- Xu, Y.Q.; Wu, Y.H.; Tong, X.; Song, K.Y.; Chen, G.Q.; Bai, Y.; Luo, L.W.; Wang, H.B.; Zhang, Z.W.; Ikuno, N.; et al. Exploring the pressure change of reverse osmosis filtration: Time-course pressure curves and a novel model for mechanism study and NEWater application. Sep. Purif. Technol. 2022, 294, 121239. [Google Scholar] [CrossRef] [Scilit]
- Abdullah, M.S.; Goh, P.S.; Ismail, A.F.; Hasbullah, H. The Treatment of Endocrine-Disruptive Chemicals in Wastewater through Asymmetric Reverse Osmosis Membranes: A Review. Symmetry 2023, 15, 1049. [Google Scholar] [CrossRef] [Scilit]
- Mohammed, H.A.; Sachit, D.E.; Al-Furaiji, M.H. The Effect of Organic Matter on Heavy Metals Removal from Simulated Wastewater using a Reverse Osmosis Membrane Process. ChemistrySelect 2022, 7, e202203151. [Google Scholar] [CrossRef] [Scilit]
- Wlodarczyk, R.; Kwarciak-Kozlowska, A. Treatment of waterborne pathogens by reverse osmosis. In Waterborne Pathogens: Detection and Treatment; Butterworth-Heinemann: Oxford, UK, 2020; pp. 57–80. [Google Scholar]
- Dao, D.T.; Duong, H.C.; Laborie, S.; Cabassud, C. Integrated reverse osmosis/vacuum membrane distillation for enhanced arsenic removal and water recovery of brackish water desalination. Desalin. Water Treat. 2023, 287, 19–28. [Google Scholar] [CrossRef] [Scilit]
- Liu, C.; Guo, Y.; Zhou, Y.; Yang, B.; Xiao, K.; Zhao, H.Z. High-hydrophilic and antifouling reverse osmosis membrane prepared based an unconventional radiation method for pharmaceutical plant effluent treatment. Sep. Purif. Technol. 2022, 280, 119838. [Google Scholar] [CrossRef] [Scilit]
- Cassano, A.; Rastogi, N.K.; Basile, A. Reverse osmosis in food processing. In Current Trends and Future Developments on (Bio-) Membranes: Reverse and Forward Osmosis: Principles, Applications, Advances; Elsevier: Oxford, UK, 2019; pp. 229–257. [Google Scholar]
- Gunathilake, K.D.P.P.; Yu, L.J.; Rupasinghe, H.P.V. Reverse osmosis as a potential technique to improve antioxidant properties of fruit juices used for functional beverages. Food Chem. 2014, 148, 335–341. [Google Scholar] [CrossRef] [Scilit] [PubMed]
- De Baat Doelman, J. Electronic water treatment: Reduces fouling in reverse osmosis. Pollut. Eng. 2014, 46, 28–29. [Google Scholar]
- Aumesquet-Carreto, M.Á.; Ortega-Delgado, B.; García-Rodríguez, L. Opportunities of Reducing the Energy Consumption of Seawater Reverse Osmosis Desalination by Exploiting Salinity Gradients. Membranes 2022, 12, 1045. [Google Scholar] [CrossRef] [Scilit] [PubMed]
- Castro, M.T.; Ocon, J.D. Techno-Economic Potential of Reverse Osmosis in Desalination Coupled-Hybrid Renewable Energy Systems in Off-Grid Islands. Chem. Eng. Trans. 2021, 88, 265–270. [Google Scholar] [CrossRef]
- Eltamaly, A.M.; Ali, E.; Bumazza, M.; Mulyono, S.; Yasin, M. Optimal Design of Hybrid Renewable Energy System for a Reverse Osmosis Desalination System in Arar, Saudi Arabia. Arab. J. Sci. Eng. 2021, 46, 9879–9897. [Google Scholar] [CrossRef] [Scilit]
- Leon, F.; Ramos, A. An assessment of renewable energies in a seawater desalination plant with reverse osmosis membranes. Membranes 2021, 11, 883. [Google Scholar] [CrossRef] [Scilit] [PubMed]
- Saboori, H. Hybrid renewable energy powered reverse osmosis desalination—Minimization and comprehensive analysis of levelized cost of water. Sustain. Energy Technol. Assess. 2023, 56, 103065. [Google Scholar] [CrossRef] [Scilit]
- Australia. Electricity Generation. Available online: https://www.energy.gov.au/energy-data/australian-energy-statistics/electricity-generation (accessed on 18 October 2026).
- Itzhaki, S. This Week’s Highlight: Feasibility Study to Support Energy Decarbonisation in the Indian Ocean Territories. Eng. Bus. 2025. Available online: https://engineeringbusiness.com.au/this-week-in-government-tenders-decarbonisation-study/ (accessed on 13 October 2026).
- Halabi, L.M.; Mekhilef, S.; Olatomiwa, L.; Hazelton, J. Performance analysis of hybrid PV/diesel/battery system using HOMER: A case study Sabah, Malaysia. Energy Convers. Manag. 2017, 144, 322–339. [Google Scholar] [CrossRef] [Scilit]
- Sen, R.; Bhattacharyya, S.C. Off-grid electricity generation with renewable energy technologies in India: An application of HOMER. Renew. Energy 2014, 62, 388–398. [Google Scholar] [CrossRef] [Scilit]
- Shahzad, M.K.; Zahid, A.; Rashid, T.U.; Rehan, M.A.; Ali, M.; Ahmad, M. Techno-economic feasibility analysis of a solar-biomass off grid system for the electrification of remote rural areas in Pakistan using HOMER software. Renew. Energy 2017, 106, 264–273. [Google Scholar] [CrossRef] [Scilit]
- Bahramara, S.; Moghaddam, M.P.; Haghifam, M.R. Optimal planning of hybrid renewable energy systems using HOMER: A review. Renew. Sustain. Energy Rev. 2016, 62, 609–620. [Google Scholar] [CrossRef] [Scilit]
- Ahmad, J.; Imran, M.; Khalid, A.; Iqbal, W.; Ashraf, S.R.; Adnan, M.; Ali, S.F.; Khokhar, K.S. Techno economic analysis of a wind-photovoltaic-biomass hybrid renewable energy system for rural electrification: A case study of Kallar Kahar. Energy 2018, 148, 208–234. [Google Scholar] [CrossRef] [Scilit]
- Riayatsyah, T.M.I.; Geumpana, T.A.; Fattah, I.M.R.; Mahlia, T.M.I. Techno-Economic Analysis of Hybrid Diesel Generators and Renewable Energy for a Remote Island in the Indian Ocean Using HOMER Pro. Sustainability 2022, 14, 9846. [Google Scholar] [CrossRef] [Scilit]
- Australia. Cocos (Keeling) Islands Census Data 2021; Australian Bureau of Statistics: Canberra, Australia, 2021. [Google Scholar]
- Australia. Size Your Solar System: Your Electricity Usage; Australian Bureau of Statistics: Canberra, Australia, 2026.
- Howard, G.; Bartram, J.; Williams, A.; Overbo, A.; Fuente, D.; Geere, J.-A. Domestic Water Quantity, Service Level and Health; World Health Organization (WHO): Geneva, Switzerland, 2020. [Google Scholar]
- Adams, J.; Bartram, J.; Chartier, Y.; Sims, J. Water, Sanitation and Hygiene Standards for Schools in Low-Cost Settings; World Health Organization: Geneva, Switzerland, 2009. [Google Scholar]
- Hurayra, M.A.; Ahmed, A.; Alim, M.A.; Rahman, A. Water Savings in Places of Worship: A Case Study for St Mary’s Mosque in Australia. Sustainability 2024, 16, 6568. [Google Scholar] [CrossRef] [Scilit]
- Alnajdi, S.; Naderi Beni, A.; Alsaati, A.A.; Luhar, M.; Childress, A.E.; Warsinger, D.M. Practical minimum energy use of seawater reverse osmosis. Joule 2024, 8, 3088–3105. [Google Scholar] [CrossRef] [Scilit]
- Das, T.K.; Frost, C.; Folley, M.; Brewster, P. Application of an energy recovery device with RO membrane for wave powered desalination. Desalination 2024, 592, 118064. [Google Scholar] [CrossRef] [Scilit]
- Kim, J.; Park, K.; Yang, D.R.; Hong, S. A comprehensive review of energy consumption of seawater reverse osmosis desalination plants. Appl. Energy 2019, 254, 113652. [Google Scholar] [CrossRef] [Scilit]
- Wang, C.; Wang, L.; Dong, L.; Shon, H.K.; Kim, J. Specific energy consumption of seawater reverse osmosis desalination plants using machine learning. Desalination 2025, 602, 118654. [Google Scholar] [CrossRef] [Scilit]
- HOMERPro. HOMER Pro Software. Available online: https://homerenergy.com/homer-pro (accessed on 18 October 2026).
- NREL. National Solar Radiation Database; NREL: Golden, CO, USA, 2021.
- NASA. NASA Prediction of Worldwide Energy Resources (POWER); NASA POWER: Hampton, VA, USA, 2022.
- Aurecon. 2024 Energy Technology Cost and Technical Parameter Review; Aurecon Australasia Pty Ltd.: Brisbane, Australia, 2024. [Google Scholar]
- IRENA. Renewable Power Generation Costs in 2025; International Renewable Energy Agency: Abu Dhabi, United Arab Emirates, 2026. [Google Scholar]
- CSIRO. Australian CDR Roadmap—Modelling Appendix; Australia’s National Science Agency: Canberra, Australia, 2025.
- Demiroren, A.; Yilmaz, U. Analysis of change in electric energy cost with using renewable energy sources in Gökceada, Turkey: An island example. Renew. Sustain. Energy Rev. 2010, 14, 323–333. [Google Scholar] [CrossRef] [Scilit]
- HOMERGrid, HOMER Pro version 3.18.5; Homer grid software; HOMER Energy, LLC: Boulder, CO, USA, 2021.
- Bloomberg. USD-AUD X-Rate. Available online: https://www.bloomberg.com/quote/USDIDR:CUR (accessed on 18 October 2026).
- Australia. Inflation Measures How Fast Prices are Rising; Australian Bureau of Statistics: Canberra, Australia, 2026.
- Attia, A.M.; Al Hanbali, A.; Saleh, H.H.; Alsawafy, O.G.; Ghaithan, A.M.; Mohammed, A. A multi-objective optimization model for sizing decisions of a grid-connected photovoltaic system. Energy 2021, 229, 120730. [Google Scholar] [CrossRef] [Scilit]
- Khamharnphol, R.; Kamdar, I.; Waewsak, J.; Chaichan, W.; Khunpetch, S.; Chiwamongkhonkarn, S.; Kongruang, C.; Gagnon, Y. Microgrid Hybrid Solar/Wind/Diesel and Battery Energy Storage Power Generation System: Application to Koh Samui, Southern Thailand. Int. J. Renew. Energy Dev. 2023, 12, 216. [Google Scholar] [CrossRef] [Scilit]
- Azman, N.; Sulistiawan, R. Design and performance evaluation of an off-grid hybrid solar system in a remote location: A case study of Legundi Island. MethodsX 2024, 12, 102716. [Google Scholar] [CrossRef] [Scilit] [PubMed]
- Maoulida, F.; Aboudou, K.M.; Djedjig, R.; El Ganaoui, M. Optimization Study of the Electrical Microgrid for a Hybrid PV–Wind–Diesel–Storage System in an Island Environment. Solar 2025, 5, 39. [Google Scholar] [CrossRef] [Scilit]
- Mehrjerdi, H. Modeling and optimization of an island water-energy nexus powered by a hybrid solar-wind renewable system. Energy 2020, 197, 117217. [Google Scholar] [CrossRef] [Scilit]
- Wu, H.; West, S.R.; Hayward, J.A. Energy options for brackish groundwater desalination in Western Australia. Desalination 2025, 600, 118446. [Google Scholar] [CrossRef] [Scilit]
- Escoto, B.E.; Abundo, M.L.S. Evaluating the feasibility and sustainability of renewable energy systems for seawater reverse osmosis desalination application in small island communities. Results Eng. 2025, 27, 106015. [Google Scholar] [CrossRef] [Scilit]
- Ma, T.; Yang, H.; Lu, L. A feasibility study of a stand-alone hybrid solar–wind–battery system for a remote island. Appl. Energy 2014, 121, 149–158. [Google Scholar] [CrossRef] [Scilit]
- He, W.; Tao, L.; Han, L.; Sun, Y.; Campana, P.E.; Yan, J. Optimal analysis of a hybrid renewable power system for a remote island. Renew. Energy 2021, 179, 96–104. [Google Scholar] [CrossRef] [Scilit]
- Spyrou, I.D.; Anagnostopoulos, J.S. Design study of a stand-alone desalination system powered by renewable energy sources and a pumped storage unit. Desalination 2010, 257, 137–149. [Google Scholar] [CrossRef] [Scilit]
- Lewis, C.G.; Ijeoma, M.W.; Yakubu, R.O.; Chukwu, B.N.; Chen, H.; Carbajales-Dale, M. Achieving universal energy access in remote locations using HOMER energy model: A techno-economic and environmental analysis of hybrid microgrid systems for rural electrification in northeast Nigeria. Front. Energy Res. 2024, 12, 1454281. [Google Scholar] [CrossRef] [Scilit]
- Asaduz-Zaman, M.; Ramli, M.A.M.; Alghamdi, S. A hybrid energy storage approach for techno-economic optimization of renewable microgrids in SWROD applications. Energy Convers. Manag. X 2026, 30, 101558. [Google Scholar] [CrossRef] [Scilit]
- Domínguez, E.J.M.; Batista, R.P.; de León Izquier, J.M. Assessing the use of photovoltaic energy at a seawater reverse osmosis desalination plant: A case study of Porto Santo Desalination Plant (Madeira–Portugal). Desalin. Water Treat. 2022, 259, 285–299. [Google Scholar] [CrossRef] [Scilit]
- Ishraque, M.F.; Shezan, S.A.; Nur, J.N.; Islam, M.S. Optimal Sizing and Assessment of an Islanded Photovoltaic-Battery-Diesel Generator Microgrid Applicable to a Remote School of Bangladesh. Eng. Rep. 2021, 3, e12281. [Google Scholar] [CrossRef] [Scilit]
- Amupolo, A.; Nambundunga, S.; Chowdhury, D.S.P.; Grün, G. Techno-Economic Feasibility of Off-Grid Renewable Energy Electrification Schemes: A Case Study of an Informal Settlement in Namibia. Energies 2022, 15, 4235. [Google Scholar] [CrossRef] [Scilit]
- Esan, A.B.; Agbetuyi, A.F.; Oghorada, O.; Ogbeide, K.; Awelewa, A.A.; Afolabi, A.E. Reliability assessments of an islanded hybrid PV-diesel-battery system for a typical rural community in Nigeria. Heliyon 2019, 5, e01632. [Google Scholar] [CrossRef] [Scilit] [PubMed]
- Gökçek, M. Integration of hybrid power (wind-photovoltaic-diesel-battery) and seawater reverse osmosis systems for small-scale desalination applications. Desalination 2018, 435, 210–220. [Google Scholar] [CrossRef] [Scilit]
- Romero, I.J.P.; Danao, L.A.M.; Encarnacion, J.I.B. Viability of hybrid renewable energy systems microgrid for off-grid islands: Case for Western Visayas, Philippines. Energy Nexus 2026, 23, 100796. [Google Scholar] [CrossRef] [Scilit]
- Khan, M.A.; Haseeb, A.; Ashraf, M.M.; Waseem, M.; Mughal, M.A.; Pallonetto, F. Building a Greener Future: A Techno-Economic Assessment of Renewable Configurations for Energy Independence and the Net-Zero Transitions in a Community Microgrid. IET Renew. Power Gener. 2026, 20, e70207. [Google Scholar] [CrossRef] [Scilit]
- Mühlbauer, A.; Fan, Y.F.; Sambor, D.J.; Jacobson, M.Z. Minimizing the multi-decadal cost of islanded renewable-electricity microgrids for different climate zones. Smart Energy 2025, 20, 100208. [Google Scholar] [CrossRef] [Scilit]
- Rehmani, A.M.; Kazmi, S.A.A.; Altamimi, A.; Khan, Z.A.; Awais, M. Techno-Economic-Environmental Assessment of an Isolated Rural Micro-Grid from a Mid-Career Repowering Perspective. Sustainability 2023, 15, 2137. [Google Scholar] [CrossRef] [Scilit]
- Lozano, L.; Querikiol, E.M.; Abundo, M.L.S.; Bellotindos, L.M. Techno-economic analysis of a cost-effective power generation system for off-grid island communities: A case study of Gilutongan Island, Cordova, Cebu, Philippines. Renew. Energy 2019, 140, 905–911. [Google Scholar] [CrossRef] [Scilit]
- Mubaarak, S.; Zhang, D.; Liu, J.; Chen, Y.; Wang, L.; Zaki, S.A.; Yuan, R.; Wu, J.; Zhang, Y.; Li, M. Potential Techno-Economic Feasibility of Hybrid Energy Systems for Electrifying Various Consumers in Yemen. Sustainability 2021, 13, 228. [Google Scholar] [CrossRef] [Scilit]
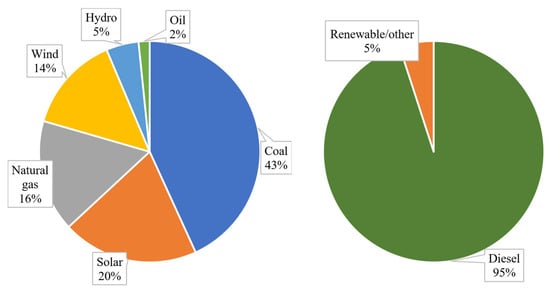
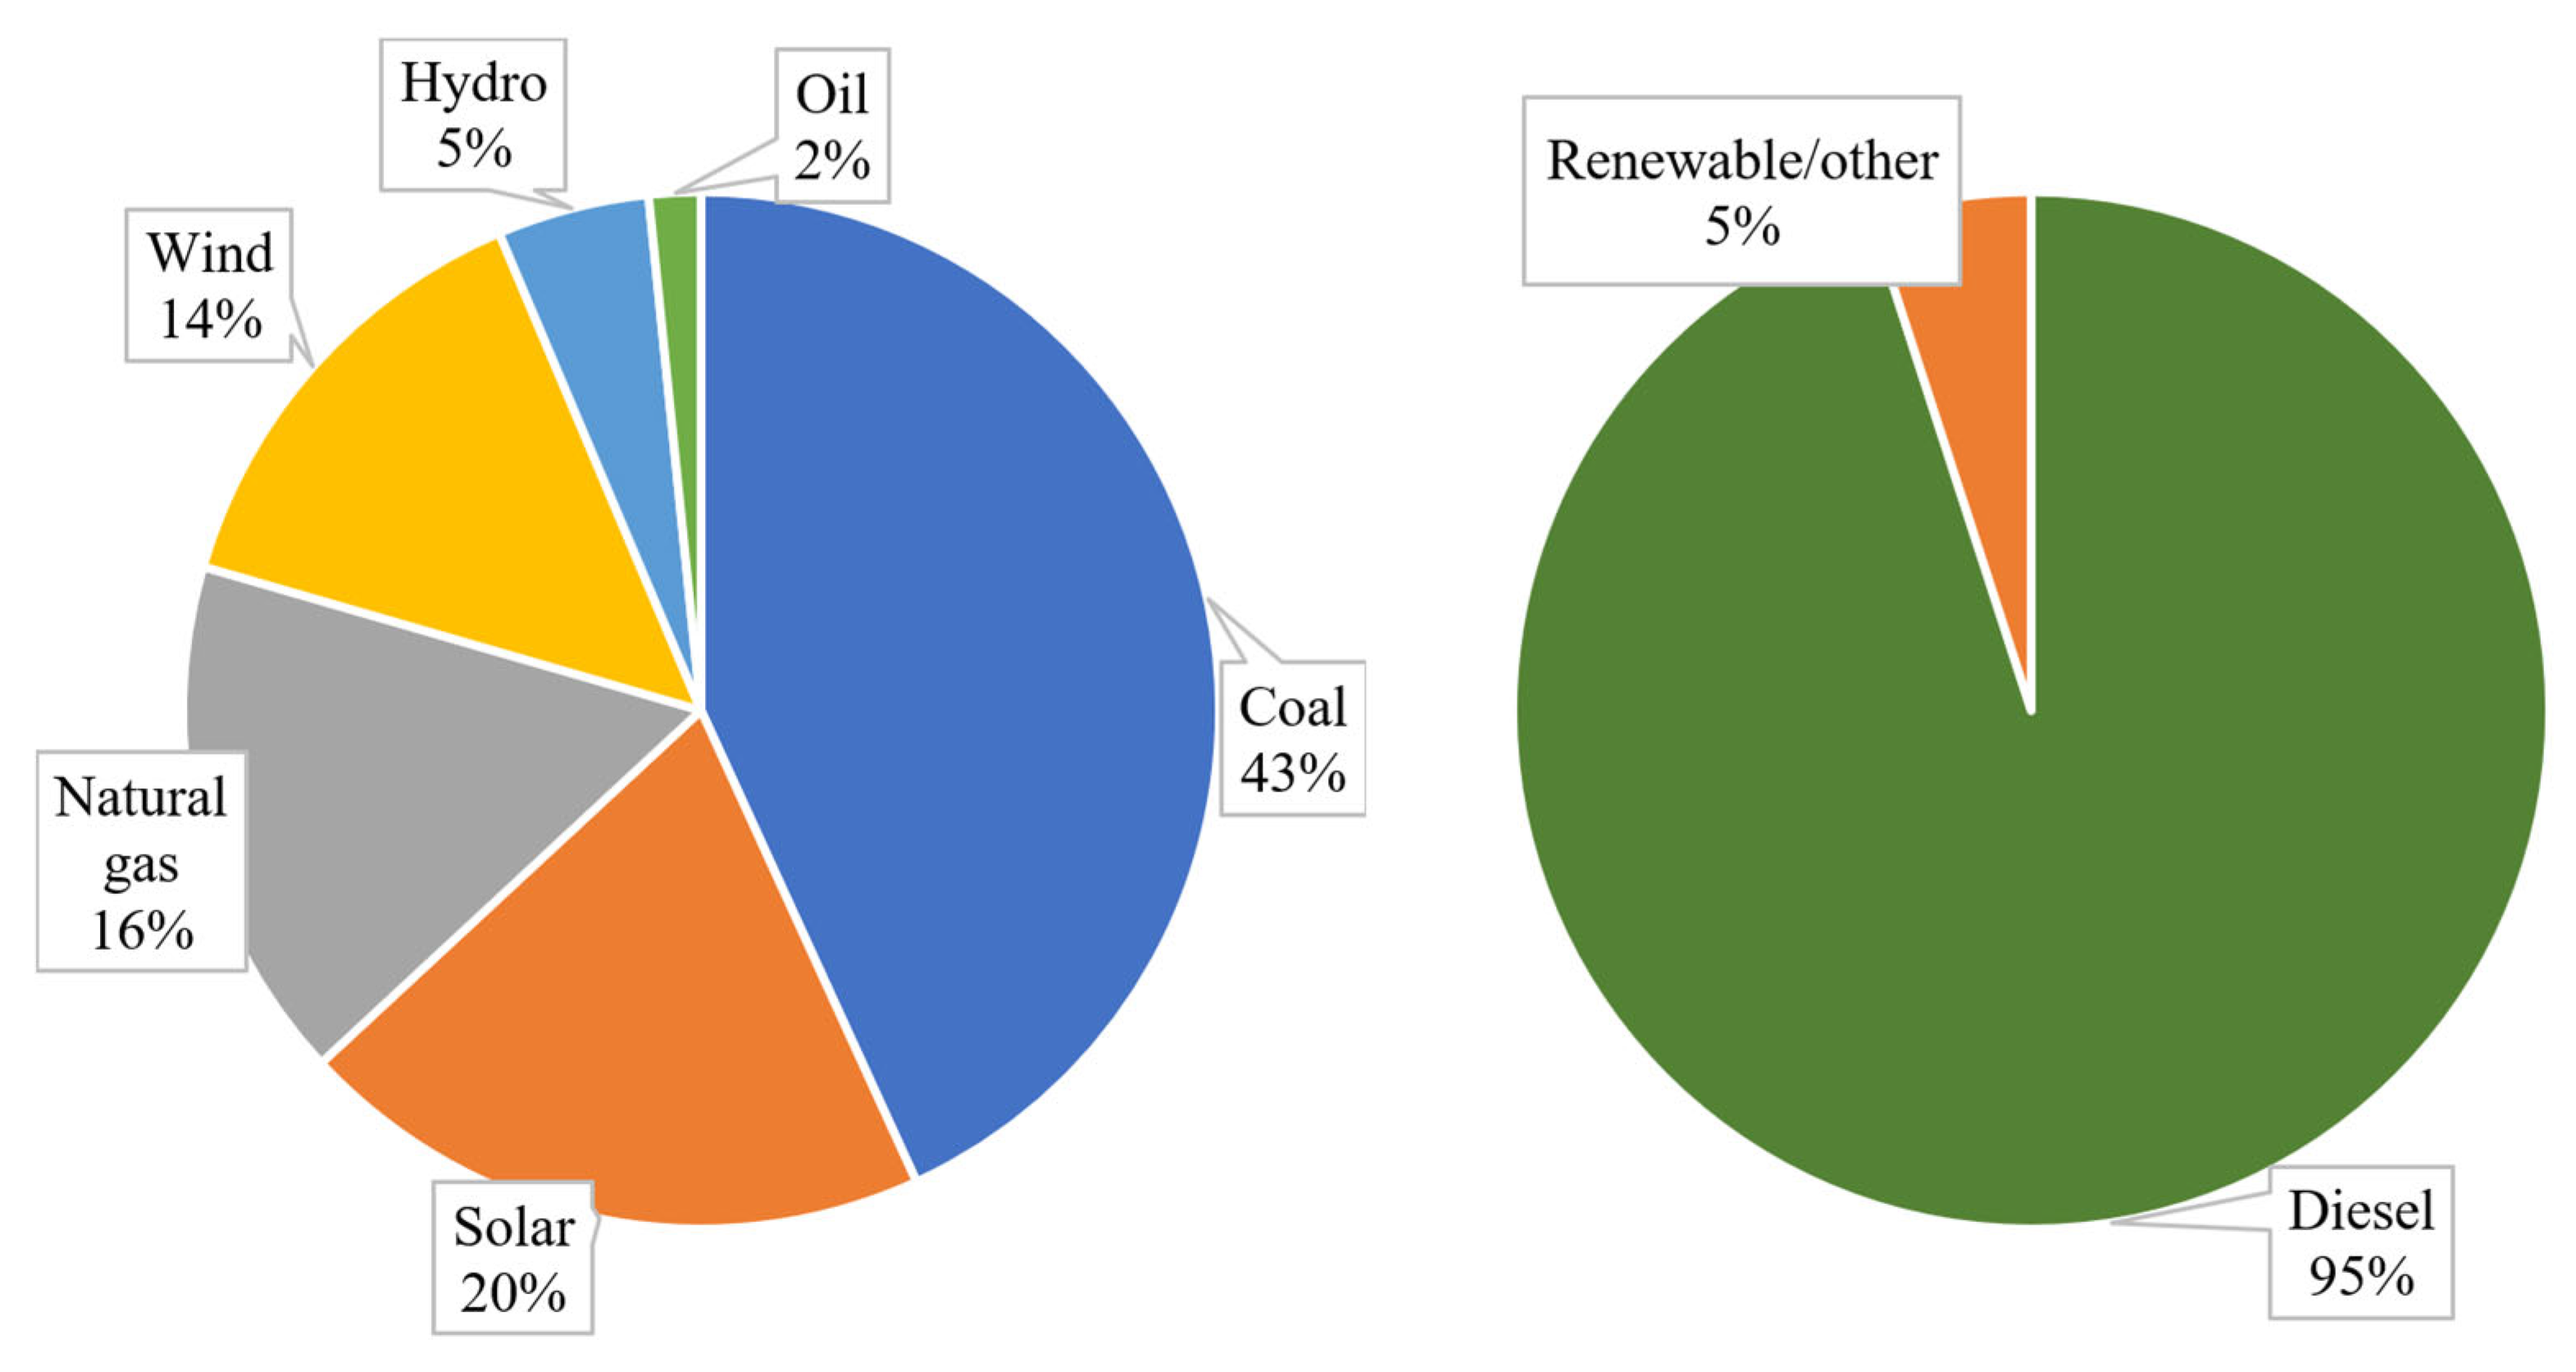
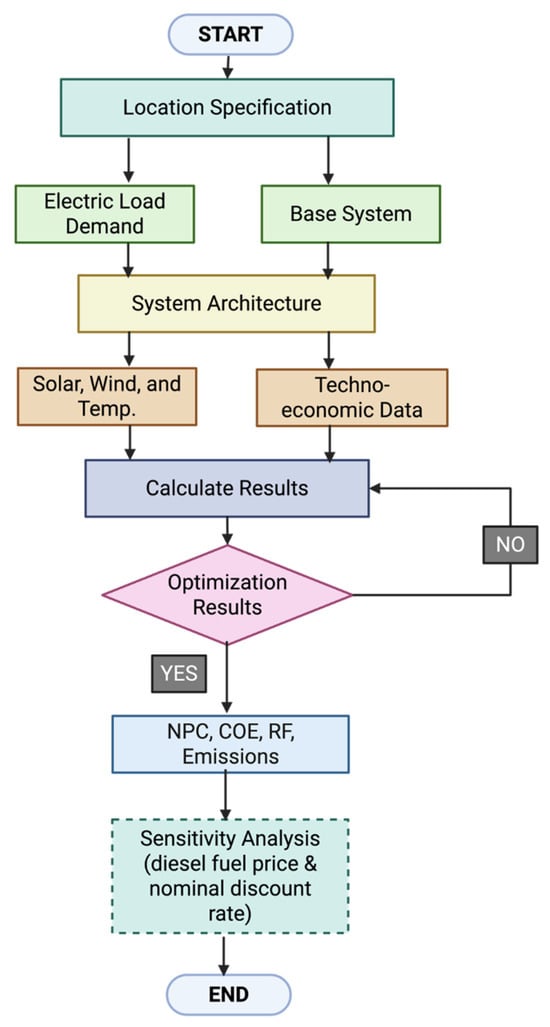
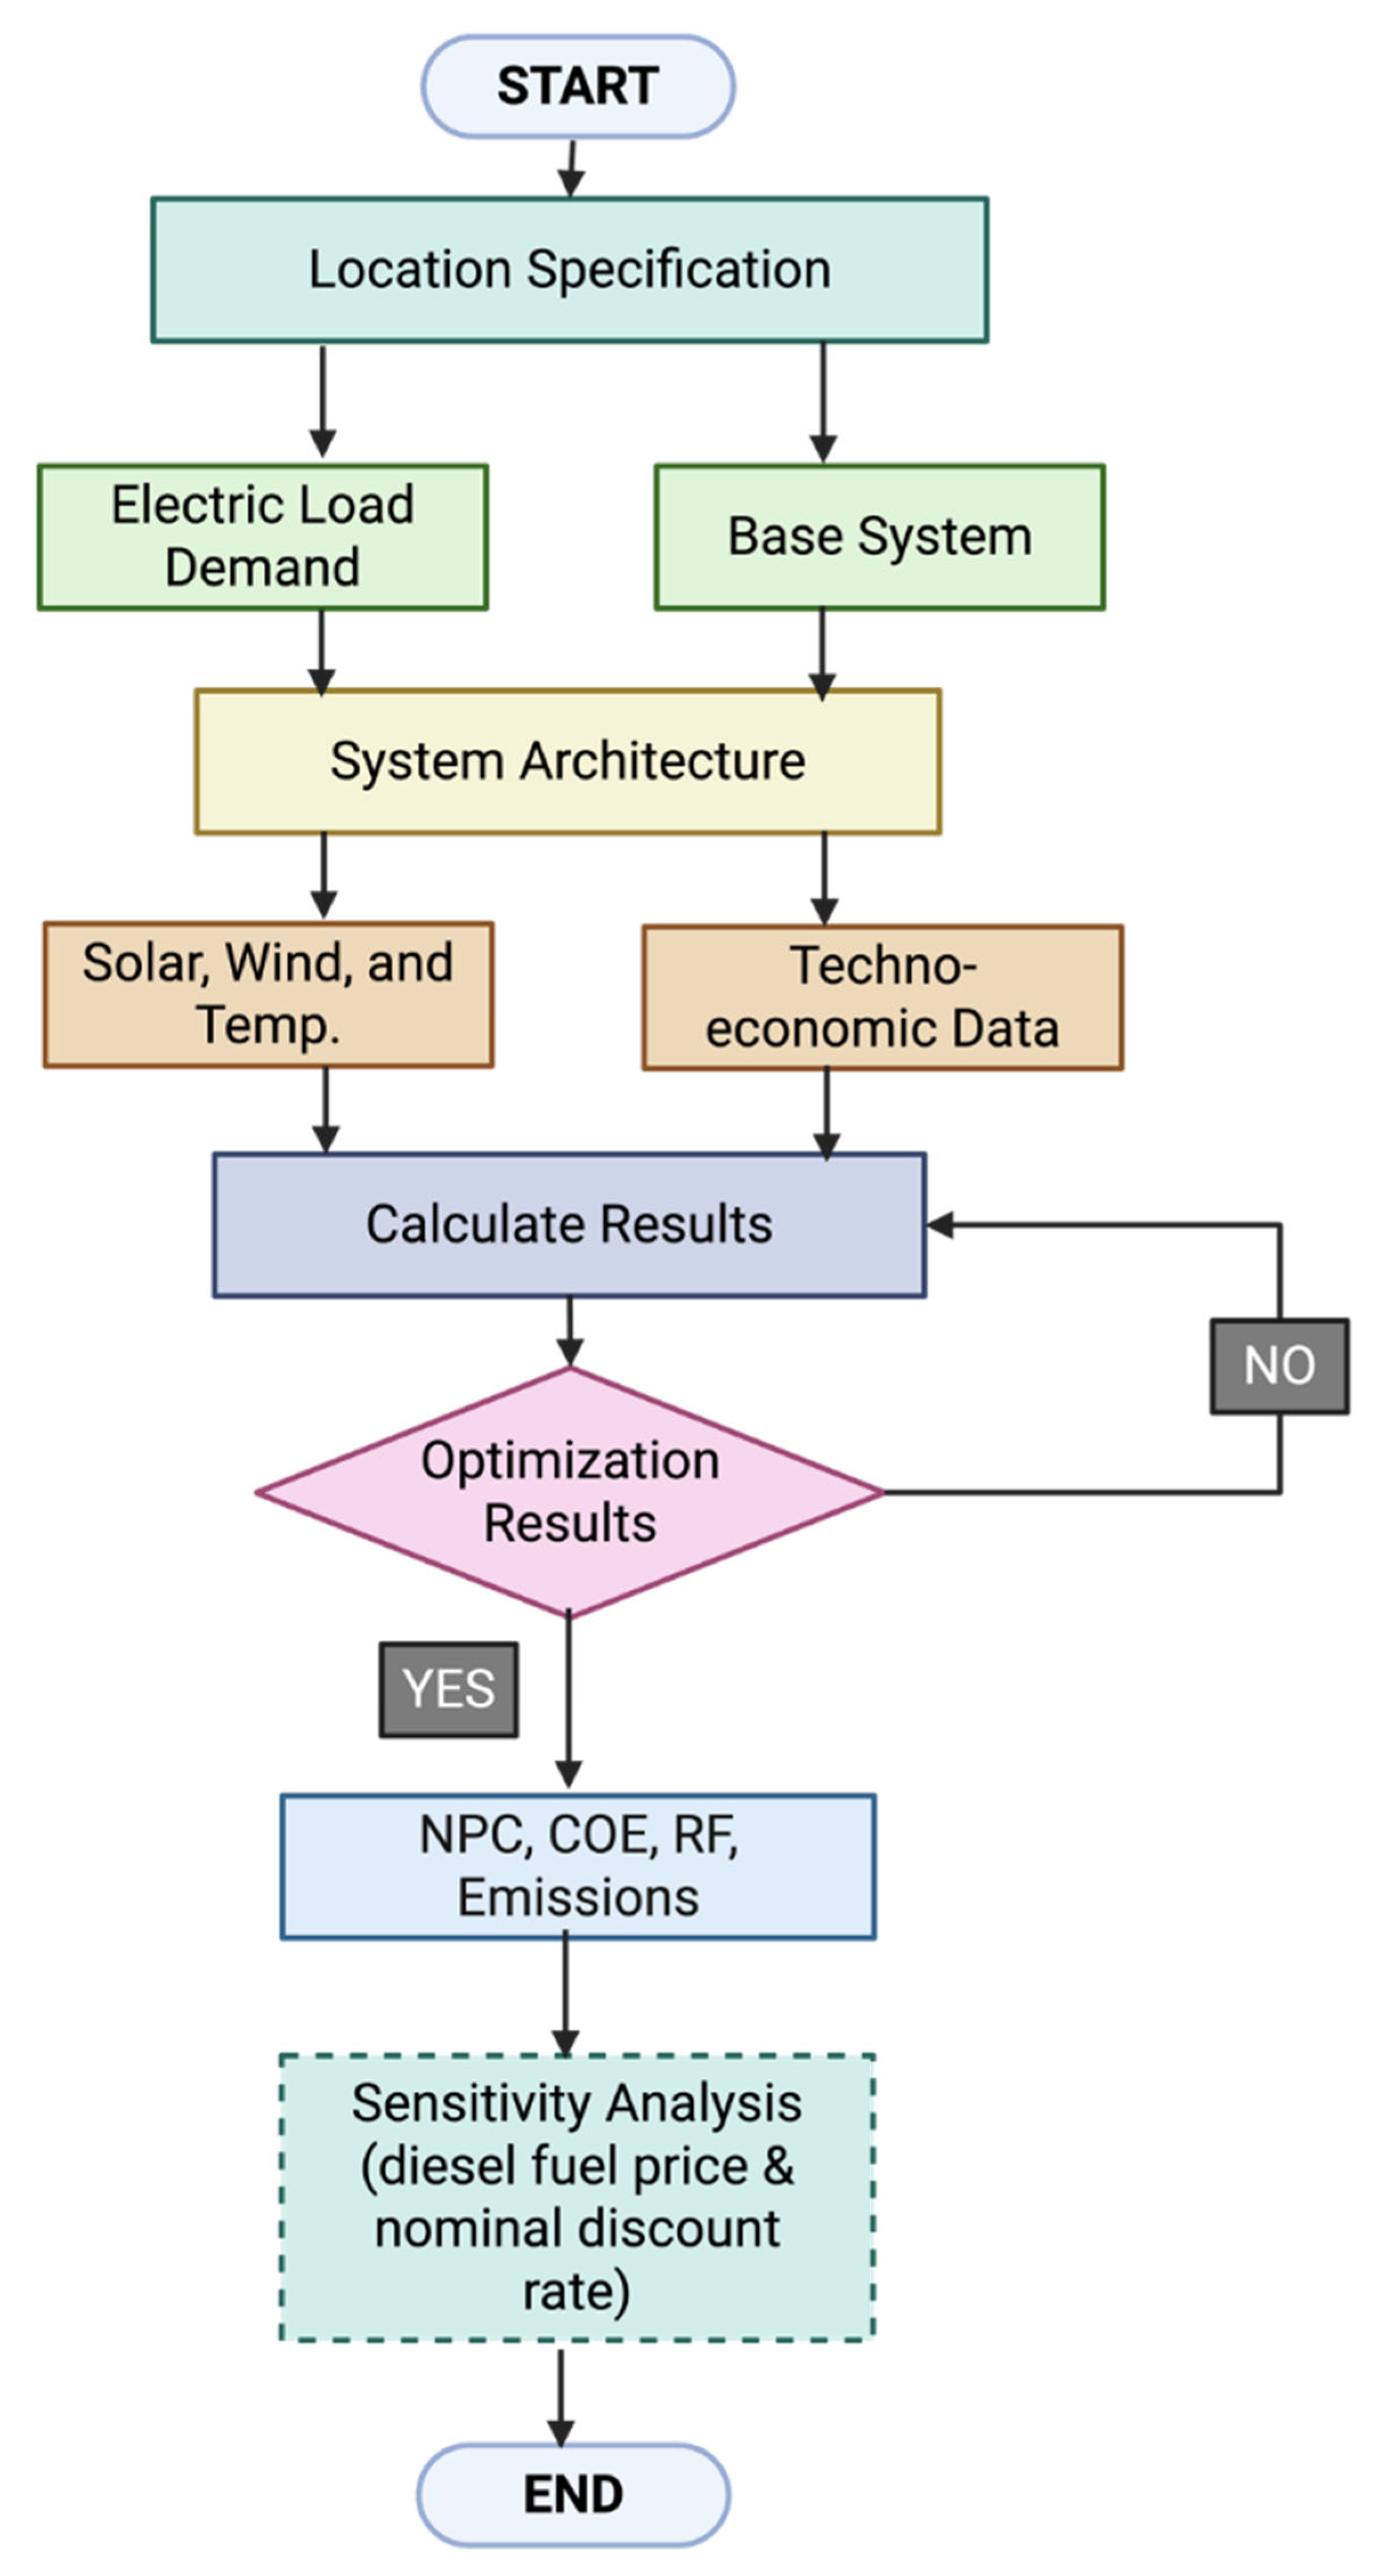
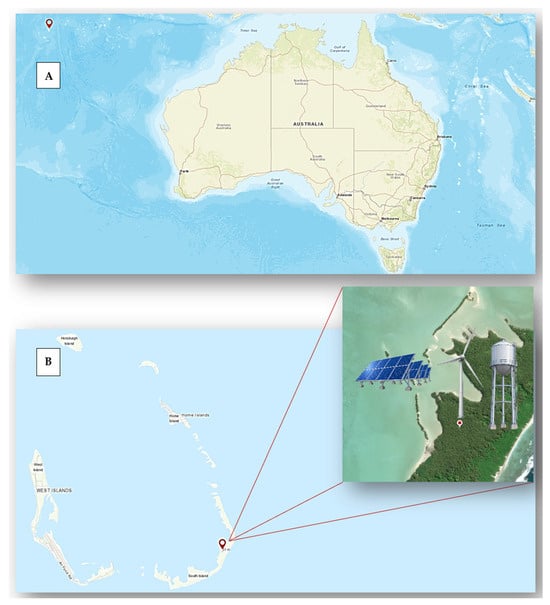
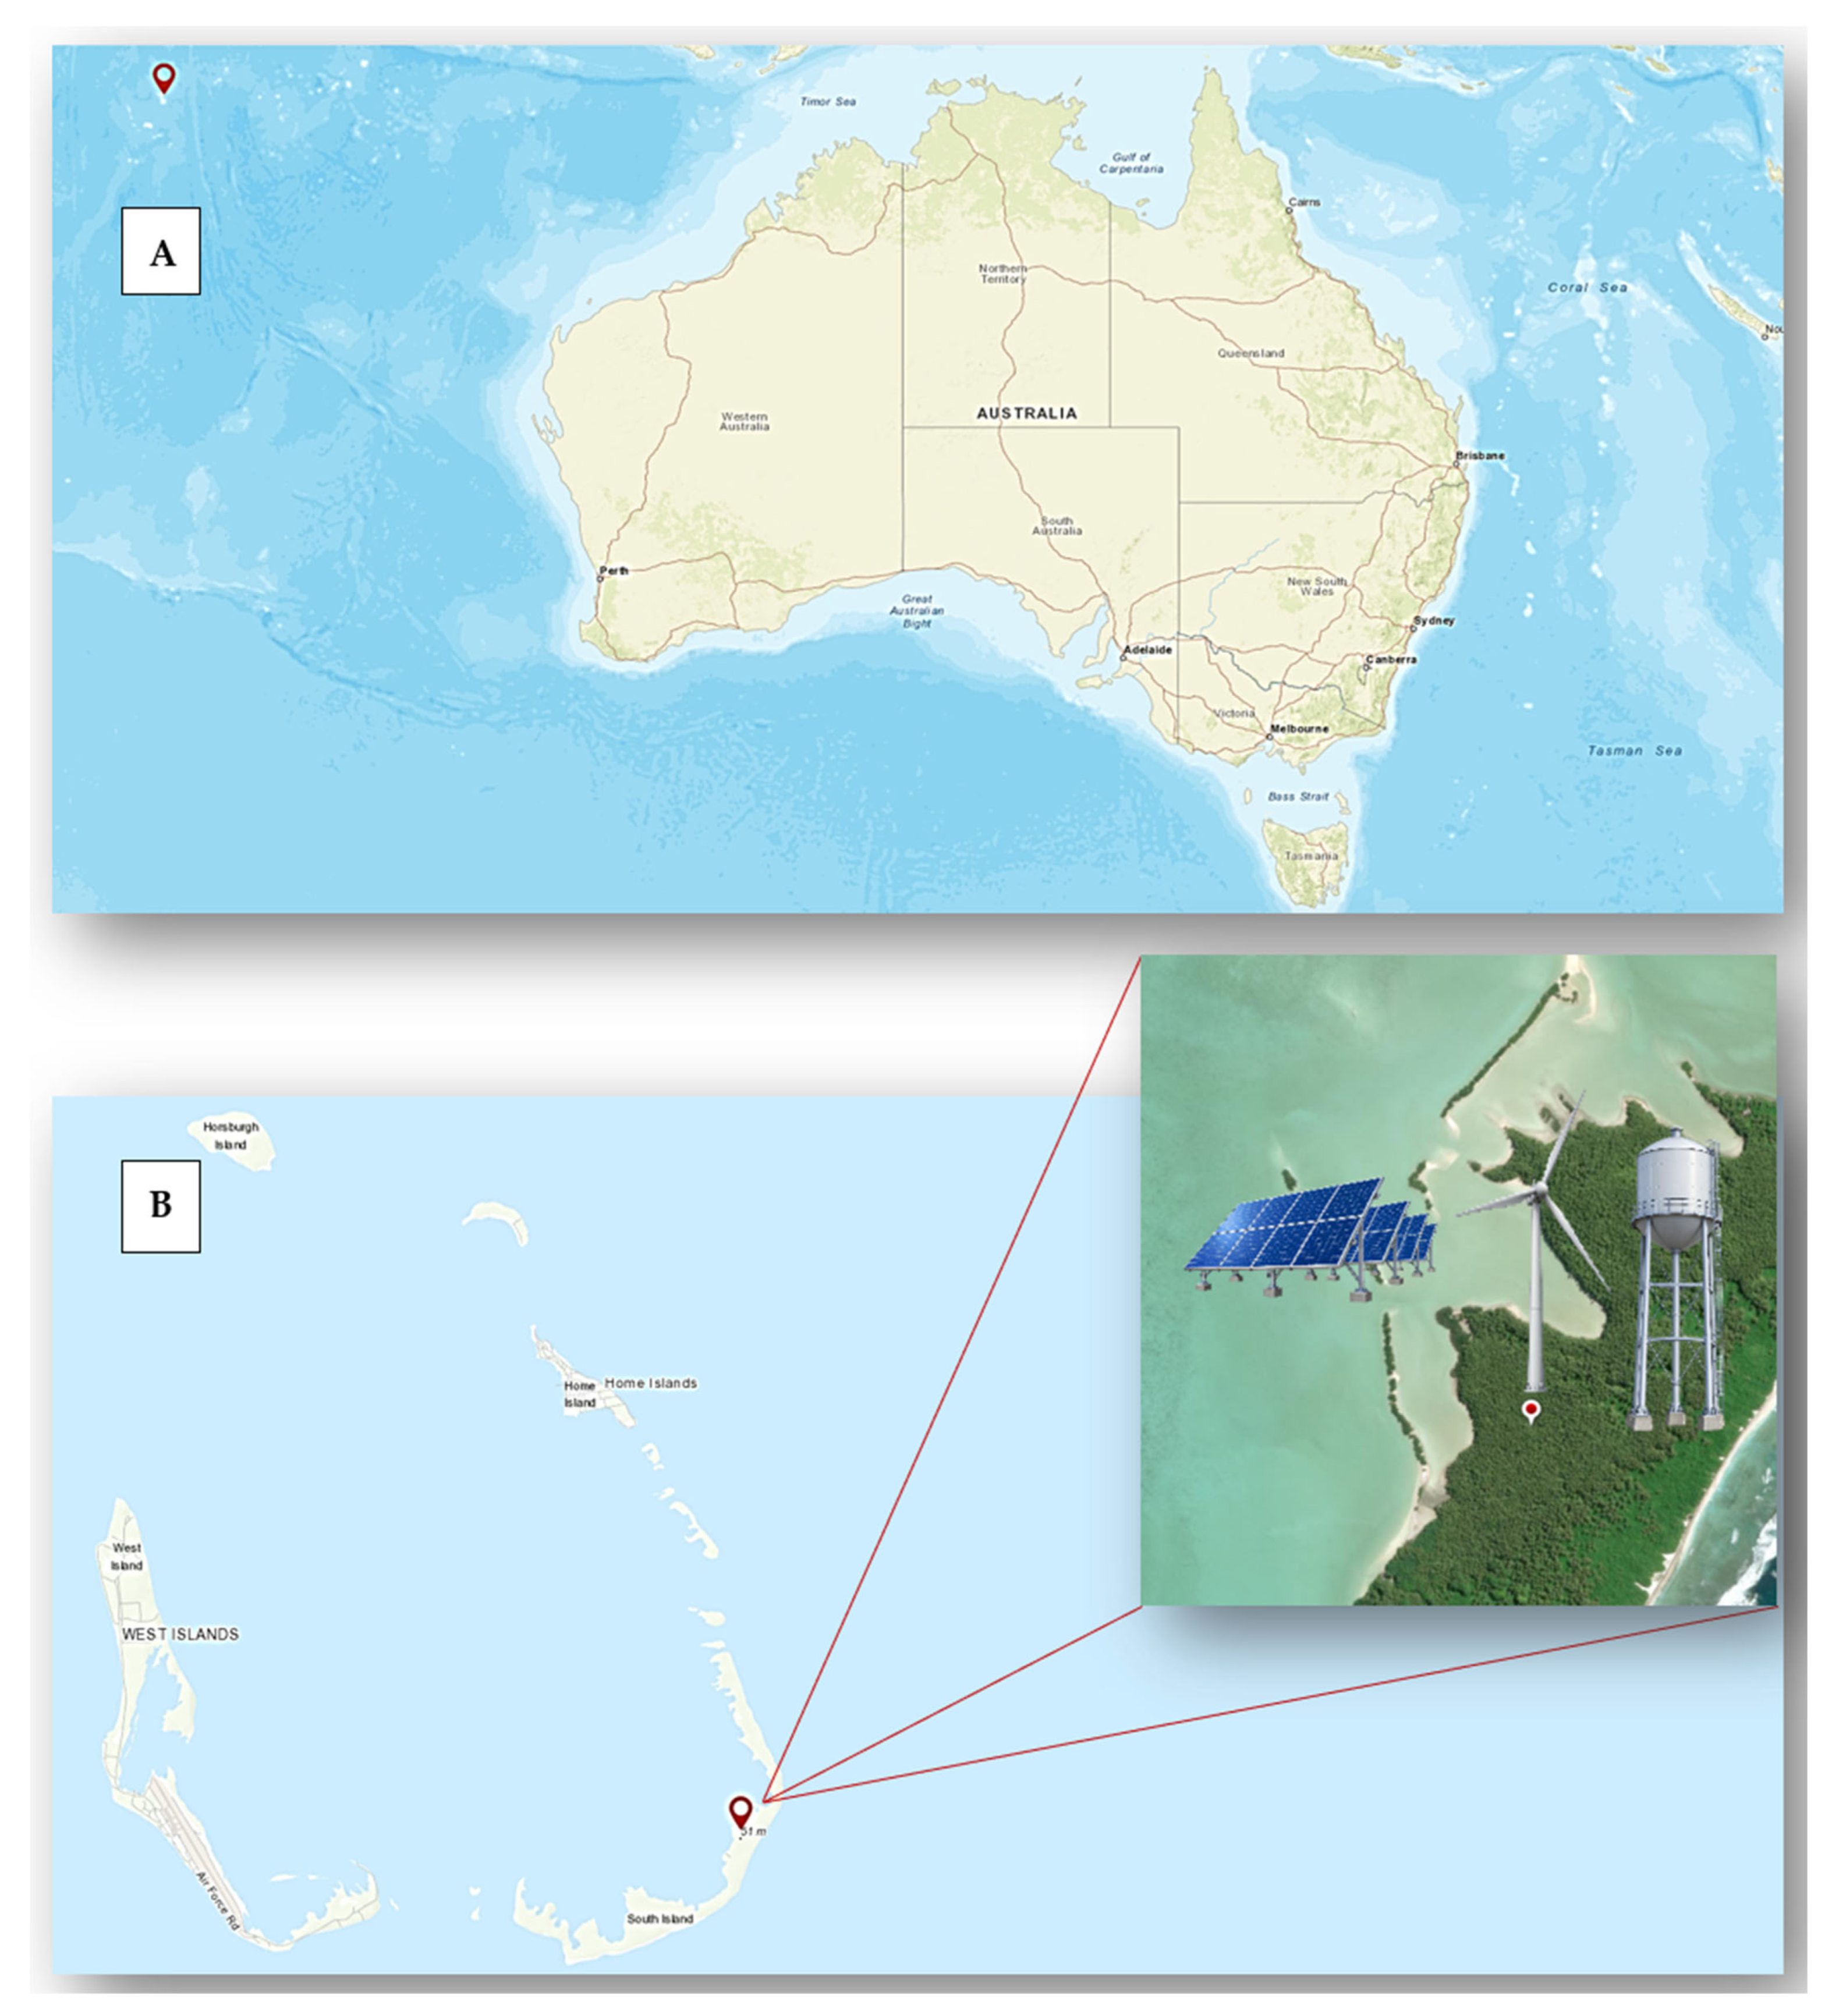
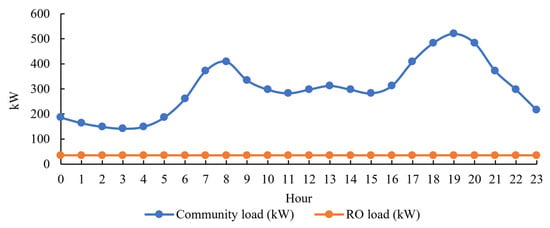
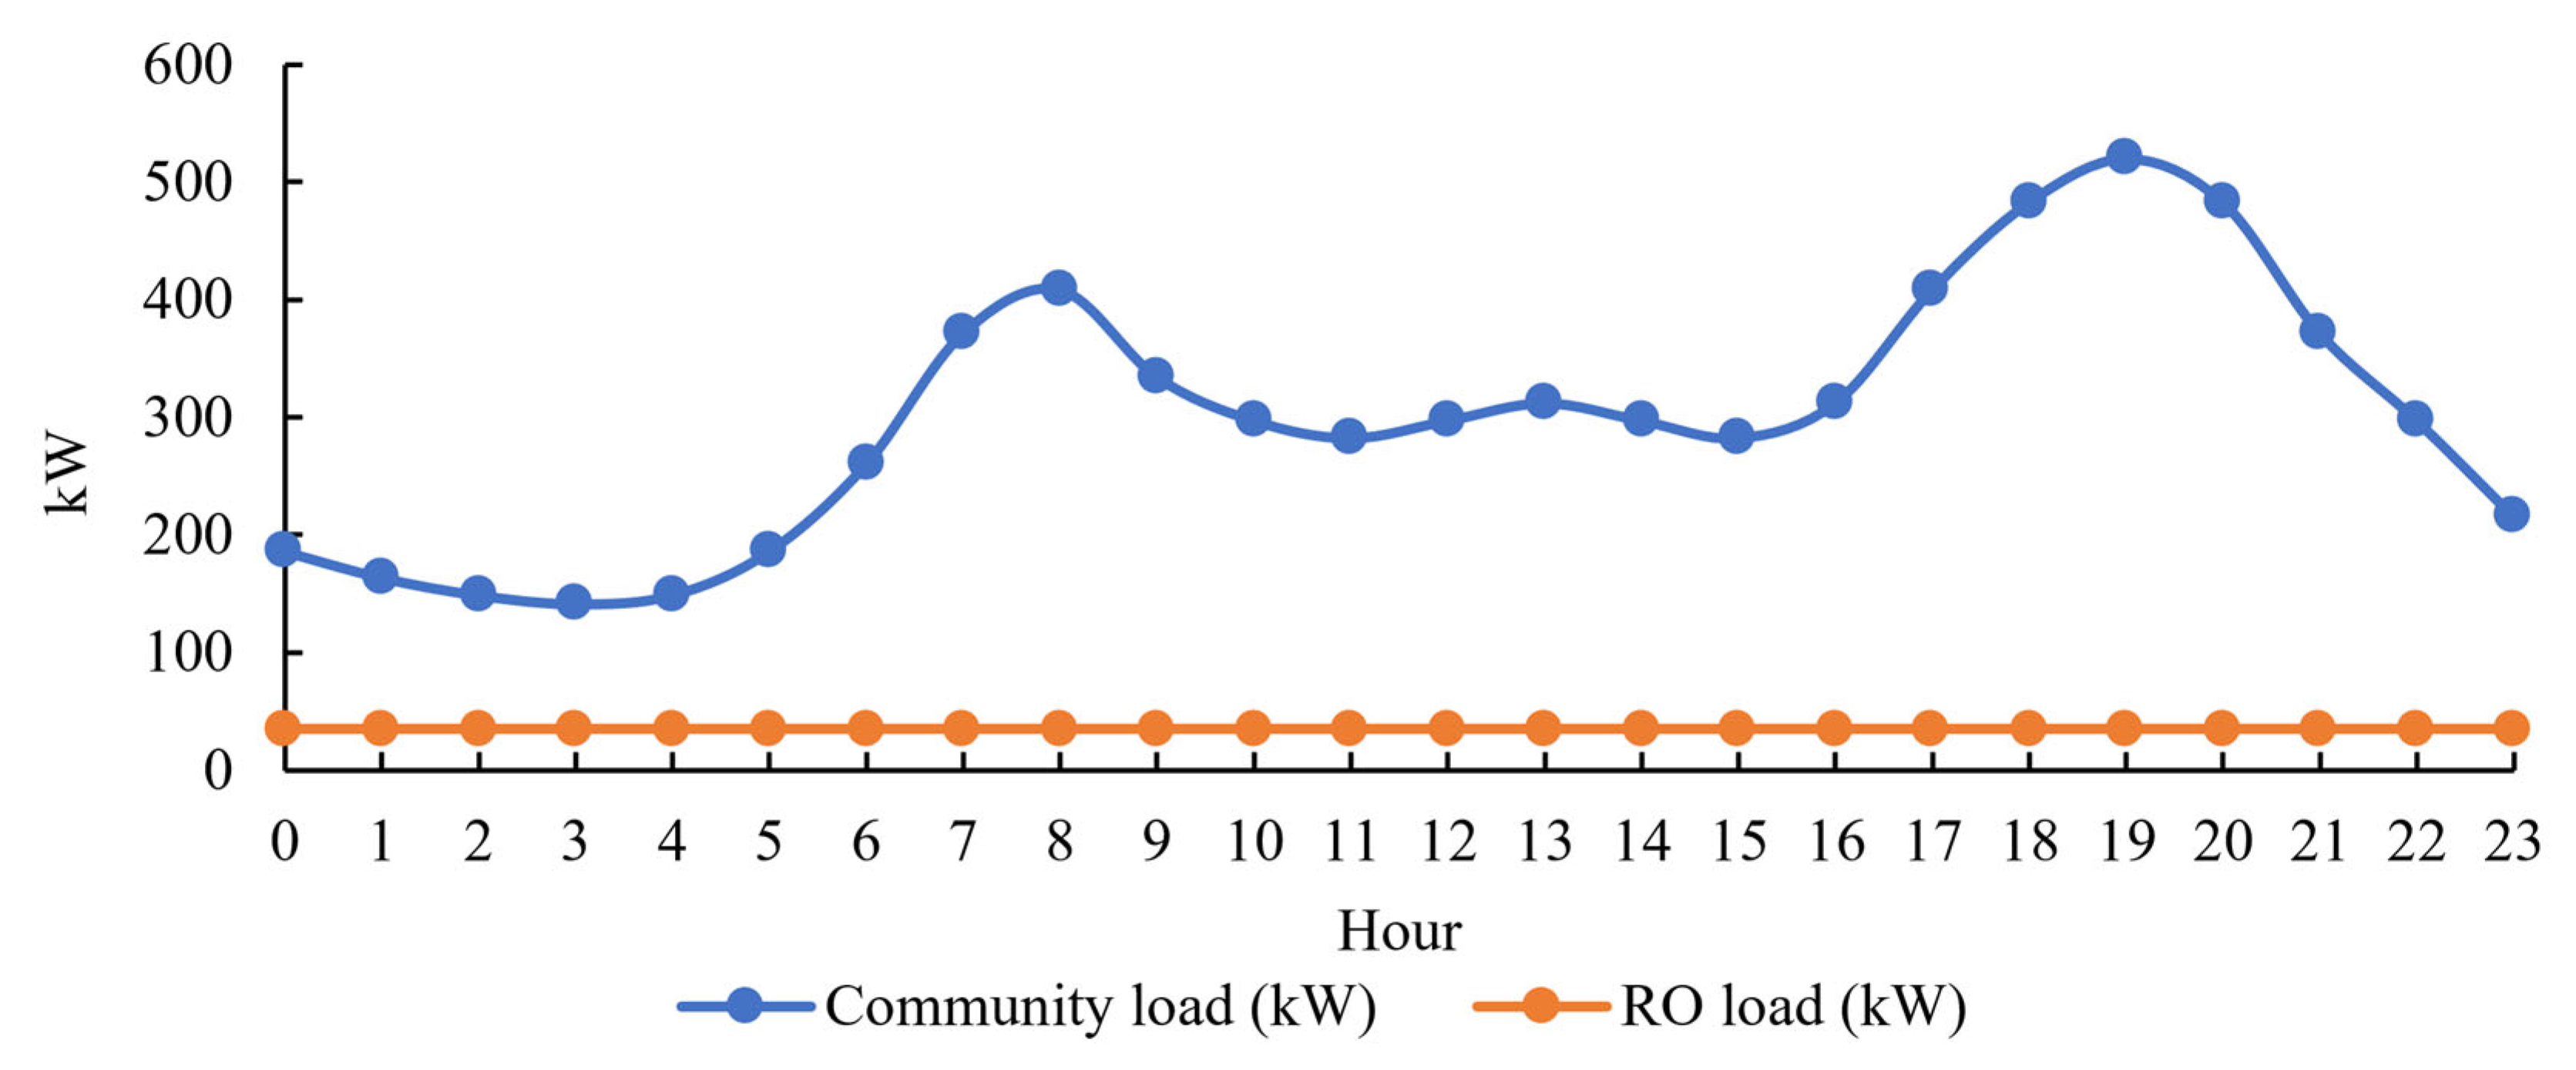
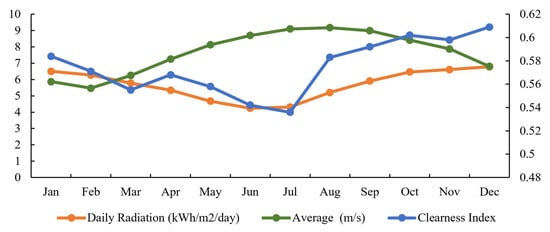
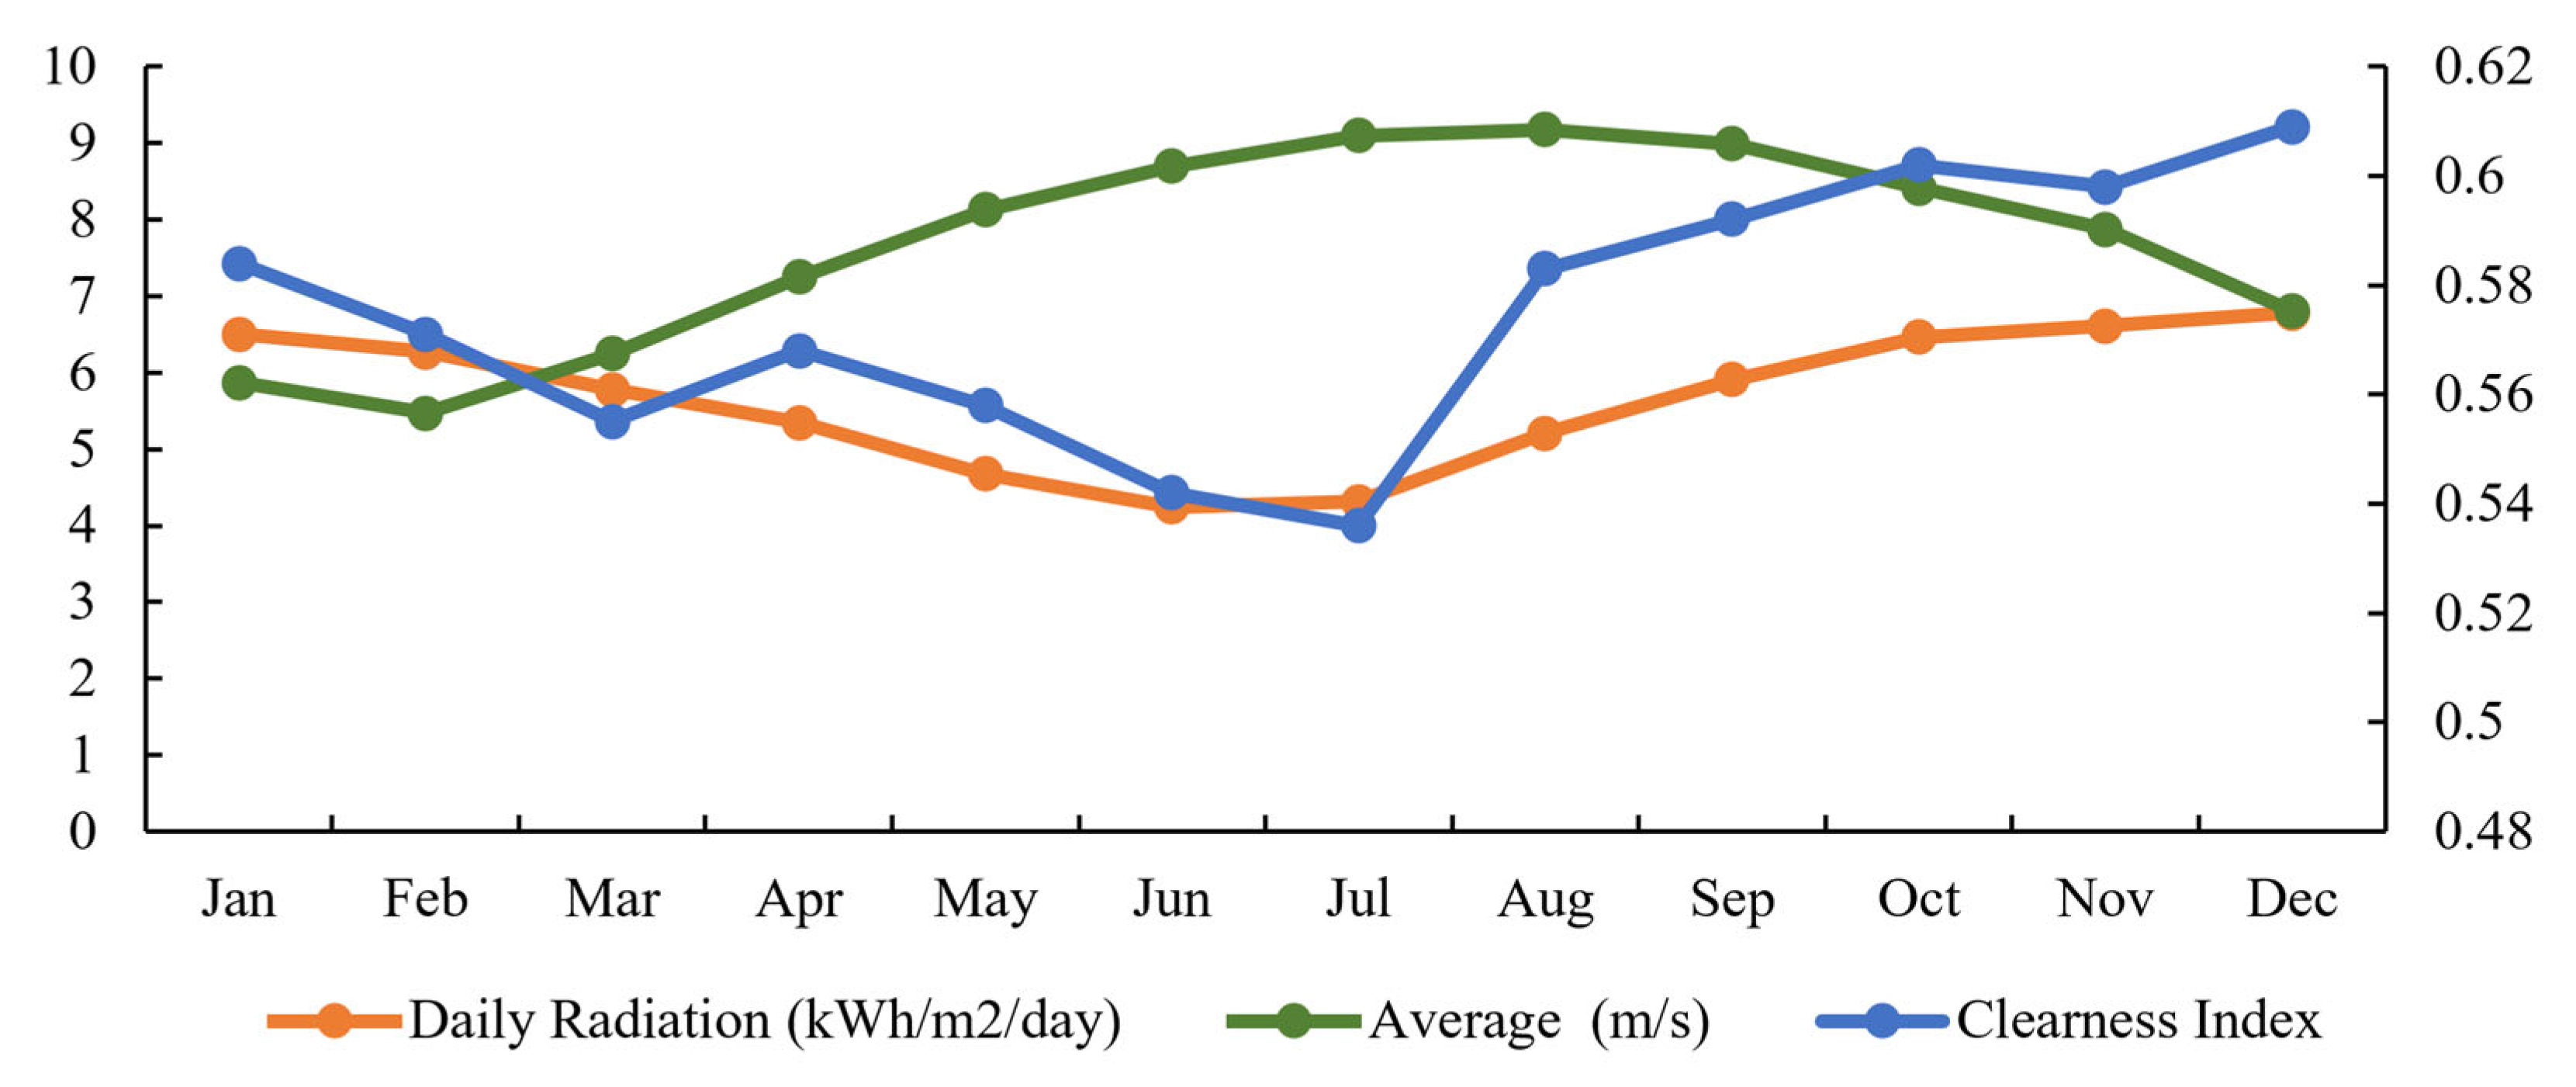
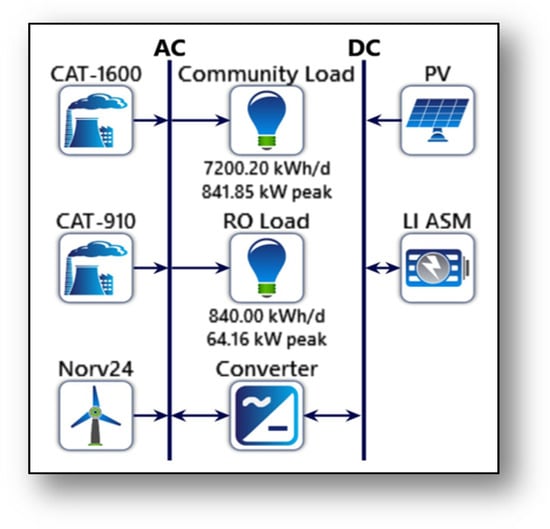
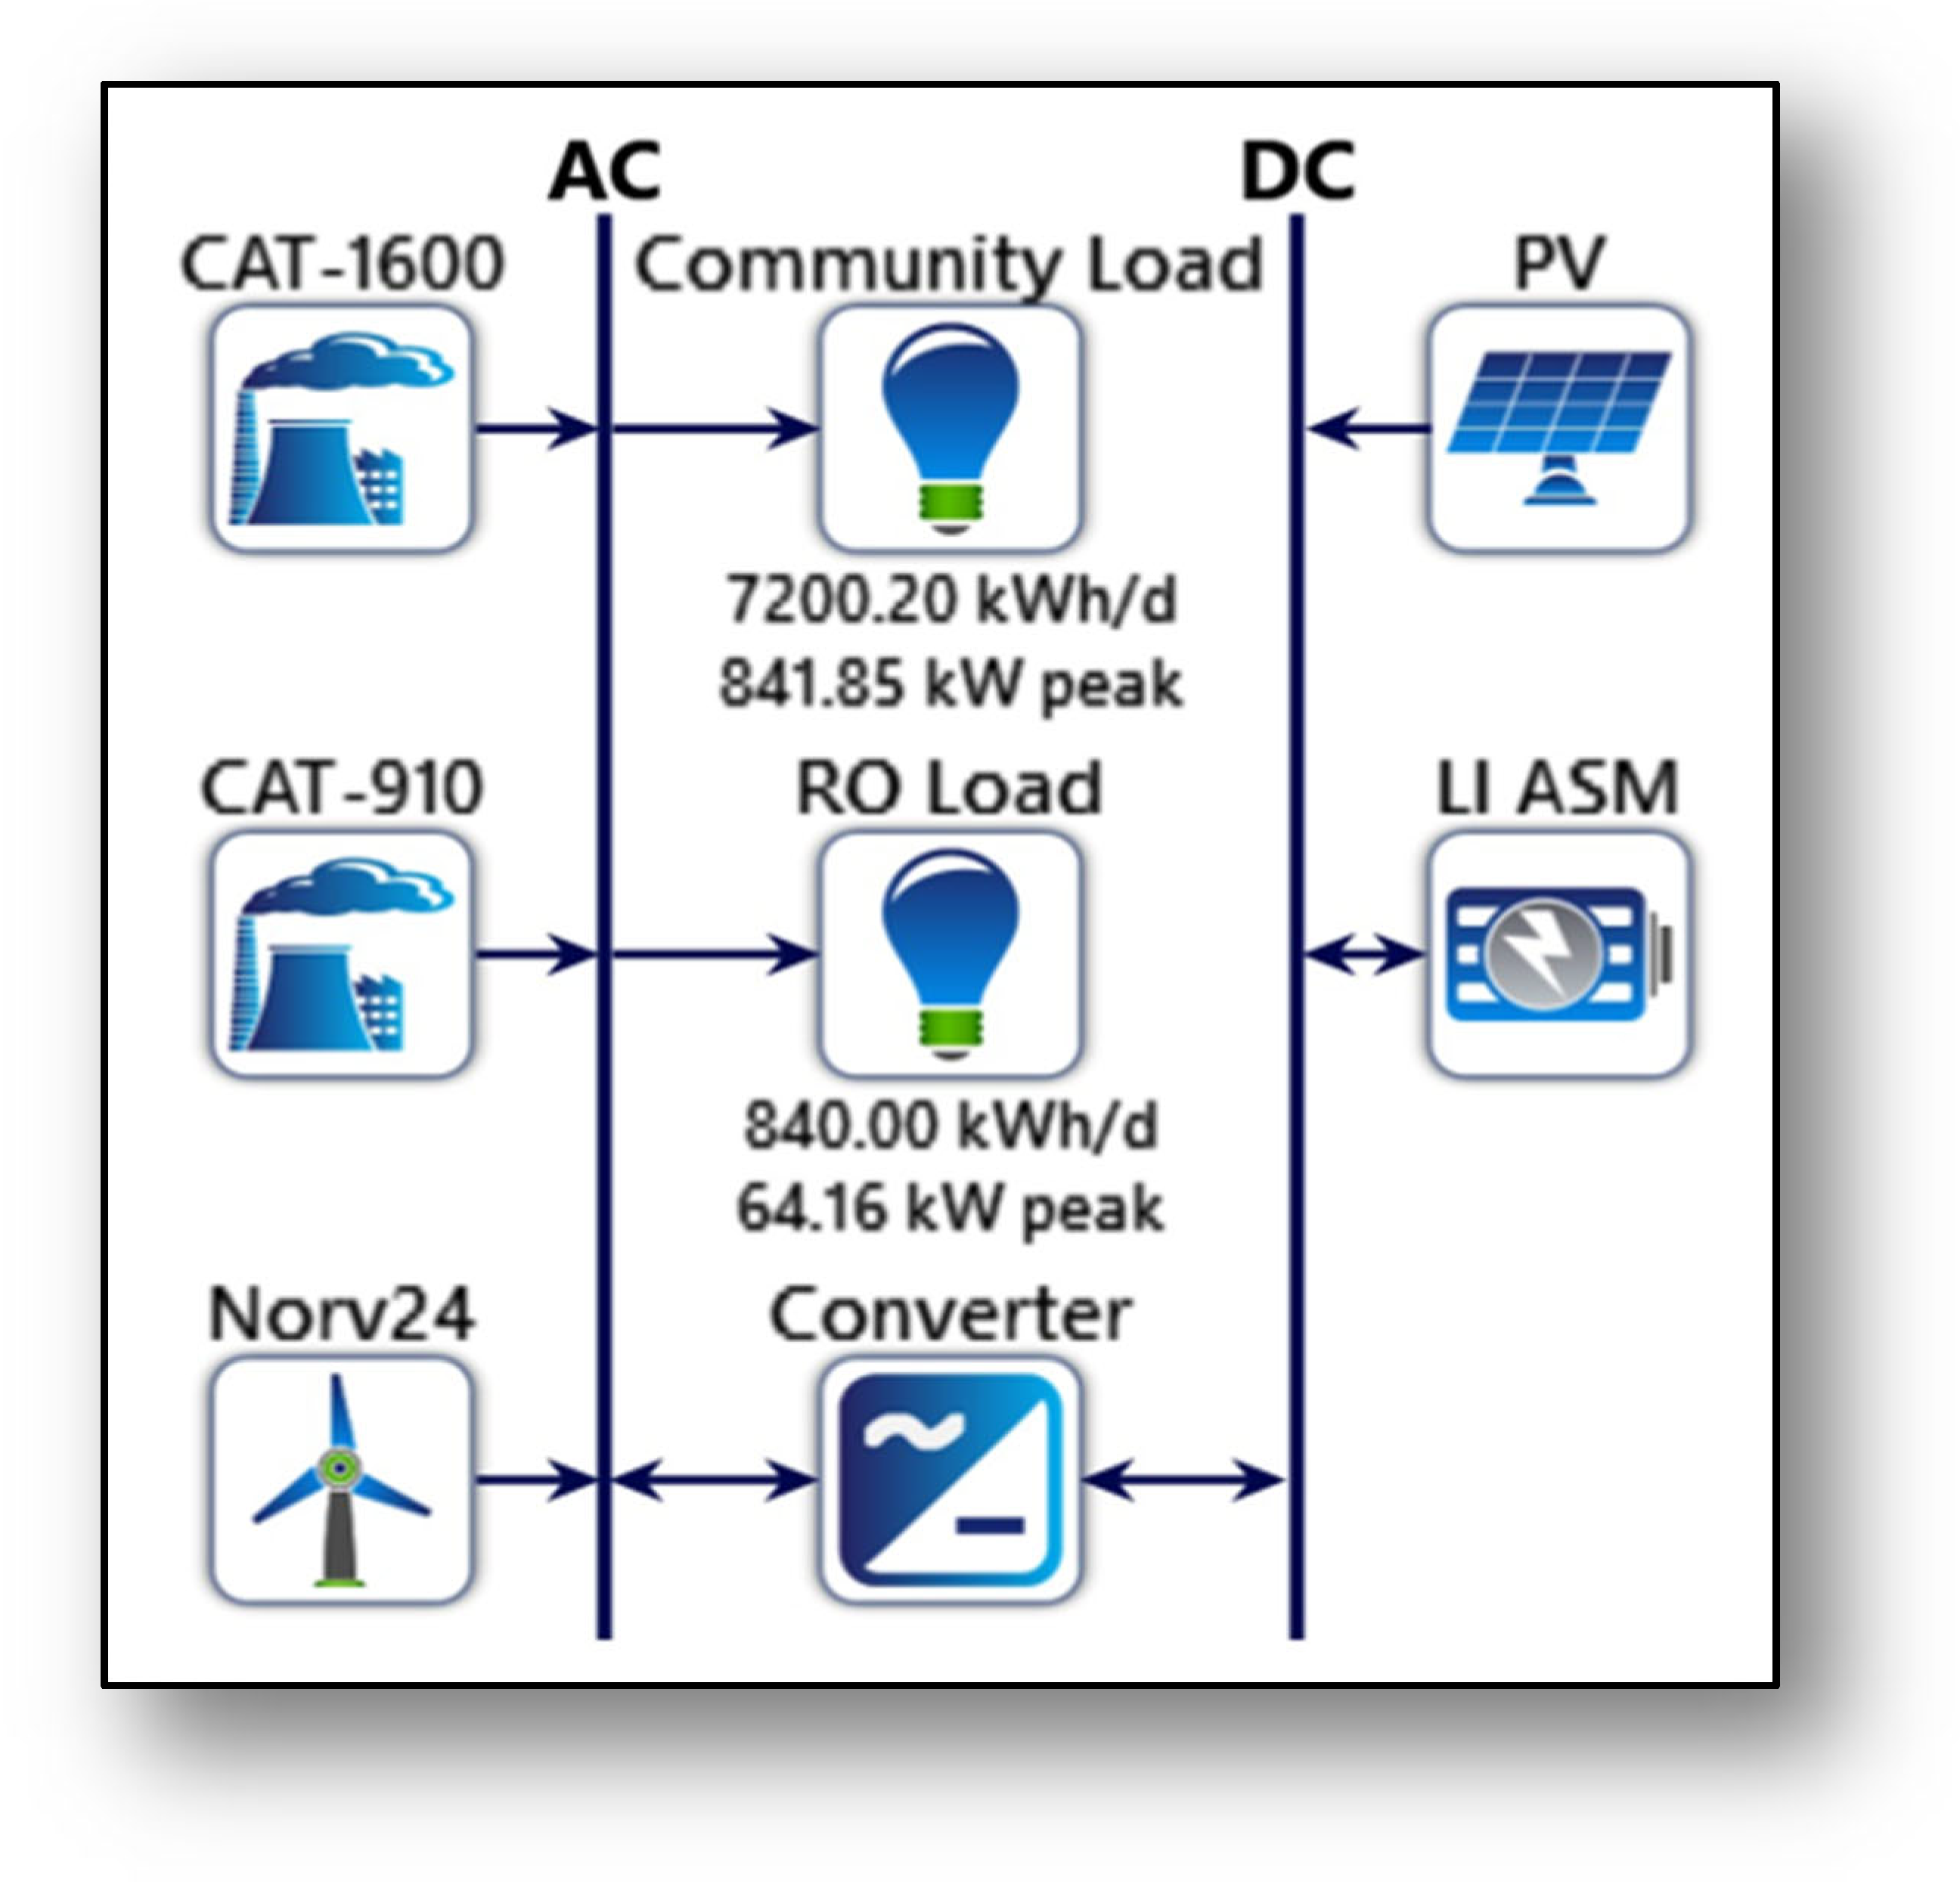
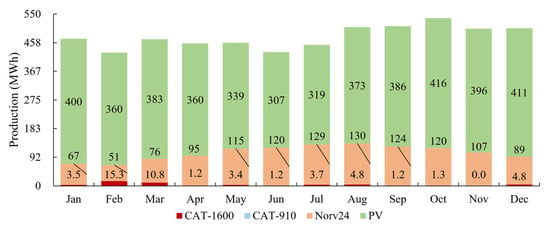
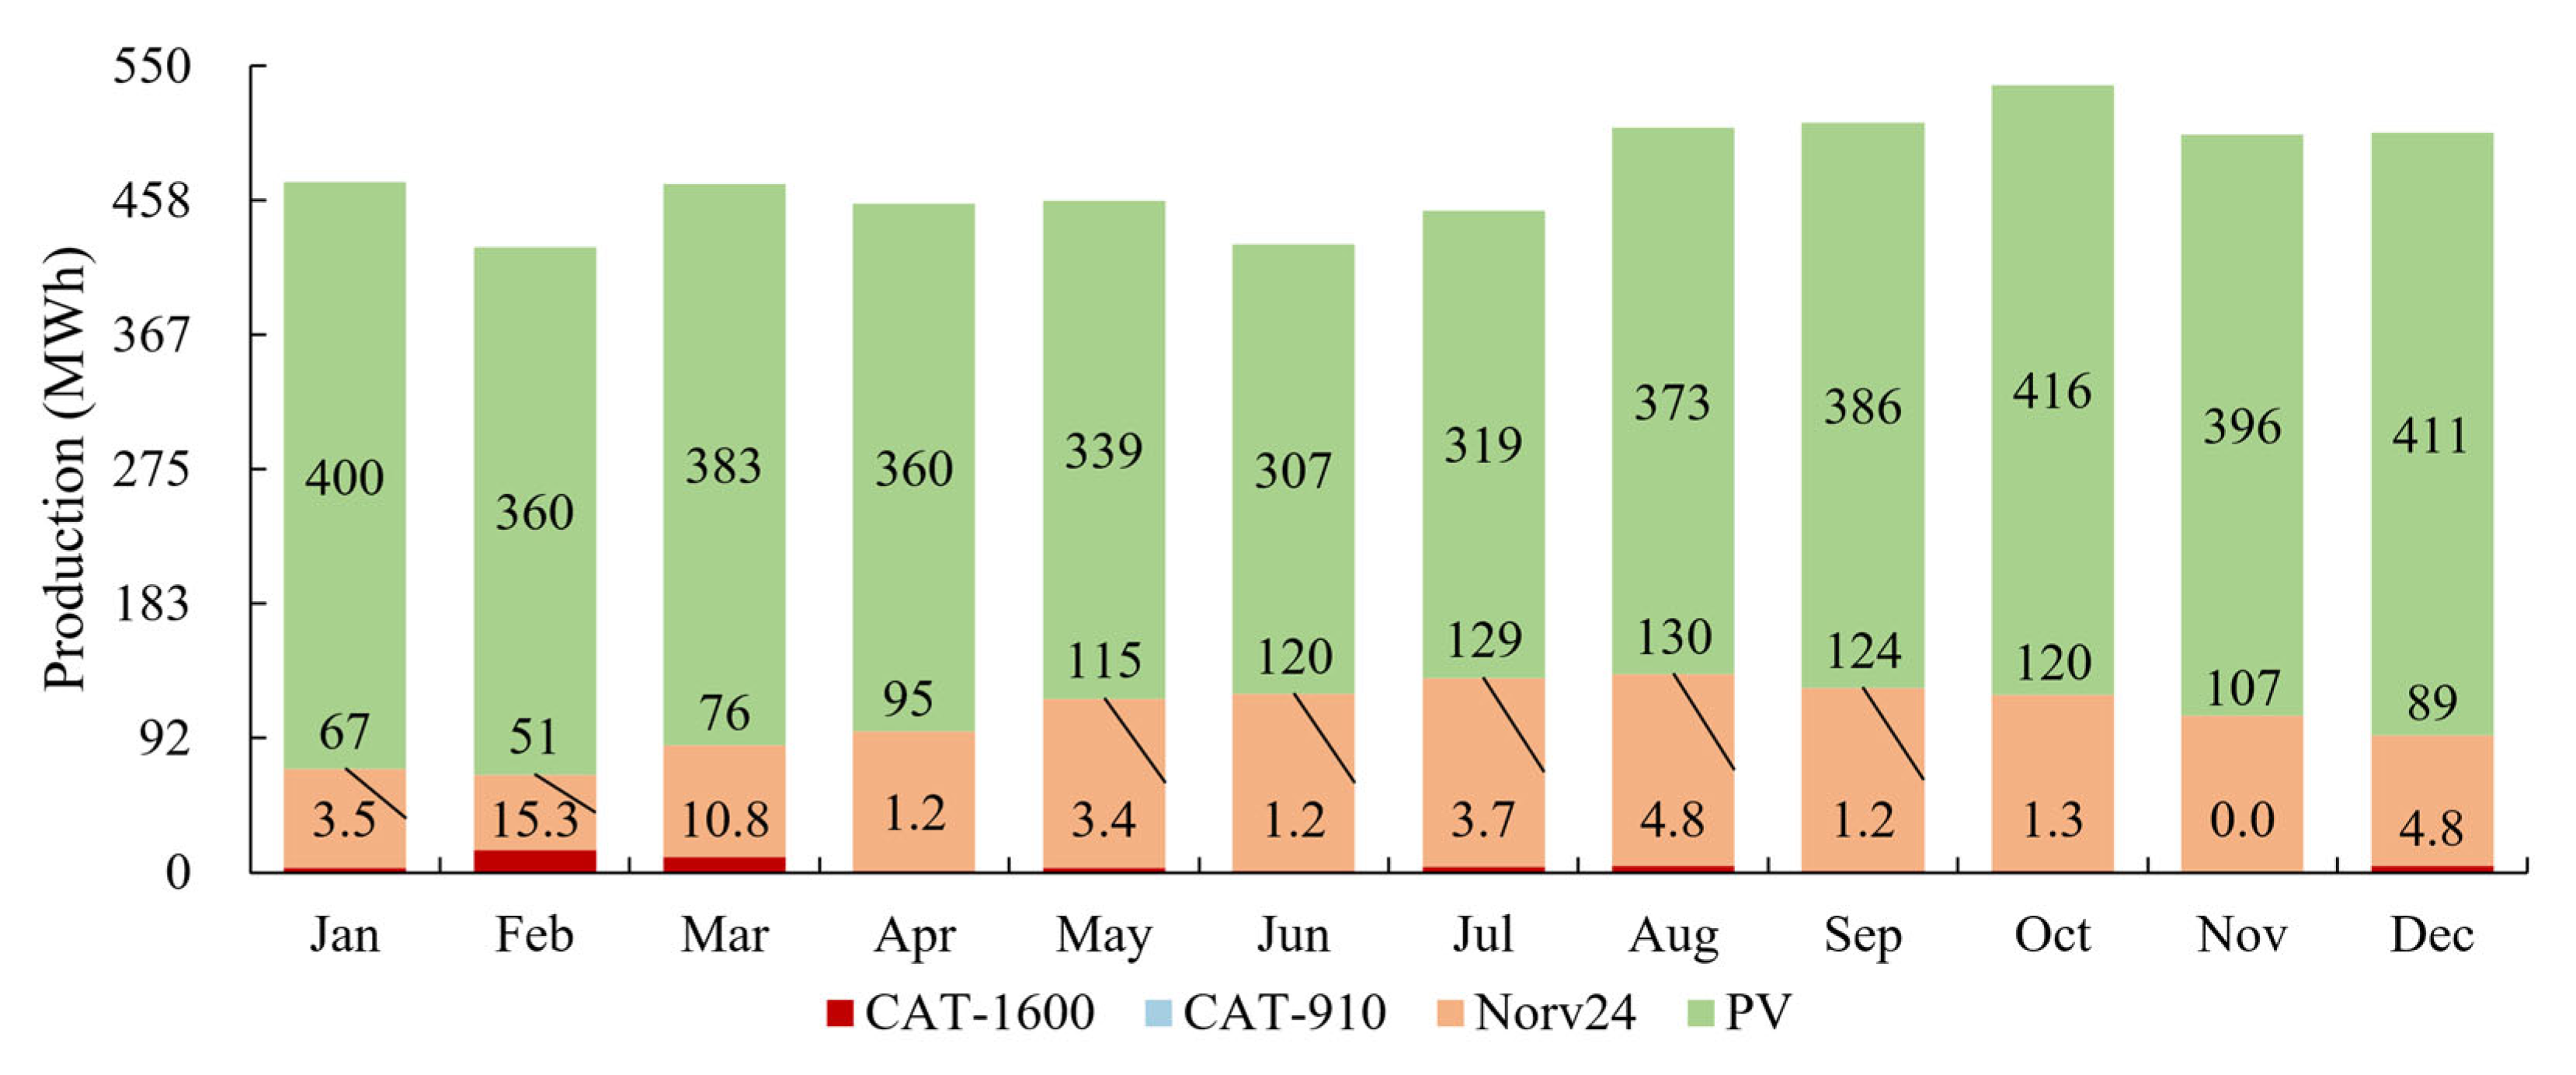
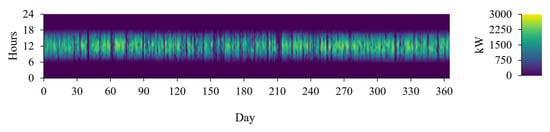
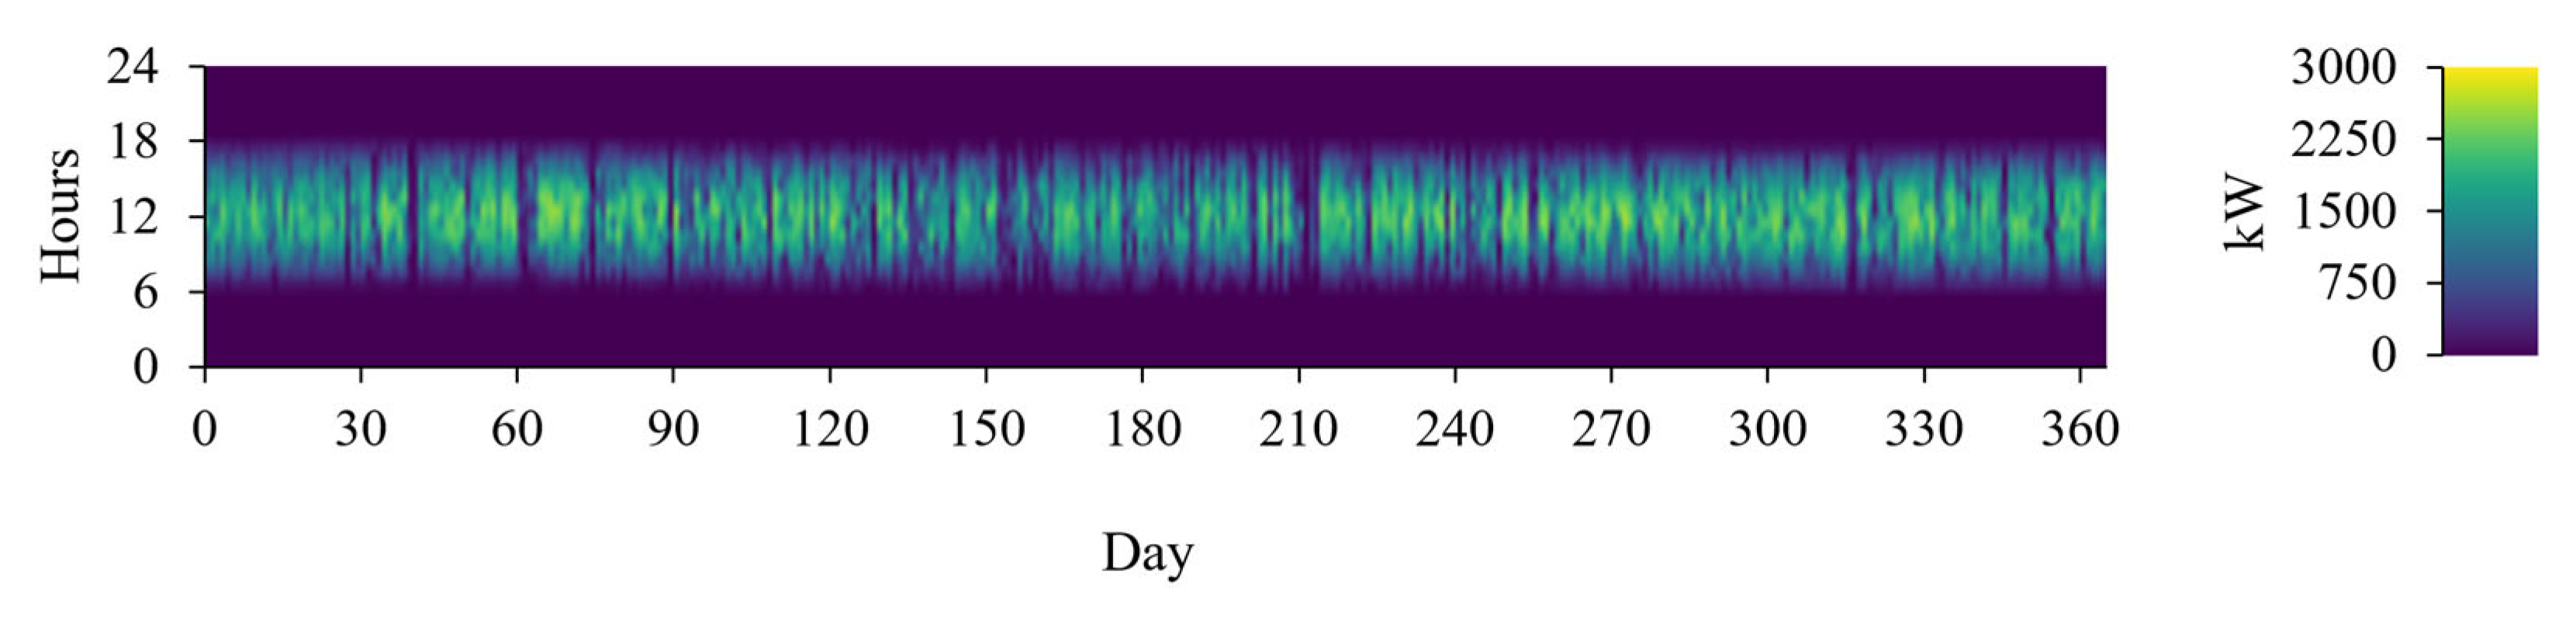
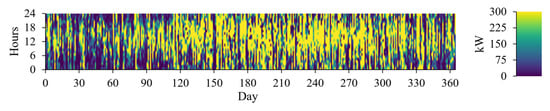
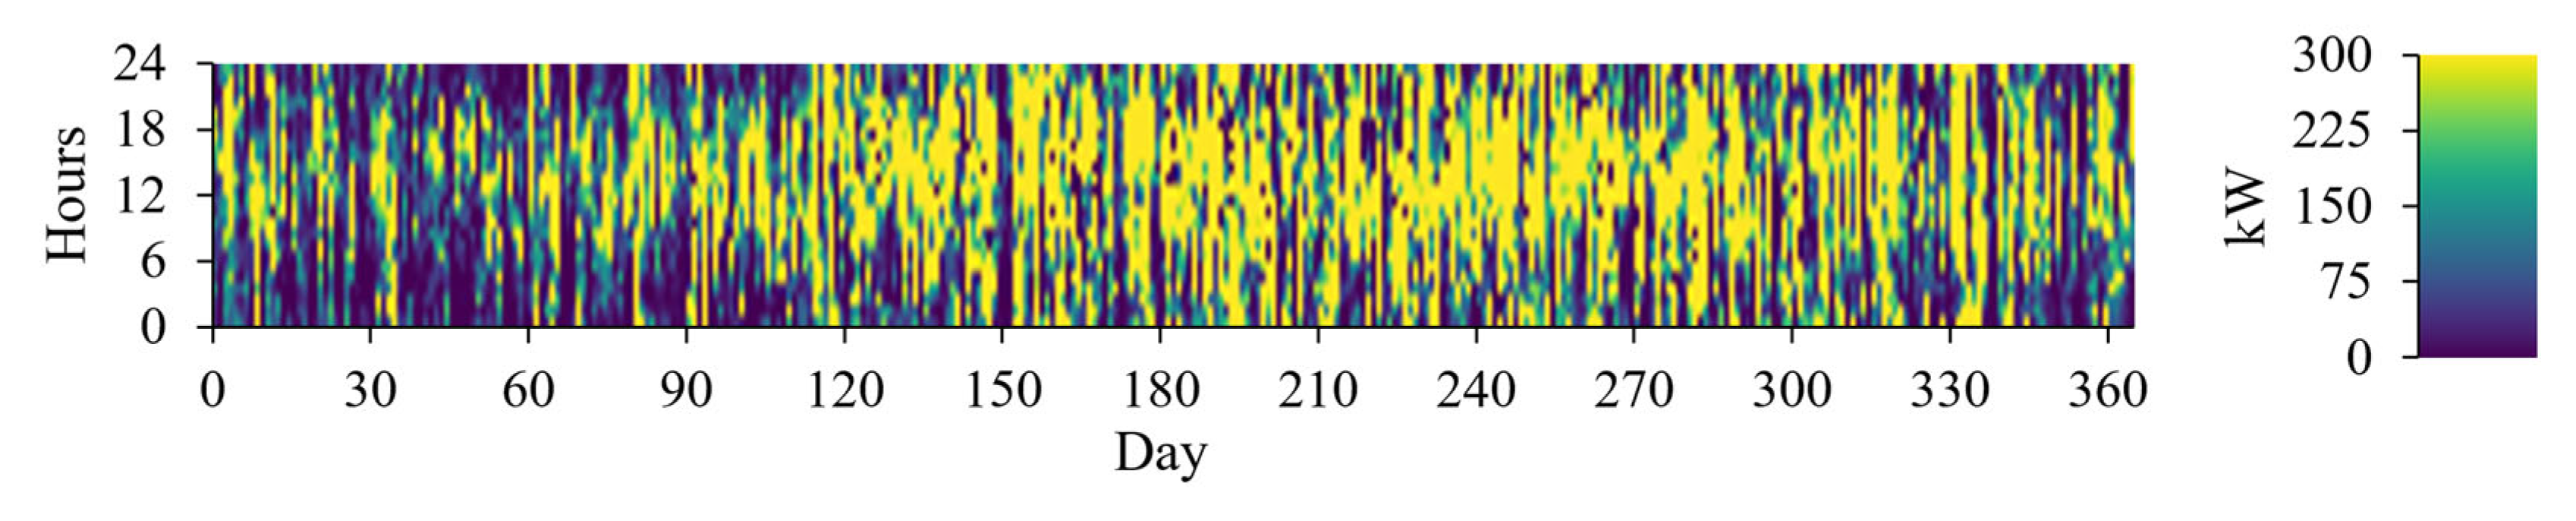
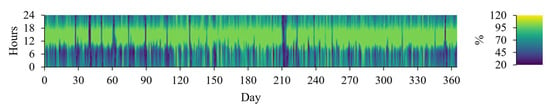
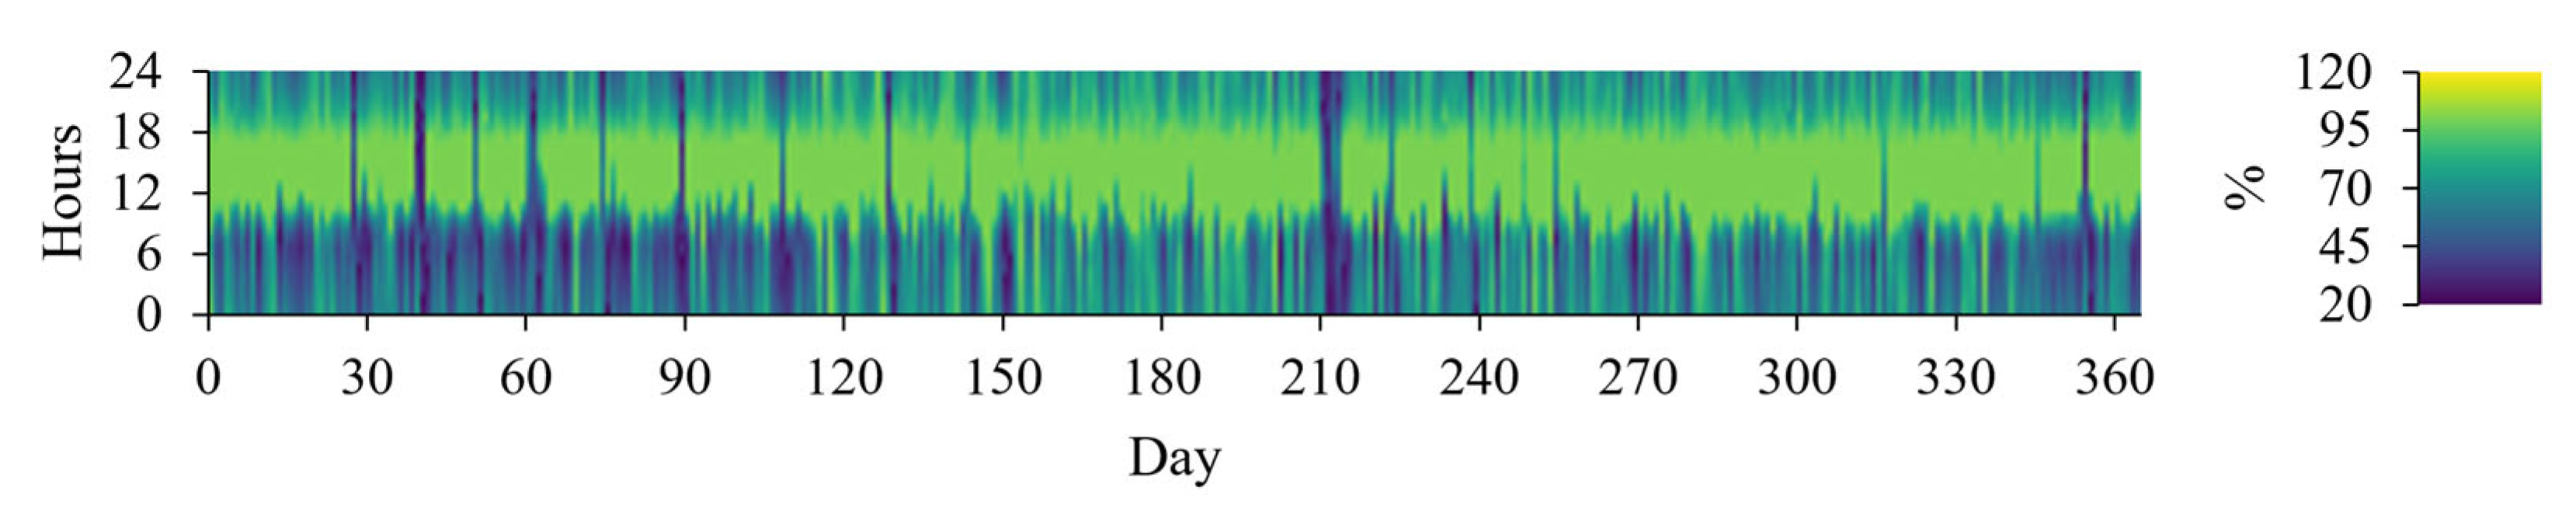
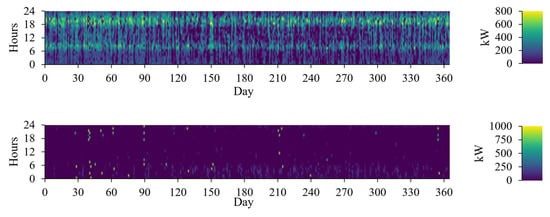
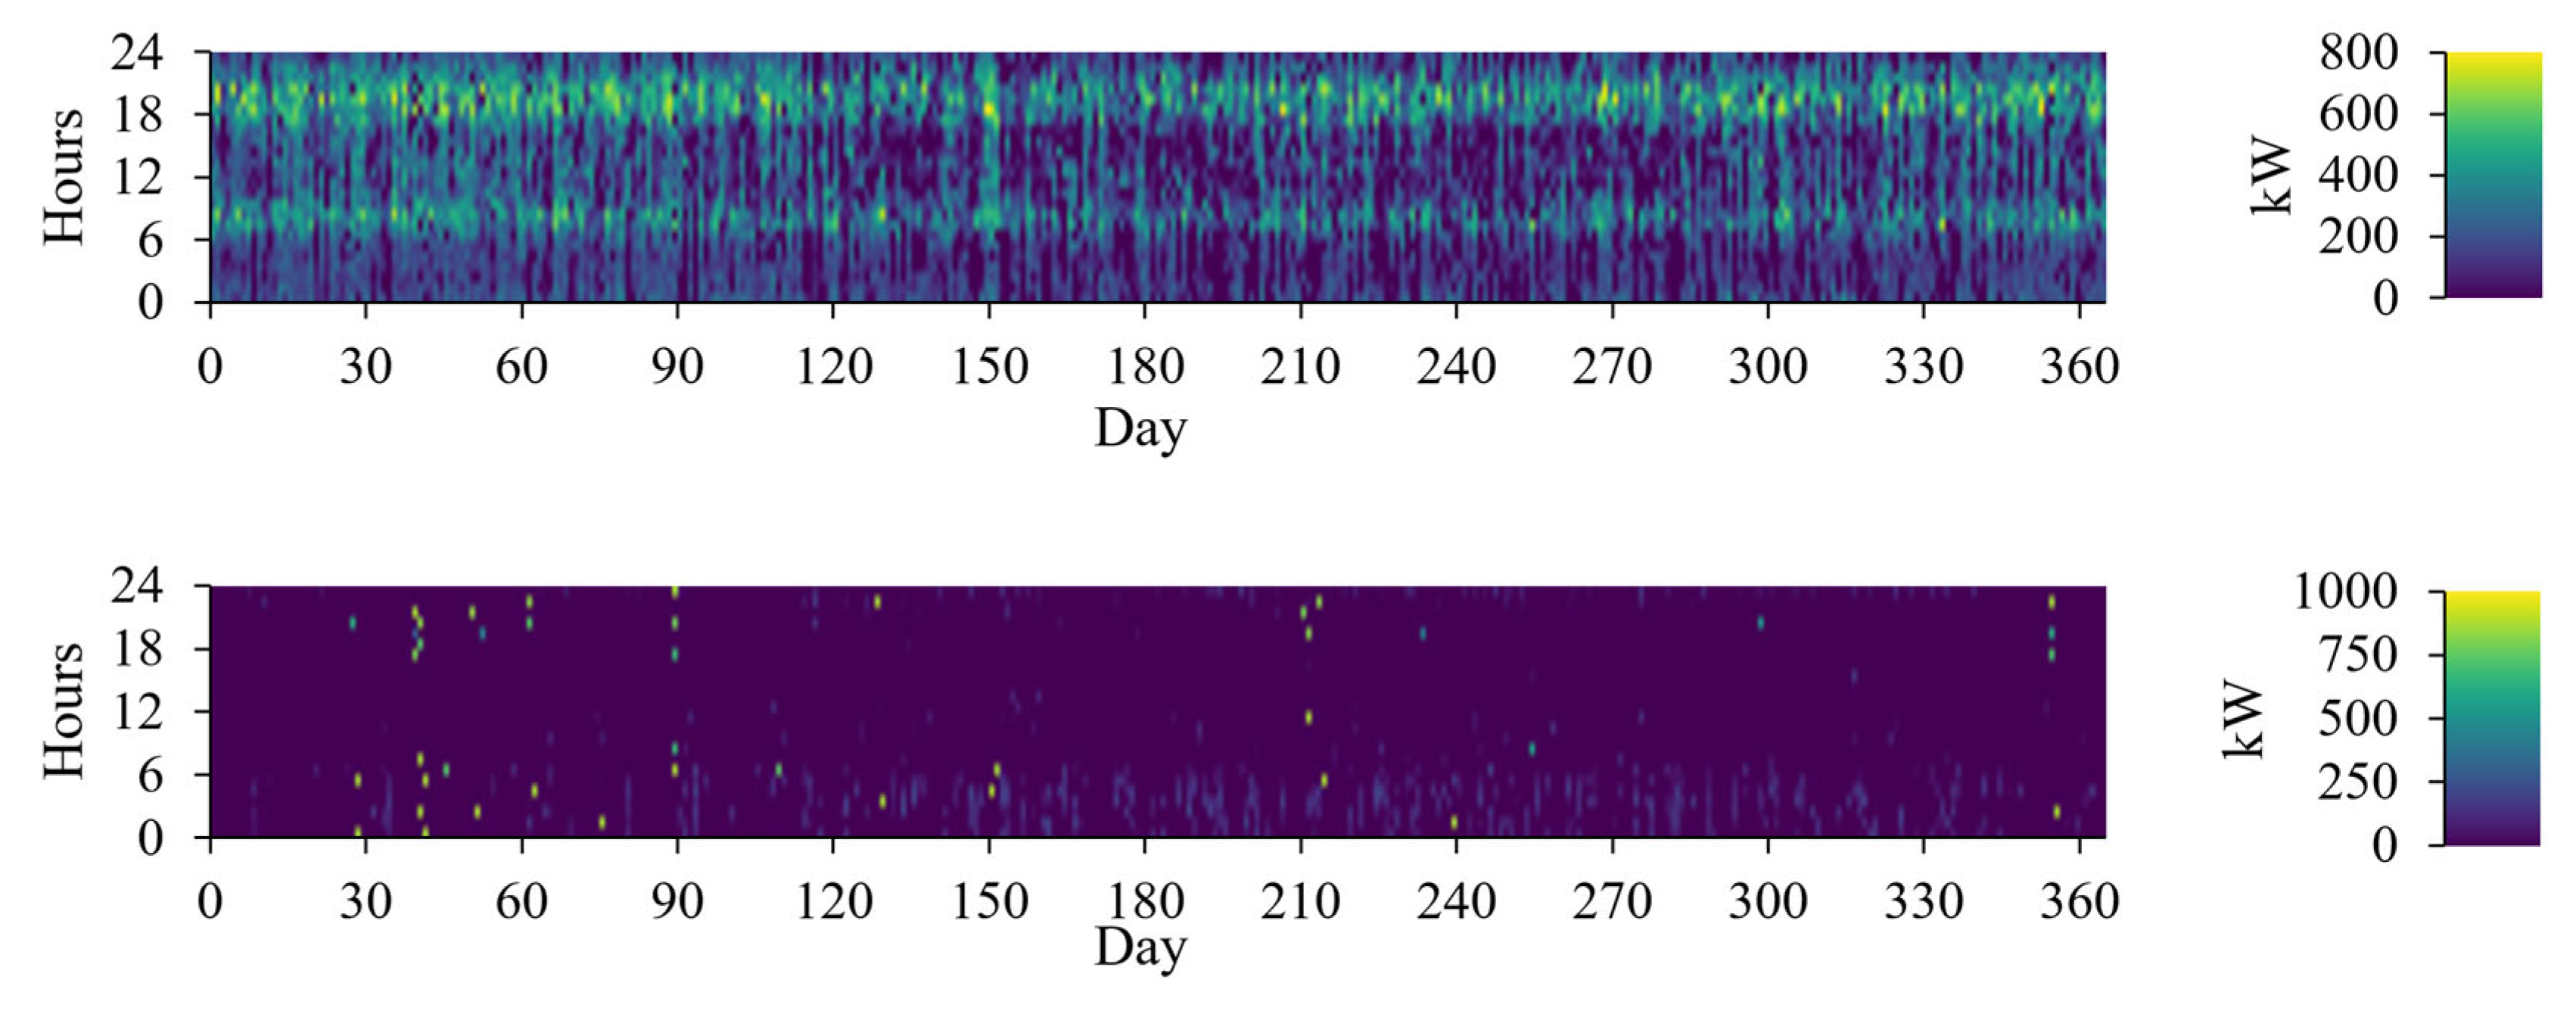


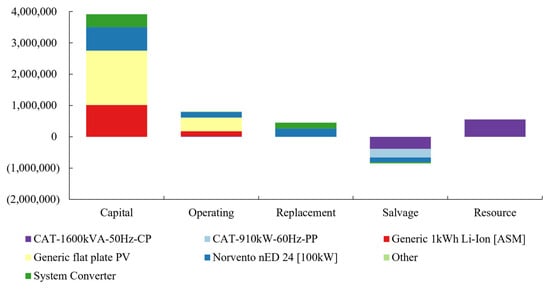
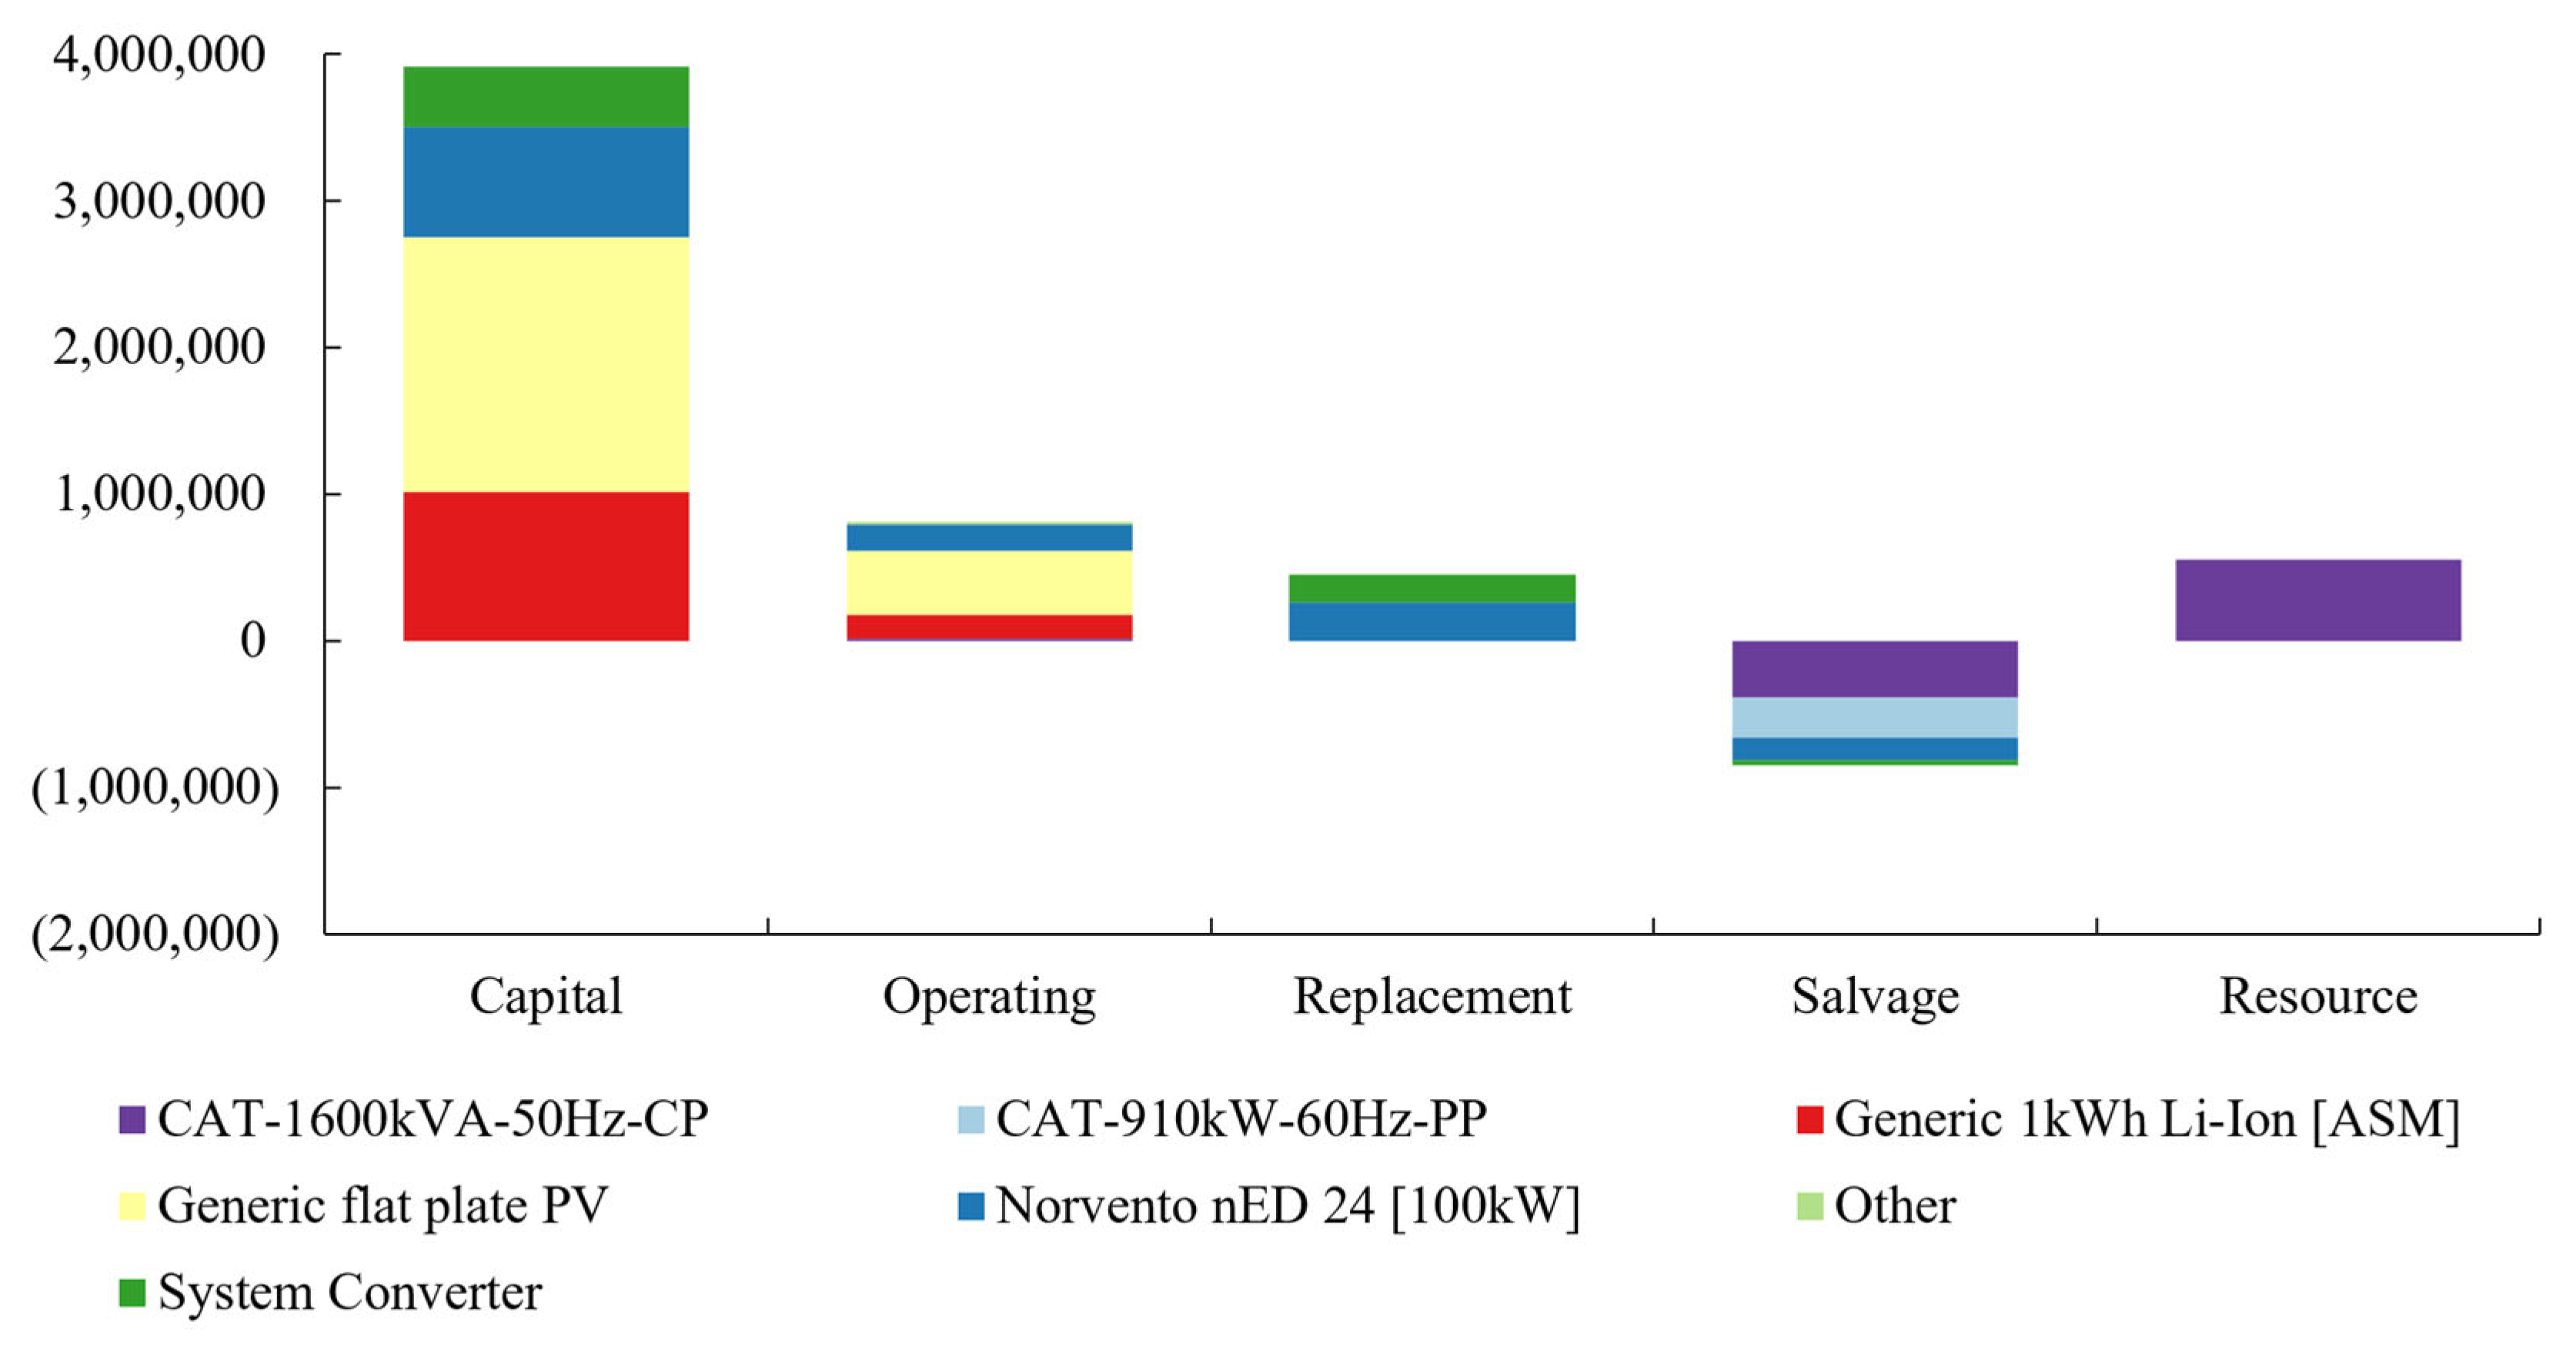
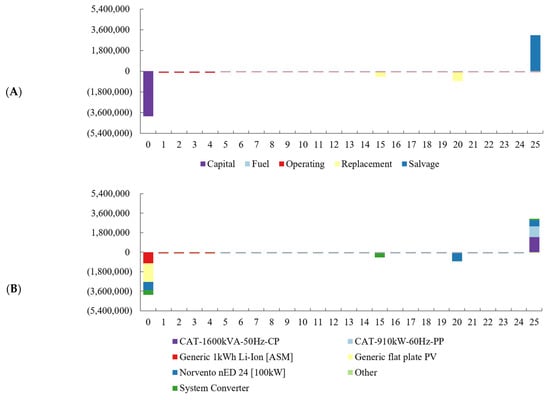
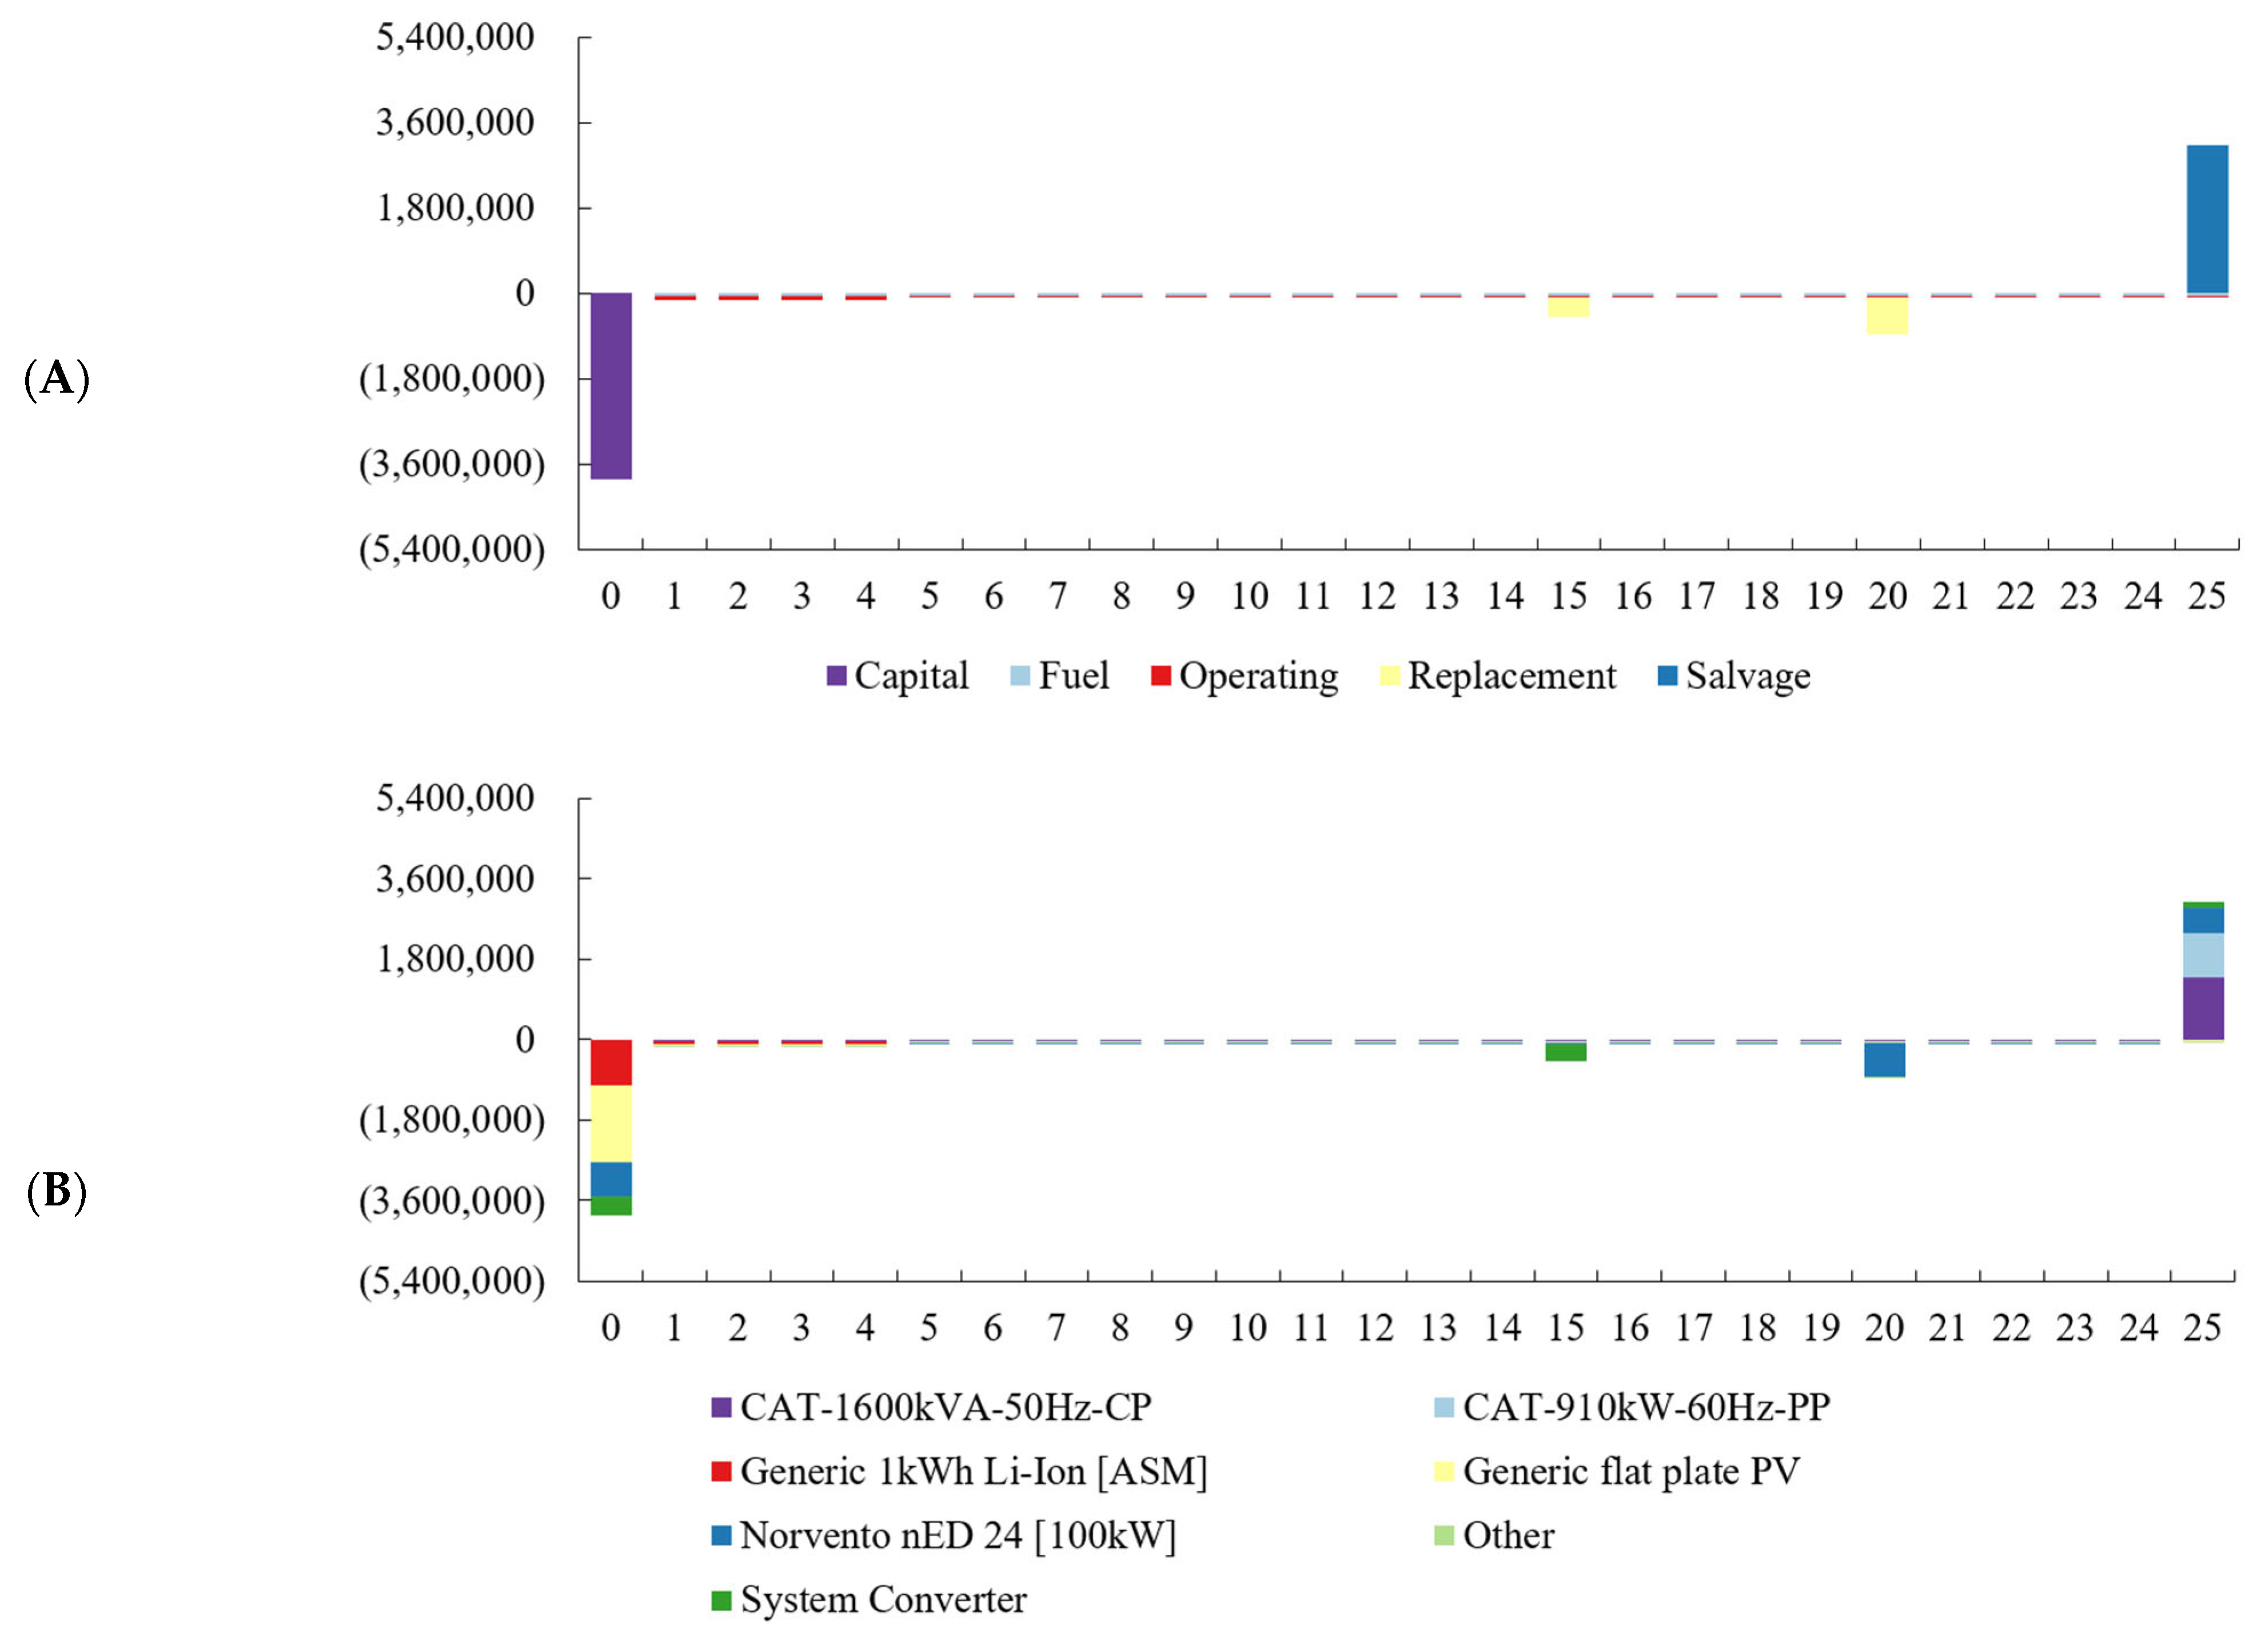
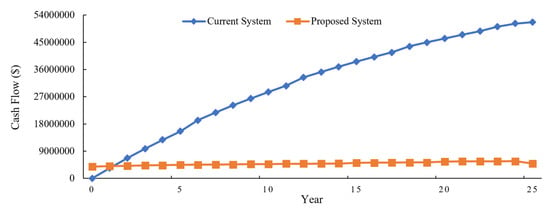
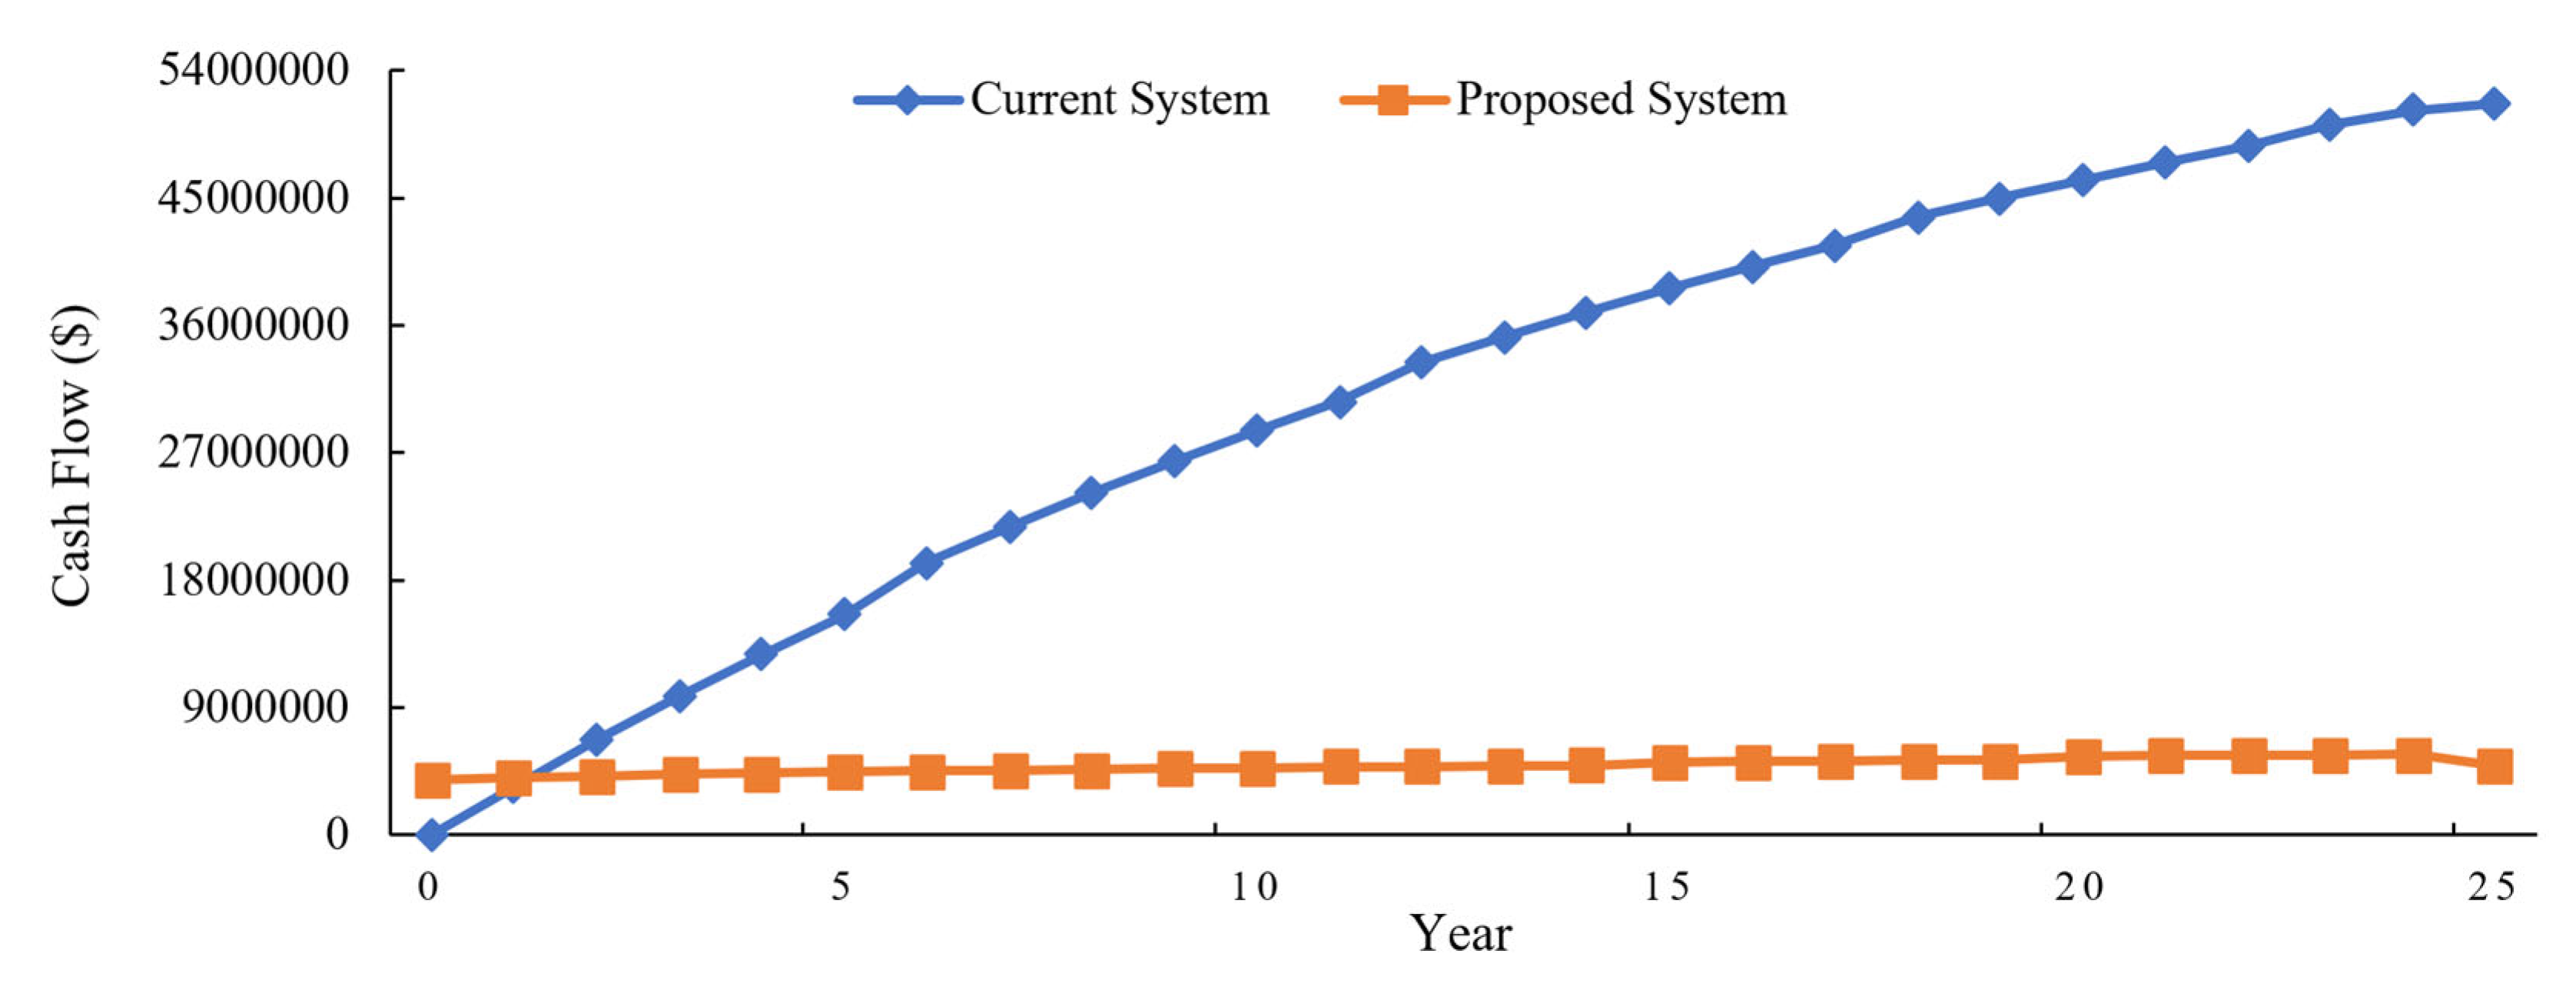
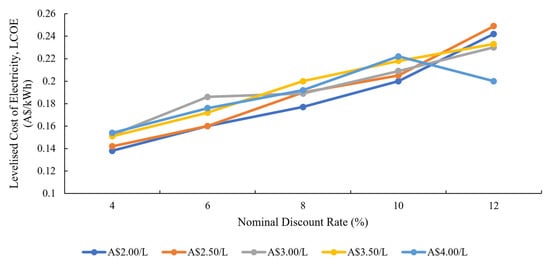
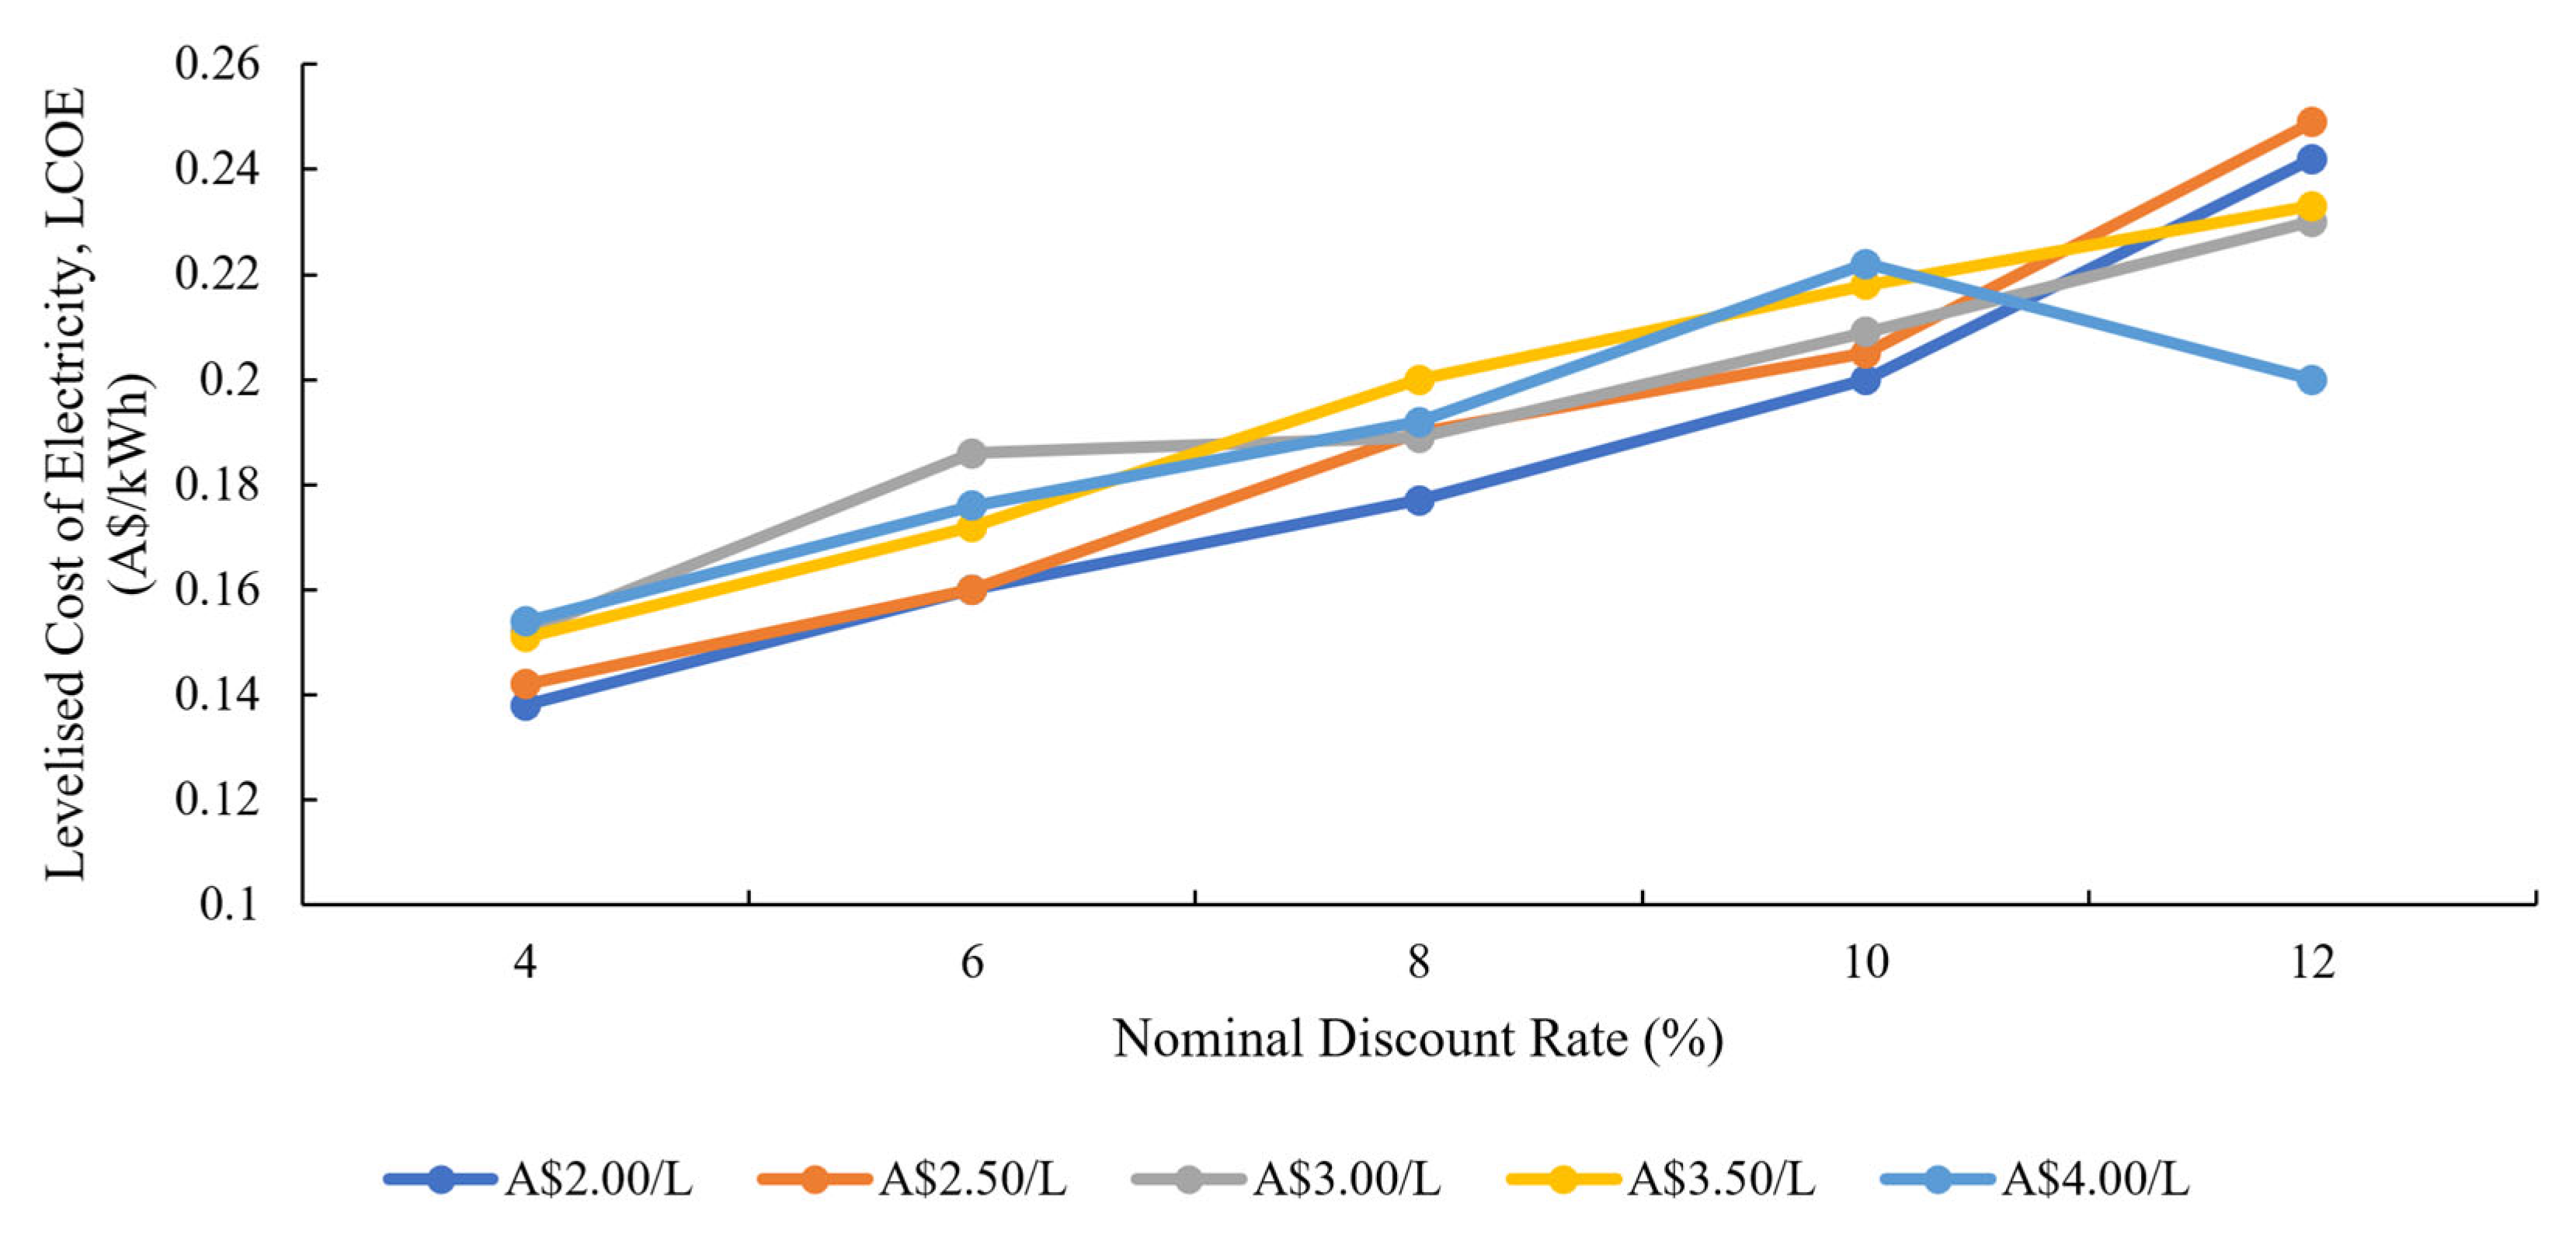
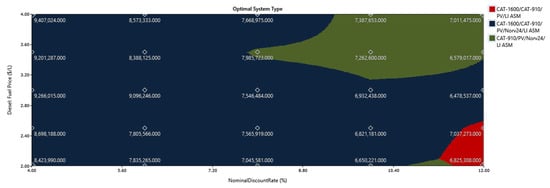
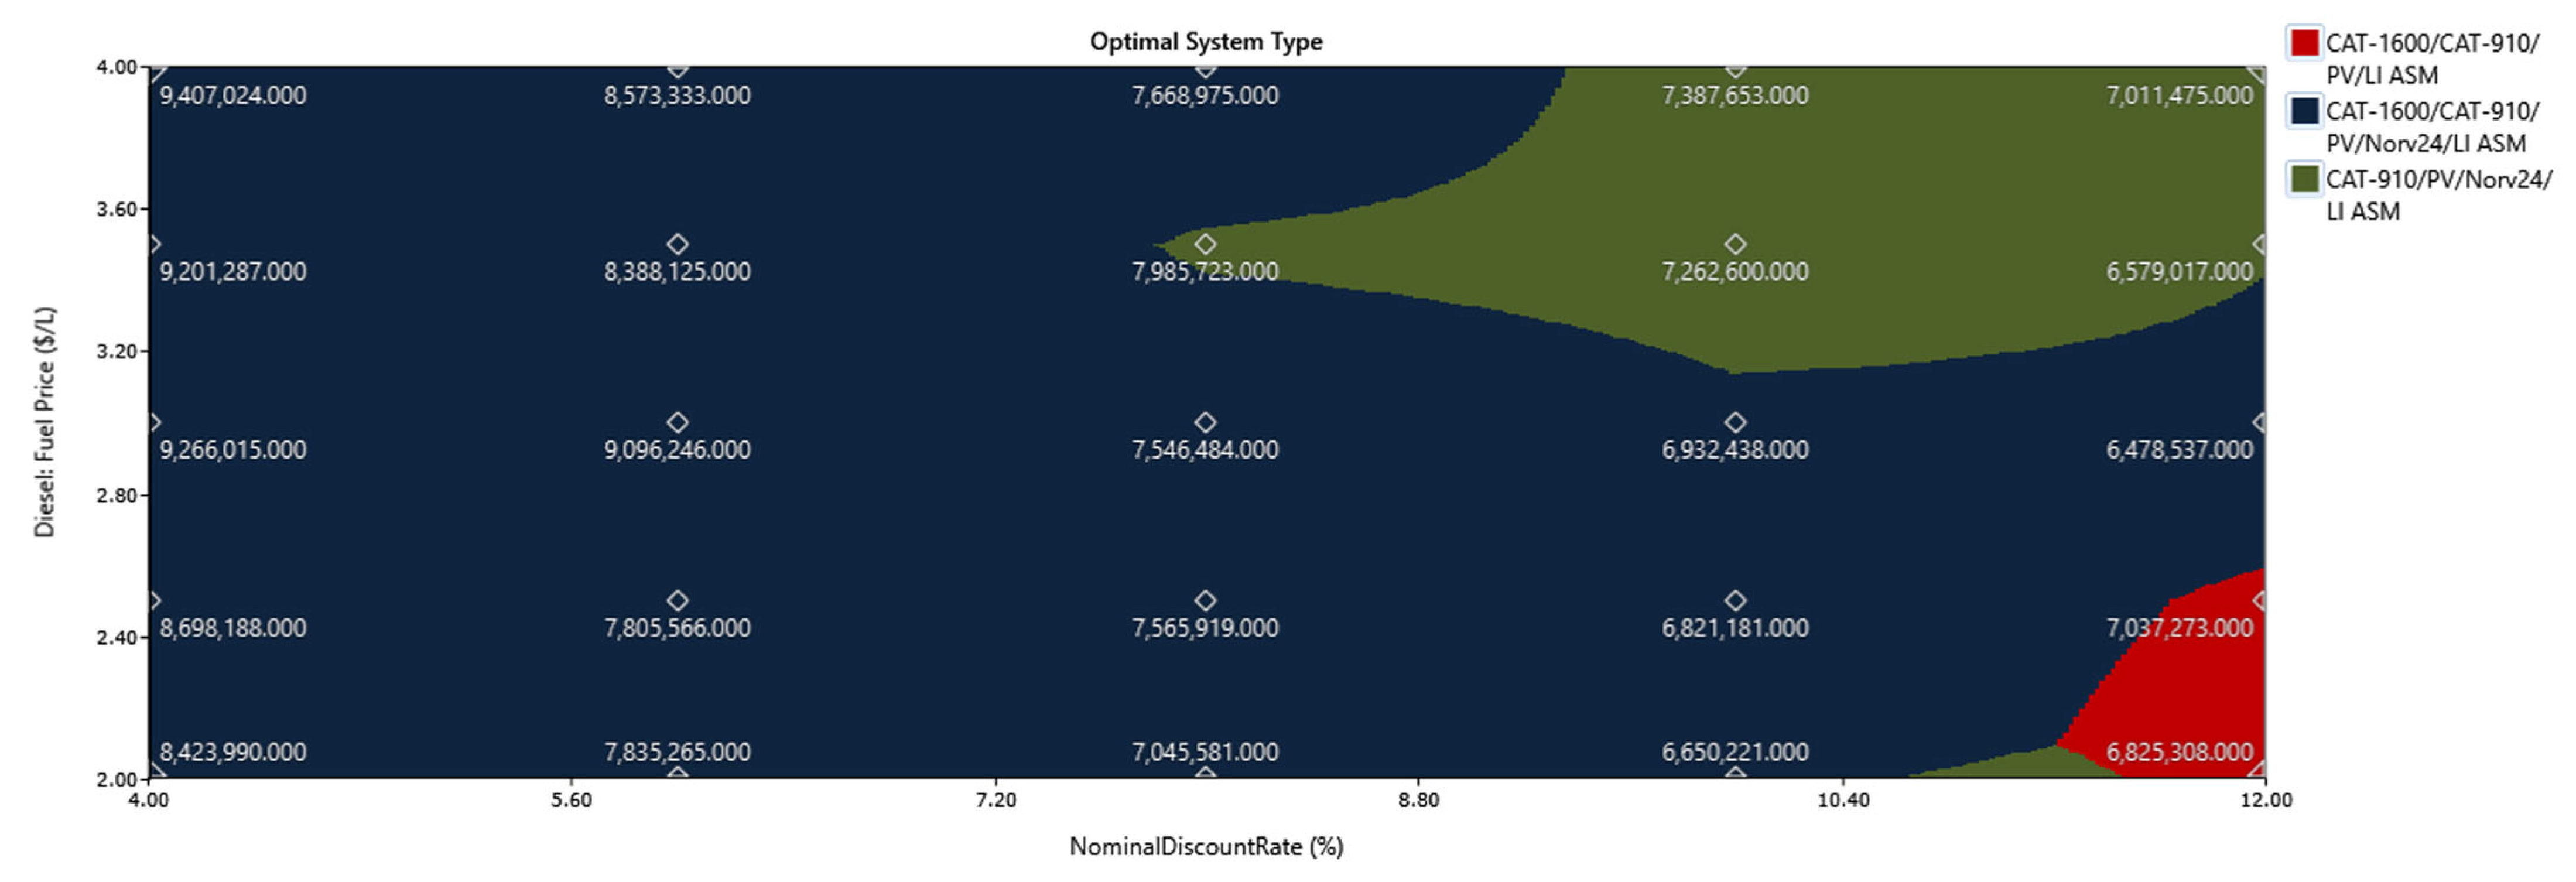

Disclaimer/Publisher’s Note: The statements, opinions and data contained in all publications are solely those of the individual author(s) and contributor(s) and not of MDPI and/or the editor(s). MDPI and/or the editor(s) disclaim responsibility for any injury to people or property resulting from any ideas, methods, instructions or products referred to in the content. |
© 2026 by the authors. Licensee MDPI, Basel, Switzerland. This article is an open access article distributed under the terms and conditions of the Creative Commons Attribution (CC BY) license.