


Highlights
What are the main findings?
- Magallanes with alkaline (HySTAT) electrolysis achieves the lowest LCOH (4.43 USD/kg H2) among the three Chilean regions and both electrolyzer technologies evaluated.
- Capacity factor and specific energy consumption, alongside electricity price, are the most influential drivers of LCOH.
- A small increase in hydrogen sale price above the breakeven LCOH produces large gains in NPV and IRR.
- Reaching Chile’s 1.5 USD/kg H2 target requires simultaneous improvements in electricity pricing, capacity factor, and electrolyzer efficiency, not incremental single-parameter gains.
Abstract
The Chilean government has proposed an ambitious plan to reduce emissions by 2050 and become a net-zero-emission country, including producing clean energy via green hydrogen generated from renewable sources. One goal is to achieve a cost of 1.5 USD/kg to be competitive. This study presents a techno-economic analysis of the production of green hydrogen using commercially available electrolyzers—HySTAT (alkaline) and HyLYZER (PEM)—for locations in northern, central, and southern Chile. The Antofagasta (northern), Bio-Bio (central), and Magallanes (southern) regions were evaluated based on their renewable energy sources—wind and solar—which vary in proportion and quantity by geographical location. The results show that the Magallanes region is the most competitive location. We calculated values of 4.43 USD/kg (HySTAT) and 4.81 USD/kg (HyLYZER). The economic evaluation of the HySTAT electrolyzer in Magallanes shows that a modest price above the break-even level yields substantially positive returns (Net Present Value (NPV) up to 2,684,250 USD, Internal Rate of Return (IRR) 19.5%). An optimized scenario combining lower electricity prices, higher capacity factor, and improved electrolyzer efficiency approaches the national target of 1.5 USD/kg , but only through simultaneous improvements beyond current commercial technology. These results suggest that Magallanes, paired with alkaline technology, represents a promising option for producing green hydrogen and merits further analysis, aligning with national decarbonization targets and global low-carbon fuel markets. Although the current LCOH values are far from the goal of 1.5 USD/kg , there are opportunities to reduce costs, either through the cheapest energy agreements or new technology developments.
1. Introduction
Chile is recognized by the United Nations Framework Convention on Climate Change (UNFCCC) as one of the countries with high vulnerability to climate change, meeting seven out of nine official vulnerability criteria [1,2]. In response to this scenario, and supported by advances in new technologies, the Chilean government has committed to achieving carbon neutrality by 2050 [2].
The search for innovative alternatives to mitigate emissions has increasingly focused on the production of green hydrogen, given its potential as a sustainable energy carrier capable of substantially reducing greenhouse gas emissions and supporting the global transition toward a low-carbon economy.
Despite this potential, hydrogen production today remains far from low-carbon at the global scale. According to the IEA [3], hydrogen supply remains dominated by unabated fossil fuels, with natural gas (via steam methane reforming) accounting for the largest share (61%), followed by coal gasification and byproduct hydrogen from industrial processes (22%). Hydrogen produced from oil and from low-emissions pathways—including water electrolysis and fossil fuels combined with carbon capture, utilization, and storage (CCUS)—together accounts for less than 2% of global production. Table 1 summarizes the current global hydrogen production landscape by production method.
Table 1.
Global hydrogen production by production method [3].
On the demand side, this supply is directed toward a well-established set of industrial applications. Global hydrogen demand today is dominated by two mature industrial applications—oil refining and ammonia synthesis—with methanol production constituting a further significant end use [3]. A newer wave of industrial demand is emerging around hydrogen’s potential to decarbonize sectors that are otherwise difficult to electrify directly, such as the iron and steel industry. Hydrogen is also gaining attention as a medium for long-duration energy storage, capable of absorbing curtailed renewable generation and later releasing it as electricity or heat, or being used directly as an industrial feedstock [4].
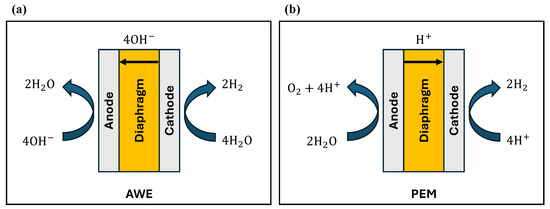
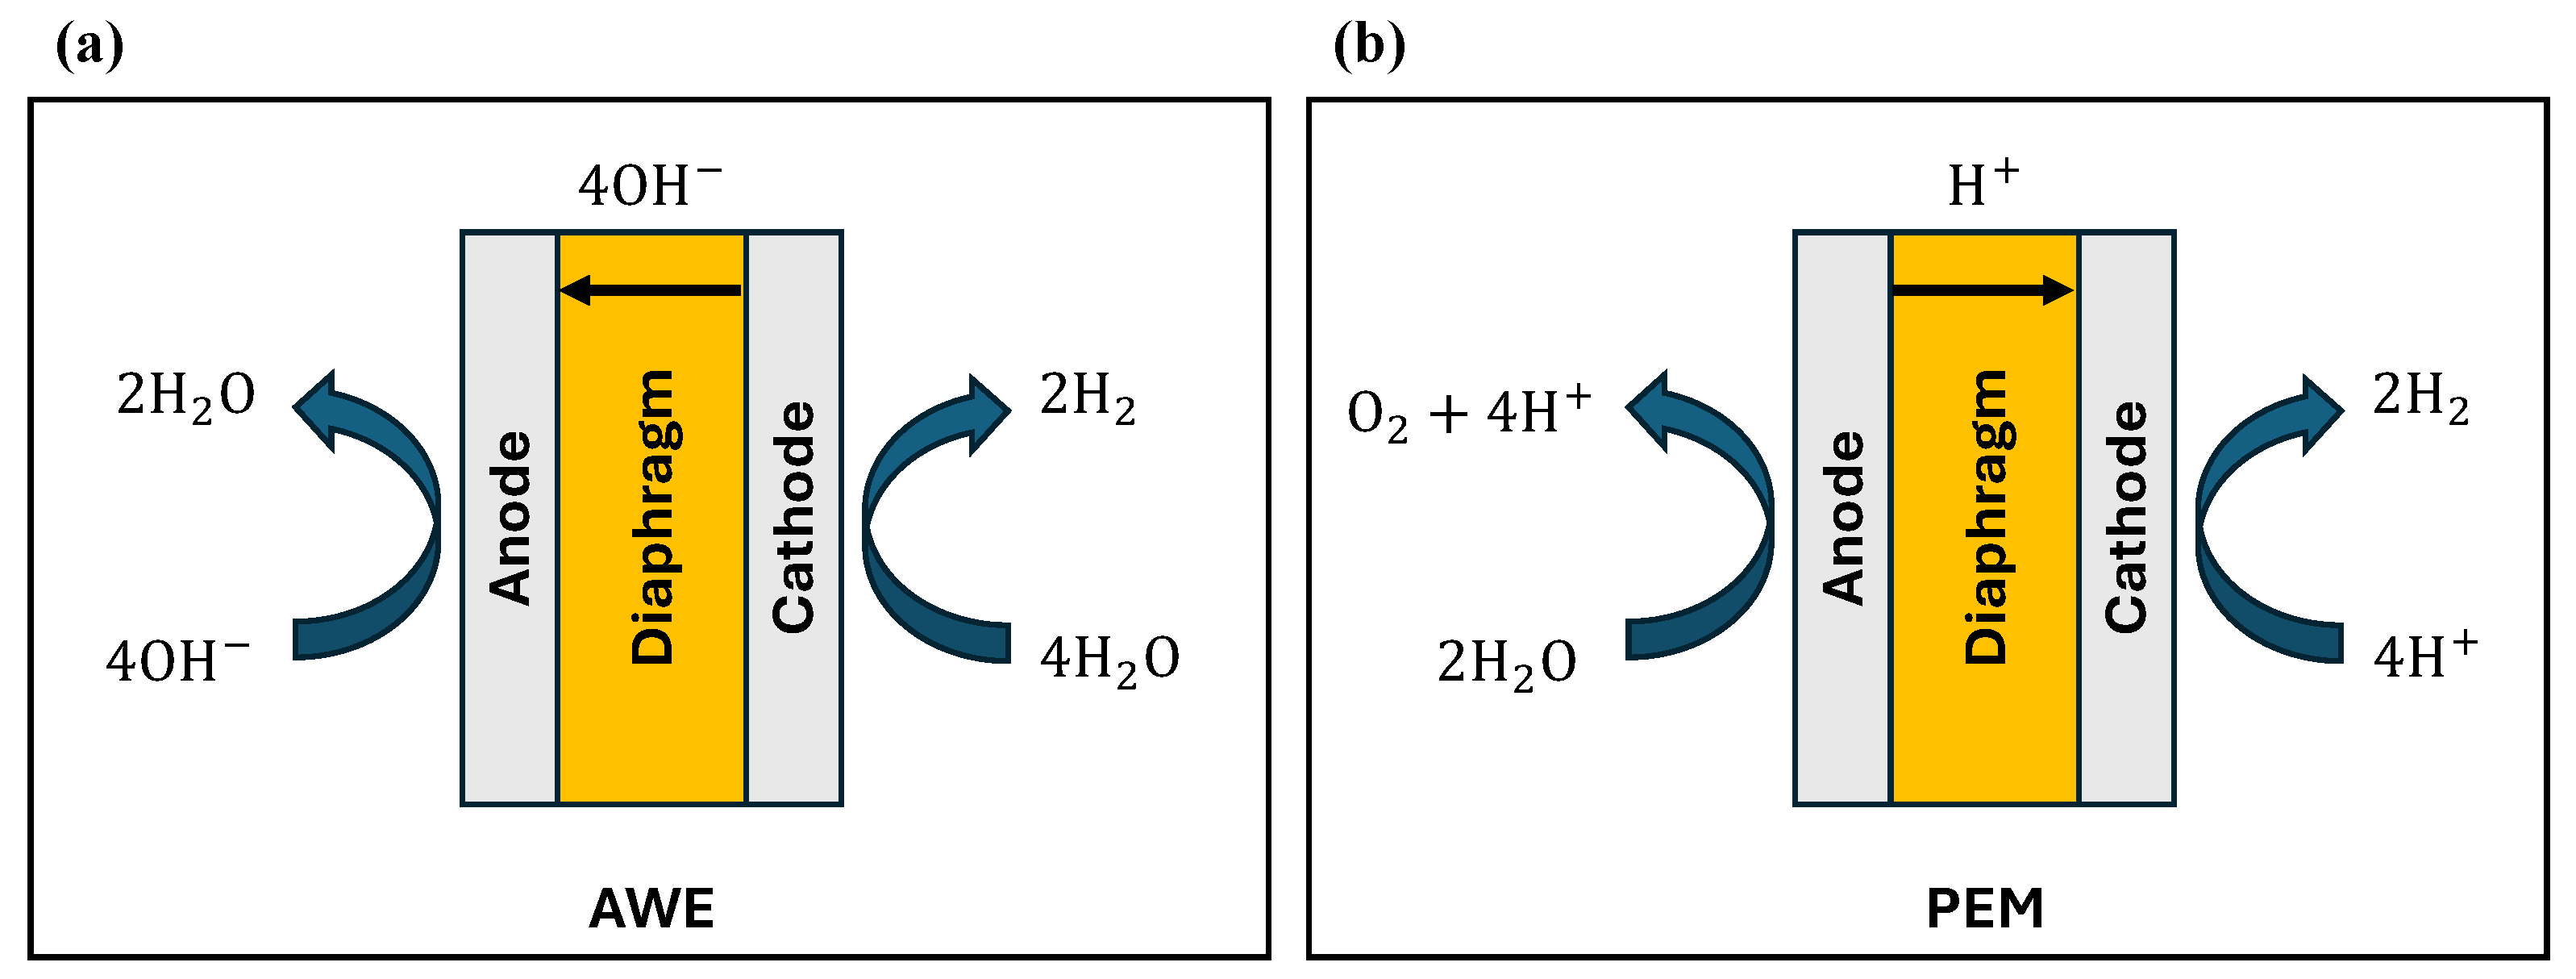
Green hydrogen is produced through electrolysis, a process in which water is electrochemically split into and using electricity from renewable energy sources. The overall water electrolysis reaction is given by:
The reaction takes place in devices known as electrolyzers, which convert electrical energy into chemical energy stored in the form of hydrogen. Four main electrolyzer technologies exist, each based on distinct materials and operating principles: Alkaline Water Electrolysis (AWE), Proton-Exchange Membrane (PEM), Anion-Exchange Membrane (AEM), and Solid Oxide Electrolyzer Cells (SOECs) [5]. In AWE, the half-cell reactions are as follows [6]:
In PEM electrolyzers, the half-cell reactions are as follows [6]:
Chile is positioning itself as a key actor in clean energy production. Its favorable geography and climatic conditions provide exceptional potential for renewable energy generation, particularly through solar and wind resources [7,8]. These advantages highlight Chile’s capacity to emerge as a strategic hub for developing non-conventional renewable energy (NCRE) industries and as a future exporter of green energy. Based on these strengths, Chile launched its National Green Hydrogen Strategy [9], with the objective of reaching a capacity of 5 GW of green hydrogen via electrolysis by 2030, with a cost of 1.5 USD/kg, positioning the country as the world’s lowest-cost producer.
Several studies have investigated Chile’s potential for green hydrogen production from diverse perspectives, including techno-economic feasibility across several locations in Chile and Argentina [10]; exportation to international markets such as Japan, Europe, and other countries [11,12]; autonomous off-grid production systems [13]; and economic analysis via optimization models [14]. Additional research has examined green hydrogen’s integration into key sectors like port operations [15], the national energy matrix for long-term decarbonization [16,17], and mining operations [18,19]. Other works have evaluated the feasibility of mobile pilot plants in the Antofagasta region [20], environmental implications via emissions analysis compared to conventional processes [21], methodological proposal for potential land utilization [22,23], and a review in which advances and perspectives on production projects in the Magallanes region are examined [24]. While these studies offer valuable insights into feasibility, cost, and integration pathways, comparatively less attention has been paid to the current commercial availability of electrolyzers and its implications for implementing large-scale green hydrogen projects in Chile. To the best of our knowledge, this specific dimension has not yet been systematically addressed.
A useful metric to evaluate the economic viability of hydrogen production is the Levelized Cost of Hydrogen (LCOH), which represents the cost of producing 1 kg of under specified conditions over the entire lifetime of a production project, accounting for both capital expenditure (CAPEX) and operating expenditure (OPEX). By condensing these factors into a single cost metric, the LCOH facilitates comparison across different hydrogen production pathways [25,26].
The aim of this work is to evaluate the current availability of commercial-scale electrolyzers to produce green hydrogen in Chile, considering the renewable energy potential across different geographical regions of the country. A techno-economic analysis was conducted to estimate the LCOH for each implementation scenario, providing insights into the feasibility of large-scale hydrogen production.
This study highlights the high availability of resources and their suitability to produce clean energy, thereby enhancing the diversification and resilience of the national energy matrix. The results demonstrate the potential to integrate green hydrogen into high-demand sectors such as mining and transportation, promoting national development at multiple levels. Furthermore, the findings suggest that Chile has the capacity to position itself as an international leader in green hydrogen production, creating favorable conditions for large-scale export and reinforcing its role in the global energy transition.
2. Methodology
To evaluate the technical and economic use of green hydrogen adjusted to local conditions, this work is structured into four main stages: First, the current demand and potential of hydrogen in industrial applications are analyzed to identify relevant scenarios at the national level. Second, the technical aspects of green hydrogen production are addressed, including available electrolyzer technologies, their commercial availability, operational requirements, and the conditions necessary for integration with renewable energy sources. Third, a comparative economic analysis is developed for the technological alternatives considered, enabling an assessment of green hydrogen’s competitiveness relative to other energy sources. Finally, a feasibility analysis is conducted for the implementation of new projects across selected regions of Chile. Each one of these stages is described in detail in the following sections.
2.1. Market Outlook and Projects
This stage involves a systematic review of the national and international literature to characterize current hydrogen demand and the state of technological development. Based on this review, hydrogen production pathways are identified and characterized at a general level, providing the basis for the more detailed technical assessment in the following stage. This enables the formulation of a preliminary proposal based on the bibliographic evidence and adapted to the Chilean context.
2.2. Technical Analysis
This stage evaluates the technical criteria and classification of electrolyzer technologies, focusing on alkaline and PEM electrolyzers. Additionally, renewable energy resource assessment tools are used—focusing on solar and wind sources—to identify geographical locations with the potential to meet the projected hydrogen demand, and to evaluate the feasibility of green hydrogen production at each site.
2.3. Economic Analysis
Financial indicators (e.g., Net Present Value (NPV) and Internal Rate of Return (IRR)), together with the LCOH, are estimated to evaluate the economic feasibility of the technological alternatives considered. This analysis identifies the conditions under which the investment becomes attractive, considering the local context and its implications for competitiveness and scalability.
2.3.1. LCOH Estimation
To estimate the LCOH, a discounted cash-flow approach was used, which accounts for factors such as CAPEX, OPEX, project lifespan, electrolyzer conversion efficiency, the cost of electricity used (mainly renewable), and the applied discount rates. This integrated approach enables the calculation of an average hydrogen production cost per kilogram over the project lifecycle, facilitating comparisons between technologies and regions. The LCOH is defined as follows [27]:
where r is the discount rate, given by the weighted average cost of capital (WACC); t is the evaluation period; n is the total number of periods; and is the total hydrogen produced. The WACC represents the average rate expected to be paid for a project, considering the total cost from various financial sources, and is defined as follows:
where is the cost of equity, E is the equity, is the cost of debt, is the debt, and is the tax rate. Table 2 details the cost-of-capital components used to calculate the WACC.
Table 2.
Cost-of-capital components for WACC.
To estimate CAPEX, it is necessary to account for the EPC cost (Engineering, Procurement, and Construction) and the electrolyzer capacity () as follows:
On the other hand, OPEX includes electricity and water costs, Operation & Maintenance (O&M), and Warranty & Insurance (W&I). Table 3 shows the O&M and W&I values as a percentage of CAPEX, escalated annually.
Table 3.
OPEX factors based on CAPEX.
To estimate , it is necessary to quantify the electricity consumption per kilogram of () and the Total Electric Demand () as follows:
is given by
where is the lower heating value of hydrogen, with a value of 33.33 (kWh/kg ), while is the electrolyzer efficiency. The electrolyzer efficiency decreases linearly over time according to
where is the beginning-of-life electrolyzer efficiency (at ) and is the annual degradation rate; reported in the literature ranges from 0.25–1.5%/year for alkaline to 0.5–2.5%/year for PEM electrolyzers [28].
is estimated as follows:
where is the electrolyzer capacity factor.
2.3.2. Cash Flow
Building on the LCOH, which also serves as the assumed hydrogen sale price, a cash-flow analysis is developed to evaluate the project’s overall profitability. EBITDA is a financial indicator used to estimate profitability and is defined as the difference between total revenues () and the OPEX.
is calculated from and the hydrogen sale price, assumed to be equal to the LCOH.
Taxable income () is the amount of income that is subject to tax, after applying deductions and exemptions permitted by law.
where D is the depreciation, calculated using the straight-line method, consistent with Chilean tax regulations, to reflect the gradual loss of value due to wear and tear, age, or obsolescence.
The tax burden (Tax) is then calculated by applying the corporate tax rate to taxable income. In Chile, the tax rate is approximately 27%, and in this work it is considered to be constant over the evaluation period.
Net Cash Flow (NCF) is the difference between the cash inflows and outflows and considers the EBITDA, CAPEX, and tax at the period t evaluated.
Net Present Value (NPV) is a financial metric used to evaluate the profitability of an investment over its lifecycle in present-value terms.
where is the initial investment given to the project.
Internal Rate of Return (IRR) is the discount rate at which the NPV of all cash flows from an investment equals zero:
Finally, Minimum Acceptable Rate of Return (MARR) is the lowest rate of return expected from an investment or project to consider it worthwhile and consider the inflation and the risk rate (RR). This metric is defined as the point at which the investor does not lose their investment.
In the Chilean case, according to the National Statistics Institute, inflation accumulated over the last 12 months was 3.5% [29]; and the risk rate, according to the National Energy Board, is 7.03% [30], resulting in an MARR of 10.53%. To evaluate the feasibility of the project, the conditions and must be satisfied.
2.4. Final Evaluation
This stage integrates the technical and economic results into a comprehensive evaluation of the alternatives analyzed. A set of selection criteria, combining technical parameters and economic indicators, is applied to determine which alternative offers the best overall performance. This evaluation identifies the most viable option from a techno-economic perspective, accounting for differences between the systems considered and their implementation feasibility across the selected regions of Chile.
3. Results
3.1. Market Outlook and Projects
3.1.1. Overall Overview
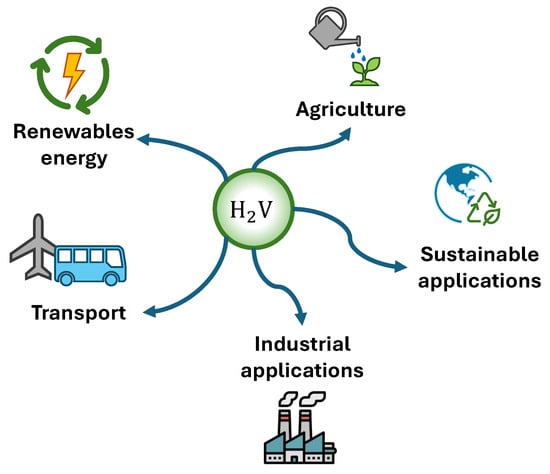
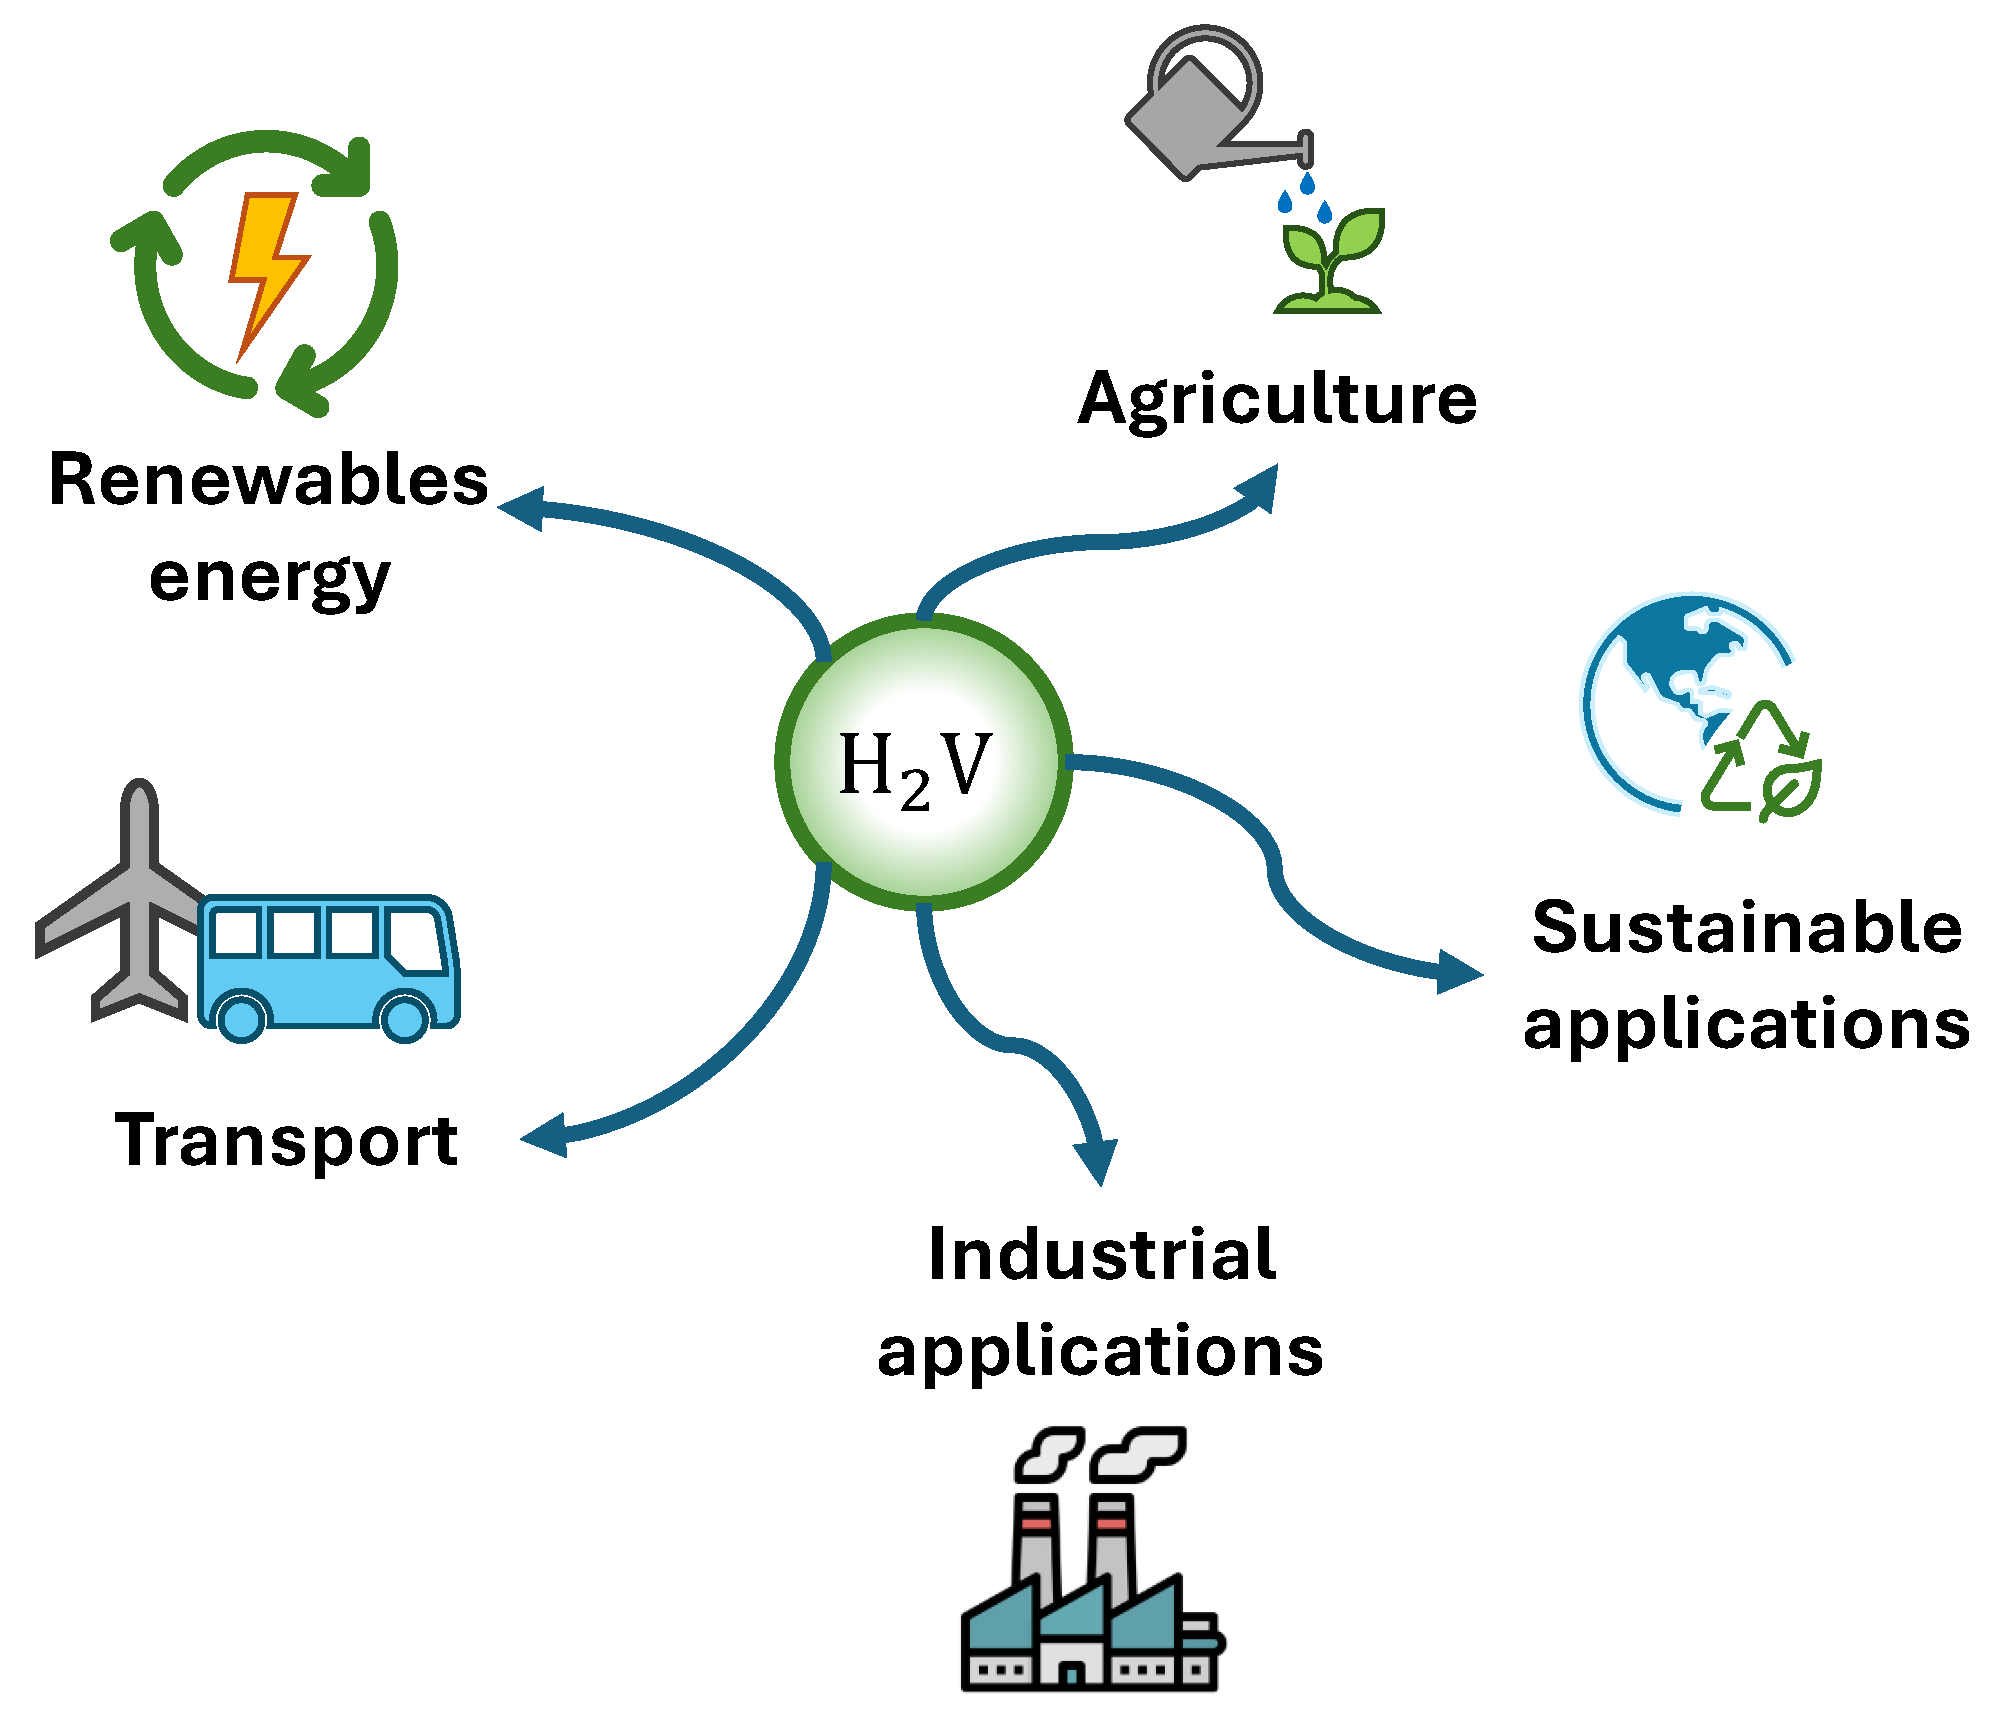
At the United Nations Climate Change Conference (COP26), celebrated in Glasgow in 2021, countries reaffirmed the Paris Agreement’s goal of limiting the global average temperature increase to 2 °C above pre-industrial levels and striving to not exceed 1.5 °C [31]. This increasing temperature has an energetic origin, as nearly 75% of greenhouse gas emissions correspond to the energy production and consumption sector [32], which is heavily dominated by fossil fuels. In this regard, green hydrogen is emerging as a key energy vector for the decarbonization of the global economy, with various opportunities for application in both energy generation and product manufacturing in sectors such as petrochemicals, chemicals, agriculture, transportation, and mining, among others (Figure 1) [33,34,35,36]. The green hydrogen market is still in an early supply-side commercial stage: project announcements have proliferated, but implementation continues to be constrained by financing and infrastructure limitations [3].
Figure 1.
Applications of green hydrogen.
On the other hand, projections point to a progressive expansion in demand [37]. Between 2030 and 2040, green hydrogen is expected to become sufficiently competitive with conventional fuels, enabling its incorporation into new markets such as residential heating and power generation [38]. In this context, commercial electrolyzers are the core enabling technology, with alkaline and PEM systems leading the market because they are the most mature and available at industrial scale [39,40].
China dominates global hydrogen use, with 30% of demand in 2025, more than four times Europe’s 7% share. This gap reflects legacy industrial hydrogen use (refining, chemicals, ammonia) more than the emerging green hydrogen build-out. Other significant players include the United States, the European Union, India, Japan, and South Korea [3]. In 2025, global installed electrolyzer capacity exceeded 4 GW, with alkaline systems accounting for most of the deployment and PEM systems representing a smaller share, while total capacity is projected to surpass 6 GW by 2026. In regional terms, the market is expected to shift from a China-led base in 2025 toward a more balanced distribution in 2026, as Europe continues to expand its installed capacity [3].
Production costs vary widely, depending mainly on electricity prices, electrolyzer installation costs, and project development costs [41,42], and can range from about USD 3/kg H2 to USD 10/kg H2 [39,43]. According to the IEA [3], by 2030, regions such as Australia, the Middle East, India, and Chile could achieve production costs of just above USD 3/kg H2 or below USD 4/kg H2, supported by their strong renewable resource potential.
The largest green hydrogen production project currently under construction is the NEOM green hydrogen Project in Saudi Arabia, which is designed for about 4 GW and has reportedly reached 90% overall construction completion. It is expected to produce up to 600 tonnes of hydrogen per day [44]. In Europe, several other large green hydrogen projects are also under construction, including Stegra in Sweden at 740 MW, Holland Hydrogen in the Netherlands at 200 MW, ELYgator in the Netherlands at 200 MW, Normand’Hy in France at 200 MW, and UpHy Large in Belgium at 140 MW [45].
3.1.2. Latin American Context
Latin America is emerging as a strategically important region for green hydrogen, combining abundant renewable resources, industrial decarbonization needs, and port access for export—though most activity remains at the project-announcement and pre-feasibility stage. Chile leads the region, combining policy ambition, renewable quality, and large-scale project development; Brazil is advancing industrial and port-based hydrogen hubs; Colombia is positioning coastal areas for export; and Argentina, Uruguay, and Mexico show more differentiated, cluster- or pilot-scale potential. The most advanced operating examples remain pilot/demonstration-scale—Hychico (Argentina), Ad Astra (Costa Rica), and Cerro Pabellón (Chile)—while the largest projects in the future pipeline are concentrated in Chile and Brazil, in export-oriented hubs such as Magallanes and Pecém, where renewable generation, desalination, and port access can support large-scale electrolyzer deployment.
3.1.3. Chilean Advances
Chile has the most mature strategy, anchored by exceptional solar resources in the Atacama Desert and some of the world’s strongest, steadiest winds in the southern Magallanes region. The national green hydrogen strategy originally targeted 25 GW of installed electrolyzer capacity and USD 2.5 billion in annual exports by 2030, but actual deployment remains early-stage, with only about 3.9 GW in the implementation phase and no fully operational industrial-scale plants yet. Table 4, Table 5 and Table 6 present a comparison of the regional heterogeneity of Chile’s green hydrogen potential.
Table 4.
Green hydrogen landscape: north region (Antofagasta).
Table 5.
Green hydrogen landscape: central region (Bio-Bío).
Table 6.
Green hydrogen landscape: south region (Magallanes).
On the other hand, Chile has the most visible large-scale projects under development. Total Energies H2 Magallanes, the country’s largest submitted green hydrogen/ammonia initiative, plans 10 GW of wind power, a phased electrolyzer build-out starting at 1 GW, hydrogen output above 800,000 tonnes/year, and exports to Asia and Europe by around 2030. Other notable projects include the 26 MW HyEx pilot in Tocopilla (mining and industrial use), the 10 MW Quintero Bay project, and the 1.25 MW Haru Oni e-fuels facility in Patagonia. Potential customers span mining, fertilizer, fuel distribution, port operations, logistics, and industrial decarbonization. As of December 2025, 83 green hydrogen projects had been announced nationally, of which only 17 were operational (mostly pilot-scale), distributed across the north (31), central (29), and south (23) [46]. Rapid market growth is expected, driven by decarbonization policy, incentives, and falling renewable energy costs [47]. As shown in Table 7, Chile’s renewable potential is led by solar PV (1180 GW, reflecting the Atacama Desert’s world-class irradiation) and on-shore wind (191 GW, concentrated in Patagonia, where plant factors routinely exceed 50–55%).
Table 7.
Renewable energy potential in Chile by energy type [9].
3.2. Selection Criteria
3.2.1. Electrolyzer Technology Selection
Electrolyzers are electrochemical devices that enable the production of green hydrogen and oxygen from water, using electricity as the energy source [48]. These devices are structured as cells with two electrodes separated by a membrane. In addition to the cells, electrolyzer systems include auxiliary components known as the Balance of Plant (BOP), such as pumps, coolers, and control systems, among others. From a plant-design perspective, individual cells can be connected in series or in parallel to increase the nominal power. However, this strategy has a disadvantage in that, as more cells are added, the BOP auxiliary systems must be scaled, which increases operational and maintenance costs.
Water electrolysis for green hydrogen production can currently be achieved through four main technologies—Alkaline Water Electrolysis (AWE), Proton Exchange-Membrane (PEM), Anion-Exchange Membrane (AEM), and Solid Oxide Electrolyzer Cells (SOECs)—each differing in electrolyte type, operating temperature, efficiency, capital cost, and compatibility with intermittent renewable power [49]. AWE is the most mature and widely deployed technology, offering the lowest capital cost, although it is best suited to steady-state operation due to its sensitivity to load variability. PEM systems, by contrast, offer faster dynamic response and higher-purity hydrogen output, making them well suited for direct coupling with variable renewable sources such as solar and wind, but at a higher capital cost driven by platinum- and iridium-based catalysts. SOEC technology achieves the highest theoretical efficiency by operating at high temperatures and can leverage waste heat from industrial processes, but its durability remains limited by thermal cycling and material degradation, keeping it largely at the pilot stage. AEM technology aims to combine PEM-like hydrogen purity with alkaline-like material costs using non-precious-metal catalysts, but it remains at an earlier stage of technological maturity, with ongoing challenges related to membrane durability and scale-up [39,40,43].
Building on this comparison, AWE and PEM systems were selected for this analysis, as they represent the most commercially mature and widely deployed options at the industrial scale, in contrast to AEM and SOEC technologies, which remain at earlier stages of commercial development. Figure 2 presents schematic diagrams of the two electrolyzer technologies considered in this study.
Figure 2.
Schematic diagram for (a) AWE and (b) PEM electrolyzers.
Within these two technologies, the HySTAT (alkaline) and HyLYZER (PEM) product lines from Cummins were considered [50]. Cummins has demonstrated experience in MW-scale plants. For instance, in Falkenhagen, Germany, Cummins provides six stacks of the HySTAT 60-10 model for an electrolysis plant with a nominal power of 1.8 MW, which allows for using the energy excess of wind energy for green hydrogen production [51]. In Becancour, Canada, a series of four HyLYZER 1000-30 units was considered, with a green hydrogen production capacity of /h [52]. Table 8 shows a comparison between HySTAT and HyLYZER electrolyzers. To enable a direct comparison between the two electrolyzer technologies evaluated in this study, the alkaline (AEM) and PEM electrolyzers were matched on an equal total installed-capacity basis of 5 MW. Given that the reference commercial AEM unit has a nominal capacity of 0.5 MW, the AEM configuration was considered as an array of ten (10) such units operating in parallel, aggregating to 5 MW, matching the nominal capacity of the single reference PEM unit (5 MW).
Table 8.
Electrolyzer characteristics and assumptions used in the LCOH estimation.
3.2.2. Regions Selection
For the purposes of this analysis, Chile’s sixteen administrative regions are grouped into three representative macro-zones (north, central, and south), following common usage in the national green-hydrogen literature and policy documents [9]. Antofagasta, Bio-Bio, and Magallanes were selected as the representative regions for each macro-zone based on their contrasting renewable resource profiles.
The growing interest in decarbonization at the global level has put the focus on green hydrogen, but to be considered green, the electric energy must come from a non-conventional and renewable source (NCRE). The potential of NCRE resources, such as solar and wind energy, continues to grow, attracting investment and leading to cost reduction in the future due to their increasing offer. In Chile, the Ministry of Energy offers online tools called Solar Explorator and Wind Explorator, which map the country’s renewable energy potential. These platforms display radiation properties for the solar case and wind velocity for the wind case. These tools utilize historical information from several monitoring stations and their own studies, allowing for the analysis of the behavior and availability of these resources over time. This information forms the basis for identifying regions with favorable conditions for large-scale green hydrogen production.
Sources of Renewable Energy
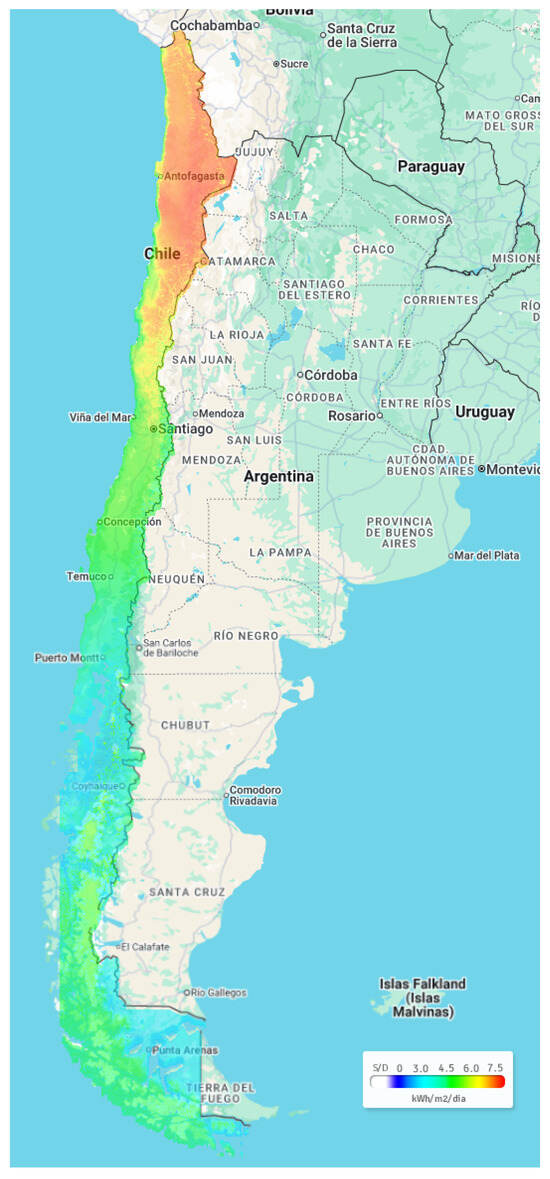
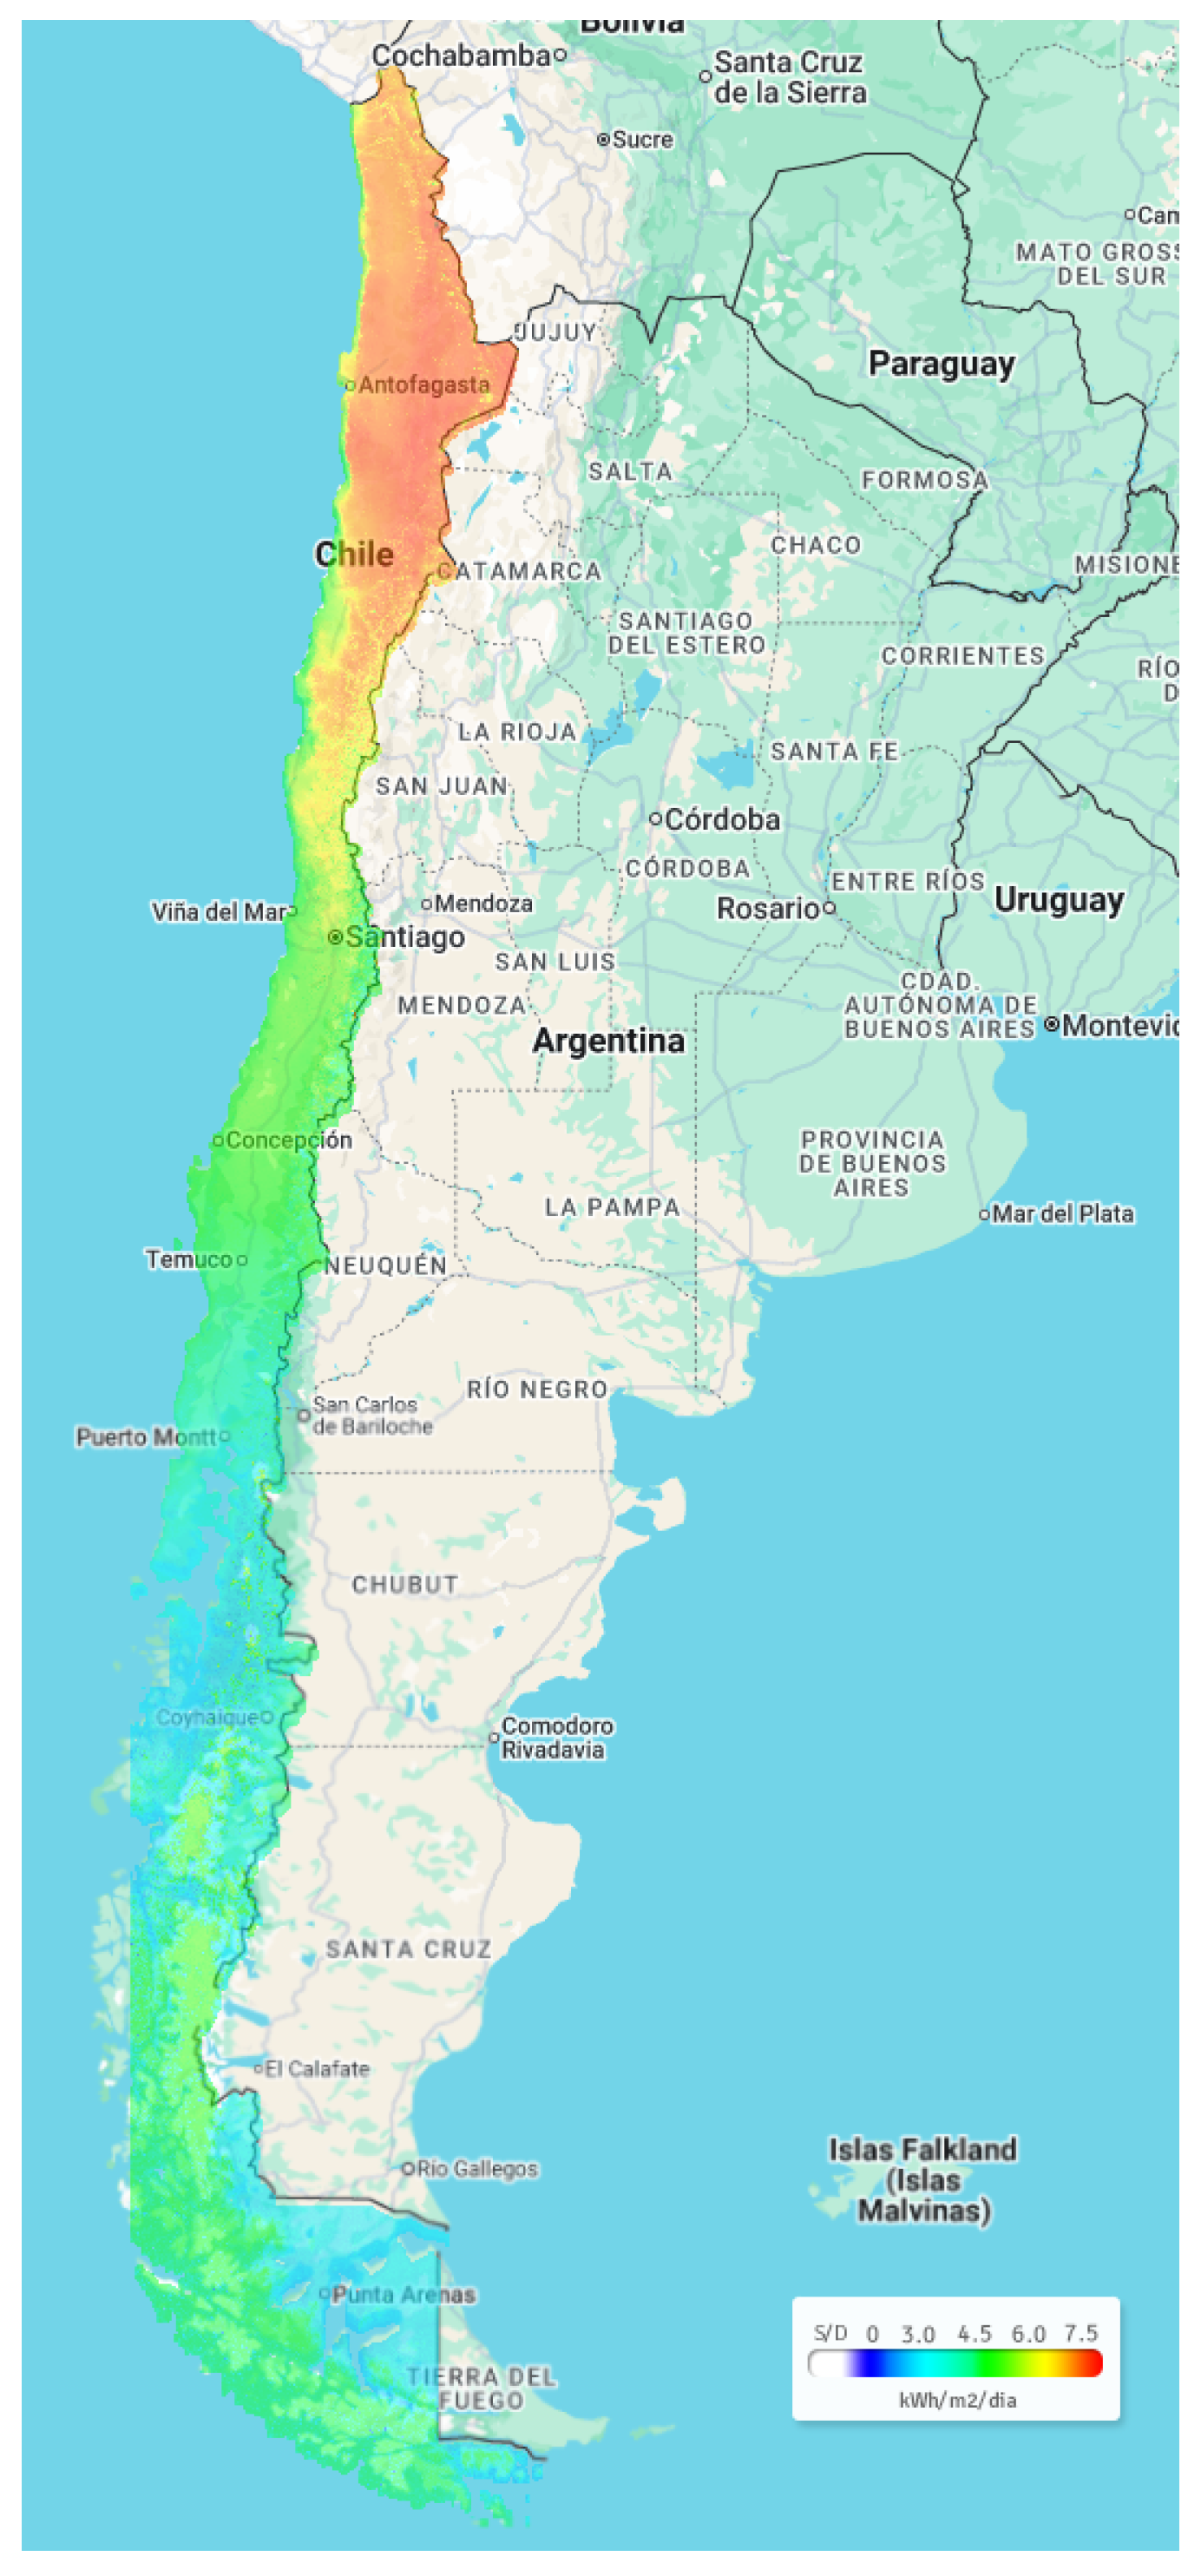
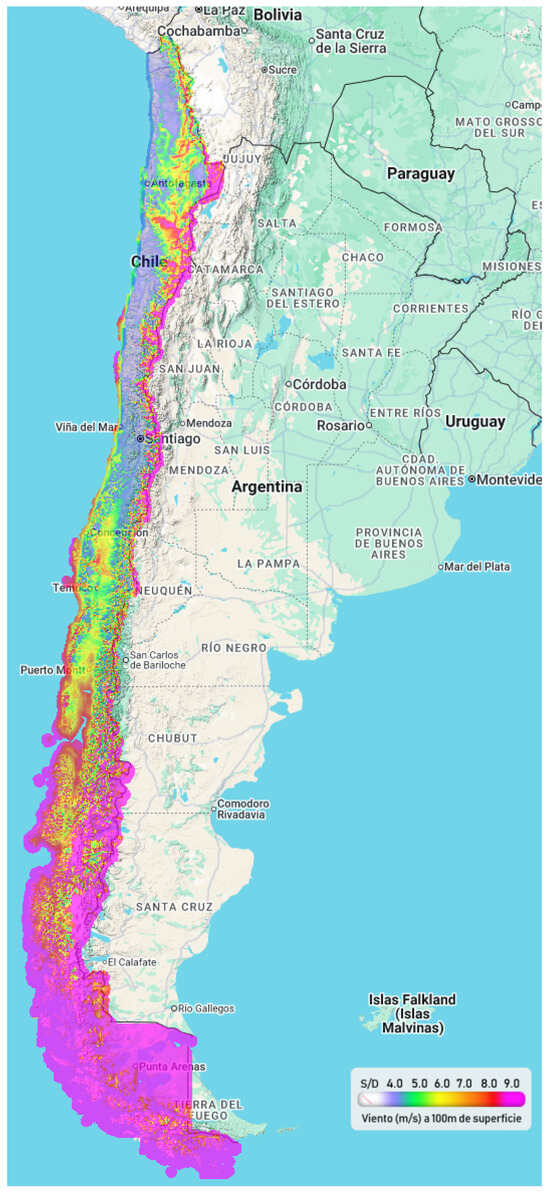
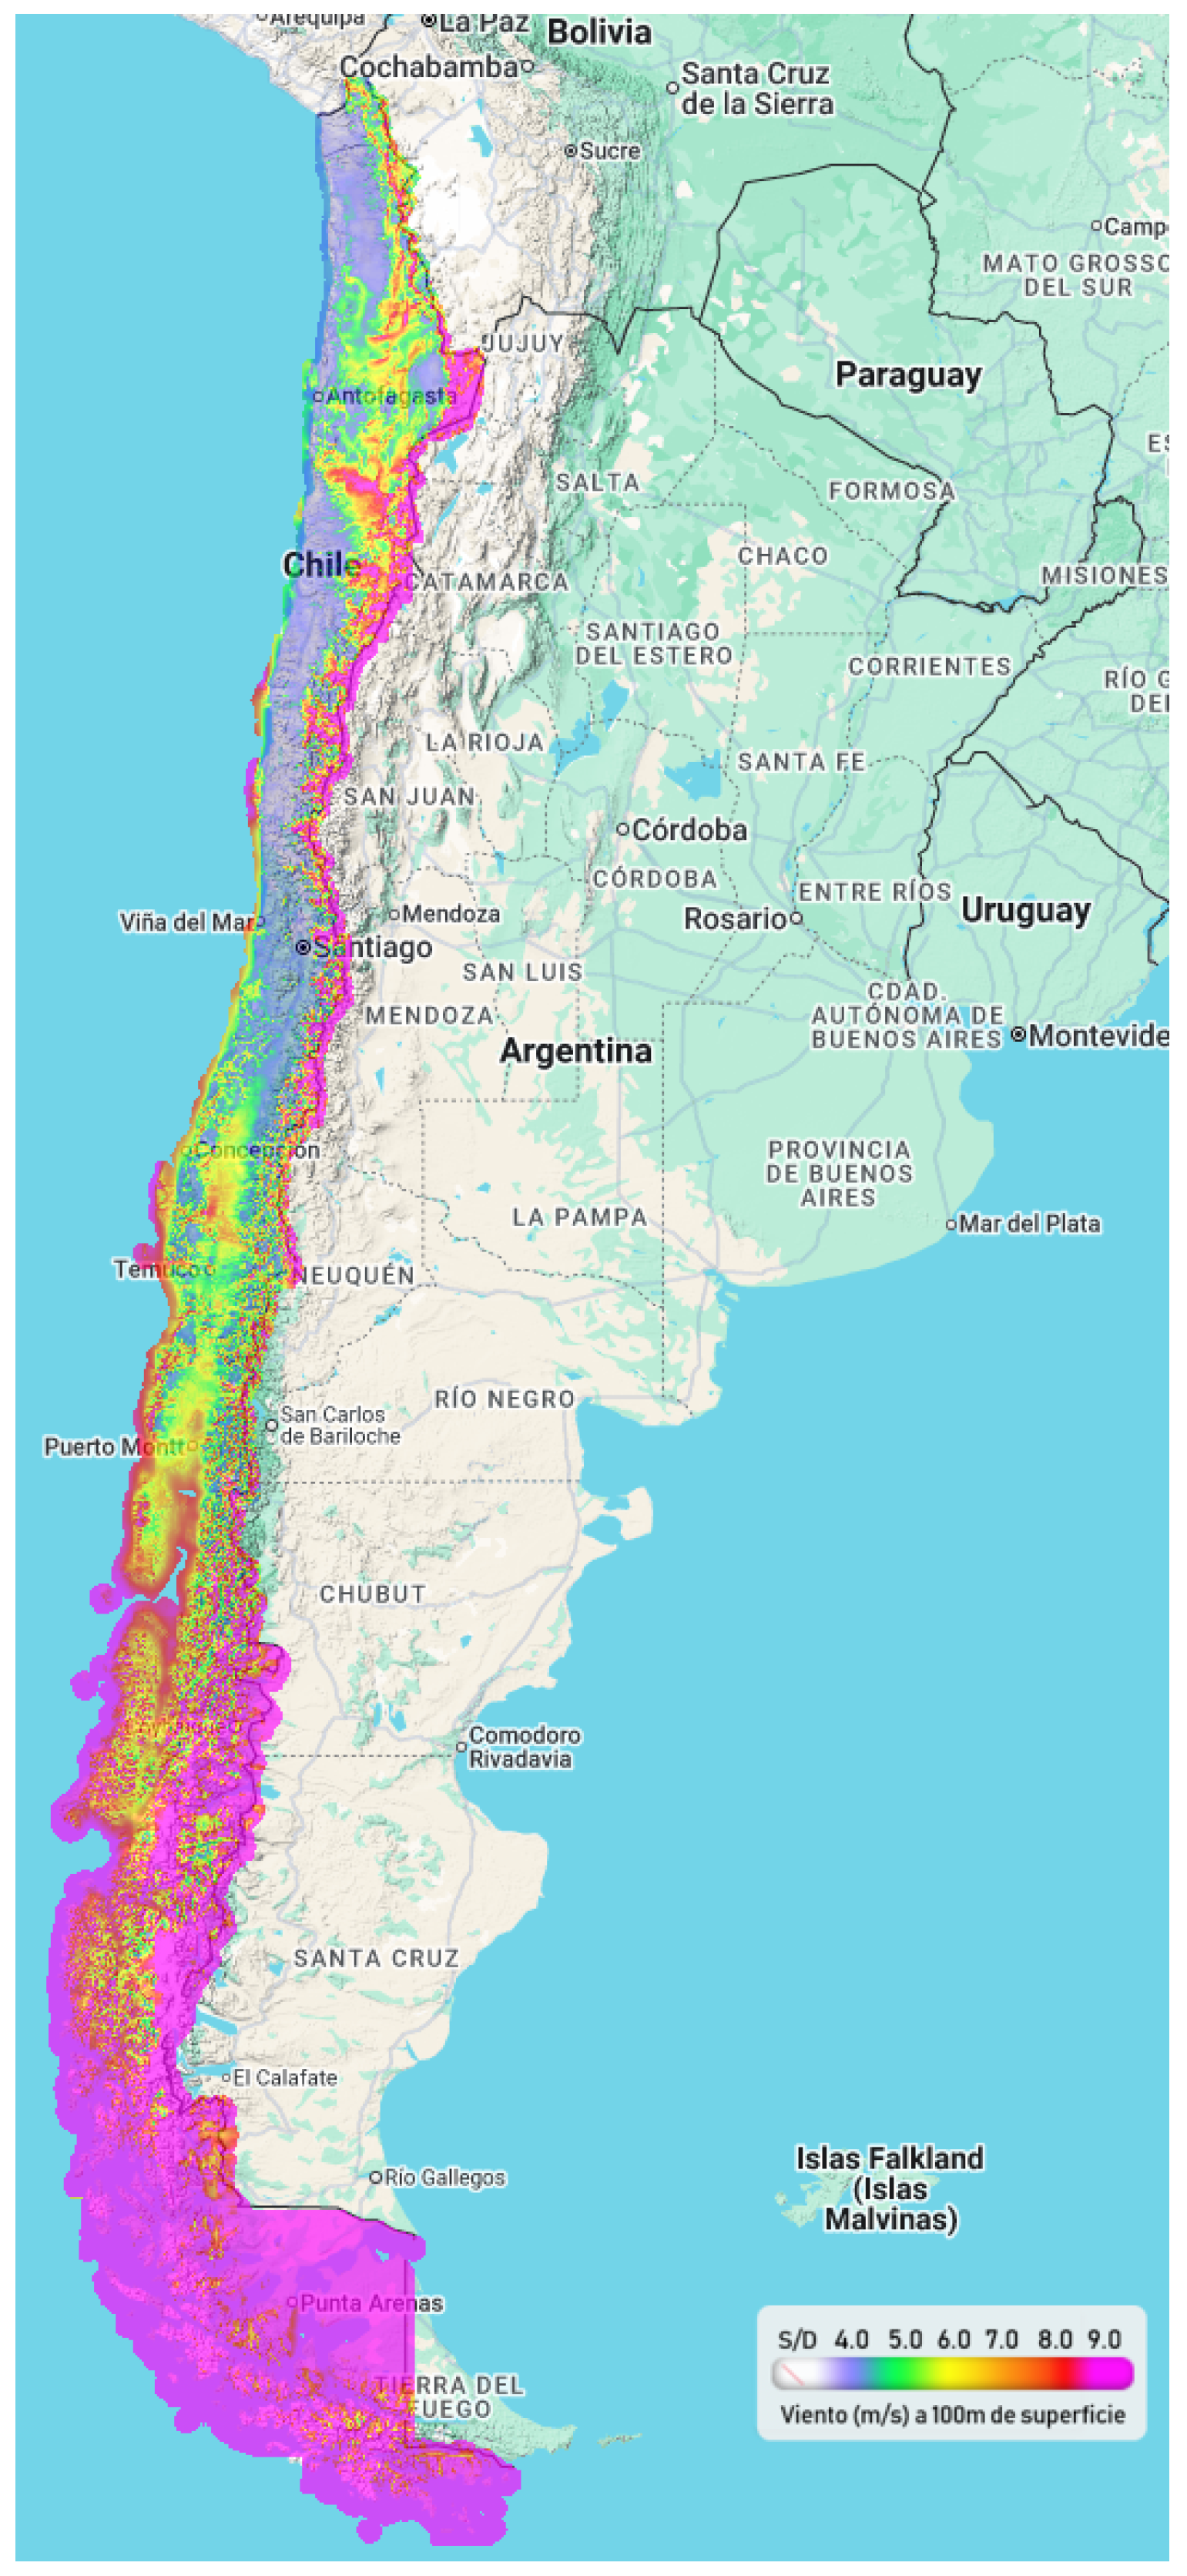
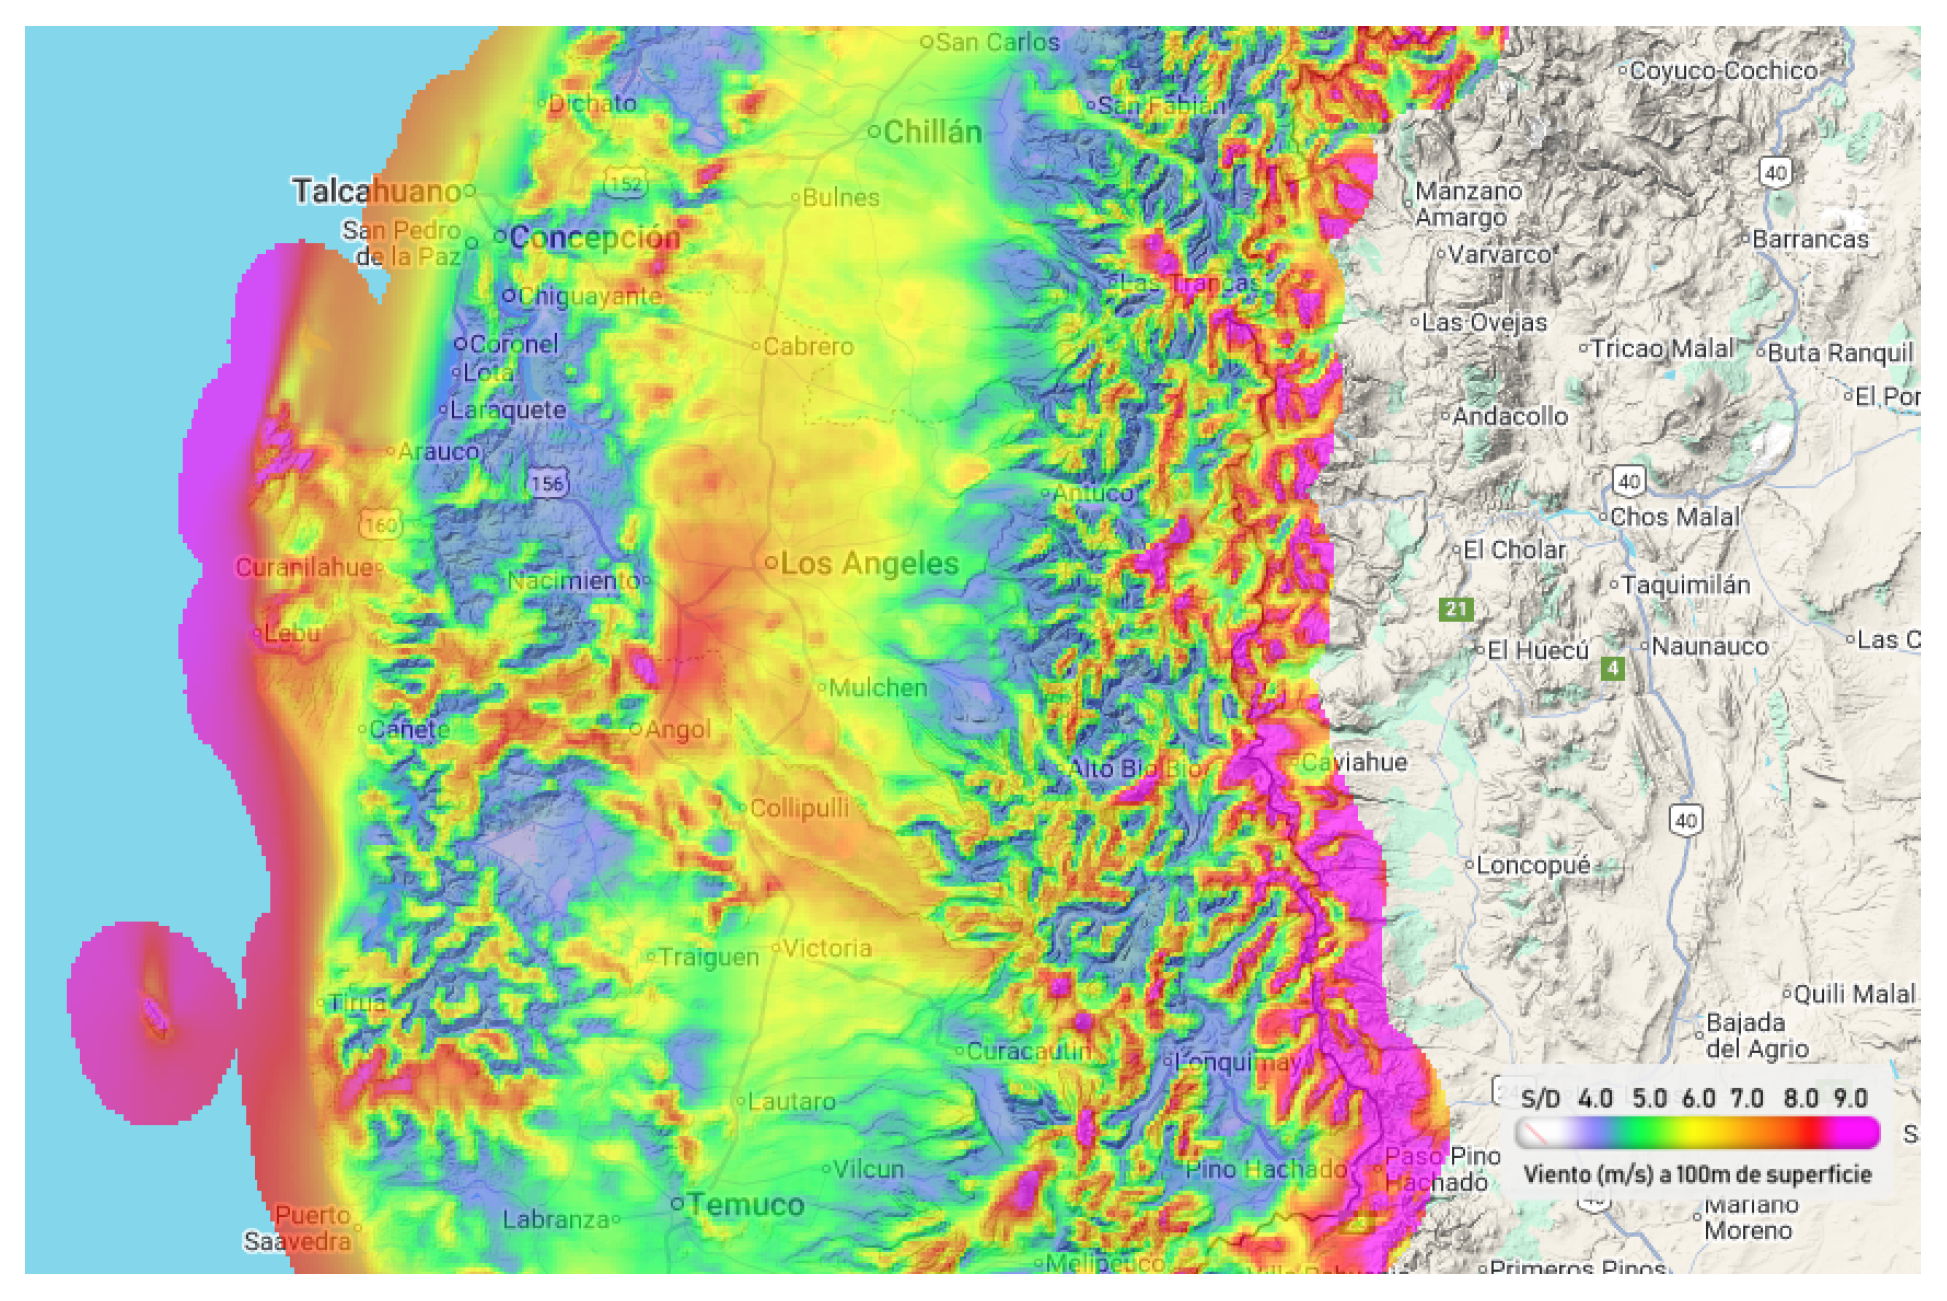
The diversity of Chile’s renewable resources and its distinctive geography present an exceptional opportunity for local electric energy production through NCRE. Figure 3 and Figure 4 show the solar and wind energy availability across the country. In the north zone, specifically the Antofagasta region, solar energy is the predominant resource, reaching an average annual radiation of /day. This condition is supported by its vast desert regions, particularly the Atacama Desert, known as one of the sunniest places on Earth, which provides an exceptional foundation for photovoltaic and concentrated solar power projects. Furthermore, minimal cloud cover and low humidity further enhance operational efficiency and energy yield, making the Antofagasta region a crucial location for solar energy production within Chile’s renewable energy matrix.
Figure 3.
Solar energy resources in Chile.
Figure 4.
Wind energy resources in Chile.
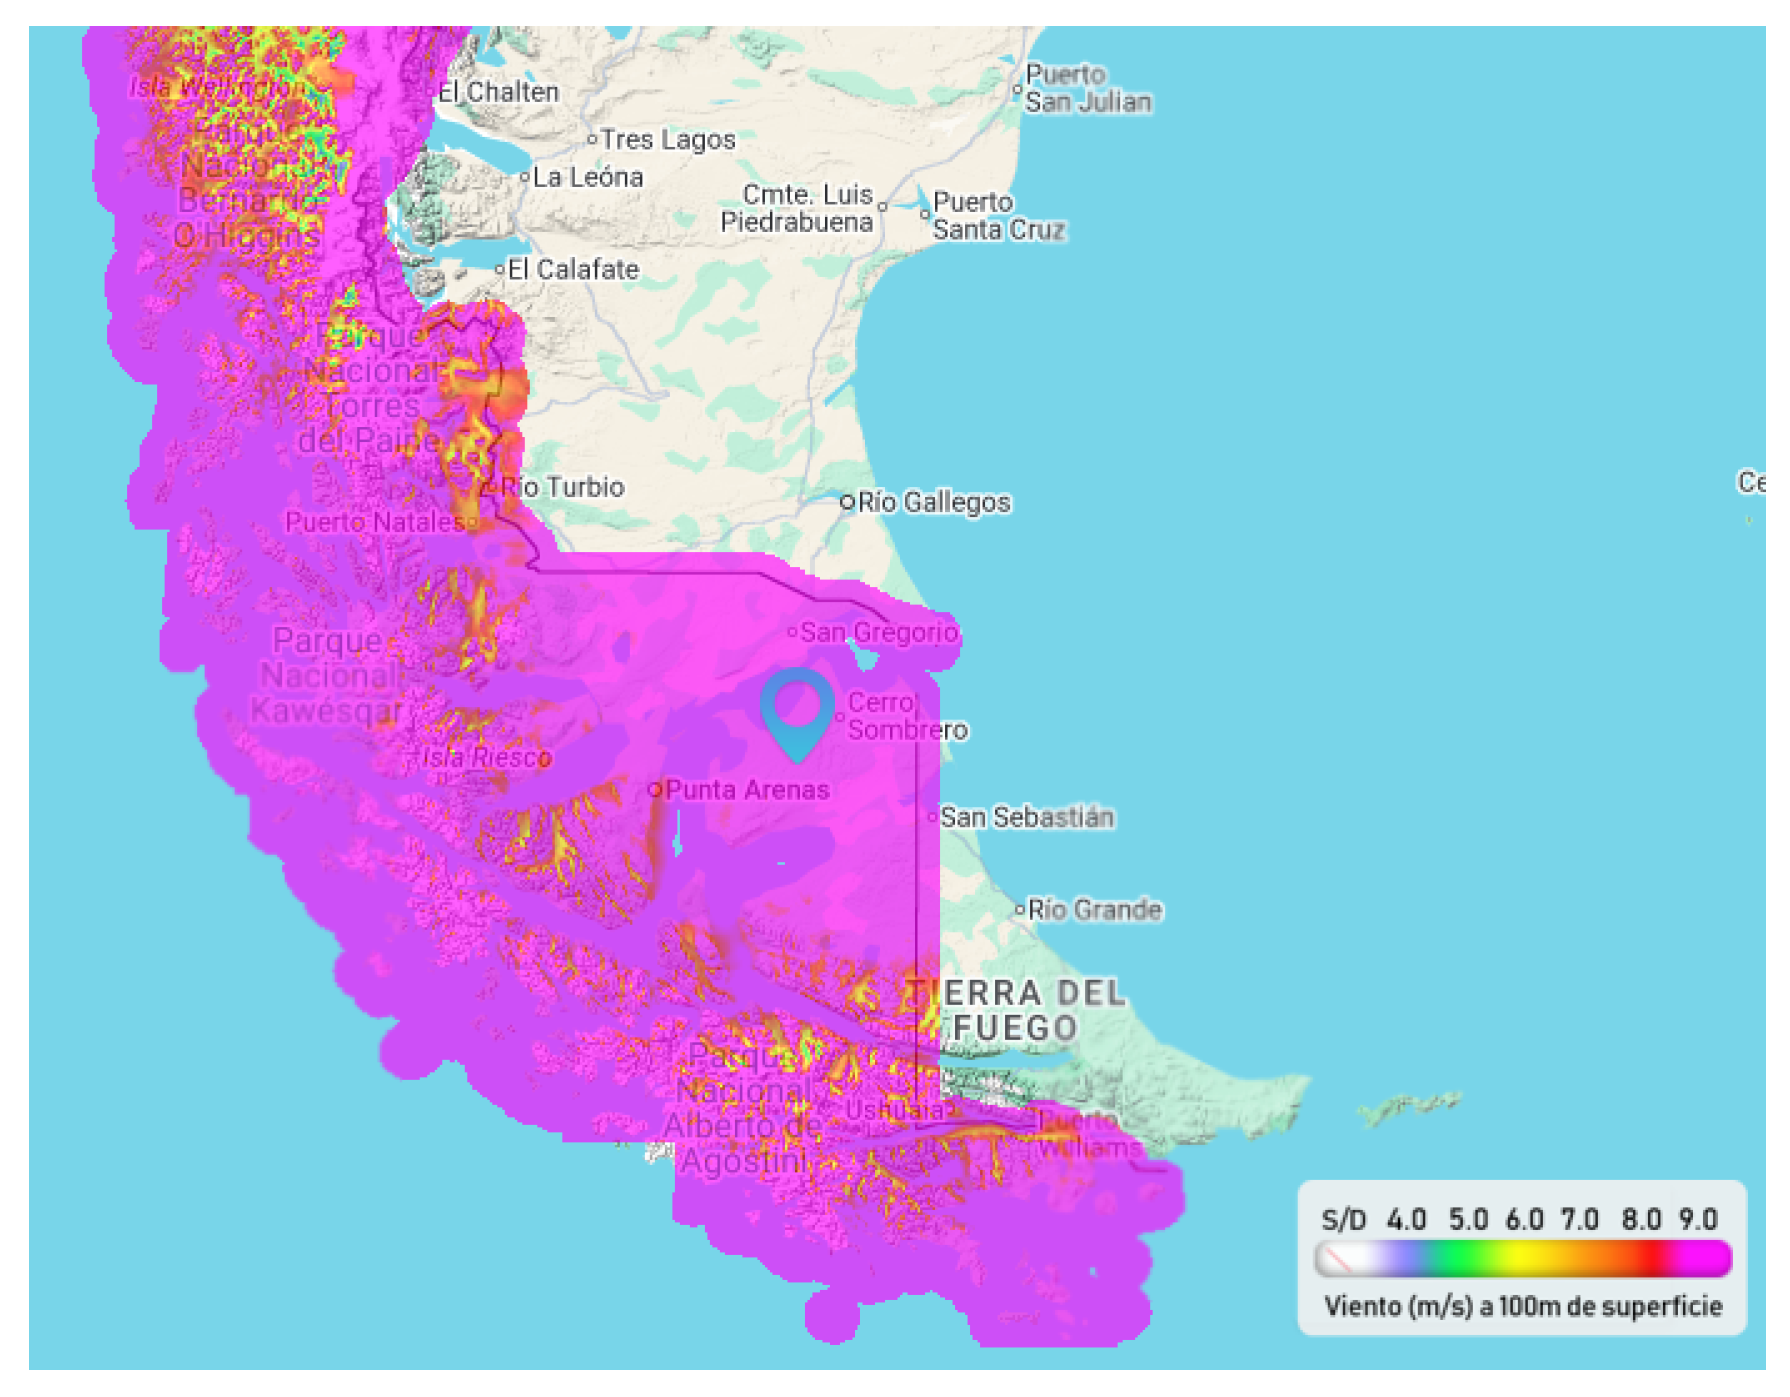
In contrast, the Magallanes region in the south zone is characterized by wind predominance, reaching wind velocities of approximately 10 m/s. These exceptional wind conditions provide a robust and consistent energy source, making the region well suited for large-scale wind power projects. This energy source complements the renewable portfolio, enabling a diversified supply.
Meanwhile, the central zone—mainly the Bio-Bio region—does not present a clear predominance of either solar or wind resources, requiring detailed evaluation of both to determine optimal project design. Despite this, the region presents a dual opportunity for hybrid renewable projects that can maximize resource complementarity and enhance grid stability.
According to Acera [58], as of September 2025, the electric power generation from NCRE sources in Chile reached 45.5%, showing an increase of 4.7% compared to the same period in 2024, which continues to rise due to favorable policies, technological advancements, and infrastructure investments. It is essential to emphasize that the most significant challenges in electric generation are concentrated in the extreme north and south of the country, posing challenges in terms of supply and distribution, given that the highest energy demand is in the central region.
North Zone
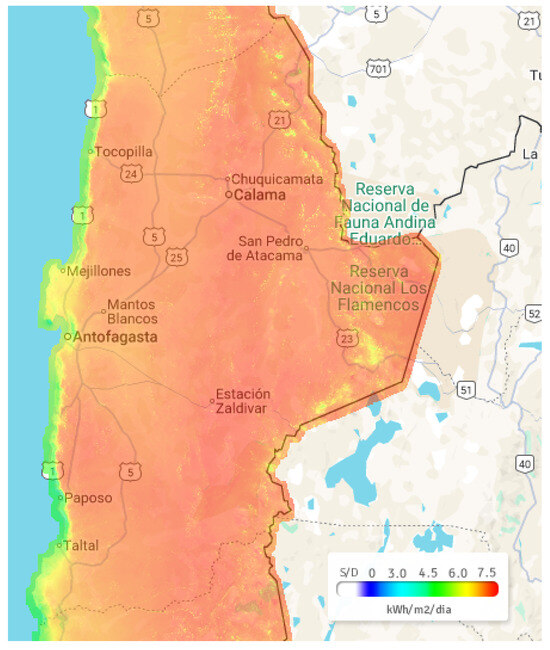
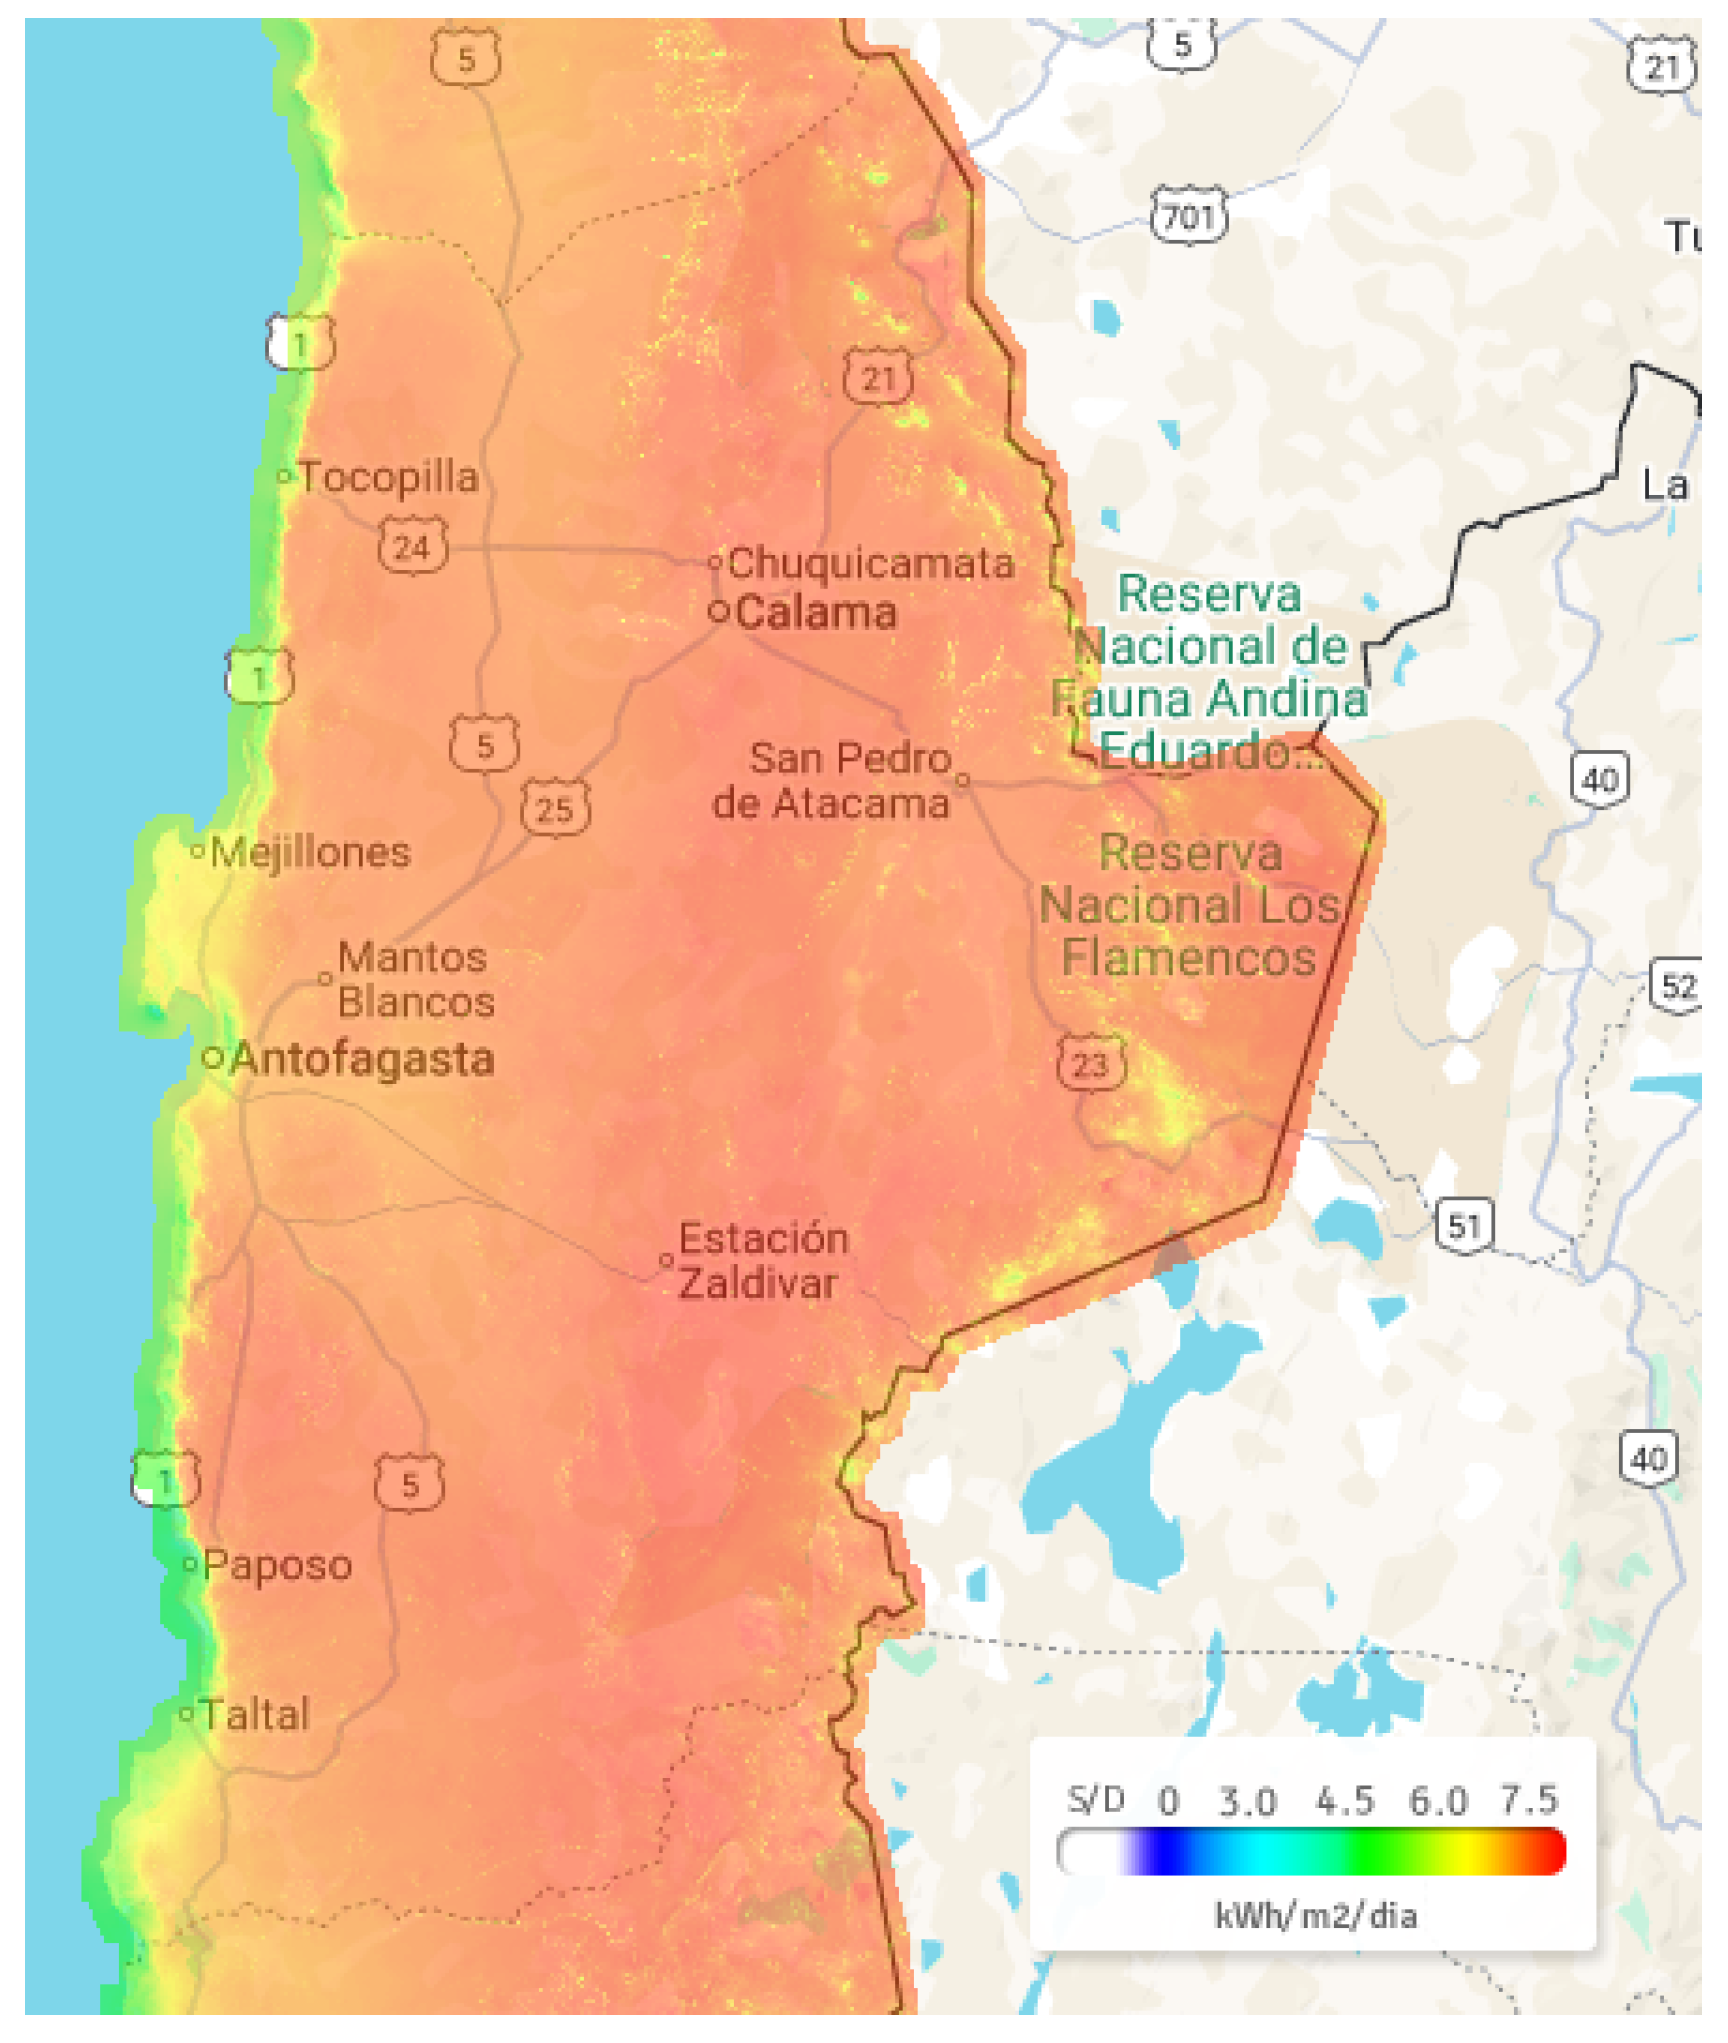
In the north zone of Chile, solar energy is the primary source of electric energy generation. This region, and particularly the Atacama Desert, presents the highest radiation levels in the world, representing an optimal condition for the operation of photovoltaic systems that favor a stable power output throughout the year. This exceptional irradiation is further reinforced by the desert’s high altitude, minimal cloud cover, and low atmospheric humidity, which together reduce energy losses and enhance the operational efficiency of solar installations [59]. Figure 5 shows the distribution of the average solar availability in the Antofagasta region, evidencing high solar potential in almost all of its geographical extension. In most of the territory, solar radiation exceeds /day, positioning the region as one of the greatest solar source zones at the global level.
Figure 5.
Solar resources in the Antofagasta region.
Central Zone
In the central zone, from a general perspective, no clear predominance is observed for either solar or wind resources; therefore, it is essential to conduct an integrated evaluation of both to determine their potential and optimize energy use.
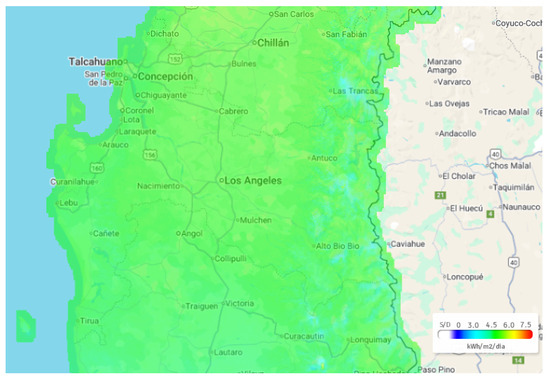
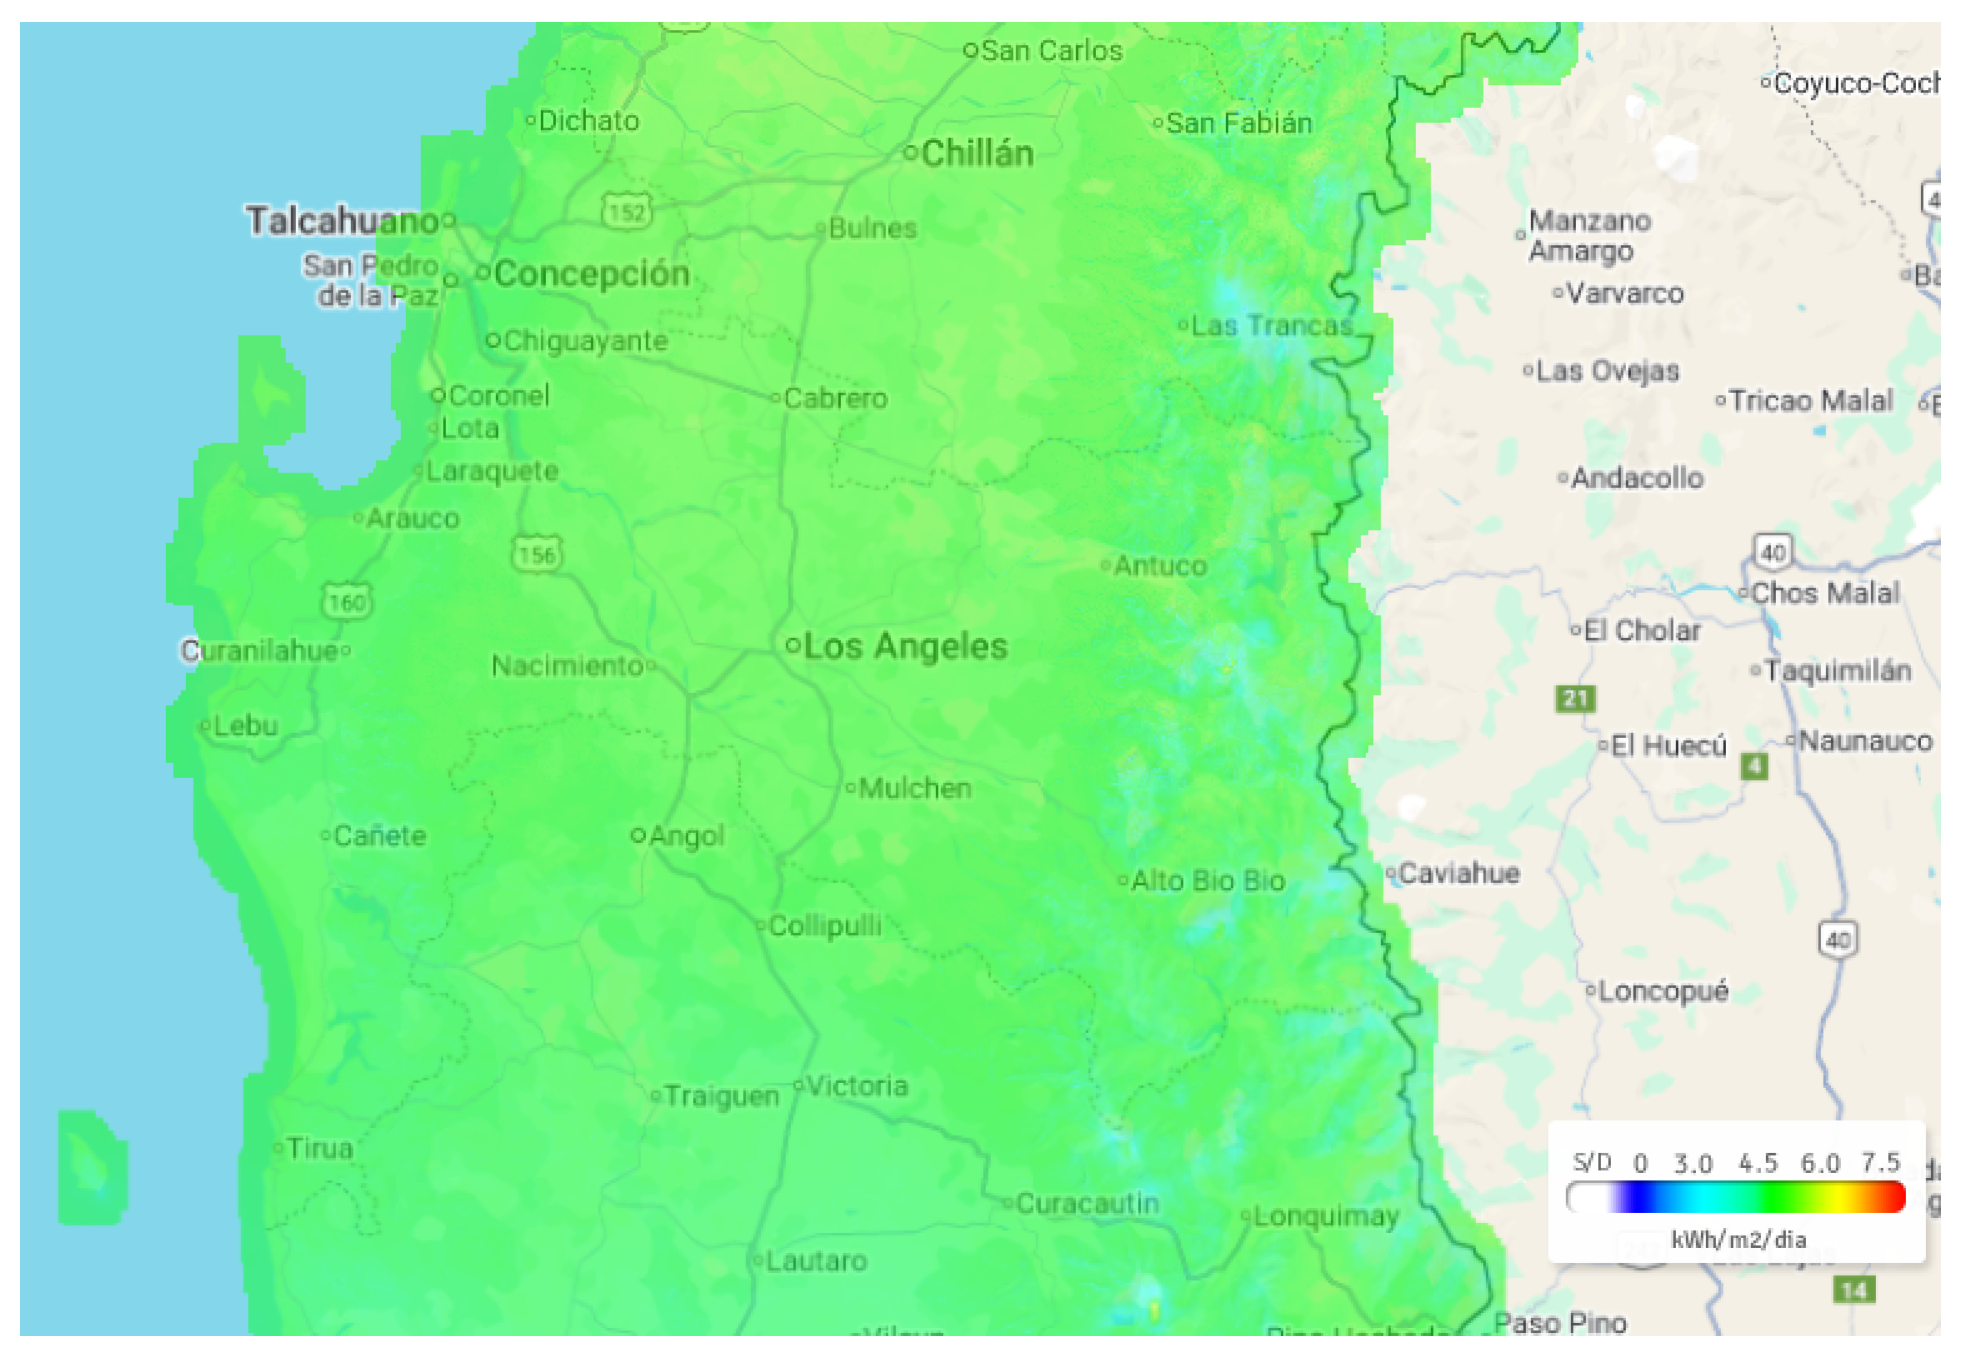
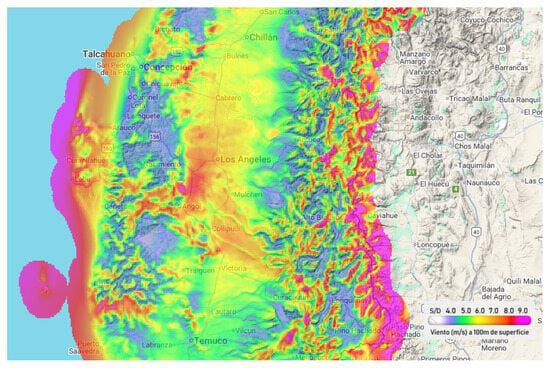
Figure 6 shows the spatial distribution of the solar radiation and wind velocity availability in the Bio-Bio region. As observed in Figure 6, the average solar radiation is close to /day. Although this is lower than in the north zone, it remains a significant resource that can complement on-shore wind generation.
Figure 6.
Solar resources in the Bio-Bio region.
Figure 7 shows the wind velocity in the region. Wind speeds in the coastal areas of Bio-Bio are generally significant near the coast, exceeding 7.0 m/s. By contrast, wind intensity decreases toward the interior, due to the presence of mountainous deviations that generate turbulence and discontinuities. Thus, the zones near the coast present the most favorable conditions for efficiently utilizing wind resources.
Figure 7.
Wind resources in the Bio-Bio region.
This diurnal and spatial complementarity between solar and wind resources is particularly relevant for hybrid renewable systems, since solar generation typically peaks during midday hours, while coastal wind resources in this region often remain more stable into the afternoon and evening. In a hypothetical scenario of the installation of the electrolyzer in the zone, the electric supply could be mixed—solar in the day and wind in the night or in lower-radiation periods—which enables decreasing the sustained charge over the wind plant, reducing its daily charge, and potentially extending its operative lifetime. This complementarity between renewable resources allows for diversifying the regional energy matrix and increasing the stability of the supply in scenarios of intermittent availability.
South Zone
In the south zone, the Magallanes region highlights its high potential to become a reference for renewable energy production, thanks to its exceptional conditions for wind generation. This potential is reinforced by the region’s proximity to the Drake Passage, considered one of the windiest areas on the planet, and by the general absence of major topographic obstacles that would otherwise disrupt wind flow [24]. Currently, the region is home to important projects such as Vientos Patagonicos, which, in five years of operation, has been supplying energy to the zone in a sustained manner and without inconvenience.
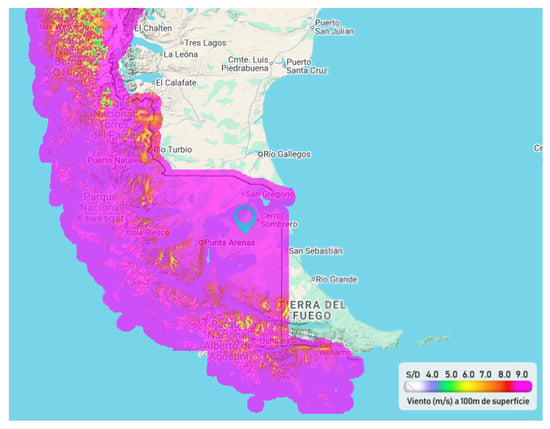
As shown in Figure 8, the region exhibits high wind intensity, with average velocities exceeding 9 m/s, enabling capacity factors that can reach up to 52% in areas such as Cabo Negro [60]. With a zone of great potential, this region is positioned as a key factor in Chile’s strategy to reduce emissions at the local level. Considering its extensive territory, favorable wind conditions, and high-factor plant, it represents a key opportunity to advance through an energy matrix that is cleaner and more sustainable.
Figure 8.
Wind resources in the Magallanes region.
Analyzing the different regions reveals significant variability in the proportion and availability of renewable energy sources according to their geographical location. While the Antofagasta region exhibits advantages in solar radiation, the Magallanes region benefits from wind resources. By contrast, the Biobío region presents an intermediate scenario, with moderate solar resources compared to Antofagasta and promising wind potential along its coastal areas. This analysis underscores the importance of regional energy planning that accounts for geographic diversity to optimize resource utilization and support the development of cost-competitive green hydrogen projects.
Finally, Table 9 shows the electricity and water costs considered for the selected regions. For the Antofagasta and Bio-Bio regions, electricity costs were obtained from the results of the most recent NCRE tender conducted by the Chilean government [61]. For the Magallanes region, data were not available; therefore, the national average tender price of 23.78 USD/MWh was used as as a reference value. The water costs for each region were obtained from the respective water producers [62,63,64]. These considerations should be regarded as a limitation of the present analysis, as the values used do not reflect region-specific generation costs or the particular renewable resource conditions of each area, and in the case of Magallanes may under- or overestimate its actual competitive electricity price. Nonetheless, relying on publicly available benchmark data ensures methodological consistency across the three regions evaluated and provides a conservative, first-order estimate suitable for comparative regional screening. To assess the robustness of this assumption, a sensitivity analysis was conducted on both electricity and water costs.
Table 9.
Cost of energy and water for the selected regions.
Finally, the electrolyzer capacity factors were assumed based on the dominant renewable resource in each region. For Antofagasta, a solar PV-only configuration was assumed, with a capacity factor of 30%, consistent with typical utility-scale solar PV performance reported for high-irradiance desert sites in northern Chile [65,66,67]. For Magallanes, a wind-only configuration was assumed, with a capacity factor of 50%, adopted as a representative base-case estimate consistent with reported wind performance data for the region, with capacity factors of up to 52% in favorable areas such as Cabo Negro [60]. For Bio-Bío, a hybrid solar–wind configuration was assumed, with an effective capacity factor of 40%, represented as the proportional sum of the capacity factors achievable from each individual resource at the site [68].
3.3. Economic Analysis
Table 10 presents the LCOH for commercial electrolyzers in each region considered, revealing distinct regional and technological cost profiles.
Table 10.
LCOH estimation for different regions and electrolyzers.
Across all three regions, the HySTAT (alkaline) electrolyzer consistently achieves a lower LCOH than the HyLYZER (PEM) unit, ranging from a difference of 0.37 USD/kg in Magallanes to 0.87 USD/kg in Antofagasta. The results indicate that Magallanes is the most competitive location overall, achieving the lowest LCOH for both electrolyzer technologies, with 4.43 USD/kg for HySTAT and 4.81 USD/kg for HyLYZER. This outcome reflects the combined effect of lower water costs and favorable electrolyzer operating conditions, which outweigh the disadvantages associated with geographic remoteness. In contrast, for HyLYZER, Antofagasta reaches 6.05 USD/kg —the highest value in the table—while Bio-Bio is lower at 4.81 USD/kg .
The comparative economic analysis across regions and electrolyzer technologies reveals distinct performance profiles, as detailed in Table 11 and Table 12.
Table 11.
Results for the Antofagasta region.
Table 12.
Results for the Magallanes region.
The results show that although the HyLYZER electrolyzer produces more hydrogen annually in both regions (257,647 kg/year versus 219,000 kg/year in Antofagasta, and 429,412 kg/year versus 365,000 kg/year in Magallanes), this increased production requires a higher initial capital investment of USD 7 million, compared with USD 5 million for the HySTAT system. In Antofagasta, the HyLYZER system exhibits a lower investment–production ratio (27.2 USD/kg /yr) than the HySTAT electrolyzer (22.8 USD/kg /yr), indicating that the higher investment is partially compensated by the significantly greater hydrogen production. However, despite this apparent capital efficiency, the PEM technology still results in a higher LCOH, suggesting that factors such as operating costs, electricity consumption, and renewable resource utilization outweigh the benefit of increased production. In contrast, the Magallanes region presents a different trend, where the HySTAT alkaline electrolyzer achieves both the lowest LCOH (4.43 USD/kg ) and the lowest investment–production ratio of 13.7 USD/kg /yr, while the HyLYZER system reaches 16.3 USD/kg /yr. Under the assumed system sizing and cost structure, these results suggest that the Magallanes region provides more favorable conditions for deploying alkaline electrolysis for green hydrogen production.
Considering the use of the HySTAT electrolyzer in the Magallanes region, an economic evaluation was conducted. Table 13 summarizes the key project metrics. At a low sale price of USD 3.50/kg , the project yields a negative NPV of −2,330,778 USD, indicating that revenue at this price is insufficient to recover costs and meet the required return on capital; under these conditions, the Internal Rate of Return (IRR) is not defined, as the project cash flows do not generate a positive return under any discount rate. At the break-even sale price of USD 4.43/kg the resulting NPV (8363 USD) is near to zero. Correspondingly, the IRR at this price (9.54%) closely matches the project’s weighted average cost of capital, which is as expected. Finally, at a higher assumed sale price (4.5 USD/kg ), the project yields a substantially positive NPV of 2,684,250 USD and an IRR of 19.48%, well above the WACC, illustrating the project’s sensitivity to hydrogen market pricing above the cost-recovery threshold. These results demonstrate that the profitability of the project is highly dependent on the achievable sale price of hydrogen relative to its levelized cost of production, and that a positive NPV should only be expected—and can only be economically justified—when the assumed sale price exceeds the break-even LCOH.
Table 13.
Summary of economic indices.
This analysis provides guidance that reinforces ongoing governmental and international efforts to reduce greenhouse gas emissions. The Magallanes region stands out as Chile’s premier entry point into the green hydrogen market, leveraging its exceptional wind resources, strategic port infrastructure, and competitive production costs to position the country as a leading exporter of low-carbon fuels. Accordingly, Magallanes may be viewed as a strong candidate for further analysis and more detailed techno-economic evaluation to confirm its financial viability and strategic position.
3.4. Sensitivity Analysis
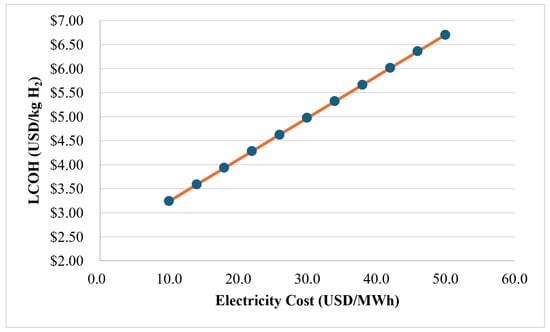
A sensitivity analysis was performed to assess the impact of key parameters on the LCOH for the Magallanes region using the HySTAT electrolyzer. Figure 9 illustrates that the LCOH increases linearly with electricity price, with LCOH rising from 3.24 USD/kg at 10 USD/MWh to 6.70 USD/kg at 50 USD/MWh, an average sensitivity of approximately 0.09 USD per kg for every 1 USD/MWh increase in electricity price. This highlights the dominant influence of electricity cost on hydrogen production, given that power consumption represents the primary operating expense in electrolysis-based systems. Therefore, maintaining low electricity prices is fundamental to achieving competitive LCOH values and enhancing overall project profitability. On the other hand, improvements in electrolyzer efficiency can partially offset higher electricity prices by reducing specific energy consumption, enabling operation through market price fluctuations.
Figure 9.
Effect of electricity cost on LCOH.
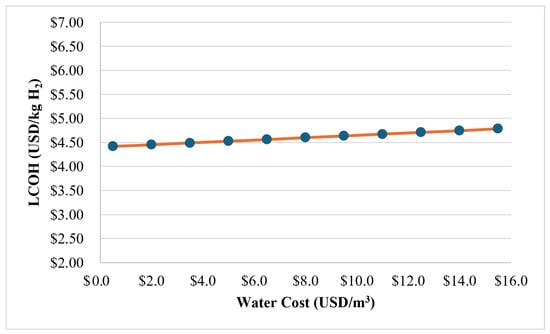
A sensitivity analysis was also performed to assess the impact of water cost on the LCOH for the Magallanes region using the HySTAT electrolyzer. Figure 10 shows that the LCOH increases only marginally with water cost, rising from approximately 4.42 USD/kg at $0.5/ to 4.78 USD/kg at —an average sensitivity of roughly 0.02 USD per kg for every increase in water price, more than three times smaller than the sensitivity observed for electricity cost (Figure 9). This confirms that water cost plays a comparatively minor role in determining the LCOH. It should be noted, however, that the water costs used in the OPEX do not account for the additional treatment required to produce demineralized water suitable for use as electrolyzer feedstock. Water treatment (e.g., seawater desalination) can add approximately 0.5– to water costs; based on the sensitivity shown in Figure 10, this would increase the LCOH by approximately 0.02 USD/kg . While this represents a minor effect relative to the dominant influence of electricity price (Figure 8), it is acknowledged here as a limitation of the base-case water cost assumption.
Figure 10.
Effect of water cost on LCOH.
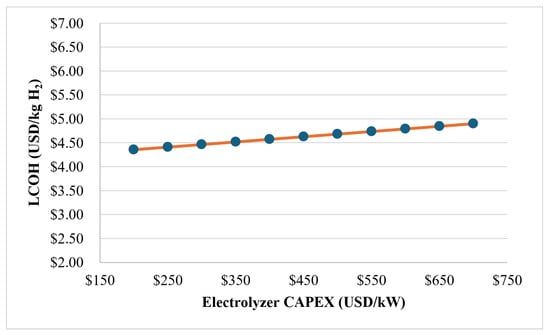
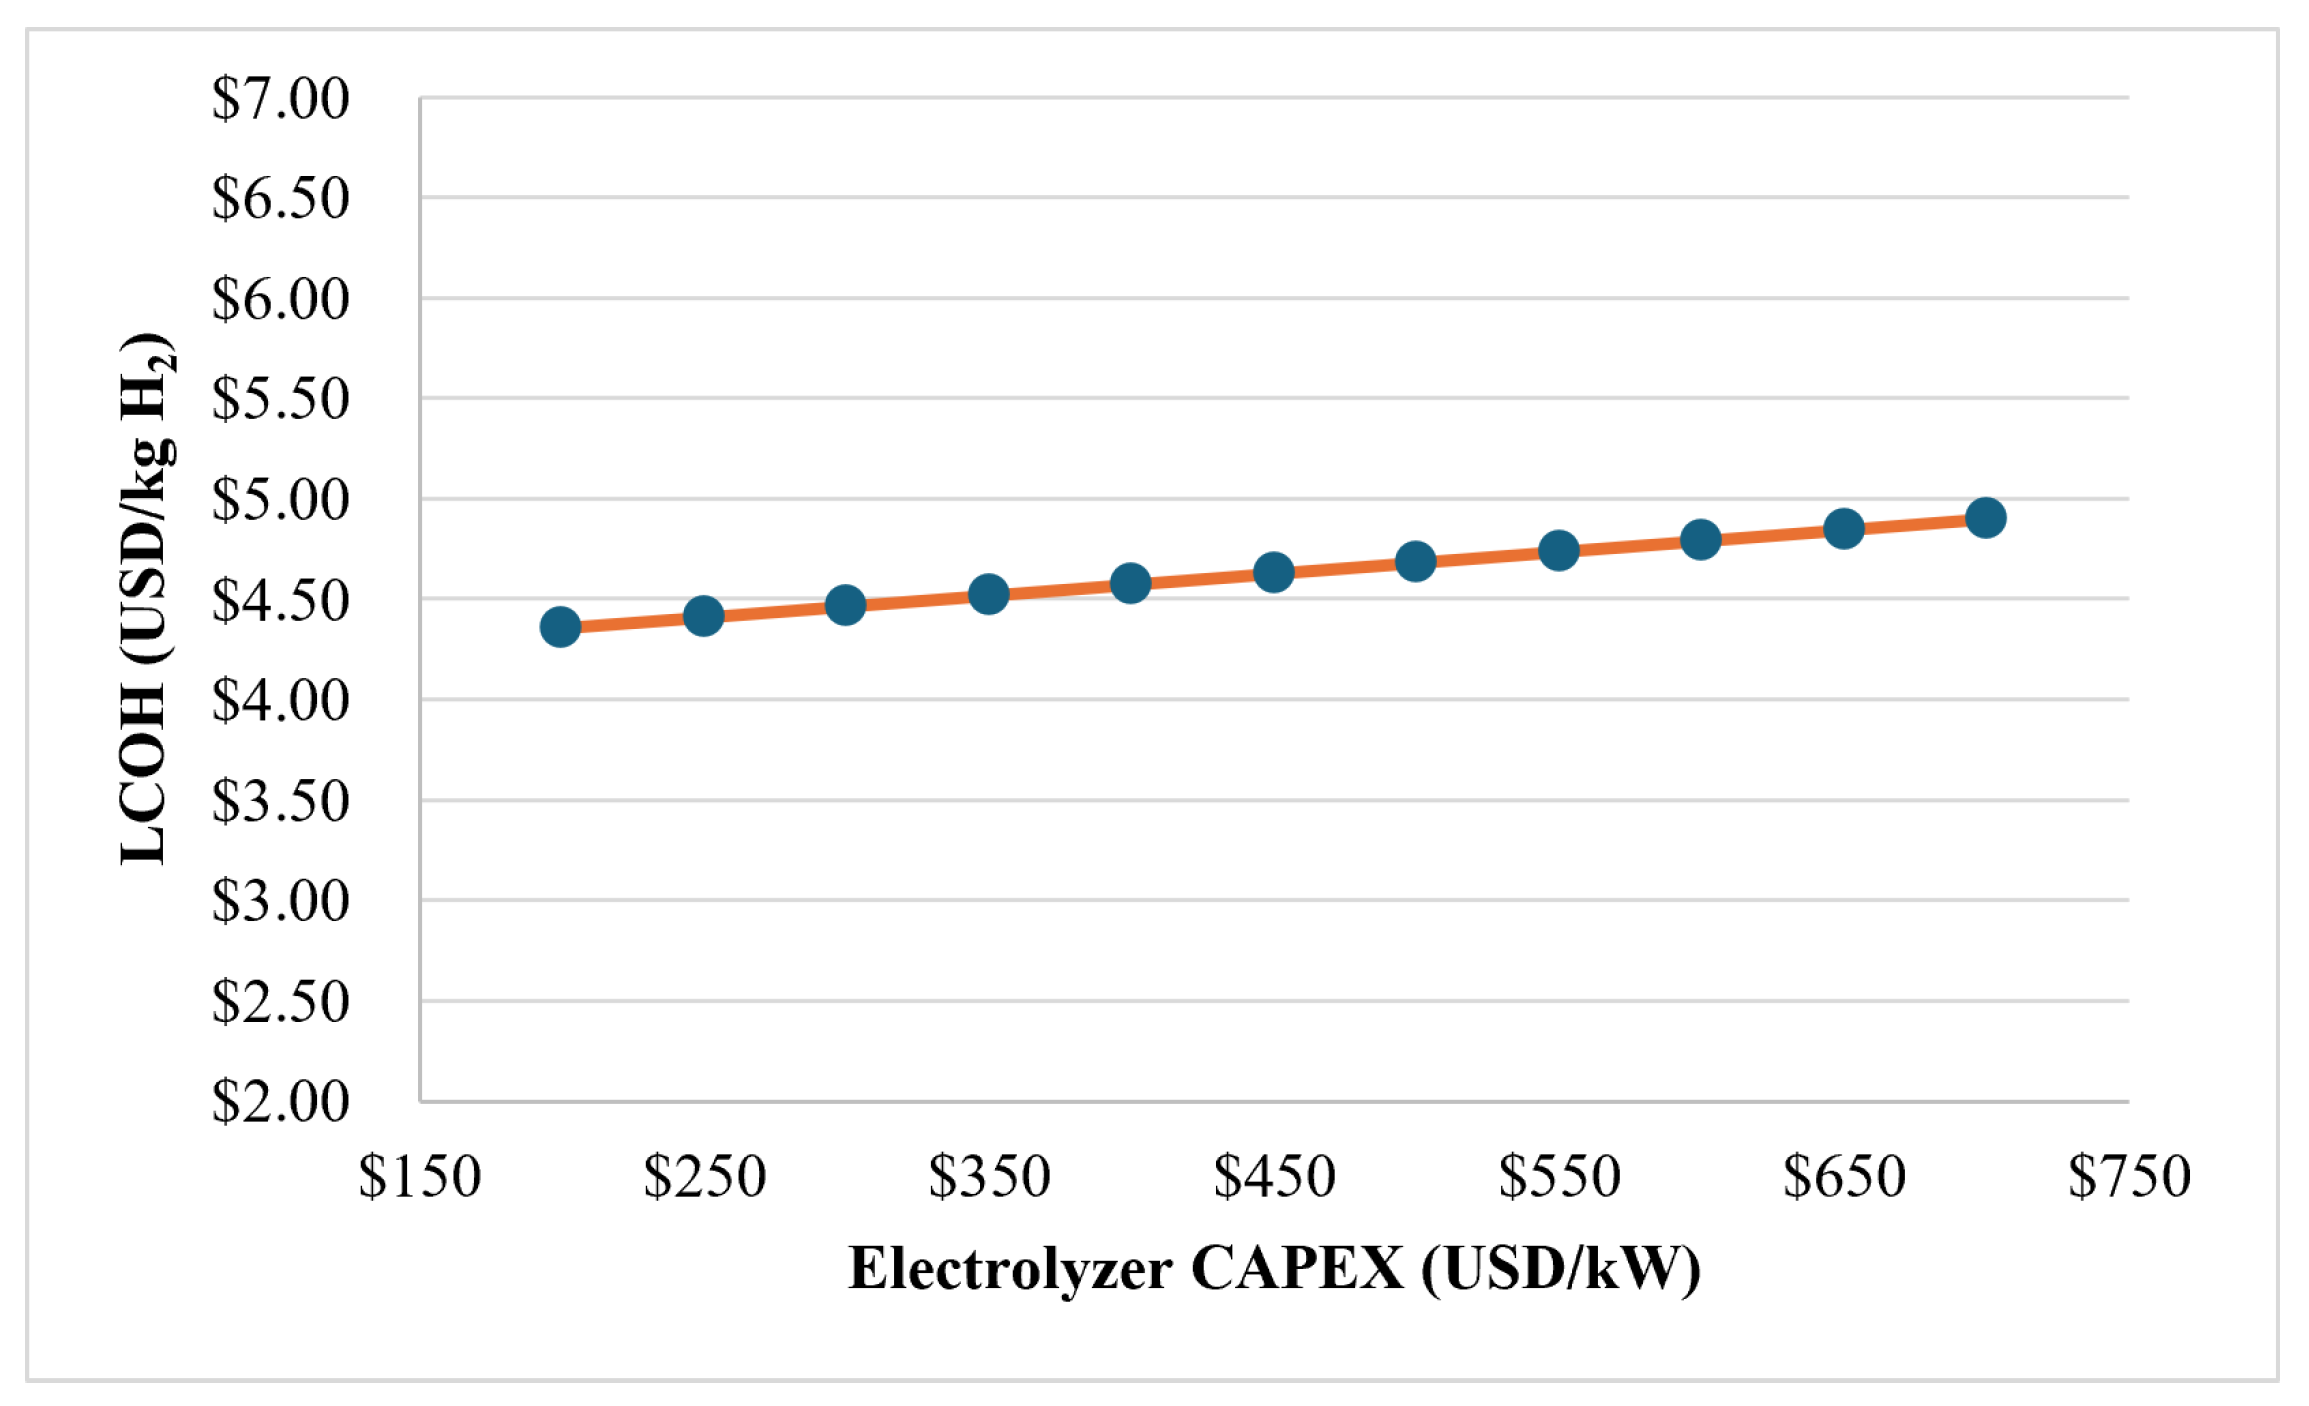
Figure 11 shows how an increase in electrolyzer CAPEX affects the LCOH, raising the cost of producing green hydrogen. The relationship is approximately linear, with the LCOH rising from 4.36 USD/kg at 200 USD/kW to 4.90 USD/kg at 700 USD/kW—an average sensitivity of roughly 0.11 USD per kg for every 100 USD/kW increase in CAPEX. This represents a moderate influence compared to electricity price sensitivity. This confirms electricity price as the dominant cost driver in this analysis, with CAPEX and water cost playing secondary, broadly similar roles. Nevertheless, continuous reductions in electrolyzer manufacturing costs, driven by economies of scale and technological advancements, can further enhance project profitability, even when electricity costs are low. This underscores that development and innovation can enable more competitive projects to minimize initial capital investment and component degradation, which impacts financial depreciation.
Figure 11.
Effect of electrolyzer CAPEX variation on LCOH.
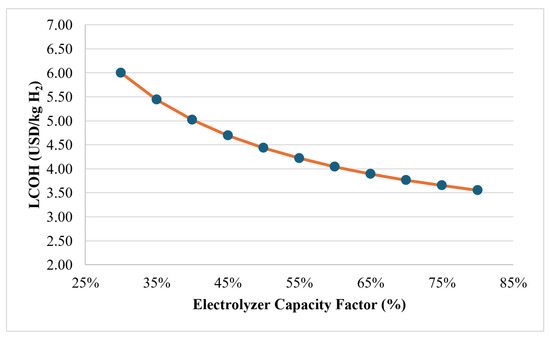
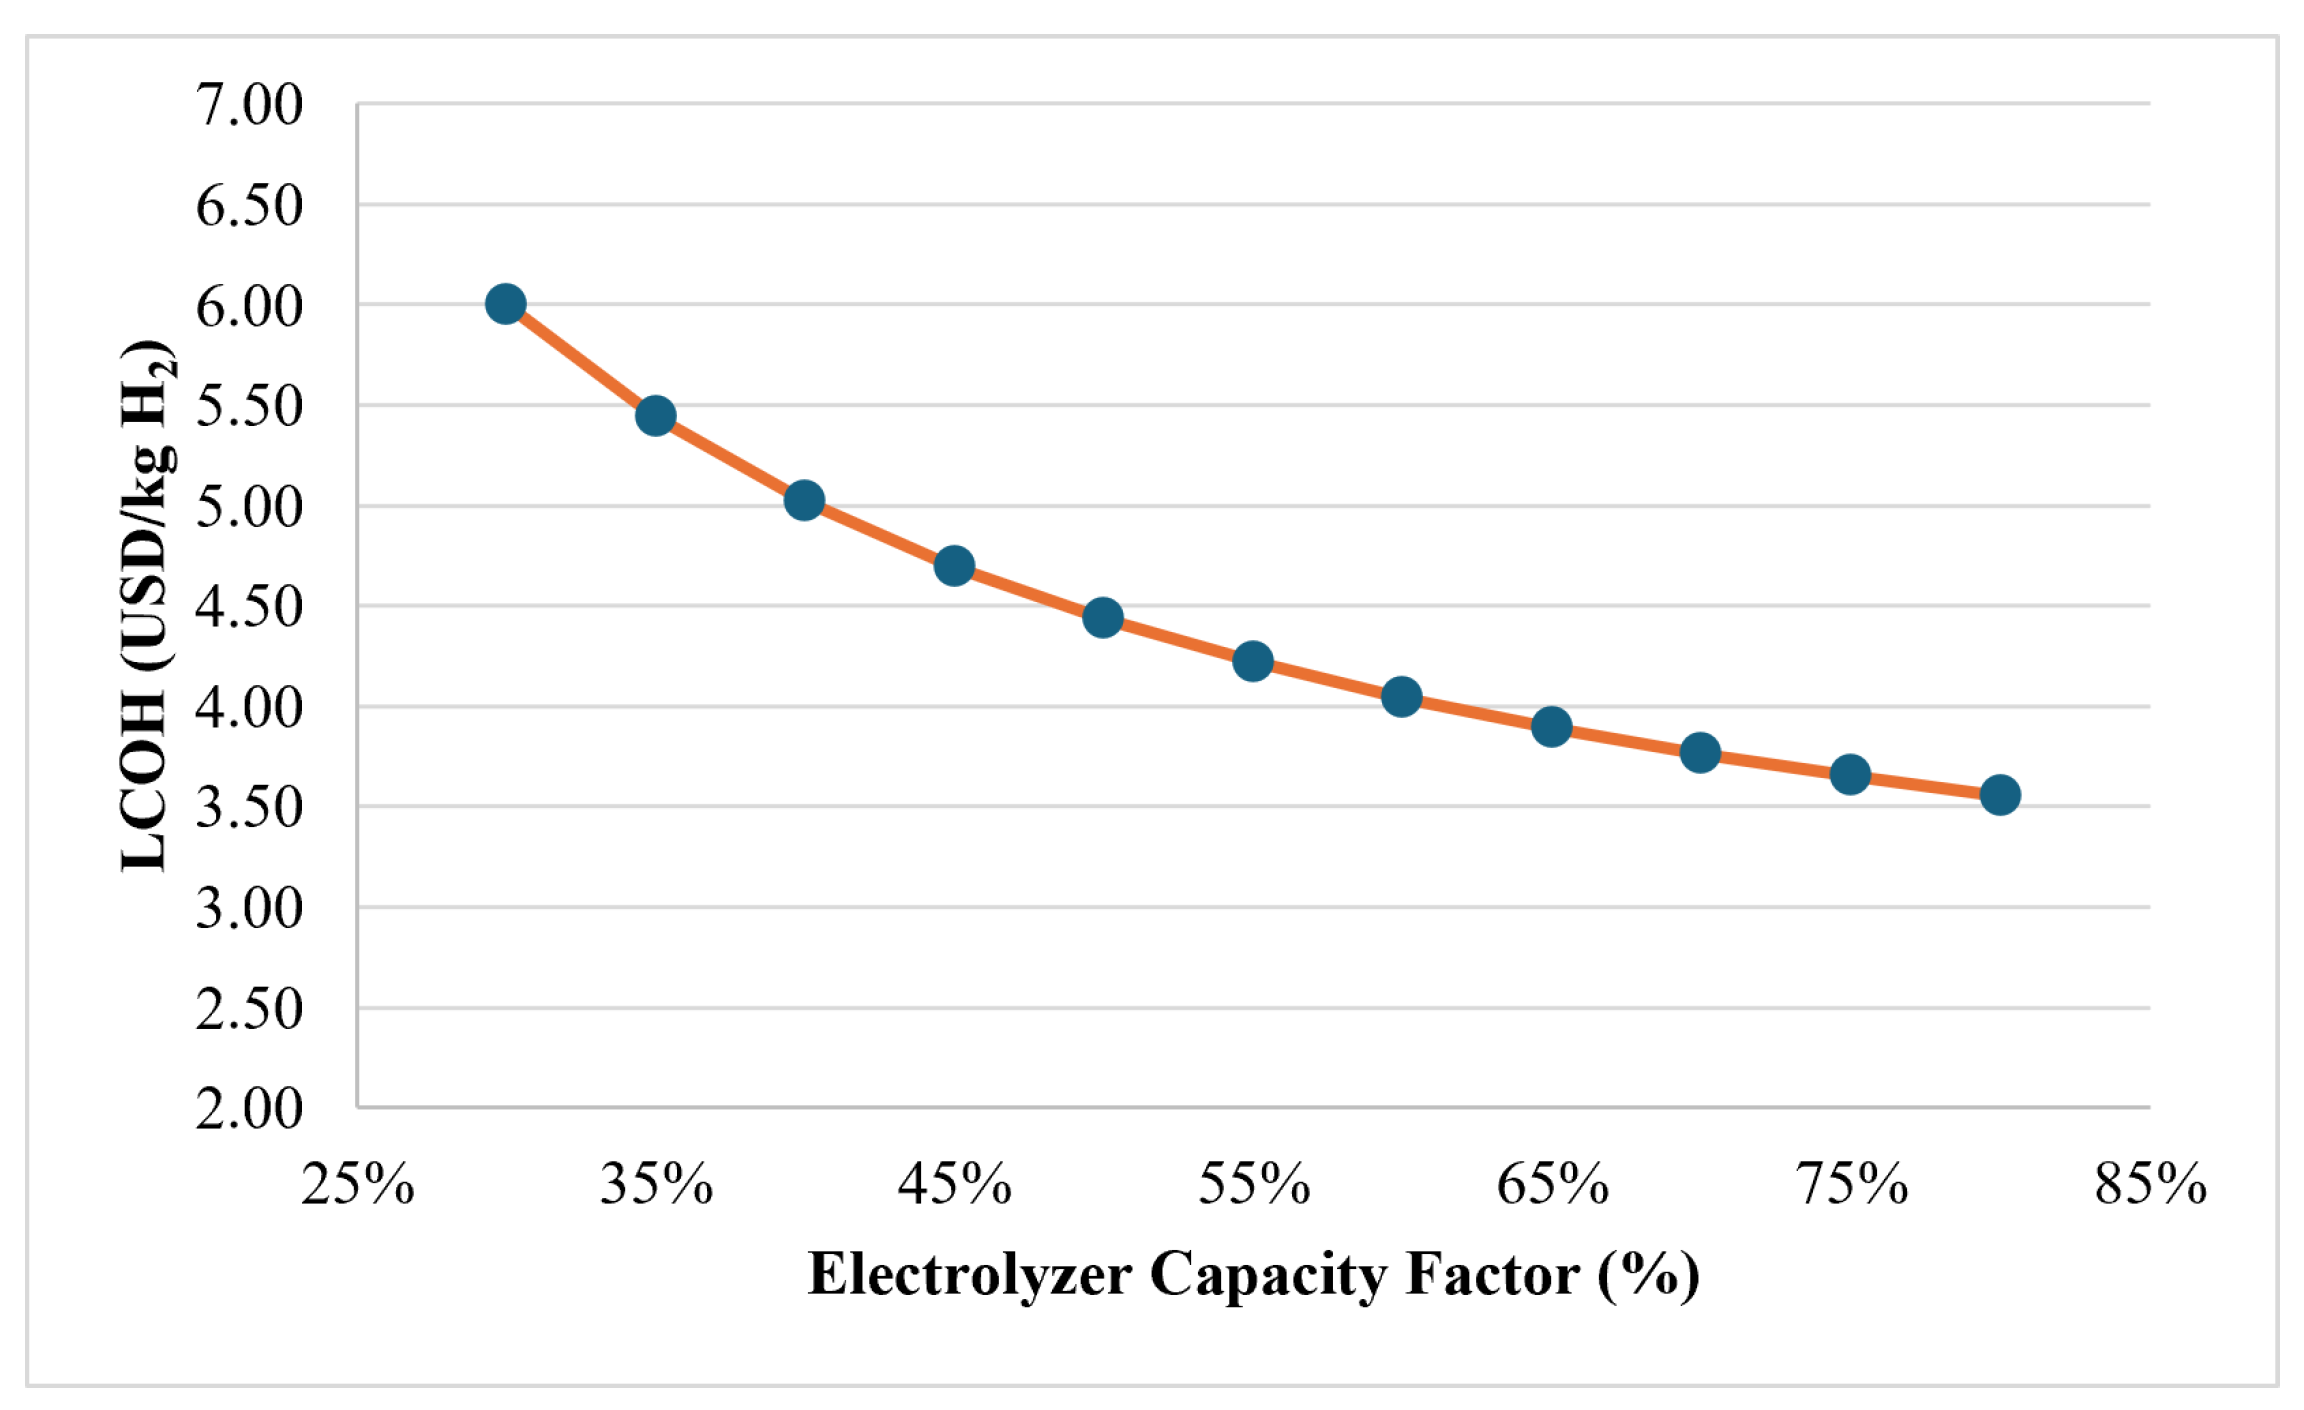
Figure 12 shows that the LCOH decreases sharply with increasing capacity factor, falling from 6.00 USD/kg at a capacity factor of 30% to 3.55 USD/kg at 80%—a reduction of approximately 41% over the range considered. This relationship exhibits pronounced diminishing returns: the sensitivity is highest at low capacity factors, with the LCOH falling by roughly 0.11 USD/kg for every percentage-point increase in capacity factor between 30% and 40%, but declining to approximately 0.02 USD/kg per percentage point between 70% and 80%. This behavior reflects the progressively smaller marginal benefit of the electrolyzer. These results underscore the importance of securing sites and system configurations—including renewable resource quality, hybridization, or oversizing strategies—capable of sustaining higher electrolyzer utilization.
Figure 12.
Effect of electrolyzer capacity factor variation on LCOH.
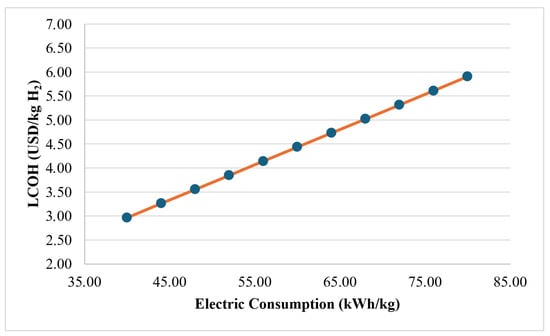
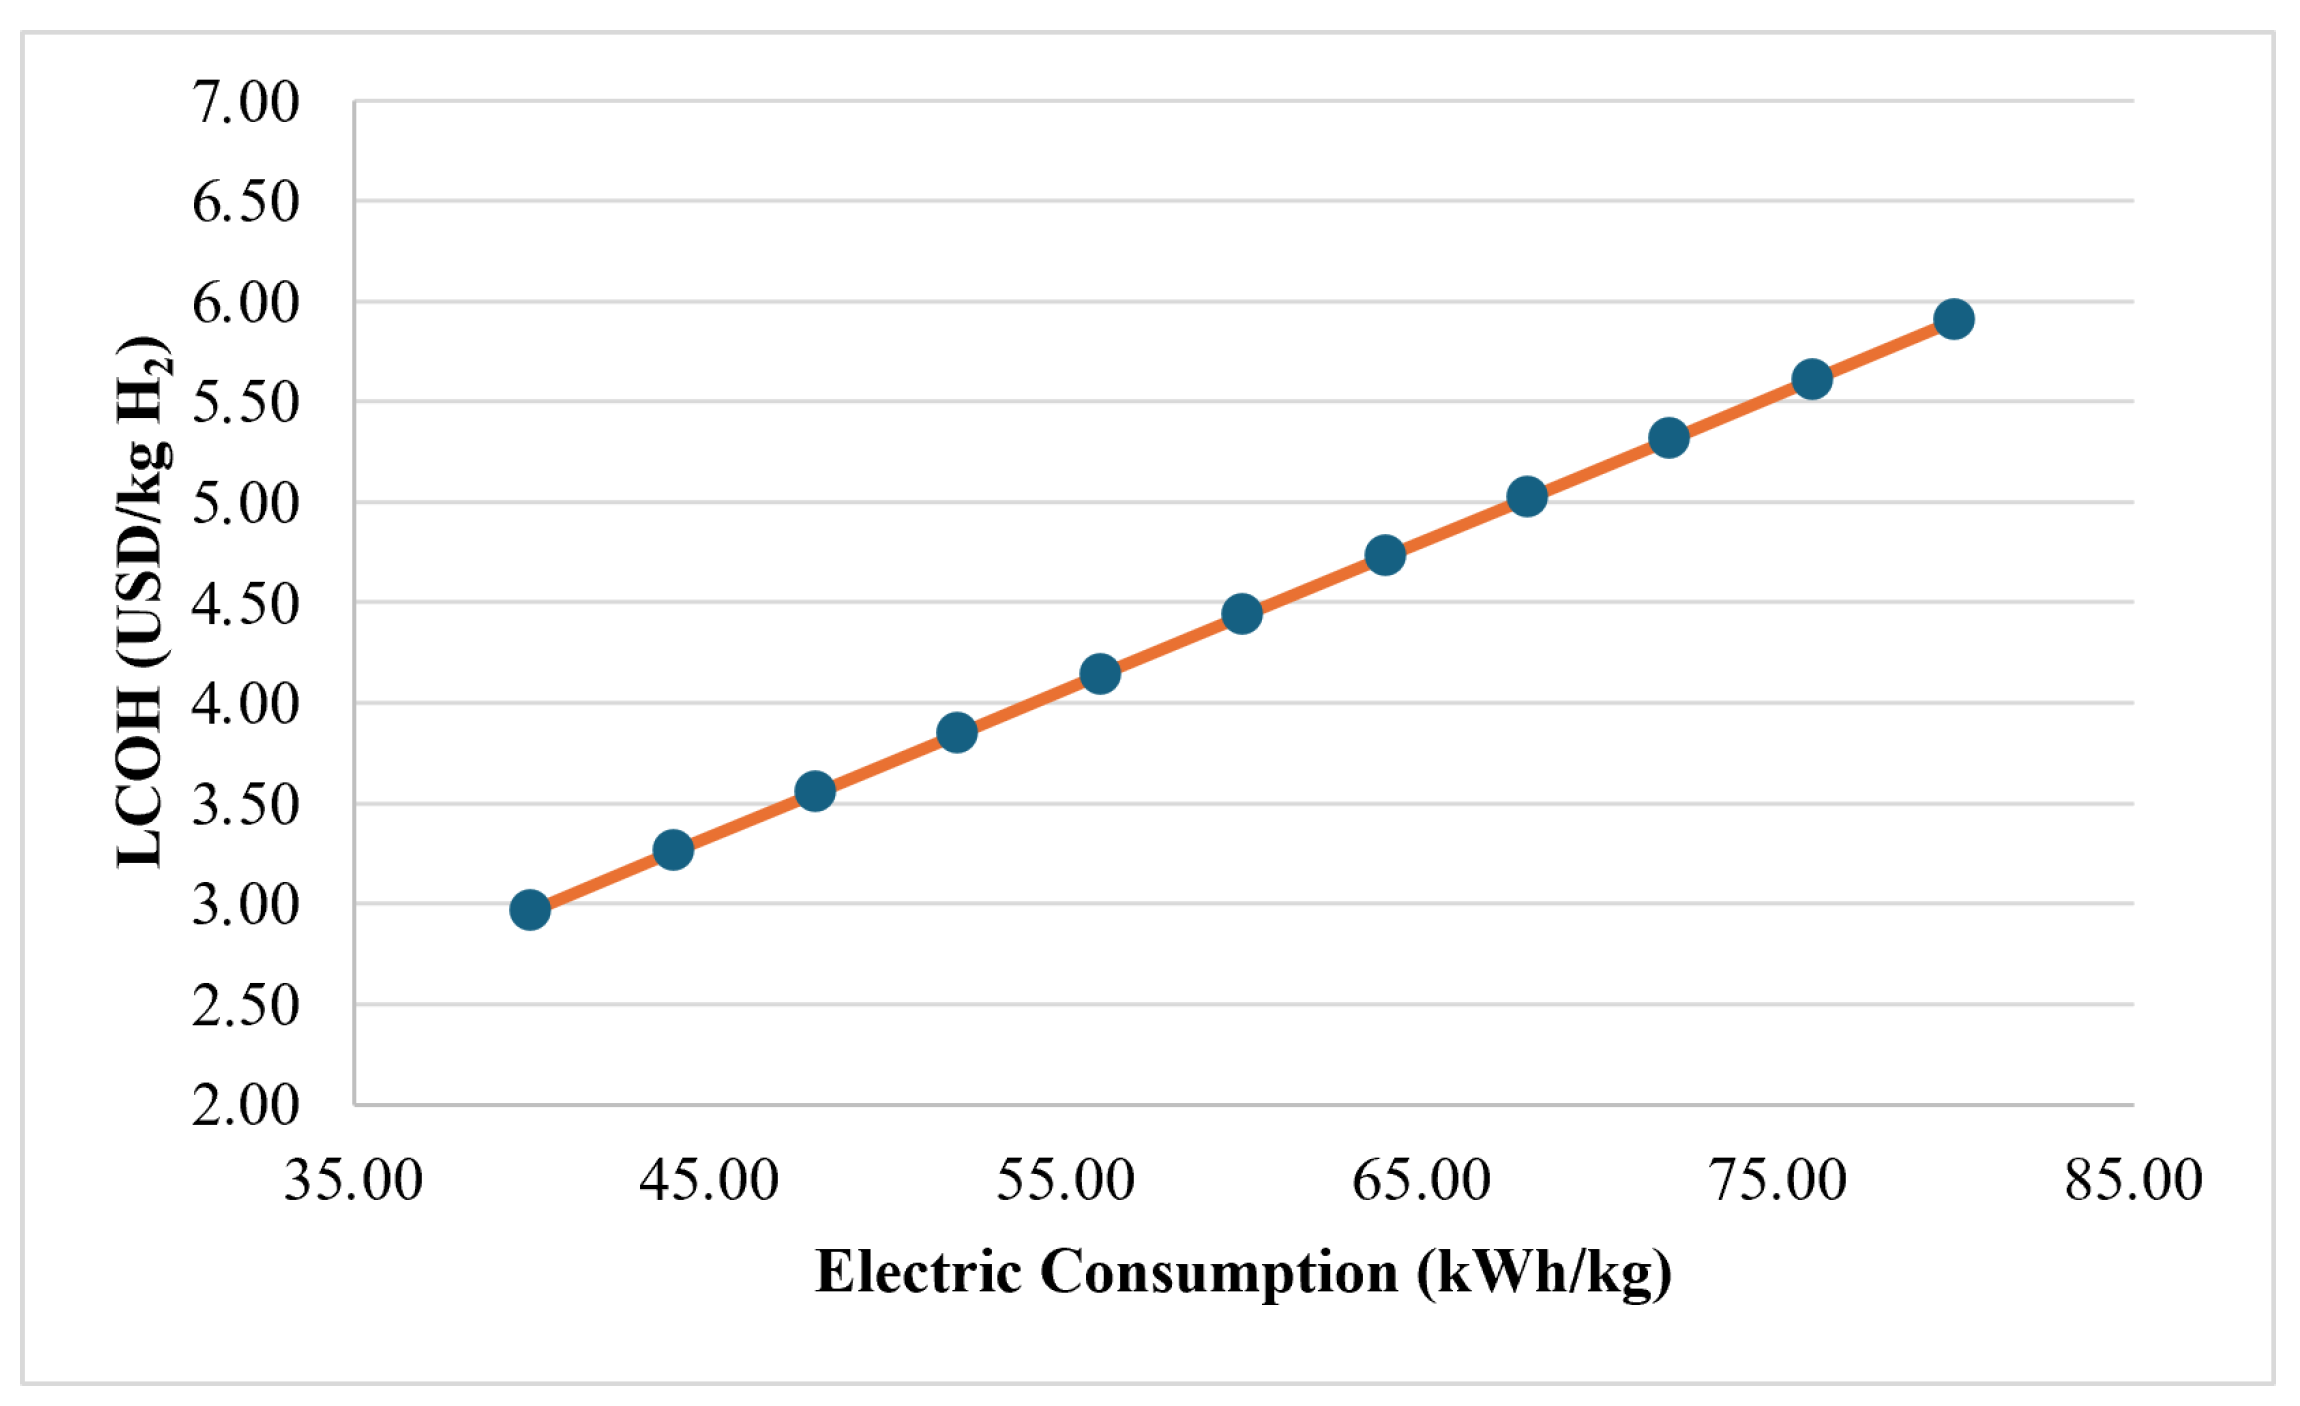
Figure 13 shows the effect of electrolyzer specific energy consumption (inversely related to conversion efficiency) on the LCOH. In contrast to the capacity factor sensitivity, this relationship is approximately linear across the range examined, with the LCOH rising from 2.97 USD/kg at 40 kWh/kg to 5.91 USD/kg at 79 kWh/kg—an average sensitivity of approximately 0.07 USD/kg per kWh/kg increase in specific energy consumption. This near-linear, non-diminishing sensitivity indicates that electrolyzer efficiency is a persistently influential cost driver throughout its operating life, showing the relevance of the degradation. This finding highlights electrolyzer efficiency as a determinant of long-term project economics.
Figure 13.
Effect of electrict consumption variation on LCOH.
3.5. Toward the 1.5 USD/kg Target
Although the base-case LCOH values obtained in this study remain substantially above the USD 1.5/kg target originally established in Chile’s National Green Hydrogen Strategy [9], the sensitivity analyses presented in the previous section indicate that the LCOH is strongly influenced by several parameters, such as electricity price, capacity factor, and specific energy consumption. Rather than treating this target as unattainable under current conditions, an optimized scenario can help to identify the combination of parameter improvements required to approach this cost target for the best-performing case identified in this study (Magallanes, HySTAT electrolyzer). Table 14 summarizes the parameter values assumed in this optimized scenario.
Table 14.
Parameter values assumed in the optimized scenario.
Under this optimized scenario, the resulting LCOH is 1.58 USD/kg , only 0.08 USD/kg above the target, and representing a reduction of approximately 65% relative to the base-case value obtained for Magallanes. It is important to note that each of these parameter values, while technically plausible, represents an aggressive improvement relative to current conditions and commercially available technology. An electricity price of 10 USD/MWh is at the low end of even the most competitive utility-scale renewable PPA tenders observed globally, and it would require continued cost declines in solar and wind generation. A capacity factor of 80% substantially exceeds what is achievable through direct, non-oversized coupling to a single renewable resource; reaching this level would require deliberate addition of battery or hydrogen storage to smooth renewable intermittency [69], each of which entails additional capital investment not captured in this simplified scenario. Finally, a specific energy consumption of 40 kWh/kg corresponds to an implied electrolyzer efficiency of approximately 83% (LHV basis)—well above the efficiency of the commercially available HySTAT alkaline electrolyzer used in this study’s base case (Table 8)—and would require a substantial advance in electrolyzer technology beyond current commercial alkaline systems. These results indicate that approaching the 1.5 USD/kg target is not achievable through incremental improvement in any single parameter but would instead require the simultaneous realization of best-in-class electricity pricing, an oversized or hybridized renewable supply configuration, and next-generation electrolyzer efficiency.
4. Conclusions
This study evaluated the feasibility of using a commercial electrolyzer for green hydrogen production powered by renewable energy sources across three key regions of Chile: Antofagasta, Bio-Bio, and Magallanes.
The regional analysis clearly demonstrates Chile’s vast national potential for green hydrogen production, with a distinct north–south gradient: solar predominance in Antofagasta, mixed resources requiring wind supplementation in central Bio-Bio, and exceptional wind intensity in Magallanes.
In the economic analysis, the difference in outcomes between the central and high cases was large relative to the small change in LCOH between them. Increasing the assumed sale price from USD 4.43/kg (central, approximately at break-even) to USD 4.50/kg (high)—a change of less than 2%—results in the NPV rising from near zero (8363 USD) to 2,684,250 USD.
A sensitivity analysis was conducted across five parameters: electrolyzer capacity factor, specific energy consumption, electricity price, water cost, and electrolyzer CAPEX. The results confirm that capacity factor and specific energy consumption, along with electricity price, are among the most influential drivers of LCOH, while water cost and electrolyzer CAPEX exert a comparatively smaller influence.
The optimized scenario shows that reaching 1.58 USD/kg (close to the Chilean government’s USD 1.5/kg target) requires simultaneous best-in-class electricity pricing, an 80% capacity factor (achievable via storage or oversizing not costed here), and next-generation electrolyzer efficiency, none of which is attainable incrementally or with current commercial alkaline technology.
The sensitivity analysis indicates that electricity prices have a significant impact on LCOH, followed by CAPEX and water cost as secondary factors. Enhancing electrolyzer efficiency can help sustain project profitability amid fluctuations in energy costs.
Although the target of 1.5 USD/kg remains distant under current conditions, there are opportunities for improvement in both the short and long term. Reducing electricity costs through more favorable agreements and advancing technological developments to enhance efficiency can gradually make green hydrogen production more competitive.
Author Contributions
Conceptualization, L.H.-V.; Investigation, M.M. and M.B.-G.; Methodology, L.H.-V., P.D.-G., M.M., M.B.-G., I.D., and J.L.S.; Supervision, L.H.-V.; Validation, L.H.-V.; Writing—Original Draft, L.H.-V. and M.B.-G.; Writing—Review and Editing, L.H.-V., P.D.-G., I.D. and J.L.S. All authors have read and agreed to the published version of the manuscript.
Funding
The APC was funded by DICYT-USACH, Universidad de Santiago de Chile.
Data Availability Statement
The original contributions presented in this study are included in the article. Further inquiries can be directed to the corresponding author.
Acknowledgments
The authors gratefully acknowledge financial support from FIUF-137139.
Conflicts of Interest
The authors declare no conflicts of interest.
References
- Ministry of Finance. Chile: Estrategia Financiera Frente al Cambio Climático. 2022. Available online: https://www.hacienda.cl/areas-de-trabajo/finanzas-internacionales/finanzas-sostenibles/archivos/actualizacion-2022-estrategia-financiera-frente-al-cambio-climatico (accessed on 8 October 2025).
- UNFCCC. Chile’s Long-Term Climate Strategy: The Path to Carbon Neutrality and Resilience by 2050. Available online: https://unfccc.int/sites/default/files/resource/CHL_LTS_2021_EN_0.pdf (accessed on 8 October 2025).
- IEA. Global Hydrogen Review 2026. 2026. Available online: https://iea.blob.core.windows.net/assets/af4b6218-0311-4963-91ab-903cb18ca0ca/GlobalHydrogenReview2026.pdf (accessed on 5 July 2026).
- Bilto, M.; Uyar, T.S. Hydrogen as a viable decarbonization enabler for critical sectors: A comprehensive review. Int. J. Hydrogen Energy 2026, 251, 156025. [Google Scholar] [CrossRef] [Scilit]
- Akyüz, E.S.; Telli, E.; Farsak, M. Hydrogen generation electrolyzers: Paving the way for sustainable energy. Int. J. Hydrogen Energy 2024, 81, 1338–1362. [Google Scholar] [CrossRef] [Scilit]
- Åžahin, M.E. An Overview of Different Water Electrolyzer Types for Hydrogen Production. Energies 2024, 17, 4944. [Google Scholar] [CrossRef] [Scilit]
- Simsek, Y.; Lorca, Á.; Urmee, T.; Bahri, P.A.; Escobar, R. Review and assessment of energy policy developments in Chile. Energy Policy 2019, 127, 87–101. [Google Scholar] [CrossRef] [Scilit]
- Oyarzún-Aravena, A.M.; Chen, J.; Brownbridge, G.; Akroyd, J.; Kraft, M. An analysis of renewable energy resources and options for the energy transition in Chile. Appl. Energy 2025, 381, 125107. [Google Scholar] [CrossRef] [Scilit]
- Estrategia Nacional de Hidrógeno Verde. Available online: https://energia.gob.cl/sites/default/files/documentos/202011_estrategianacionalhidrogenoverde_foliado.pdf (accessed on 6 January 2026).
- Armijo, J.; Philibert, C. Flexible production of green hydrogen and ammonia from variable solar and wind energy: Case study of Chile and Argentina. Int. J. Hydrogen Energy 2020, 45, 1541–1558. [Google Scholar] [CrossRef] [Scilit]
- Gallardo, F.I.; Monforti Ferrario, A.; Lamagna, M.; Bocci, E.; Astiaso Garcia, D.; Baeza-Jeria, T.E. A Techno-Economic Analysis of solar hydrogen production by electrolysis in the north of Chile and the case of exportation from Atacama Desert to Japan. Int. J. Hydrogen Energy 2021, 46, 13709–13728. [Google Scholar] [CrossRef] [Scilit]
- Burdack, A.; Duarte-Herrera, L.; López-Jiménez, G.; Polklas, T.; Vasco-Echeverri, O. Techno-economic calculation of green hydrogen production and export from Colombia. Int. J. Hydrogen Energy 2023, 48, 1685–1700. [Google Scholar] [CrossRef] [Scilit]
- León, M.; Silva, J.; Ortíz-Soto, R.; Carrasco, S. A Techno-Economic Study for Off-Grid Green Hydrogen Production Plants: The Case of Chile. Energies 2023, 16, 5327. [Google Scholar] [CrossRef] [Scilit]
- Muñoz Díaz, M.T.; Chávez Oróstica, H.; Guajardo, J. Economic Analysis: Green Hydrogen Production Systems. Processes 2023, 11, 1390. [Google Scholar] [CrossRef] [Scilit]
- Masip Macía, Y.; Rodríguez Machuca, P.; Rodríguez Soto, A.A.; Carmona Campos, R. Green Hydrogen Value Chain in the Sustainability for Port Operations: Case Study in the Region of Valparaiso, Chile. Sustainability 2021, 13, 13681. [Google Scholar] [CrossRef] [Scilit]
- Acosta, K.; Salazar, I.; Saldaña, M.; Ramos, J.; Navarra, A.; Toro, N. Chile and its Potential Role Among the Most Affordable Green Hydrogen Producers in the World. Front. Environ. Sci. 2022, 10, 890104. [Google Scholar] [CrossRef] [Scilit]
- Ferrada, F.; Babonneau, F.; Homem-de Mello, T.; Jalil-Vega, F. The role of hydrogen for deep decarbonization of energy systems: A Chilean case study. Energy Policy 2023, 177, 113536. [Google Scholar] [CrossRef] [Scilit]
- Sánchez-Squella, A.; Muñoz, M.; Toledo, M.; Yanine, F. Techno-economic assessment of a green hydrogen production plant for a mining operation in Chile. Int. J. Hydrogen Energy 2025, 112, 531–543. [Google Scholar] [CrossRef] [Scilit]
- Pavez, R.; Ripoll, N.; Briceño, P.; Sánchez-Squella, A.; Olivares, M.; Pontt, J.; Mena, R.; Espergues, F.; Toledo, M. Review of international standards for the use of green H2 in Chilean mining industry. Int. J. Hydrogen Energy 2025, 103, 975. [Google Scholar] [CrossRef] [Scilit]
- Chavez-Angel, E.; Castro-Alvarez, A.; Sapunar, N.; Henríquez, F.; Saavedra, J.; Rodríguez, S.; Cornejo, I.; Maxwell, L. Exploring the Potential of Green Hydrogen Production and Application in the Antofagasta Region of Chile. Energies 2023, 16, 4509. [Google Scholar] [CrossRef] [Scilit]
- Garcia, G.; Oliva, M. Technical, economic, and CO2 emissions assessment of green hydrogen production from solar/wind energy: The case of Chile. Energy 2023, 278, 127981. [Google Scholar] [CrossRef]
- San Martin, M.; Poch, P.; Carmona, R.; Rodríguez, P.; Rodríguez, A.; Garrido, R.; Serafini, D.; Mena, M.; Valdes, J.; Masip, Y. Parameterization proposal to determine the feasibility of geographic areas for the green hydrogen industry under socio-environmental and technical constraints in Chile. Int. J. Hydrogen Energy 2024, 50, 578–598. [Google Scholar] [CrossRef] [Scilit]
- Farfán, I.A.; Castro, C.B.; Lazo, R.G.; Gil, A.F.; Hormazábal, M.S.M.; Machuca, P.R.; Serafini, D.; Soto, A.R.; Mena-Carrasco, M.; Valdes, J.; et al. Socio-environmental and technical factors assessment of photovoltaic hydrogen production in Antofagasta, Chile. Energy Strategy Rev. 2024, 53, 101373. [Google Scholar] [CrossRef] [Scilit]
- Cacciuttolo, C.; Huertas, A.; Montoya, B.; Cano, D. The Present and Future of Production of Green Hydrogen, Green Ammonia, and Green E-Fuels for the Decarbonization of the Planet from the Magallanes Region, Chile. Appl. Sci. 2025, 15, 6228. [Google Scholar] [CrossRef] [Scilit]
- Kumar, D.; Zhang, C.; Holubnyak, E.; Demirkesen, S. Integrated assessment of levelized costs of hydrogen production: Evaluating renewable and fossil pathways with emission costs and tax incentives. Int. J. Hydrogen Energy 2024, 95, 389–401. [Google Scholar] [CrossRef] [Scilit]
- Curcio, E. Hydrogen Production Costs: Analyzing LCOH, LCOE, and Market Implications. SSRN Electron. J. 2025. [Google Scholar] [CrossRef] [Scilit]
- Galevskiy, S.; Qian, H. A Binary Discounting Method for Economic Evaluation of Hydrogen Projects: Applicability Study Based on Levelized Cost of Hydrogen (LCOH). Energies 2025, 18, 3839. [Google Scholar] [CrossRef] [Scilit]
- Maoulida, F.; Guilbert, D.; Camara, M.B.; Dakyo, B. Dynamic electrical degradation of PEM electrolyzers under renewable energy Intermittency: Mechanisms, diagnostics, and mitigation strategies—A comprehensive review. Renew. Sustain. Energy Rev. 2026, 225, 116170. [Google Scholar] [CrossRef] [Scilit]
- Instituto Nacional de Estadísticas. Boletín estadístico: índice de precios al consumidor. Available online: https://www.ine.gob.cl/docs/default-source/%C3%ADndice-de-precios-al-consumidor/boletines/espa%C3%B1ol/2025/boletin-%C3%ADndice-de-precios-al-consumidor-diciembre-2025.pdf?sfvrsn=15b15af1_5 (accessed on 23 January 2026).
- Comision Nacional de Energia. Tasa de Costo de Capital. 2026. Available online: https://www.cne.cl/wp-content/uploads/2022/06/Res-Ex-CNE-N%C2%B0535-2021-IT-Definitivo-TCC.pdf (accessed on 23 January 2026).
- Lee, W.J. Meeting the Goal of Net-Zero Carbon Emission [President’s Message]. IEEE Ind. Appl. Mag. 2022, 28, 5–6. [Google Scholar] [CrossRef] [Scilit]
- Ritchie, H. Sector by Sector: Where Do Global Greenhouse Gas Emissions Come from? Our World in Data 2020. Available online: https://ourworldindata.org/ghg-emissions-by-sector. (accessed on 5 July 2026).
- Cordonnier, J.; Saygin, D. Green Hydrogen Opportunities for Emerging and Developing Economies: Identifying Success Factors for Market Development and Building Enabling Conditions; OECD Environment Working Papers; OECD: Paris, France, 2022. [Google Scholar] [CrossRef] [Scilit]
- Figueiredo, R.L.; da Silva, J.M.; Ortiz, C.E.A. Green hydrogen: Decarbonization in mining—Review. Clean. Energy Syst. 2023, 5, 100075. [Google Scholar] [CrossRef] [Scilit]
- Rashid, M.I.; Benhelal, E.; Abbas, M.M. A Critical Analysis on Transformation of Renewable Energy to Green Chemicals: Opportunities and Challenges. ChemBioEng Rev. 2024, 11, 363–385. [Google Scholar] [CrossRef] [Scilit]
- Li, Q.; Zhang, Q.; Zhang, L.; Lang, J.; Yuan, W.; An, G.; Lei, T.; JunhaoYan. A comprehensive review of advances and challenges of hydrogen production, purification, compression, transportation, storage and utilization technology. Renew. Sustain. Energy Rev. 2026, 226, 116196. [Google Scholar] [CrossRef] [Scilit]
- Yusaf, T.; Laimon, M.; Alrefae, W.; Kadirgama, K.; Dhahad, H.A.; Ramasamy, D.; Kamarulzaman, M.K.; Yousif, B. Hydrogen Energy Demand Growth Prediction and Assessment (2021–2050) Using a System Thinking and System Dynamics Approach. Appl. Sci. 2022, 12, 781. [Google Scholar] [CrossRef] [Scilit]
- Sokil, O.; Podolchak, N.; Stetsiv, I.; Zuiev, M.; Chepil, B. Hydrogen for Heating: Technologies, Challenges, and Opportunities. Open Res. Eur. 2025, 5, 143. [Google Scholar] [CrossRef] [Scilit]
- Younus, H.A.; Al Hajri, R.; Ahmad, N.; Al-Jammal, N.; Verpoort, F.; Al Abri, M. Green hydrogen production and deployment: Opportunities and challenges. Discov. Electrochem. 2025, 2, 32. [Google Scholar] [CrossRef] [Scilit]
- Mansilha, C.; Barbosa-Póvoa, A.; Tarelho, L.; Fonseca, A. A comprehensive review of green hydrogen production technologies: Current status, challenges, research trends and future directions. Renew. Sustain. Energy Rev. 2026, 225, 116119. [Google Scholar] [CrossRef] [Scilit]
- Asghari, M.; Afshari, H.; Jaber, M.Y.; Searcy, C. Strategic analysis of hydrogen market dynamics across collaboration models. Renew. Sustain. Energy Rev. 2025, 208, 115001. [Google Scholar] [CrossRef] [Scilit]
- Shahzad, S.; Alrumayh, O.; Almutairi, A.; Altamimi, A. Green hydrogen: A review of technological innovations, economic viability, and global prospects. Renew. Sustain. Energy Rev. 2026, 225, 116162. [Google Scholar] [CrossRef] [Scilit]
- Mohsen, F.M.; Mjbel, H.M.; Challoob, A.F.; Alkhazaleh, R.; Alahmer, A. Advancements in green hydrogen production: A comprehensive review of prospects, challenges, and innovations in electrolyzer technologies. Fuel 2026, 404, 136251. [Google Scholar] [CrossRef] [Scilit]
- NGHC. World’s Largest Green Hydrogen Plant Achieves 90% Overall Construction Completion Across All Sites. 2026. Available online: https://nghc.com/news/worlds-largest-green-hydrogen-plant-achieves-90-overall-construction-completion-across-all-sites/ (accessed on 8 July 2026).
- Hydrogen Europe. Electrolytic Hydrogen Project Developments. 2026. Available online: https://hydrogeneurope.eu/wp-content/uploads/2026/02/ElY-projects-FID-overview-2025-UPDATED-Feb-2026.pdf (accessed on 8 July 2026).
- Chile, H. Mapa de Proyectos. 2025. Available online: https://h2chile.cl/mapa-de-proyectos/ (accessed on 19 July 2026).
- Alam, S.N.; Khalid, Z.; Singh, B.; Guldhe, A. Integration of Government Policies on the Global Level for Green Hydrogen Production. In Green Hydrogen Economy for Environmental Sustainability; American Chemical Society: Washington, DC, USA, 2024; Volume 1, pp. 1–28. [Google Scholar] [CrossRef] [Scilit]
- Dincer, I.; AlZahrani, A.A. 4.25 Electrolyzers. In Comprehensive Energy Systems; Elsevier: Amsterdam, The Netherlands, 2018; pp. 985–1025. [Google Scholar] [CrossRef] [Scilit]
- Aminaho, E.N.; Aminaho, N.S.; Aminaho, F. Techno-economic assessments of electrolyzers for hydrogen production. Appl. Energy 2025, 399, 126515. [Google Scholar] [CrossRef] [Scilit]
- Cummins. Hydrogen: The Next Generation. Discover Cummins Electrolyzer Technolgies. Available online: https://www.cummins.com/sites/default/files/2023-10/electrolyzer-brochure.pdf (accessed on 27 October 2025).
- Cummins. Green Hydrogen: The Power of Wind. Available online: https://www.cummins.com/news/2021/05/03/green-hydrogen-power-wind (accessed on 27 October 2025).
- Cummins. Cummins HyLYZER PEM electrolyzer in Bécancour, Quebec. Available online: https://www.cummins.com/es/news/2021/10/04/video-case-study-cummins-hylyzerr-pem-electrolyzer-becancour-quebec (accessed on 27 October 2025).
- Cummins. HySTAT Alkaline Electrolyzers. Available online: https://www.cummins.com/sites/default/files/2021-08/cummins-hystat-100-specsheet.pdf (accessed on 27 October 2025).
- Cummins. HyLYZER Water Electrolyzers. Available online: https://www.cummins.com/sites/default/files/2021-08/cummins-hylyzer-1000-specsheet.pdf (accessed on 27 October 2025).
- Cummins. Hydrogen: The Next Generation. 2021. Available online: https://www.cummins.com/sites/default/files/2021-08/cummins-hydrogen-generation-brochure-20210603.pdf (accessed on 4 September 2026).
- Shanian, S.; Savadogo, O. Techno economic analysis of electrolytic hydrogen production by alkaline and PEM electrolysers using MCDM methods. Discov. Energy 2024, 4, 23. [Google Scholar] [CrossRef] [Scilit]
- Bora, D.K. Green Hydrogen Production with 25 kW Alkaline Electrolyzer Pilot Plant Shows Hydrogen Flow Rate Exponential Asymptotic Behavior with the Stack Current. Hydrogen 2025, 6, 75. [Google Scholar] [CrossRef] [Scilit]
- ACERA. Estadísticas. Sector de Generación de Energía Eléctrica Renovable; Technical Report; ACERA: Santiago, Chile, 2024. [Google Scholar]
- Zurita, A.; Castillejo-Cuberos, A.; García, M.; Mata-Torres, C.; Simsek, Y.; García, R.; Antonanzas-Torres, F.; Escobar, R.A. State of the art and future prospects for solar PV development in Chile. Renew. Sustain. Energy Rev. 2018, 92, 701–727. [Google Scholar] [CrossRef] [Scilit]
- ENAP. Informe Trimestral: Proyectos de InversióN En EnergíAs Renovables no Convencionales y Eficiencia EnergéTica. 2019. Available online: https://www.senado.cl/site/presupuesto/2019/cumplimiento/Otras%20Leyes%202019/Ley%2021.025%20Gob.%20Corporativo%20ENAP/ENAP%2025.04.2019.pdf (accessed on 19 July 2026).
- Empresas Electricas AG. Documentos Licitaciones Vigentes. 2021. Available online: https://www.licitacioneselectricas.cl/licitaciones/licitacion-de-suministro-2021-01 (accessed on 30 October 2025).
- Aguas Antofagasta, S.A. Tarifas Vigentes. 2025. Available online: https://www.siss.gob.cl/589/articles-4497_Antofagasta_G1_Oct2025.pdf (accessed on 23 January 2026).
- ESSBIO. Tarifas Agua Potable Y Alcantarillado. 2025. Available online: https://www.essbio.cl/get-files/VTJGc2RHVmtYMThwSjlPT09HdlpGNVFpZ1JMN1E5dWZ0RUMwM2FBVmd3alZNR0ZZSjdyUDI0V3owOWJtSGFsZGptcExWTFV6RVcvNTBNc1V2K0xaKzVGb1dzR0ZjSm5kcDhYNzB3RFh0K3M9 (accessed on 23 January 2026).
- Aguas Magallanes, S.A. Tarifas Vigentes. 2025. Available online: https://www.aguasmagallanes.cl/recursos-ama/Tarifas/TARIFA$12008022025.pdf (accessed on 23 January 2026).
- IRENA. Green Hydrogen Cost Reduction. 2020. Available online: https://www.irena.org/-/media/Files/IRENA/Agency/Publication/2020/Dec/IRENA_Green_hydrogen_cost_2020.pdf (accessed on 19 July 2026).
- CATF. Hydrogen Production via Electrolysis. 2023. Available online: https://cdn.catf.us/wp-content/uploads/2023/11/21103902/hydrogen-production-electrolysis.pdf (accessed on 19 July 2026).
- Cacciuttolo, C.; Guzmán, V.; Catriñir, P. Renewable Solar Energy Facilities in South America—The Road to a Low-Carbon Sustainable Energy Matrix: A Systematic Review. Energies 2024, 17, 5532. [Google Scholar] [CrossRef] [Scilit]
- Polo, J. Hybrid Wind—Solar Generation and Analysis for Iberian Peninsula: A Case Study. Energies 2025, 18, 3966. [Google Scholar] [CrossRef] [Scilit]
- Khan, M.H.A.; Heywood, P.; Kuswara, A.; Daiyan, R.; MacGill, I.; Amal, R. An integrated framework of open-source tools for designing and evaluating green hydrogen production opportunities. Commun. Earth Environ. 2022, 3, 309. [Google Scholar] [CrossRef] [Scilit]

Disclaimer/Publisher’s Note: The statements, opinions and data contained in all publications are solely those of the individual author(s) and contributor(s) and not of MDPI and/or the editor(s). MDPI and/or the editor(s) disclaim responsibility for any injury to people or property resulting from any ideas, methods, instructions or products referred to in the content. |
© 2026 by the authors. Licensee MDPI, Basel, Switzerland. This article is an open access article distributed under the terms and conditions of the Creative Commons Attribution (CC BY) license.