


Highlights
What are the main findings?
- Carbon–zeolite materials derived from agri-food by-products are prepared via carbonization, characterized using BET, XRD, and XPS analysis methods, and exhibit satisfactory dye adsorption capacity, contributing to the remediation of aqueous and industrial media.
- Various parameters, i.e., pH, temperature, contact time, the adsorbent to adsorbate ratio, and the initial adsorbate concentration, play a significant role in dye adsorption.
- Converting agro-food by-products into high-value water remediation filters enhances biorefinery economics and reduces industrial disposal costs, thereby improving commercial viability and sustainability.
- Carbon–zeolite adsorbents serve as carriers for the release of bioactive C-phycocyanin into foods, enhancing their antioxidant properties and color.
Abstract
The production of carbonaceous materials from agro-food byproducts, i.e., olive stone and molasses alone or in combination with aluminosilicate minerals, i.e., zeolite, was investigated. Two different dyes, i.e., methylene blue (MB) and C-phycocyanin (C-PhC) contained in Spirulina extract, were used for the examination of the adsorptive properties of the materials. The combination of the Brunauer–Emmett–Teller surface area, X-ray diffraction, and X-ray photoelectron spectroscopy provides a comprehensive profile of composite sorbents. Several key factors, including initial dye concentration, pH, contact time, temperature, and sorbent, were investigated. All the produced adsorbents have shown a highly disordered carbon structure with specific surface areas between 16 and 1211 m2/g. The elemental composition analysis revealed the presence of C-C, C-H, C-O, C=O, O-C=O, and (CO3)2− bonds during high-resolution C1s and O1s deconvolution and detected the elements Al, Si, Na, Ca, K, Na, and S, confirming the aluminosilicate framework of the zeolitic structure of the materials. The examined conditions showed the best MB and C-PhC adsorption results at pH 8, temperatures of 50 °C and 40 °C, respectively, an initial concentration of 0.5 mg/L for MB and 32 mg/L for Spirulina extract (SE), and a sorbent dosage of 2.0 g/L C/MB or SE solution. The adsorbents produced were applied to the removal of C-PhC from industrial waste. To conclude, this research underscores the viability and high efficiency of repurposing agricultural waste into carbonaceous composite sorbents to eliminate dyes from wastewater.
1. Introduction
The global food industry generates significant quantities of agricultural and processing wastes and by-products each year. Managing these surplus materials efficiently remains a key environmental and economic challenge across the sector [1]. On average, 3 million tons of olive oil are produced worldwide each year, with the EU being the largest consumer, accounting for approximately 1.5 million tons (50% of global production) [2].
Olive oil extraction leads to the production of a wide range of agro-industrial residues, such as olive stones, oil cake, and olive mill wastewater, which become significant pollutants and cause harmful impacts on the environment and ecosystems when discharged without prior treatment. More specifically, olive industry by-products present high values of chemical oxygen demand (COD, up to 200–220 gL−1) and biochemical oxygen demand (BOD, up to 100 gL−1), low pH (around 4 to 5) and high phenolic concentration [3,4]. Another quite polluting agri-food industry is the sugar industry. Sugarcane, from which sugar is mainly produced [5], produces more than 279 million tons of solid and liquid waste and by-products annually worldwide during its processing. The unrestricted discharge of wastewater and solid residues from the sugar industry can lead to serious environmental impacts [6]. Their high organic load and the rapid rate of decomposition trigger the release of significant amounts of ammonia and heat, which inhibits plant organisms’ growth [5]. In addition, sugar-generated effluents discharged to aquatic ecosystems tend to adsorb most of the available oxygen, depriving the aquatic organisms and leading to their death [7].
Furthermore, synthetic dyes, such as methylene blue (MB), are widely used in a broad range of industrial applications (food, plastics, textiles, paper, pharmaceuticals, cosmetics), with an average global production of 7 million metric tons per year. The high concentration of such organic pollutants and waste poses a serious threat to both the environment and human health [8]. To address this high accumulation of toxic industrial wastewater in ecosystems, a wide range of treatment processes and methods have already been implemented, including, among others, photocatalytic degradation, enhanced micellar ultrafiltration, and adsorption [9,10,11]. Specifically, synthetic dyes exhibit high resistance to conventional wastewater treatment methods due to their low biodegradability and exceptional stability against light, temperature, and chemical or microbial degradation [11,12,13,14]. Among other methods, adsorption techniques appear to be among the most environmentally friendly, low-cost, easy-to-implement, and effective methods [9,11,12,15,16].
Activated carbons demonstrate important adsorptive characteristics, such as large specific surface area, chemical stability, low density, variety of structural forms, the ability to modify the pore structures and suitability for large-scale production. Thus, activated carbons are rendered suitable and are a popular choice for wastewater purification [10]. Additionally, characteristics such as pore volume, pore size distribution and surface functional groups determine the interactions between adsorbents and adsorbed substances at the interface. Güzel et al. [17] mentioned that the use of tomato paste waste impregnated with zinc chloride prepared a novel nanoporous carbon (TWNC) for the effective removal of cationic Crystal Violet dye (CV) from industrial wastewater. The maximum adsorption capacity was found to be 68.97 mg g−1 at 50 °C and increased with increasing temperature. Vunain and Biswick [18] studied the removal of methylene blue (MB) from aqueous solution with activated carbon derived from Baobab fruit shell (BFS). The optimal activation temperature was 700 °C and the optimal pH was 9. The equilibrium was reached within 60 min. The maximum adsorption capacity of MB dye was approximately 334.45 mg/g. Valix et al. [19] prepared activated carbon by low-temperature carbonization with physical activation of high-ash raw bagasse for acid dye adsorption. The maximum adsorption capacity of acid blue dye of activated carbon prepared from bagasse is high (up to 391 mg g−1 carbon) compared to commercially available carbon, despite the high ash content of the final carbon (61% w/w). The adsorption of safranin-T from wastewater using activated carbon derived from waste rice husks was achieved with an adsorbent capacity of 3.183 mol g−1 at 40 °C, with an initial dye concentration of 50 mM [20]. The removal of methylene blue (MB) from an aqueous medium was investigated using zinc hydroxide nanoparticles that were synthesized and loaded onto activated carbon prepared from cherry wood (Zn(OH)2-NPs-AC). Optimal operating conditions were determined for MB concentration (12.5 mgL−1), pH (6), adsorbent mass (0.025 g), and ultrasonication time (6.5 min) [21]. A carbon nanotube material enriched with La and Ca species (La-Ca-CNT) was produced for the removal of hexavalent chromium and phosphate ions from aqueous solutions [22]. The results have shown that phosphate ions were removed through physical–chemical adsorption, while Cr(VI) reduction occurred via H2O2 derived from CaO2 or directly through the CaO2 surface.
Previous studies have used activated carbon derived from agro-food industry by-products without adding minerals as a matrix to enhance their adsorptive properties. Clinoptilolite is one of the most abundant zeolites in Greece with excellent properties combining high surface area and porosity with ion exchange capacity. The zeolitic structure comprises a three-dimensional framework of interconnected (SiO4)4− and (AlO4)5− tetrahedra, linked together through shared oxygen atoms. Clinoptilolite has a Si/Al ratio equal to 2.1 up to 5.3, which renders stable mineral under extreme conditions, like carbonization temperature. Finally, minerals are low-cost, recyclable and natural materials [23,24]. Zeolite fiber catalysts [25] with a range of pores and active sites were prepared via solid transformation. The adsorbents achieved high methylene blue removal (around 99%) with the application of response surface morphology while molecular dynamics simulations have shown high pollutant diffusivity factors, low adsorption energy of the pollutants, and strong reactive oxygen species generation leading to high tetracycline degradation from water bodies. The combination of a zeolitic matrix with activated carbons derived from agricultural by-products leads to the production of novel materials with unique properties that have not previously been investigated.
The blue-green Spirulina (Limnospira platensis or Arthrospira platensis) belongs to the group of microalgae. The term “algae” encompasses three different categories of organisms: cyanobacteria, eukaryotic microalgae, and macroalgae. More specifically, Arthrospira platensis is described in the literature as both a microalga and a cyanobacterium [26]. The common characteristic among these three groups is that they are mainly found in marine ecosystems and that they can photosynthesize [27]. Historically, Spirulina has been cultivated through the years by many different civilizations, like Maya, Indians, Aztecs and others. Spirulina thrives primarily in saline, alkaline lakes situated within tropical and subtropical areas, across Asia, Africa, and Central and South America. [28]. In recent years Spirulina and Spirulina-derived products have gained great recognition due to their valuable properties with annual production exceeding 3000 tons on a dry basis [26,29,30]. Among various nutrients that are present in Spirulina, C-phycocyanin has attracted considerable interest. Phycocyanin is a phycobiliprotein that gives Spirulina its green-blue color and is responsible for the photosynthetic process [26,27]. Recently rising health concerns about synthetic additives, like dyes and colorants in food and beverages, cosmetics and pharmaceuticals, have led to higher demands for natural alternatives. Phycocyanin and other phycobiliproteins can serve this purpose as they can be used in a wide range of products as a healthier option. In addition, these natural compounds can offer more than a brilliant blue color in the products that is added. They are also characterized by strong antioxidant and inflammatory activity, contributing to preventing chronic diseases [26,27,29,30,31]. Activated carbons are used for the purification of the extracted phycocyanin [29,32].
C-phycocyanin (a natural algal protein) and methylene blue (a synthetic dye) are both powerful blue compounds with overlapping antioxidant and photodynamic applications. However, they differ fundamentally, since C-phycocyanin is a non-toxic, natural nutrient with fluorescent properties, high production cost, and low stability, whereas methylene blue is a cationic, potent, fast-acting synthetic dye that can act as a potent mitochondrial booster, has fast tissue penetration, broad antimicrobial and antifungal properties, toxicity risks at high doses, and dangerous drug interactions requiring strict medical supervision [16,28].
In the past, similar work has been conducted using activated carbon and zeolite materials, and their properties have been studied in relation to dyes such as methylene blue [33]. However, there are significant differences with the present study, such as: 1. Commercially available activated carbon is examined for the first time in relation to previous studies. 2. The zeolite used in the carbon–zeolite materials has a different particle size (2 mm in diameter) and is used as a dietary supplement for animals. The zeolite used in the previous study was in powder form and was purer—and therefore more expensive—than the one used in the current study. 3. The carbonaceous material from olive pomace molasses was obtained from different time periods compared to that used in the previous study. 4. A different pyrolysis program was applied to the materials produced in this study, with a lower temperature rate and increased residual time at each temperature compared to those in the previous study. 5. This study examined parameters that were not studied previously, e.g., the effect of pH, temperature, initial dye concentration, and the ratio of carbon content versus dye concentration. From the above, we conclude that the materials produced are completely different from those developed in the previous study.
Zeolite-carbon materials are synthesized by infiltrating carbon precursors into the uniform pore network of zeolite structures, followed by carbonization or hydrothermal treatment. The resulting carbon materials exhibit a well-defined microporous structure, high specific surface area, and three-dimensional connectivity—characteristics inherited from the zeolite template. The zeolite-carbon composite material combines the high ionic selectivity of zeolites with the large surface area, electrical conductivity, and moisture resistance of carbon, overcoming the individual drawbacks associated with using either material alone. In the literature, the combination of carbons with zeolites often refers to commercial materials, either carbon or zeolite [34], or to different types of zeolites [35] or carbon [36] compared to those used in the present study. The synthetic material of zeolite-carbon consists of carbon that was produced from agri-food by-products such as olive stone and molasses, upcycling waste into high-value porous materials. The combination of the two different agricultural by-products, which have undergone processing with a specific carbonization temperature program, and clinoptilolite as a zeolite is being used for the first time to produce carbon–zeolite materials. This practice reduces disposal costs and environmental pollution, replaces expensive fossil-fuel precursors like coal, and creates efficient, renewable adsorbents for water purification, gas separation, and carbon capture. There are limited studies concerning the preparation of carbon–zeolite materials from agri-food by-products [33], whereas carbons of such origin are often used independently of zeolites. The entire process of carbonizing raw agri-food by-products with zeolite facilitates the incorporation of the resulting carbon into various sites within the zeolite’s three-dimensional framework, thereby increasing microporosity, preserving the ion exchange capacity of zeolites and enhancing the materials’ adsorption properties compared to carbons of agri-food origin without zeolite. Synthetic materials can effectively remove heavy metal ions and organic contaminants through combined ion exchange and surface adsorption.
The scope of the present study is the production of carbon–clinoptilolite materials in different proportions, their characterization through Brunauer–Emmett–Teller (BET), X-ray Diffraction (XRD), and X-ray Photoelectron Spectroscopy (XPS) analysis, and the examination of their adsorption properties for two dyes, i.e., methylene blue (MB), a synthetic chemical structure dye, and C-phycocyanin (C-PhC), a water-soluble pigment-protein complex found in algae like Spirulina. Different factors were investigated such as pH, temperature, contact time, initial concentration, and ratio of adsorbent to adsorbate. Finally, the optimal conditions of adsorbents were employed in the food industry to remove C-PhC from wastewater.
2. Materials and Methods
2.1. Materials
The raw materials of the study consist of olive stone, zeolite, and molasses. Olive stone was obtained from a local olive industry as a by-product of the olive oil process, while sugar molasses was bought from a local market. Fytro sugar cane molasses is a thick, dark, and nutritious syrup that is a natural by-product of refining sugarcane into white table sugar, rich in iron, potassium, calcium, and magnesium. It can be consumed as part of a varied, balanced diet and healthy lifestyle. Zeolite was obtained from a local shop of agricultural products. Its characteristics are the ground form, i.e., 2 mm in diameter, as it is used as a supplement in animal feed. Pure methylene blue was bought from Merc Industry (Amarousio, Greece) while Spirulina powder was bought from VitaMondo (Tampere, Finland). Spirulina is a well-known and widespread microalga that is used extensively in food production and dietary supplements [37]. It can be characterized as a superfood due to its rich content in proteins and essential amino acids, fatty acids, numerous vitamins, minerals, and pigments, including chlorophylls and carotenoids. Phycobiliproteins, such as phycocyanin, are the water-soluble and pigmented proteins extracted from Spirulina [38,39]. C-phycocyanin is the most abundant pigmented protein in Spirulina, constituting up to 20% of its dry weight, which yields a vibrant, fluorescent blue color. In the experiment, three different adsorbents were prepared: 80/20 w/w zeolite (Z)/olive stone (OS), 80/10/10 w/w zeolite (Z)/olive stone (OS)/molasses (ML) and 50/50 w/w olive stone (OS)/molasses (ML). Commercial carbon (CM) was also used for comparison reasons (charcoal activated, granulated 1–4 mm, Labbox Labware S.L., Barcelona, Spain). Commercial carbon derives from the following raw materials, e.g., coconut shell, coal (bituminous or lignin), wood or petroleum coke. The moisture content of the three mixtures was determined following the ISO 11465/1993 standard [40]. Additionally, the ash content was quantified via dry ashing, in accordance with the method described by John and Case [41,42]. The European Standard EN15148-2009 [43] was used for the determination of volatile matter. Fixed carbon content was later estimated by the difference. Then, the specimens underwent a carbonization process. The samples were positioned inside ceramic crucibles and introduced into a horizontal pyrolysis oven, where a continuous flow of nitrogen was maintained at a rate of 330 mL/min. The carbonization thermal program was executed in four sequential stages, utilizing a constant heating rate of 5 °C/min and a 30 min isothermal dwelling time at each plateau. The temperature was first increased to 300 °C, maintained for 30 min, and then raised to 500 °C for another 30 min hold. Following this, the sample was heated to 700 °C (30 min hold) before finally reaching a peak carbonization temperature of 800 °C, where it was held stable for a final 30 min. The materials were weighed before and after the carbonization process. The final carbonized products were characterized as Z80OS20C, Z80OS10ML10C, and OS50ML50C for the proportions of 80/20 Z/OS, 80/10/10 Z/OS/ML and 50/50 OS/ML, w/w, respectively.
2.2. Characterization of the Adsorbents
The materials were characterized by X-ray diffraction analysis. A Rigaku Smart Lab Diffractometer (Rigaku SmartLab, Neu-Isenburg, Germany) with Cu-Ka radiation was used. Data collection was performed using θ/2θ scans across an angular range of 2.0–55.0°. The measurement was executed with a step size of 0.03° and a dwell time of 0.3 s/step.
Surface chemical analysis was performed using a Proven-X Near Ambient Pressure X-ray Photoelectron Spectroscopy (NAP-XPS) system (Specs GmbH, Berlin, Germany) equipped with monochromatic Al Kα radiation (1486.6 eV). All the samples were analyzed under ultra-high vacuum conditions (≤5 × 10⁻⁹ mbar). Data analysis and fitting were performed with CasaXPS software (Ver. 2.3.26PR1.0), after Shirley background subtraction. In all measurements, the C1s binding energy at 284.8 ± 0.1 eV was used as a reference for the binding energy scale.
A TriStar II Plus analyzer (Micromeritics Instrument Corporation, Norcross, GA, USA) was utilized to determine the specific surface area and porosity characteristics of the prepared adsorbents. Helium and nitrogen were employed as carrier gases. Prior to analysis, the samples were weighed, placed in a sample container on the analyzer, and degassed individually for 24 h at 400 °C. The samples’ weights varied from 0.13 to 0.29 g, i.e., CM (0.14 g), Z80OS20C (0.29 g), Z80OS10ML10C (0.29 g), and OS50ML50C (0.13 g). Subsequently, the samples were allowed to cool and were stored under a nitrogen atmosphere at a pressure of 5 mmHg for 24 h. The specific surface area, pore volume, and pore diameter of the resulting materials were evaluated via N2 adsorption–desorption isotherms at −196 °C using the Brunauer–Emmett–Teller (BET) method. Additionally, the micropore volume was determined using the t-plot method, while the pore size distribution was calculated using the Barrett–Joyner–Halenda (BJH) model [44].
2.3. Key Factors Affecting the Adsorption Process of MB and C-PhC
2.3.1. Influence of pH
0.01 g of carbon is mixed with 15 mL of MB at a concentration of 1.0 mg/L or 15 mL of Spirulina extract at a concentration of 32.0 mg/L at different pH values of 3, 8, and 10. The pH of the solutions is adjusted by adding 0.1 M sulfuric acid (H2SO4) and/or 0.1 M sodium hydroxide (NaOH). The pH is measured using a pH meter. The solutions are agitated on an incubator shaker at 180 rpm for 24 h at ambient temperature, then transferred to 25 mL plastic Falcon tubes and centrifuged at 9000 rpm for 3 min. Subsequently, the absorbance of the solutions was measured at selected wavelengths, i.e., 664 for MB and 620 and 652 nm for C-PhC, respectively, using a UV-1900i spectrophotometer (Shimadzu Corporation, Santa Clara, CA, USA) [45,46]. The concentration of C-PhC can be calculated according to the equation:
The purity of C-PhC was calculated spectrophotometrically using the absorbance ratio at 620 nm and 280 nm [45], according to the equation:
Purity = A620/A280
The results are expressed as the percentage of dye adsorption and as the amount of dye adsorbed (mg) per g of carbon as a function of time. The amount of MB or C-PhC adsorbed onto the carbon (qt) was calculated by subtracting the residual dye quantity in the solution at specified time intervals from the initial dye quantity (qo). The corresponding mathematical expressions are as follows:
where qt is the adsorbed amount of dye per unit mass of adsorbent in mg/g; Co is the initial dye concentration in mg/L; Ct is the dye concentration in the solution after time, t, expressed as mg/L; V is the dye volume in L; and m is the mass of adsorbent. The procedure is repeated three times.
2.3.2. Influence of Temperature
A 15 mL solution of the MB dye at a concentration of 1.0 mg/L or of the Spirulina extract at a concentration of 32.0 mg/L is placed in a 25 mL Falcon tube with carbon at a carbon/dye solution ratio of 0.67 g/L. Then, the mixture is stirred using an incubation shaking table at 180 rpm. At regular intervals, centrifugation is carried out at 9000 rpm for 3 min and then the absorbance in the solution is measured with a spectrophotometer. The experiments are carried out at three different temperatures of 30, 40 and 50 °C. The percentage adsorption of the dye and the adsorption of the dye (mg) per g of carbon are measured at regular intervals. The procedure is repeated three times.
2.3.3. Influence of Initial Dye Concentration
Solutions of methylene blue (MB) dye of 0.5, 1.0 and 2.0 mg/L concentrations and Spirulina extract of 32.0, 70.0 and 90.0 mg/L concentrations, respectively, were prepared. An amount of each dye concentration was placed in plastic Falcon tubes together with a quantity of carbon, such that the carbon/adsorbent ratio was equal to 0.67 g/L. The solutions are stirred on an incubator shaker at 180 rpm. At different time intervals, they are centrifuged at 9000 rpm for 3 min and then placed in the spectrophotometer for measurement of absorbance at wavelengths of 664 for MB and 620 and 652 nm for C-PhC, respectively. The percentage absorption of the MB and C-PhC dyes is measured and the amount of dye absorbed per amount of adsorbent material versus time is also determined for the different dye concentrations.
2.3.4. Influence of the Ratio of Carbon Mass to Dye Volume
A methylene blue dye solution or Spirulina extract solution at concentrations of 1.0 and 32.0 mg/L, respectively, was prepared in polyethylene plastic bottles, and then a proportion of 0.67, 1.33, and 2.00 g/L of carbon per solution was added to Falcon tubes. The process is carried out by stirring on an incubator shaker at 180 rpm. At different time intervals, the samples are centrifuged at 9000 rpm for 3 min and the concentration of the dyes (MB and C-PhC) in the solution is measured using a spectrophotometer. The adsorption percentage of the dye and the adsorption of the dye (mg) per g of carbon as a function of time are determined. The process is repeated three times.
2.4. Removal of C-PhC from Industrial Wastewater
Liquid waste from a blue honey industry was collected in Polytetrafluoroethylene (PTFE) plastic bottles and transported to the laboratory immediately after sampling and stored at −18 °C in a freezer. Subsequently, 56 mg of waste was placed in a 100 mL beaker where a corresponding volume of deionized water was added and followed by stirring for 5 min at 400 rpm. Centrifugation at 9000 rpm for 10 min is performed, followed by extraction. The pH is adjusted to 8 with 0.1 M H2SO4 and/or 0.1 M NaOH solutions. The initial C-PhC concentration was equal to 8.84 mg/L. Then, 15 mL of each sample are transferred to a Falcon bottle with an appropriate amount of carbon so that the carbon/solution ratio is 2.0 g/L and then, the samples are placed on a shaking table, impregnated with the waste at 40 °C. At regular intervals, the samples are centrifuged at 9000 rpm for 3 min and the concentration of the dye in the solution is measured using a spectrophotometer. The adsorption percentage of the dye as a function of time is determined. The procedure is repeated three times. The selection of the pH adjustment, the temperature and the carbon/solution ratio is made after finding the best adsorption conditions for the four materials from Section 2.3.1, Section 2.3.2, Section 2.3.3 and Section 2.3.4.
3. Results and Discussion
3.1. Influence of the Process on the Production of the Samples
The percentage of moisture content in the samples was calculated using the equation given below:
where W1 is the initial weight of the samples before drying; W2 is the final weight of the samples after different hours in the dryer. The moisture content of the produced materials is shown in Figure 1.
Figure 1.
Moisture content of the different samples (Z80OS20C, Z80OS10ML10C, and OS50ML50C).
It was observed that, over time from 3 to 9 h, the humidity remained constant. After 10 h, a small increase is observed due to the preservation of the sample for many hours in the dryer. It is also evident that the OS50ML50C sample has the highest moisture content (between 10.50 and 11.28%) compared to the Z80OS20C and Z80OS10ML10C samples due to the lack of zeolite and its content in lignocellulosic materials.
The ash content and volatile compound contents of the samples were calculated using the equations given below:
where WO1 is the initial weight of the samples before the oven; WO2 is the final weight of the samples after their extraction from the oven. The ash content and volatile compounds are expressed on a dry basis (%dry base, %db). The remaining amount after the removal of volatiles and ash is characterized as fixed carbon (Table 1).
Table 1.
Proximate analysis results (wt%, db) of the samples: Z80OS20C, Z80OS10ML10C, and OS50ML50C.
Based on the above table, it is concluded that Z80OS10ML10C, with a content of 80% zeolite, has the lowest content of volatile components and the highest ash content, due to the greater amount of zeolite it contains compared to OS50ML50C. Zeolite decomposes above 900 °C and at a temperature of 550 °C it loses only its moisture content. Z80OS20C exhibits a similar behavior due to the same proportion of zeolite. OS50ML50C has the highest content of volatile components while it has the lowest ash content, compared to samples Z80OS20C and Z80OS10ML10C due to the lack of zeolite.
By comparing the present samples with the carbonaceous adsorbents of a previous publication [33], it can be concluded that the moisture content shows similarities presenting a higher percentage in lignocellulosic materials such as OS50ML50C compared to carbon–zeolite materials. Similar ash content values represent the inorganic substances that remain after the combustion of the samples; however, the percentage of volatile compounds is higher in the present study due to greater degradation of organic compounds. The differences in the volatile compounds can be explained by the different content of organic compounds in the raw materials, i.e., olive stone and molasses between the two studies and the different particle sizes of the zeolitic matrix (2 mm in diameter of granules instead of powder). Zeolite particle dimensions influence space and mass-transport phenomena, showing how the final carbon material performs as an adsorbent. Volatile gaseous molecules (e.g., hydrocarbons) encounter less structural resistance and diffuse out of the framework much faster at carbon–zeolite materials with granules of 2 mm in diameter instead of powder. The higher external surface area of powder zeolite compared to zeolite with granules ameliorates the active surface contact of carbon to zeolite, acting as a catalytic medium, leading to the complete combustion of volatiles to carbon dioxide and water. The 2 mm granular zeolitic structure allows these unreacted volatiles to escape the heat zone before they can be completely oxidized, resulting in higher volatile measurements [47].
The moisture, ash and volatile matter content of the materials directly dictate the material’s surface area, pore structure, and adsorption efficiency. Moisture plays an important role since water molecules can occupy pore space or block the pore structure, reducing the adsorption activity. High-performance carbons are sealed airtight before their use to avoid water absorption from the air. Moreover, moisture promotes the growth of microorganisms, leading to the degradation of agri-food raw materials during storage. Ash content represents the impurities of each adsorbent that can clog the micro and mesopore space of the adsorbents. Furthermore, they can cause catalytic side reactions with the liquids, or they can create a hydrophilic carbon surface influencing its affinity for organic pollutants. The appropriate removal of volatile matter produces a stable, rigid carbon skeleton with an extended pore structure. Finally, volatile matter is an indicator for the optimization of the process, altering activation parameters such as temperature and time to ameliorate carbon structure [48,49].
Based on Figure 2, the OS50ML50C sample shows the highest weight loss percentage (77.3%) in contrast to the Z80OS10ML10C sample which shows the lowest weight loss percentage (24.7%). Finally, the sample Z80OS20C shows intermediate weight loss values (28.9%). In conclusion, it is observed that the samples containing zeolite (Z80OS20C and Z80OS10ML10C) do not have a high weight loss because only the moisture content is removed since zeolite decomposes at higher temperatures (>900 °C). Mahapatra et al. [50], concluded that 300 °C is the optimal temperature for the creation of activated carbon from food industry sludge, while in our study the temperature reaches 800 °C. Hoang et al. [51], studied activated carbons prepared from Okara powder waste, where the samples were inserted in a tubular furnace with N2 as an inert gas and they were carbonized at 600 °C for 1 h with a heating rate of 3 °C/min. In our study the samples we created were carbonized at 800 °C for 30 min with a heating rate of 5 °C/min. The highest weight loss percentages of the materials, e.g., OS50ML50C, Z80OS20C, compared to the corresponding materials of a previous study [33], can be explained by the lower heating rates of 5 °C/min compared to 10 °C/min, allowing the materials the time to degrade efficiently especially between 300 and 500 °C.
Figure 2.
Percentage weight loss of carbonized samples.
3.2. Materials Characterization
According to the XRD pattern (Figure 3), the diffraction peaks at specific 2θ angles, notably around 10.04, 11.09, 21.56, 22.64, 26.12, 30.17 for Z80OS10ML10C and 7.25, 10.04, 11.09, 21.89, 22.64, 26.09, 30.20 for Z80OS20C, respectively correspond to clinoptilolite using Cu-Kα radiation [52]. Two broad asymmetric peaks were observed in the diffraction pattern of carbonaceous materials of lignocellulosic origin (OS50ML50C and CM) between 25° and 30° angles and between 42° and 45° angles. These broad peaks indicate a highly disordered carbon structure and a mostly amorphous arrangement. Similar broad peaks are also present in the other two materials, i.e., Z80OS10ML10C and Z80OS20C, but with lower intensity than that of OS50ML50C and CM, due to the low percentage of carbon derived from 20% w/w of lignocellulosic materials, either olive stone or olive stone and molasses [53,54].
Figure 3.
XRD analysis of the four samples.
Additionally, several sharp peaks of CM (20.48°, 28.76°, 34.61°, 41.75°, 42.77°) are also clearly seen in the pattern, indicating another crystalline phase that could be identified as KAlSiO4 [55]. Please see also Figure S1, where SEM-EDS analysis confirms the presence of elements such as K, Si, Al and oxygen. Moreover, the peaks at 28.76° for CM material and between 27° and 29° for the other materials (28.37° for OS50ML50C, 27.83° for Z80OS10ML10C and 28.28° for Z80OS20C) correspond to amorphous or disordered carbons (often derived from biomass, polymer precursors, or chars) and can be related to localized defects and heteroatom intercalations. The characteristic peak of 22.28° of CM usually indicates an average interlayer spacing (002) between short regions of parallel graphene sheets in a turbostratic carbon, with the peaks at 40.5° of CM and OS50ML50C to confirm such structures [56]. Except for the zeolitic structure and kalsilite, the sharp crystalline reflections correspond to mineralized ash residues. The intense peak 34.16° of OS50ML50C is frequently associated with the presence of secondary phases (such as mineral residues or catalysts) [57]. The intense peak at 29.4° in the OS50ML50C XRD pattern corresponds to the 104-crystal plane, and the secondary peaks around 36°, 39.4°, 43.1° and 48.5° belongs to calcite. Peaks observed at 36.3° and 37.0° are highly characteristic of a small amount of residual calcium carbonate and calcite impurities [58]. The main peak at 26.6° corresponding to the 101-crystal plane and the secondary peaks at 32.4° and 35.6° belong to quartz, the most common natural impurity found in clinoptilolite [59]. As far as the peaks at 31.28° and 31.34° may concern, they typically indicate the presence of mineral impurities (like potassium compounds or carbonates from the biomass).
The XPS survey spectra of commercial carbon, Z80OS20C, Z80OS10ML10C, and OS50ML50C are presented in Figure 4. The wide-scan spectrum confirms the elemental composition of the surface, showing characteristic core-level peaks for C, O, Ca, Si, and Al. High resolution spectra were obtained to detect elements of S and Na for comparison/confirmation with the results of other techniques. The presence of prominent Si, Al, Ca, and Na peaks across samples (b) and (c) reflects the aluminosilicate/silicate matrix chemistry of these materials.
Figure 4.
XPS wide-scan spectrum of the four materials: (a) Com. Carbon, (b) Z80OS20C, (c) Z80OS10ML10C, (d) OS50ML50C.
The C1s spectrum of commercial carbon (Figure 5a) exhibited a distinct C1s (~285 eV) peak, along with a weaker K2p (~294 eV) peak, which was resolved into seven components corresponding to C-C/C-H (284.8 eV), C-O (286.2 eV), C=O (287.7 eV), O-C=O (288.6 eV), and (CO3)2− (≥290.0 eV) bonds. The presence of potassium was confirmed by the characteristic doublet of the K2p core level. The main K2p3/2 peak was located at 293.4 eV, while the companion K2p1/2 peak appeared at 296.2 eV. The energy difference (spin–orbit splitting) between the two peaks was calculated to be 2.8 eV. The presence of these peaks in the higher energy region relative to the C1s spectrum allows for the clear separation of potassium from the carbon components, confirming the existence of stable ionic potassium (K+) species [60].
Figure 5.
XPS spectra of the commercial carbon: (a) C1s and (b) O1s.
The O1s spectrum (Figure 5b) is located at 533.6 eV and exhibits a broad and asymmetric profile (531–537 eV), suggesting a complex chemical environment. Due to the significant overlap between the organic oxygen groups of carbon and the inorganic oxygen bound to the sodium, potassium and sulfur salts, quantification of individual bonds is uncertain.
To ensure consistency, the same constraints and line shape were maintained for the fitting of all C1s spectra (Figure 6b–d), revealing a shift of 0.9 eV to higher binding energy (from 293.4 eV to 294.3 eV) for the K2p peaks in samples (b) Z80OS20C and (c) Z80OS10ML10C (Figure 6a). This BE displacement in peak position is primarily ascribed to charging effects occurring within the heterogeneous composite matrix. Since no charge-neutralizing flood gun was utilized, the highly insulating aluminosilicate/silicate domains (Al2O3 and SiO2) localized positive electrical charge under X-ray illumination, thus retarding the emitted photoelectrons from matrix-bound elements (K and Ca), while the conductive carbon framework remained successfully grounded and unaffected. However, alternative electronic factors cannot be completely ruled out and may simultaneously contribute to these shifts. These include genuine chemical modifications in the local coordination environment of the aluminosilicate framework or interfacial electronic interactions (such as local dipole formations) at the boundaries between the carbon and zeolitic phases.
Figure 6.
XPS spectra of C1s. (a) comparative normalized C1s graph between materials spectra (b) Z80OS20C, (c) Z80OS10ML10C, (d) OS50ML50C.
The O1s spectra (Figure 7b–d) do not show any noticeable shift in binding energy, while the width remains quite large. This extended width reflects the high chemical heterogeneity of the surface, as oxygen participates simultaneously in organic bonds with carbon and in ionic interactions with metals (Na, K, Ca), forming a network of overlapping chemical states. The O1s peak intensity increases for samples (b) Z80OS20C and (c) Z80OS10ML10C due to the presence of aluminum, silicon, and calcium oxides.
Figure 7.
XPS spectra of the O1s. (a) O1s spectra of all samples; (b) Z80OS20C; (c) Z80OS10ML10C; (d) OS50ML50C.
Figure 8 displays the comparative high-resolution XPS core-level spectra of (a) Al2p, (b) Si2p, (c) Na1s and (d) S2p, providing detailed interpretation of the structural framework. The Al2p (Figure 8a) and Si2p (Figure 8b) spectra in samples Z80OS20C and Z80OS10ML10C show intense, symmetric peaks at 75.6 eV (Al3+) and 104.3 eV (Si4+) respectively. These high BE values confirm the framework configuration of the aluminosilicate network [61,62,63]. The Na1s (Figure 8c) core-level spectra display a broad peak at 1073.5 eV assigned to ionic sodium (Na+) [61]. S2p peak (Figure 8d) is located at ~171.0 eV for the commercial carbon and OS50ML50C, associated with standard metal sulfate species (SO42−) [64].
Figure 8.
Comparative high-resolution XPS spectra of (a) Al2p, (b) Si2p, (c) Na1s, and (d) S2p.
High-resolution XPS core-level spectra revealed the presence of Ca in three out of the four samples (Figure 9a). Detailed analysis of the Ca2p core-level spectra (Figure 9b–d) confirmed the existence of two distinct chemical environments across the samples. Τhe Ca2p spectra were fitted using spin–orbit doublets (Ca2p3/2 and Ca2p1/2) with a fixed branching ratio of 2:1 and a spin–orbit splitting (ΔE) of 3.5 eV. For sample OS50ML50C (Figure 9d) the resolved Ca2p3/2 peaks were located at 348.4 eV and 350.8 eV (Ca2p1/2 appears at 351.9 eV and 354.3 eV). For samples Z80OS20C (Figure 9b) and Z80OS10ML10C (Figure 9c) a noticeable shift toward higher binding energies was observed due to the combination of matrix charging and chemical environmental factors. The two Ca2p components are shifted to 349.2 eV and 352.0 eV [64,65].
Figure 9.
XPS spectra of Ca2p. (a) Ca2p spectra of all samples, (b) Z80OS20C, (c) Z80OS10ML10C, (d) OS50ML50C.
The basic characteristics of the pore structure of the adsorbents are given in Table 2. Comparing the specific surface area (Sbet) of the materials, it seems that the increase in Sbet follows the order: CM > OS50ML50C > Z80OS20C > Z80OS10ML10C. It seems that the preparation of carbon–zeolite materials from clinoptilolite of higher granulometry and not from high-purity powder, negatively affects the porous network and the specific surface area of the materials in relation to earlier research [33]. The CM material with the highest specific surface area presents the highest total pore volume, micropore volume, and the lowest adsorption average pore diameter, equal to 22.09Å measured with the BET method and 32.37Å measured with the BJH method. The adsorption average pore width according to the BET methods shows that CM and OS50ML50C materials mainly exhibit pores with diameters in the range of 1.9–2.2 nm, where the pore sizes are predominantly microporous, while the carbon–zeolite materials present average pore diameters between 21 and 22 nm, indicating a mesoporous behavior according to IUPAC [66].
Table 2.
Characteristics of pore structure, i.e., SBET: specific surface area; Vtot: total pore volume; Vmicro: micropore volume; daver.p.d.: adsorption average pore diameter; dBJH,aver.p.d.: BJH adsorption average pore diameter.
The porous features of the adsorbents are analyzed using nitrogen isothermal adsorption/desorption measurements and pore size distributions (Figure 10). CM and OS50ML50C exhibited a typical type I isotherm with an H4 hysteresis loop, and its adsorption capacity increased significantly at low initial relative pressures, which is consistent with the isotherm properties of microporous materials [35,67]. These findings indicate that the pore structure of CM and OS50ML50C is largely microporous, which is consistent with the pore size distribution (Figure 10b) and the adsorption average pore diameter presented on Table 2. The carbon–zeolite materials show a type II adsorption isotherm with an H3 hysteresis loop, indicating mesopore structures [68]. Hysteresis occurs during desorption. The H3 hysteresis loop specifically indicates the presence of slit-shaped pores. This often arises from the aggregation of plate-like particles or loose, non-rigid networks (common in carbon materials like graphene sheets or exfoliated structures) rather than well-defined, cylindrical networks.
Figure 10.
(a) The N2 adsorption–desorption isotherm and (b) the pore size distribution (PSD) based on the BJH method for the prepared samples, where the arrows pointing up and to the left refer to the x-axis and the primary y-axis, while the arrows pointing up and to the right refer to the x-axis and the secondary y-axis.
Comparing CM with agri-food-based carbons, the following aspects should be mentioned: a. The raw materials of CM are hard, dense precursors with a high bulk density and mechanical strength. Carbons derived from agri-food waste are generally more brittle, have lower bulk density and their raw materials consist of cellulose, lignin, and hemicellulose. Cellulose is the main structural element of the framework, lignin imparts rigidity and mechanical stability, and hemicellulose functions as an amorphous interlocking matrix between them, exhibiting high susceptibility to chemical degradation [69]. These carbons tend to break down easily under physical stress, b. The carbonization and activation process of CM leads to the development of a dense, uniform network of micropores ideal for gas, organic compound, and heavy metal adsorption, while agro-based carbons are less effective at adsorbing pollutants without the widening and multiplying of pores that activation provides.
The XRD profile of CM and OS50ML50C reveals an amorphous highly, disordered carbon structure. This means the carbonization temperature was optimally tuned, breaking down the inherent biopolymers (cellulose, hemicellulose, and lignin) and releasing gases that create carbonaceous micropores [49]. The high-resolution C1s of XPS spectrum reveals a dominant, sharp, asymmetric peak at 285 eV, signifying a network of sp3-hybridized carbons (C-C, C-H). This structural carbon, a basic element of the carbon chain, provides the mechanical strength to support micro-mesoporous walls, preventing pore collapse under high capillary pressures. Furthermore, the two carbonaceous materials show distinct oxygenated surface functional groups (C-O, C=O) originating from their raw materials, which keep the pore entrances chemically open and accessible to liquid molecules. According to adsorption/desorption isotherms, the type I isotherm with H4 hysteresis in both carbons proves a highly developed, dense microporous network with uniform pore channels. BET analysis shows that the high specific surface area and the low mean pore diameter of the two materials, i.e., CM and OS50ML50C, reveal that the pore volume is highly concentrated in micropores, allowing uniform pore channels to maximize liquid adsorption [70].
On the contrary, the XRD pattern of the carbon–zeolite materials, i.e., Z80OL10ML10C and/or Z80OL20C, presents sharp crystalline reflections from the clinoptilolite matrix at 2θ 10 and 21.5°, while the amorphous carbon signal is mostly drowned out. Since zeolite is predominant to both materials, the material acts as a mineral block, while carbon produced after the carbonization process cannot create a uniform, continuous pore network. It acts either as a thin, disconnected coating, or it gets trapped inside the large gaps between the mineral crystals. The XPS pattern shows the presence of dominant aluminum (AL2p), silicon (Si2p), and oxygen (O1s) groups, proving that the surface chemistry is almost inorganic. The C1s of XPS spectrum reveals a low peak at 285 eV, signifying a network of sp3 hybridized carbons (C-C, C-H), which covers the zeolitic matrix. Moreover, alkali and alkaline earth cations (Na1s, K2p1/2, Ca2p), which exhibit in the zeolitic structure can migrate with ash residues after carbonization and settle at the pore structure, leading to a severe pore-blocking effect and locking nitrogen molecules out of the internal channels during the BET analysis. In conclusion, the specific surface area of carbon–zeolite materials are low enough and the adsorption is restricted to mesopores or multilayer condensation on the open external boundaries of the crystal aggregates (type II behavior) [70].
The high-surface-area carbons, i.e., CM and OS50ML50C, rely on pore filling and surface chemistry affinity based on surface hydrogen bonding and hydrophobic effects, while the high-zeolite composite, i.e., Z80OS10ML10C and Z80OS20C, relies on ion exchange, electrostatic forces, and macromolecular trapping [71,72]. According to Allawan et al. [73], a new zeolite/activated carbon (Zeo/AC) nanocomposite was prepared for the removal of the carcinogenic dyes Congo Red (CR) and Crystal Violet (CV). Dye removal was achieved via electrostatic attraction for the cationic CV, and via π–π stacking and pore filling for the anionic CR. The regeneration performance of the material was evaluated using four regeneration agents: HCl, NaOH, ethanol, and NaCl. Following dye adsorption, the adsorbent was reused in five adsorption–desorption cycles under optimized conditions (pH 7, 55 °C, 60 min); HCl was identified as the most suitable regeneration agent for CV removal, whereas NaOH proved effective for CR. Gabruś et al. [74] studied the adsorption of 1-hexene (HEX) and water (WV) vapors on zeolite and activated carbons. The adsorption mechanism of HEX vapor is characterized by physical physisorption and pore filling via strong intermolecular dispersion forces, while the WV adsorption exhibits weaker initial dispersion interactions, leading to progressive clustering and capillary condensation at higher relative humidities. Thermal regeneration at optimal temperatures of 120 °C for zeolite and 150 °C for activated carbons successfully allows the safe air-based recovery of 1-hexene. The regeneration degree for the zeolite reaches 75%, and the process is driven by physisorption with desorption energies of 51–63 kJ/mol.
3.3. Influence of pH Solution
The purity ratio was calculated at 2.26 according to eq. 1, indicating that Spirulina C-phycocyanin (C-PhC) extract is classified as cosmetic grade. The dependence of MB or C-PhC adsorption on carbonaceous materials as a function of solution pH was studied (Figure 11). The contact of MB or C-PhC solution with each carbonaceous material after 24 h, shows the highest MB or C-PhC adsorption on commercial charcoal for all pH values compared to all the other materials. More specifically, the materials’ adsorption follows the order (MB/C-PhC in mg/g): CM (1.48/2.50) > OS50ML50C (1.30/2.44) > Z80OS10ML10C (1.17/2.11) ≈ Z80OS20C (1.11/1.86) for pH 8, where they present the highest adsorption values compared to all the other pH values. Therefore, it seems that for all materials the best solution environment is the basic one, i.e., at pH = 8 for MB and for C-PhC, respectively.
Figure 11.
Effect of pH on the adsorption of (a) MB and (b) C-PhC by carbonaceous materials for an initial adsorbate concentration of 1.0 mg/L for MB and 32 mg/L for Spirulina extract, and an adsorbent/adsorbate ratio of 0.67 g/L w/v.
In another related study concerning the adsorption of MB with an initial concentration of 5 mg/L on activated carbons using zeolite and sugarcane, where the pH values varied from 3 to 10 and an adsorbent mass of 5 mg per 50 mL, the adsorption rates of the MB dye for pH 3, 5, 7, and 10 were 93, 95, 97, and 99.2%, respectively. pH 3 has the lowest adsorption due to the high mobility of H+ ions and the protonation of the adsorbent surface [75]. Also, the study by Sohrabnezhad & Pourahmad [76] shows that for activated carbon with mordenite nanocrystalline zeolite, as the pH increases from 3 to 9, the amount of adsorption increases. A similar study concerning sugar waste reports that pH affects the adsorption of the MB dye. More specifically, they studied the adsorption at pH values between 7 and 9 and it was found that the maximum adsorption occurred at pH 9 [7]. Hazzaa & Hussein [10] studied the effect of pH values (2–9) for activated carbon containing olive pomace. The results showed that it reached a maximum MB absorption of 9.5 mg/g at pH 5, which corresponds to a slightly acidic environment. In another study that investigated activated carbon with olive pomace, at pH 6.65 (neutral environment), a small increase in the adsorption of the MB dye was observed [12]. Yasin et al. [77] examined the adsorption for pH values from 1.5 to 12 obtained by adding sulfuric acid or sodium hydroxide, for treated or untreated activated carbons. The higher the pH value, and therefore the more alkaline the environment, the greater the adsorption of the MB dye, and this is achieved due to a decrease in electrostatic repulsion since the surface charge density also decreases. In the research of Wang et al. [78], for activated carbon with potassium citrate, it seems that pH affects the adsorption of the MB dye. The results showed that with the change in pH from 2 to 10, the adsorption of MB increased. The effect of pH on the adsorption of the methylene blue dye (MB) on activated carbon obtained by the chemical activation of caraway seeds concluded that the positive effect on adsorption capacity, i.e., an increase in the percentage absorption, is achieved at higher pH values (8–12) [79]. According to the literature [26], phycocyanin solutions in acidic environments exhibited lower absorbance at 620 nm and stronger absorbance at 280 nm compared to higher pH values, i.e., 5–7, and temperatures between 55 and 65 °C. This happens due to the precipitation of proteins, altering their confrontation. This phenomenon also explains the low adsorption percentage values of C-PhC at acidic conditions (pH 3) for all the materials. At extreme alkalinity (pH above 9.0), the tertiary and secondary structures of the protein begin to permanently unfold. This results in irreversible denaturation, loss of biological activity, and eventually protein precipitation or aggregation, resulting in a reduction in the c-phycocyanin adsorption percentage from the materials.
3.4. Influence of Temperature
The temperature effect on MB and C-PhC adsorption using carbon–zeolite composites was assessed and presented in Figure 12. The influence of temperature on the adsorption of MB on carbonaceous adsorbents varies according to the order: 323 K > 313 K > 303 K for carbonaceous adsorbents, i.e., commercial carbon (1.44 mg/g at 323 K) and olive stone-molasses (1.15 mg/g at 323 K) and 313 K > 323 K > 303 K for carbon–zeolite materials (0.94 mg/g for Z80OS20C and 1.03 mg/g for Z80OS10ML10C at 313K). On the contrary, the adsorption behavior of C-PhC on adsorbents shows that the best temperature for C-PhC removal is 313K for all materials (between 3.26 mg/g for Z80OS10ML10C, 3.43 mg/g for Z80OS20C, 3.62 mg/g for OS50ML50C, and 4.46 mg/g for CM). All carbon–zeolite materials appear to show an increase in organic substances’ adsorption from 303 to 313 K, but further increase in temperature, i.e., 323 K, reduces MB and C-PhC adsorption.
Figure 12.
Effect of temperature on the adsorption of (a) MB and (b) C-PhC by carbonaceous materials for an initial adsorbate concentration of 1.0 mg/L for MB and 32.0 mg/L for Spirulina extract, at time t = 60 min, and an adsorbent/adsorbate ratio of 0.67 g/L w/v.
Comparing the adsorptive materials, it seems that the order of MB or C-PhC adsorption decreases as follows: CM > OL50ML50C > Z80OS10ML10C ≈ Z80OS20C. It is observed that commercial activated carbon presented the highest MB and C-PhC adsorption followed by OL50ML50C. According to Le et al. [80], the adsorption efficiency of MB on NaY zeolite reduced from 90.1% to 67.76% when the temperature increased from 303 K to 333 K. An exothermic process characterizes the adsorption of MB on NaY zeolite. The observed reduction in MB uptake at higher temperatures can be the result of the weakened adsorptive forces between the MB molecules and the active sites of NaY zeolite. Moreover, high temperatures enhance the solubility of MB and reduce attractive forces between the adjacent molecules of the adsorbed phase. This causes an increase in desorption rate or a decrease in the adsorption capacity. Another study has shown that as the temperature increased from 25 to 40 °C, the adsorption capacity of MB dye onto natural Saudi zeolite decreased from 33.85 to 21.43 mg/g at an initial MB concentration of 15 mg/L [81]. According to C-PhC behavior, temperatures between 25 and 47 °C led to slow degradation of phycocyanin while higher temperatures accelerated the phenomenon. Above 70 °C the denaturation of protein was intense [26]. A temperature of less than 45 °C is optimal for preserving phycocyanin stability [26,82]. Another study examined the effect of pH and temperature on phycocyanin solutions. Five pH levels (pH 5.0, 5.5, 6.0, 6.5 and 7.0 ± 0.1, citrate phosphate buffer) were used at two different temperatures (50 and 60 °C) with the same concentration of phycocyanin equal to 1 mg/mL. Samples were taken for examination at different time intervals showing that the half-life of phycocyanin dropped sharply when temperatures increased from 47 to 64 °C. While the solution was more stable at pH 7.0 than pH 5.0 between 43 and 59 °C, it proved more stable at pH 5.0 beyond 59 °C. Optimum stability for the phycocyanin solution was consistently maintained at pH 6.0 [83]. Another study has shown the reduction in phycocyanin concentration with the increase in temperature from 40 to 80 °C by adding different kinds of sugar, i.e., glucose, fructose, and sucrose [84]. In conclusion, elevated operating temperatures shifted optimal phycocyanin stability towards lower pH values, showing an inverse relationship between degradation temperature and pH [85].
3.5. Initial Organic Pollutant Concentration
The influence of the initial concentration of dye on the adsorbents is presented in Figure 13. According to the results, it seems that CM adsorbs the highest amount of MB or C-PhC versus time, OS50ML50C follows and the carbon–zeolite materials show the lowest adsorption percentage of dyes. This phenomenon is in accordance with the specific surface area values of the materials. Furthermore, comparing the different initial concentrations of MB or C-PhC, it appears that the highest adsorption rates occur at the lowest initial dye concentration for all materials.
Figure 13.
Effect of initial adsorbate concentration on the adsorption of (a–c) MB, (d–f) C-PhC by carbonaceous materials, versus time t, and an adsorbent/adsorbate ratio of 0.67 g/L w/v, where each color represents a specific material. In the MB plots, the higher colored curves indicate adsorption percentage rates and the corresponding lower colored curves indicate mg dye/g adsorbent, while in the C-PhC plots, the straight parts of the curves indicate adsorption percentage rates and the colored curves with dashed lines indicate mg dye/g adsorbent.
Another study [86] mentioned that increasing the initial MB concentration from 200 to 1000 mg/L, while keeping all other parameters stable, led to a decrease in MB removal efficiency from 90% to less than 60%, while the adsorption capacity (mg of MB/g adsorbent) increased due to the greater concentration gradient driving force. According to Murtaza et al. [87], as the MB initial concentration increases from 10 to 40 ppm, the adsorbent’s efficacy (2D AlNiZn-LDH/BDC MOF) in removing the dye diminishes from 90 to 20%. The decrease in removal efficiency observed at elevated concentrations is primarily due to the saturation of the adsorbent’s active sites. As a result, the excess dye molecules remain un-adsorbed within the solution. Conversely, at lower dye concentrations, a greater proportion of active sites remain available in the adsorbent material, which leads to a significantly higher removal yield. Similar behavior is also presented to C-Phycocyanin adsorption, where the increase in initial concentration from 32 to 90 mg/L leads to a decrease in MB removal efficiency due to the saturation of the adsorbent’s active sites.
The adsorption isotherm experimental results for MB and C-phycocyanin on the four adsorbents at different initial adsorbate concentrations are shown in Figure S2 (see Supplementary Material). It seems that increasing the initial concentrations of MB or C-PhC on adsorbents increases their adsorption capacity. The Langmuir and Freundlich isotherms were used to fit the experimental data for MB and C-PhC adsorption. The results are shown in Table S1 (see Supplementary Material). The Freundlich isotherm fits best with the experimental data of MB (correlation coefficient R2 from 0.88 to 0.99), while the data of C-PhC are best described by the Langmuir model (correlation coefficient R2 from 0.95 to 0.99). A lower correlation coefficient indicates less agreement between the experimental data and each isotherm model.
The Freundlich model is based on the heterogeneous surface energies of the adsorbent and posits that the adsorbate initially occupies strong-binding sites before all available sites are filled. The Freundlich isotherm also indicates multilayer adsorption, where the adsorption capacity is proportional to the equilibrium concentration of the adsorbate. An R2 value of 0.90 to 0.99 was calculated for the Freundlich isotherm parameters, indicating the presence of sites with varying energy levels and heterogeneity of the adsorption surface. The value of n was calculated between 1.27 and 5.46. An n value ranging from 2 to 10 indicates excellent adsorption capacity. However, a value between 1 and 2 represents moderate adsorption capacity, whereas an n value of less than 1 indicates low adsorption capacity [88]. According to Vallejo et al. [89], the adsorption data of MB onto activated carbon derived from the peel of musa paradisiaca (banana), carbonized and chemically activated by three chemical agents (citric acid, CA, tartaric acid, TA, and EDTA) fits best either to the Freundlich model for AC and AC/CA and the Langmuir model for AC/EDTA and AC/TA. Comparing the adsorption capacities of MB from different activated carbons [88,90], it seems that they range from 17.68 and 18.95 mg/g for carbons derived from neem and apricot seeds, respectively, continue to 21.6 mg/g for carbons derived from avocado seeds, and reach up to 492.00 mg/g for carbons derived from grape seed. Different parameters are crucial to the above experiments: the preparation of carbons from agri-food by-products, the initial MB concentration, the ratio of carbon to solution, and the treatment time. In our study the maximum adsorption capacity ranged from 3.57 to 11.03 mg/g, indicating lower values compared to the literature, probably due probably to the lack of activation of the final adsorbent materials.
The Langmuir model assumes homogeneous adsorption and describes the adsorption of a C-PhC monolayer onto adsorbent surfaces possessing a finite number of identical binding sites for the protein molecule. According to the Langmuir model, the KL constant is a dissociation coefficient representing the affinity between the adsorbate and the adsorbents. Higher values show more affinity for the adsorption of C-PhC to the adsorbent. Other researchers [91] have shown that the adsorption experimental data of C-PhC on ion exchange resins (Streamline DEAE and Streamline Q XL) follows the Langmuir model.
3.6. Influence of Material-to-Organic Pollutant Ratio
The effect of different amounts of adsorbent on the dye adsorption behavior is presented in Figure 14. According to the results, it seems that the adsorption percentage for MB follows the order: CM-B, CM-C > CM-A, OL50ML50C-C > Z80OS10ML10C-C, Z80OS20C-C > OL50ML50C-B > Z80OS10ML10C-B > Z80OS20C-B > OL50ML50C-A, Z80OS10ML10C-A > Z80OS20C-A, while the adsorption percentage for C-PhC follows the order CM-C > CM-B > CM-A, OL50ML50C-C > OL50ML50C-B > OL50ML50C-A, Z80OS20C-C > Z80OS10ML10C-C, Z80OS10ML10C-B, Z80OS20C-B, Z80OS10ML10C-A, Z80OS20C-A. Consequently, the highest ratio of adsorbent to dye solution leads to the highest adsorption percentage due to the increased functional groups on the carbon–zeolite materials that will bind the dye molecules.
Figure 14.
Effect of initial amount of adsorbent on the adsorption of (a) MB and (b) C-PhC for an initial adsorbate concentration of 1.0 mg/L for MB and 32.0 mg/L for Spirulina extract, at time t = 400 min, where the adsorbent/adsorbate ratio varies as follows: A: 0.67, B: 1.33, C: 2.0 g/L w/v.
According to Bu et al. [86], the increase in adsorbent to MB solution ratio from 0.5 to 2.0 g/L w/v results in an enhancement of MB removal efficiency from 83.8% to 95%, due to the greater availability of active sorption sites and the corresponding increase in effective surface area at higher dosages. Vasilijević et al. [92] reported that an increase in the adsorbent-to-adsorbate solution ratio from 0.05 to 0.1 g/L led to a gradual increase in the efficiency of MB removal, while at higher ratios (0.15–0.25 g/L), complete removal of MB from the solution was achieved (100% removal).
3.7. Application of the Adsorbents to Industrial Wastewater
Considering all the above parameters regarding the adsorption of C-PhC contained in the Spirulina extract by the adsorbents, we used the same adsorbents for the remediation of wastewater from a food industry that uses C-PhC for coloring its products. Using the optimal conditions from our experimental data, we observe that the removal of C-PhC by the adsorbents is shown in Figure 15. The results show that the adsorption rates follow the order: CM > OL50ML50C > Z80OL20C > Z80OL10ML10C. Consequently, an industry that colors its product can use, among other techniques, filters prepared from agro-food by-products, e.g., OL50ML50C, to remove organic substances effectively from its waste.
Figure 15.
Adsorption percentage of C-phycocyanin in wastes from the different materials.
4. Conclusions
The creation of carbon-rich materials from agro-food byproducts, specifically olive stone and molasses individually or mixed with aluminosilicate minerals like zeolite, was explored. Methylene blue and c-phycocyanin, two distinct dyes, were employed to investigate the adsorptive characteristics of the materials. BET analysis revealed that the specific surface area of the materials follows the order: CM > OS50ML50-C > Z80OS20-C > Z80OS10ML10-C. The N2 adsorption–desorption isotherms show that CM and OS50ML50C materials exhibit a typical type I isotherm with an H4 hysteresis loop, indicating a microporous structure, while the carbon–zeolite materials show a type II adsorption isotherm with an H3 hysteresis loop characteristic of mesoporous materials. According to XRD analysis, all the adsorbents produced have shown a highly disordered carbon structure and a mostly amorphous arrangement. XPS analysis revealed the presence of C-C, C-H, C-O, C=O, O-C=O, and (CO3)2− bonds during high-resolution C1s and O1s deconvolution and detected the elements AL, Si, Na, Ca, K, Na, and S, confirming the aluminosilicate framework of the zeolitic structure of the materials. Several key factors, including pH, temperature, initial concentration of methylene blue or phytocyanin, contact time, and sorbent, were investigated. The conditions examined showed the best adsorption results for MB and c-phycocyanin at pH 8, temperatures of 50 and 40 °C, respectively, an initial concentration of 0.5 mg/L for MB and 32 mg/L of Spirulina extract, respectively, and an adsorbent dose equal to 2.0 g/L of C/MB solution or Spirulina extract. The adsorbents produced under the optimal conditions were applied to the removal of c-phycocyanin from the industrial waste, showing that the effectiveness of CM and olive stone/molasses adsorbents reached nearly 72.6 and 70.0%, respectively. Consequently, this research underscores the viability and high efficiency of repurposing agricultural waste into carbonaceous or carbonaceous—zeolitic adsorbents to eliminate dyes from wastewater.
Supplementary Materials
The following supporting information can be downloaded at: https://www.mdpi.com/article/10.3390/cleantechnol8050147/s1, Figure S1: SEM-EDS images of commercial charcoal indicating the presence of impurities in the carbon matrix. Figure S2: Adsorption isotherms of (a) MB and (b) C-PhC on different materials (CM, Z80OS20C, Z80OS10ML10C, OS50ML50C) and at different initial concentrations (0.5 to 2 mg/L for MB and 32 to 90 mg/L for Spirullina extract); Table S1: Parameters of adsorption isotherm models for MB and C-PhC adsorption onto different adsorbents.
Author Contributions
Conceptualization, methodology, software, Z.I.; validation, V.A.G. and Z.I.; formal analysis, Z.I. and V.A.G.; investigation, D.S., S.P. and V.A.G.; data curation, G.K., G.S., S.P. and Z.I.; resources, G.S., S.P. and G.K.; writing—original draft preparation, Z.I., D.S.; visualization, supervision, and project administration, Z.I. All authors have read and agreed to the published version of the manuscript.
Funding
This research received no external funding.
Data Availability Statement
The original contributions presented in this study are included in the article/Supplementary Material. Further inquiries can be directed at the corresponding author.
Acknowledgments
The authors express their gratitude to V. Psycharis at NCSR Demokritos for his valuable contribution to the XRD analysis.
Conflicts of Interest
The authors declare no conflicts of interest.
Abbreviations
The following abbreviations are used in this manuscript:
| BET | Brunauer–Emmett–Teller |
| SEM | Scanning electron microscopy |
| EDS | Energy dispersive spectroscopy |
| MB | Methylene blue |
| C-PhC | C-phycocyanin |
| CM | Commercial charcoal |
| OS50ML50C | Olive stone/molasses in a proportion of 50/50 w/w after carbonization |
| Z80OS20C | Zeolite/Olive stone in a proportion of 80/20 w/w after carbonization |
| Z80OS10ML10C | Zeolite/Olive stone/molasses in a proportion of 80/10/10 w/w/w after carbonization |
References
- Ratu, R.N.; Veles, J.D.; Stoica, F.; Usturoi, A.; Arsenoaia, V.N.; Crivei, I.C.; Postolache, A.N.; Lips, F.D.; Filipov, F.; Florea, A.M.; et al. Application of Agri-Food By-Products in the Food Industry. Agriculture 2023, 13, 1559. [Google Scholar] [CrossRef] [Scilit]
- Available online: https://agriculture.ec.europa.eu/farming/crop-productions-and-plant-based-products/olive-oil_en (accessed on 6 August 2026).
- Chouchene, A.; Jeguirim, M.; Trouvé, G.; Favre-Reguillon, A.; Le Buzit, G. Combined process for the treatment of olive oil mill wastewater: Absorption on sawdust and combustion of the impregnated sawdust. Bioresour. Technol. 2010, 101, 6962–6971. [Google Scholar] [CrossRef] [Scilit] [PubMed]
- Al-Shaweesh, M.; Matouq, M.; Al-Kabariti, D.; Khamash, D.; Al-Zawaidah, S.; Hindiyeh, M.; Omar, W. Olive mill wastewater (OMW) treatment by using ferric oxide dephenolization and chemical oxygen demand removal. Glob. NEST J. 2018, 20, 558–563. [Google Scholar] [CrossRef] [Scilit]
- Raza, Q.-U.-A.; Bashir, M.A.; Rehim, A.; Sial, M.U.; Raza, H.M.A.; Atif, H.M.; Brito, A.F.; Geng, Y. Sugarcane industrial byproducts as challenges to environmental safety and their remedies: A review. Water 2021, 13, 3495. [Google Scholar] [CrossRef] [Scilit]
- Ungureanu, N.; Vlăduț, V.; Biriș, S.S. Sustainable Valorization of Waste and By-Products from Sugarcane Processing. Sustainability 2022, 14, 11089. [Google Scholar] [CrossRef] [Scilit]
- Anastopoulos, I.; Bhatnagar, A.; Hameed, B.H.; Ok, Y.S.; Omirou, M. A review on waste-derived adsorbents from sugar industry for pollutant removal in water and wastewater. J. Mol. Liq. 2017, 240, 179–188. [Google Scholar] [CrossRef] [Scilit]
- Al-Ghouti, M.; Sweleh, A.O. Optimizing textile dye removal by activated carbon prepared from olive stones. Environ. Technol. Innov. 2019, 16, 100488. [Google Scholar] [CrossRef] [Scilit]
- Alardhi, S.M.; Salih, H.G.; Ali, N.S.; Khalbas, A.H.; Salih, I.K.; Saady, N.M.C.; Zendehboudi, S.; Albayati, T.M.; Harharah, H.N. Olive stone as an eco-friendly bio-adsorbent for elimination of methylene blue dye from industrial wastewater. Nature 2023, 13, 21063. [Google Scholar] [CrossRef] [Scilit] [PubMed]
- Hazzaa, R.; Hussein, M. Adsorption of cationic dye from aqueous solution onto activated carbon prepared from olive stones. Environ. Technol. Innov. 2015, 4, 36–51. [Google Scholar] [CrossRef] [Scilit]
- Baccar, R.; Blánquez, P.; Bouzid, J.; Feki, M.; Sarrà, M. Equilibrium, thermodynamic and kinetic studies on adsorption of commercial dye by activated carbon derived from olive-waste cakes. Chem. Eng. J. 2010, 165, 457–464. [Google Scholar] [CrossRef] [Scilit]
- Benzekri, M.B.; Benderdouche, N.; Bestani, B.; Douara, N.; Duclaux, L. Valorization of olive stones into a granular activated carbon for the removal of Methylene blue in batch and fixed bed modes. J. Mater. Environ. Sci. 2018, 9, 272–284. [Google Scholar] [CrossRef] [Scilit]
- Lacerda, V.; López-Sotelo, J.B.; Correa-Guimarães, A.; Hernández-Navarro, S.; Sánchez-Báscones, M.; Navas-Gracia, L.M.; Martín-Ramos, P.; Martín-Gil, J. Rhodamine B removal with activated carbons obtained from lignocellulosic waste. J. Environ. Manag. 2015, 155, 67–76. [Google Scholar] [CrossRef] [Scilit] [PubMed]
- Yagub, M.T.; Sen, T.K.; Afroze, S.; Ang, H.M. Dye and its removal from aqueous solution by adsorption: A review. Adv. Colloid Interface Sci. 2014, 209, 172–184. [Google Scholar] [CrossRef] [Scilit] [PubMed]
- Berrios, M.; Martın, M.A.; Martın, A. Treatment of pollutants in wastewater: Adsorption of methylene blue onto olive-based activated carbon. J. Ind. Eng. Chem. 2012, 18, 780–784. [Google Scholar] [CrossRef] [Scilit]
- Zhang, Z.; Xu, L.; Zhou, P.; Feng, R.; Zou, T.; Zhang, Y.; Kang, Y.; Zhou, P. Efficient removal of methylene blue using the mesoporous activated carbon obtained from mangosteen peel wastes: Kinetic, equilibrium, and thermodynamic studies. Microporous Mesoporous Mater. 2021, 315, 110904. [Google Scholar] [CrossRef] [Scilit]
- Güzel, F.; Sayğılı, H.; Sayğılı, G.A.; Koyuncu, F. Decolorisation of aqueous crystal violet solution by a new nanoporous carbon: Equilibrium and kinetic approach. J. Ind. Eng. Chem. 2014, 20, 3375–3386. [Google Scholar] [CrossRef] [Scilit]
- Vunain, E.; Biswick, T. Adsorptive removal of methylene blue from aqueous solution on activated carbon prepared from Malawian baobab fruit shell wastes: Equilibrium, kinetics and thermodynamic studies. Sep. Sci. Technol. 2019, 54, 27–41. [Google Scholar] [CrossRef] [Scilit]
- Valix, M.; Cheung, W.H.; McKay, G. Preparation of activated carbon using low temperature carbonisation and physical activation of high ash raw bagasse for acid dye adsorption. Chemosphere 2004, 56, 493–501. [Google Scholar] [CrossRef] [Scilit] [PubMed]
- Gupta, V.K.; Mittal, A.; Jain, R.; Mathur, M.; Sikarwar, S. Adsorption of Safranin-T from wastewater using waste materials—Activated carbon and activated rice husks. J. Colloid Interface Sci. 2006, 303, 80–86. [Google Scholar] [CrossRef] [Scilit] [PubMed]
- Ardekani, P.S.; Karimi, H.; Ghaedi, M.; Asfaram, A.; Purkait, M.K. Ultrasonic assisted removal of methylene blue on ultrasonically synthesized zinc hydroxide nanoparticles on activated carbon prepared from wood of cherry tree: Experimental design methodology and artificial neural network. J. Mol. Liq. 2017, 229, 114–124. [Google Scholar] [CrossRef] [Scilit]
- You, X.; Liu, M.; Chen, X.; Li, Y.; Yang, Y. Mechanistic insight into the simultaneous removal of Cr(VI) and phosphate by a novel versatile bimetallic material. J. Environ. Chem. Eng. 2024, 12, 114446. [Google Scholar] [CrossRef] [Scilit]
- Kakhki, R.M.; Zirjanizadeh, S.; Mohammadpoor, M. A review of clinoptilolite, its photocatalytic, chemical activity, structure and properties: In time of artificial intelligence. J. Mater. Sci. 2023, 58, 10555–10575. [Google Scholar] [CrossRef] [Scilit]
- Moshoeshoe, M.; Nadiye-Tabbiruka, M.S.; Obuseng, V. A Review of the Chemistry, Structure, Properties and Applications of Zeolites. Am. J. Mater. Sci. 2017, 7, 196–221. [Google Scholar]
- Yang, Y.; Shu, W.; Chen, Z.; Li, Z.; Chen, X.; You, X.; Xu, B.; Ng, H.Y. Self-supported zeolite fibers with multiscale porosity boosting mass transfer and stability for environmental pollutants removal. Water Res. 2026, 15, 125758. [Google Scholar] [CrossRef] [Scilit] [PubMed]
- Adjali, A.; Clarot, A.; Chen, Z.; Marchioni, E.; Boudier, A. Physicochemical degradation of phycocyanin and means to improve its stability: A short review. J. Pharm. Anal. 2022, 12, 406–414. [Google Scholar] [CrossRef] [Scilit] [PubMed]
- Braud, L.; McDonnell, K.; Murphy, F. Beyond phycocyanin: Environmental life cycle assessment of a European pilot scale Spirulina biorefinery. Bioresour. Technol. Rep. 2025, 29, 102027. [Google Scholar] [CrossRef] [Scilit]
- Fernandes, R.; Toubarro, J.C.D.; Serra, M.; Fidalgo, J.; Almeida, H.; Barros, A.I.R.N.A. Exploring the Benefits of Phycocyanin: From Spirulina Cultivation to Its Widespread Applications. Pharmaceuticals 2023, 16, 592. [Google Scholar] [CrossRef] [Scilit] [PubMed]
- Lin, J.; Pang, Y.; Huo, Y.; Jiang, J.; Zhou, B.; Shang, C. Extraction, purification and characterization of Spirulina phycocyanin. Algal Res. 2025, 85, 103861. [Google Scholar] [CrossRef] [Scilit]
- Papadaki, S.; Kyriakopoulou, K.; Tzovenis, I.; Krokida, M. Environmental impact of phycocyanin recovery from Spirulina platensis cyanobacterium. Innov. Food Sci. Emerg. Technol. 2017, 44, 217–223. [Google Scholar] [CrossRef] [Scilit]
- Li, Y.; Zhang, Z.; Paciulli, M.; Abbaspourrad, A. Extraction of phycocyanin—A natural blue colorant from dried spirulina biomass: Influence of processing parameters and extraction techniques. J. Food Sci. 2020, 85, 727–735. [Google Scholar] [CrossRef] [Scilit] [PubMed]
- Krakauskaite, U.; Aboobacker, S.; Kitryte-Syrpa, V.; Syrpas, M. Optimized extraction and purification of dual-function cosmetic-grade phycocyanin and allophycocyanin from dried Arthrospira platensis biomass using conventional methods. Appl. Sci. 2025, 15, 532. [Google Scholar] [CrossRef] [Scilit]
- Gkaliouri, C.M.; Ioannou, Z.; Rigopoulos, N.; Sarris, D. Sustainable management of agro-food wastes derived from olive mill and sugar industry and clinoptilolite to produce novel adsorptive materials. Sustainability 2024, 16, 9204. [Google Scholar] [CrossRef] [Scilit]
- Gonzalez-Olmos, R.; Gutierrez-Ortega, A.; Sempere, J.; Nomen, R. Zeolite versus carbon adsorbents in carbon capture: A comparison from an operational and life cycle perspective. J. CO2 Util. 2022, 55, 101791. [Google Scholar] [CrossRef] [Scilit]
- Gunawan, T.; Wijiyanti, R.; Widiastuti, N. Adsorption–desorption of CO2 on zeolite-Y-templated carbon at various temperatures. RSC Adv. 2018, 8, 41594–41602. [Google Scholar] [CrossRef] [Scilit] [PubMed]
- Bandura, L.; Panek, R.; Madej, J.; Franus, W. Synthesis of zeolite-carbon composites using high-carbon fly ash and their adsorption abilities towards petroleum substances. Fuel 2021, 283, 119173. [Google Scholar] [CrossRef] [Scilit]
- Podgórska-Kryszczuk, I. Spirulina—An Invaluable Source of Macro- and Micronutrients with Broad Biological Activity and Application Potential. Molecules 2024, 29, 5387. [Google Scholar] [CrossRef] [Scilit] [PubMed]
- Koyande, A.K.; Chew, K.W.; Rambabu, K.; Tao, Y.; Chu, D.T.; Show, P.L. Microalgae: A Potential Alternative to Health Supplementation for Humans. Food Sci. Hum. Wellness 2019, 8, 16–24. [Google Scholar] [CrossRef] [Scilit]
- Bürck, M.; Fratelli, C.; Campos, M.; De Amarante, A.; Cavalcante Braga, A.R. Unveiling the Potential of Spirulina Biomass—A Glimpse into the Future Circular Economy Using Green and Blue Ingredients. Biomass 2024, 4, 704–719. [Google Scholar] [CrossRef] [Scilit]
- ISO 11465; Soil Quality—Determination of Dry Matter and Water Content on a Mass Basis—Gravimetric Method. International Organization for Standardization: Geneva, Switzerland, 1993.
- Jones, J.B.; Case, V.W. Sampling, handling and analyzing plant tissue samples. In Soil Testing and Plant Analysis, 3rd ed.; Westerman, R.L., Ed.; Book Series No. 3; Soil Science Society of America: Madison, WI, USA, 1990; pp. 389–427. [Google Scholar]
- Pietrzak, R.; Nowicki, P.; Kaźmierczak, J.; Kuszyńska, I.; Goscianska, J.; Przepiórski, J. Comparison of the effects of different chemical activation methods on properties of carbonaceous adsorbents obtained from cherry stones. Chem. Eng. Res. Des. 2014, 92, 1187–1191. [Google Scholar] [CrossRef] [Scilit]
- EN 15148; Solid Biofuels—Determination of the Content of Volatile Matter. European Committee for Standardization: Brussels, Belgium, 2009.
- Saka, C. BET, TG–DTG, FT-IR, SEM, iodine number analysis and preparation of activated carbon from acorn shell by chemical activation with ZnCl2. Turk. J. Anal. Appl. Pyrolysis 2012, 95, 21–24. [Google Scholar] [CrossRef] [Scilit]
- Zeng, W.; Luo, J.; Grimi, N. Maximizing C-phycocyanin purification efficiency from Spirulina: A synergistic strategy combining CaCl2 precipitation and membrane diafiltration. Sep. Purif. Technol. 2025, 361, 131575. [Google Scholar] [CrossRef] [Scilit]
- Gkaliouri, C.M.; Laoudikou, E.T.; Ioannou, Z.; Papadopoulou, S.; Giota, V.A.; Sarris, D. Production and Characterization of Novel Photocatalytic Materials Derived from the Sustainable Management of Agro-Food By-Products. Molecules 2026, 31, 300. [Google Scholar] [CrossRef] [Scilit] [PubMed]
- Yang, X.; Zhong, H.; Zhang, W.; Liu, Y.; Sun, N.; Kuang, R.; Wang, C.; Zhan, A.; Zhang, J.; Tang, Q.; et al. Progress in Adsorptive Removal of Volatile Organic Compounds by Zeolites. Aerosol Air Qual. Res. 2023, 23, 220442. [Google Scholar] [CrossRef] [Scilit]
- Yirdaw, G.; Dessie, A.; Birhan, T.A. Optimization of process variables to prepare activated carbon from Noug (Guizotia abyssinica cass.) stalk using response surface methodology. Heliyon 2023, 9, e17254. [Google Scholar] [CrossRef] [Scilit] [PubMed]
- Senthilkumar, G.; Nagarajan, D.; Thillaikkarasi, D.; Chen, C.-W.; Chang, J.-S.; Dong, C.-D. Agro-waste derived porous biochar for adsorptive removal of the fluorinated antibiotic florfenicol: Isotherm, kinetic, and mechanistic insights. J. Taiwan Inst. Chem. Eng. 2026, 189, 106870. [Google Scholar] [CrossRef] [Scilit]
- Mahapatra, K.; Ramteke, D.S.; Paliwal, L.J. Production of activated carbon from sludge of food processing industry under controlled pyrolysis and its application for methylene blue removal. J. Anal. Appl. Pyrolysis 2012, 95, 79–86. [Google Scholar] [CrossRef] [Scilit]
- Hoang, T.-D.; Liu, Y.; Le, M.-T. Synthesis and Characterization of Biochars and Activated Carbons Derived from Various Biomasses. Sustainability 2024, 16, 5495. [Google Scholar] [CrossRef] [Scilit]
- Lin, H.; Liu, Q.; Dong, Y.; Chen, Y.; Huo, H.; Liu, S. Study on Channel Features and Mechanism of Clinoptilolite Modified by LaCl3. J. Mater. Sci. Res. 2013, 2, 37–44. [Google Scholar] [CrossRef] [Scilit]
- Ferreira de Paula, F.G.; Campello-Gómez, I.; Ribeiro Ortega, P.F.; Rodríguez-Reinoso, F.; Martínez-Escandell, M.; Silvestre-Albero, J. Structural flexibility in activated carbon materials prepared under harsh activation conditions. Materials 2019, 12, 1988. [Google Scholar] [CrossRef] [Scilit] [PubMed]
- Du, Q.-S.; Tang, P.-D.; Huang, H.-L.; Du, F.-L.; Huang, K.; Xie, N.-Z.; Long, S.-Y.; Li, Y.-M.; Qiu, J.-S.; Huang, R.-B. A new type of two-dimensional carbon crystal prepared from 1,3,5-trihydroxybenzene. Sci. Rep. 2017, 7, 40796. [Google Scholar] [CrossRef] [Scilit] [PubMed]
- Leal, J.F.; Amado, P.S.M.; Lourenço, J.P.; Cristiano, M.L.S. The potential of chitosan-based composites for adsorption of diarrheic shellfish. Toxins 2024, 21, 200. [Google Scholar] [CrossRef] [Scilit] [PubMed]
- Ramirez-Gutierrez, C.F.; Arias-Niquepa, R.; Prías-Barragán, J.J.; Rodriguez-Garcia, M.E. Study and identification of contaminant phases in commercial activated carbons. J. Environ. Chem. Eng. 2020, 8, 103636. [Google Scholar] [CrossRef] [Scilit]
- Mopoung, S.; Amornsakchai, P. Production of KMnO4 modified activated carbon fiber filter from pineapple leaf carbon fiber for Fe3+ and Ca2+ ions adsorption. Indian J. Sci. Technol. 2017, 10, 1–14. [Google Scholar] [CrossRef] [Scilit]
- Dehkhoda, A.M.; Ellis, N.; Gyenge, E. Electro-sorption on activated biochar: Effect of thermo-chemical activation treatment on the electric double layer capacitance. J. Appl. Electrochem. 2014, 44, 141–157. [Google Scholar] [CrossRef] [Scilit]
- Mekhanikova, I.V.; Andreev, D.S.; Belozerova, O.Y.; Mikhlin, Y.L.; Lipko, S.V.; Klimenkov, I.V.; Akimov, V.V.; Kargin, V.F.; Mazurova, Y.V.; Tauson, V.L.; et al. Specific features of mandible structure and elemental composition in the polyphagous amphipod Acanthogammarus grewingkii endemic to Lake Baikal. PLoS ONE 2012, 7, e43073. [Google Scholar] [CrossRef] [Scilit] [PubMed]
- Paluch, D.; Wolski, R.; Bazan-Wozniak, A.; Pietrzak, R. Adsorption of butylparaben and methylene blue from aqueous solution using activated carbon derived from Oak Bark. Materials 2025, 18, 2984. [Google Scholar] [CrossRef] [Scilit] [PubMed]
- Wagner, C.D.; Passoja, D.E.; Hillery, H.F.; Kinisky, T.G.; Six, H.A.; Jansen, W.T.; Taylor, J.A. Auger and photoelectron line energy relationships in aluminum–oxygen and silicon–oxygen compounds. J. Vac. Sci. Technol. 1982, 21, 933–944. [Google Scholar] [CrossRef] [Scilit]
- Stoch, J.; Lercher, J.; Ceckiewicz, S. Correlations between XPS binding energies and composition of aluminasilicate and phosphate molecular sieves. Zeolites 1992, 12, 81–85. [Google Scholar] [CrossRef] [Scilit]
- Jiang, Y.; Yifeng, E.; Wei, P.; Wang, J.; Chen, P.; Wang, L.; Krenzel, T.F.; Qian, K.; Tong, X. Application of LTA zeolite-modified electrode for sensitive detection of retinoic acid in tap water. RSC Adv. 2023, 13, 3364–3370. [Google Scholar] [CrossRef] [Scilit] [PubMed]
- Liang, X.; Hart, C.; Pang, Q.; Garsuch, A.; Weiss, T.; Nazar, L.F. A highly efficient polysulfide mediator for lithium–sulfur batteries. Nat. Commun. 2015, 6, 5682. [Google Scholar] [CrossRef] [Scilit] [PubMed]
- Singh, S.; Dalbehera, M.M.; Rawat, A.; Sharma, P. Carbonation study and determination of cement to sand ratio in hardened cement mortar by X-ray photoelectron spectroscopy. Surf. Interface Anal. 2020, 52, 603–610. [Google Scholar] [CrossRef] [Scilit]
- Everett, D.H. IUPAC, Manual of symbol and terminology for physico-chemical quantities and units, Appendix, Definitions, Terminology and Symbols in Colloid and Surface Chemistry. Pure Appl. Chem. 1972, 31, 577–638. [Google Scholar] [CrossRef] [Scilit]
- Thamer, B.M.; Alaizari, F.A.; Abdo, H.S. Enhanced Adsorption of Textile Dyes by a Novel Sulfonated Activated Carbon Derived from Pomegranate Peel Waste: Isotherm, Kinetic and Thermodynamic Study. Molecules 2023, 28, 7712. [Google Scholar] [CrossRef] [Scilit] [PubMed]
- Kumar, P.; Antal, P.; Wang, X.; Wang, J.; Trivedi, D.; Fellner, O.F.; Wu, Y.A.; Nemec, I.; Santana, V.T.; Kopp, J.; et al. Partial Thermal Condensation Mediated Synthesis of High-Density Nickel Single Atom Sites on Carbon Nitride for Selective Photooxidation of Methane into Methanol. Small 2024, 20, 2304574. [Google Scholar] [CrossRef] [Scilit] [PubMed]
- Gonçalves, J.O.; Leones, A.R.; de Farias, B.S.; da Silva, M.D.; Jaeschke, D.P.; Fernandes, S.S.; Ribeiro, A.C.; Cadaval, T.R.S., Jr.; Pinto, L.A.D.A. A Comprehensive Review of Agricultural Residue-Derived Bioadsorbents for Emerging Contaminant Removal. Water 2025, 17, 2141. [Google Scholar] [CrossRef] [Scilit]
- Tan, J.; Hu, R.; Luo, W.; Ma, Z.; He, G. Pore Evolution of Lacustrine Organic-Rich Shales: Insights from Thermal Simulation Experiments. Energy Fuels 2021, 35, 3079–3094. [Google Scholar] [CrossRef] [Scilit]
- Velarde, L.; Nabavi, M.S.; Escalera, E.; Antti, M.-L.; Akhtar, F. Adsorption of heavy metals on natural zeolites: A review. Chemosphere 2023, 328, 138508. [Google Scholar] [CrossRef] [Scilit] [PubMed]
- Wang, Y.; Tang, X.; Yi, H. Adsorption Materials for Carbon Capture: Research Advancements and Prospects. Separations 2025, 12, 334. [Google Scholar] [CrossRef] [Scilit]
- Alawam, A.S.; Mahgoub, S.M.; Allam, A.A.; Radalla, A.M.; Shemy, M.H.; Mahmoud, R. Sustainable zeolite/activated carbon nanocomposite for dual-dye adsorption, kinetic and thermodynamic studies, and urea electro-oxidation applications. RSC Adv. 2025, 15, 43983–44006. [Google Scholar] [CrossRef] [Scilit] [PubMed]
- Gabruś, E.; Tabero, P.; Aleksandrzak, T. A study of the thermal regeneration of carbon and zeolite adsorbents after adsorption of 1-hexene vapor. Appl. Therm. Eng. 2022, 216, 119065. [Google Scholar] [CrossRef] [Scilit]
- Mohamed, F.; Shaban, M.; Zaki, S.K.; Abd-Elsamie, M.S.; Sayed, R.; Zayed, M.; Khalid, N.; Saad, S.; Omar, S.; Ahmed, A.M.; et al. Activated carbon derived from sugarcane and modified with natural zeolite for efficient adsorption of methylene blue dye: Experimentally and theoretically approaches. Sci. Rep. 2022, 12, 18031. [Google Scholar] [CrossRef] [Scilit] [PubMed]
- Sohrabnezhad, S.; Pourahmad, A. Comparison absorption of new methylene blue dye in zeolite and nanocrystal zeolite. Desalination 2010, 256, 84–89. [Google Scholar] [CrossRef] [Scilit]
- Yasin, Y.; Hussein, M.Z.; Ahmad, F.H. Adsorption of methylene blue onto treated activated carbon. Malays. J. Anal. Sci. 2007, 11, 400–406. [Google Scholar]
- Wang, S.; Dou, J.; Zhang, T.; Li, S.; Chen, X. Selective adsorption of methyl orange and methylene blue by porous carbon material prepared from potassium citrate. ACS Omega 2023, 8, 35024–35033. [Google Scholar] [CrossRef] [Scilit] [PubMed]
- Paluch, D.; Bazan-Wozniak, A.; Nosal-Wiercinska, A.; Pietrzak, R. Removal of methylene blue and methyl red from aqueous solutions using activated carbons obtained by chemical activation of caraway seed. Molecules 2023, 28, 6306. [Google Scholar] [CrossRef] [Scilit] [PubMed]
- Le, T.P.; Luong, H.V.T.; Nguyen, H.N.; Pham, T.K.T.; Le, T.L.T.; Tran, T.B.Q.; Ngo, T.N.M. Insight into adsorption-desorption of methylene blue in water using zeolite NaY: Kinetic, isotherm and thermodynamic approaches. Results Surf. Interfaces 2024, 16, 100281. [Google Scholar] [CrossRef] [Scilit]
- Alsuhybani, M.; Alshehri, S.; Alquwaizany, A.; Alosime, E.; Alaeq, R.; Alrehaili, A. Effective adsorption of methylene blue using natural Saudi zeolite as a low-cost sustainable adsorbent. Sci. Rep. 2026, 16, 211. [Google Scholar] [CrossRef] [Scilit] [PubMed]
- Aoki, J.; Sasaki, D.; Asayama, M. Development of a method for phycocyanin recovery from filamentous cyanobacteria and evaluation of its stability and antioxidant capacity. Biotechnology 2021, 21, 40. [Google Scholar] [CrossRef] [Scilit] [PubMed]
- Chaiklahana, R.; Chirasuwana, N.; Bunnag, B. Stability of phycocyanin extracted from Spirulina sp.: Influence of temperature, pH and preservatives. Process Biochem. 2012, 47, 659–664. [Google Scholar] [CrossRef] [Scilit]
- Christwardana, M.; Sutanto, H.; Suzery, M.; Amelia, D.; Aritonang, R.F. Kinetic study on the effects of sugar addition on the thermal degradation of phycocyanin from Spirulina sp. Food Biosci. 2018, 22, 85–90. [Google Scholar] [CrossRef] [Scilit]
- Antelo, F.S.; Costa, J.A.V.; Kalil, S.J. Thermal degradation kinetics of the phycocyanin from Spirulina platensis. Biochem. Eng. J. 2008, 41, 43–47. [Google Scholar] [CrossRef] [Scilit]
- Bu, Z.; Fang, Y.; Chen, H.; Zhang, M.; Wang, F. Study on the adsorption properties of organically modified diatomite for methylene blue. Sci. Rep. 2025, 15, 27561. [Google Scholar] [CrossRef] [Scilit] [PubMed]
- Murtaza, G.; Shah, S.S.A.; Mumtaz, A.; Chotana, G.A.; Nafady, A.; Waha, M.A.; Sohail, M. Efficient Adsorption of Methylene Blue Using a Hierarchically Structured Metal–Organic Framework Derived from Layered Double Hydroxide. ACS Omega 2024, 9, 16334. [Google Scholar] [CrossRef] [Scilit] [PubMed]
- Al-Asadi, S.T.; Mussa, Z.H.; Al-Qaim, F.F.; Kamyab, H.; Al-Saedi, H.F.S.; Deyab, I.F.; Kadhim, N.J. A comprehensive review of methylene blue dye adsorption on activated carbon from edible fruit seeds: A case study on kinetics and adsorption models. Carbon Trends 2025, 20, 100507. [Google Scholar] [CrossRef] [Scilit]
- Vallejo, W.; Diaz-Uribe, C.; Duran, F.; Vargas-Delgadillo, D.P.; Barbosa, O. Kinetic and Thermodynamic Study of Methylene Blue Adsorption onto Activated Carbon Obtained from the Peel of musa paradisiaca. Sci 2025, 7, 170. [Google Scholar] [CrossRef] [Scilit]
- Dominguez, M.P.; Mendoza, J.; Hechenleitner, R. Continuous and batch methylene blue removal using avocado seed carbon: Performance evaluation and kinetic analysis. Bioresour. Technol. Rep. 2025, 29, 102071. [Google Scholar] [CrossRef] [Scilit]
- Sala, L.; Figueira, F.S.; Cerveira, G.P.; Moraes, C.C.; Kalil, S.J. Kinetics and adsorption isotherm of C-Phycocyanin from Spirulina platensis on ion-exchange resins. Braz. J. Chem. Eng. 2014, 31, 1013–1022. [Google Scholar] [CrossRef] [Scilit]
- Vasiljević, N.; Panić, S.; Tadić, G.; Vuković, J.; Novaković, N.; Mićić, V. Investigation of the kinetics of the adsorption of methylene blue on activated carbon. Eng. Proc. 2025, 99, 4. [Google Scholar] [CrossRef] [Scilit]
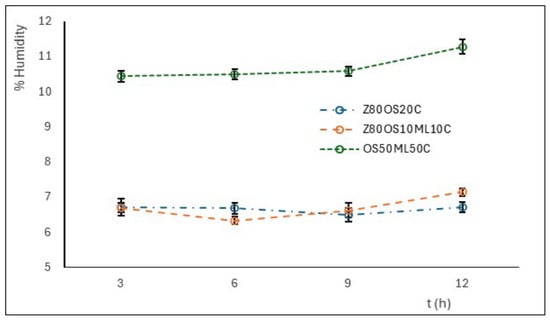
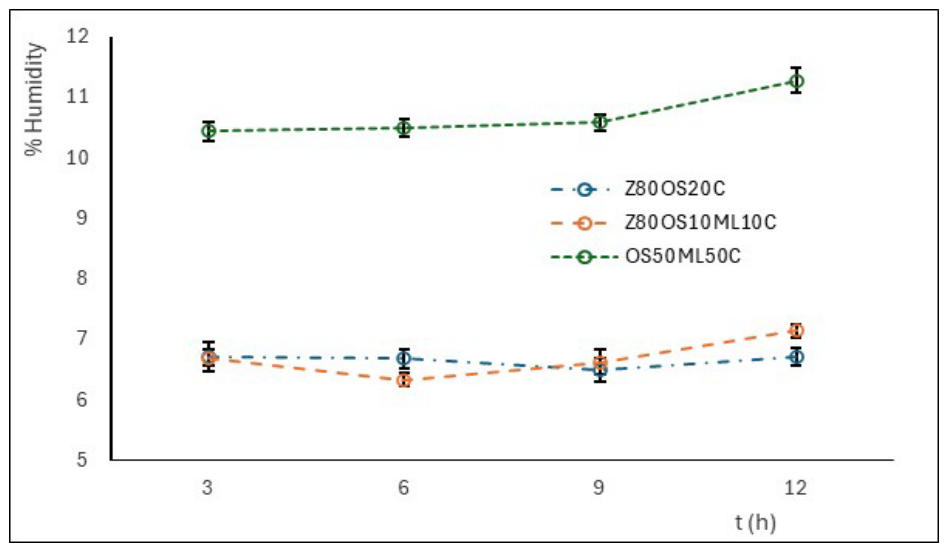
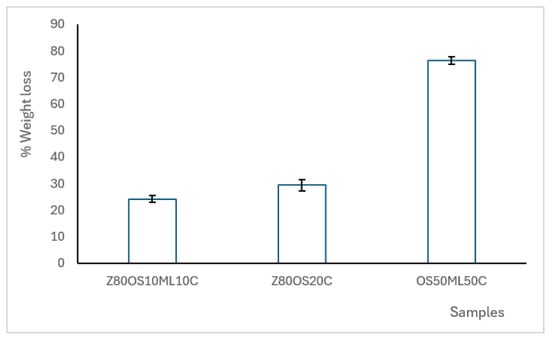
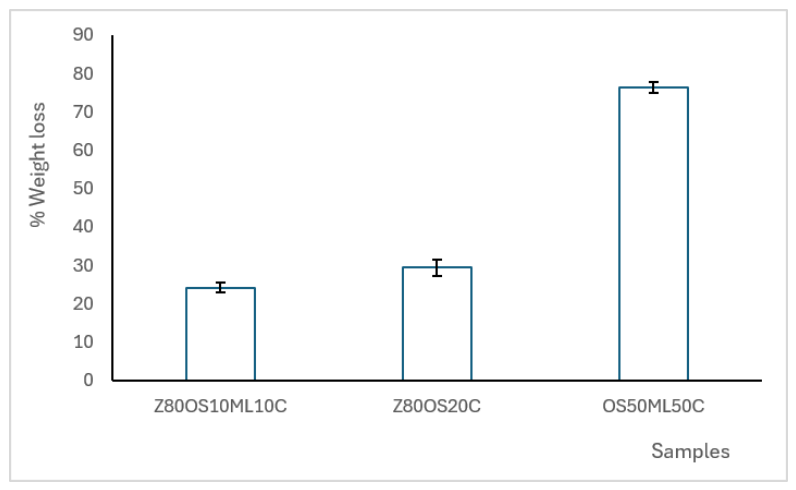
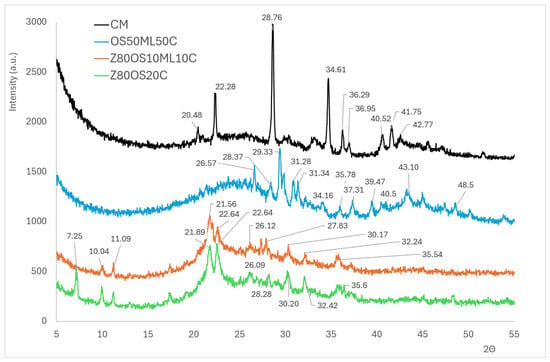
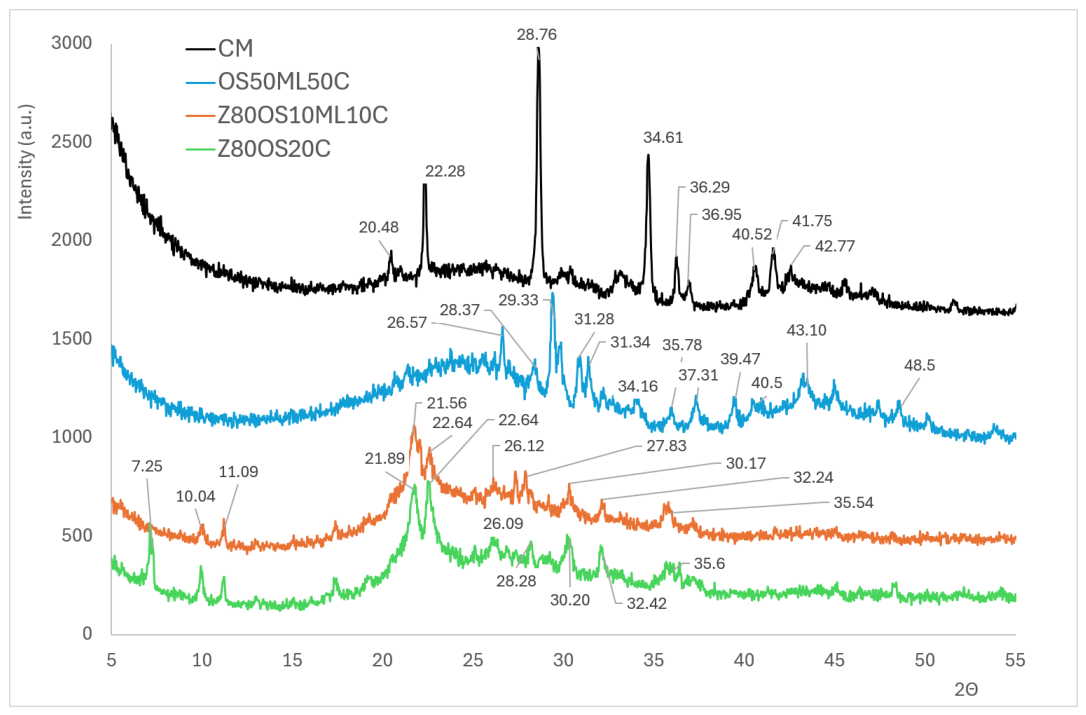
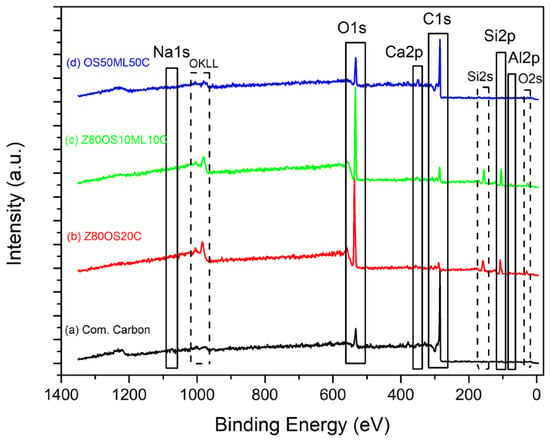
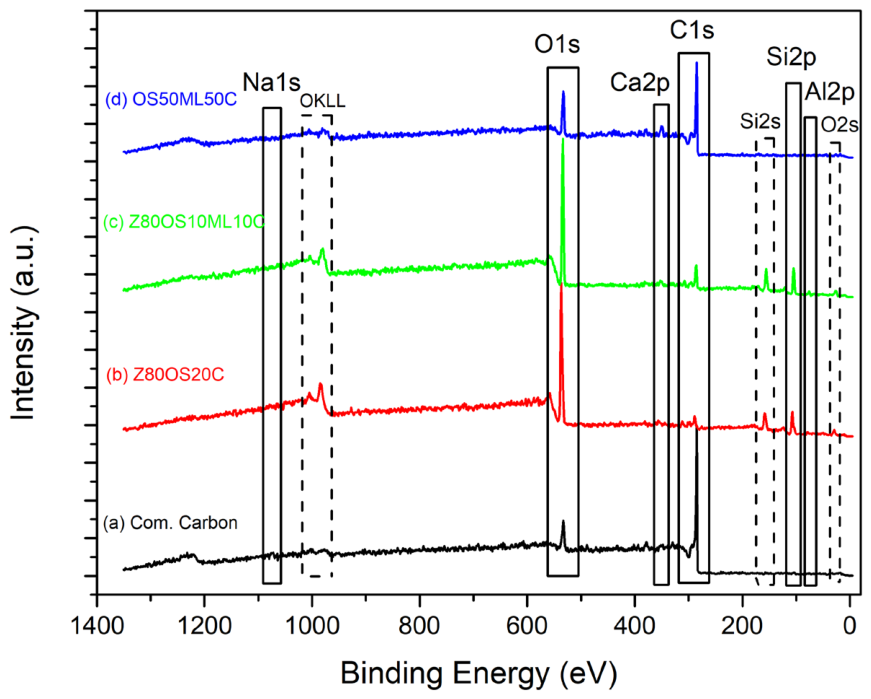
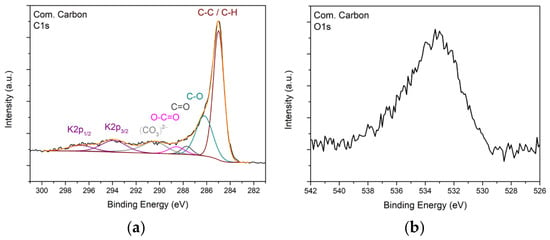
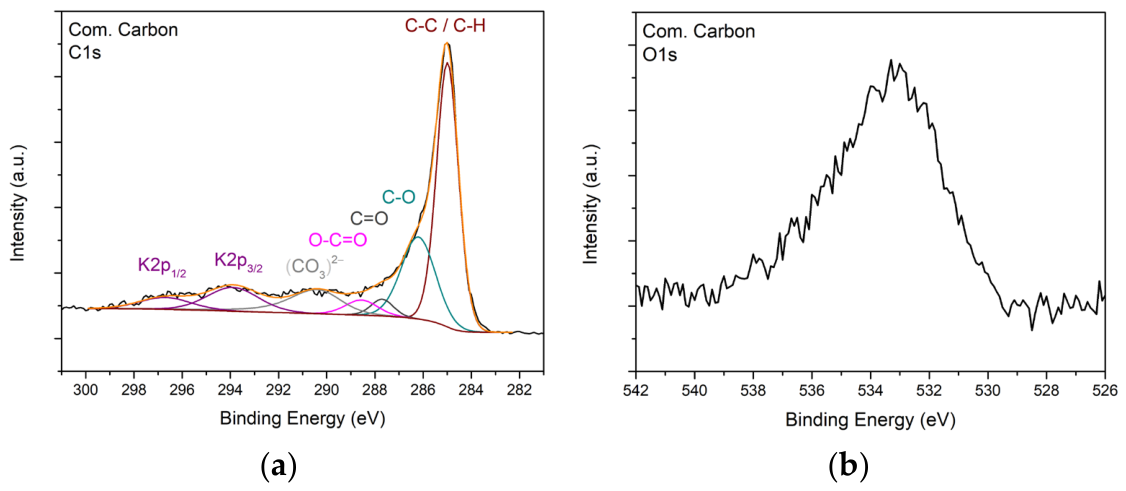
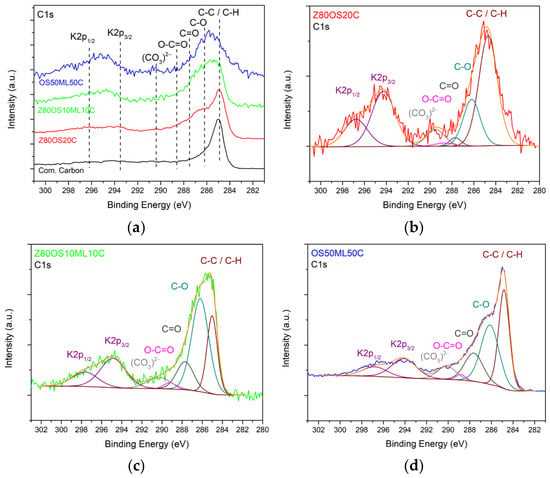
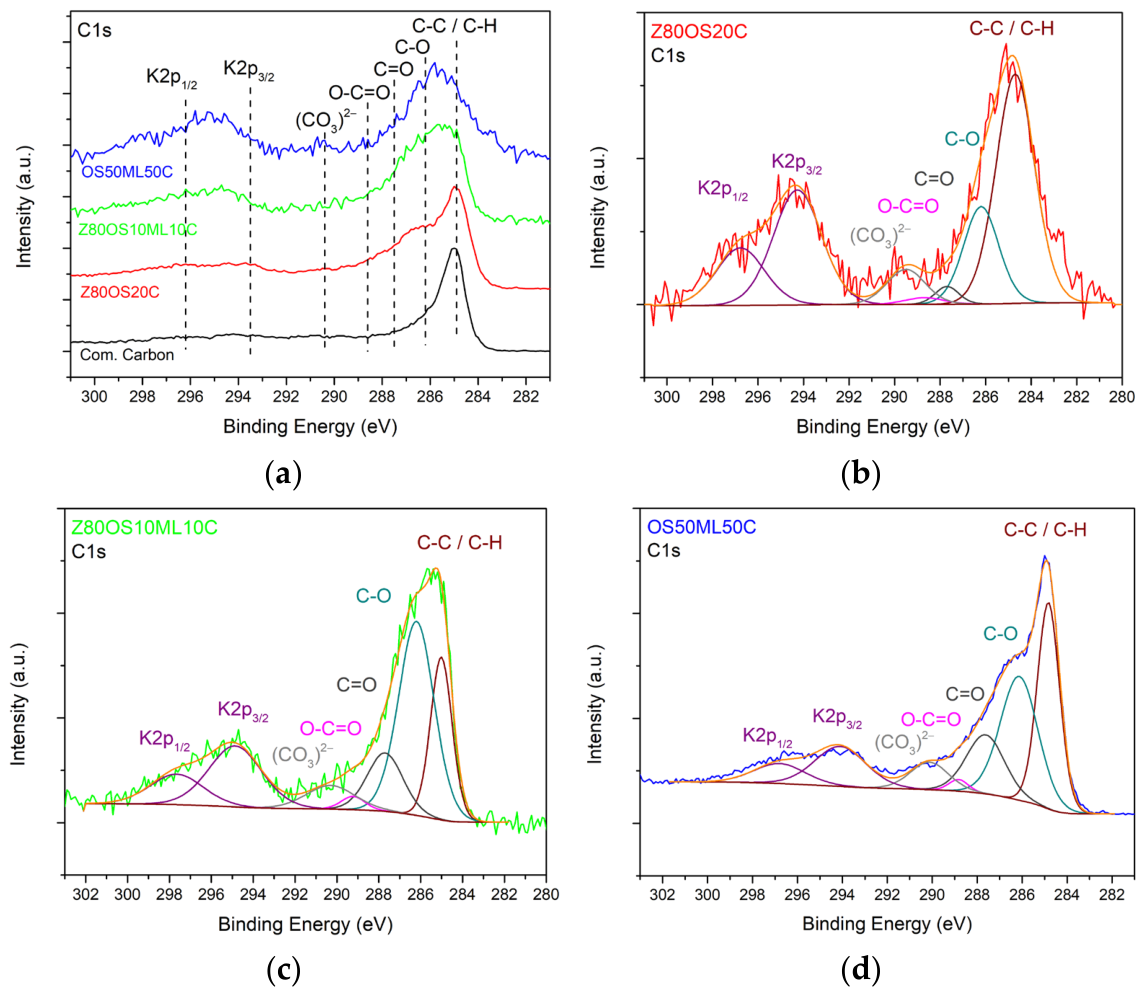
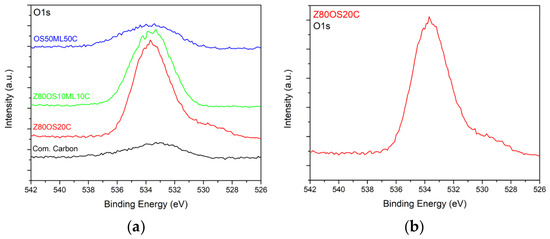
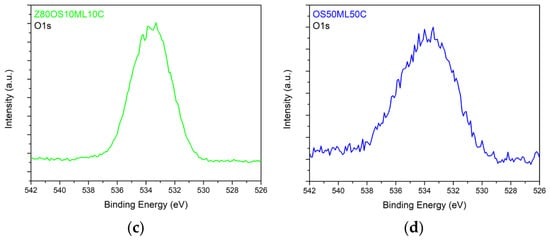
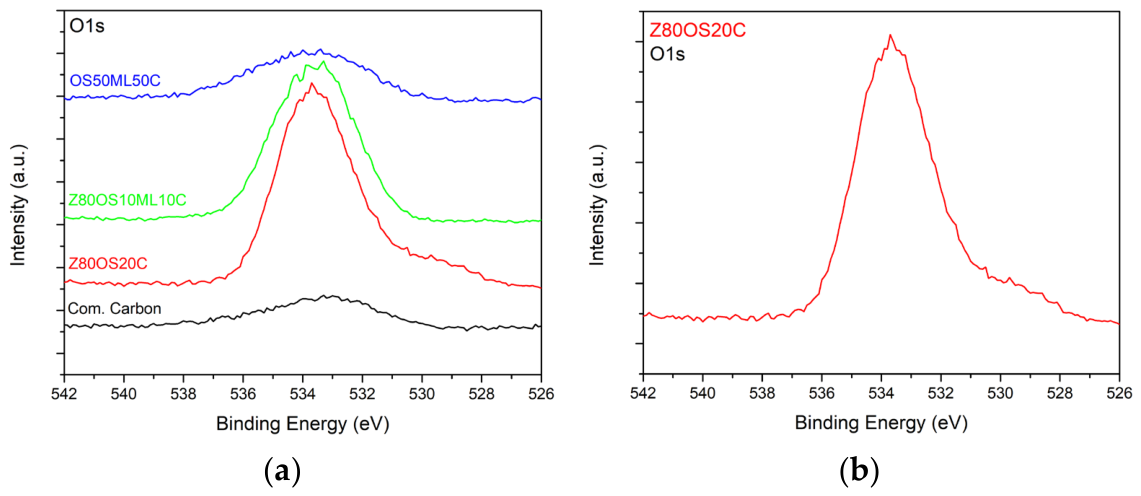
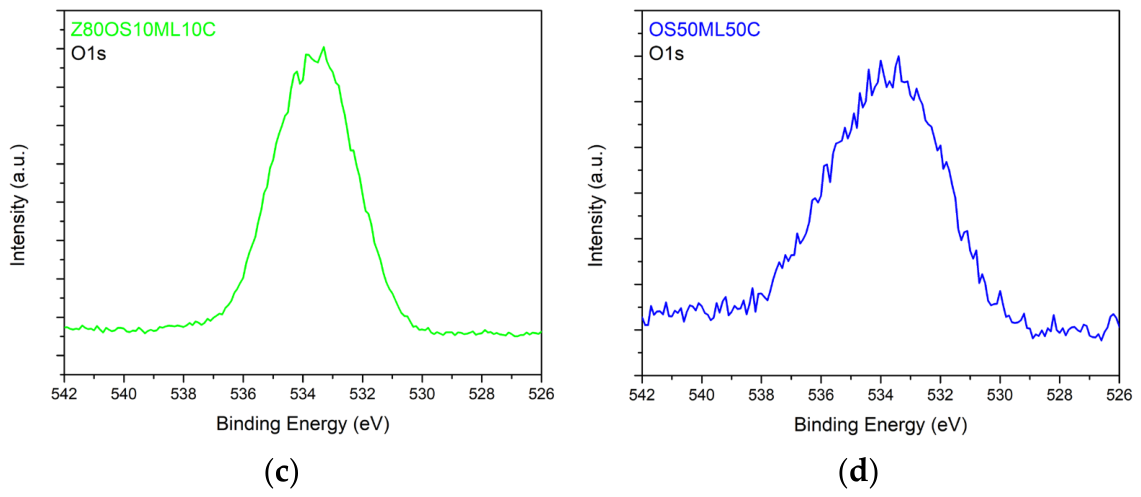
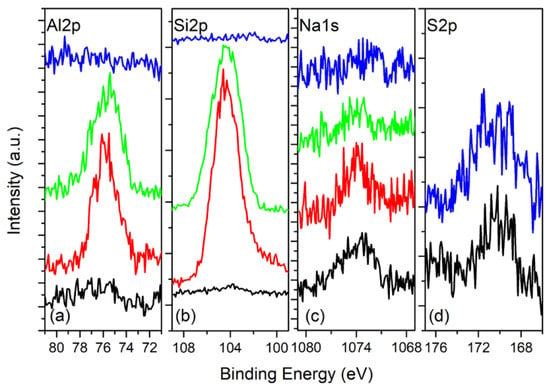
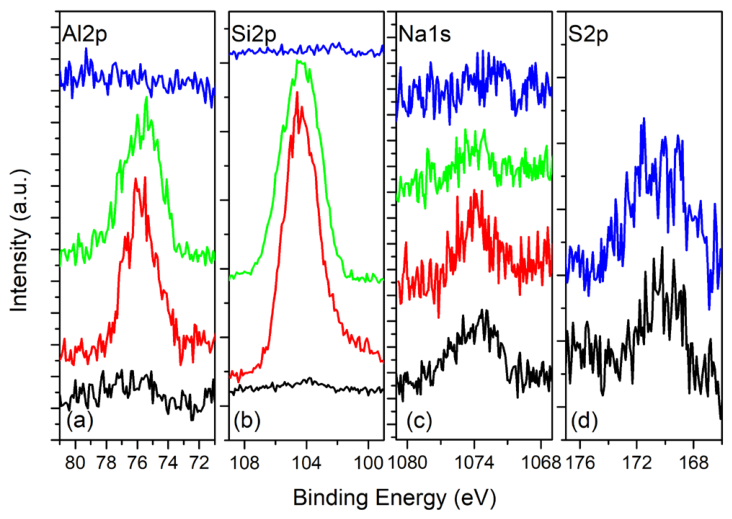
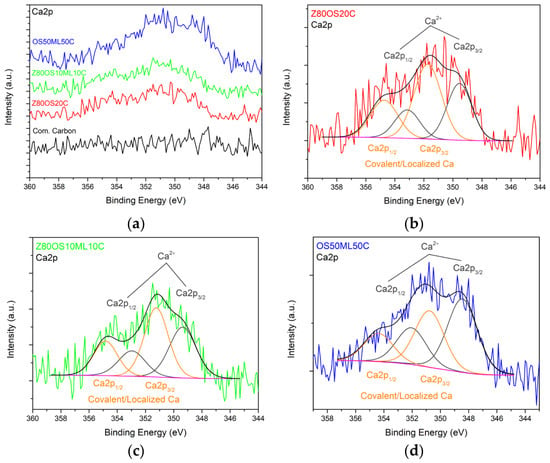
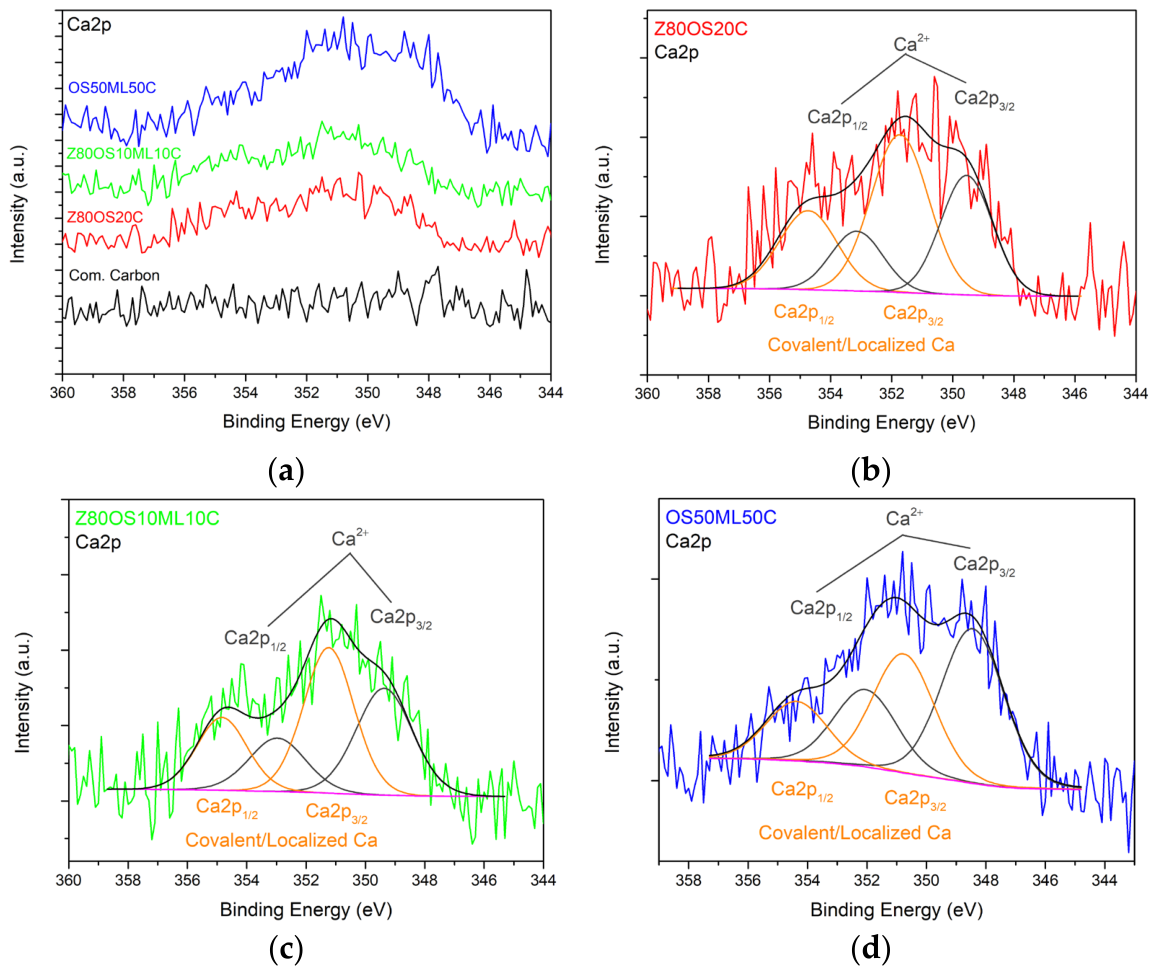
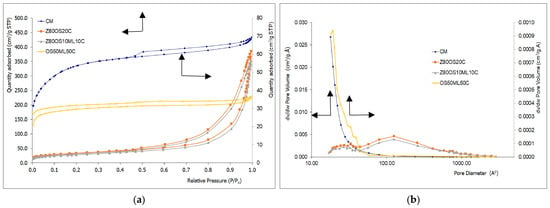
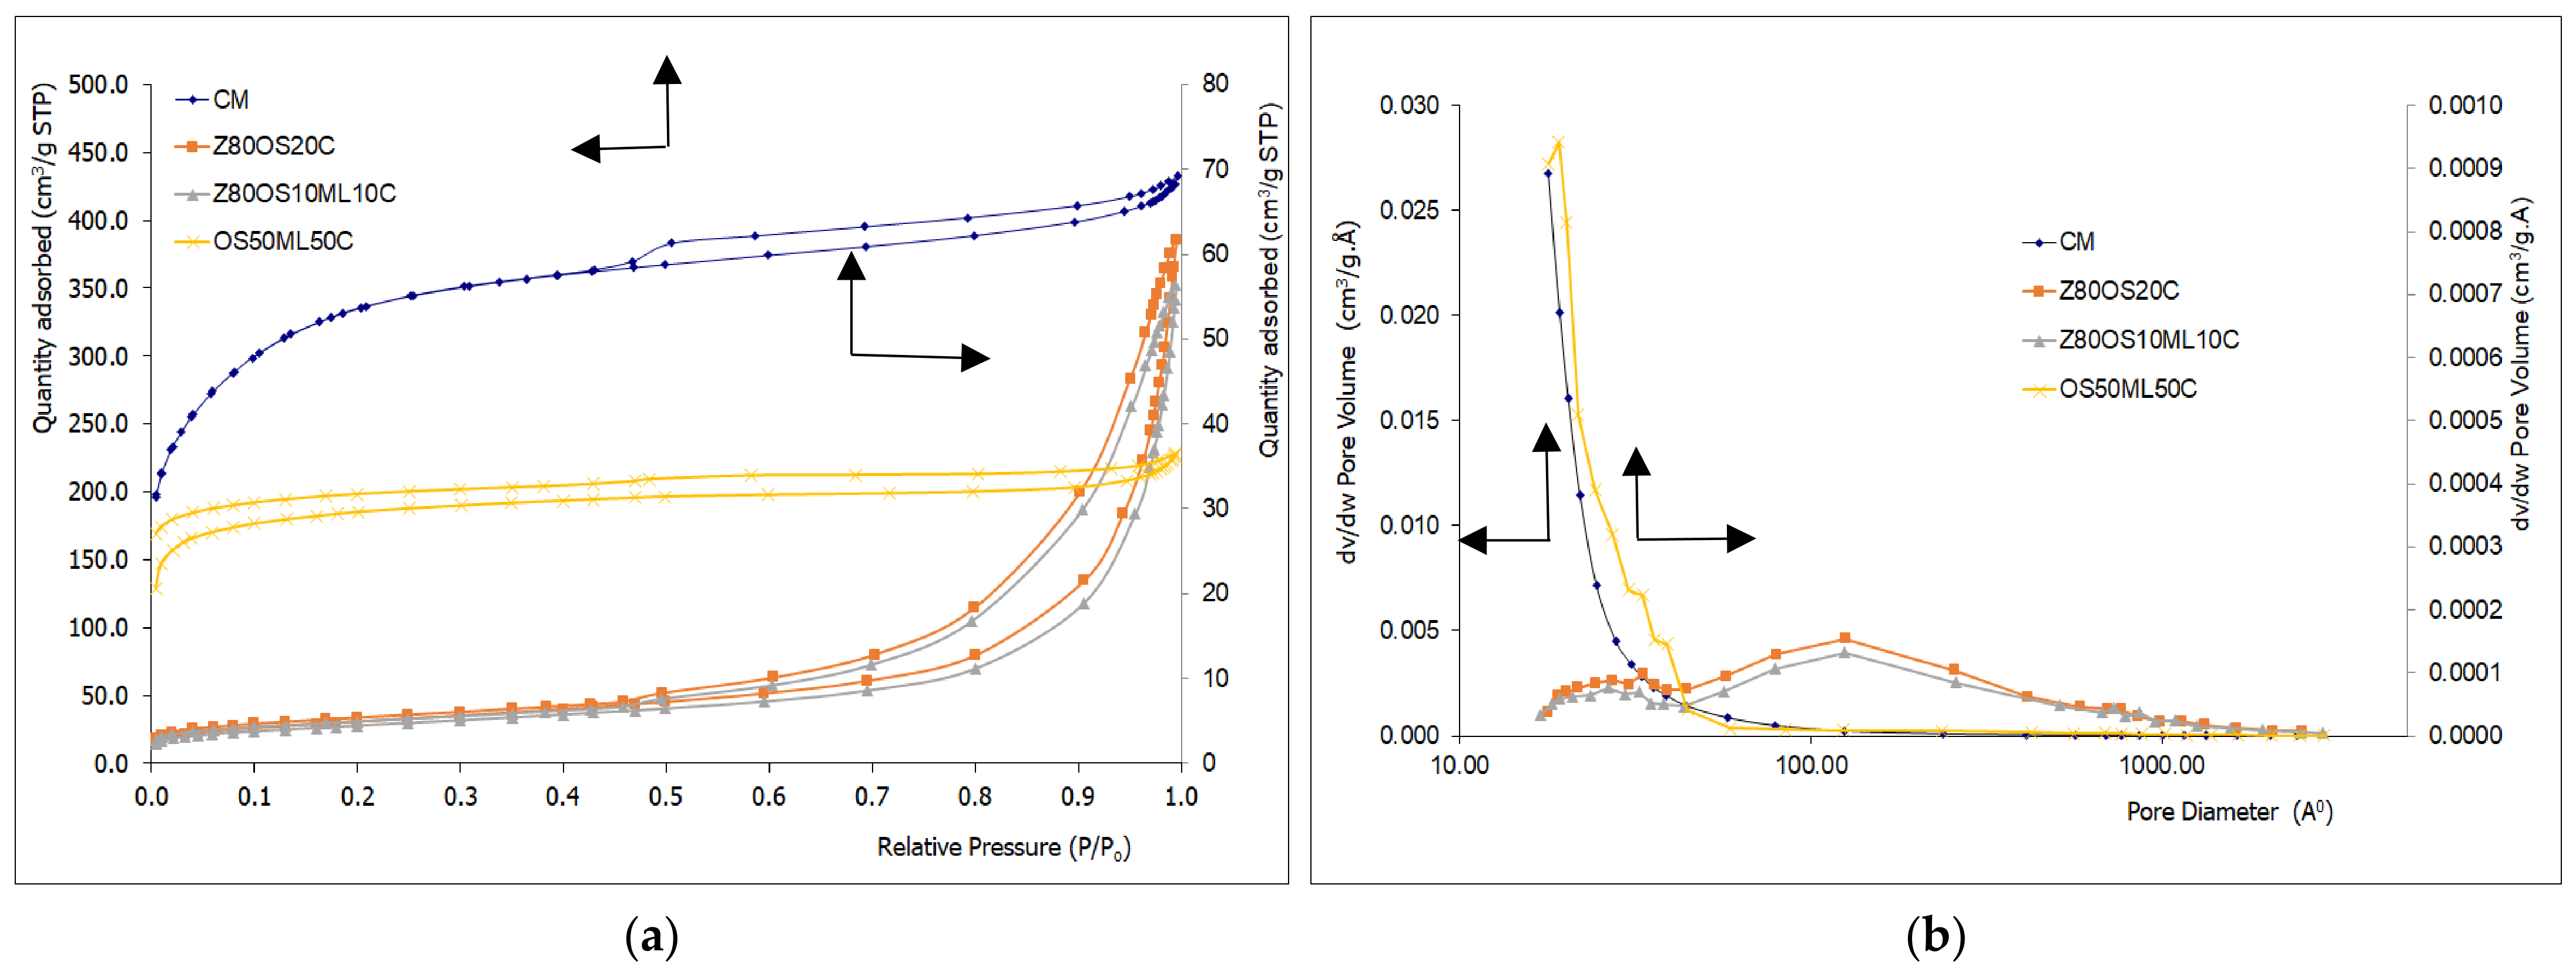
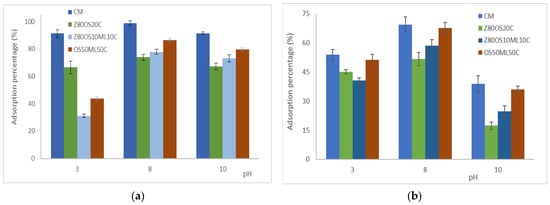
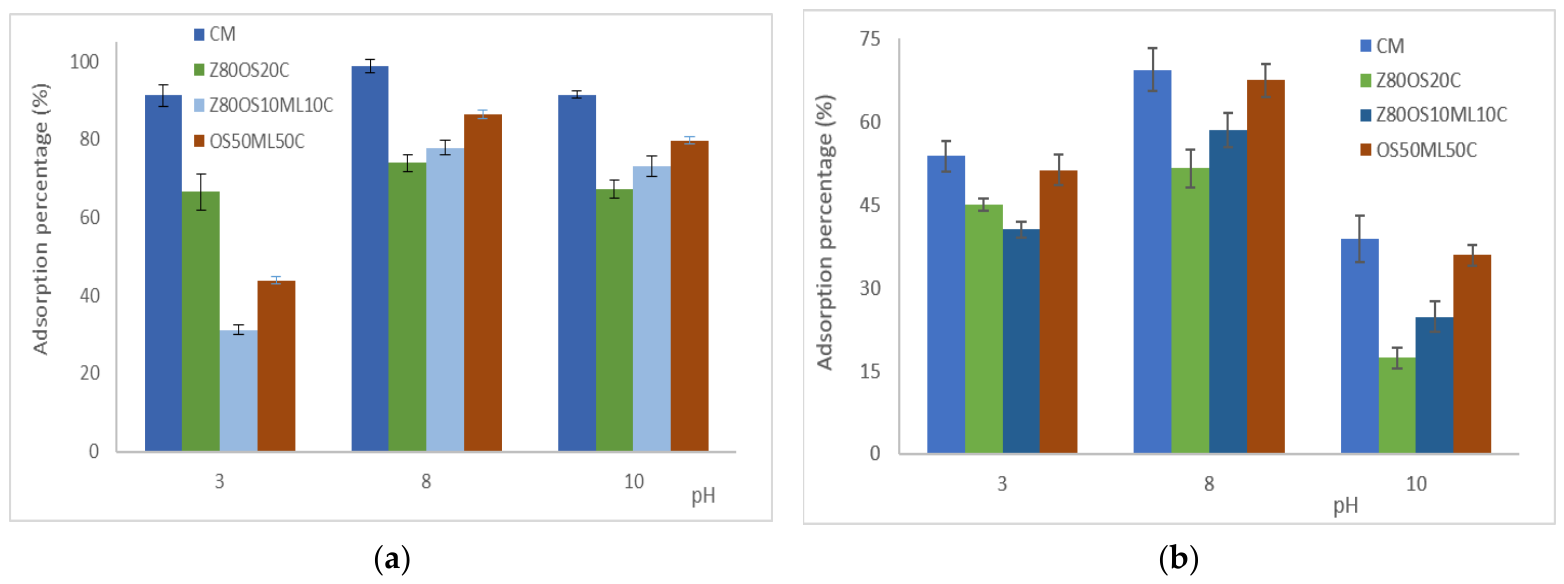
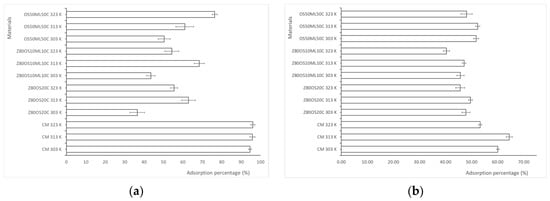
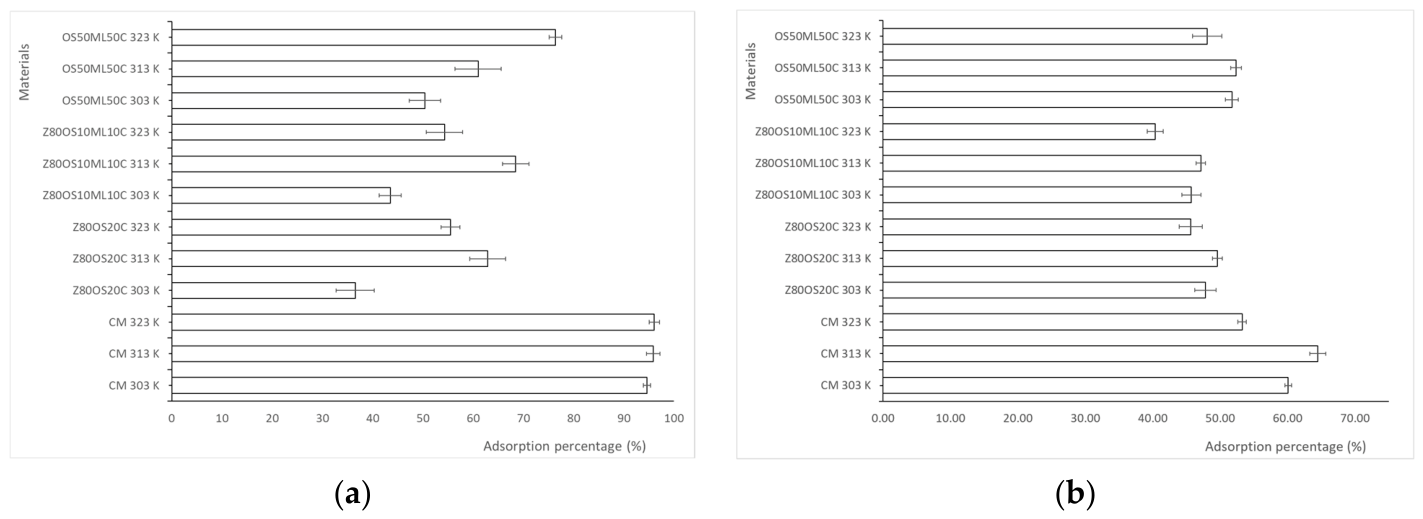
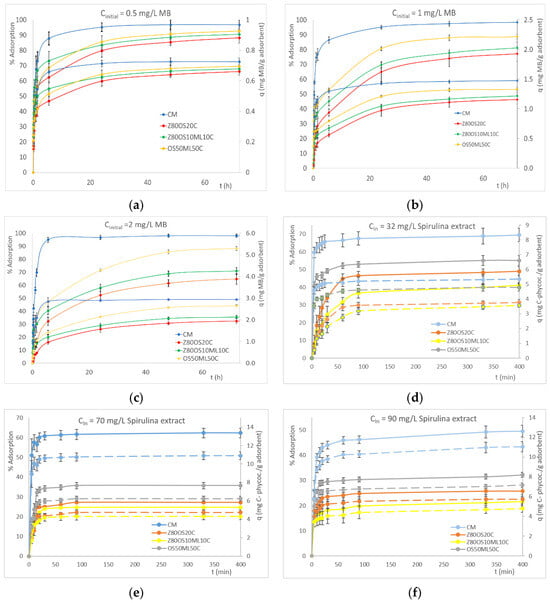
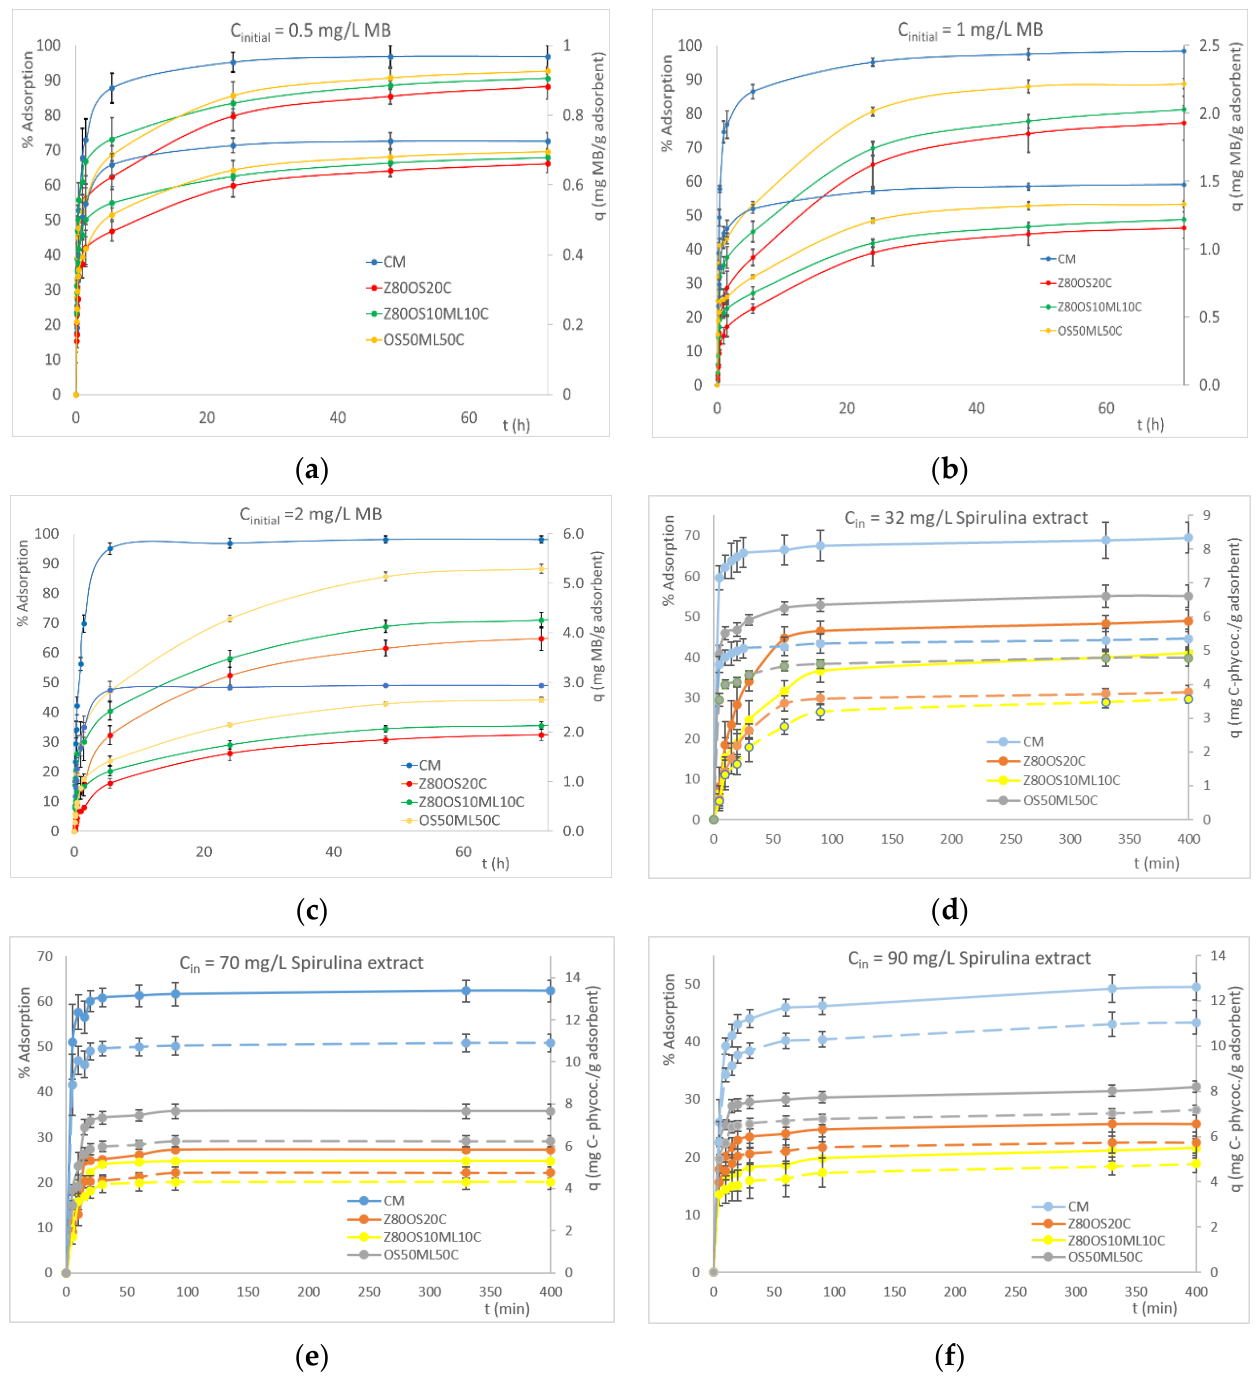
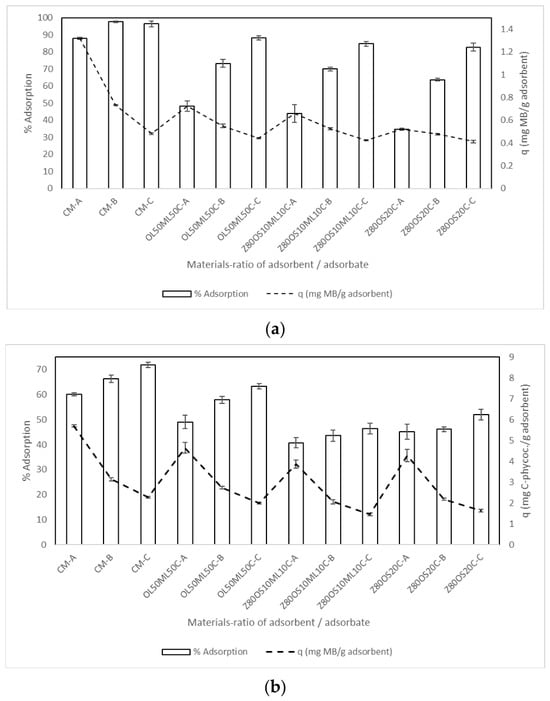
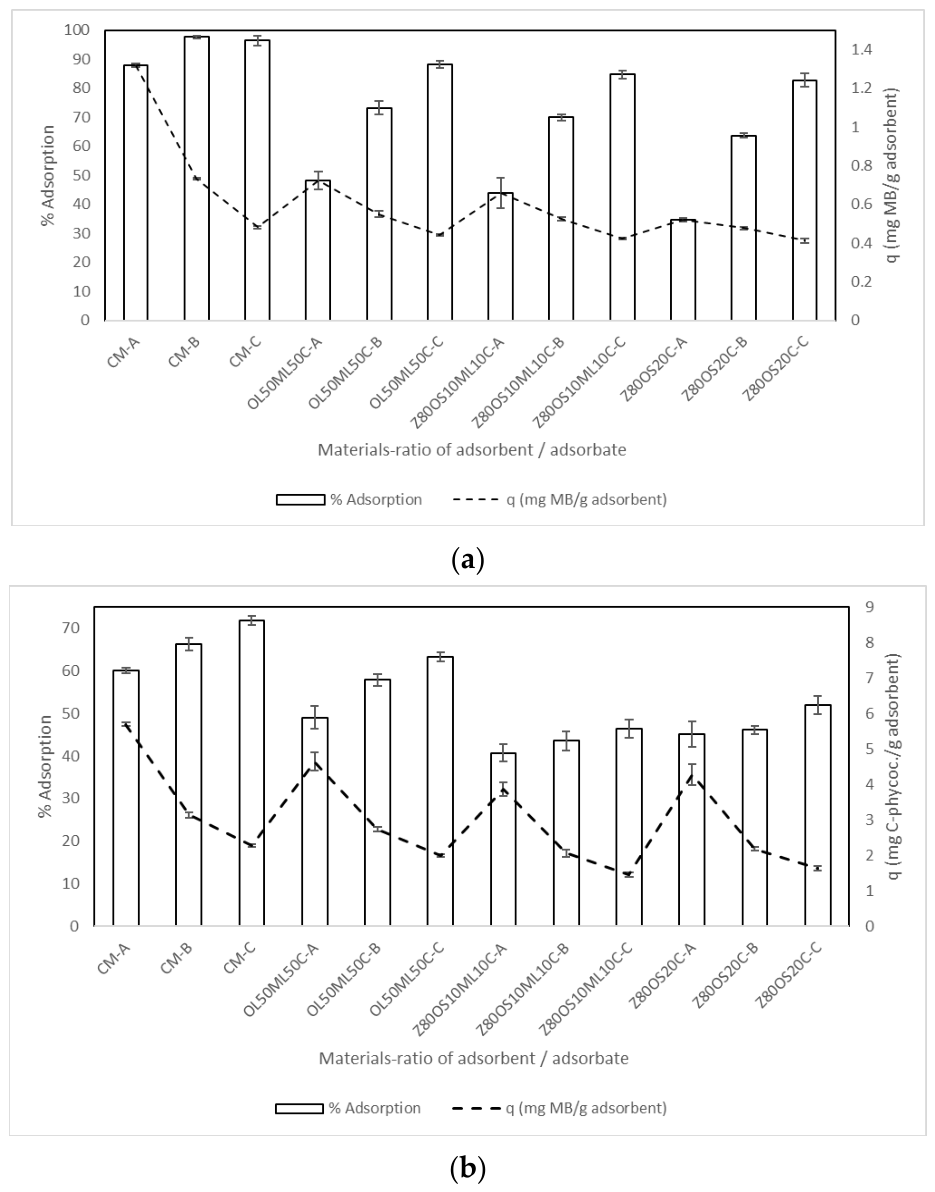
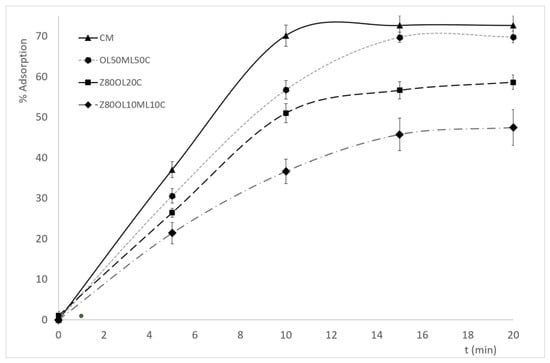
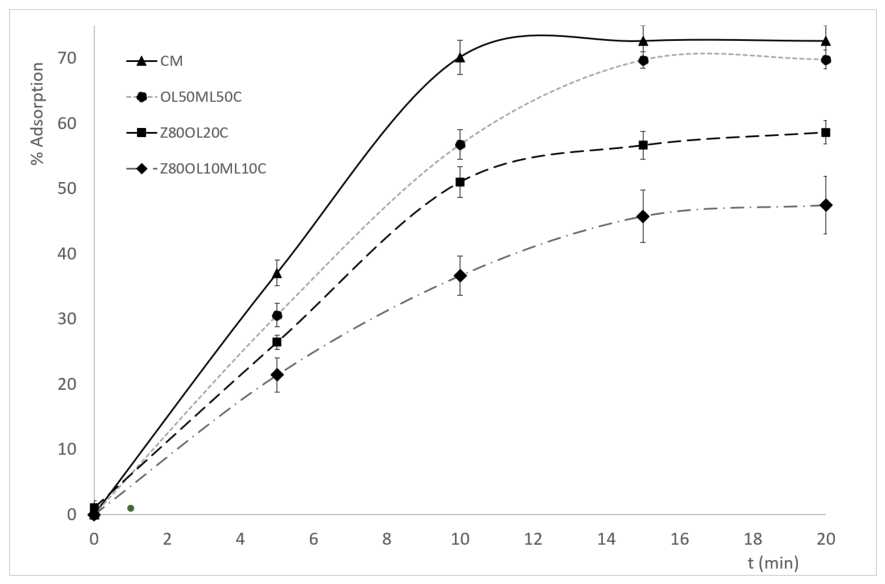

Disclaimer/Publisher’s Note: The statements, opinions and data contained in all publications are solely those of the individual author(s) and contributor(s) and not of MDPI and/or the editor(s). MDPI and/or the editor(s) disclaim responsibility for any injury to people or property resulting from any ideas, methods, instructions or products referred to in the content. |
© 2026 by the authors. Licensee MDPI, Basel, Switzerland. This article is an open access article distributed under the terms and conditions of the Creative Commons Attribution (CC BY) license.