


Highlights
What are the main findings?
- The integrated net-zero-emissions scenario achieved the largest reduction in global cement-sector direct CO2 emissions, lowering 2050 emissions by about 87.9% compared with the business-as-usual scenario.
- Materials efficiency and clinker substitution substantially reduced emissions, but near-zero direct emissions required large-scale CCS combined with demand moderation, clinker reduction, alternative fuels, and thermal-efficiency improvement.
- Global cement decarbonization requires a coordinated portfolio of mitigation measures because efficiency improvements and fuel switching alone cannot eliminate process emissions from clinker production.
- Distinguishing annual emissions from cumulative emissions is essential for policy planning, since delayed mitigation increases the long-term carbon burden even when strong reductions are achieved by 2050.
Abstract
Cement production remains one of the largest industrial sources of anthropogenic carbon dioxide (CO2) because of process emissions from limestone calcination and high-temperature fuel combustion. The primary objective of this study is to quantify the comparative effects of isolated and integrated mitigation portfolios on annual and cumulative global cement emissions through 2050 and to identify the principal leverage points needed for deep sectoral decarbonization. To achieve this, a global aggregate system dynamics model was developed and anchored to a 1990–2022 historical production baseline. The model evaluates five internally consistent scenarios: business-as-usual (BAU), efficiency and alternative fuels (EFF), materials efficiency and clinker substitution (MAT), carbon capture and storage (CCS), and an integrated net-zero-emission (NZE) pathway. The results show that while efficiency improvement alone (EFF) reduces 2050 annual emissions by 14.0% relative to BAU, it does not reverse sector-wide emissions growth. Deep decarbonization requires both substantial clinker-demand reduction (MAT, 33.2%) and broad CCS deployment (CCS, 61.1%). Only the integrated NZE pathway achieves an 87.9% reduction, lowering 2050 direct emissions to 325.8 Mt CO2. Cumulative emissions analysis further shows that delayed structural mitigation results in a large long-term carbon burden, with BAU accumulating 72.86 Gt CO2 over 2023–2050 compared with 40.07 Gt CO2 in the NZE case. A 5000-run Monte Carlo uncertainty analysis confirms that the scenario ranking remains robust under bounded-parameter variation and identifies CCS penetration and the clinker-to-cement ratio as the most influential determinants of long-term mitigation performance. Overall, the study provides a reproducible and policy-relevant framework showing that cement decarbonization cannot rely on single-technology measures, but instead requires coordinated early action across materials efficiency, alternative fuels, and large-scale carbon capture.
1. Introduction
Cement production remains one of the largest industrial sources of anthropogenic carbon dioxide (CO2), with emissions arising from both the process chemistry of clinker formation and the combustion of thermal fuels in rotary kilns. As a foundational supplier to housing, transport infrastructure, water systems, and industrial development, the cement sector is both essential to global progress and among the most difficult manufacturing industries to decarbonize [1,2,3,4]. Portland cement relies on clinker, and clinker production inherently releases CO2 through the thermal decomposition of calcium carbonate and the high-temperature fuels required for kiln operation. Because process emissions are chemically embedded in clinker formation, the sector cannot achieve deep decarbonization through fuel switching alone [2,3]. Achieving net-zero emissions in cement production, therefore, requires a systems-level approach that combines clinker substitution, low-carbon kiln technologies, thermal-efficiency improvement, alternative fuels, demand moderation, and commercial-scale carbon capture and storage (CCS). Beyond its climate importance, a net-zero cement pathway can also support supply chain resilience, reduce air pollution-related health burdens, and sustain manufacturing capacity under increasingly stringent climate policy conditions [5,6].
To provide a broader sectoral context, Figure 1 presents the distribution of global greenhouse gas (GHG) emissions by the economic sector in 2019, adapted from the U.S. Environmental Protection Agency (EPA) using Intergovernmental Panel on Climate Change (IPCC) 2022 data [7]. In this classification, cement-related emissions are included within the broader industry category, rather than reported as a standalone sector. Nevertheless, cement is a major contributor to industrial process- and energy-related emissions because clinker production releases CO2 from both the calcination of calcium carbonate (CaCO3 → CaO + CO2) and the combustion of thermal fuels required for high-temperature kiln operation [2,3,8,9,10]. Energy-related emissions depend on kiln thermal demand, fuel mix, and plant-level thermal efficiency, while process emissions scale directly with clinker production [2,11,12]. Consequently, the clinker-to-cement ratio is one of the most influential variables in analyses of cement-sector decarbonization [3,13,14]. Historical production data further show that global cement output expanded strongly between 1990 and 2022, meaning that credible decarbonization assessment must address both emissions intensity and the physical scale of future cement demand [1,15,16]. Although cement-based materials reabsorb some CO2 through carbonation over long time periods, this uptake is excluded from the core production-side accounting in this study because its climate benefit depends strongly on timing, exposure conditions, demolition practices, and accounting conventions [17].
Figure 1.
Global GHG by economic sector in 2019; adapted from U.S. EPA [7].
A substantial body of literature confirms that meaningful cement decarbonization requires a portfolio of complementary mitigation measures, rather than reliance on a single intervention. Sector-wide reviews consistently conclude that deep emissions reduction requires coordinated action across plant technology, cement composition, construction practices, and policy design [2,4,18,19,20]. Energy efficiency can reduce fuel demand through kiln modernization, waste-heat recovery, advanced grinding, and process optimization, but it cannot eliminate process emissions from clinker formation [2,3,11,20,21] Clinker substitution and broader materials efficiency directly reduce calcination-related emissions by lowering clinker content through supplementary cementitious materials (SCMs), such as calcined clay, limestone, slag, and fly ash [14,22,23]. Low-clinker cement systems, including limestone calcined clay cement (LC3), can provide substantial mitigation potential, although large-scale deployment remains constrained by SCM availability, quality control, cement standards, durability validation, and market acceptance formulations [24,25,26]. Alternative fuels and biomass can reduce emissions from fossil-fuel combustion when fuel quality, moisture control, kiln compatibility, and logistics are properly managed, but their climate value depends on the sustainability of feedstocks and the extent to which they genuinely displace fossil thermal inputs [27,28]. CCS is widely recognized as an important option for deep decarbonization of the cement sector because it can capture CO2 from both clinker calcination and kiln fuel combustion [18,19,20,21,29]. However, plant-level assessments show that CCS deployment is constrained by high capital costs and additional energy demand [18,19,20]. Wider deployment also depends on CO2 transport infrastructure, storage availability, and supportive institutional frameworks [20,27,29]. A summary of the major mitigation measures is provided in Table A1 (Appendix A).
The modeling literature also shows the need for dynamic assessment. Static accounting, LCA, and techno-economic studies provide valuable evidence on individual technologies and regional mitigation options, but they cannot fully capture the path-dependent interactions among cement demand, capacity turnover, technology adoption, clinker substitution, fuel switching, CCS deployment, and cumulative emissions. System dynamics is appropriate for this study because it represents stock–flow accumulation, feedbacks, time delays, and cumulative behavior in a transparent structure [17,30]. Previous cement-sector applications have used system dynamics to assess emissions mitigation, production-capacity behavior, LCA coupling, and decarbonization pathways [13,15,16]. Existing system dynamics applications have modeled national mitigation pathways, coupled system dynamics with LCA, and explored carbon-reduction strategies under regional or technology-specific assumptions [29,31,32,33]. However, many available studies remain regionalized, focus mainly on target-year annual emissions, or do not clearly distinguish annual emissions from cumulative emissions [3,13,14,17,33,34]. In addition, several published scenario models provide limited historical reference-mode validation or formal probabilistic uncertainty analysis, which weakens their usefulness for long-term policy assessment [30,31,32,33]. These limitations create a need for a transparent, global aggregate model that can compare multiple cement-sector mitigation portfolios using a common dynamic accounting framework. The objective of this study is to develop and apply a transparent global aggregate system dynamics model for assessing how alternative cement-sector decarbonization portfolios affect production, emissions intensity, annual direct CO2 emissions, and cumulative direct CO2 emissions from 2022 to 2050.
Against this objective, the study addresses three specific research gaps. First, it addresses the absence of a globally aggregated benchmark model that evaluates the simultaneous interactions among the principal cement-sector mitigation strategies, including demand moderation, clinker substitution, alternative fuels, thermal-efficiency improvement, and CCS, within a unified dynamic framework. Previous studies have examined important regional- or technology-specific pathways, including European cement decarbonization [11], system dynamics applications for cement emissions mitigation and production planning [13,15,16], and LEAP-LCA-based decarbonization assessment for China’s cement industry [35].
Second, it addresses the limited distinction between target-year annual emissions and cumulative emissions in many cement-sector pathway assessments. Annual emissions describe the CO2 released in a specific year, whereas cumulative emissions represent the accumulated carbon burden over the full assessment period, and are therefore critical for evaluating the effect of delayed mitigation [3,7]. Several cement-sector-scenario and prospective-assessment studies report important annual or target-year mitigation outcomes, but they do not always place equal emphasis on cumulative emissions as a separate policy-relevant output [23,36].
Third, it strengthens methodological transparency by combining historical reference-mode validation with a 5000-run Monte Carlo uncertainty and sensitivity analysis. The model is anchored to a 1990–2022 historical production baseline and evaluates five internally consistent scenarios: business-as-usual (BAU), efficiency and alternative fuels (EFF), materials efficiency and clinker substitution (MAT), carbon capture and storage (CCS), and an integrated net-zero-emissions (NZE) scenario. By linking cement demand, production capacity adjustment, clinker ratio, thermal intensity, alternative fuel deployment, CCS, annual direct CO2 emissions, and cumulative emissions, this study provides a reproducible and policy-relevant framework for assessing global cement decarbonization pathways.
2. Materials and Methods
2.1. Model Objective, System Boundary, and Data Basis
The model is formulated to represent the long-run evolution of global cement-sector direct CO2 emissions under interacting assumptions about demand, production capacity, technology, and mitigation. It is designed as a transparent global aggregate scenario model, rather than a plant-level techno-economic optimization model. The purpose is to compare how alternative mitigation portfolios affect cement production, emissions intensity, annual direct CO2 emissions, and cumulative direct CO2 emissions over time.
The model is initialized with a populated historical production baseline compiled from a public country-level cement dataset. The aggregated series indicates that global cement production increased from approximately 1340.3 Mt in 1990 to 4161.6 Mt in 2022, corresponding to an average annual growth rate of about 3.6% over the full period. The 2021 value is the local maximum in the populated series, followed by a moderate decline in 2022. These observations establish the historical scale of the modeled sector and provide the base-year production anchor for the forward scenarios.
The model boundary covers direct CO2 emissions from (i) clinker calcination and (ii) kiln fuel combustion. It therefore represents Scope 1 direct production emissions. Scope 2 emissions from electricity generation and Scope 3 emissions from quarrying, raw-material transport, alternative-fuel collection and preparation, SCM processing, clinker-replacement material production, and other upstream supply-chain activities are excluded from the core accounting. Carbonation uptake is also excluded from the core emissions balance, and is treated separately as an accounting limitation [37].
To improve transparency, the total model boundary is summarized in Table 1. The table defines the spatial, temporal, emissions, technological, stock-flow, and accounting boundaries used in the model, and clarifies the processes included in, and excluded from, the core system.
Table 1.
System boundaries and model scope of the global cement decarbonization model.
This boundary was chosen for two primary reasons. First, clinker calcination and kiln fuel combustion are the main direct sources of CO2 in cement production [2,3,8]. These emissions are also the components most directly affected by clinker-ratio reduction, fuel switching, thermal-efficiency improvement, and CCS deployment [2,3,38]. Second, limiting the accounting boundary to plant-gate direct emissions ensures that the comparison among demand moderation, clinker substitution, fuel switching, and CCS remains internally consistent with the model’s stock–flow structure [13,14]. Excluding Scope 2 electricity emissions and Scope 3 upstream and downstream supply-chain emissions also avoids introducing the high regional uncertainty associated with full life-cycle inventory modeling at the global aggregate level [28]. This boundary preserves the structural transparency of the core model, while keeping the scenario comparison focused on direct cement-production emissions. The base-year direct-emissions intensity is 0.59 t CO2/t cement, consistent with sector-wide cement decarbonization studies that report direct emissions from clinker calcination and kiln fuel combustion as the dominant components of cement-sector CO2 emissions [2,3]. This value is also within the range used in recent cement-sector scenarios and decarbonization assessments [11,13]. The initial clinker-to-cement ratio is 0.72 t clinker/t cement, consistent with recent global cement-sector assumptions and model calibration values [11,13]. Base-year thermal intensity is 3.6 GJ/t clinker, consistent with contemporary assessments of cement kiln energy demand [3,11,38]. The base-year alternative-fuel share is 10% of kiln thermal demand, a calibration input consistent with recent sectoral benchmark data.
In the implemented accounting, the process-emissions factor, , is assigned a central value of 0.525 t CO2/t clinker, consistent with stoichiometric values and global default factors used in cement-emissions studies [1,2]. This value is used as a global aggregate approximation, rather than as a plant-specific constant. In practice, the process-emissions factor may vary with raw-material carbonate composition, clinker chemistry, clinker moduli, kiln dust losses, bypass dust losses, and production technology. However, because the present model is formulated at the global aggregate scale, a single central value is applied to maintain accounting consistency across scenarios and to avoid introducing highly uncertain plant- and region-specific raw-material data.
2.2. System Dynamics Rationale and Model Structure
System dynamics provides a structurally appropriate framework for modeling cement-sector decarbonization because the transition is governed by stock–flow accumulation, time-lagged responses, and interacting feedback loops. Cement capacity evolves through investment and retirement cycles, while demand adjusts gradually to macroeconomic trends and materials-efficiency policies. Technology adoption alters emission intensities along diffusion paths, rather than instantaneously. Carbon capture deployment entails multi-year lead times for plant retrofits, CO2 transport networks, and storage infrastructure, and the existing system dynamics applications in cement research demonstrate that this approach preserves causal transparency and structural clarity while remaining directly applicable to long-horizon policy analysis [31,32,33]. Building on established regional (e.g., South African) and global studies that link production growth, emission factors, and mitigation pathways, this study adopts an intentionally aggregate system dynamics structure [31,32]. This design isolates a parsimonious set of sector-level control variables, enabling clear attribution of emission pathways to specific intervention portfolios, without obscuring the underlying dynamic mechanisms.
While the model captures physical stock–flow dynamics and time delays, including capacity investment, capacity retirement, clinker-ratio adjustment, and cumulative emissions, it intentionally treats economic drivers such as CO2 pricing, climate-policy costs, investment incentives, and endogenous technological learning as exogenous scenario parameters. The major exogenous parameters and scenario variables are listed in Appendix B. This boundary was chosen to maintain transparency and parsimony in a global aggregate assessment. The focus of the present model is therefore on the systemic impact of mitigation portfolios, including clinker substitution, alternative fuels, materials-efficiency moderation, and CCS deployment, rather than on detailed economic forecasting or region-specific carbon-price optimization.
The proposed system dynamics model is formulated with annual time steps from 2022 to 2050. Table A2 in Appendix A lists and defines the main model variables, symbols, and units used in the aggregate stock–flow formulation. Cement demand, installed production capacity, and cumulative CO2 emissions are represented as state variables, while investment, retirement, production output, emissions intensity, and annual direct CO2 emissions are represented as flows or algebraic variables. This structure captures the dynamic interaction between demand growth, capacity expansion, asset retirement, material-efficiency measures, clinker intensity, fuel substitution, CCS deployment, and cumulative emissions.
2.2.1. Governing Equations
Cement demand evolves according to
where is cement demand in year , is the exogenous demand growth rate, and is the materials-efficiency moderation factor. Equation (1) assumes that future demand is driven by baseline market growth but reduced by scenario-specific measures such as improved concrete design, reduced material intensity, longer service life, and more efficient cement use.
Desired production capacity is determined by
where is the desired cement-production capacity and is the target capacity-utilization rate. This formulation assumes that producers plan capacity based on expected demand, while maintaining a utilization margin to avoid supply shortages.
New capacity investment is represented as
where is a new investment and is the investment response time. The maximum operator prevents negative investment and implies that excess capacity is not immediately removed through disinvestment. Instead, capacity reduction occurs through normal retirement.
Capacity retirement is defined as
where is retired capacity and L is the average technical lifetime of cement-production assets.
Installed capacity then evolves as
where is the installed cement production capacity. Equations (2)–(5) represent the capacity-adjustment block of the model. They capture the delay between demand growth and capacity expansion, as well as the inertia created by long-lived cement plants.
Realized cement production is constrained by demand and available utilized capacity:
where is realized cement production and is the maximum attainable utilization rate. Equation (6) ensures that production cannot exceed market demand, or the available capacity is operated at maximum feasible utilization.
Direct-emissions intensity is represented as the sum of process and fuel-combustion components:
where is direct-emissions intensity, is the process-emissions factor per ton of clinker, is the clinker-to-cement ratio, is the share of production equipped with CCS, is the capture efficiency of equipped plants, is the thermal-intensity term, is the fossil-fuel emissions coefficient, and is the alternative-fuel share. The first term represents CO2 from clinker production, while the second term represents fuel-related CO2. In the central model specification, is set to 0.525 t CO2/t clinker. This value represents a global aggregate approximation and may vary in practice with raw-material carbonate composition, clinker chemistry, clinker moduli, kiln dust losses, bypass dust losses, and production technology. The term reduces both process and fuel emissions according to the effective capture rate. The term represents the reduction in fossil-fuel emissions associated with alternative-fuel substitution, assuming that the alternative-fuel component displaces 80% of fossil-related CO2 per unit of substituted thermal energy.
The CCS component is treated as an aggregate sector-level capture term, rather than as a technology-specific representation of cement-plant capture systems. This assumption means that the model applies the same effective capture fraction to both process-related and fuel-related direct emissions. The model does not distinguish among post-combustion capture, oxyfuel combustion, calcium looping, direct separation, or other CCS routes. It also does not explicitly include auxiliary energy demand, capture-related efficiency penalties, operating costs, compression energy, CO2 transport cost, or storage cost. These factors are important for plant-level techno-economic assessment, but they fall outside the scope of the present global aggregate scenario model. Therefore, the CCS results reported in this study should be interpreted as conditional sector-level emissions reductions under assumed capture penetration and average capture efficiency.
Annual direct CO2 emissions are calculated as
where is the annual direct CO2 emissions. Cumulative emissions are then updated as
where is cumulative direct CO2 emissions. Equation (9) is important because climate relevance depends not only on annual emissions in the target year, but also on accumulated emissions over the full simulation period.
In general, Equations (1)–(9) provide a compact representation of the main engineering and planning mechanisms governing cement-sector CO2 emissions. The demand block captures market growth and moderation in materials efficiency. The capacity block captures investment delay, retirement, and utilization constraints. The emissions block links clinker ratio, fuel intensity, alternative fuels, and CCS deployment to direct-emissions intensity. This formulation is intentionally parsimonious, but it preserves the core stock–flow relationships required to evaluate long-term decarbonization pathways in the cement industry.
2.2.2. Model Boundaries Regarding Economic and Policy Feedbacks
It is important to clarify the structural boundaries of the current model with respect to economic and policy dynamics. While more comprehensive system dynamics frameworks often incorporate endogenous feedback loops for technological learning, dynamic CO2 pricing, climate-policy costs, investment incentives, and market adoption, these factors are intentionally treated as exogenous scenario drivers in the present global aggregate model. This boundary was deliberately chosen to maintain structural transparency and parsimony. By isolating the physical stock–flow relationships, including capacity delays, clinker-to-cement ratios, production volumes, direct-emissions intensity, and cumulative emissions, the model avoids introducing highly uncertain and region-specific economic assumptions into a global-scale assessment. Accordingly, the framework is designed as a scenario-based decision-support tool for evaluating the systemic impact of distinct mitigation portfolios, rather than as a comprehensive techno-economic forecasting model.
Economic and policy factors are nevertheless represented indirectly, through the scenario assumptions. For example, stronger climate policy, higher CO2 prices, procurement reform, or expanded investment support would be reflected in more ambitious assumptions for CCS penetration, clinker-factor reduction, materials-efficiency deployment, and alternative-fuel substitution. Conversely, weaker policy signals or constrained investment would correspond to slower technology adoption and lower mitigation endpoints. Future iterations of the model should couple the present physical stock–flow core with endogenous techno-economic modules. Such extensions could integrate technology-specific learning curves, explicit CO2 price pathways, carbon contract mechanisms, CCS infrastructure cost functions, capital investment constraints, and regional policy variables. These additions would enable subsequent versions of the model to evaluate both the physical and economic feasibility of cement-sector decarbonization pathways under dynamic market conditions.
2.3. Calibration, Historical Reference-Mode Validation, and Internal Checks
Calibration was performed in four sequential steps. (i) The model scale was initialized using the observed 2022 global cement production value of 4161.6 Mt. (ii) The base-year direct emissions intensity anchor of 0.59 t CO2/t cement was imposed so that the initial model reproduced literature-consistent total direct emissions of approximately 2455.3 Mt CO2 in 2022. (iii) The clinker ratio, thermal intensity, and alternative-fuel share were parameterized using values consistent with contemporary sector syntheses [2,3,8,11,13,38]. (iv) The fossil-fuel emissions coefficient was solved implicitly so that the sum of the process- and fuel-emissions terms matched the imposed total direct-emissions intensity. The calibration values are reproduced in Table A3 (Appendix A).
The implemented 2022 accounting gives 1573.1 Mt CO2 from calcination and 882.3 Mt CO2 from fuel combustion. These values correspond to process- and fuel-emissions shares of 64.1% and 35.9%, respectively. This decomposition is consistent with the broader cement-decarbonization literature, which identifies process emissions from carbonate decomposition as the dominant component of direct CO2 emissions [2,3,8,13]. Therefore, the calibration satisfies both numerical consistency and physical plausibility by reproducing the expected ordering of dominant emission sources.
2.3.1. Historical Reference-Mode Validation
Table A4 (Appendix A) provides the relevant historical baseline from 1990 to 2022, year-over-year growth percentage (YoY), and Index 1990. In addition to the 2022 initialization, the historical cement production series from 1990 to 2022 was used as a reference model for evaluating the behavior of the demand-production block. The purpose of this validation step is not to recalibrate the forward scenarios or modify the 2022–2050 results, but to confirm that the demand-production block is consistent with the observed historical production pattern. The historical reference mode is constructed by applying the observed annual growth rates from the production dataset to the demand equation.
The observed annual growth rate is defined as
The reconstructed model demand is then calculated recursively as
with the initial condition
where is the observed cement production in year , is the observed cement production in the preceding year, is the observed annual production-growth rate, and is the reconstructed model demand. Because the historical reference-mode check is not a mitigation-policy simulation, the materials-efficiency moderation factor in Equation (1) is set to zero for this validation step. The demand equation, therefore, reduces to the recursive form shown in Equation (11). This procedure checks whether the demand block, unit conversion, and annual time-step implementation consistently reproduce the historical production reference mode.
The historical data show that global cement production increased from approximately 1340.3 Mt in 1990 to 4161.6 Mt in 2022. This corresponds to an average annual growth rate of approximately 3.6% over the full period. When driven by the observed annual growth rates, the model reproduces this long-term change in scale. Therefore, the historical production series shown in Figure 2 serves both as a descriptive baseline and as a reference-mode validation for the demand-production block.
Figure 2.
Historical global cement production and modeled production under the five scenarios.
Historical emissions reproduction was treated as a consistency check, rather than a full annual backcasting exercise because the model is designed primarily for forward scenario assessment from 2022 to 2050. Full annual reconstruction of historical global cement emissions would require year-specific data on clinker ratios, kiln technologies, fuel mixes, plant-level thermal intensities, and regional production structures. Instead, the emissions block was checked against the 2022 direct-emissions intensity anchor of 0.59 t CO2/t cement and the resulting total direct emissions of approximately 2455.3 Mt CO2.
Base-year direct emissions are calculated as
where is the estimated total direct CO2 emissions in 2022, and is the direct-emissions intensity in 2022, in t CO2/t cement. The process-emissions component is calculated using the process-emissions factor, , defined in Equation (7):
where is process-related CO2 emissions in 2022, is observed cement production in 2022, is clinker-to-cement ratio in 2022, and is the process-emissions factor per ton of clinker. Fuel-combustion emissions are then obtained as the residual between total direct emissions and process emissions:
where is fuel-combustion CO2 emissions in 2022. The base-year decomposition therefore gives 1573.1 Mt CO2 from calcination and 882.3 Mt CO2 from fuel combustion, corresponding to process- and fuel-emissions shares of 64.1% and 35.9%, respectively. This distribution is consistent with the established sectoral understanding that process emissions dominate direct emissions from cement production.
Accordingly, the historical validation approach combines three checks: (i) reproduction of the observed 1990–2022 cement-production reference mode, (ii) consistency of the 2022 direct-emissions intensity with literature-based values, and (iii) verification that the process/fuel-emissions split follows the expected physical ordering. This validation structure is appropriate for a global aggregate scenario model, while recognizing that detailed historical emissions backcasting would require annual global data on clinker ratios, kiln technologies, fuel mixes, and plant-level thermal intensities.
2.3.2. Internal Checks
Model checking was conducted through dimensional consistency, logical bounds, and endpoint sanity tests. All shares are bounded between zero and one. Production cannot exceed the available utilized capacity. Direct-emissions intensity remains non-negative under all scenarios. CCS penetration is allowed to increase only after 2030, to avoid an unrealistically immediate deployment. Carbonation is excluded from the emissions balance, thereby preventing artificial early offsets [17]. Because the model is aggregate and starts its forward simulation in 2022, validation is framed as consistency with observed historical production scale, literature-based sector parameters, and expected physical emissions structure, rather than as a claim of exact year-by-year reproduction of global plant-level behavior.
2.3.3. External Benchmark Comparison with IEA and GCCA Pathways
In addition to the historical reference-mode validation presented in Section 2.3.1, the model- baseline and forward scenario assumptions were compared with external sectoral benchmarks. This comparison was used to assess whether the model assumptions are directionally consistent with recognized cement-sector decarbonization pathways. It is not intended as a formal validation of future outcomes, because 2050 decarbonization pathways are conditional scenarios, rather than observed datasets.
The 2022 baseline was cross-checked against independent sectoral benchmarks. The global cement production value used to initialize the model is consistent with the historical cement production dataset reported by Andrew [15]. The calibrated 2022 direct-emissions intensity of 0.59 t CO2/t cement is also consistent with the order-of-magnitude reported in recent global cement-sector assessments, which identify cement production as a major industrial source of CO2 due to both clinker calcination and high-temperature fuel combustion [15,39]. This agreement supports using the 2022 baseline as a reasonable global aggregate starting point for the scenario simulations.
The forward scenario assumptions were further compared with external decarbonization benchmarks from the IEA Net Zero Roadmap and the GCCA 2050 Cement and Concrete Industry Roadmap. The IEA cement-sector pathway identifies reductions in the clinker-to-cement ratio, lower kiln thermal energy intensity, increased use of low-emission fuels, and large-scale CO2 capture as central requirements for alignment with net-zero emissions by 2050 [39]. Similarly, the GCCA roadmap identifies clinker reduction, concrete efficiency, alternative fuels, renewable electricity, CCUS, and supportive policy frameworks as major strategies for achieving net-zero concrete by 2050 [40]. The NZE scenario in the present model is therefore designed to be directionally consistent with these benchmark pathways by combining demand moderation, clinker-ratio reduction, thermal-efficiency improvement, alternative-fuel substitution, and broad CCS deployment.
This comparison is not intended to reproduce the IEA or GCCA pathways exactly, since those roadmaps include regional, technological, economic, and policy detail beyond the boundary of the present global aggregate model. Instead, the comparison provides an external plausibility check, showing that the modeled NZE assumptions reflect the same broad mitigation logic emphasized in recognized sectoral decarbonization pathways. The sensitivity and uncertainty of the forward results are assessed separately through the 5000-run Monte Carlo analysis described in Section 2.5, with the corresponding results presented in Section 2.6.
2.4. Scenario Design
The study implemented five scenarios to evaluate alternative cement-sector decarbonization pathways through 2050. Each scenario represents an internally consistent benchmark package, rather than a forecast. The business-as-usual (BAU) case assumes continued growth in cement demand, with modest improvements in the clinker-to-cement ratio, kiln thermal intensity, and alternative-fuel use. The efficiency and alternative-fuels (EFF) case strengthens thermal-efficiency improvement and fossil-fuel substitution but imposes only limited demand moderation. The materials efficiency and clinker substitution (MAT) case lowers the clinker-to-cement ratio more aggressively and includes stronger moderation of cement demand through materials efficiency, design optimization, and reduced clinker demand. The CCS case prioritizes carbon capture while keeping demand reduction and clinker-ratio improvement moderate. The integrated net-zero-emissions (NZE) case combines strong demand moderation, clinker reduction, alternative fuels, thermal-efficiency improvement, and large-scale CCS deployment.
All scenario endpoints were specified for 2050 and interpolated annually from the 2022 base year. The scenario design is not intended to be predictive; rather, it provides internally consistent benchmark packages that can be compared on a common accounting basis. Table A5 (Appendix A) reports the exact 2050 endpoint assumptions implemented in the model, including demand reduction relative to BAU, demand factor, clinker-to-cement ratio, kiln thermal intensity, alternative-fuel share, CCS-equipped capacity, and capture rate.
The 2050 endpoint values in Table A5 were selected to span a transparent range of mitigation ambition while remaining consistent with engineering constraints and major sectoral decarbonization roadmaps. The BAU endpoint represents continuation of modest incremental improvement in clinker ratio, kiln thermal intensity, and alternative-fuel use. The EFF endpoint reflects a higher, but still technically plausible, level of thermal-efficiency improvement and fuel substitution without assuming major structural changes in cement or clinker demand. The MAT endpoint was selected to represent a materials-led mitigation package in which stronger demand moderation and clinker substitution are achieved, while remaining within the practical constraints imposed by the availability of supplementary cementitious materials, cement standards, durability requirements, and market acceptance.
The CCS endpoint isolates the effect of large-scale capture deployment under moderate improvements in demand and clinker ratio, allowing the model to distinguish capture-led mitigation from materials-led mitigation. Finally, the NZE endpoint combines the strongest assumptions across demand moderation, clinker reduction, thermal-efficiency improvement, alternative-fuel substitution, and CCS deployment. These endpoints are therefore not forecasts, but benchmark assumptions designed to test how different combinations of mitigation strategies affect annual and cumulative direct CO2 emissions under a common stock–flow accounting structure [13,14,39,40,41,42,43].
A critical modeling boundary concerns the treatment of clinker substitution. In the MAT and NZE scenarios, the clinker-to-cement ratio is reduced aggressively, but is constrained by a lower bound of 0.50. This floor reflects real-world physical, logistical, and regulatory constraints on the use of SCMs. Specifically, it reflects the anticipated decline in the availability of traditional SCMs, including fly ash from coal-fired power generation and granulated blast-furnace slag from steelmaking, as well as standardization, durability, and market acceptance barriers associated with scaling up alternative SCM sources and low-clinker cement systems such as LC3-type formulations [23,24,25,44]. Consequently, the modeled clinker reduction represents an ambitious, constraint-informed benchmark for clinker substitution under system-level constraints, rather than an unconstrained exogenous reduction.
Although the model does not explicitly simulate the market penetration of specific commercial cement standards, the clinker-to-cement ratio serves as an aggregate proxy for cement product composition and enables practical interpretation of the results. A clinker ratio close to 0.95–1.00 is broadly consistent with high-clinker Portland cement products, such as CEM I-type cement. Ratios in the range of approximately 0.65–0.90 are broadly consistent with composite cement systems, such as CEM II-type products, while lower ratios approaching the modeled floor of 0.50 indicate a stronger shift toward high-volume blended cements, including slag-rich CEM III-type products where slag is available, limestone–LC3 systems, and other low-clinker blended formulations. Near-zero-clinker binders, such as alkali-activated cementitious systems, are not explicitly represented in the present model because their large-scale deployment is constrained by barriers related to standardization, durability validation, raw material availability, and market acceptance. Therefore, by tracking the aggregate clinker ratio, the model captures the physical and emissions implications of shifting the sector toward lower-clinker cement systems without requiring region-specific market-share data for each cement-standard category [23,25,44].
2.5. Uncertainty and Sensitivity Analysis
An uncertainty and sensitivity analysis was conducted to assess the robustness of the scenario results and to identify the parameters that exert the strongest influence on model outputs. The analysis focused on annual direct CO2 emissions in 2050 and cumulative direct CO2 emissions from 2023 to 2050. The parameters selected for uncertainty analysis were the 2050 cement-demand level, the scenario demand-moderation factor, clinker-to-cement ratio , process-emissions factor , thermal-intensity term , alternative-fuel share , CCS penetration share and CCS capture efficiency . These parameters were selected because they directly affect cement production, emissions intensity, and mitigation effectiveness in Equations (1)–(9).
A 5000-run Monte Carlo analysis was performed. For each run, uncertain parameters were sampled from bounded uniform distributions around the scenario endpoint assumptions. The 2050 BAU demand level was varied by ±10%. Demand-moderation factors were varied by ±0.05 absolute units. The clinker-to-cement ratio was varied by ±0.04, the process-emissions factor by ±0.025 t CO2/t clinker, thermal intensity by ±0.15 GJ/t clinker, alternative-fuel share by ±0.05, CCS penetration by ±0.10, and capture efficiency by ±0.05. Share variables were constrained between zero and one. For scenarios without CCS deployment, was fixed at zero and was not activated in the emissions calculation.
For each Monte Carlo run , the sampled parameter set is expressed as
where represents the sampled parameter set for run . For each run, the sampled endpoint values were used to reconstruct the scenario from 2023 to 2050, after which the model was recalculated to obtain annual direct emissions and cumulative direct emissions:
The uncertainty interval for each scenario output was reported using the 5th and 95th percentiles of the Monte Carlo distribution:
where is the model output of interest, is the 5th percentile, and is the 95th percentile. Parameter sensitivity was assessed using the Spearman rank correlation coefficient between sampled input parameters and model outputs:
where is the Spearman rank correlation coefficient for parameter , and is either 2050 annual direct CO2 emissions or cumulative direct CO2 emissions. Positive values indicate that increasing the parameter increases emissions, while negative values indicate that increasing the parameter reduces emissions. Spearman’s rank correlation was used because it provides a monotonic sensitivity measure that is robust to non-normal input distributions and nonlinear model responses. Although the uncertainty and sensitivity analysis focused on direct cement-sector emissions, a supplementary test was conducted to examine whether partial downstream concrete carbonation uptake could materially affect the cumulative-emissions interpretation of the scenario results.
2.6. Sensitivity Test for Concrete Carbonation Uptake
A supplementary sensitivity analysis was performed to examine the effect of partial uptake of carbonation in concrete on the modeled emissions results. In the core model, the system boundary is limited to direct CO2 emissions from the cement sector, arising from clinker calcination and kiln fuel combustion. Concrete carbonation was excluded from the main accounting framework because it occurs downstream, during the use and end-of-life phases of cement-based materials, rather than at the cement production stage. To assess the possible influence of this omitted process, carbonation uptake was introduced as an exogenous offset applied to cumulative process-related emissions. The sensitivity test was not used to modify annual direct-emissions intensity or the core scenario trajectories. Instead, it was used only to estimate the extent to which partial downstream CO2 reabsorption could reduce net cumulative emissions over the study period.
The carbonation-adjusted cumulative emissions were calculated as
where is carbonation-adjusted cumulative emissions, is cumulative direct CO2 emissions from the core model, is the cumulative process-emissions component, and λ is the assumed carbonation uptake fraction. The parameter λ was varied in a bounded sensitivity range to reflect uncertainty in long-term carbonation behavior, exposure conditions, demolition timing, and material recovery pathways. Three illustrative carbonation cases were examined: a low-uptake case (λ = 0.05), a medium-uptake case (λ = 0.10) and a high-uptake case (λ = 0.15). These values were selected to provide a transparent bounded test of the potential influence of downstream carbonation without redefining the model as a full life-cycle carbon-balance framework.
3. Results
3.1. Historical Baseline and Modeled Production
Figure 2 combines the historical global production baseline with modeled production under the five scenarios. The historical series shows more than a threefold increase from 1990 to 2022, confirming the scale challenge facing sector decarbonization. In the model, BAU production rises to 5028.5 Mt by 2050. EFF and CCS reach 4787.0 Mt because they include only limited demand moderation. MAT constrains 2050 production to 4283.1 Mt, while NZE lowers it further to 3779.2 Mt through stronger material efficiency and design-side reductions in cement demand.
The historical portion of Figure 2 also serves as a reference-mode validation of the model’s production block. Before applying the forward-scenario assumptions, the demand-production structure was checked against the observed 1990–2022 cement production series. This validation confirms that the model is consistent with the observed sector scale and long-term production-growth behavior. The forward scenarios begin in 2022 because the purpose of the study is not to reconstruct all historical plant-level technological changes, but to evaluate how alternative mitigation portfolios affect emissions from a common, literature-consistent base year.
The production results show that direct-emissions mitigation cannot be interpreted solely as an intensity problem. Even when direct intensity gradually declines, rising physical output can offset some of the benefit. This feature is especially evident in BAU, where intensity declines modestly over time, yet annual direct emissions continue to rise because sector activity grows faster than intensity declines.
3.2. Annual Direct CO2 Emissions
Figure 3 reports annual direct CO2 emissions from 2022 to 2050. Starting from the calibrated 2022 baseline of 2455.3 Mt CO2, the BAU case increases to 2692.9 Mt in 2050, indicating that modest improvements in clinker ratio, thermal intensity, and alternative-fuel share do not reverse global sector emissions. The mitigation scenarios achieve progressively deeper reductions, as summarized in Table 2.
Figure 3.
Modeled annual direct CO2 emissions under BAU, EFF, MAT, CCS, and NZE.
Table 2.
Summary of modeled scenario outcomes for 2050.
The EFF case lowers 2050 emissions to 2316.0 Mt (14.0% below BAU), confirming that efficiency and fuel substitution are valuable, but insufficient, when used in isolation. The MAT case reaches 1798.0 Mt CO2 (33.2% below BAU) by reducing both production volume and clinker content. The CCS case achieves 1046.9 Mt CO2 (61.1% below BAU), while the integrated NZE case reaches 325.8 Mt CO2, representing an 87.9% reduction relative to BAU and an 86.7% reduction relative to the 2022 baseline.
Detailed milestone values for 2030, 2040, and 2050 are reported in Table A6 (Appendix A) and discussed further in Section 4.4; therefore, Section 3 focuses on the main 2050 outcomes and cumulative-emissions comparison.
3.3. Direct-Emissions Intensity
Figure 4 shows the modeled direct-emissions intensity of cement production. The BAU case declines from 0.590 t CO2/t cement in 2022 to 0.536 t CO2/t cement in 2050 (Table 2). The EFF case lowers intensity to 0.484 t CO2/t cement through stronger thermal-efficiency gains and higher alternative-fuel substitution.
Figure 4.
Modeled direct-emissions intensity of cement production.
The MAT case reaches 0.420 t CO2/t cement as a result of clinker-ratio reduction combined with moderate kiln improvement. The CCS case lowers intensity to 0.219 t CO2/t cement because captured process and fuel emissions dominate the decarbonization effect after 2030. The NZE case reaches 0.086 t CO2/t cement by 2050. These patterns confirm that clinker-ratio reduction has a stronger influence than efficiency improvement alone, because it directly lowers the process-emissions term, and that CCS fundamentally changes the residual-emissions structure once meaningful deployment is reached.
3.4. 2050 Decomposition of Process and Fuel Emissions
Figure 5 and Table 3 decompose 2050 direct emissions into process and fuel components. In the BAU case, process emissions dominate, accounting for 1795.2 Mt CO2 (66.7% of the total), while fuel emissions are 897.7 Mt CO2. The EFF case reduces fuel emissions to 657.3 Mt CO2, but process emissions remain high at 1658.7 Mt CO2, due to modest clinker reduction and the absence of capture.
Figure 5.
Decomposition of 2050 direct CO2 emissions into process and fuel components across scenarios.
Table 3.
Numerical decomposition of 2050 direct CO2 emissions into process and fuel components.
The MAT case lowers both terms, with 1236.8 Mt CO2 from process emissions and 561.3 Mt CO2 from fuels. The CCS and NZE cases achieve the largest reductions because capture applies to both components; in the CCS case, residual process and fuel emissions decline to 716.8 and 330.1 Mt CO2, respectively, after the modeled effect of capture. The NZE case shows the largest reduction, with residual process emissions falling to 238.1 Mt CO2 and residual fuel emissions to 87.7 Mt CO2, respectively.
This decomposition illustrates the basic engineering logic reported in the literature: measures focused mainly on thermal demand and fuel substitution can substantially reduce fuel-related emissions but leave a significant residual process-emissions component from clinker calcination, whereas broad CCS deployment reduces both process- and fuel-related direct emissions, and is therefore the principal mechanism by which the modeled sector approaches near-zero direct emissions [2,3,11,13,21,27,35,45].
3.5. Cumulative Emissions and Summary Metrics
Table 4 and Figure 6 present cumulative direct CO2 emissions from 2023 to 2050. Cumulative direct CO2 emissions differ strongly across scenarios, as shown in Table 4. The BAU scenario accumulates 72.86 Gt CO2 over the modeled period. The EFF, MAT, and CCS scenarios lower cumulative emissions to 67.48 Gt CO2, 59.95 Gt CO2, and 53.70 Gt CO2, respectively.
Table 4.
Summary of cumulative direct CO2 emissions and avoided emissions from 2023 to 2050 by scenario.
Figure 6.
Cumulative direct CO2 emissions from 2023 to 2050 across scenarios.
The integrated NZE case achieves the lowest cumulative emissions at 40.07 Gt CO2, avoiding approximately 32.79 Gt CO2 (45.0%), relative to BAU. Because cumulative emissions determine the long-run climate burden, the substantial gap between BAU and NZE highlights the fact that delaying structural mitigation increases the irreversible carbon burden. While BAU and EFF remain emissions-intensive, due to continued sector growth, MAT demonstrates the strength of materials efficiency, and NZE provides the lowest cumulative footprint by deploying all major mitigation pathways simultaneously.
3.6. Sensitivity and Uncertainty Results
The Monte Carlo uncertainty analysis shows that the relative ranking of the five scenarios remains robust under parameter uncertainty. The uncertainty analysis was based on 5000 simulation runs using bounded-parameter ranges around the scenario endpoint assumptions. The outputs evaluated were annual direct CO2 emissions in 2050 and cumulative direct CO2 emissions over 2023–2050. Table 5 reports the central values together with the corresponding 5th–95th percentile uncertainty ranges. Across the sampled parameter space, BAU remains the highest-emission scenario, whereas NZE remains the lowest-emission scenario.
Table 5.
Monte Carlo uncertainty ranges for 2050 annual and cumulative direct CO2 emissions.
The uncertainty intervals indicate that the NZE scenario remains clearly separated from the other scenarios, even under upper-bound uncertainty. The CCS scenario also remains substantially below BAU, EFF, and MAT in annual direct emissions in 2050. By contrast, the uncertainty ranges for BAU and EFF partially overlap, indicating that efficiency improvement and alternative-fuel substitution alone may not provide a robust reduction if the 2050 demand level and clinker-to-cement ratio remain unfavorable. The MAT scenario shows a greater reduction than EFF because clinker substitution and materials-efficiency measures act simultaneously on production volume and process-emissions intensity.
Figure 7 shows the sensitivity ranking of key model parameters based on Spearman rank correlation coefficients. In BAU, EFF, and MAT, the strongest positive influence on 2050 annual direct CO2 emissions comes from the 2050 demand level, followed by the clinker-to-cement ratio.
Figure 7.
Sensitivity ranking of key model parameters for 2050 annual direct CO2 emissions.
This indicates that, in scenarios without CCS deployment, the scale of future cement production and the clinker intensity of cement remain the principal determinants of direct emissions. The alternative-fuel share has a negative Spearman coefficient because greater alternative-fuel substitution reduces fuel-related emissions. However, its influence remains smaller than that of the 2050 demand level and the clinker-to-cement ratio, as process emissions remain the dominant component of direct cement-sector CO2 emissions.
Including , the uncertainty analysis shows that the process-emissions factor is an important secondary driver of emissions in the non-CCS scenarios. This is expected, because process emissions remain the dominant component of direct cement-sector CO2 emissions in the absence of CCS. In BAU, EFF, and MAT, the strongest positive sensitivities remain the 2050 demand level and clinker-to-cement ratio, but also contributes positively to annual and cumulative emissions. In CCS-intensive scenarios, the influence of is reduced because the effective capture term applies to process-related emissions. Therefore, CCS penetration and capture efficiency remain the dominant parameters in the CCS and NZE cases.
For CCS-intensive scenarios, the dominant sensitivity shifts from production and clinker variables toward CCS deployment variables. In the CCS scenario, the 2050 CCS penetration share is the most influential parameter, followed by the 2050 demand level, CCS capture efficiency, and clinker-to-cement ratio. In the NZE scenario, CCS penetration and CCS capture efficiency dominate the sensitivity ranking. This result confirms that when strong clinker reduction and demand moderation are already in place, the final level of residual emissions is determined primarily by the scale and effectiveness of CCS deployment.
Figure 8 presents the uncertainty ranges for both annual direct emissions in 2050 and cumulative direct emissions over 2023–2050. The results reinforce the ranking reported in Table 5. NZE remains the lowest-emission scenario; CCS remains substantially below BAU, EFF, and MAT; and the overlap between BAU and EFF indicates that efficiency improvements and alternative-fuel substitution alone are insufficient to ensure robust emissions reductions. The MAT scenario performs better than EFF because clinker substitution and materials-efficiency measures reduce both production volume and process-emissions intensity.
Figure 8.
Monte Carlo uncertainty ranges for annual and cumulative direct CO2 emissions.
For cumulative emissions, demand-related parameters remain highly influential because cumulative direct CO2 emissions depend on the full annual-emissions time series from 2023 to 2050. Consequently, delayed demand moderation or delayed clinker-to-cement ratio reduction can still generate a large cumulative carbon burden, even when annual emissions in 2050 are substantially reduced. This result highlights the importance of early mitigation action, rather than reliance on endpoint improvements alone.
Overall, the sensitivity and uncertainty results reinforce the main findings of the scenario analysis. Efficiency improvement and alternative-fuel substitution are useful, but insufficient, when applied alone. More robust emissions reduction requires simultaneous demand moderation, clinker substitution, and high CCS deployment. The analysis also shows that cumulative emissions remain sensitive to early-period demand and clinker-to-cement ratio assumptions, meaning that delayed mitigation can increase the cumulative carbon burden, even when substantial reductions are achieved by 2050. Because the uncertainty and sensitivity analysis was limited to direct cement-sector emissions, a supplementary sensitivity test was also performed to examine whether partial downstream concrete carbonation uptake would materially alter the cumulative-emissions interpretation of the scenario results.
3.7. Sensitivity of Net Emissions to Concrete Carbonation Uptake
A supplementary carbonation sensitivity test was performed to examine how partial downstream CO2 uptake affects cumulative emissions across the five scenarios. In this test, carbonation was not introduced into the core plant-level emissions equations. Instead, it was treated as an exogenous downstream offset applied to cumulative process emissions over 2023–2050. This preserves the direct-emissions system boundary of the main model while allowing the possible effect of concrete carbonation to be examined transparently. Table 6 reports the carbonation-adjusted cumulative emissions for three illustrative uptake cases: a low-uptake case
(λ = 0.05), a medium-uptake case (λ = 0.10), and a high-uptake case (λ = 0.15) Across all scenarios, carbonation reduces net cumulative emissions, but it does not alter the relative ranking of the pathways. BAU remains the highest-emission case, whereas NZE remains the lowest-emission case under all three uptake assumptions.
Table 6.
Sensitivity of cumulative direct CO2 emissions to partial concrete carbonation uptake, 2023–2050.
The largest absolute reduction occurs in BAU because it has the greatest cumulative process-emissions burden over the study period. By contrast, the absolute carbonation offset is smaller in CCS and NZE because clinker demand and residual process emissions are already lower in those pathways. Under the medium-uptake case (λ = 0.10), net cumulative emissions decline from 72.86 to 68.09 Gt CO2 in BAU, from 67.48 to 62.90 Gt CO2 in EFF, from 59.95 to 55.97 Gt CO2 in MAT, from 53.70 to 50.15 Gt CO2 in CCS, and from 40.07 to 37.37 Gt CO2 in NZE.
These results indicate that concrete carbonation can moderately reduce the long-run net carbon burden of cement and concrete systems, but it does not substitute for direct mitigation at the production stage. In particular, carbonation does not remove the need for clinker substitution, demand moderation, alternative-fuel deployment, or CCS. Rather, it acts as a secondary downstream offset whose magnitude depends on service life, exposure conditions, demolition timing, and material recovery pathways. Accordingly, carbonation should be interpreted as a supplementary adjustment to cumulative emissions, rather than as a primary decarbonization mechanism within the plant-level model.
4. Discussion
4.1. Interpretation of the Modeled Results
The results support three broad conclusions. First, plant-efficiency and fuel-substitution measures remain necessary because they reduce emissions across all scenarios. However, their sector-level effect is bounded because they mainly reduce fuel-combustion emissions and do not eliminate process emissions from clinker formation. This result is consistent with value-chain studies showing that efficiency improvement and fuel switching are important, but insufficient on their own, for very deep cement decarbonization [3,4]. Technology-specific and life-cycle studies similarly show that low-carbon fuels and efficiency measures deliver meaningful reductions, but deeper mitigation requires additional levers such as clinker substitution, demand moderation, and/or CCS [20,27,28,42].
Second, clinker reduction and demand moderation have high system leverage. In the model, MAT performs better than EFF, even though its thermal-intensity improvement is weaker. This occurs because reducing clinker demand directly targets process emissions from carbonate decomposition and also lowers the kiln energy required per ton of cement. This result is consistent with value-chain studies showing that clinker-factor reduction and materials efficiency are central to deep mitigation in the cement sector [3]. Studies on LC3 and supplementary cementitious materials further show that lower-clinker cement systems can reduce process-related emissions while maintaining technically viable cement formulations under appropriate material and performance conditions [22,24,25]. Previous system-dynamics and integrated assessment studies also support the finding that demand-side and clinker-related interventions can strongly influence long-term cement-sector emissions outcomes [13,14].
Third, CCS becomes decisive once the policy question shifts from incremental reduction to near-zero direct emissions. Even strong measures of materials efficiency and clinker substitution leave residual calcination emissions because CO2 is chemically released during clinker formation [2]. The difference between the MAT and CCS scenarios in 2050 is therefore not merely a model artifact; it reflects the physical constraint that conventional clinker production cannot eliminate process emissions without either capturing the released CO2 or shifting toward lower-clinker and alternative binder systems [18,19,20,21,29]. Low-clinker systems, LC3-type formulations, and SCMs can reduce the required clinker quantity, but their deployment remains constrained by material availability, standards, durability validation, and market acceptance [24,25]. The integrated NZE case performs best because it combines clinker reduction, lower fuel emissions, demand moderation, and high CCS penetration.
The uncertainty and sensitivity results strengthen the interpretation of the scenario analysis by showing that the comparative ranking of the pathways remains stable under bounded-parameter variation, even though the absolute magnitude of emissions varies across the sampled parameter space. In particular, the deep-mitigation scenarios are most sensitive to the 2050 CCS penetration share and 2050 CCS capture efficiency, indicating that the credibility of very low residual emissions depends strongly on the scale and effectiveness of capture deployment. By contrast, cumulative emissions remain strongly influenced by the 2050 demand level, the 2050 demand-moderation factor, and the clinker-to-cement ratio, highlighting the importance of early action on materials efficiency and clinker substitution, rather than relying solely on end-period CCS expansion. These findings support the conclusion that robust cement-sector decarbonization requires both near-term structural mitigation and long-term deployment of capture technologies.
4.2. Comparison with Recent Literature
The modeled pattern broadly agrees qualitatively with recent studies on cement decarbonization. Cavalett et al. [13] showed that large emissions reductions in Europe require combined measures involving clinker reduction, low-carbon energy, and CCS, rather than isolated single interventions. Miller et al. [3] similarly emphasized that net-zero-compatible mitigation requires coordinated action across the full cement and concrete value chain. Reviews by Griffith, et al. [18], Barbhuiya et al. [20] and Nehdi et al. [19] reach similar conclusions, particularly regarding the central role of material substitution, policy support, and infrastructure for carbon capture. The relative performance of the MAT scenario in the present model is also consistent with prospective life-cycle studies of blended cements. Georgiades et al. [14] and Martinez et al. [22] reported substantial benefits from lower-clinker formulations under future energy-system conditions. Juenger et al. [24] and Scrivener et al. [25] further documented the technical basis for expanding clinker substitution through new supplementary cementitious materials and LC3-type systems. At the same time, the literature identifies constraints related to supply, standards, and durability. For this reason, the present model does not assume clinker ratios below 0.50, even in the integrated NZE scenario [14,22,24,25].
The CCS results are equally consistent with published evidence. Comparative assessments indicate that post-combustion systems, calcium looping, oxyfuel designs, and integrated CCUS routes can all deliver major emissions reductions, albeit at high cost and with substantial infrastructure requirements [21,27,35,45]. The present model does not seek to rank capture technologies; instead, it uses sector-level capture penetration and a uniform capture efficiency as aggregated descriptors of overall CCS performance. This abstraction is appropriate for a global planning model, but it also implies two important limitations that are acknowledged explicitly: (i) technology-specific energy penalties and operating costs are not resolved in detail, and (ii) differential capture efficiencies for process versus combustion emissions are not distinguished. These constraints are partly reflected through the scenario design, which represents aggregate CCS deployment barriers using constrained diffusion rates and delayed activation timing. However, they also motivate the development of technology-differentiated CCS modules in future model extensions.
The modeled NZE pathway is also broadly consistent with the deep decarbonization logic outlined in major global sector roadmaps. The IEA Net Zero Roadmap identifies lower clinker-to-cement ratios, improved kiln thermal efficiency, increased use of low-emission fuels, and large-scale CO2 capture as central requirements for cement-sector decarbonization by 2050 [39]. Similarly, the GCCA 2050 Cement and Concrete Industry Roadmap emphasizes coordinated action across clinker reduction, concrete efficiency, alternative fuels, renewable electricity, CCUS, and enabling policy frameworks to support net-zero concrete by 2050 [40]. The NZE scenario in the present model reflects the same integrated mitigation structure: it combines demand moderation, clinker-ratio reduction, thermal-efficiency improvement, alternative-fuel substitution, and broad CCS deployment. Its 2050 direct-emissions intensity of 0.086 t CO2/t cement is therefore not intended to reproduce the IEA or GCCA pathway exactly, but it is directionally consistent with the scale of mitigation required in recognized global cement-sector decarbonization roadmaps. This comparison supports the external credibility of the model assumptions while preserving the role of the study as a transparent global aggregate assessment, rather than a detailed regional techno-economic roadmap.
4.3. Policy Implications
Several policy implications follow from the modeled results. First, standards reform and procurement reform are as important as plant-level technology deployment. If public and private buyers continue to specify clinker-intensive products by default, the MAT and NZE scenarios become more difficult to realize. Research on low-carbon binders and whole-system supply-chain decarbonization repeatedly identifies standards, codes, and product acceptance as key determinants of practical implementation [3,4,20,24,25,46]. Second, CCS should be treated as an infrastructure policy, not only as a plant-level technology policy. Although the model represents CCS through plant-level adoption shares, actual deployment depends on storage assessment, transport corridors, permitting, financing, and liability frameworks. Published assessments identify these extra-plant conditions as major determinants of CCS feasibility [21,27,29,35,45,47]. Third, a near-term delay carries a cumulative emissions penalty. Because BAU and EFF retain high cumulative emissions through 2050, delayed reductions in clinker factor, materials intensity, and capture deployment increase the long-run mitigation burden. This point is reinforced by broader construction-sector studies showing that early use of best-available low-emissions technologies can avoid large quantities of embodied CO2 before the middle of the century [13,46].
4.4. Scenario Milestones in 2030 and 2040
The midpoint milestones in Table A6 indicate when the modeled packages begin to diverge materially. In 2030, differences remain moderate: BAU reaches 2549.7 Mt CO2, while EFF, CCS, MAT, and NZE reach 2449.3, 2441.3, 2306.7, and 2152.1 Mt CO2, respectively. By 2040, the separation becomes more pronounced, with BAU at 2643.7 Mt CO2, EFF at 2405.0 Mt CO2, MAT at 2070.6 Mt CO2, CCS at 1739.6 Mt CO2, and NZE at 1086.1 Mt CO2. These milestone values show that efficiency improvement and alternative-fuel substitution provide earlier but smaller reductions, whereas clinker-demand reduction and CCS become more influential after 2030, as structural changes accumulate. This timing is important for policy design because investment planning, industrial standards, and CO2 transport-and-storage infrastructure decisions made in the present decade strongly influence the scale of feasible emissions reduction by the 2040s.
4.5. Engineering Interpretation of the Modeled Parameter Shifts
The parameter shifts implemented in the scenarios have direct engineering meaning. A lower clinker ratio can be achieved only if suitable SCMs are available in sufficient quantity and quality, and if product standards permit their use in target applications [14,22,24,25]. The MAT and NZE cases, therefore, imply not only changes at the kiln, but also coordinated changes in grinding, blending, mix design, testing practices, and the specifications used by designers and clients. Lower thermal intensity implies a package of efficiency actions, rather than a single retrofit. The literature links such improvement to preheater and precalciner optimization, heat recovery, combustion control, grinding efficiency, and better process integration [2,11,21]. In the present model, thermal-intensity improvement is represented as an aggregate sector variable, but the physical interpretation remains plant modernization and operating discipline. Higher shares of alternative fuels likewise require engineering and logistical readiness. Fuel preprocessing, moisture management, dosing consistency, and emissions control determine whether higher substitution can be achieved without compromising kiln stability or product quality [27,28,47]. The modeled rise from 10% in the base year to 40% in NZE should therefore be understood as an industrial-system change, rather than a simple fuel switch.
The modeled clinker-ratio shifts can also be interpreted as an aggregate engineering proxy for changes in cement product composition. A clinker-to-cement ratio close to the BAU and EFF values implies continued reliance on high-clinker cement products, including CEM Iand high-clinker CEM II-type formulations. By contrast, the lower clinker ratios in MAT and NZE imply a broader shift toward blended and low-clinker systems, including CEM II products with higher SCM contents, CEM III-type slag-rich cements where slag is available, limestone–calcined clay cement systems, and other low-clinker blended formulations. However, the model does not allocate production among these cement types. Therefore, the results should be interpreted as indicating the scale of product-composition change required at the sector level, not as a specification of exact CEM I, CEM II, CEM III, LC3, or alkali-activated cement market shares.
Finally, CCS shares of 60% in the CCS case and 80% in the NZE case imply large deployment of capture-ready assets, transport networks, and storage systems [21,27,35,45]. Such shares are ambitious, but they align with the physical requirement that deep direct-emissions reduction cannot be achieved without large-scale management of calcination CO2.
5. Limitations
5.1. Spatial Aggregation and Life-Cycle Boundaries
The model is intentionally aggregate. It does not represent regional heterogeneity in kiln vintage, electricity mix, clinker standards, SCM availability, waste-fuel quality, or access to geologic storage. As a result, it is best interpreted as a transparent global benchmark model, rather than as a replacement for regional techno-economic planning tools. The accounting boundary is also limited to direct CO2 emissions from clinker calcination and kiln fuel combustion. This is suitable for comparing the effects of clinker ratio, fuel switching, materials-efficiency moderation, and CCS on plant-gate direct emissions, but it does not capture the full life-cycle implications emphasized in the recent LCA literature [14,22,38]. Indirect emissions associated with electricity generation, quarrying, raw-material transport, alternative-fuel collection and preparation, SCM processing, and the production of clinker-replacement materials are excluded. Therefore, the results should be interpreted as direct-emissions outcomes, rather than as comprehensive life-cycle climate-footprint estimates. Future work should connect the present stock–flow core to dynamic life-cycle modules for electricity, transport, fuel-preparation chains, SCM supply, clinker-substitute production, and construction-system substitution.
5.2. Historical Validation Scope
Although the model uses the 1990–2022 cement-production series as a historical reference mode, it does not perform a full annual reconstruction of historical global cement emissions. Such reconstruction would require year-specific data on global clinker ratios, kiln technologies, thermal intensities, alternative-fuel shares, fuel mixes, and regional production structures. Therefore, the validation focuses on reproducing the historical production scale and checking the consistency of the 2022 direct-emissions intensity and process/fuel-emissions decomposition with values reported in the cement-decarbonization literature.
5.3. Economic Feasibility and Policy-Cost Feedbacks
The current model does not include an explicit economic feasibility module. Capital expenditure, operating expenditure, CO2 allowance prices, carbon taxes, CCS capture costs, CO2 compression costs, transport and storage costs, and policy-incentive costs are not represented as endogenous model variables. Similarly, the model does not incorporate endogenous economic and policy feedbacks such as technological learning curves, dynamic CO2 pricing, investment-cost feedbacks, or the financial costs of climate policies. Therefore, the scenarios should not be interpreted as cost-optimal or economically feasible transition plans. Instead, they should be understood as physical direct-emissions scenarios that compare how demand moderation, clinker substitution, fuel switching, and CCS deployment affect annual and cumulative CO2 emissions under common accounting assumptions. Future versions of the model should couple the current stock–flow emissions framework with techno-economic modules that represent CAPEX, OPEX, carbon price signals, marginal abatement costs, CCS infrastructure costs, learning effects, and regional investment constraints.
5.4. Representation of CCS Technologies
The model applies a uniform capture efficiency to both process- and fuel-related emissions, and does not distinguish between individual capture technologies, such as post-combustion amine scrubbing, oxyfuel combustion, calcium looping, direct separation, or other cement-specific capture systems. As a result, technology-specific energy penalties, retrofit requirements, infrastructure needs, cost structures, and differential capture performance are not resolved explicitly. These effects are represented indirectly through scenario-level constraints on CCS diffusion rates and deployment timing. While this aggregation is appropriate for a global benchmark scenario model, it means that the model cannot evaluate the relative techno-economic merit of competing CCS routes. As a result, the CCS and NZE cases should be interpreted as sector-level direct-emissions accounting scenarios conditional on assumed CCS deployment, not as detailed plant-level techno-economic assessments. Future versions of the model should integrate technology-differentiated CCS modules with clear energy penalties, cost functions, infrastructure requirements, and learning curves to enable a more detailed assessment of CCS selection under different policy and market conditions.
5.5. Clinker Substitution and SCM Constraints
The model treats the reduction in clinker share as a bounded exogenous scenario parameter, with a minimum clinker-to-cement ratio of 0.50, rather than as an endogenously constrained variable driven by dynamic SCM supply curves. While this lower bound partly reflects aggregate limits on SCM availability, the model does not explicitly simulate the declining supply of traditional SCMs, such as fly ash and blast-furnace slag, associated with the decarbonization of the power and steel sectors. It also does not model standardization barriers, quality variation, transportation logistics, processing requirements, or market acceptance constraints for alternative SCMs and low-clinker cement systems.
The model also does not explicitly distinguish among cement types and binder systems, such as CEM I, CEM II, CEM III, LC3-type blends, or alkali-activated binders. These products have different clinker contents, SCM requirements, performance requirements, standards constraints, and market-adoption barriers. In the present model, these differences are represented only by the aggregate clinker-to-cement ratio, which serves as a physical proxy for changes in product composition. This limits the direct translation of the results into product-specific cement standards, national cement-market shares, or adoption rates for individual cement classes. Future regionally disaggregated versions of the model could incorporate explicit product-mix modules to evaluate the adoption of specific low-clinker cement products and novel binder systems under different material-supply, standards, and market conditions. Future versions of the framework should incorporate dynamic SCM supply constraints and technology-specific adoption frictions to better constrain clinker-substitution assumptions at regional and sectoral scales.
5.6. Alternative Fuels and Carbonation Uptake
The model treats alternative-fuel substitution with a simplified fossil-displacement term, and does not explicitly distinguish biomass from waste-derived fossil fractions. This means that the climate benefit of fuel substitution is represented at a sector-average level, rather than at a feedstock-specific level. Carbonation uptake is also excluded from the core balance because current literature indicates that immediate climate crediting can overstate short- to medium-term mitigation [35].
Concrete carbonation was excluded from the core emissions balance because current literature indicates that immediate climate crediting can overstate short- to medium-term mitigation due to temporal mismatches, slow carbonation kinetics, and potential CO2 re-release during demolition and end-of-life processing [35]. In this study, carbonation is therefore treated as a downstream lifecycle sink, rather than as an immediate production-side emissions reduction. This boundary choice is consistent with the model’s focus on direct cement-sector emissions from clinker calcination and kiln fuel combustion.
The supplementary carbonation sensitivity analysis presented in Section 2.6 and Section 3.7 shows that partial downstream CO2 uptake can modestly reduce net cumulative emissions, but it does not alter the relative ranking of the scenarios or the study’s main comparative conclusions. In particular, carbonation does not eliminate the need for direct mitigation at the production stage. The BAU, EFF, and MAT pathways still retain substantial residual emissions, while the lowest-emission outcomes continue to depend on deep clinker reduction and broad CCS deployment. Accordingly, carbonation should be interpreted as a secondary lifecycle offset, rather than as a substitute for production-side decarbonization.
5.7. Remaining Uncertainty Boundaries
Although the revised study includes Monte Carlo uncertainty analysis and parameter sensitivity testing, the uncertainty analysis remains constrained by the selected parameter ranges and scenario endpoint assumptions. The analysis does not assign full probability distributions to future technology costs, regional policy strength, SCM availability, CCS infrastructure deployment, or market adoption conditions. Therefore, the uncertainty ranges should be interpreted as plausible bounds around the scenario assumptions, rather than as complete probabilistic forecasts of cement-sector decarbonization. Future work should extend the model by incorporating region-specific probability distributions for techno-economic, resource, and policy variables.
Finally, the model applies a single global aggregate process-emissions factor of 0.525 t CO2/t clinker. While this value is consistent with commonly used stoichiometric and default factors in cement emissions accounting, actual values vary with the carbonate composition of raw materials, clinker chemistry, clinker moduli, kiln dust and bypass losses, and production technology. Future regionally disaggregated versions of the model could incorporate spatially varying process-emission factors derived from local limestone chemistry, raw meal composition, and kiln-specific operating configurations.
6. Conclusions
This study developed a global aggregate system dynamics model to evaluate five cement-sector decarbonization pathways through 2050. The model integrates demand moderation, clinker substitution, alternative fuels, thermal efficiency, and CCS deployment within a unified direct-emissions accounting framework.
Three main findings emerge. First, efficiency improvement and fuel substitution alone are insufficient for deep decarbonization. The EFF scenario reduces 2050 emissions to 2316.0 Mt CO2, or 14.0% below BAU, but does not reverse continued emissions growth driven by sector expansion. Second, materials efficiency and clinker substitution provide stronger mitigation leverage. The MAT scenario reaches 1798.0 Mt CO2 in 2050, or 33.2% below BAU, by reducing both cement production volume and clinker intensity. This confirms the importance of targeting emissions from calcination-related processes. Third, very deep emissions reduction requires broad CCS deployment. The CCS scenario reaches 1046.9 Mt CO2, or 61.1% below BAU, while the integrated NZE pathway achieves 325.8 Mt CO2, or 87.9% below BAU, by combining all major mitigation levers. Cumulative-emissions results further show that the NZE pathway avoids 32.79 Gt CO2 relative to BAU over 2023–2050, highlighting the importance of early structural mitigation.
The uncertainty analysis confirms that the scenario ranking remains robust under bounded-parameter variation. It also shows that deep-mitigation outcomes are most sensitive to CCS deployment scale, CCS capture effectiveness, cement-demand level, and the clinker-to-cement ratio. Overall, the results indicate that global cement decarbonization cannot rely on isolated measures. Instead, it requires coordinated action across materials efficiency, clinker substitution, alternative fuels, thermal efficiency improvements, and CO2 capture infrastructure.
Future research should extend the model in several directions. Regional disaggregation would allow differences in policy frameworks, kiln technologies, availability of supplementary cementitious materials, alternative-fuel supply, and access to CO2 transport and storage to be represented more explicitly. Integration with techno-economic modules would support assessment of costs, carbon pricing, investment constraints, and deployment feasibility. Coupling the model with dynamic life-cycle assessment would also enable the inclusion of indirect emissions from electricity, transport, and the supply chains for supplementary cementitious materials. Finally, technology-differentiated CCS modules and expanded probabilistic uncertainty analysis would improve evaluation of capture-strategy selection and decision-making under uncertainty.
Author Contributions
Conceptualization, O.E.I.; methodology, O.E.I. and M.K.; software, O.E.I.; validation, O.E.I. and M.K.; formal analysis, O.E.I.; investigation, O.E.I.; resources, M.K.; data curation, O.E.I.; writing—original draft preparation, O.E.I.; writing—review; editing, O.E.I. and M.K. and funding acquisition, M.K. All authors have read and agreed to the published version of the manuscript.
Funding
This research received no external funding.
Data Availability Statement
The original contributions presented in this study are included in the article. Further inquiries can be directed to the corresponding author.
Conflicts of Interest
The authors declare no conflict of interest.
Appendix A
Major mitigation measures
Table A1.
Major mitigation measures for cement decarbonization.
Table A2.
Main variables and units.
Calibration Inputs
Table A3.
The calibration Inputs [15,55].
Dataset Tables
Table A4.
Historical baseline dataset annual cement production (1990–2022) [15].
Scenario EndPoint Assumptions
Table A5.
Implemented 2050 endpoint assumptions by scenario.
Milestone results
Table A6.
Milestone results for 2030, 2040, and 2050.
Appendix B
The main exogenous parameters
| Annual demand-growth rate in year | |
| Materials-efficiency moderation factor in year | |
| Target capacity-utilization rate | |
| Maximum operable capacity-utilization rate | |
| Investment adjustment time (years) | |
| Average technical lifetime of cement capacity (years) | |
| clinker-to-cement ratio in year | |
| Process-emissions factor for clinker production | |
| Kiln thermal-energy intensity in year | |
| Alternative-fuel share in year | |
| CCS deployment share in year | |
| CO2 capture rate among CCS-equipped production in year | |
| Fossil-fuel emissions coefficient (t CO2/GJ) |
References
- Andrew, R. Global CO2 emissions from cement production, 1928–2018. Earth Syst. Sci. Data 2019, 11, 1675–1710. [Google Scholar] [CrossRef] [Scilit]
- Fennell, P.S.; Davis, S.J.; Mohammed, A. Decarbonizing cement production. Joule 2021, 5, 1305–1311. [Google Scholar] [CrossRef] [Scilit]
- Miller, S.A.; Habert, G.; Myers, R.J.; Harvey, J.T. Achieving net zero greenhouse gas emissions in the cement industry via value chain mitigation strategies. One Earth 2021, 4, 1398–1411. [Google Scholar] [CrossRef] [Scilit]
- Pamenter, S.; Myers, R.J. Decarbonizing the cementitious materials cycle: A whole-systems review of measures to decarbonize the cement supply chain in the UK and European contexts. J. Ind. Ecol. 2021, 25, 359–376. [Google Scholar] [CrossRef] [Scilit] [PubMed]
- Rissman, J.; Bataille, C.; Masanet, E.; Aden, N.; Morrow, W.R.; Zhou, N.; Elliott, N.; Dell, R.; Heeren, N.; Huckestein, B.; et al. Technologies and policies to decarbonize global industry: Review and assessment of mitigation drivers through 2070. Appl. Energy 2020, 266, 114848. [Google Scholar] [CrossRef] [Scilit]
- Panos, E.; Kannan, R.; Hirschberg, S.; Kober, T. An assessment of energy system transformation pathways to achieve net-zero carbon dioxide emissions in Switzerland. Commun. Earth Environ. 2023, 4, 157. [Google Scholar] [CrossRef] [Scilit]
- EPA. Global Greenhouse Gas Overview; United States Environmental Protection Agency: Washington, DC, USA, 2025. Available online: https://www.epa.gov/ghgemissions/global-greenhouse-gas-overview (accessed on 20 June 2026).
- Wang, Y.; Yi, H.; Tang, X.; Wang, Y.; An, H.; Liu, J. Historical trend and decarbonization pathway of China’s cement industry: A literature review. Sci. Total Environ. 2023, 891, 164580. [Google Scholar] [CrossRef] [Scilit] [PubMed]
- Farfan, J.; Fasihi, M.; Breyer, C. Trends in the global cement industry and opportunities for long-term sustainable CCU potential for Power-to-X. J. Clean. Prod. 2019, 217, 821–835. [Google Scholar] [CrossRef] [Scilit]
- Barbhuiya, S.; Das, B.B.; Adak, D. Roadmap to a net-zero carbon cement sector: Strategies, innovations and policy imperatives. J. Environ. Manag. 2024, 359, 121052. [Google Scholar] [CrossRef] [Scilit] [PubMed]
- Tan, C.; Yu, X.; Guan, Y. A technology-driven pathway to net-zero carbon emissions for China’s cement industry. Appl. Energy 2022, 325, 119804. [Google Scholar] [CrossRef] [Scilit]
- Shen, L.; Zhong, S.; Elshkaki, A.; Zhang, H.; Zhao, J. Energy-Cement-Carbon Emission Nexus and its Implications for Future Urbanization in China. J. Sustain. Dev. Energy Water Environ. Syst. 2021, 9, 1080354. [Google Scholar] [CrossRef] [Scilit]
- Cavalett, O.; Watanabe, M.D.B.; Voldsund, M.; Roussanaly, S.; Cherubini, F. Paving the way for sustainable decarbonization of the European cement industry. Nat. Sustain. 2024, 7, 568–580. [Google Scholar] [CrossRef] [Scilit]
- Georgiades, M.; Shah, I.H.; Steubing, B.; Cheeseman, C.; Myers, R.J. Prospective life cycle assessment of European cement production. Resour. Conserv. Recycl. 2023, 194, 106998. [Google Scholar] [CrossRef] [Scilit]
- Andrew, R. Global CO2 Emissions from Cement Production, Zenodo. 2023. Available online: https://zenodo.org/records/10008931 (accessed on 21 May 2026).
- IEA. Cement (Technology Deployment); International Energy, Agency: Paris, France, 2024; Available online: https://www.iea.org/energy-system/industry/cement (accessed on 12 February 2026).
- Van Roijen, E.; Sethares, K.; Kendall, A.; Miller, S.A. The climate benefits from cement carbonation are being overestimated. Nat. Commun. 2024, 15, 4848. (In English) [Google Scholar] [CrossRef] [Scilit] [PubMed]
- Griffiths, S.; Sovacool, B.K.; Del Rio, D.D.F.; Foley, A.M.; Bazilian, M.D.; Kim, J.; Uratani, J.M. Decarbonizing the cement and concrete industry: A systematic review of socio-technical systems, technological innovations, and policy options. Renew. Sustain. Energy Rev. 2023, 180, 113291. [Google Scholar] [CrossRef] [Scilit]
- Nehdi, M.L.; Marani, A.; Zhang, L. Is net-zero feasible: Systematic review of cement and concrete decarbonization technologies. Renew. Sustain. Energy Rev. 2024, 191, 114169. [Google Scholar] [CrossRef] [Scilit]
- Barbhuiya, S.; Kanavaris, F.; Das, B.B.; Idrees, M. Decarbonising cement and concrete production: Strategies, challenges and pathways for sustainable development. J. Build. Eng. 2024, 86, 108861. [Google Scholar] [CrossRef] [Scilit]
- Cormos, C.-C. Decarbonization options for cement production process: A techno-economic and environmental evaluation. Fuel 2022, 320, 123907. [Google Scholar] [CrossRef] [Scilit]
- Martinez, D.M.; Horvath, A.; Monteiro, P.J.M. Comparative environmental assessment of limestone calcined clay cements and typical blended cements. Environ. Res. Commun. 2023, 5, 055002. [Google Scholar] [CrossRef] [Scilit]
- Scrivener, K.L.; John, V.M.; Gartner, E.M. Eco-efficient cements: Potential economically viable solutions for a low-CO2 cement-based materials industry. Cem. Concr. Res. 2018, 114, 2–26. [Google Scholar] [CrossRef] [Scilit]
- Juenger, M.C.G.; Snellings, R.; Bernal, S.A. Supplementary cementitious materials: New sources, characterization, and performance insights. Cem. Concr. Res. 2019, 122, 257–273. [Google Scholar] [CrossRef] [Scilit]
- Scrivener, K.; Martirena, F.; Bishnoi, S.; Maity, S. Calcined clay limestone cements (LC3). Cem. Concr. Res. 2018, 114, 49–56. [Google Scholar] [CrossRef] [Scilit]
- Snellings, R.; Suraneni, P.; Skibsted, J. Future and emerging supplementary cementitious materials. Cem. Concr. Res. 2023, 171, 107199. [Google Scholar] [CrossRef] [Scilit]
- Cavalett, O.; Watanabe, M.D.B.; Fleiger, K.; Hoenig, V.; Cherubini, F. LCA and negative emission potential of retrofitted cement plants under oxyfuel conditions at high biogenic fuel shares. Sci. Rep. 2022, 12, 8924. [Google Scholar] [CrossRef] [Scilit] [PubMed]
- Kusuma, R.T.; Hiremath, R.B.; Rajesh, P.; Kumar, B.; Renukappa, S. Sustainable transition towards biomass-based cement industry: A review. Renew. Sustain. Energy Rev. 2022, 163, 112503. [Google Scholar] [CrossRef] [Scilit]
- Dang, W.; Chen, S.; He, B.; Song, J.; Duan, Z.; Duan, H.; Gao, Z. Decarbonization and clean production in China’s cement industry: Strategies from the LEAP-LCA perspective. Environ. Impact Assess. Rev. 2026, 116, 108124. [Google Scholar] [CrossRef] [Scilit]
- Kunche, A.; Mielczarek, B. Application of System Dynamic Modelling for Evaluation of Carbon Mitigation Strategies in Cement Industries: A Comparative Overview of the Current State of the Art. Energies 2021, 14, 1464. [Google Scholar] [CrossRef] [Scilit]
- Ige, O.E.; Von Kallon, D.V.; Desai, D. Carbon emissions mitigation methods for cement industry using a systems dynamics model. Clean Technol. Environ. Policy 2024, 26, 579–597. [Google Scholar] [CrossRef] [Scilit]
- Ige, O.E.; Duffy, K.J.; Olanrewaju, O.A.; Collins, O.C. An Integrated System Dynamics Model and Life Cycle Assessment for Cement Production in South Africa. Atmosphere 2022, 13, 1788. [Google Scholar] [CrossRef] [Scilit]
- Mittal, V.; Dosan, L. System Dynamics Modeling of Cement Industry Decarbonization Pathways: An Analysis of Carbon Reduction Strategies. Sustainability 2025, 17, 7128. [Google Scholar] [CrossRef] [Scilit]
- Watari, T.; Cao, Z.; Hata, S.; Nansai, K. Efficient use of cement and concrete to reduce reliance on supply-side technologies for net-zero emissions. Nat. Commun. 2022, 13, 4158. [Google Scholar] [CrossRef] [Scilit] [PubMed]
- Bacatelo, M.; Capucha, F.; Ferrão, P.; Margarido, F. Selection of a CO2 capture technology for the cement industry: An integrated TEA and LCA methodological framework. J. CO2 Util. 2023, 68, 102375. [Google Scholar] [CrossRef] [Scilit]
- Ige, O.; Kallon, D.; Desai, D. Integrating Life Cycle Assessment and System Dynamics Modeling for Sustainable Practice. Presented at the 5th African conference on Industrial Engineering and Operations Management, Johannesburg, South Africa, 23–25 April 2024. [Google Scholar] [CrossRef] [Scilit]
- Xi, F.; Davis, S.J.; Ciais, P.; Crawford-Brown, D.; Guan, D.; Pade, C.; Shi, T.; Syddall, M.; Lv, J.; Ji, L.; et al. Substantial global carbon uptake by cement carbonation. Nat. Geosci. 2016, 9, 880–883. [Google Scholar] [CrossRef] [Scilit]
- Olsson, J.A.; Miller, S.A.; Kneifel, J.D. A review of current practice for life cycle assessment of cement and concrete. Resour. Conserv. Recycl. 2024, 206, 107619. [Google Scholar] [CrossRef] [Scilit]
- IEA. Cement; International Energy Agency (IEA): Paris, France, 2023; Available online: https://www.iea.org/reports/cement-3 (accessed on 12 February 2026).
- Cement and Global. Concrete Future: The GCCA 2050 Cement and Concrete Industry Roadmap for Net Zero Concrete; GCCA: London, UK, 2021; Available online: https://gccassociation.org/concretefuture/wp-content/uploads/2022/10/GCCA-Concrete-Future-Roadmap-Document-AW-2022.pdf (accessed on 12 February 2026).
- Miller, S.A.; John, V.M.; Pacca, S.A.; Horvath, A. Carbon dioxide reduction potential in the global cement industry by 2050. Cem. Concr. Res. 2018, 114, 115–124. [Google Scholar] [CrossRef] [Scilit]
- Habert, G.; Miller, S.A.; John, V.M.; Provis, J.L.; Favier, A.; Horvath, A.; Scrivener, K.L. Environmental impacts and decarbonization strategies in the cement and concrete industries. Nat. Rev. Earth Environ. 2020, 1, 559–573. [Google Scholar] [CrossRef] [Scilit]
- Shah, I.H.; Miller, S.A.; Jiang, D.; Myers, R.J. Cement substitution with secondary materials can reduce annual global CO2 emissions by up to 1.3 gigatons. Nat. Commun. 2022, 13, 5758. [Google Scholar] [CrossRef] [Scilit] [PubMed]
- Juenger, M.C.G.; Winnefeld, F.; Provis, J.L.; Ideker, J.H. Advances in alternative cementitious binders. Cem. Concr. Res. 2011, 41, 1232–1243. [Google Scholar] [CrossRef] [Scilit]
- Dávila, J.G.; Sacchi, R.; Pizzol, M. Preconditions for achieving carbon neutrality in cement production through CCUS. J. Clean. Prod. 2023, 425, 138935. [Google Scholar] [CrossRef] [Scilit]
- Karlsson, I.; Rootzén, J.; Toktarova, A.; Odenberger, M.; Johnsson, F.; Göransson, L. Roadmap for Decarbonization of the Building and Construction Industry—A Supply Chain Analysis Including Primary Production of Steel and Cement. Energies 2020, 13, 4136. [Google Scholar] [CrossRef] [Scilit]
- Okeke, I.J.; Kamath, D.; Nimbalkar, S.U.; Cresko, J. The Role of Low-Carbon Fuels and Carbon Capture in Decarbonizing the U.S. Clinker Manufacturing for Cement Production: CO2 Emissions Reduction Potentials. Energies 2024, 17, 5233. [Google Scholar] [CrossRef] [Scilit]
- IEA. Technology Roadmap—Low-Carbon Transition in the Cement Industry. In World Business Council for Sustainable Development (WBCSD); International Energy Agency (IEA): Paris, France, 2018; Available online: https://www.iea.org/reports/technology-roadmap-low-carbon-transition-in-the-cement-industry (accessed on 18 December 2025).
- Lehne, J.; Preston, F. Making Concrete Change: Innovation in Low-Carbon Cement and Concrete; Chatham House, the Royal Institute of International Affairs: London, UK, 2018; pp. 1–66. Available online: https://www.chathamhouse.org/sites/default/files/publications/2018-06-13-making-concrete-change-cement-lehne-preston-final.pdf (accessed on 26 May 2026).
- IE Agency. Net Zero by 2050: A Roadmap for the Global Energy Sector; International Energy Agency: Paris, France, 2021; Available online: https://www.iea.org/reports/net-zero-by-2050 (accessed on 28 February 2022).
- Gartner, E.; Hirao, H. A review of alternative approaches to the reduction of CO2 emissions associated with the manufacture of the binder phase in concrete. Cem. Concr. Res. 2015, 78, 126–142. [Google Scholar] [CrossRef] [Scilit]
- Davis, S.J.; Lewis, N.S.; Shaner, M.; Aggarwal, S.; Arent, D.; Azevedo, I.L.; Benson, S.M.; Bradley, T.; Brouwer, J.; Chiang, Y.-M.; et al. Net-zero emissions energy systems. Science 2018, 360, eaas9793. [Google Scholar] [CrossRef] [Scilit] [PubMed]
- Miller, S.A.; Moore, F.C. Climate and health damages from global concrete production. Nat. Clim. Change 2020, 10, 439–443. [Google Scholar] [CrossRef] [Scilit]
- Galan, I.; Elhoweris, A.; Hanein, T.; Bannerman, M.N.; Glasser, F.P. Advances in clinkering technology of calcium sulfoaluminate cement. Adv. Cem. Res. 2017, 29, 405–417. [Google Scholar] [CrossRef] [Scilit]
- GCCA. GNR 2.0—GCCA in Numbers. In Percentage Distribution of Alternative Fuels and Biomass Waste; Global Cement and Concrete Association: London, UK, 2025; Available online: https://gccassociation.org/gnr/ (accessed on 25 January 2026).
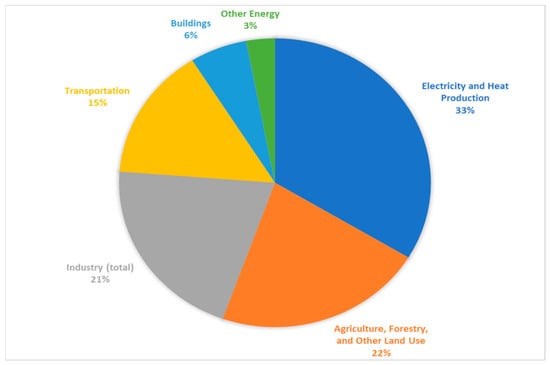
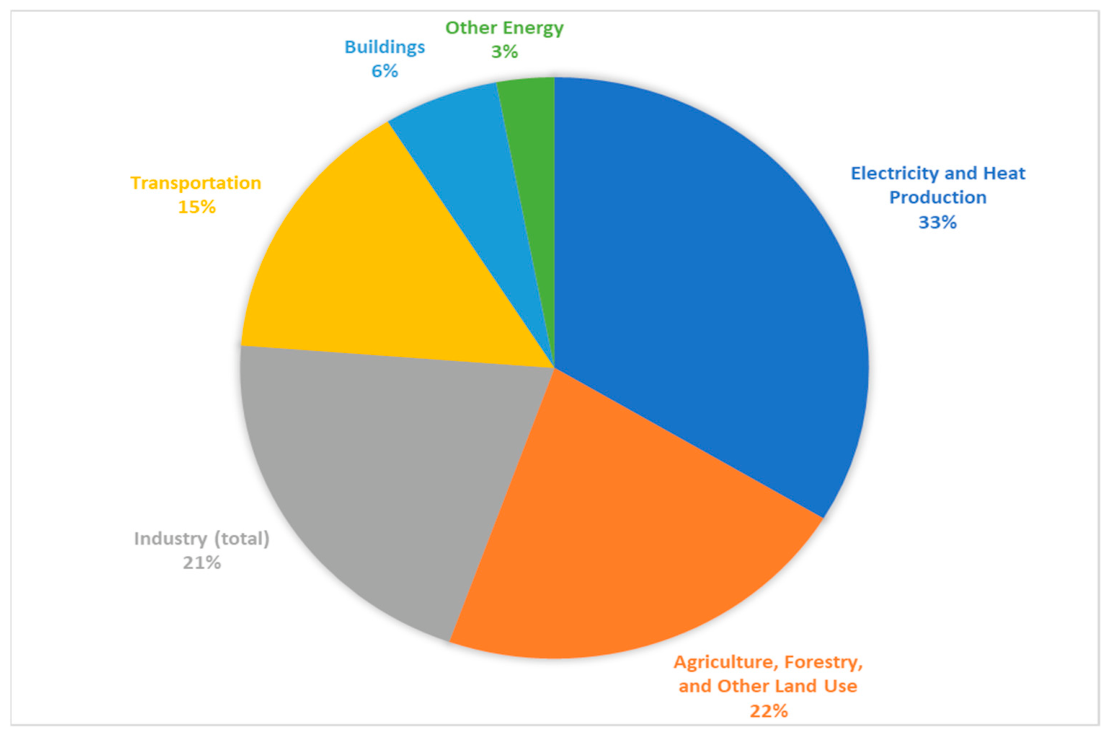
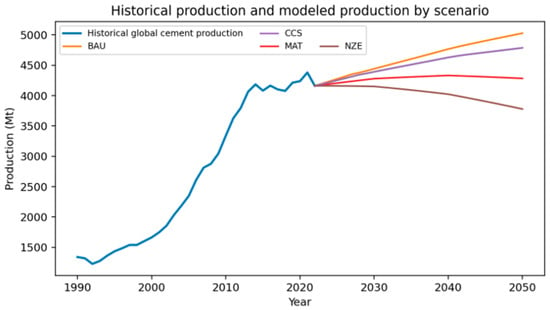
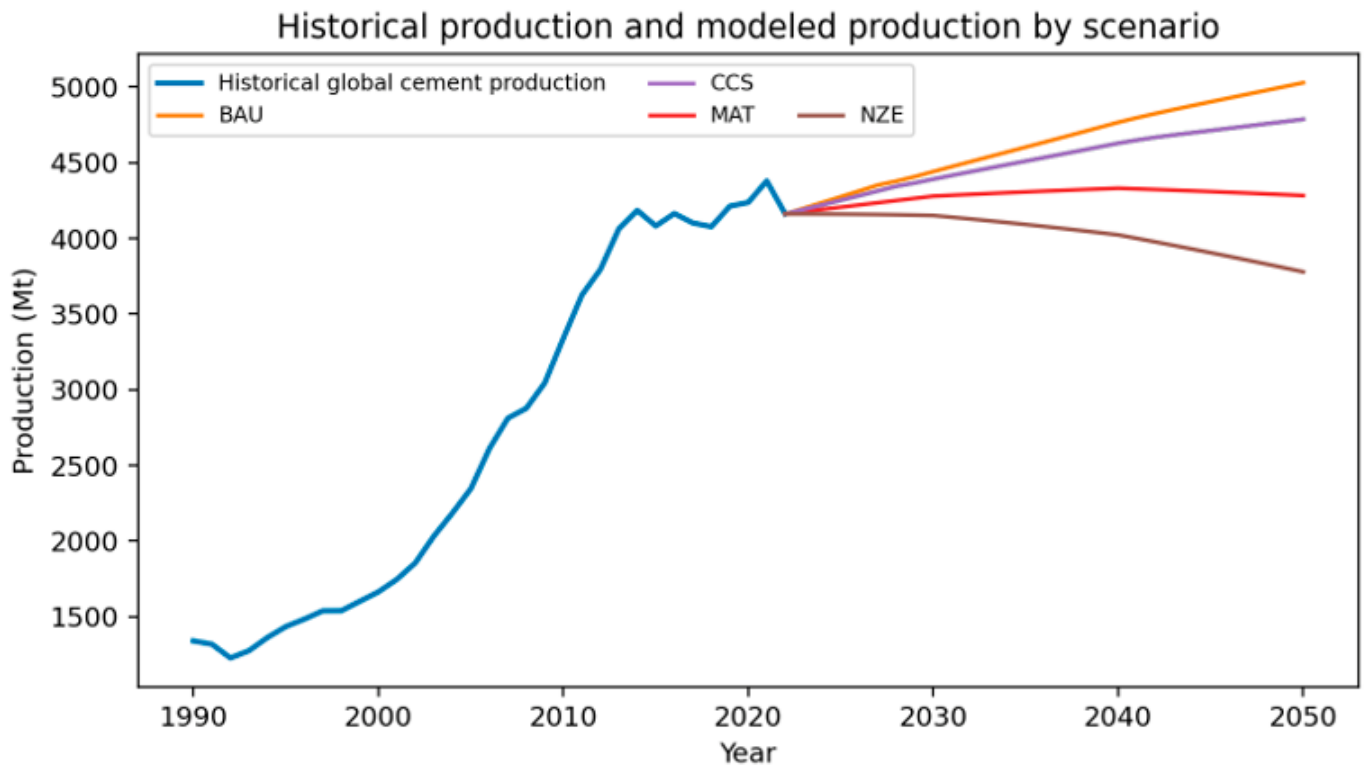
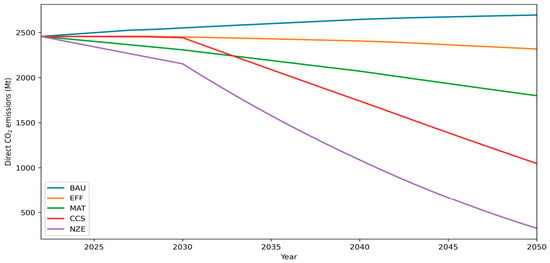
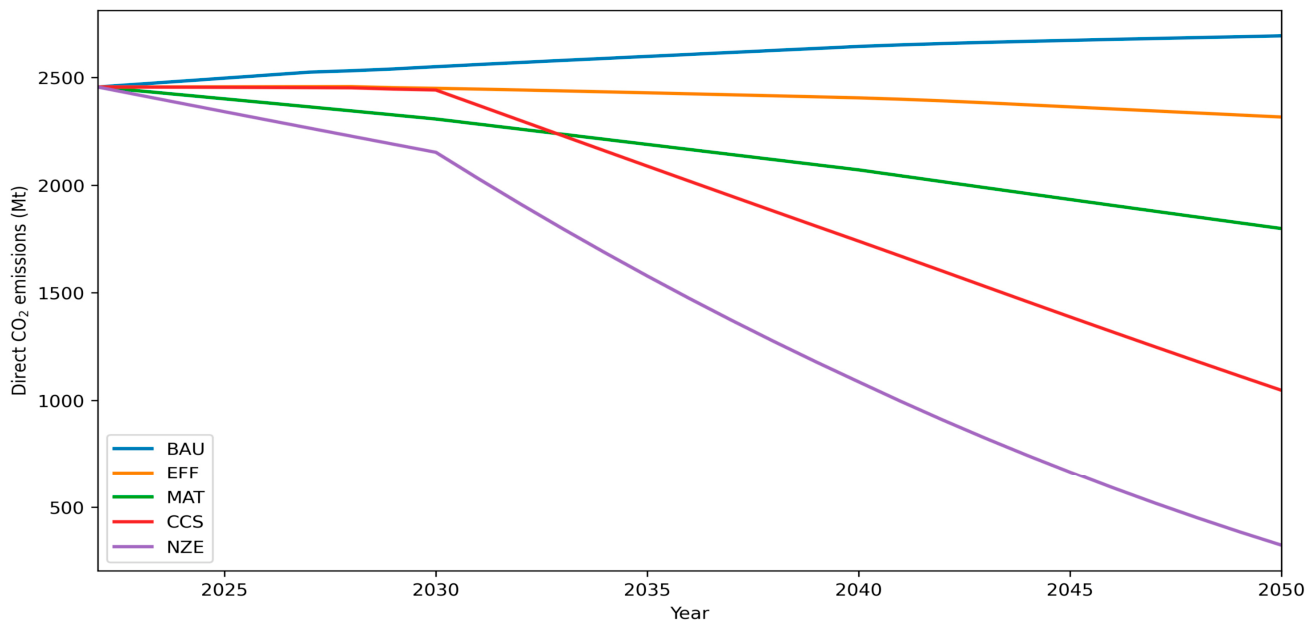
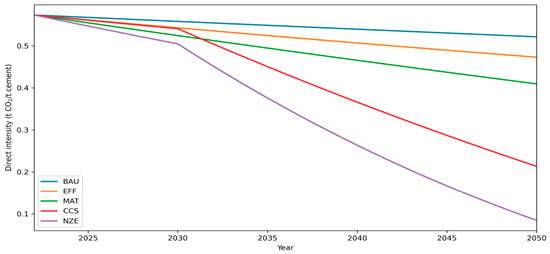
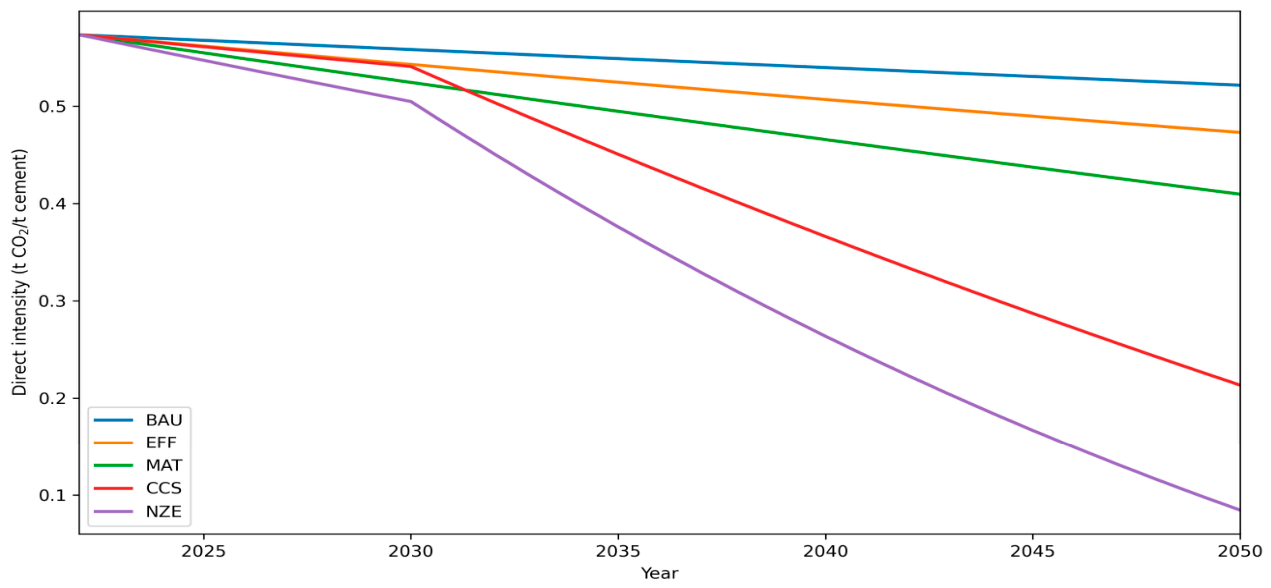
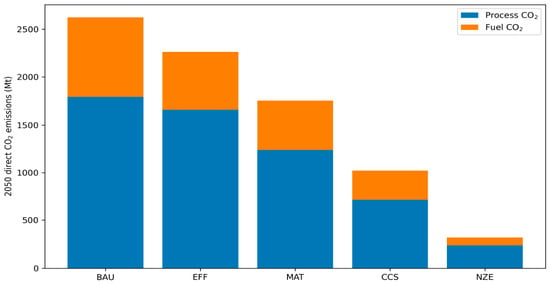
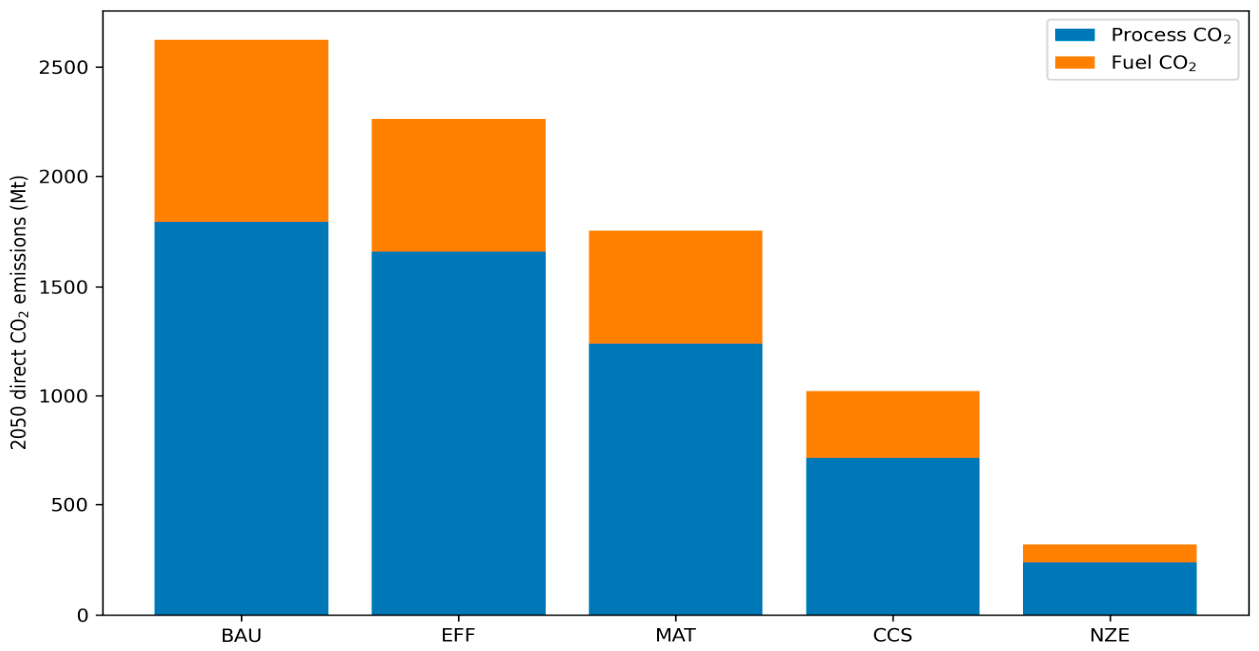
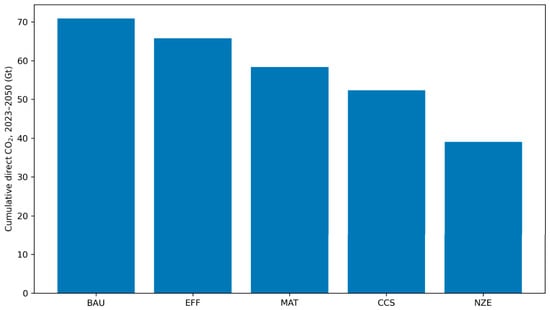
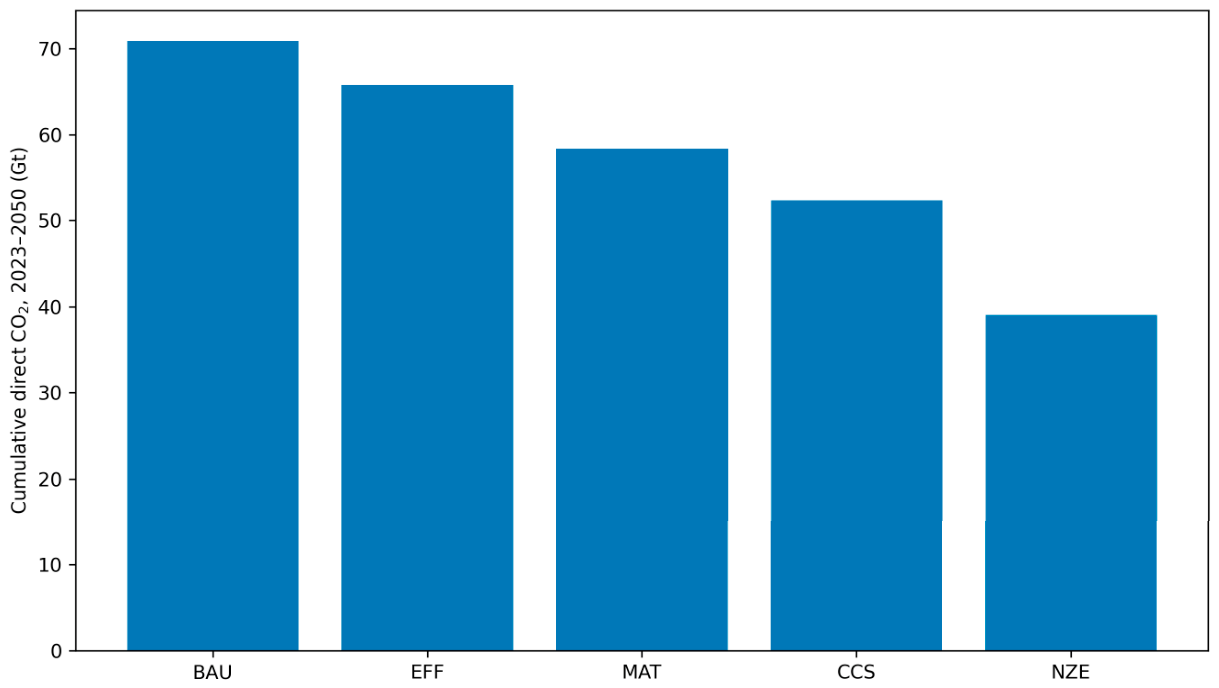
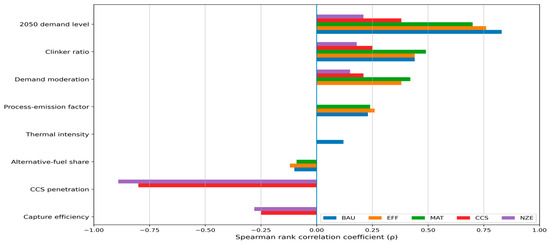
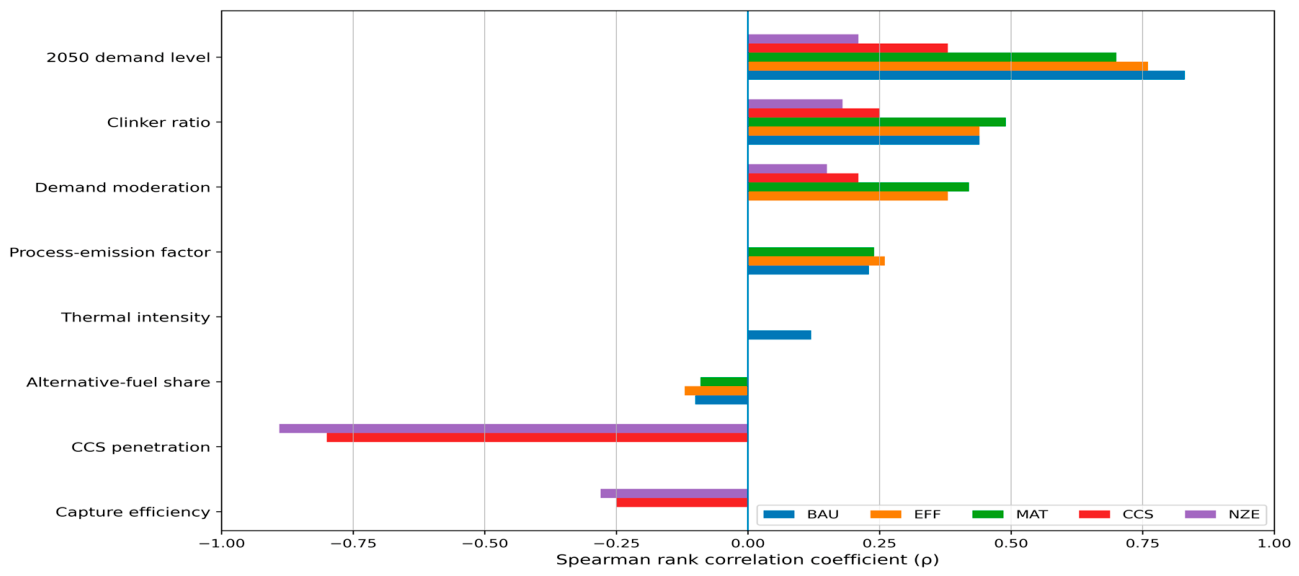
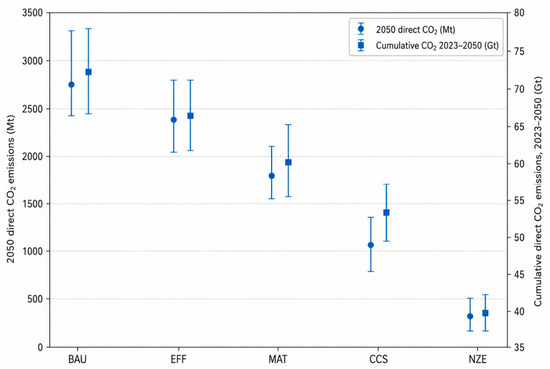
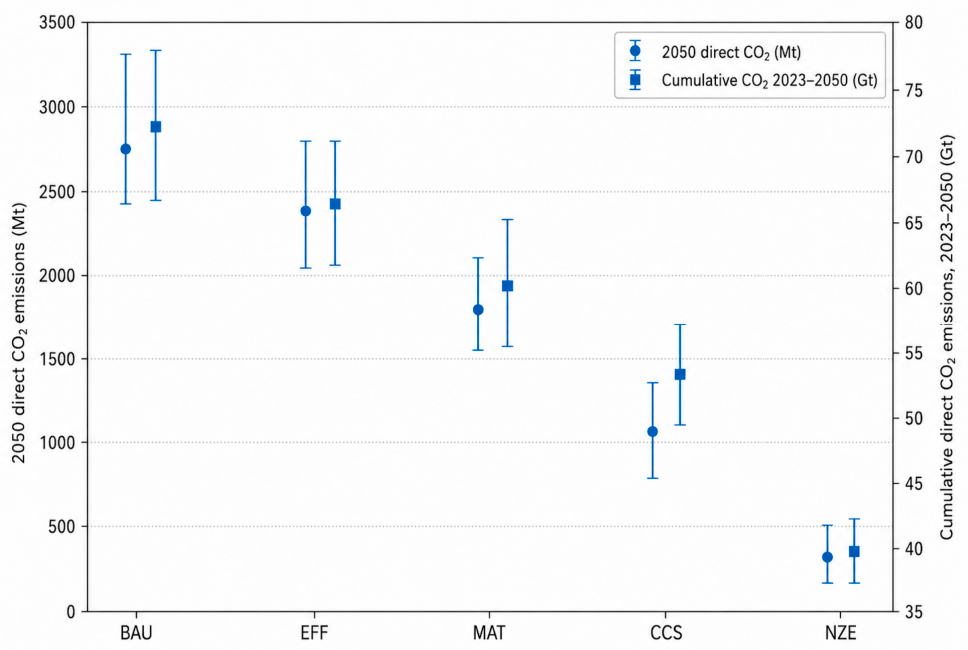

Disclaimer/Publisher’s Note: The statements, opinions and data contained in all publications are solely those of the individual author(s) and contributor(s) and not of MDPI and/or the editor(s). MDPI and/or the editor(s) disclaim responsibility for any injury to people or property resulting from any ideas, methods, instructions or products referred to in the content. |
© 2026 by the authors. Licensee MDPI, Basel, Switzerland. This article is an open access article distributed under the terms and conditions of the Creative Commons Attribution (CC BY) license.