


Highlights
What are the main findings?
- Sewage sludge digesters tolerated sodium propionate concentrations up to 20.3 mmol·L−1 (1.5 g·L−1 propionic acid equivalent) in semi-continuous reactors.
- A sodium propionate loading of 135.3 mmol·L−1 (10 g·L−1 propionic acid equivalent) caused VFA accumulation (>4.5 g·L−1), reduced methane production by approximately 40%, and altered microbial community structure.
- The identified propionate/propionic acid inhibition thresholds can support improved monitoring and management of anaerobic sludge digesters. The switch to batch mode (stopping feeding and heating) could be an interesting strategy for the system stressed by propionate to recover.
- The observed microbial shifts (Methanothrix, Methanobrevibacter, Pelotomaculum, and Methanosarcina) may provide early biological indicators of propionate stress and digester recovery.
Abstract
The accumulation of intermediate products, particularly volatile fatty acids (VFAs) like propionic acid (HPr) or its dissociated form, can inhibit biogas production during anaerobic digestion (AD) at low concentrations. Knowledge about the response of microorganisms to VFA inhibition can help control the digesters. In this study, we aimed to determine how sodium propionate (NaPr) inhibits the AD of municipal sewage sludge by identifying shifts in the microbial community. Four 5 L reactors were operated in semi-continuous mode using sewage sludge and then loaded with different levels of NaPr. The reactors operated at 37 °C with two hydraulic retention times. The results show that there was no apparent inhibition of biogas production at NaPr loading up to 20.3 mmol·L−1. However, moderate inhibition was observed at 81 mmol·L−1, corresponding to an approximate 10% decrease in methane production, while a ≈40% decrease in methane production was observed at 135.3 mmol·L−1. Sequencing analysis revealed that the community composition was dominated by Bacillota, Bacteroidota, Proteobacteria, Chloroflexi, and Cloacimonadota, with Halobacterota and Euryarchaeota as the main archaeal groups. PERMANOVA revealed incubation time as the primary driver of community structure, followed by NaPr concentration. Elevated NaPr levels resulted in a decline in Methanothrix and Methanobrevibacter and promoted distinct syntrophic propionate-oxidizing bacteria (SPOB).
1. Introduction
Sewage sludge is an inevitable byproduct of wastewater treatment plants. Many middle- and high-income countries with high treatment coverage are working to address the issue of clean water discharge into the environment by implementing more centralized wastewater management. However, this presents new challenges related to the control or elimination of municipal sewage sludge [1,2]. The production of municipal sewage sludge has increased due to population growth, rapid urbanization, and industrialization [3,4]. This high quantity of sewage sludge poses a risk to the environment if improperly disposed of because it contains approximately 50–80% organic, toxic, perishable, and persistent contaminants [5]. Conventional treatment of sludge includes landfill disposal, throwing, and incineration [6]. Sludge disposal in Europe is regulated by stringent guidelines established by the EU Urban Wastewater Directive (91/271/EEC) [7,8].
Sewage sludge management is estimated to account for approximately 30% and 50% of the capital and operational costs of wastewater treatment plants (WWTPs), respectively [9,10]. However, sewage sludge can be an excellent source of value-added products that may offset the cost of WWTPs due to its content of organic matter and nutrients that can be recovered [5]. Therefore, sewage sludge has been considered a resource rather than waste, aligning with the European Union Action Plan for the Circular Economy Strategy. This policy aims to develop a sustainable, low-carbon, and resource-efficient future by closing material loops and recycling and reusing products, effectively reducing dependency on virgin resources and associated environmental problems. Landfilling and incineration, which are commonly used to manage various forms of waste such as sludge, are less cost-effective and compatible with the concept of the Circular Economy [11]. Therefore, sewage sludge management is gaining interest in research, as studies have enhanced its sustainability and eco-friendliness through anaerobic digestion [5]. Anaerobic digestion (AD) is a widely used technology for treating organic waste [12], where organic byproducts, such as sewage sludge, can be transformed into biogas (bioenergy) and digestate (biofertilizers) [5]. Consequently, it contributes to the generation of green energy, removal of organic waste, environmental protection, and reduction in greenhouse gas emissions [13]. AD comprises four steps: hydrolysis, acidogenesis, acetogenesis, and methanogenesis.
During the AD process, the organic loading rate (OLR), which refers to the daily quantity of substrate introduced into the AD reactor per unit volume, is a crucial factor that directly affects biogas production. The optimal range of the organic loading rate in a bioreactor depends on various factors, including sludge loading rate, pH conditions, feedstock type, temperature, and reactor type [14]. It is recommended to maintain an OLR of 0.5–5 kgVS·m−3·d−1 during AD [15]. Overloading of anaerobic reactors can result in system acidification, typically due to the accumulation of volatile fatty acids (VFAs) produced by acidogenic and acetogenic bacteria. This in turn inhibits biogas production [16,17,18]. Generally, pH values ranging from 7 to 8 are indicative of a stable one-stage digestion process [19]. In anaerobic reactors with low buffering capacity, pH and VFAs may cause an imbalance in the system. However, in a highly buffered system, changes in pH may be minimal even under significant process strain. Thus, only VFAs are considered reliable for process monitoring [20]. High concentrations of VFAs, particularly propionic acid (HPr), are major inhibitors of microbial activity, leading to failure of anaerobic digestion [21]. HPr usually dissociates into its conjugated base form, propionate (Pr−), at a slightly neutral pH during the AD process. Propionate is therefore considered a key intermediate in anaerobic digestion [22], and microorganisms use it directly as a substrate. However, VFA concentrations around 2000 mg·L−1 have been observed to cause disturbances in AD systems by decreasing methane production of food waste [23,24]. It has been reported that propionic acid concentrations around 900 mg·L−1 can cause significant inhibition of methanogenic microorganisms [24,25]. Similarly, propionate concentrations of approximately 4000 mg·L−1 have been associated with inhibition of methane production during anaerobic digestion of sludge [26]. In addition, VFA concentrations exceeding 4000 mg·L−1 were reported to inhibit anaerobic digestion during glucose degradation [27]. Other studies have reported that high VFA levels enhance biogas production [19]. It has also been reported that at a pH of 7 and propionic acid/propionate concentration of 5000 mg·L−1, methane yield dropped by 22–38%, indicating that lower pH levels could further amplify this inhibitory effect [25].
The inhibitory effects of propionic acid on the AD process are not well defined, with reported threshold concentrations often conflicting across studies. In addition, information on VFA accumulation during sewage sludge AD is limited. Together, these uncertainties make it challenging to control AD reactors effectively [5]. Furthermore, the impact of VFA accumulation on microbial communities has lacked thorough investigation in the AD system. Methane production in anaerobic digesters relies on specialized archaea, and efficient biogas generation depends on the coordinated interaction of various microorganisms at each stage of anaerobic digestion [28]. In particular, a considerable syntrophic relationship exists between methanogens and acetate-forming bacteria, as the latter provides the main substrate (acetate and hydrogen) for methane production [29]. Syntrophy is important because it allows other organisms to quickly utilize the hydrogen (H2) produced, making the first reaction step energetically feasible [30]. Propionate degradation in anaerobic digestion is primarily mediated through syntrophic interactions involving propionate-oxidizing bacteria, such as members of the genera Pelotomaculum and Syntrophobacter. Simultaneously, methanogenic archaea utilize acetate or hydrogen pathways. These include acetoclastic methanogens, such as Methanosarcina and Methanothrix, as well as hydrogenotrophic methanogens belonging to groups such as Methanospirillum, Methanoculleus, Methanomicrobiales, and Methanobrevibacter [31,32,33]. Because these microorganisms are closely linked to interspecies electron and hydrogen transfer, they are generally considered more susceptible to operational disturbances and VFA stress than hydrolytic and acidogenic microbial populations [34]. According to previous studies, a shift from acetoclastic to hydrogenotrophic methanogenesis enabled the recovery of an anaerobic digester inhibited by HPr [35]. Methanotrichaceae, a family composed exclusively of acetoclastic methanogens, has been reported to play an important role in sustaining propionate degradation under elevated ammonia concentrations [36]. During the initial start-up phase, acetate and propionate gradually accumulated, while the abundance of Methanothrix remained stable, Methanosarcina decreased, and members of the order Methanomicrobiales increased. During acetate and propionate degradation and accumulation, the abundance of propionate-oxidizing bacteria increased gradually, reaching 5.1% of the total bacterial population. Pelotomaculum emerged as the predominant genus, followed by Smithella and Syntrophobacter. A recent study revealed that a redundant consortium could handle high levels of propionate when it is co-digested with chicken litter [37]. Syntrophic bacteria were not present in the reactors after an enrichment process of the consortium under a gradual extreme propionate concentration.
As mentioned earlier, reported VFA inhibition thresholds during anaerobic digestion vary considerably across studies because they depend strongly on substrate characteristics and operational conditions, including temperature, inoculum origin, reactor configuration, feeding regime, and organic loading rate [38]. Therefore, VFA inhibition levels may vary depending on the specific characteristics and operating conditions of the anaerobic digestion system. Nevertheless, determining system-specific inhibitory ranges remains essential for improving reactor monitoring, stability, and operational optimization under defined process conditions. In our previous batch study conducted with municipal sewage sludge [39], slight inhibition of methane production was observed at a sodium propionate concentration of 81 mmol·L−1. Therefore, the objective of the present study was to determine the concentration range at which VFAs begin to impair the anaerobic digestion of municipal sewage sludge under mesophilic semi-continuous conditions, while simultaneously investigating microbial community shifts associated with these inhibitory stages using 16S rDNA metabarcoding analysis [28]. Such system-specific information is important because a lack of operationally relevant inhibition data often leads to empirical digester design, oversized reactors, or excessively conservative loading strategies, which may compromise process efficiency and stability [29,38].
2. Materials and Methods
2.1. Inoculum and Substrate (Mix Sludge and Sodium Propionate)
For this study, an inoculum consisting of digested sludge and a substrate consisting of undigested sludge (primary sludge and secondary sludge) were obtained from Seine Aval wastewater treatment plant and its biogas plant, respectively (SIAAP, Achères, Yvelines, France). Seine Aval WWTP was constructed in 1940 to serve the needs of the Paris region. It is considered one of Europe’s largest and oldest wastewater treatment plants. It consists of a wastewater treatment unit and a sludge treatment unit. The biogas plant treating the sewage sludge operated under mesophilic conditions. The inoculum was collected once at the beginning of the experiment. Subsequently, different batches of undigested sludge were collected (i.e., once at the beginning and twice during the operation of the reactors). The undigested sludge was stored in an air-tight plastic jar and refrigerated at 4 °C. Both the digested and undigested sludge were characterized as illustrated in Table 1. Sodium propionate (NaPr) (99% purity, Alfa Aesar, Kandel, Germany) was selected to load the reactors and determine the concentration level that causes inhibition. Our previous investigations conducted in batch under similar anaerobic digestion conditions indicated that the inhibitory effect associated with propionic acid addition could result from multiple factors, including the undissociated acid, the propionate ion, and the acidification caused by proton release during dissociation [39]. In comparative experiments performed at equivalent molar concentrations, reactors supplemented with sodium propionate maintained methane production even at elevated propionate levels, whereas systems using propionic acid exhibited complete process failure. Based on these observations, sodium propionate (NaPr) was selected in the present study, since propionic acid is expected to occur mainly in its dissociated form under typical anaerobic digestion conditions [39].
Table 1.
Characteristics of substrate and inoculum.
2.2. Operation of the Semi-Continuous Reactors
Four identical continuous stirred tank reactors were used in this study (Bioprocess Control, Lund, Sweden), made of stainless steel, named R1, R2, R3, and R4, and each with a working volume of 5 L. The reactors were operated under mesophilic conditions at 37 °C by circulating heated water from a water bath through a jacket surrounding them. The reactors were run for 81 days with a hydraulic retention time (HRT) of 20 days. Each digester was equipped with an inlet and outlet for feeding and effluent discharge, respectively.
During the start-up period, all four reactors were operated under identical conditions to ensure comparable initial microbial and physicochemical states before the addition of sodium propionate (NaPr). Each reactor was initially filled with 2.5 L of the same inoculum batch, and 0.5 L of the same undigested sludge substrate was added daily until the working volume was reached on day 5. The reactors were maintained at the same mesophilic temperature (37 °C) and operated with identical mixing conditions, feeding frequency, hydraulic retention time, and organic loading regime throughout the acclimatization period. This fed-batch start-up phase enabled gradual acclimatization and stabilization of the microbial communities.
After start-up, all reactors continued to receive the same undigested sludge substrate once daily, five days per week (Monday to Friday), under semi-continuous operation. Reactor performance was monitored regularly through biogas production, methane content, VFA concentration, pH, and measurements of total alkalinity. Addition of sodium propionate was initiated only after all four reactors exhibited similar operational behavior and stable process performance during the steady-state period (days 12–21), thereby minimizing differences attributable to initial reactor variability. Following the stabilization period, all reactors continued to receive the same undigested sludge substrate under identical operating conditions; however, different NaPr concentrations were subsequently applied to each reactor to evaluate the effects of concentration-dependent inhibition. The target NaPr concentrations in the reactors were 0, 20.3, 81, and 135.3 mmol·L−1, corresponding to equivalent propionic acid (HPr) concentrations of 0, 1.95, 7.78, and 13 g·L−1, respectively. R1, which received no addition of NaPr, was fed only with undigested sludge throughout the experiment and served as the control reactor for comparison with the NaPr-loaded reactors (R2–R4).
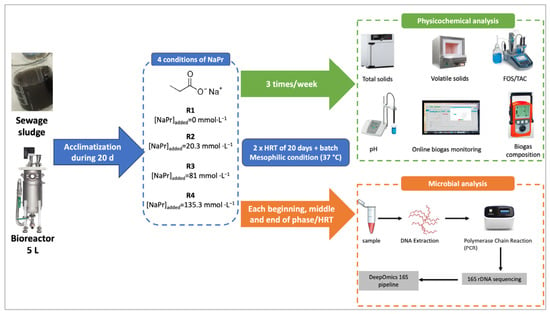
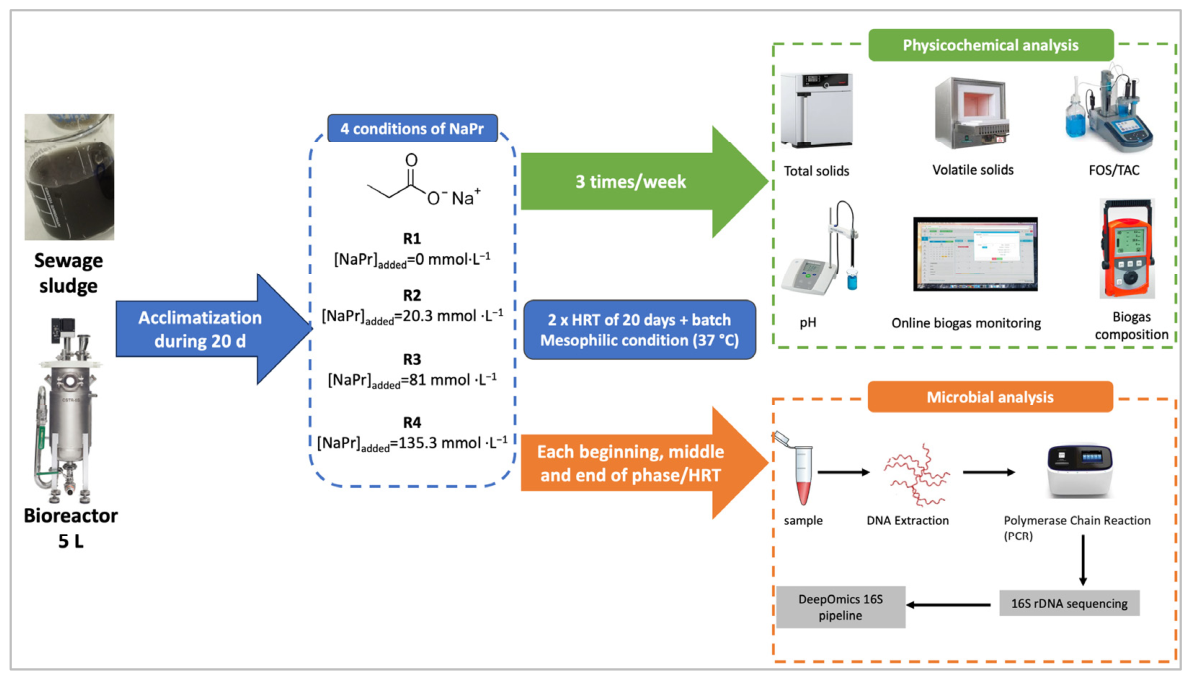
The NaPr concentrations were selected to induce a gradual and controlled disturbance of the anaerobic digestion process based on previous reports in the literature [35,40,41] and the findings of our earlier batch study. Here, slight inhibition of methane production was observed at 81 mmol·L−1 NaPr. It was also noted that the addition of sodium ions in the form of sodium chloride had a limited impact on gas production compared to sodium propionate, as shown in the batch stage [39]. In total, 350 mL of the content (digestate) was withdrawn from each reactor for analysis, and an equivalent of 350 mL of undigested sludge and a corresponding propionate concentration was fed into each reactor every weekday. Heating and feeding were stopped on day 61 (after two HRT periods), and the operation was switched to batch mode at room temperature for another 20 days, representing the third hydraulic retention time. This was conducted to examine the possible recovery of the reactors from inhibition. Figure 1 contains a simple diagram depicting the experimental setup and workflow of the semi-continuous anaerobic digestion study. Table 2 summarizes the experimental design for feeding the reactors in semi-continuous conditions.
Figure 1.
Schematic diagram depicting the experimental setup and workflow of the semi-continuous reactors.
Table 2.
Experimental design for feeding the reactors.
2.3. Analytical Methods
Samples were collected at the start and end of each feeding or residence time phase. Total solids (TS), volatile solids (VS), pH, total alkalinity (TAC), VFAs, and chemical oxygen demand (COD) were then analyzed on the collected samples. TS and VS were analyzed in triplicate following standard methods [42]. An automatic titrator (HACH, TitraLab AT1000 Series, Loveland, CO, USA) was used to measure total alkalinity (TAC), VFAs, and the VFA/TAC ratio, which is also referred to as the FOS/TAC ratio in the German literature, where FOS stands for Flüchtigen Organischen Säuren and TAC stands for Total Alkalischen Carbonaten. The FOS/TAC ratio involves titration of a sample with a standard sulfuric acid (H2SO4) titrant (90.1 N) to endpoints of pH 5.0 and 4.4 using the Nordmann method [43]. The obtained VFA and TAC values were further processed according to the methods outlined in [44]. VFA and alkalinity measurements were performed in replicates, with standard deviations generally below 5%. The VFA conversion rate was calculated to evaluate the efficiency of volatile fatty acid degradation in the NaPr-loaded reactors relative to the control reactor (R1). The calculation considered the amount of VFAs introduced into the reactors by the addition of sodium propionate and the residual accumulation of VFAs measured experimentally during reactor operation. The VFA conversion rate was expressed as a percentage according to Equation (1). The pH was measured using a pH meter (Mettler Toledo, Greifensee, Switzerland). All reactors were equipped with an online biogas monitoring system (microflow, Bioprocess Control, Lund, Sweden). The biogas composition was determined on a thrice-weekly basis, using a gas analyzer (Multitec 540, Sewerin, Gütersloh, Germany). All amounts of biogas and methane produced were reported regarding standard conditions (0 °C, 1 atm). Samples were collected at various time points during the experiment (days 5, 19, 26, 40, 61, and 81) and stored at −18 °C until their analysis for microbial populations.
where
- VFA_introduced is the theoretical VFA concentration introduced by the addition of NaPr;
- VFA_exp,Ri is the experimentally measured VFA concentration in reactor Ri (R2, R3, and R4); VFA_R1 is the concentration of VFAs measured in the control reactor (R1).
2.4. DNA Extraction, Quantification, and Sequencing
Total DNA was extracted from the pellets using the DNeasy PowerSoil kit (Qiagen, Velno, Netherlands) according to the manufacturer’s instructions. The DNA concentrations were subsequently measured using the Qubit dsDNA BR Assay Kit (Invitrogen, Carlsbad, CA, USA).
Libraries for sequencing were prepared following the 16S Metagenomic Sequencing Library Preparation protocol (Illumina, San Diego, CA, USA) with minor modifications. The diversity of bacterial and archaeal communities in the samples was assessed by sequencing the V4–V5 regions of the 16S ribosomal RNA (rRNA) gene. Amplicons were prepared using universal primers 515F (5′-GTGYCAGCMGCCGCGGTA-3′) and 928R (5′-CCCCGYCAATTCMTTTRAGT-3′) [45], which included Illumina overhang adapter sequences. PCR was performed with the KAPA Hifi HotStart PCR Kit (Roche Diagnostics France, Meylan, France), and sequencing was performed on an Illumina MiSeq sequencer (Illumina Inc., San Diego, CA, USA). Each sample was processed twice, including extraction, amplification, and sequencing. The resulting fastq raw sequence files were concatenated to obtain a sufficient number of reads per sample (>10,000).
2.5. Bioinformatics Processing
The 16S rRNA sequencing data were pre-processed using the DeepOmics16S pipeline (version 08-02-2024) on the INRAE Migale bioinformatics platform cluster (https://forgemia.inra.fr/cedric.midoux/deepomics16S, accessed on 1 February 2024). This pipeline primarily applies dada2 [46] for the first steps, including filtration and generation of amplicon sequencing variants (ASVs). Taxonomic assignment was performed using FROGS (2018) [47] and the Blastn tool (2.10.1+) for alignment against the silva_138.1_16S_pintail100 database. The raw sequencing files as well as pipeline results were presented in biom format and metrics files and integrated into the DeepOmics information system (https://deepomics-info.hub.inrae.fr/, accessed on 1 February 2024), which is an online platform dedicated to the storage and analysis of data from environmental biotechnology processes, such as anaerobic digestion. The raw sequencing files are available in the ENA repository under accessions ERR15469053-ERR15469106 (project PRJEB96189).
2.6. Biostatistics Analysis
After bioinformatic pre-processing, the biom files and associated metadata were imported into RStudio (4.3.2) using the Phyloseq package (1.46.0) [48]. An initial filter was applied to exclude rare ASVs from the analysis, which were defined as having fewer than 50 sequences in the sample set. The ASV counts were then transformed into relative abundances to standardize comparisons between samples. For some analyses, abundance data and transformation were normalized using the centered log-ratio (CLR) and log-ratio.transfo function in the MixOmics package (6.26.0), respectively [49].
All statistical analyses were performed in Rstudio. The packages MixOmics (6.26.0) and Phyloseq (1.46.0) were used to visualize the taxonomic composition of the samples and perform various assessments, such as principal component analysis (PCA) and multivariate analysis of variance by permutation (PERMANOVA). Linear Mixed-Effect Model Spline (LMMS) analysis was conducted using the package lmms (1.3.3) [50]. The PCA was performed using microbial community composition data obtained from 16S rDNA metabarcoding analysis (metagenomic data), together with the associated number of incubation days (i.e., the respective sampling period from day 5 to day 81). NaPr concentrations were used as explanatory and experimental variables. The microbial variables corresponded to the relative abundances of microorganisms identified from sequencing data after filtering and centered log-ratio (CLR) transformation.
3. Results and Discussion
3.1. Effects of Propionate on VFA Accumulation
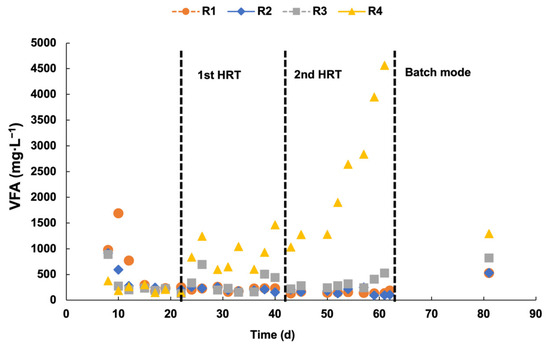
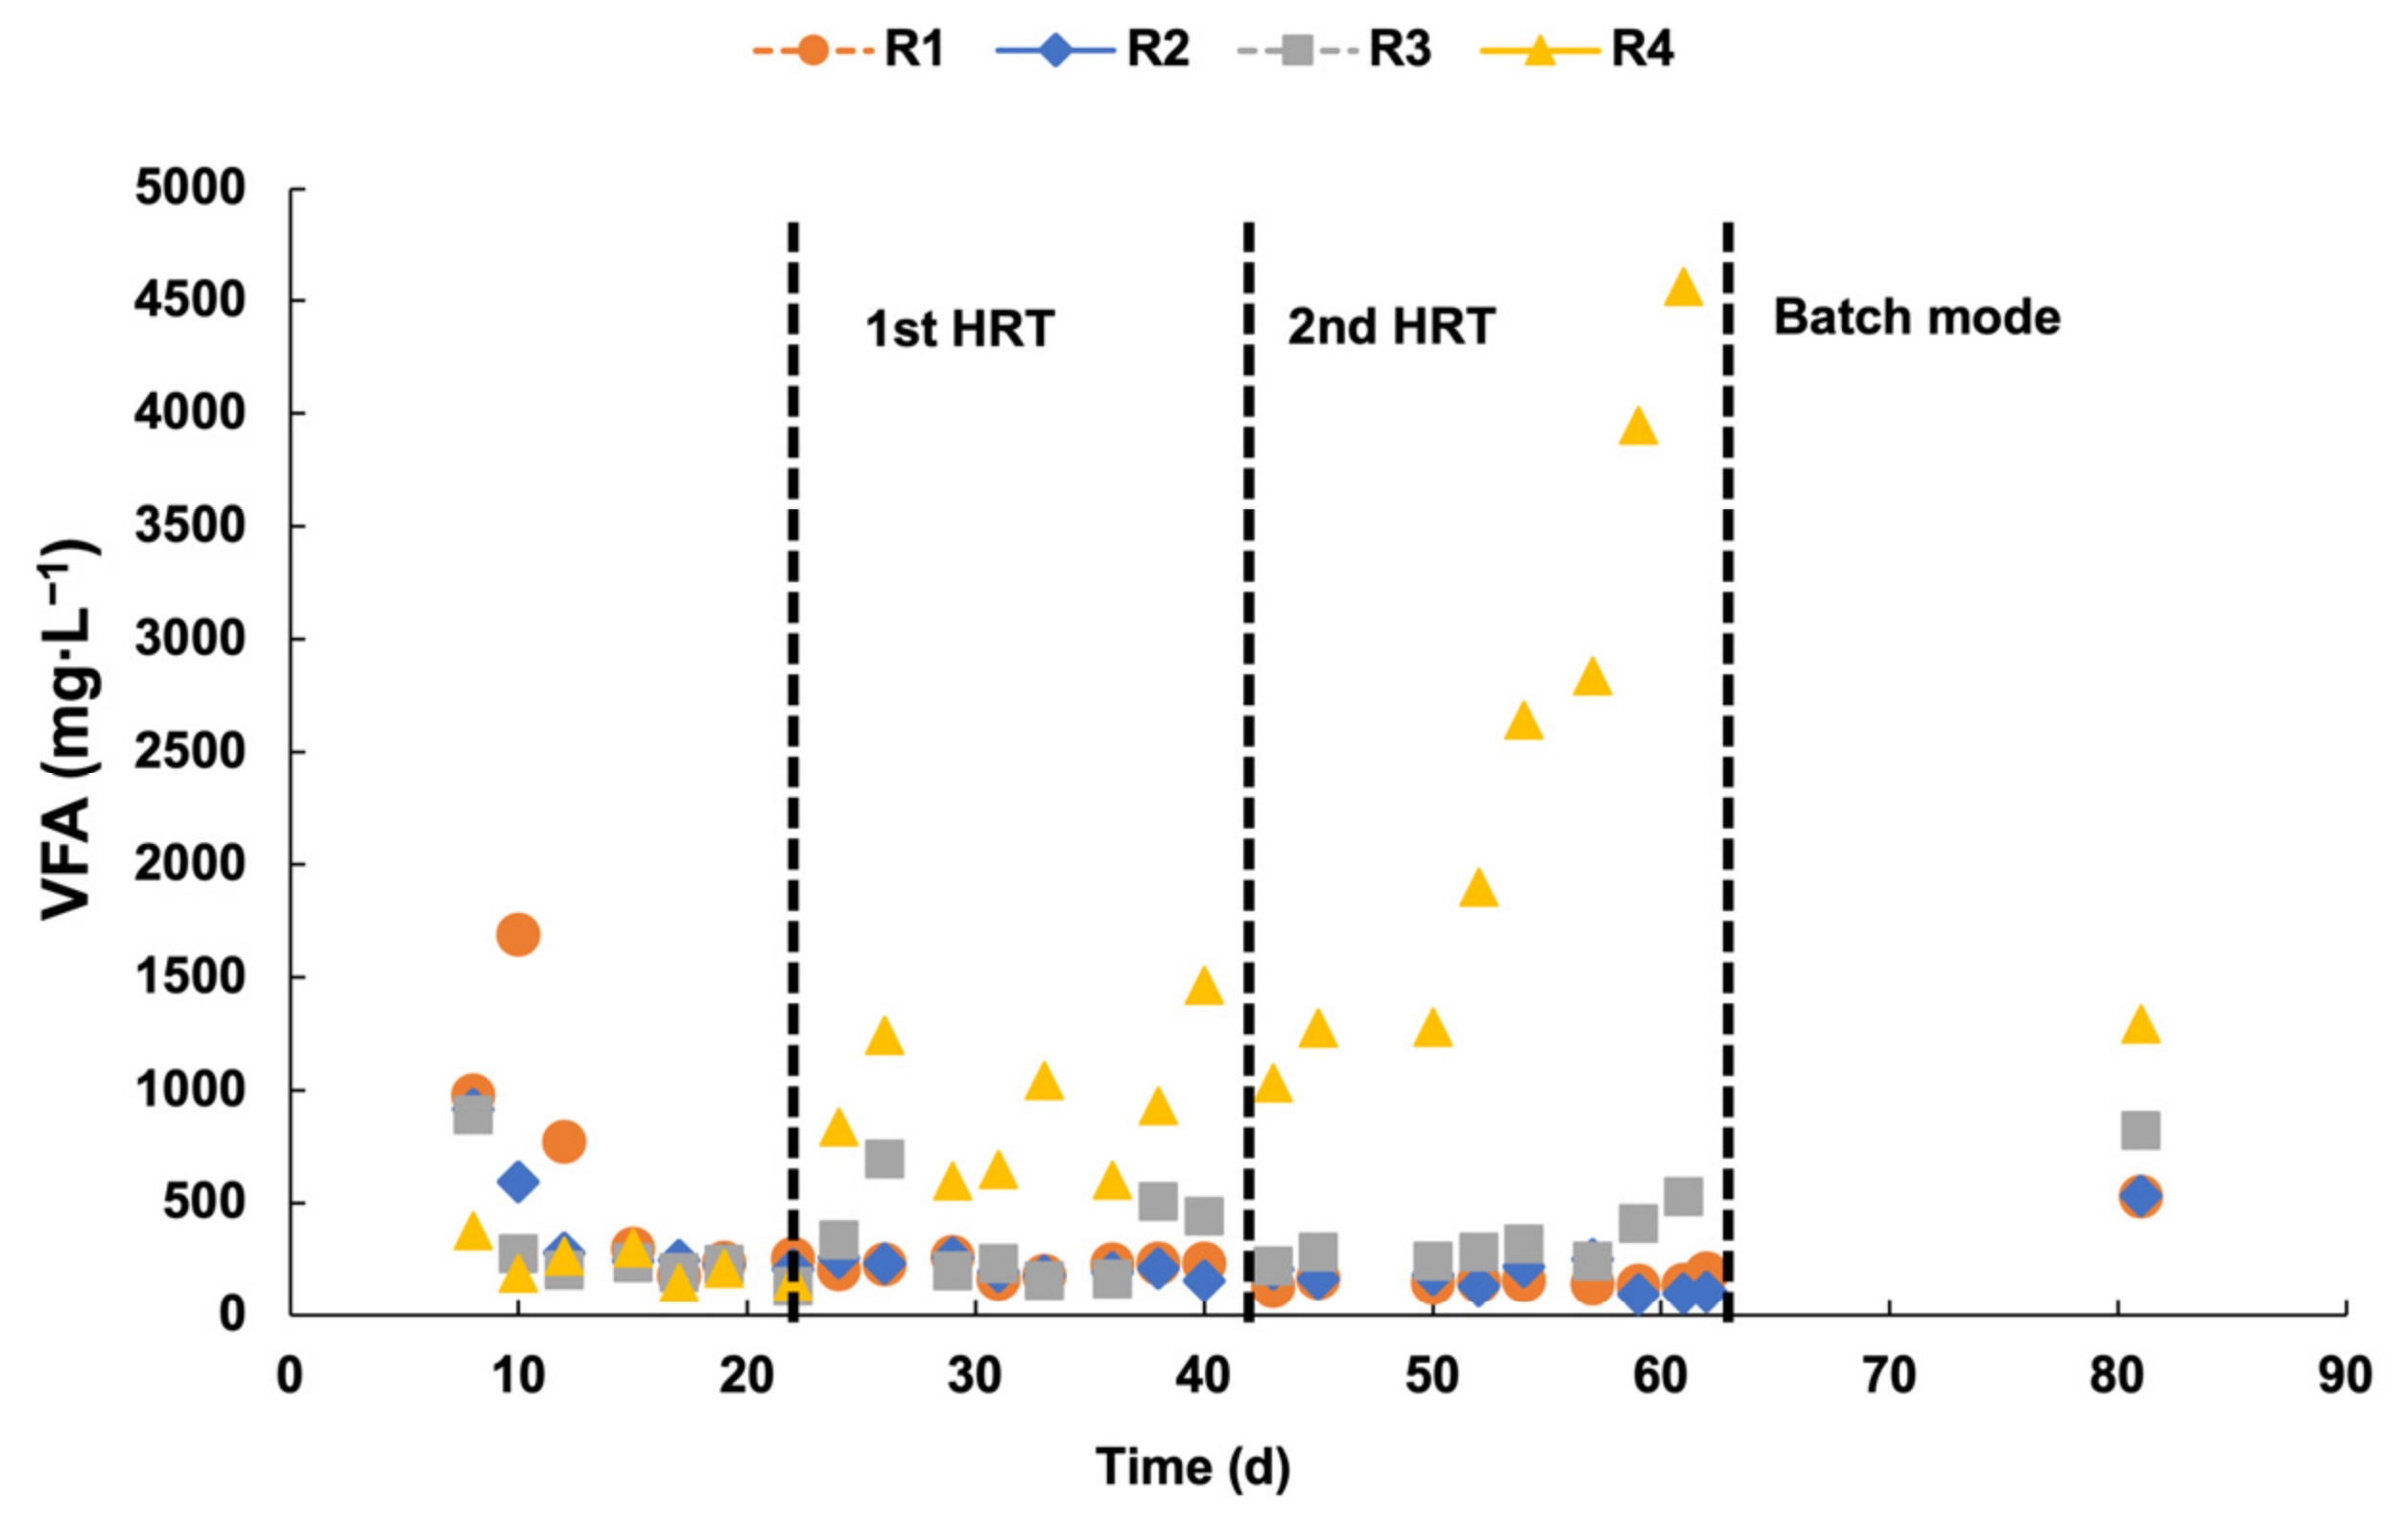
Figure 2 shows the evolution of VFA concentration during the operation of the reactors. During the first HRT, the reactor loaded with the highest NaPr concentration, R4, exhibited a rapid increase in VFA concentration immediately after the start of this phase. VFA accumulation reached 1462 mg·L−1 by the end of the first HRT in R4. R3 exhibited a lower and less stable VFA accumulation compared to R4, reaching a concentration of 442 mg·L−1 at the end of HRT 1. Meanwhile, VFA concentrations in R1 (the control reactor) and R2 (the reactor with the lowest NaPr load) remained relatively stable and low at approximately 232 and 157 mg·L−1, respectively, indicating that low propionate loading had only a limited effect on VFA accumulation during anaerobic digestion.
Figure 2.
VFA concentrations over time in the four reactors. Dashed black lines represent the different HRT and phases during the process with NaPr: R1—0 mmol·L−1 (0 g·L−1), R2—20.3 mmol·L−1 (1.95 g·L−1), R3—81 mmol·L−1 (7.78 g·L−1), and R4—135.3 mmol·L−1 (13 g·L−1).
During the second HRT, VFA concentrations in R4 continued to rise sharply, reaching 4562 mg·L−1, highlighting the sustained impact of propionate loading on VFA accumulation. However, during this, R3 maintained relatively stable VFA levels, reaching a maximum of 530 mg·L−1 at the end of the second HRT. R1 and R2 maintained low and stable VFA concentrations, consistent with previous studies reporting VFA accumulations of approximately 236 mg·L−1 during stable anaerobic digestion of mixed sludge under balanced operating conditions [5]. Also, in the degradation of cellulose and glucose, it has been noted that acceptable levels of VFA concentration are around 2000 mg·L−1 and 4000 mg·L−1, respectively [51]. In this study, it can, therefore, be observed that R4, with the highest propionate loading, had a higher VFA accumulation of over 4500 mg·L−1. Upon cessation of propionate loading and feeding and with reactors left at ambient temperature for several weeks, a decline in VFA concentration in R4 was observed. This possibly suggests that microbial organisms gradually consumed the accumulated VFA, indicating the recovery of the reactors.
3.2. Alkalinity and pH Dynamics Under High Propionate Loading
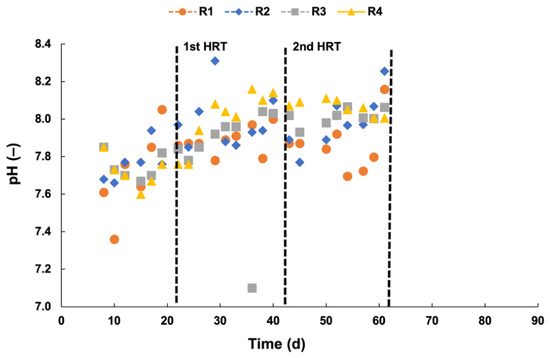
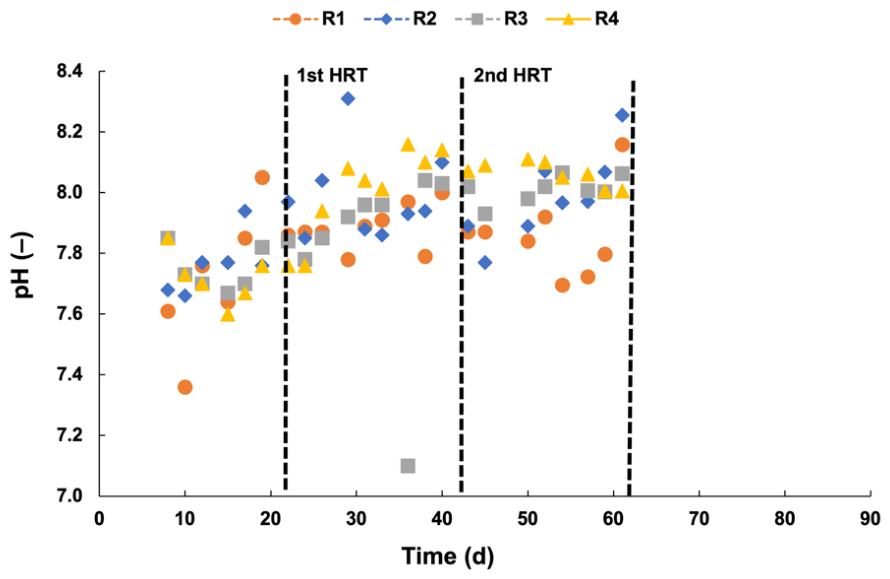
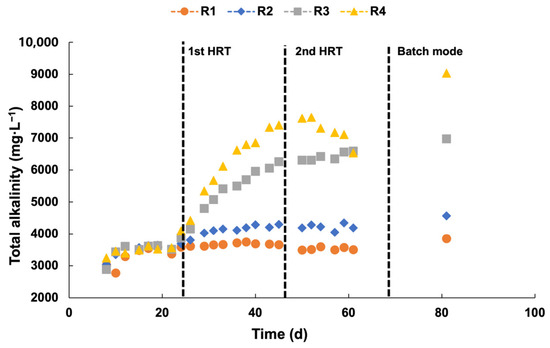
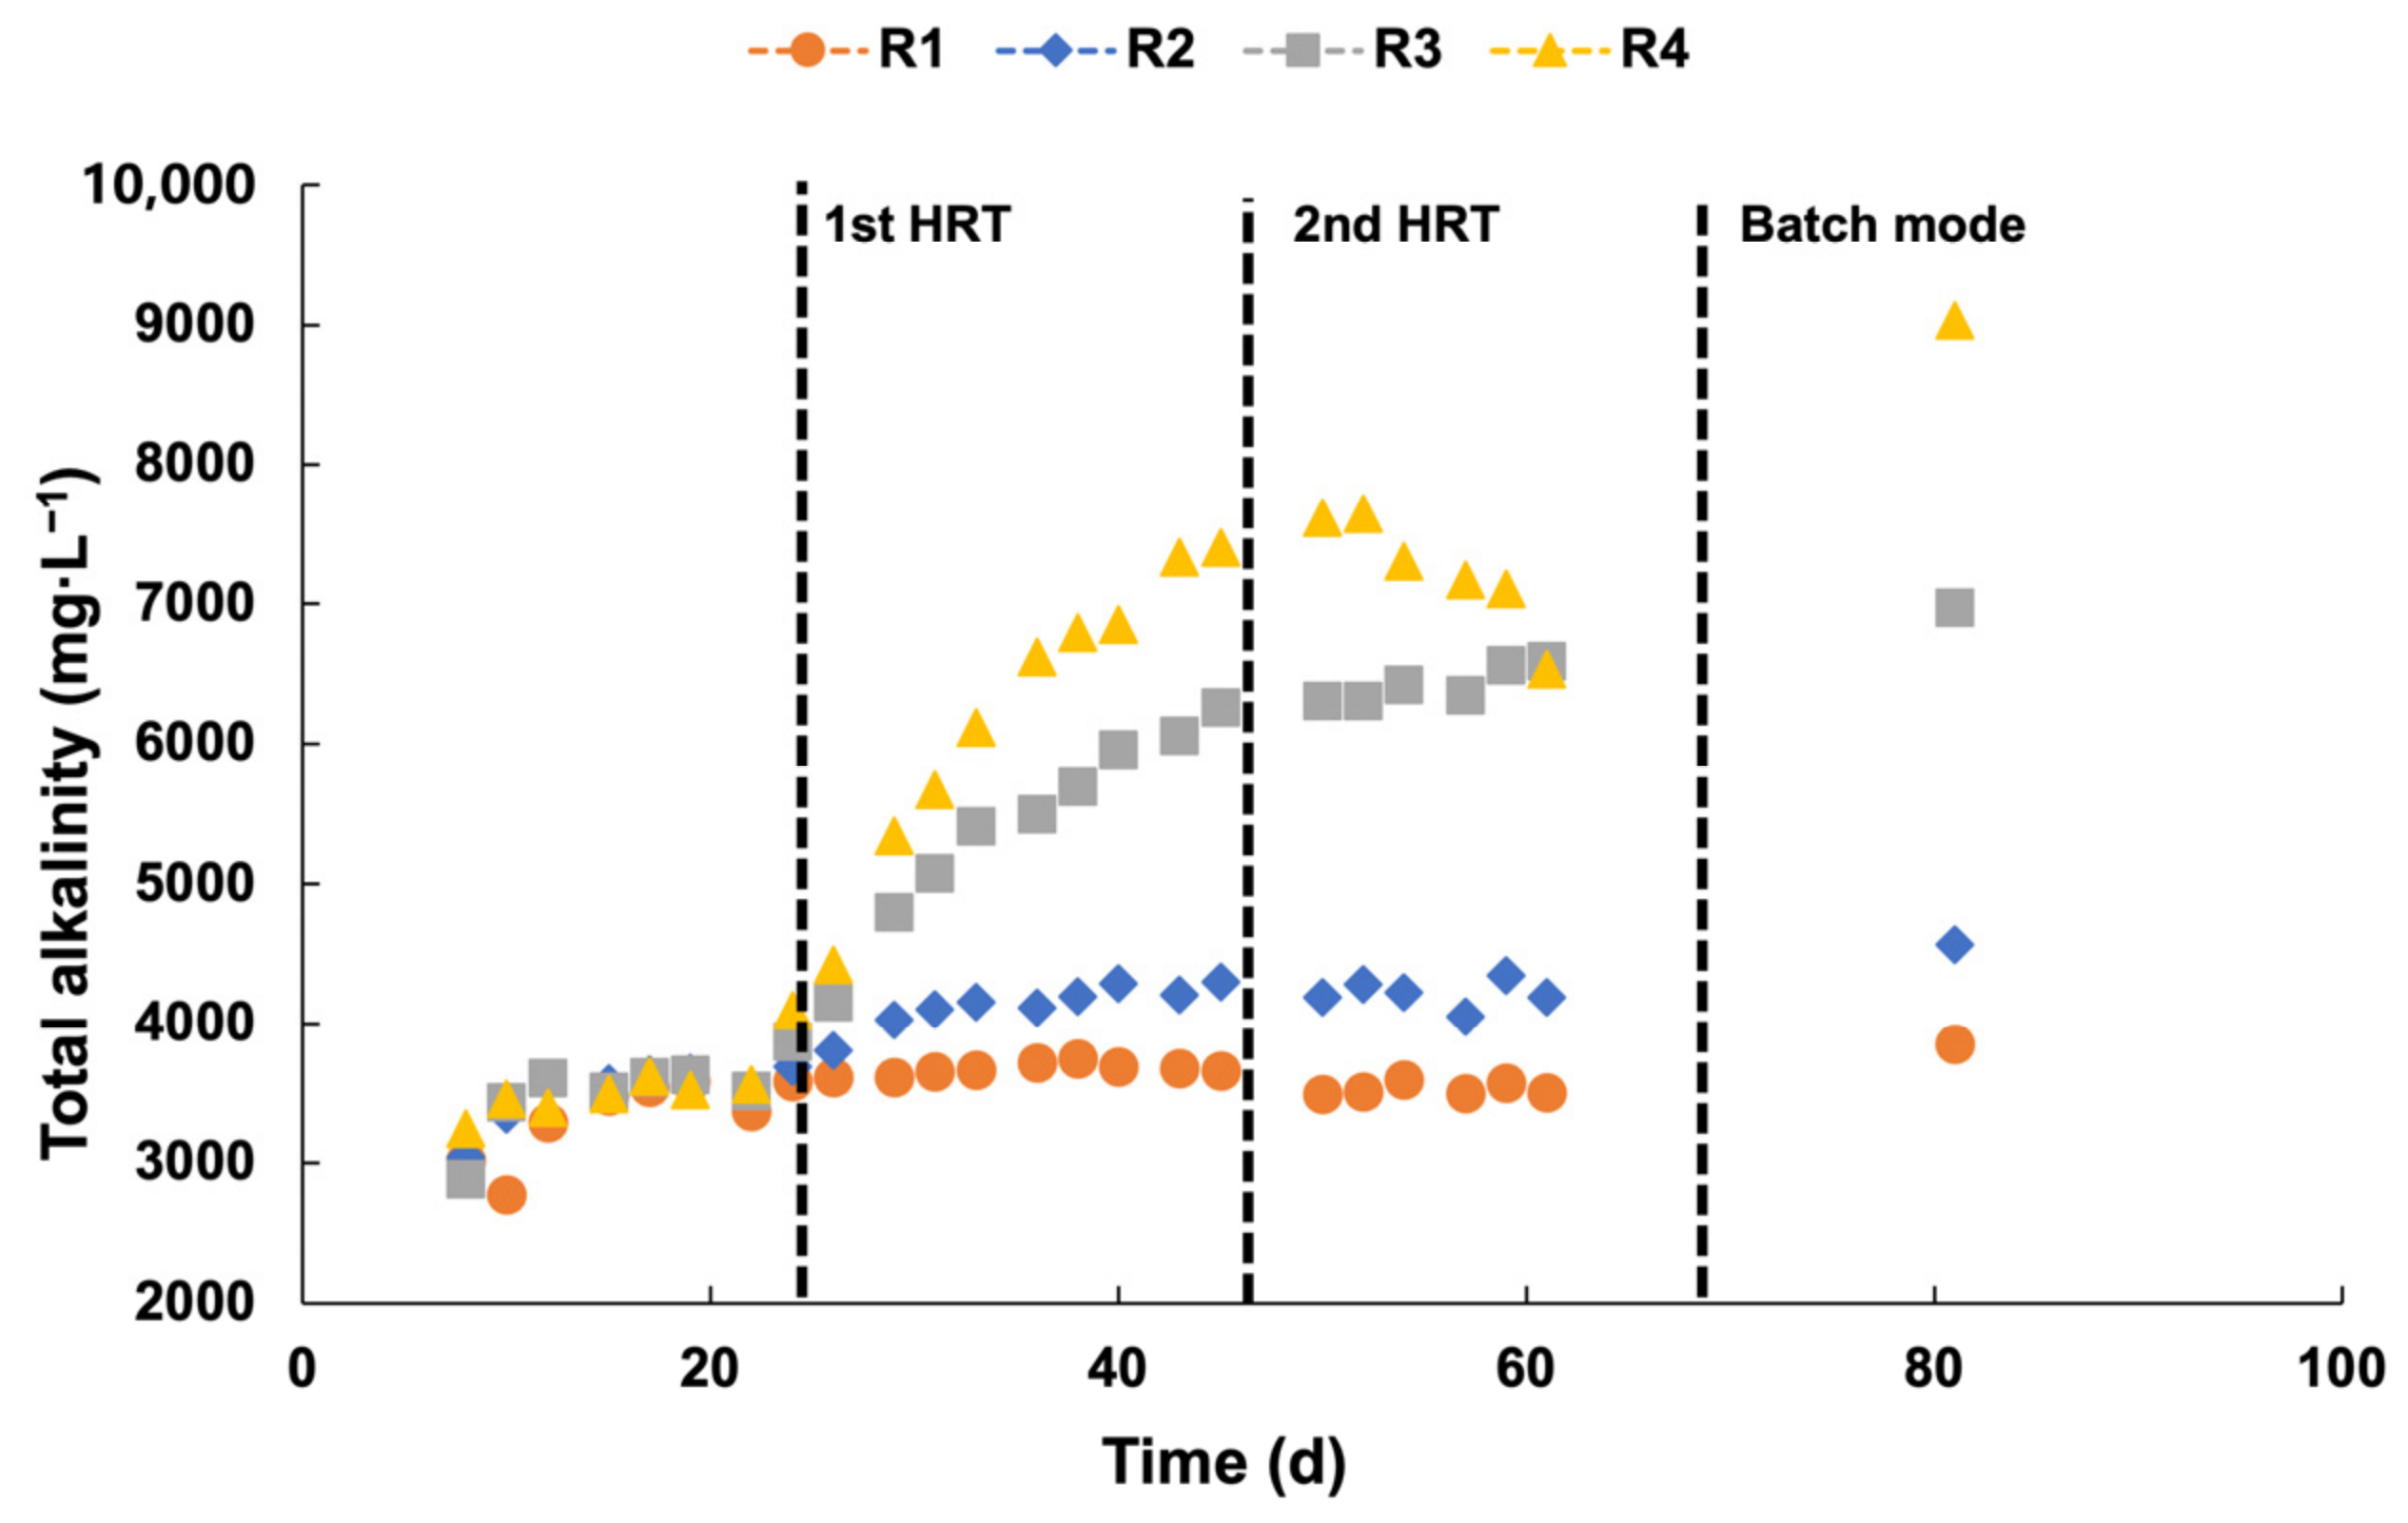
During anaerobic digestion, pH plays a crucial role. The optimal pH range is typically considered to be between 6.8 and 7.2 for methanogenesis, although the process can tolerate pH levels ranging from 6.5 to 8.0 [52,53]. In this study, the pH in all four reactors was within tolerable levels for microbial growth, despite significant VFA accumulation in R4, particularly during the first HRT (Figure 3). In the first HRT, the pH levels for R1, R2, R3, and R4 were 7.0 ± 0.1, 8.0 ± 0.2, 7.8 ± 0.3, and 8 ± 0.2, respectively. In the second HRT, the observed pH levels were 7.9 ± 0.1, 8.0 ± 0.2, 8.0 ± 0.1, and 8.1 ± 0.1, respectively. Typically, the accumulation of volatile fatty acids causes a decrease in pH. However, in this instance, the addition of sodium propionate could have had an impact. The ideal alkalinity during AD is between 2000 mg·L−1 and 5000 mg·L−1 [24]. Both R4 and R3 experienced a notable increase in alkalinity upon the addition of propionate, reaching maximum values of 7646 mg·L−1 and 6592 mg·L−1, respectively. These values were slightly higher than the optimum range, as depicted in Figure 4. This increase in alkalinity, especially during the first HRT, can be attributed to propionate conversion to acetate, which releases alkaline byproducts [30,54], thereby enhancing the overall buffering capacity of the system. Also, because propionic acid (pKa ≈ 4.87) is almost completely dissociated at the AD system, the addition of sodium propionate supplies propionate ions (CH3CH2COO−) that can neutralize protons and may also enhance the pH levels in R3 and R4 [55]. Towards the end of the second HRT, there was a slight decline in pH and alkalinity in R4. This was likely due to the increasing accumulation of VFA and the reduced propionate conversion rate in this reactor. As a result, it was unable to maintain its buffer capacity. However, the pH level remained within acceptable levels for the AD process. R1 also showed a minor decline in pH toward the end of the second HRT (around 7.7). It is worth mentioning that when heating and feeding stopped during the batch mode, despite the decline in VFA, pH values showed a slight decline, with R3 exhibiting a more pronounced drop. The slight decline in pH during this period may be attributed to the temperature drop since lower temperatures favor CO2 solubility, which can eventually decrease pH.
Figure 3.
Evolution of pH in the four reactors. Dashed black lines represent the different HRT and phases during the process. R1—0 mmol·L−1 (0 g·L−1), R2—20.3 mmol·L−1 (1.95 g·L−1), R3—81 mmol·L−1 (7.78 g·L−1), and R4—135.3 mmol·L−1 (13 g·L−1).
Figure 4.
Total alkalinity. Dashed black lines represent the different HRT and phases during the process. R1—0 mmol·L−1 (0 g·L−1), R2—20.3 mmol·L−1 (1.95 g·L−1), R3—81 mmol·L−1 (7.78 g·L−1), and R4—135.3 mmol·L−1 (13 g·L−1).
3.3. Effect of Propionate on the Biogas and Methane Production
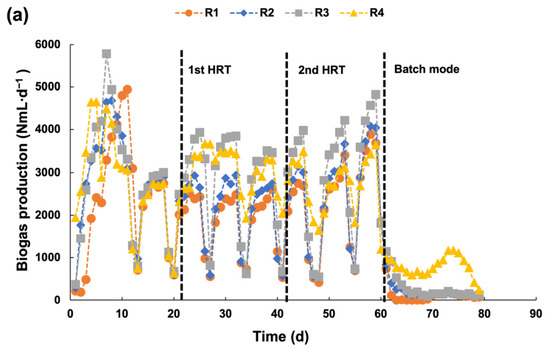
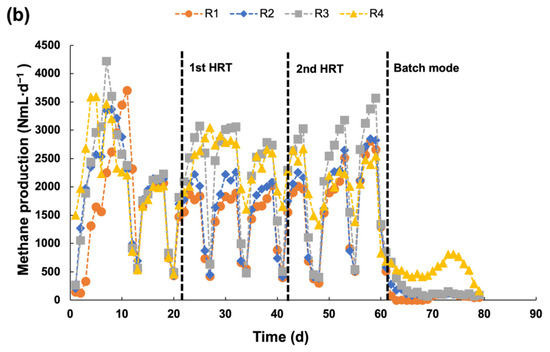
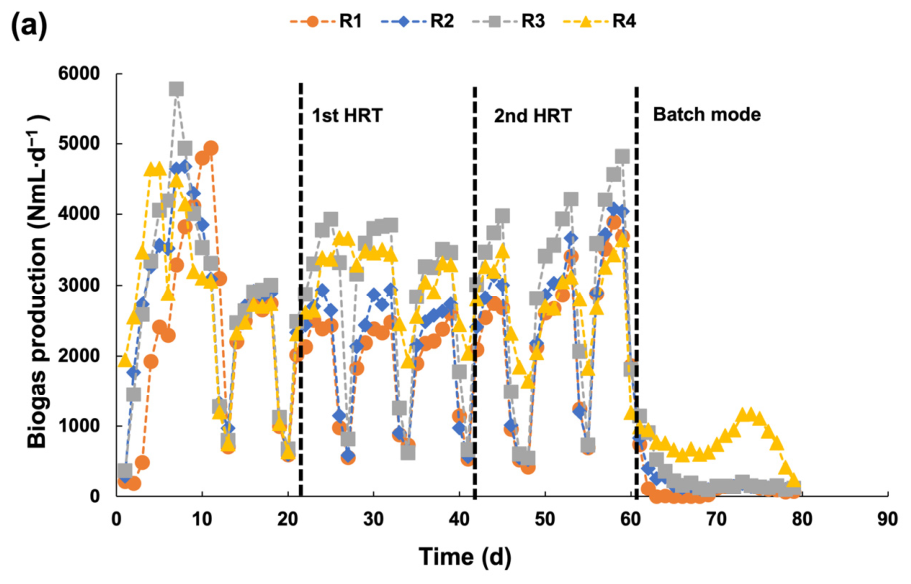
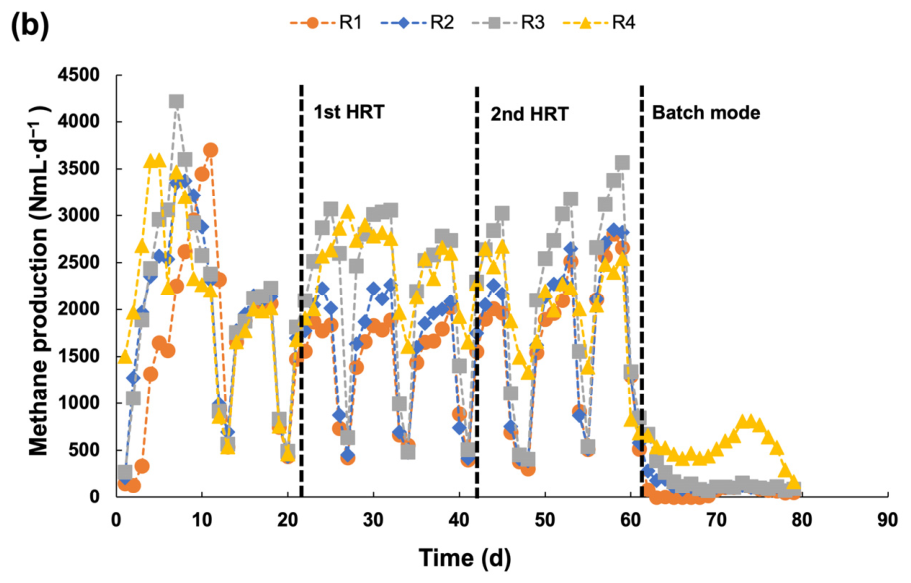
After the steady-state period of operation, which marked the start of the first HRT, biogas and methane production in R3 and R4 increased sharply following the addition of the corresponding propionate concentrations. By contrast, gas production in R1 and R2 remained relatively stable (Figure 5). This initial increase in gas production in R3 and R4 was likely associated with the additional readily biodegradable substrate provided by the higher NaPr loading, which temporarily stimulated methane generation. Consequently, the addition of NaPr also increased the organic loading rate (OLR) in these reactors. The OLRs in R1, R2, R3, and R4 were approximately 1.1–1.2, 1.2–1.3, 1.4–1.5, and 1.6–1.8 g VS·L−1·d−1, respectively, which may also have contributed to the observed increase in biogas and methane production during the initial phase of operation.
Figure 5.
Biogas and methane production over time: (a) Biogas production; (b) Methane production. Dashed black lines represent the different HRT and phases during the process. R1—0 mmol·L−1 (0 g·L−1), R2—20.3 mmol·L−1 (1.95 g·L−1), R3—81 mmol·L−1 (7.78 g·L−1), and R4—135.3 mmol·L−1 (13 g·L−1).
The methane content in the biogas ranged from 75 to 76% in reactors R1 and R2, while slightly higher values of approximately 76–80% were observed in R3 and R4 (Supplementary Figure S1). The relatively higher methane fractions observed in R3 and R4 may be associated with the elevated reactor pH and higher amounts of sodium propionate, which may have promoted greater retention of dissolved CO2 in the liquid phase. Although methane contents of 55–65% are commonly reported for sewage sludge anaerobic digestion, similarly elevated methane fractions have also been observed in stable and optimized anaerobic digestion [56]. During the first HRT, biogas and methane production levels in reactors R3 and R4 were similar. R3 reached maximum biogas and methane production rates of 3929 NmL·d−1 and 3070 NmL·d−1, respectively. During the second HRT, the maximum daily biogas and methane production in R3 increased to 4825 NmL·d−1 and 3567 NmL·d−1, respectively. As for R4, the maximum biogas and methane production rates were slightly reduced compared to R3; thus, recordings of 3667 and 3043 NmL·d−1 were obtained, respectively, despite its highest propionate loading. However, a significant decrease in gas production during the second HRT was observed, with maximum daily biogas and methane production dropping to 3644 NmL·d−1 and 2543 NmL·d−1, suggesting possible process inhibition.
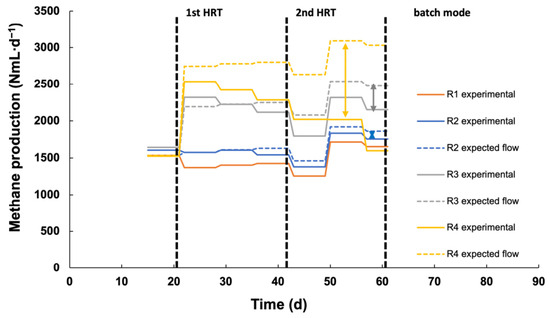
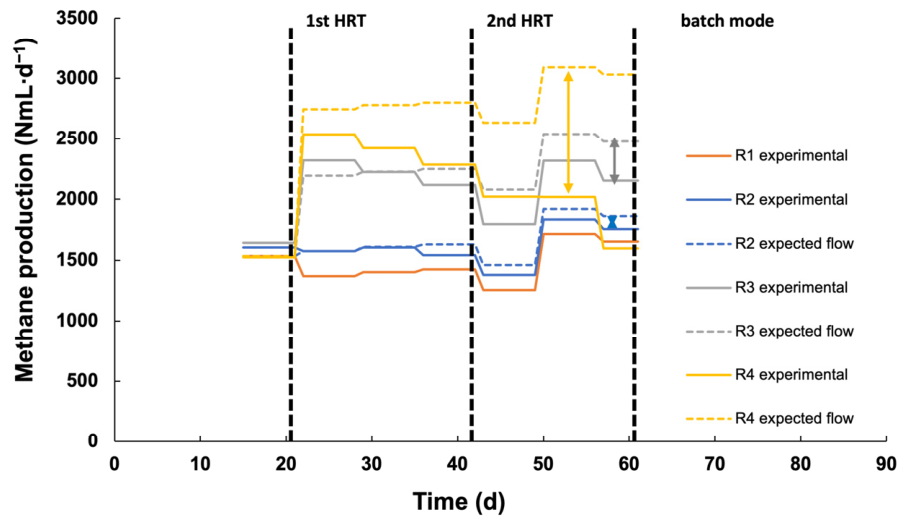
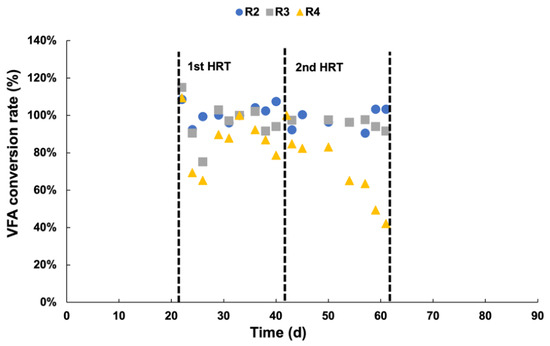
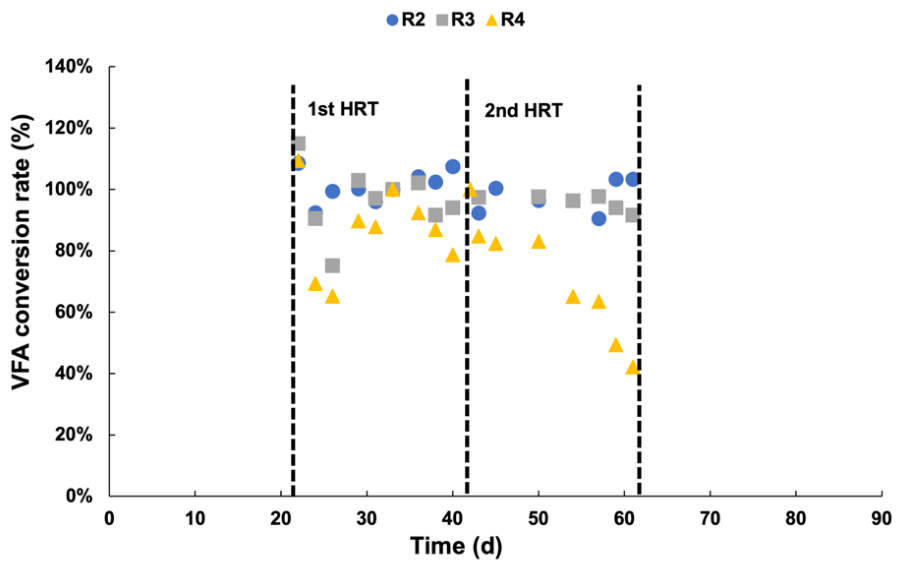
To better observe this inhibition, theoretical methane production was calculated by adding the experimental CH4 production from R1 (the control reactor as a reference) to the theoretical surplus CH4 production expected from the addition of NaPr. According to Equation (1), the stoichiometric methane production from propionate ions or propionic acid leads to the formulation of 39.2 NLCH4.mol−1 (0.529 NLCH4 g−1). Therefore, the added sodium propionate served as an additional substrate for the microorganisms in R2, R3, and R4; its amount is proportional to biogas production if it is fully degraded in the absence of inhibition. It was then observed that both R3 and R4 were affected by the addition of propionate loading, as depicted in Figure 6, as experimental methane production was lower than theoretical production. Although R3 somewhat recovered from the addition of propionate, it did not maintain optimal activity during the second HRT. The decrease in methane production began on day 54, when accumulation of VFAs reached above 2500 mg·L−1—a concentration lower than the reported inhibitory threshold of 4000 mg·L−1 [27] during glucose degradation. Unlike R3, R4 failed to fully recover, resulting in a further decrease in methane production as the concentration of VFAs increased to above 4500 mg·L−1 during the second HRT (see Figure 5). This is higher than the reported threshold of 480–1080 mg·L−1 but lower than 5500 mg·L−1, as reported by [35]. By comparing theoretical methane production from the addition of propionate and experimental methane production, a significant decline of approximately 40% in methane production was observed in R4 (Figure 6). This was likely associated with the accumulation of VFAs, which reached approximately 4562 mg·L−1. This concentration slightly exceeds the VFA levels considered acceptable during glucose degradation and approaches inhibitory concentrations reported for sewage sludge digestion [26]. Similarly, Sun et al. reported a decline in methane production at VFA concentrations above 2000 mg·L−1 during the anaerobic digestion of food waste [23]. In the present study, the high level of VFA accumulation in R4 was induced by high propionate loading of 135.3 mmol·L−1 (13 g·L−1). In R3, with a propionate loading of 81 mmol·L−1 (7.78 g·L−1), the methane yield declined by 10%, as indicated by the difference between the experimental and predicted methane production. This 10% reduction in methane yield can be considered insignificant, as no decrease in daily biogas or methane production was observed by the end of the second HRT compared to R4. However, this finding is consistent with our previous batch experiment, in which moderate inhibition was observed upon the addition of sodium propionate at a concentration of 81 mmol L−1 to the reactors [39]. In the second HRT, the methane yield in R2, which had a propionate loading of 20.3 mmol·L−1 (1.95 g·L−1), showed a negligible difference between the predicted and experimental values. This decrease in methane production in R4 was in line with the VFA conversion rate, which significantly dropped from around 100% in the first HRT to approximately 42% by the end of the second HRT (Figure 7). This drop suggested that inhibition was caused by the concentration of sodium propionate loading at 13 g·L−1. This led to an increased accumulation of VFA values in R4 and a decrease in methane production. Notably, switching the reactors to batch mode after the second HRT (day 61) resulted in a peak in methane production in R4 on day 75, probably due to R4’s recovery from inhibition as propionate loading stopped.
CH3CH2COO− + H+ + 0.5 H2O → 1.75 CH4 + 1.25 CO2
Figure 6.
Average weekly experimental methane production rate versus theoretical methane production rate based on NaPr addition. Dashed black lines represent the different HRT and phases during the process. Gray and yellow arrows show the difference between the experimental methane production and the theoretical methane production of R3 and R4, respectively. R1—0 mmol·L−1 (0 g·L−1), R2—20.3 mmol·L−1 (1.95 g·L−1), R3—81 mmol·L−1 (7.78 g·L−1), and R4—135.3 mmol·L−1 (13 g·L−1).
Figure 7.
VFA degradation/conversion rate. Dashed black lines represent the different HRT and phases during the process. R1—0 mmol·L−1 (0 g·L−1), R2—20.3 mmol·L−1 (1.95 g·L−1), R3—81 mmol·L−1 (7.78 g·L−1), and R4—135.3 mmol·L−1 (13 g·L−1).
3.4. Incubation Time and NaPr Concentrations as Key Determinants of Reactor Microbial Community Structure
To determine the effect of NaPr addition on microbial community composition during the reactors’ operation, 16S rDNA metabarcoding was employed, with six samples sequenced per reactor throughout the incubation time.
The dominant phyla within the dataset were Bacillota (previously Firmicutes, 25.53% on average), with Syntrophomonadaceae as the most abundant family (4.81%); Bacteroidota (22.56%), primarily represented by the families Bacteroidetes vadinHA17 (5.75%) and Lentimicrobiaceae (5.15%); Proteobacteria (15.67%), represented by the family Comamonadaceae (3.76%); Chloroflexi (11.15%), dominated by the family Anaerolineaceae (9.75%); and Cloacimonadota (8.85%), represented by the family Cloacimonadaceae (8.85%).
Regarding archaea, two phyla were primarily represented: Halobacterota (2.79%), dominated by the genus Methanothrix (previously Methanosaeta, 2.03%), and Euryarchaeota (0.51%), with Methanobrevibacter (0.32%) as the main genus. The limited relative abundance of archaea compared to bacteria is standard in anaerobic digestion systems [57].
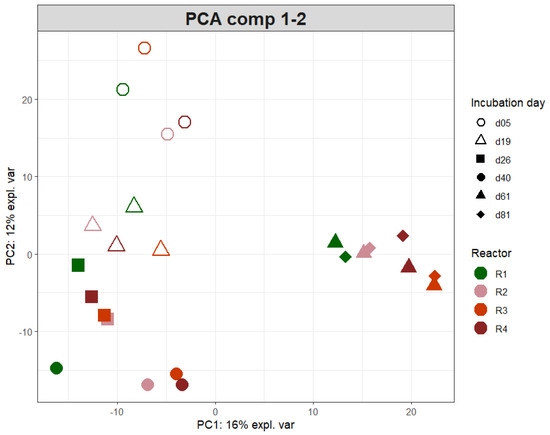
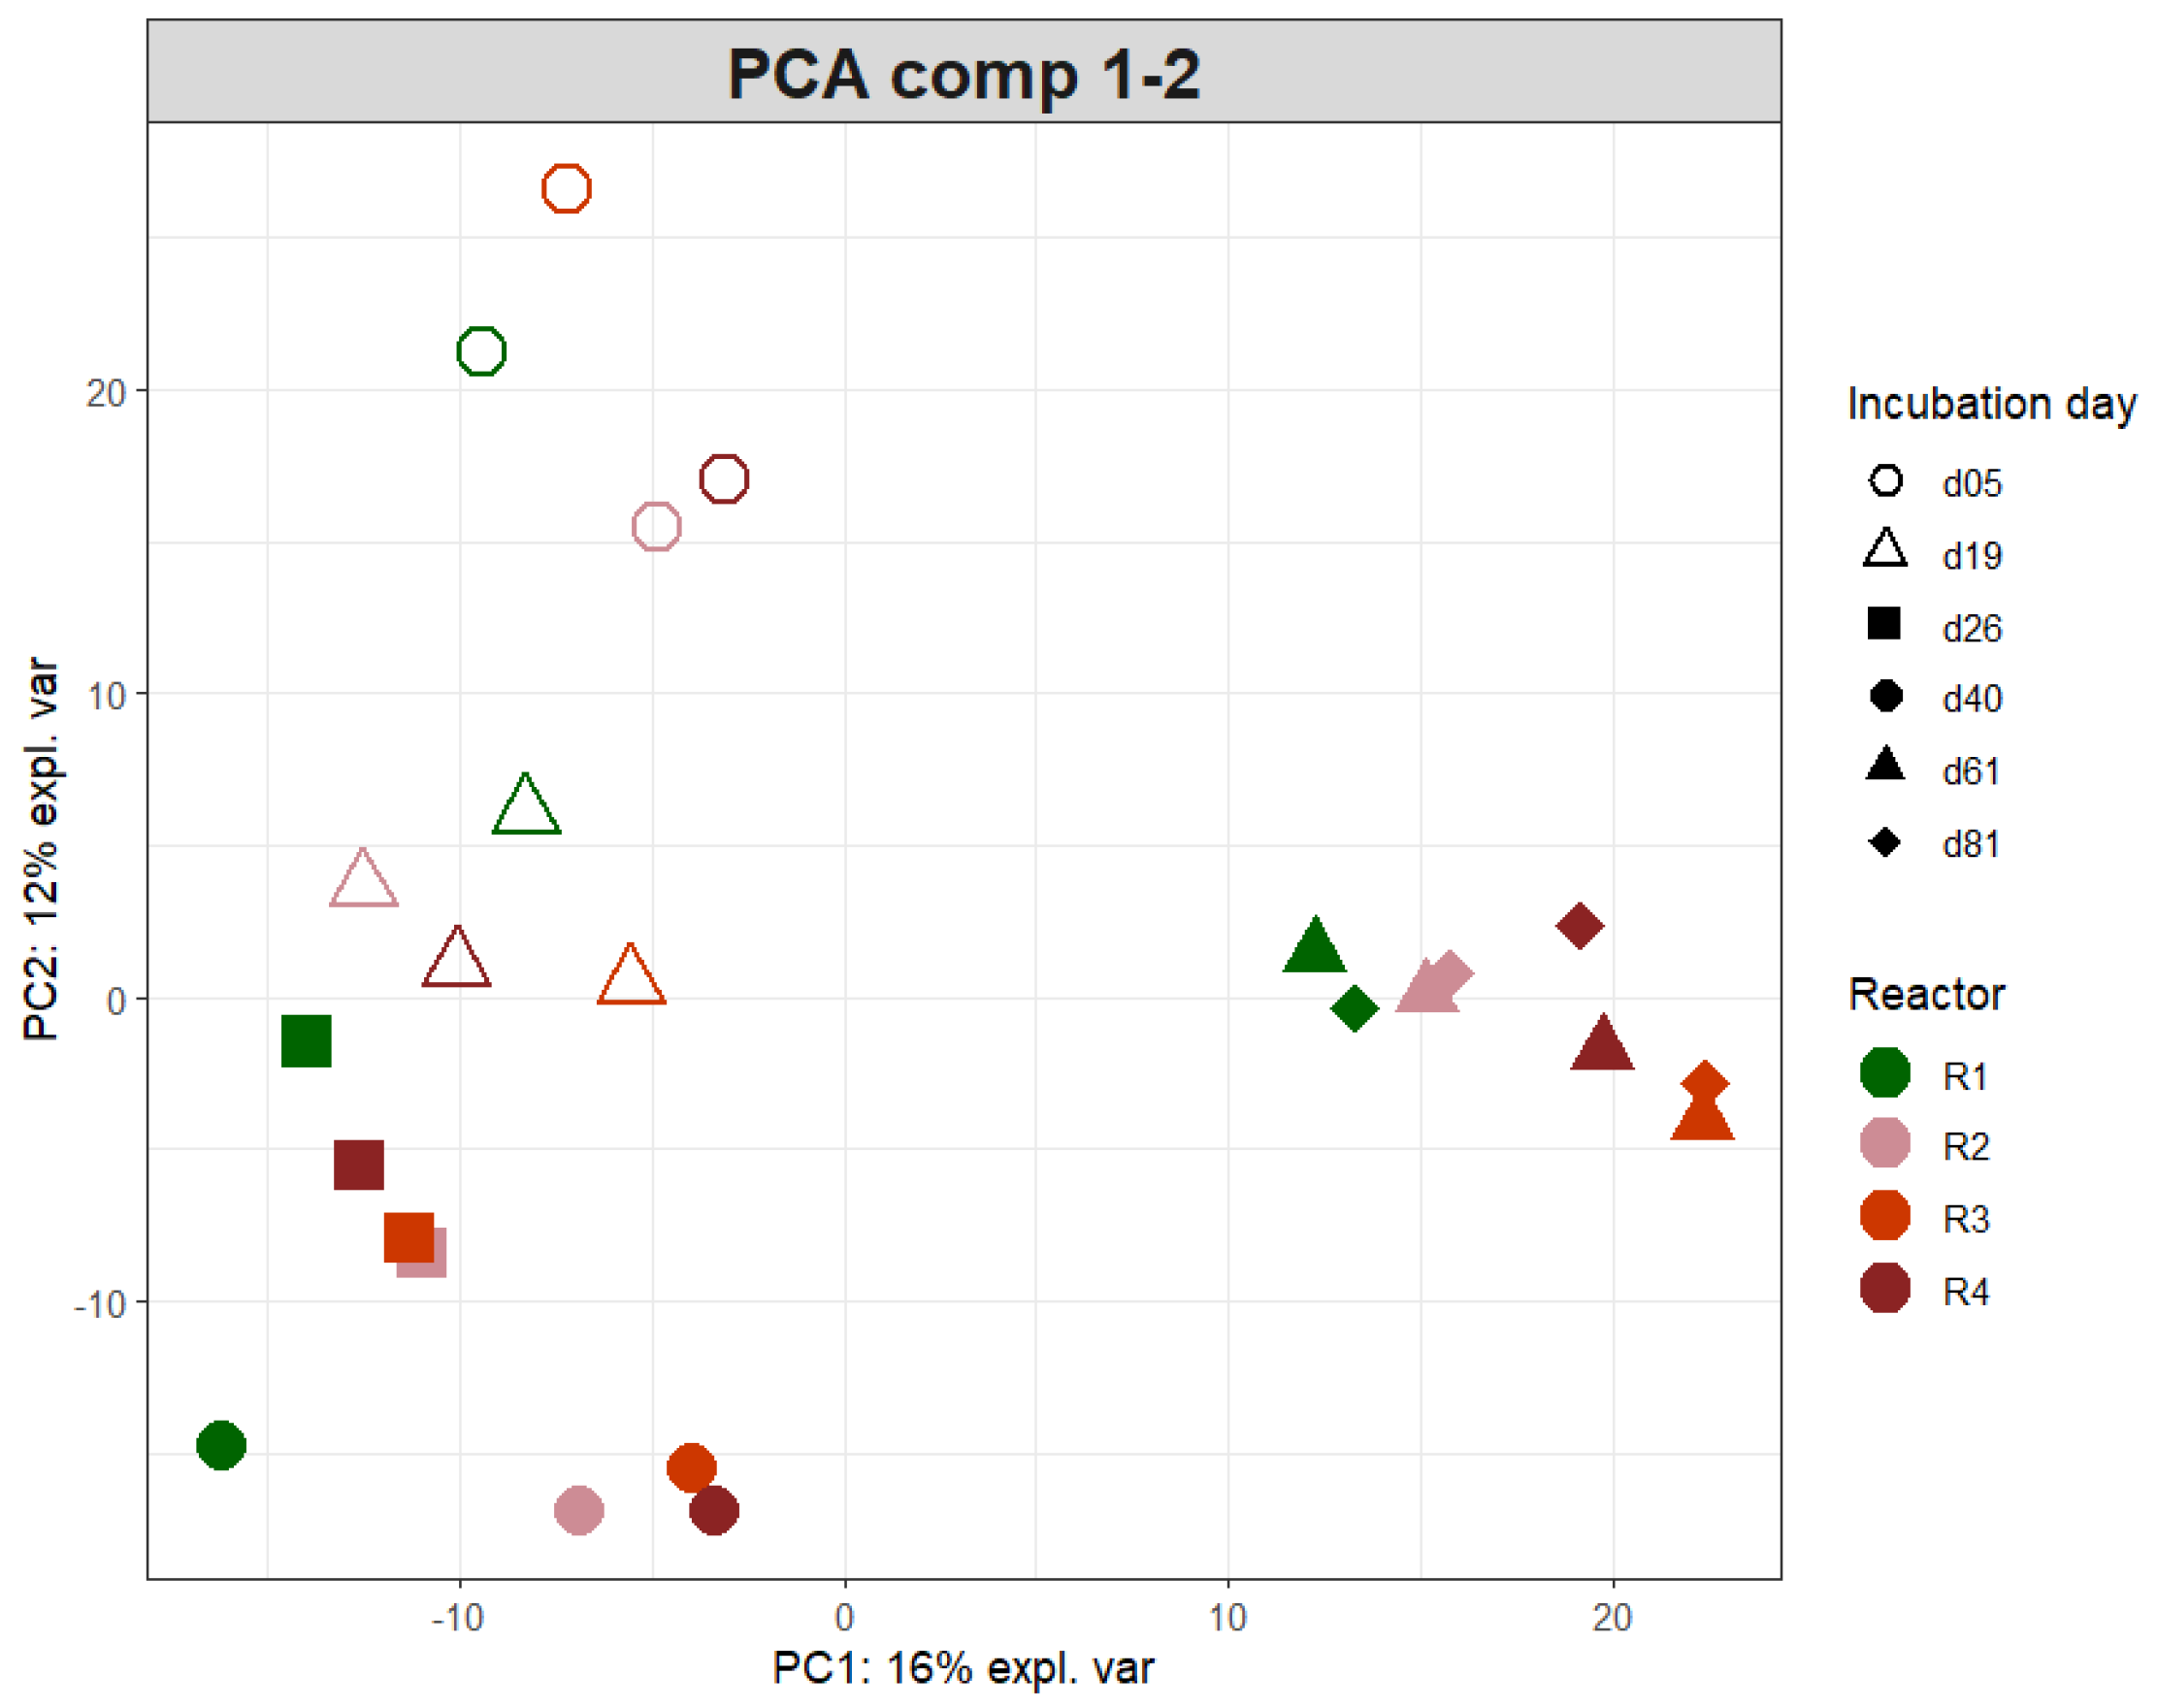
As expected, the composition of the inoculum (digested sludge) was qualitatively similar to that of the reactor samples. By contrast, the substrate (undigested sludge) exhibited significant differences, including a higher proportion of Proteobacteria, a lower proportion of Chloroflexi, and the absence or near-absence of Synergistota, Halobacterota, Spirochaetota, and Desulfobacterota (Supplementary Figure S2). Consistently, the substrate, derived from an aerobic process, contained very few methanogenic archaea (Supplementary Figure S3). Principal component analysis of reactor samples (Figure 8) revealed that time was the primary factor driving sample distribution, followed by the amount of NaPr added. The distinction between R1 (control, no NaPr addition) and the other three reactors was particularly pronounced on day 40, whereas by day 61, each reactor was clearly differentiated from the others. The contribution of these two factors was confirmed by PERMANOVA (9999 permutations): incubation time accounted for 48% of the variance (p = 0.00), and the NaPr concentration added explained 12% (p = 0.03).
Figure 8.
Principal component analysis of reactor samples (axes 1 and 2). Data were normalized using centered-log ratio transformation. R1—0 mmol·L−1 (0 g·L−1), R2—20.3 mmol·L−1 (1.95 g·L−1), R3—81 mmol·L−1 (7.78 g·L−1), and R4—135.3 mmol·L−1 (13 g·L−1).
The predominance of time over NaPr addition as a factor explaining the microbial community composition may be linked to the semi-continuous operating mode, which induces a regular input of microorganisms and their DNA through the feeding of undigested sludge, thereby leading to frequent reshaping of the communities.
3.5. NaPr Addition Causes a Decrease in the Relative Abundance of Methanogens
To focus more specifically on the effect of adding NaPr on the microbial community composition, we first examined methanogenic archaea, a key functional group known to be sensitive to inhibition [58] and particularly to NaPr [26].
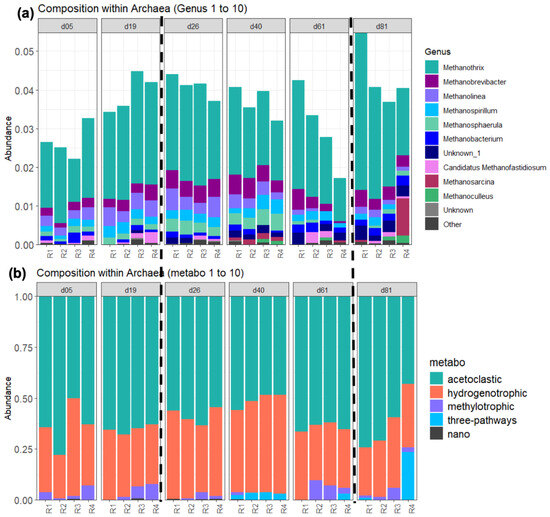
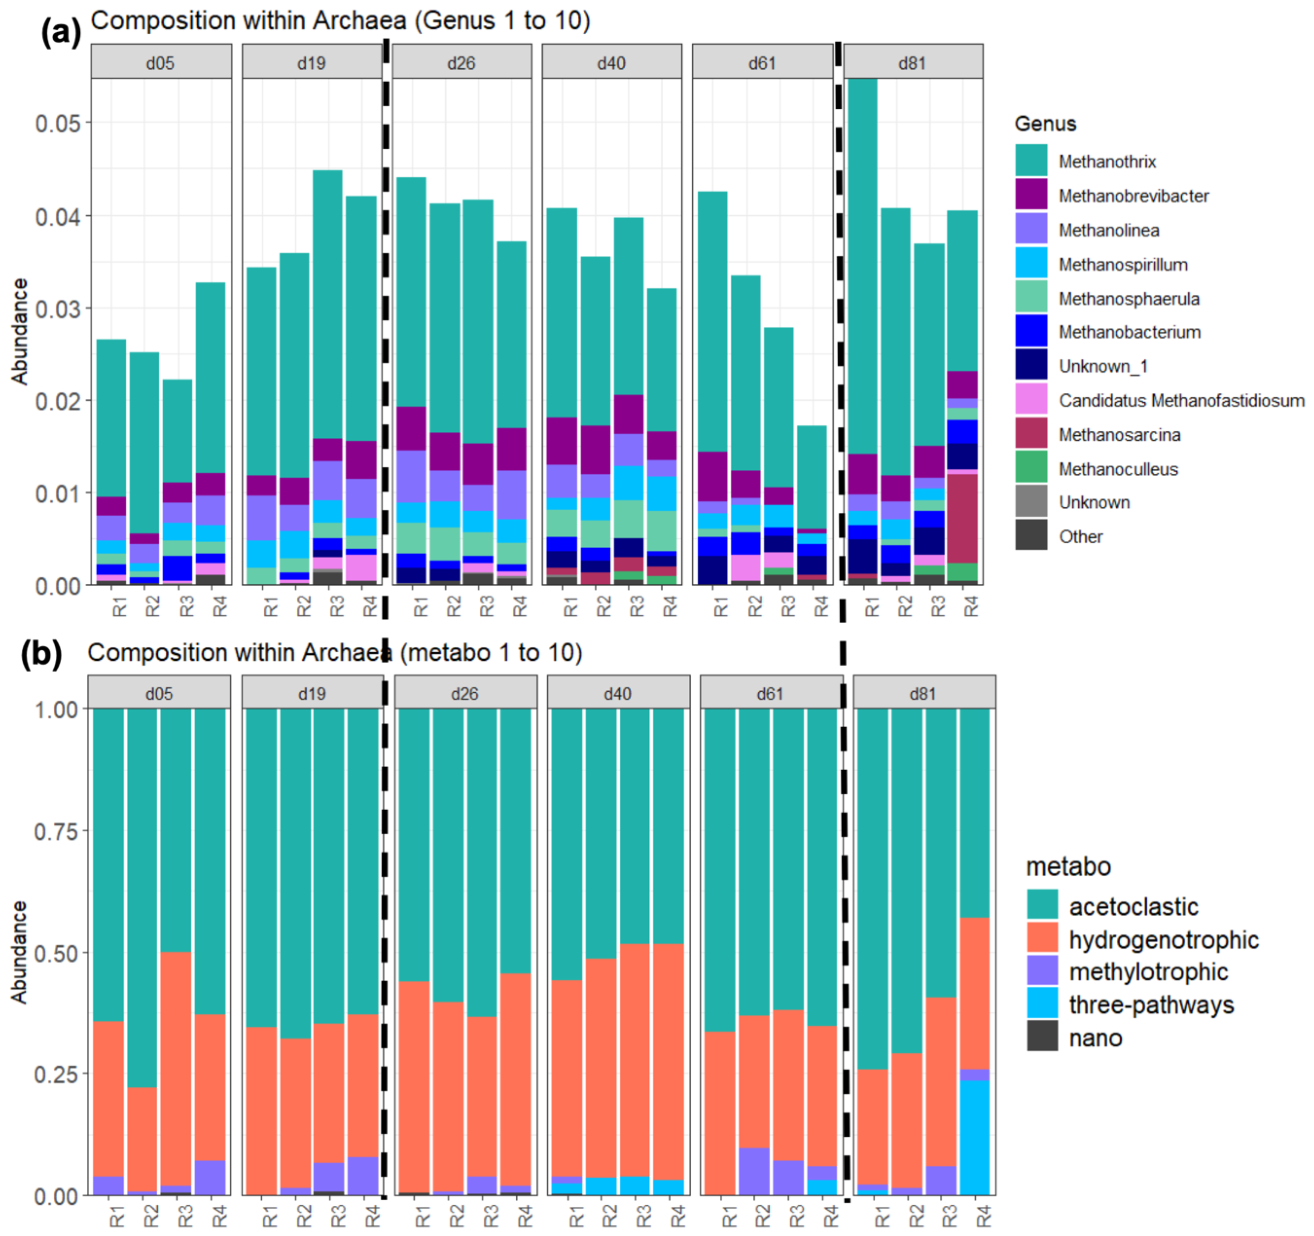
In R1, the abundance of archaea increased over time (Figure 9a). In contrast, from the day that NaPr was introduced in the other reactors, the relative abundance of methanogenic archaea overall stagnated or decreased. These effects intensified over time and were more pronounced at higher NaPr concentrations (Figure 9a, e.g., day 61). Such an effect was particularly evident in the two most abundant archaeal genera, Methanothrix and Methanobrevibacter, and was consistent with the gradual impairment of methane production observed in R2 to R4. This decrease in the relative abundance of methanogenic archaea is consistent with our previous batch study, in which a comparable reduction was observed at similar NaPr concentrations [39]. By day 81, following the reactor recovery phase (batch mode), a restoration of methanogenic archaeal abundance was observed, along with a significant increase in Methanosarcina in reactor R4. Notably, Methanosarcina potentially contributed to the recovery of this reactor’s microbial community, as it is known as a robust methanogen [59]. Despite recovery, the substantial reduction in archaeal abundance during this semi-continuous feeding phase suggests that high propionate concentrations can impose significant physiological stress on the methanogenic community, potentially disrupting key metabolic pathways essential for methane production [26].
Figure 9.
Compositional analysis of archaea. (a) Relative abundance of archaeal genera as a proportion of the total prokaryotic community. (b) Distribution of methanogenic metabolic pathways over time. Acetoclastic corresponds to Methanothrix, methylotrophic to Candidatus Methanofastidiosum, three-pathways to Methanosrcina, nano to the phylum Nanoarchaeota, and all other methanogenic archaea exhibit hydrogenotrophic metabolism. Dashed lines indicate operational changes during the sampling period: the start-up/acclimatization period (days 5 and 19) to NaPr addition (days 26, 41, and 61), and the halting of feeding and heating (between days 61 and 81). R1—0 mmol·L−1 (0 g·L−1), R2—20.3 mmol·L−1 (1.95 g·L−1), R3—81 mmol·L−1 (7.78 g·L−1), and R4—135.3 mmol·L−1 (13 g·L−1).
In terms of metabolism, the effect of NaPr did not seem pronounced (Figure 9b); rather than a lack of selection for a specific metabolic pathway during incubation at 35 °C, general impairment of methanogenic archaea is suggested. Based on 16S rDNA gene sequencing data, the acetoclastic methanogenesis pathway, encoded by Methanothrix, was dominant throughout the incubation period. The hydrogenotrophic methanogenesis pathway was the second most abundant, originating from Methanobrevibacter [60] and various other methanogens [61]. However, these observations are based on DNA sequencing, which does not directly reflect activity and should therefore be interpreted with caution.
3.6. NaPr Addition Reshaped Syntrophic Propionate-Oxidizing Bacteria (SPOB) Populations
The subsequent analysis focused on syntrophic propionate-oxidizing bacteria (SPOB), which are key groups during anaerobic digestion [33]. Moreover, in this case, the presence of NaPr is expected to promote the growth of SPOB, since propionate serves as their growth substrate; however, excessively high concentrations of this compound can also exert inhibitory effects [33]. So far, the SPOB isolated or co-cultivated have belonged to specific species within six distinct genera: Smithella, Desulfofundulus, Pelotomaculum, Syntrophobacter, Syntrophobacterium, and Desulfotomaculum [33,62]. Based on meta-omic analyses, several additional candidates have been proposed: Candidatus Propionivorax syntrophicum, Candidatus Syntrophopropionicum ammoniitolerans, Candidatus Cloacimonas, Cryptanaerobacter, Variovorax, and Candidatus Caldatribacterium [32], as well as Candidatus Desulfonatronobulbus [62], DMER64 [63,64], W5 [65], Candidatus Syntrophosphaera [66], Bacteroides, UBA932 [64], Candidatus Brevefilum [67], and members of the family Prolixibacteraceae [64]. During anaerobic digestion, SPOB establish essential syntrophic interactions, particularly with hydrogenotrophic and acetoclastic methanogenic archaea [33]. Despite their key role in anaerobic digestion, SPOB are typically low in abundance, accounting for approximately <2% of microbial communities [68].
In the present study, the following groups were detected in reactor samples: Candidatus Caldatribacterium, Pelotomaculum, Smithella, Syntrophobacter, Candidatus Cloacimonas, Cryptoanaerobacter, DMER64, Bacteroides, and Prolixibacteraceae. This suggested a potentially high diversity of SPOB. Their mean relative abundance across reactor samples was 0.52%, which is consistent with the low levels typically reported for syntrophs [68].
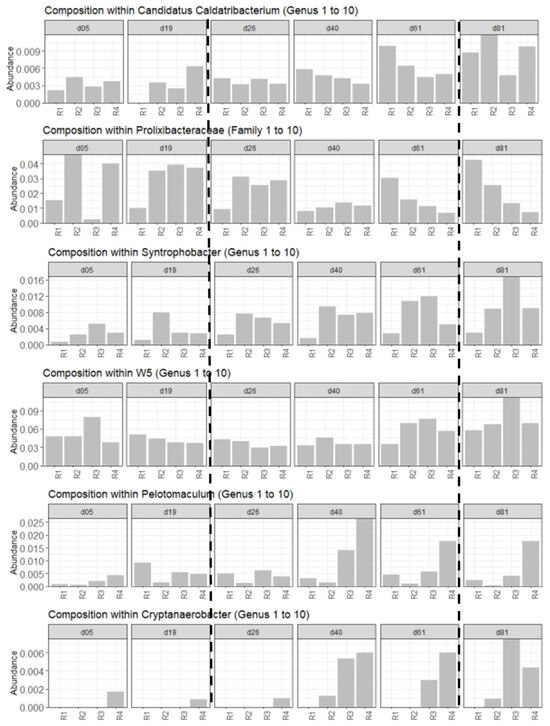
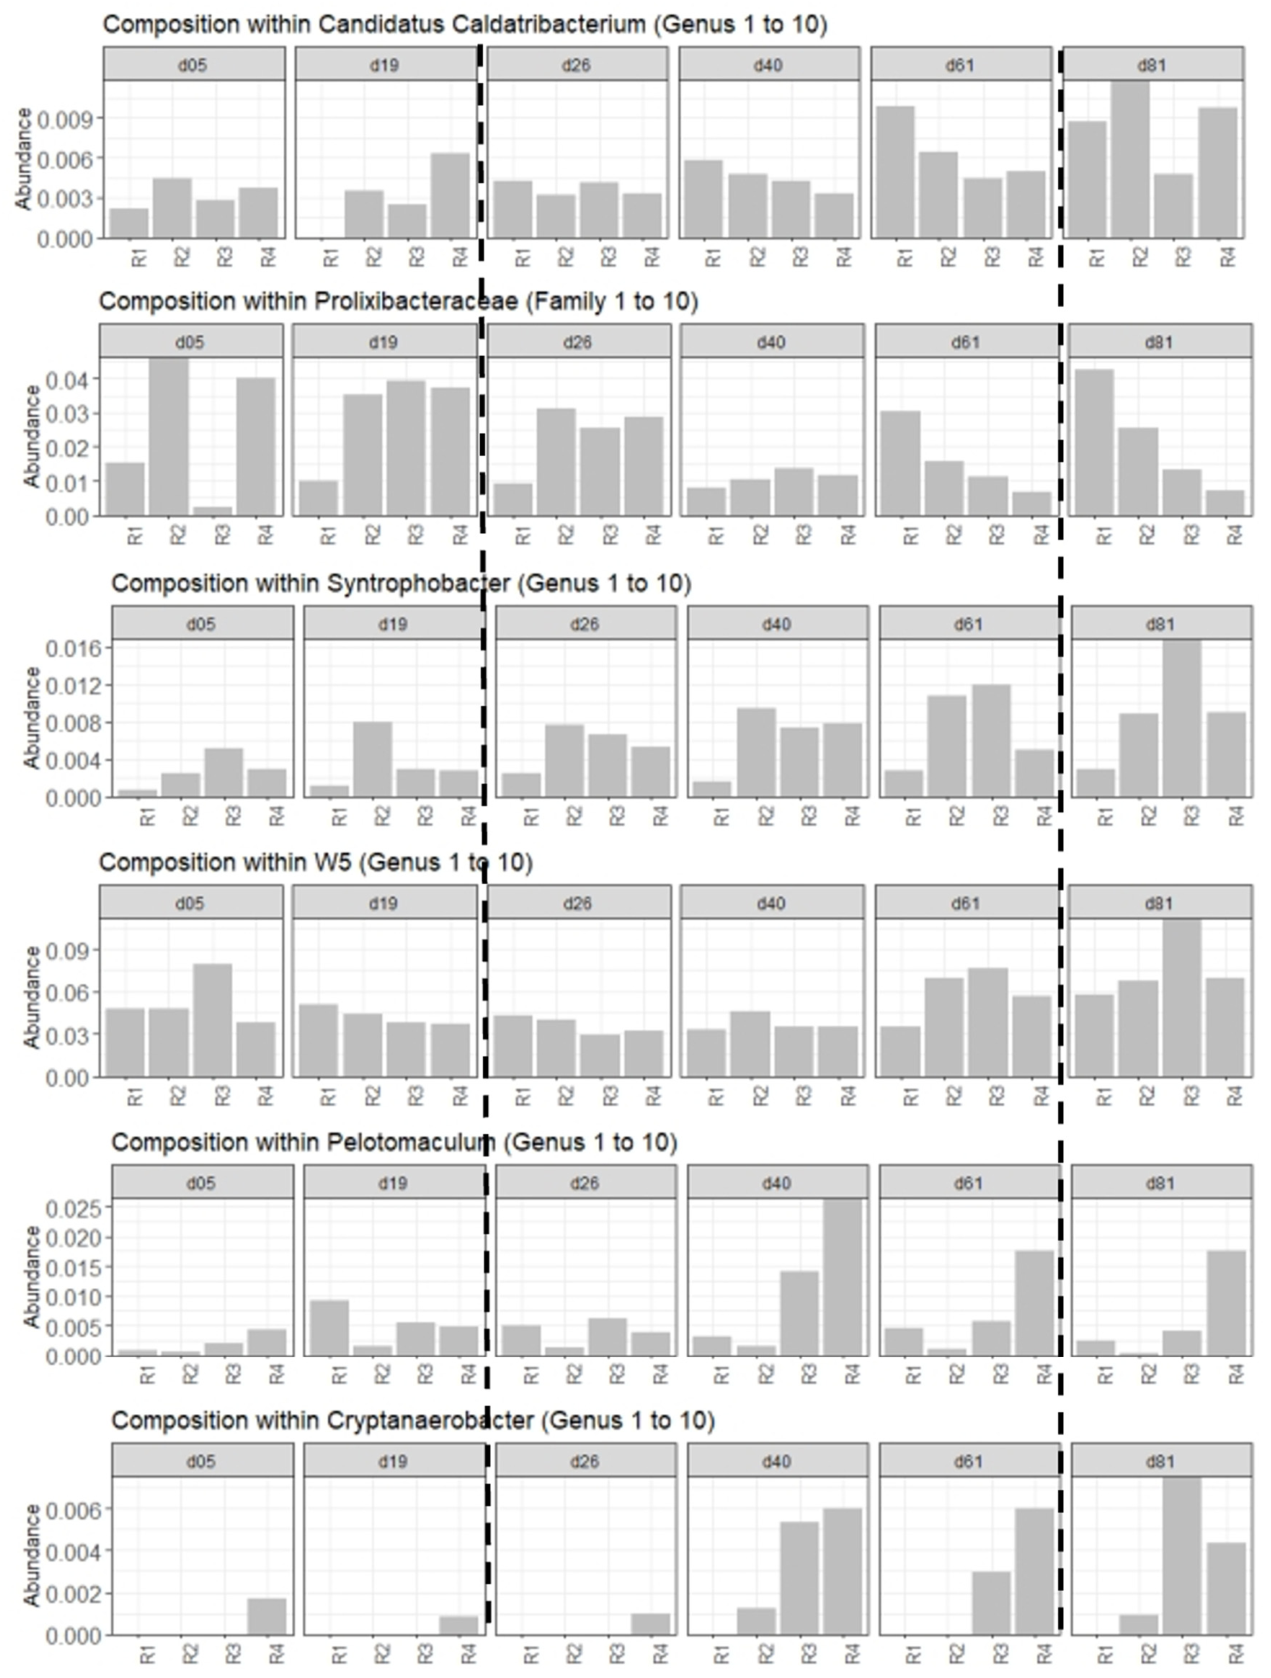
Some of these groups appeared to persist over time or be selectively enriched, but without exhibiting clear or consistent patterns in response to NaPr addition—specifically DMER64, Smithella, Candidatus Cloacimonas, and Bacteroides (Supplementary Figure S3). In contrast, Candidatus Caldatribacterium and Prolixibacteraceae thrived at low NaPr concentrations (in R1 and R2), while Syntrophobacter and W5 were favored at intermediate NaPr concentrations (in R2 and R3). Finally, Pelotomaculum and Cryptoanaerobacter were selected at high NaPr concentrations in R3 and R4 (Figure 10). These trends generally became apparent from day 40 of incubation onward, highlighting the adaptation of SPOB composition to NaPr addition.
Figure 10.
Relative abundance of SPOB-associated genera affected by NaPr addition. Dashed lines indicate operational changes during the sampling period: the start-up/acclimatization period (days 5 and 19) to NaPr addition (days 26, 41, and 61), and the halting of feeding and heating (between days 61 and 81). R1—0 mmol·L−1 (0 g·L−1), R2—20.3 mmol·L−1 (1.95 g·L−1), R3—81 mmol·L−1 (7.78 g·L−1), and R4—135.3 mmol·L−1 (13 g·L−1).
Unlike the observations for archaea, no significant increase in abundance was detected on day 81, at the end of the recovery phase, suggesting the persistence of inhibition, potentially due to the lower temperature or competition with other propionate consumers.
3.7. Other Types of Syntrophs and Fermenters Are Also Affected by NaPr
To complement the above analysis and identify microbial groups affected by NaPr without previous considerations of their biological function and dynamics, the temporal evolution of each ASV in each reactor was modeled using Linear Mixed-Effect Model Splines (LMMs). For each reactor, the resulting curves were clustered to group ASVs with similar dynamics within a given reactor. An example of the obtained results is provided for reactor R1 (Supplementary Figure S4).
Through manual analysis of these results, combined with abundance data, microbial groups with dynamics that varied depending on the amount of NaPr added were identified. Notably, this approach highlighted some of the methanogenic archaea and potential SPOB discussed above: Methanothrix (Figure 9a), the family Prolixibacteraceae, Syntrophobacter, Cryptanerobacter, and Pelotomaculum (Figure 10).
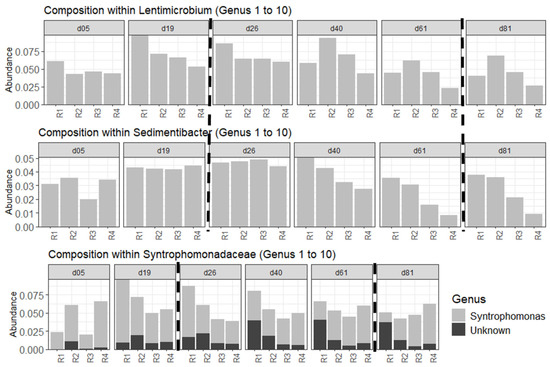
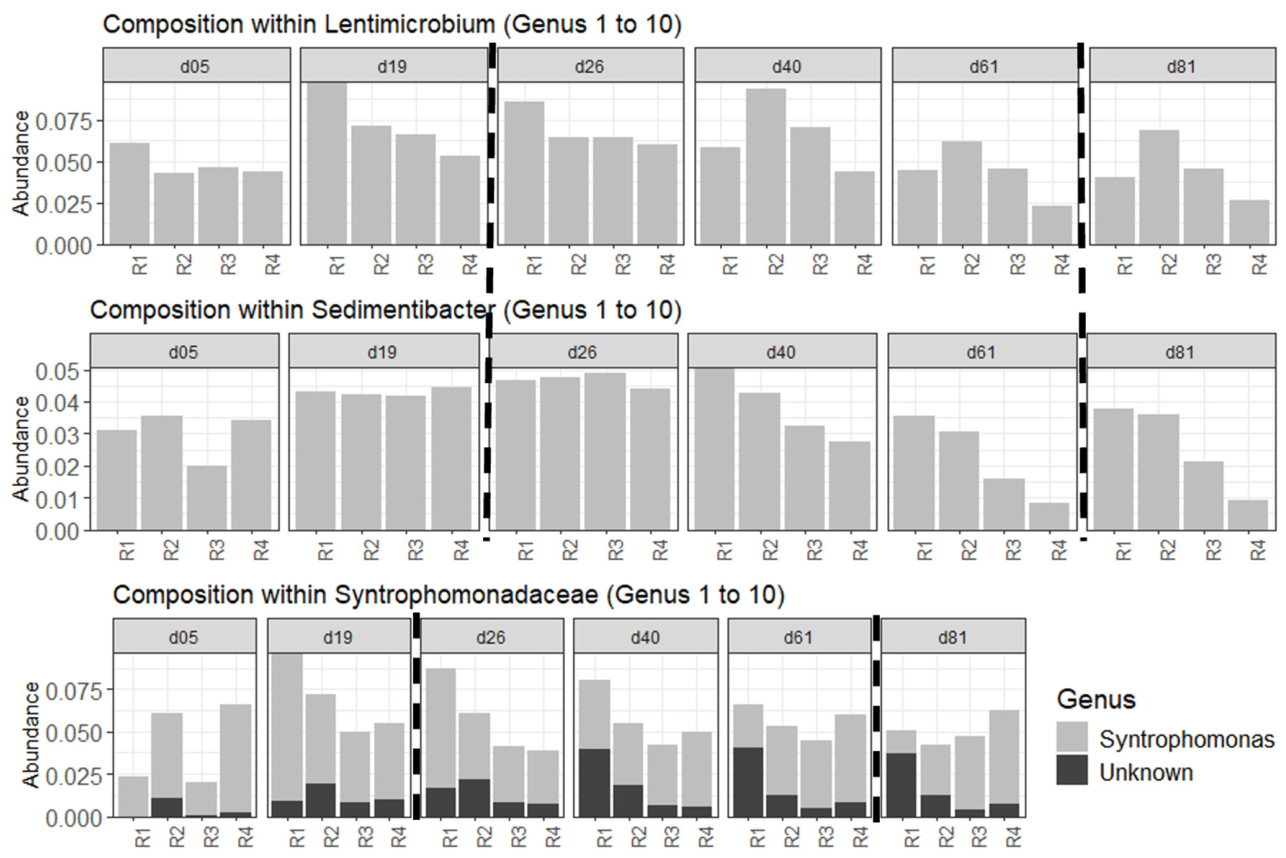
Additionally, two genera of fermentative bacteria were identified. Lentimicrobium (Bacteroidota phylum, 5.74% average abundance in reactors) appeared to be globally favored at intermediate NaPr concentrations (R2 and R3), while Sedimentibacter (Bacillota phylum, 3.45%) was increasingly disadvantaged as NaPr addition increased (Figure 11). According to the MIDAS database [69], Lentimicrobium members are slow-growing, strictly anaerobic, carbohydrate-fermenting bacteria; Sedimentibacter comprises anaerobic fermentative bacteria that primarily utilize amino acids or pyruvate for growth, but not carbohydrates.
Figure 11.
Relative abundance of diverse microbial groups affected by NaPr addition. Dashed lines indicate operational changes during the sampling period: the start-up/acclimatization period (days 5 and 19) to NaPr addition (days 26, 41, and 61), and the halting of feeding and heating (between days 61 and 81). R1—0 mmol·L−1 (0 g·L−1), R2—20.3 mmol·L−1 (1.95 g·L−1), R3—81 mmol·L−1 (7.78 g·L−1), and R4—135.3 mmol·L−1 (13 g·L−1).
Overall, the microbial groups affected by the addition of NaPr had limited abundances within the community, yet they included diverse and key functional groups (fermenters, SPOB, and methanogens). Thus, various stages of anaerobic digestion, with the exception of hydrolysis, were covered. Changes in microbial composition were detected in R2, which had the lowest addition of NaPr, although at more moderate levels than in R3 and R4, highlighting the sensitivity of microbial communities to this compound. It can be hypothesized that microbial community adaptation mitigated the decline in performance—specifically in methane production—but did not fully sustain it.
Notably, compositional shifts within syntrophic propionate-oxidizing bacteria (SPOB) were observed in response to the addition of NaPr. Notably, the selection of Pelotomaculum at high NaPr concentrations was reported in a previous similar study under batch conditions [39]. Regarding methanogenic archaea, a general decrease without a major shift was observed; this was surprising as several studies report the selection of Methanosarcina under extreme conditions [39,58,59].
4. Summary and Implications
This study highlights the complex interaction between propionate concentration, biogas production, VFA accumulation, microbial community dynamics, and system stability during the anaerobic digestion of municipal sewage sludge. The operation of four 5 L continuous reactors supplemented with different sodium propionate (NaPr) concentrations (0, 20.3, 81, and 135.3 mmol·L−1, equivalent to 0, 1.95, 7.78, and 13 g HPr·L−1) demonstrated that moderate propionate supplementation had limited effects on methane production. By contrast, excessive propionate loading inhibited the process through the accumulation of VFAs and disruption of the microbial community. In particular, the addition of propionate up to 81 mmol·L−1 resulted in only a slight reduction in methane yield; the highest loading (135.3 mmol·L−1) caused VFA accumulation exceeding 4500 mg·L−1 and a significant decline in methane production. These findings are consistent with previous reports describing VFA-associated inhibition in anaerobic digestion systems [23,27]. As such, the variations in inhibitory levels that exist across studies are based on the substrates and operating conditions used, as illustrated in Table 3.
Table 3.
Comparison of reported VFA and propionate inhibitory levels during anaerobic digestion under different substrate and operating conditions.
In this study, microbial community analysis confirmed that both incubation time and NaPr concentration influenced the reactor microbiota, with incubation time explaining most of the observed variation. The bacterial community was mainly dominated by Bacillota, Bacteroidota, Proteobacteria, Chloroflexi, and Cloacimonadota, while methanogenic archaea were represented primarily by Methanothrix and Methanobrevibacter, which are commonly reported in anaerobic digestion systems [57]. Increasing NaPr concentrations led to a decline in methanogenic archaea in reactors R2–R4, particularly Methanothrix and Methanobrevibacter, coinciding with reduced methane production. The partial recovery of these methanogens following the cessation of NaPr loading nevertheless suggests a degree of resilience and adaptability of the methanogenic community under stress conditions [26,58]. In addition, the proliferation of Methanosarcina in reactor R4 indicates a restructuring of the methanogenic community toward more stress-tolerant populations capable of maintaining methanogenesis under unstable conditions [71].
Syntrophic propionate-oxidizing bacteria (SPOB) also exhibited compositional shifts depending on NaPr concentration, although their relative abundances remained low (<1%). Different genera dominated under specific conditions, with Pelotomaculum and Cryptoanaerobacter becoming more prominent under high NaPr stress. The enrichment of Pelotomaculum under elevated propionate conditions aligns with previous studies describing its role in syntrophic propionate degradation [26,33]. However, unlike methanogens, SPOB showed limited recovery during the batch phase, suggesting prolonged inhibition or reduced competitiveness under substrate-limited conditions.
Other microbial groups also responded to propionate loading. Lentimicrobium increased under moderate NaPr concentrations, whereas Sedimentibacter declined at higher concentrations, reflecting shifts in fermentation pathways and substrate utilization patterns. These microbial changes were associated with differences in VFA degradation efficiency, where reactors operating under low or moderate propionate loading maintained stable VFA conversion. Reactor R4 exhibited substantial VFA accumulation and microbial inhibition. This overall microbial restructuring suggests that the anaerobic digestion system exerts an adaptive response, attempting to restore syntrophic balance under propionate stress.
Despite elevated VFA concentrations, pH remained within the optimal methanogenic range due to the buffering capacity provided by sodium propionate and system alkalinity [24,55]. Nevertheless, prolonged inhibition progressively affected the stability of alkalinity and efficiency of propionate degradation under the highest loading conditions. These findings highlight the importance of controlling propionate accumulation to maintain stable anaerobic digestion performance. Monitoring VFA accumulation with shifts in the microbial community could provide useful early indicators of process imbalance and reactor instability in sewage sludge digesters. In particular, the observed selection of specific methanogenic and syntrophic populations under stress conditions may contribute to the identification of microbial biomarkers associated with inhibition and recovery.
Microbial community analysis in this study was based on 16S rDNA metabarcoding, which provides information on microbial composition but does not directly reflect microbial metabolic activity or functional pathways.
5. Conclusions
This study demonstrated that sodium propionate (NaPr) exerts concentration-dependent effects on anaerobic digestion performance and microbial community dynamics during the mesophilic semi-continuous digestion of municipal sewage sludge. Moderate loading of propionate up to 81 mmol NaPr·L−1 (7.78 g·L−1) resulted in only a moderate reduction in methane production without significant VFA accumulation. By contrast, high loading of propionate at 135.3 mmol NaPr·L−1 (13 g·L−1) caused severe inhibition, leading to an approximately 40% reduction in methane production and accumulation of VFAs exceeding approximately 4500 mg·L−1. These inhibitory conditions were accompanied by major microbial community restructuring, including a decline in methanogenic archaea such as Methanothrix and Methanobrevibacter and the enrichment of syntrophic propionate-oxidizing bacteria, particularly Pelotomaculum and Cryptoanaerobacter, under elevated propionate stress.
Compared with our previous batch study conducted under similar conditions, the present work was performed using larger 5 L semi-continuous reactors, which operate under conditions more representative of full-scale anaerobic digesters. This experimental configuration enabled a more comprehensive evaluation of process stability over time and strengthened the validation of the concentration-dependent effects of propionate on both anaerobic digestion performance and microbial community adaptation. In addition, the observed proliferation of Methanosarcina during the recovery phase suggests that this genus may play an important role in maintaining methanogenic resilience under stressed anaerobic digestion conditions.
Overall, this study contributes to the understanding of propionate inhibition during the anaerobic digestion of municipal sewage sludge by linking reactor performance, VFA accumulation, and microbial community dynamics under semi-continuous operation. The findings further highlight the importance of controlling propionate accumulation to maintain stable methanogenesis and suggest that specific microbial populations may serve as potential indicators of process imbalance and recovery.
Future studies should investigate VFA inhibition under various substrates and operational conditions to improve understanding of microbial adaptation and process stability in anaerobic digestion systems. Furthermore, integrating functional microbial analyses with detailed VFA characterization could provide a deeper insight into the mechanisms governing propionate inhibition and microbial resilience under stressed conditions.
Supplementary Materials
The following supporting information can be downloaded at: https://www.mdpi.com/article/10.3390/cleantechnol8030089/s1, Figure S1: Microbial community composition of the samples based on the bacterial phyla; Figure S2: Microbial community composition of the samples based on the archaeal phyla; Figure S3: Relative abundance of genera likely to contain SPOB, and which did not show a clear pattern with respect to NaPr addition. Dashed lines indicate operational changes during the sampling period: the start-up/acclimatization period (days 5 and 19) to NaPr addition (days 26, 41, and 61), and the halting of feeding and heating (between days 61 and 81); Figure S4. Spline regression clusters obtained for reactor R1. We can see that cluster 5 groups together ASVs showing strong growth, while cluster 3 groups together ASVs showing a slight decline. Excel file. Original data file.
Author Contributions
J.A.A.: Investigation, Formal analysis, Roles/Writing—original draft. X.L.: Conceptualization, Validation, Writing—review & editing, Supervision, Project administration, Funding acquisition. L.A.: Conceptualization, Validation, Writing—review & editing, Supervision, Project administration. C.A.: Investigation, Formal analysis. S.T.: Conceptualization, Project administration. C.B.: Conceptualization, Project administration. S.G.: Conceptualization, Project administration. V.R.: Conceptualization, Project administration. C.L.: Conceptualization, project administration. O.C. Investigation, Formal analysis, Writing—review & editing, Project administration. A.B.: Investigation, Formal analysis, Writing—review & editing, Project administration, Funding acquisition. C.R.-A.: Investigation, Formal analysis, Writing—review & editing, Project administration, Funding acquisition. A.P.: Conceptualization, Validation, Writing—review & editing, Supervision, Project administration, Funding acquisition. T.R.: Conceptualization, Validation, Writing—review & editing, Supervision, Project administration, Funding acquisition. All authors have read and agreed to the published version of the manuscript.
Funding
This study was funded by the French research program MOCOPEE (https://inneauvation.fr, accessed on 3 June 2026). The PhD project of Joel Awinzure Agumah was jointly financed by the Ministry of Higher Education and Research (MESR, France), John Cockerill (France) and Sources (France) within the framework of “Cométha” (https://www.cometha.fr/en/, accessed on 3 June 2026), an innovative partnership funded by SIAAP and SYCTOM.
Data Availability Statement
The original raw data of anaerobic digestion presented in this study are included in the Supplementary Materials. The raw sequencing files are also available in the ENA repository in the project PRJEB96189 under accessions ERR15469053-ERR15469106. Further inquiries can be directed to the corresponding authors.
Conflicts of Interest
The authors declare no known conflicts of interest.
References
- Mateo-Sagasta, J.; Raschid-Sally, L.; Thebo, A. Global Wastewater and Sludge Production, Treatment and Use. In Wastewater; Drechsel, P., Qadir, M., Wichelns, D., Eds.; Springer: Dordrecht, The Netherlands, 2015; pp. 15–38. ISBN 978-94-017-9544-9. [Google Scholar]
- Gadaleta, G.; Todaro, F.; Giuliano, A.; De Gisi, S.; Notarnicola, M. Co-Treatment of Food Waste and Municipal Sewage Sludge: Technical and Environmental Review of Biological and Thermal Technologies. Clean Technol. 2024, 6, 852–885. [Google Scholar] [CrossRef] [Scilit]
- Liang, T.; Elmaadawy, K.; Liu, B.; Hu, J.; Hou, H.; Yang, J. Anaerobic Fermentation of Waste Activated Sludge for Volatile Fatty Acid Production: Recent Updates of Pretreatment Methods and the Potential Effect of Humic and Nutrients Substances. Process Saf. Environ. Prot. 2021, 145, 321–339. [Google Scholar] [CrossRef] [Scilit]
- Wei, L.; Xia, X.; Zhu, F.; Li, Q.; Xue, M.; Li, J.; Sun, B.; Jiang, J.; Zhao, Q. Dewatering Efficiency of Sewage Sludge during Fe2+-Activated Persulfate Oxidation: Effect of Hydrophobic/Hydrophilic Properties of Sludge EPS. Water Res. 2020, 181, 115903. [Google Scholar] [CrossRef] [Scilit]
- Al-Sulaimi, I.N.; Nayak, J.K.; Alhimali, H.; Sana, A.; Al-Mamun, A. Effect of Volatile Fatty Acids Accumulation on Biogas Production by Sludge-Feeding Thermophilic Anaerobic Digester and Predicting Process Parameters. Fermentation 2022, 8, 184. [Google Scholar] [CrossRef] [Scilit]
- He, B. An Overview on Resource Utilization of Sewage Sludge. In Proceedings of the 2017 International Conference on Advanced Materials Science and Civil Engineering (AMSCE 2017); Atlantis Press: Phuket, Thailand, 2017. [Google Scholar]
- Ak, M.S.; Muz, M.; Komesli, O.T.; Gökçay, C.F. Enhancement of Bio-Gas Production and Xenobiotics Degradation during Anaerobic Sludge Digestion by Ozone Treated Feed Sludge. Chem. Eng. J. 2013, 230, 499–505. [Google Scholar] [CrossRef] [Scilit]
- López, A.; Rodríguez-Chueca, J.; Mosteo, R.; Gómez, J.; Ormad, M.P. Microbiological Quality of Sewage Sludge after Digestion Treatment: A Pilot Scale Case of Study. J. Clean. Prod. 2020, 254, 120101. [Google Scholar] [CrossRef] [Scilit]
- Song, C.; Li, R.; Zhao, Y.; Li, R.; Ma, D.; Kansha, Y. Assessment of four sewage sludge treatment routes with efficient biogas utilization and heat integration. Process Saf. Environ. Prot. 2019, 126, 205–213. [Google Scholar] [CrossRef] [Scilit]
- Gebreeyessus, G.D.; Jenicek, P. Thermophilic versus Mesophilic Anaerobic Digestion of Sewage Sludge: A Comparative Review. Bioengineering 2016, 3, 15. [Google Scholar] [CrossRef] [Scilit]
- Baldi, F.; Pecorini, I.; Iannelli, R. Comparison of Single-Stage and Two-Stage Anaerobic Co-Digestion of Food Waste and Activated Sludge for Hydrogen and Methane Production. Renew. Energy 2019, 143, 1755–1765. [Google Scholar] [CrossRef] [Scilit]
- Maragkaki, A.E.; Fountoulakis, M.; Kyriakou, A.; Lasaridi, K.; Manios, T. Boosting Biogas Production from Sewage Sludge by Adding Small Amount of Agro-Industrial by-Products and Food Waste Residues. Waste Manag. 2018, 71, 605–611. [Google Scholar] [CrossRef] [Scilit] [PubMed]
- Piadeh, F.; Offie, I.; Behzadian, K.; Rizzuto, J.P.; Bywater, A.; Córdoba-Pachón, J.-R.; Walker, M. A Critical Review for the Impact of Anaerobic Digestion on the Sustainable Development Goals. J. Environ. Manag. 2024, 349, 119458. [Google Scholar] [CrossRef] [Scilit] [PubMed]
- Arimi, M.M.; Knodel, J.; Kiprop, A.; Namango, S.S.; Zhang, Y.; Geißen, S.-U. Strategies for Improvement of Biohydrogen Production from Organic-Rich Wastewater: A Review. Biomass Bioenergy 2015, 75, 101–118. [Google Scholar] [CrossRef] [Scilit]
- Gautam, R.; Nayak, J.K.; Daverey, A.; Ghosh, U.K. Emerging Sustainable Opportunities for Waste to Bioenergy: An Overview. In Waste-to-Energy Approaches Towards Zero Waste; Elsevier: Amsterdam, The Netherlands, 2022; pp. 1–55. ISBN 978-0-323-85387-3. [Google Scholar]
- Akuzawa, M.; Hori, T.; Haruta, S.; Ueno, Y.; Ishii, M.; Igarashi, Y. Distinctive Responses of Metabolically Active Microbiota to Acidification in a Thermophilic Anaerobic Digester. Microb. Ecol. 2011, 61, 595–605. [Google Scholar] [CrossRef] [Scilit] [PubMed]
- Wang, M.; Lyu, H.; Zhao, W.; Wang, H.; Li, F.; Chen, J.; Yang, C.; Yao, Y. Methanogenesis Recovery Mechanism Under Extreme Acidic Stress in Failed Solid-State Anaerobic Digestion System of Maize Straw. BioEnergy Res. 2025, 18, 60. [Google Scholar] [CrossRef] [Scilit]
- Yang, S.; Wu, N.; Pullammanappallil, P. Comparative Evaluation of Mesophilic and Thermophilic Anaerobic Digestion for Microbrewery Waste Streams: Process Integration, Internal Neutralization, and CO2 Scrubbing. Clean Technol. 2026, 8, 47. [Google Scholar] [CrossRef] [Scilit]
- Ohnmacht, B.; Lemmer, A.; Kress, P.; Steinbrenner, J.; Oechsner, H. Propionic Acid Degradation in Anaerobic Digestion and Recovery Strategies for Full-Scale Biogas Plants. Bioresour. Technol. Rep. 2022, 19, 101192. [Google Scholar] [CrossRef] [Scilit]
- Franke-Whittle, I.H.; Insam, H. Treatment Alternatives of Slaughterhouse Wastes, and Their Effect on the Inactivation of Different Pathogens: A Review. Crit. Rev. Microbiol. 2013, 39, 139–151. [Google Scholar] [CrossRef] [Scilit]
- Maurus, K.; Kremmeter, N.; Ahmed, S.; Kazda, M. High-Resolution Monitoring of VFA Dynamics Reveals Process Failure and Exponential Decrease of Biogas Production. Biomass Convers. Biorefinery 2023, 13, 10653–10663. [Google Scholar] [CrossRef] [Scilit]
- Liu, T.; Chang, H.; Wu, G. Ecological engineering of r/K-selected microbial strategies for enhancing anaerobic propionate degradation. Environ. Res. 2026, 294, 123833. [Google Scholar] [CrossRef] [Scilit]
- Sun, M.; Zhang, X.; Goel, R.; Liu, B.; Terashima, M.; Yasui, H. Novel Operational Strategy of Anaerobic Processes to Recover Volatile Fatty Acids from Food Wastes. In Proceedings of the International Conference on Applied Sciences and Engineering (ICASE 2023); Atlantis Highlights in Engineering; Vandandoo, U., Tumurpurev, N., Baatar, O., Gelegbadam, A., Badarch, A., Ganbat, B., Tsangia, B., Gereltbyamba, B., Naoyasu, K., Dash, I., et al., Eds.; Atlantis Press International BV: Dordrecht, The Netherlands, 2023; Volume 22, pp. 125–135. ISBN 978-94-6463-329-0. [Google Scholar]
- Wang, F.; Li, W.-Y.; Yi, X.-N. Two-Phase Anaerobic Co-Digestion of Food Waste and Sewage Sludge. Water Sci. Technol. 2015, 71, 52–58. [Google Scholar] [CrossRef] [Scilit]
- Wang, Y.; Zhang, Y.; Wang, J.; Meng, L. Effects of Volatile Fatty Acid Concentrations on Methane Yield and Methanogenic Bacteria. Biomass Bioenergy 2009, 33, 848–853. [Google Scholar] [CrossRef] [Scilit]
- Liu, M.; Li, Y.; Zheng, Z.; Li, L.; Hao, J.; Liu, S.; Wang, Y.; Qi, C. Ordered Changes in Methane Production Performance and Metabolic Pathway Transition of Methanogenic Archaea under Gradually Increasing Sodium Propionate Stress Intensity. Fermentation 2024, 10, 201. [Google Scholar] [CrossRef] [Scilit]
- Siegert, I.; Banks, C. The Effect of Volatile Fatty Acid Additions on the Anaerobic Digestion of Cellulose and Glucose in Batch Reactors. Process Biochem. 2005, 40, 3412–3418. [Google Scholar] [CrossRef] [Scilit]
- Weedermann, M.; Wolkowicz, G.S.K.; Sasara, J. Optimal Biogas Production in a Model for Anaerobic Digestion. Nonlinear Dyn. 2015, 81, 1097–1112. [Google Scholar] [CrossRef] [Scilit]
- Harirchi, S.; Wainaina, S.; Sar, T.; Nojoumi, S.A.; Parchami, M.; Parchami, M.; Varjani, S.; Khanal, S.K.; Wong, J.; Awasthi, M.K.; et al. Microbiological Insights into Anaerobic Digestion for Biogas, Hydrogen or Volatile Fatty Acids (VFAs): A Review. Bioengineered 2022, 13, 6521–6557. [Google Scholar] [CrossRef] [Scilit]
- Zhang, Y.; Li, C.; Yuan, Z.; Wang, R.; Angelidaki, I.; Zhu, G. Syntrophy mechanism, microbial population, and process optimization for volatile fatty acids metabolism in anaerobic digestion. Chem. Eng. J. 2023, 452, 139137. [Google Scholar] [CrossRef] [Scilit]
- Ziemiński, K. Methane Fermentation Process as Anaerobic Digestion of Biomass: Transformations, Stages and Microorganisms. Afr. J. Biotechnol. 2012, 11, 4127–4139. [Google Scholar] [CrossRef] [Scilit]
- Kurade, M.B.; Saha, S.; Salama, E.-S.; Patil, S.M.; Govindwar, S.P.; Jeon, B.-H. Acetoclastic Methanogenesis Led by Methanosarcina in Anaerobic Co-Digestion of Fats, Oil and Grease for Enhanced Production of Methane. Bioresour. Technol. 2019, 272, 351–359. [Google Scholar] [CrossRef] [Scilit]
- Westerholm, M.; Calusinska, M.; Dolfing, J. Syntrophic Propionate-Oxidizing Bacteria in Methanogenic Systems. FEMS Microbiol. Rev. 2022, 46, fuab057. [Google Scholar] [CrossRef] [Scilit]
- Sikora, A.; Detman, A.; Chojnacka, A.; Błaszczyk, M. Anaerobic Digestion: I. A Common Process Ensuring Energy Flow and the Circulation of Matter in Ecosystems. II. A Tool for the Production of Gaseous Biofuels. In Fermentation Processes; InTech: London, UK, 2017. [Google Scholar]
- Han, Y.; Green, H.; Tao, W. Reversibility of Propionic Acid Inhibition to Anaerobic Digestion: Inhibition Kinetics and Microbial Mechanism. Chemosphere 2020, 255, 126840. [Google Scholar] [CrossRef] [Scilit]
- Li, Y.; Zhang, Y.; Sun, Y.; Wu, S.; Kong, X.; Yuan, Z.; Dong, R. The Performance Efficiency of Bioaugmentation to Prevent Anaerobic Digestion Failure from Ammonia and Propionate Inhibition. Bioresour. Technol. 2017, 231, 94–100. [Google Scholar] [CrossRef] [Scilit]
- Ochoa-Bernal, T.G.; Huber, D.H.; Espinosa-Solares, T. The Progressive Shift in Anaerobic Digestion Communities under Extreme Propionate Levels Led to a Redundant Microbiome Capable of Producing Methane. J. Environ. Manag. 2025, 395, 127698. [Google Scholar] [CrossRef] [Scilit] [PubMed]
- Lee, C.; Kim, J.; Shin, S.G.; O’Flaherty, V.; Hwang, S. Quantitative and Qualitative Transitions of Methanogen Community Structure during the Batch Anaerobic Digestion of Cheese-Processing Wastewater. Appl. Microbiol. Biotechnol. 2010, 87, 1963–1973. [Google Scholar] [CrossRef] [Scilit]
- Liu, X.; Soulard, C.; Jamilloux, V.; Pauss, A.; Andre, L.; Ribeiro, T.; Guerin-Rechdaoui, S.; Rocher, V.; Lacroix, C.; Bureau, C. A Deeper Study on Propionic Acid-Related Inhibition during Anaerobic Digestion: Insights on Methane Production and Identification of Biomarker Candidates for an Early Warning. bioRxiv 2025, 2025-05. [Google Scholar] [CrossRef] [Scilit]
- Elsamadony, M.; Mostafa, A.; Fujii, M.; Tawfik, A.; Pant, D. Advances towards understanding long chain fatty acids-induced inhibition and overcoming strategies for efficient anaerobic digestion process. Water Res. 2021, 190, 116732. [Google Scholar] [CrossRef] [Scilit]
- Yang, Y.; Chen, Q.; Guo, J.; Hu, Z. Kinetics and Methane Gas Yields of Selected C1 to C5 Organic Acids in Anaerobic Digestion. Water Res. 2015, 87, 112–118. [Google Scholar] [CrossRef] [Scilit]
- APHA; AWWA; WEF. Standard Methods for the Examination of Water and Wastewater, 23rd ed.; APHA Press: Washington, DC, USA, 2017. [Google Scholar]
- André, L.; Agumah, J.A.; Picard, F.; Liu, X.; Moreau, T.; Magis, A.; Bernat, O.; Mabrouk, N.; Routhier, F.; Brunet, A.; et al. Thermophilic and mesophilic two-phase co-digestion of the organic fraction of municipal solid waste with sewage sludge and equine manure. Bioresour. Technol. Rep. 2026, 34, 102614. [Google Scholar] [CrossRef] [Scilit]
- Liu, X.; André, L.; Mercier-Huat, M.; Grosmaître, J.-M.; Pauss, A.; Ribeiro, T. Accurate Estimation of Bicarbonate and Acetic Acid Concentrations with Wider Ranges in Anaerobic Media Using Classical FOS/TAC Titration Method. Appl. Sci. 2021, 11, 11843. [Google Scholar] [CrossRef] [Scilit]
- Wang, Y.; Qian, P.-Y. Conservative Fragments in Bacterial 16S rRNA Genes and Primer Design for 16S Ribosomal DNA Amplicons in Metagenomic Studies. PLoS ONE 2009, 4, e7401. [Google Scholar] [CrossRef] [Scilit]
- Callahan, B.J.; McMurdie, P.J.; Rosen, M.J.; Han, A.W.; Johnson, A.J.A.; Holmes, S.P. DADA2: High-Resolution Sample Inference from Illumina Amplicon Data. Nat. Methods 2016, 13, 581–583. [Google Scholar] [CrossRef] [Scilit] [PubMed]
- Escudié, F.; Auer, L.; Bernard, M.; Mariadassou, M.; Cauquil, L.; Vidal, K.; Maman, S.; Hernandez-Raquet, G.; Combes, S.; Pascal, G. FROGS: Find, Rapidly, OTUs with Galaxy Solution. Bioinformatics 2018, 34, 1287–1294. [Google Scholar] [CrossRef] [Scilit] [PubMed]
- McMurdie, P.J.; Holmes, S. Phyloseq: An R Package for Reproducible Interactive Analysis and Graphics of Microbiome Census Data. PLoS ONE 2013, 8, e61217. [Google Scholar] [CrossRef] [Scilit]
- Rohart, F.; Gautier, B.; Singh, A.; Lê Cao, K.-A. mixOmics: An R Package for ‘omics Feature Selection and Multiple Data Integration. PLoS Comput. Biol. 2017, 13, e1005752. [Google Scholar]
- Straube, J.; Gorse, A.-D.; PROOF Centre of Excellence Team; Huang, B.E.; Lê Cao, K.-A. A Linear Mixed Model Spline Framework for Analysing Time Course ‘Omics’ Data. PLoS ONE 2015, 10, e0134540. [Google Scholar] [CrossRef] [Scilit]
- Yuan, H.; Zhu, N. Progress in Inhibition Mechanisms and Process Control of Intermediates and By-Products in Sewage Sludge Anaerobic Digestion. Renew. Sustain. Energy Rev. 2016, 58, 429–438. [Google Scholar] [CrossRef] [Scilit]
- Cioabla, A.E.; Ionel, I.; Dumitrel, G.-A.; Popescu, F. Comparative Study on Factors Affecting Anaerobic Digestion of Agricultural Vegetal Residues. Biotechnol. Biofuels 2012, 5, 39. [Google Scholar] [CrossRef] [Scilit]
- Gonde, L.; Wickham, T.; Brink, H.G.; Nicol, W. pH-Based Control of Anaerobic Digestion to Maximise Ammonium Production in Liquid Digestate. Water 2023, 15, 417. [Google Scholar] [CrossRef] [Scilit]
- Mu, L.; Wang, Y.; Xu, F.; Li, J.; Tao, J.; Sun, Y.; Song, Y.; Duan, Z.; Li, S.; Chen, G. Emerging Strategies for Enhancing Propionate Conversion in Anaerobic Digestion: A Review. Molecules 2023, 28, 3883. [Google Scholar] [CrossRef] [Scilit]
- Rahimieh, A.; Akhavan, G.; Mousazadehgavan, M.; Mehriar, M.; Javadi, A. Propionate Production and Degradation in the Biological Wastewater Treatment: A Mini Review on the Role of Additives in Anaerobic Digestion. Desalination Water Treat. 2024, 319, 100555. [Google Scholar] [CrossRef] [Scilit]
- Chen, Y.; Rößler, B.; Zielonka, S.; Lemmer, A.; Wonneberger, A.M.; Jungbluth, T. The pressure effects on two-phase anaerobic digestion. Appl. Energy 2014, 116, 409–415. [Google Scholar] [CrossRef] [Scilit]
- Vítězová, M.; Kohoutová, A.; Vítěz, T.; Hanišáková, N.; Kushkevych, I. Methanogenic Microorganisms in Industrial Wastewater Anaerobic Treatment. Processes 2020, 8, 1546. [Google Scholar] [CrossRef] [Scilit]
- Hao, L.; Bize, A.; Conteau, D.; Chapleur, O.; Courtois, S.; Kroff, P.; Desmond-Le Quéméner, E.; Bouchez, T.; Mazéas, L. New Insights into the Key Microbial Phylotypes of Anaerobic Sludge Digesters under Different Operational Conditions. Water Res. 2016, 102, 158–169. [Google Scholar] [CrossRef] [Scilit]
- De Vrieze, J.; Hennebel, T.; Boon, N.; Verstraete, W. Methanosarcina: The Rediscovered Methanogen for Heavy Duty Biomethanation. Bioresour. Technol. 2012, 112, 1–9. [Google Scholar] [CrossRef] [Scilit]
- Leahy, S.C.; Kelly, W.J.; Altermann, E.; Ronimus, R.S.; Yeoman, C.J.; Pacheco, D.M.; Li, D.; Kong, Z.; McTavish, S.; Sang, C.; et al. The Genome Sequence of the Rumen Methanogen Methanobrevibacter Ruminantium Reveals New Possibilities for Controlling Ruminant Methane Emissions. PLoS ONE 2010, 5, e8926. [Google Scholar] [CrossRef] [Scilit]
- Borrel, G.; O’Toole, P.W.; Harris, H.M.B.; Peyret, P.; Brugère, J.-F.; Gribaldo, S. Phylogenomic Data Support a Seventh Order of Methylotrophic Methanogens and Provide Insights into the Evolution of Methanogenesis. Genome Biol. Evol. 2013, 5, 1769–1780. [Google Scholar] [CrossRef] [Scilit] [PubMed]
- Jin, Y.; Lu, Y. Syntrophic Propionate Oxidation: One of the Rate-Limiting Steps of Organic Matter Decomposition in Anoxic Environments. Appl. Environ. Microbiol. 2023, 89, e00384-23. [Google Scholar] [CrossRef] [Scilit]
- Li, Y.; Zhang, S.; Chen, Z. Multi-Omics Analysis Unravels Effects of Salt and Oil on Substance Transformation, Microbial Community, and Transcriptional Activity in Food Waste Anaerobic Digestion. Bioresour. Technol. 2023, 387, 129684. [Google Scholar] [CrossRef] [Scilit]
- Yan, M.; Shi, Z.; Zhang, X.; Lin, X.; Sun, Y.; Cheng, X.; Tian, H.; Li, Y. Decipher Syntrophies and Adaptive Response towards Enhancing Conversion of Propionate to Methane under Psychrophilic Condition. Water Res. 2025, 274, 123143. [Google Scholar] [CrossRef] [Scilit] [PubMed]
- Dyksma, S.; Gallert, C. Candidatus Syntrophosphaera Thermopropionivorans: A Novel Player in Syntrophic Propionate Oxidation during Anaerobic Digestion. Environ. Microbiol. Rep. 2019, 11, 558–570. [Google Scholar] [CrossRef] [Scilit]
- Zhang, H.; Yuan, W.; Dong, Q.; Wu, D.; Yang, P.; Peng, Y.; Li, L.; Peng, X. Integrated Multi-Omics Analyses Reveal the Key Microbial Phylotypes Affecting Anaerobic Digestion Performance under Ammonia Stress. Water Res. 2022, 213, 118152. [Google Scholar] [CrossRef] [Scilit]
- Duc, L.V.; Miyagawa, Y.; Inoue, D.; Ike, M. Identification of Key Steps and Associated Microbial Populations for Efficient Anaerobic Digestion under High Ammonium or Salinity Conditions. Bioresour. Technol. 2022, 360, 127571. [Google Scholar] [CrossRef] [Scilit]
- Pan, X.; Li, H.; Zhao, L.; Yang, X.; Su, J.; Dai, S.; Ning, J.; Li, C.; Cai, G.; Zhu, G. Response of Syntrophic Bacterial and Methanogenic Archaeal Communities in Paddy Soil to Soil Type and Phenological Period of Rice Growth. J. Clean. Prod. 2021, 278, 123418. [Google Scholar] [CrossRef] [Scilit]
- Dueholm, M.K.D.; Andersen, K.S.; Korntved, A.-K.C.; Rudkjøbing, V.; Alves, M.; Bajón-Fernández, Y.; Batstone, D.; Butler, C.; Cruz, M.C.; Davidsson, Å.; et al. MiDAS 5: Global Diversity of Bacteria and Archaea in Anaerobic Digesters. Nat. Commun. 2024, 15, 5361. [Google Scholar] [CrossRef] [Scilit]
- Li, X.; Shimizu, N. Biochar-promoted methane production and mitigation of acidification during thermophilic anaerobic co-digestion of food waste with crude glycerol: Comparison with re-inoculation. Sustain. Environ. Res. 2023, 33, 4. [Google Scholar] [CrossRef] [Scilit]
- Chang, H.; Yin, Q.; He, K.; De Vrieze, J.; Wu, G. Feeding Regime Selectively Enriching Acetoclastic Methanogens to Enhance Energy Production in Anaerobic Digestion Systems. Biochem. Eng. J. 2025, 220, 109764. [Google Scholar] [CrossRef] [Scilit]

Disclaimer/Publisher’s Note: The statements, opinions and data contained in all publications are solely those of the individual author(s) and contributor(s) and not of MDPI and/or the editor(s). MDPI and/or the editor(s) disclaim responsibility for any injury to people or property resulting from any ideas, methods, instructions or products referred to in the content. |
© 2026 by the authors. Licensee MDPI, Basel, Switzerland. This article is an open access article distributed under the terms and conditions of the Creative Commons Attribution (CC BY) license.