1. Introduction
Anaerobic digestion (AD) is a strategic technology for the recovery of livestock waste, particularly swine manure, by converting it into biogas—a source of renewable energy—and nutrient-rich digestate suitable for agricultural use. AD simultaneously mitigates greenhouse gas emissions, reduces water and soil pollution, and operationalizes circular economy principles by transforming waste streams into productive resources [
1,
2]. A recent mini-review of ten Life Cycle Assessment (LCA) studies on pig manure treatment confirmed AD as the dominant technology in this sector [
3]. Among the available reactor configurations, covered lagoon biodigesters with mechanical agitation have proven particularly well-suited for tropical regions, where mesophilic operation can be sustained without auxiliary heating, capital costs remain moderate, and operational experience in Latin America and the Caribbean is consolidated [
4].
Under mesophilic conditions (30–38 °C) with adequate mixing, these systems achieve organic matter removal rates above 80%, methane contents of 55–70%, and specific biogas yields of 0.02–0.04 m
3 per kg of raw swine manure [
5,
6,
7,
8,
9,
10]. The digestate produced contains concentrated levels of nitrogen, phosphorus, and potassium in proportions suitable for direct agricultural application and partial substitution of synthetic fertilizers when used in conjunction with appropriate management practices [
11,
12]. Recent advances in co-digestion and substrate pretreatment strategies have further improved biogas yields and nutrient recovery efficiency [
12,
13]. Techno-economic analyses confirm that centralized AD plants achieve financial viability when revenue from power generation and biofertilizer sales is considered together, particularly on an industrial scale [
14,
15,
16].
Despite this technological maturity, the existing literature on swine manure management remains methodologically fragmented: studies typically focus on isolated technical parameters or independent economic and environmental metrics [
17,
18,
19]. The same mini-review cited above [
3] noted that none of the ten LCA studies analysed proposed quantitative indicators of circularity. Although AD has gained widespread acceptance as a strategy for mitigating greenhouse gas (GHG) emissions [
17,
20], its contribution to the implementation of circular economy principles in the agri-food sector remains insufficiently quantified. Recent reviews position AD as a low-carbon technology within a circular economy framework [
21], yet a comprehensive systematic scoping review of biogas in the Global South confirmed that Circular Economy (CE) remains a rarely discussed and underdeveloped topic in the literature [
22]. A review of 63 existing CE indicators confirmed that there is no universally accepted metric and recommended complementary multidimensional sets rather than aggregate scores [
23]. Partial proposals have been put forward: process-level metrics for slurry treatment that separately capture water efficiency, biofertilizer, and biogas [
24]; integrated treatment systems such as SISTRATES
® in Brazil that achieve the simultaneous recovery of energy, nutrients, and water without formal quantitative indicators [
25]; and scalable circularity metrics for the bio-economy [
26]. The significance of these gaps is magnified in tropical regions, where mesophilic operation eliminates the need for auxiliary heating, which in temperate climates accounts for 20–40% of the energy generated [
27], and where the availability of agricultural land allows for the reuse of digestate and effluent [
28]. No standardized or integrated framework currently quantifies the simultaneous closure of energy, material, carbon, nutrient, and water cycles at the agricultural system level for large-scale covered lagoon biodigesters in tropical contexts, and the Cuban pork sector exemplifies this convergence—producing more than 180,000 tons of pork annually with limited deployment of large-scale industrial AD—without ever having been quantitatively benchmarked against international circularity references.
To address this gap, this study develops and evaluates a covered lagoon biodigester with mechanical agitation, designed for a 10,000-head fattening module located in Matanzas, Cuba, and proposes a framework of five quantitative circular economy indicators—the Energy Self-Sufficiency Ratio (ESSR), the Waste Valorization Index (WVI), the Decarbonization Index (DCI), the Fertilizer Substitution Rate (FSR), and the Water Closure Factor (WCF)—that independently measure the closure of the energy, material, carbon, nutrient, and water cycles [
29,
30,
31]. The study (i) integrates hydraulic, thermal, and structural design parameters into a reproducible sizing methodology adapted to tropical mesophilic conditions; (ii) quantifies biogas, electricity, and biofertilizer outputs; (iii) evaluates economic viability through Net Present Value, Internal Rate of Return, and payback period, with sensitivity analysis on the most volatile parameters; and (iv) performs a comparative screening-level LCA against a diesel-based generation baseline using the ReCiPe 2016 Midpoint (H) method, providing a replicable and transferable tool for alternative reactor configurations, geographic contexts, and livestock production models.
The novelty of this work lies in four interconnected scientific contributions. First, a reproducible sizing methodology integrating hydraulic, thermal, and structural parameters is formulated for covered lagoon biodigesters operating under tropical mesophilic conditions without auxiliary heating, with explicit treatment of safety margins for organic load variability. Second, a quantitative circular economy framework comprising five independent indicators (ESSR, WVI, DCI, FSR, WCF) is proposed and aligned with ISO 59020:2024 [
29], enabling the simultaneous measurement of energy, material, carbon, nutrient, and water-cycle closure at farm scale—an integration absent from previous indicator sets for anaerobic digestion systems. Third, the proposed framework is benchmarked against three direct antecedents [
24,
25,
26], evidencing both quantitative superiority in the Cuban tropical context and methodological complementarity with established techno-economic and life cycle assessment tools. Fourth, a sensitivity decomposition reveals a fundamental asymmetry in circularity performance: the energy and carbon dimensions are intrinsic to biogas capture, whereas the material and water dimensions are conditional on the agricultural reuse of digestate and treated effluent—a finding with direct implications for biodigester siting policy and integrated land-use planning. These contributions are developed across the Methodology (
Section 2), Results (
Section 3), and Discussion (
Section 4), before being synthesized in the Conclusions (
Section 5).
2. Materials and Methods
2.1. Integrated Methodological Framework for Biodigester Design and Evaluation
An integrated methodological framework was developed to guide the design, evaluation, and validation of the covered lagoon biodigester system. This approach integrates specific technical procedures with broader environmental and economic assessments, ensuring the resulting system adheres strictly to the requirements of a circular economy and long-term sustainability.
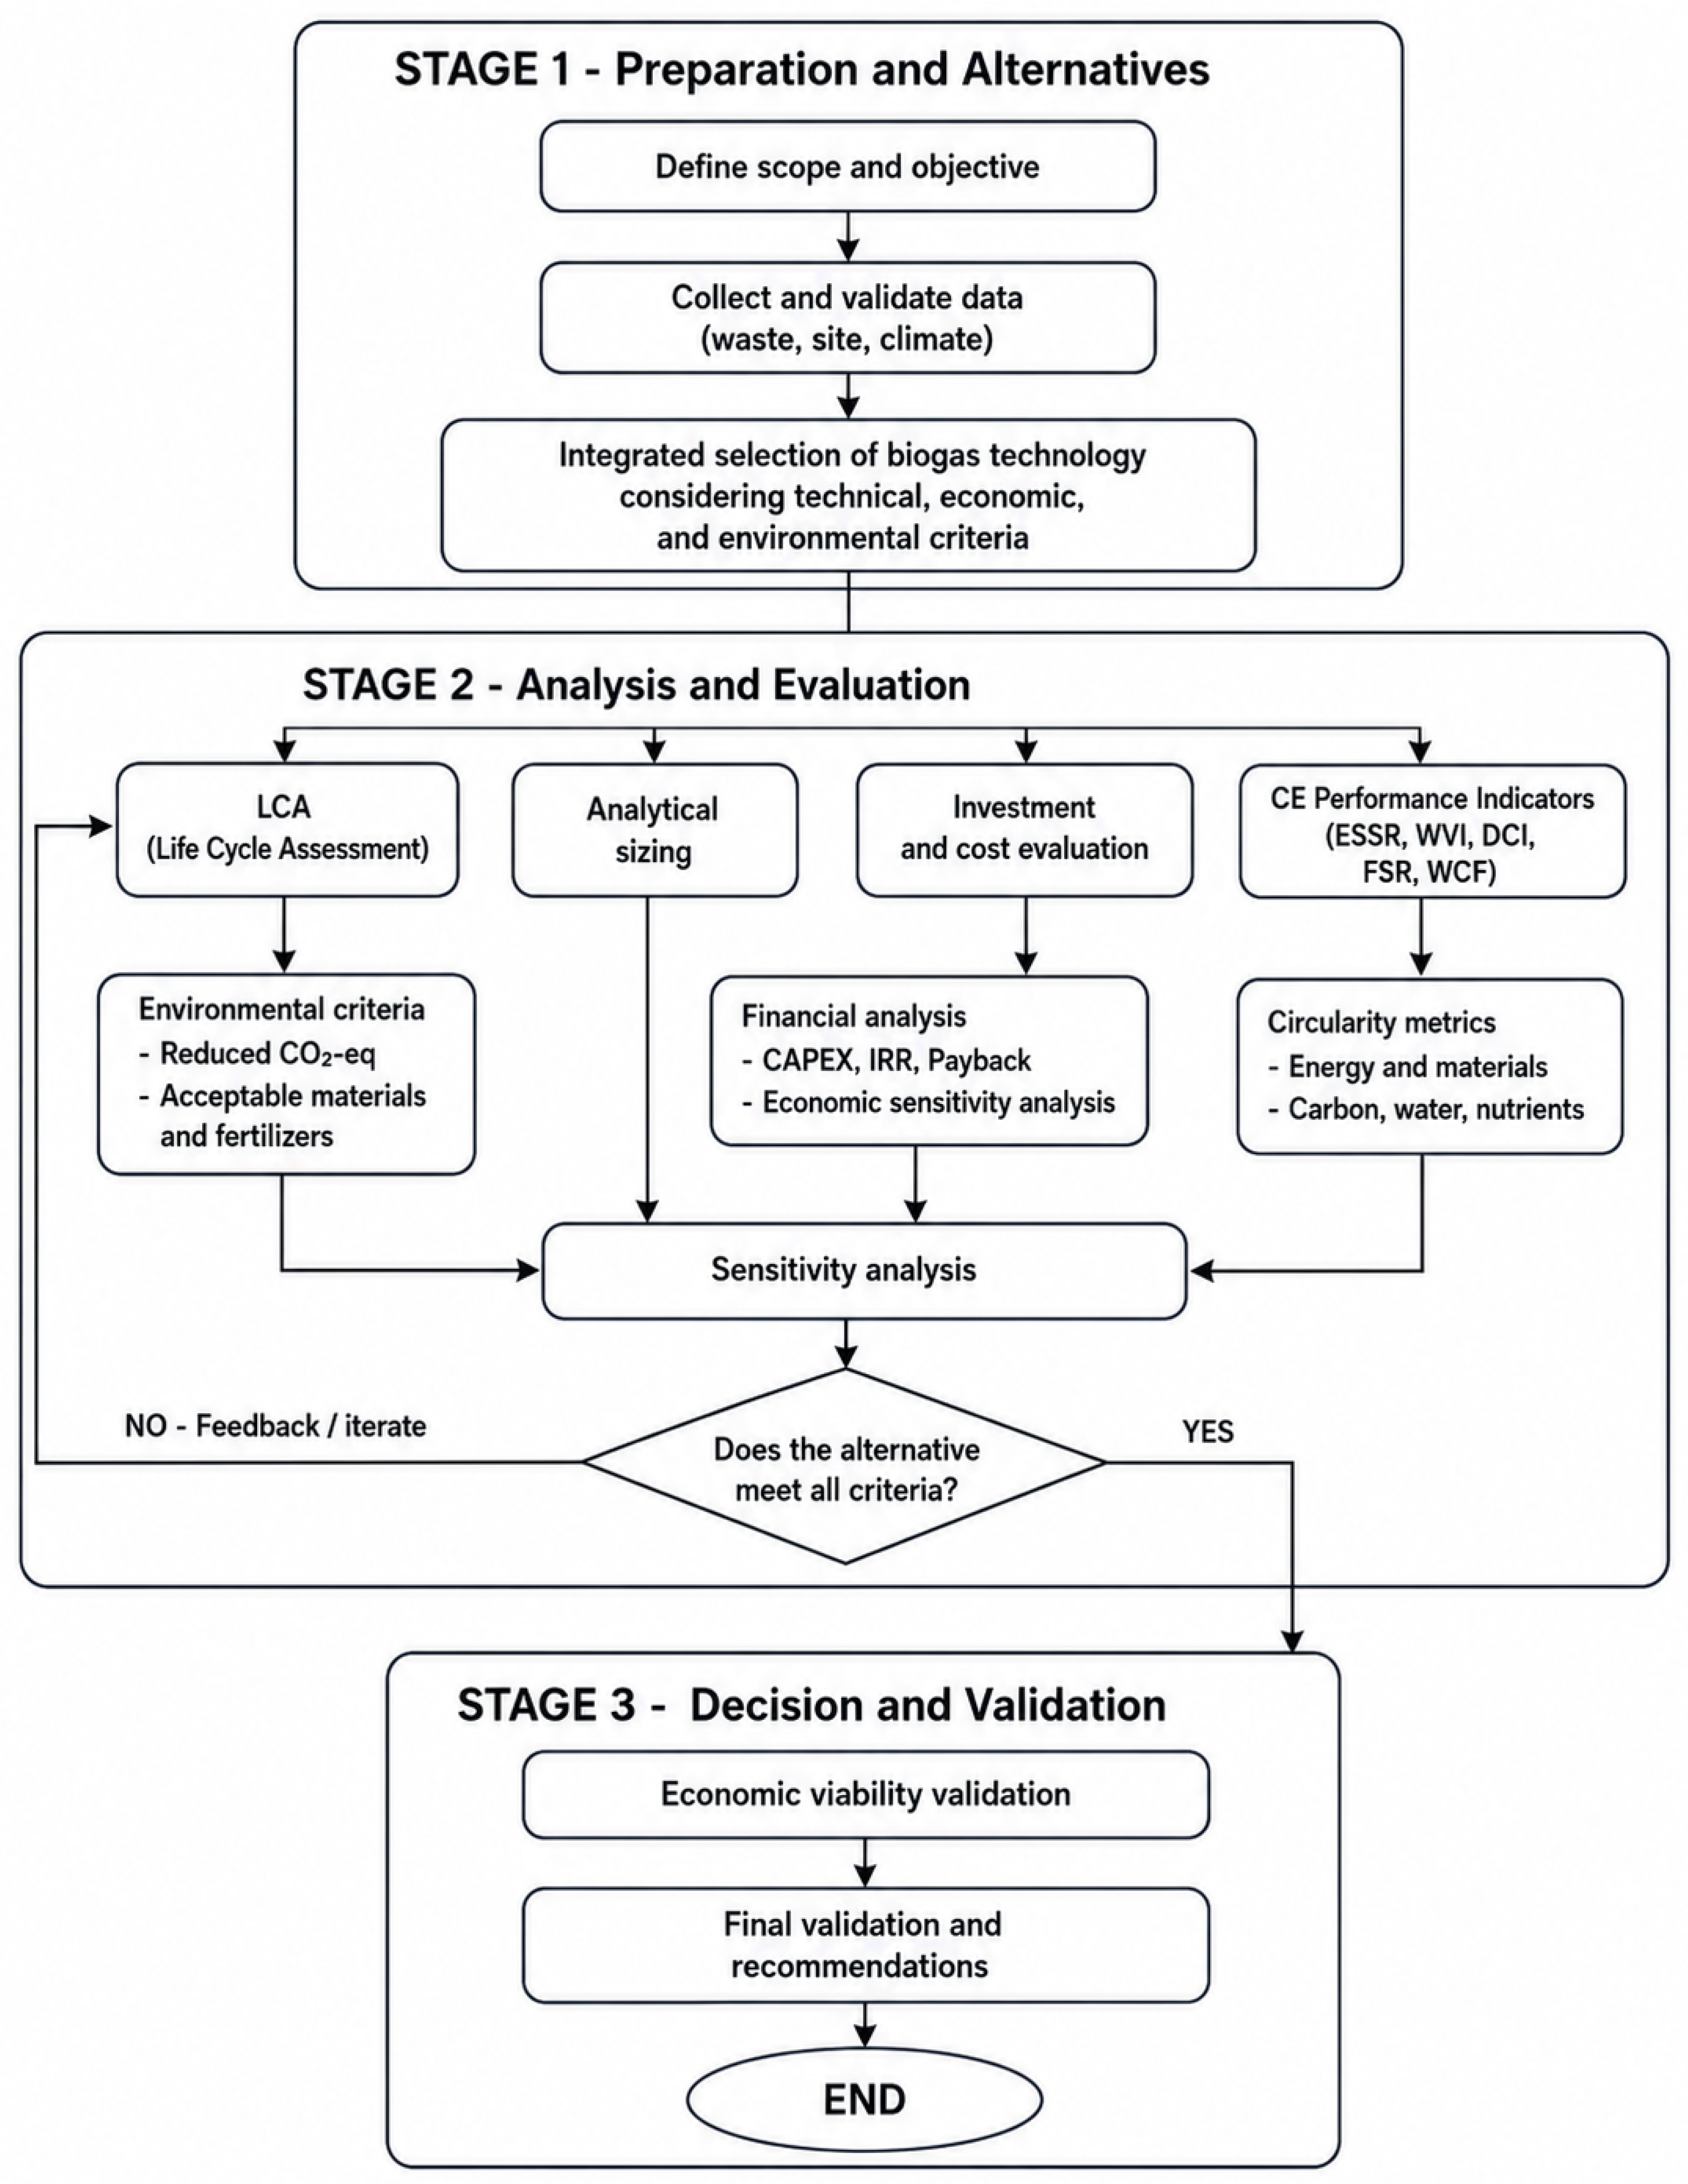
The proposed methodology follows a three-tier structure, as depicted in
Figure 1. During the initial phase (Preparation and Alternatives), the primary focus lies on establishing the system’s scope and objectives while simultaneously gathering and verifying critical data regarding waste production, site-specific variables, and local climate. These datasets then serve as the basis for a screening process, where potential anaerobic digestion technologies are evaluated against technical requirements, financial limitations, and environmental priority.
The subsequent Analysis and Evaluation phase (Stage 2) merges the analytical sizing of the biodigester and its auxiliary components with techno-economic and environmental assessment tools. Within this stage, environmental impacts are weighed through a life cycle lens, specifically targeting resource recovery and greenhouse gas abatement, while financial viability is determined by calculating indicators such as NPV, IRR, CAPEX, and the expected payback period. To ensure the system’s resilience against market or operational fluctuations, the methodology incorporates a sensitivity analysis focused on volatile factors such as investment overheads, electricity pricing, and biogas productivity.
The framework concludes with Stage 3 (Decision and Validation), which functions as an iterative gateway where the biodigester’s configuration is weighed against established technical, environmental, and financial benchmarks. This phase is designed with built-in feedback loops; should the initial results fall short of the required targets, design assumptions are refined and performance metrics recalculated. Ultimately, this process yields a validated model that confirms both economic feasibility and sustainability, demonstrating the system’s effectiveness for managing swine manure at scale within tropical environments.
By employing this integrated framework, a clear alignment is maintained between the engineering design, operational performance, and long-term sustainability metrics. Furthermore, such an approach establishes a transparent foundation for the screening-level life cycle sustainability analysis that forms the core of this research, ensuring all subsequent evaluations are grounded in consistent data.
To support consistent reading of the equations and parameters used throughout the manuscript,
Table 1 presents the unified nomenclature adopted in this work. All variables follow a consistent two-level subscript convention (variable, time scale) and SI-compatible units.
2.2. Data Collection: Study Site and Swine Production System
The study was conducted at a large-scale swine production facility belonging to a mixed pork enterprise located between José Martí and Valentín Castro streets, in the Máximo Gómez municipality, Matanzas Province, Cuba (approximately 22.90° N, 81.58° W; mean annual ambient temperature ≈ 26 °C; tropical climate). A satellite image of the site is provided in
Figure S1 (Supplementary Material). The facility operates under a complete production cycle, including breeding, nursery, pre-fattening, and fattening units, and, in some cases, integrates on-site feed manufacturing to ensure supply continuity. The production system is based on established genetic lines, employing Yorkshire and Landrace breeds as maternal lines and Duroc Jersey as the paternal line, aiming to optimize growth performance and meat quality. The facility is primarily oriented toward the commercialization of fresh pork, roasting pigs, and related by-products for the local market and has more than 50 years of operational experience in the swine sector.
The analyzed production module corresponds to a fattening unit with a capacity of approximately 10,000 pigs. Based on operational data and conservative estimates, each animal generates an average of 3.5 kg animal−1 day−1 of manure, resulting in a total daily waste production of approximately 35,000 kg on a wet basis. To ensure adequate fluidity and process stability, the manure is diluted with process water at a 1:2 ratio, yielding a design influent flow rate of 126 m3 day−1, including a 20% safety margin to account for fluctuations in organic load. These organic residues constitute the primary substrate for the wet anaerobic digestion system evaluated in this study, designed for both energy recovery through biogas production and agronomic valorization via digestate reuse within a circular economy framework.
2.3. Methodological Approach
This study followed a quantitative–analytical methodology aimed at designing and evaluating a covered lagoon anaerobic digester with mechanical agitation under tropical conditions. The approach integrates empirical data from swine production systems with design procedures recommended by FAO (Varnero Moreno, 2011) [
32] and ECLAC (2019) [
33], and adapted to Cuban swine production conditions following national references on biogas plant design (Guardado Chacón, 2007 [
34]; Pérez et al., 2016 [
35]).
The methodology was structured in four stages:
- (a)
Estimation of substrate production and influent flow rate;
- (b)
Geometric and hydraulic design of the digester and complementary units;
- (c)
Specification of mixing and gas-handling systems;
- (d)
Economic and environmental assessment based on dynamic indicators.
2.4. Substrate and Flow Characterization
This stage defines the daily substrate generation and the hydraulic load entering the treatment line, as calculated in Equation (
1). The dilution ratio and excreta production values were selected according to reported data for swine manure management systems [
36,
37,
38].
where:
Q = Nominal hydraulic flow rate, in m3 day−1;
N = Dilution factor, dimensionless;
= Daily manure production, in kg day−1;
= Density of the diluted slurry, taken as 1010 kg m
−3, a representative value for swine manure–water mixtures at the dilution ratio adopted in this study [
36,
38].
The use of slurry density rather than raw manure density ensures that the volumetric flow correctly represents the mixed influent entering the biodigester. To ensure adequate operational capacity under fluctuations of organic load, a design safety margin was incorporated according to Equation (
2), following recommendations reported in the literature [
39,
40].
where
is the design hydraulic flow rate (m
3 day
−1) and
Q is the nominal hydraulic flow rate (m
3 day
−1).
2.5. Feed Tank Design
The feed tank is designed to guarantee proper homogenization of the slurry prior to anaerobic digestion. The useful storage volume was estimated using Equation (
3), following engineering practices commonly adopted for livestock wastewater management systems [
41,
42].
where
is the useful feed tank volume (m
3) and
is the storage time (days).
2.6. Biodigester Dimensioning
The useful volume of the biodigester was determined according to Equation (
4), based on the hydraulic retention time required for swine manure treatment under mesophilic conditions. Reported retention times for this type of substrate are commonly around 30 days [
43,
44].
To accommodate peak organic loads and operational variability, an additional safety factor was incorporated using Equation (
5) [
41].
The biodigester lagoon was geometrically represented as a rectangular truncated pyramid, a configuration widely adopted for covered lagoon digesters [
45,
46]. The corresponding volumetric expression, the base-area formulation for a 3:1 length-to-width ratio, and the crown-area expression considering the depth and 1:1 wall slopes are presented as
Equations (S1)–(S3) of the Supplementary Material. The resulting geometric parameters are reported in
Section 3.
2.7. Effluent Lagoon and Post-Treatment
Post-treatment of the biodigester effluent was evaluated according to Equation (
6) to ensure compliance with discharge regulations and improve the environmental quality of the treated wastewater. Facultative lagoons are commonly used for this purpose due to their robustness, low operational cost, and simplicity of operation [
47,
48].
where
is the useful volume of the discharge lagoon (m
3),
is the discharge flow rate directed to the lagoon (m
3 day
−1), and
is the hydraulic retention time of the facultative lagoon (days). The discharge lagoon geometry was represented using the same truncated-pyramid configuration adopted for the biodigester, in order to maintain geometric consistency and facilitate earthwork construction [
49,
50]; the corresponding volumetric expression is presented as
Equation (S4) of the Supplementary Material.
2.8. Agitation and Auxiliary Systems
The total mixing power requirement was estimated using the empirical criterion of 20 W per m
3 of reactor volume (0.02 kW m
−3), commonly adopted for large-scale anaerobic digesters, as expressed in Equation (
7) [
51].
where
is the total installed mixing power (kW),
is the design biodigester volume (m
3), and
is the specific mixing power requirement (kW m
−3). For a biodigester volume of
m
3 and a specific mixing power of
kW m
−3, the resulting installed power requirement was estimated at
kW.
2.9. Biogas and Energy Estimation
Daily biogas production was estimated using Equation (
8), considering a specific biogas yield for swine manure digestion under mesophilic operating conditions, consistent with values reported for covered lagoon biodigesters in the literature [
4,
52].
where:
= Daily biogas production, in m3 day−1;
= Daily mass of raw swine excreta (35,000 kg day−1 on a wet basis; this term does not include the dilution water used to prepare the influent), in kg day−1;
= Specific biogas yield, equal to of raw excreta.
The specific biogas yield of 0.025 m
3 per kg of raw excreta was adopted as a conservative design value within the range of 0.02–0.04 m
3/kg reported in the literature [
4,
53,
54]. This lower-bound estimate accounts for the inherent variability in covered lagoon systems operating without temperature control, where actual yields may fluctuate depending on ambient conditions, substrate composition, and organic loading rate. The sensitivity of the economic results to biogas yield variation is addressed in
Section 4.
2.10. Techno-Economic Evaluation
The economic viability of the proposed biodigester system was evaluated using discounted cash-flow techniques, following criteria established for pre-investment project appraisal [
55,
56,
57,
58,
59,
60]. The analysis assumes a project lifetime of 20 years, a discount rate of 8%, and a 35% profit tax. The system generates two main revenue streams: electricity production and biofertilizer sales. According to [
61], for each cubic meter of influent fed into the biodigester, approximately 0.215 t of digested sludge suitable for use as biofertilizer is obtained.
All economic parameters, electricity tariffs, market prices, and operational assumptions adopted in this study correspond to reference conditions available during the period January–March 2025. The electricity tariff of 0.24 USD kWh
−1 was adopted from the Cuban national reference [
62], and the biogas-to-electricity conversion factor of 2 kWh per Nm
3 of biogas was selected as a conservative value within the range of 2.2–2.4 kWh m
−3 reported in the literature [
63,
64]. The biofertilizer market values were selected based on regional data and institutional reports available at the time of the analysis. The estimated capital expenditure (CAPEX) of approximately
$300,000 includes the principal components required for the construction and operation of the proposed covered lagoon biodigester system. The investment structure comprises civil works and earthmoving activities, geomembrane acquisition and installation, feed and discharge piping systems, agitation equipment, biogas collection and safety devices, electrical interconnection infrastructure, auxiliary pumping systems, and installation labor. Civil construction and geomembrane implementation accounted for the largest share of the total investment cost due to the dimensions of the biodigester and the post-treatment lagoon. The CAPEX estimation was developed using reference cost criteria reported for industrial anaerobic digestion facilities and adapted to the local operating conditions of the case study.
Table 2 summarizes the percentage distribution of the total CAPEX by component, based on reference cost criteria reported for industrial covered lagoon anaerobic digestion plants [
14,
65]. The civil works, geomembrane installation, and biogas/Combined Heat and Power (CHP) equipment together represent approximately 72% of the total investment, consistent with values reported for large-scale livestock waste digestion systems in tropical contexts. The remaining cost share is distributed among mechanical agitation, piping, electrical interconnection, and installation engineering.
The detailed expressions for the annual income from electricity generation, the annual income from biofertilizer commercialization, the total annual income, and the Net Present Value used for the sensitivity analysis are provided as
Equations (S14)–(S17) of the Supplementary Material.
2.11. Life Cycle Assessment (LCA) Methodology
The LCA was used as a standardized and systematic methodology to assess the potential environmental impacts associated with electricity generation, in accordance with international standards ISO 14040 and ISO 14044 [
66,
67]. This methodology allows for the consistent quantification and comparison of the environmental burdens associated with different technological alternatives on a common functional basis. In this context, LCA was applied with the aim of comparing electricity generation from biogas with electricity generation using conventional diesel in Cuba. The methodological approach is structured in four interrelated phases—definition of the objective and scope, life cycle inventory analysis, life cycle impact assessment, and interpretation of results—which are developed sequentially and iteratively, ensuring the consistency of the analysis and the correct interpretation of the environmental impacts assessed [
68].
Goal, Scope, Inventory, and Impact Assessment of the LCA
The goal of this screening-level LCA is to compare the environmental performance of electricity generation from biogas produced by the proposed covered lagoon biodigester with conventional diesel-based electricity generation in Cuba, in accordance with ISO 14040 and ISO 14044 [
69,
70].
The functional unit was defined as the generation of 1 MWh of electricity. The system boundaries followed a cradle-to-gate approach: for the biogas scenario, they included manure collection, substrate dilution, anaerobic digestion, biogas combustion in a CHP engine, and digestate and treated effluent management; for the diesel scenario, they included diesel extraction, refining, transport, and combustion in a generator set.
The life cycle inventory (LCI) was modeled using SimaPro 9.5 software with background data from the ecoinvent 3.9 database, under the cut-off system model. Foreground data for the biogas system were derived from the design calculations presented in
Section 2.4,
Section 2.5,
Section 2.6,
Section 2.7,
Section 2.8 and
Section 2.9 and the operational parameters in
Table 3. The life cycle impact assessment (LCIA) was performed using the ReCiPe 2016 Midpoint (H) V1.07/World (2010) method to evaluate the environmental impacts associated with the assessed electricity generation systems [
71].
The diesel reference scenario was modeled assuming a 100 kW stationary diesel generator with an electrical efficiency of 35% and a specific fuel consumption of 0.28 L/kWh [
72]. The Cuban electricity grid emission factor of 0.9 kg CO
2eq/kWh was adopted [
73].
The life cycle impact assessment (LCIA) [
74,
75] was carried out using the ReCiPe 2016 Midpoint (H) V1.07/World (2010) method, evaluating 18 impact categories including global warming, ozone depletion, ionizing radiation, ozone formation, fine particulate matter formation, terrestrial acidification, freshwater and marine eutrophication, terrestrial, freshwater, and marine ecotoxicity, human carcinogenic and non-carcinogenic toxicity, land use, mineral resource scarcity, fossil resource scarcity, and water consumption [
76].
Multifunctionality was addressed through system expansion: the biogas system received credit for avoided synthetic fertilizer production, based on the nitrogen, phosphorus, and potassium content of the digestate, and for avoided methane emissions from open manure storage. No allocation was applied, since the system delivers a single primary function (electricity generation), with co-products handled through substitution [
77].
2.12. Circular Economy Performance Indicators
In order to operationalize the circular economy performance of the proposed covered lagoon biodigester, five quantitative indicators were defined. These indicators cover the energy, material, carbon, nutrient, and water dimensions of cycle closure within the system. The indicators were formulated using the same system boundaries adopted in this study, which include manure collection, substrate dilution, anaerobic digestion, effluent post-treatment, electricity generation from biogas, digestate valorization, and reuse of treated effluent for agricultural irrigation. Unless otherwise stated, mass and energy flows are expressed on a daily basis, whereas fertilizer substitution and greenhouse gas mitigation are expressed on an annual basis, in accordance with the operating conditions and agricultural management of the system.
2.12.1. Energy Self-Sufficiency Ratio (ESSR)
The ESSR, defined in Equation (
9), quantifies the extent to which the system can meet its internal electricity demand through biogas generation.
where
is the daily electrical energy generated from biogas (kWh day
−1) and
is the total daily on-site electrical demand (kWh day
−1). The demand term includes the electricity required by the finishing module and by the biodigestion system itself, including agitators, pumps, and auxiliary equipment. A value of ESSR > 1 indicates energy self-sufficiency, whereas a value of ESSR > 1 indicates dependence on external electricity supply.
The exportable energy surplus can be estimated using Equation (
10).
where
is the daily electricity surplus available for export to the grid (kWh day
−1). From a functional perspective, this indicator expresses the degree of energy-cycle closure, showing whether the system not only satisfies its own demand but also generates an economically usable surplus.
2.12.2. Waste Valorization Index (WVI)
The WVI, defined in Equation (
11), quantifies the mass fraction of the total input stream that is transformed into useful products with energy, agronomic, or water value.
where
,
, and
are the daily masses of biogas, digestate destined for agricultural application, and treated effluent effectively reused for irrigation (kg day
−1), and
is the total daily mass entering the system (kg day
−1). The input mass was estimated according to Equation (
12).
The detailed expressions for the biogas mass (
), the reused-effluent mass (
), and the non-valorized fraction
are presented as
Equations (S5)–(S7) of the Supplementary Material. The WVI ranges from 0 to 1; values close to 1 indicate a high degree of material valorization and minimal system losses.
2.12.3. Decarbonization Index (DCI)
The DCI, defined in Equation (
13), expresses the relationship between the annual greenhouse gas emissions avoided by the system and the annual emissions attributable to system operation.
At a screening level, avoided emissions can be estimated using Equation (
14) as the sum of two principal contributions: emissions avoided through methane capture and controlled utilization, and emissions avoided through displacement of grid electricity.
Operational emissions of the system were approximated according to Equation (
15), aggregating the three contributions identified for screening-level assessment of covered lagoon biodigesters: total electricity consumption of the mixing, pumping, and auxiliary equipment, expressed in grid-equivalent terms, and fugitive methane emissions through the lagoon cover.
where
is the total annual electricity consumption of the system, comprising mixing, pumping, and auxiliary equipment (kWh year
−1);
is the emission factor of the displaced electricity grid (kg CO
2eq kWh
−1);
is the annual mass of fugitive methane released through the lagoon cover (kg CH
4 year
−1), estimated at 2–5% of the captured CH
4 based on reported data for covered lagoon systems; and
is the 100-year global warming potential of methane (28–34). The detailed expression for
as a function of installed agitation power, daily operating time, and annual operating days is presented as
Equation (S8) of the Supplementary Material. Embodied emissions of construction materials are excluded, in accordance with the screening-level scope of this assessment.
A value of DCI > 1 indicates that the system emits less than it generates during operation. From the circular economy perspective, this indicator reflects carbon-cycle closure through methane capture and substitution of fossil-based electricity.
2.12.4. Fertilizer Substitution Rate (FSR)
The FSR (Equation (
16)) quantifies the annual mass of synthetic nutrients that can be replaced through the agricultural application of digestate. The indicator is calculated independently for each nutrient of interest:
where FSR
i is the annual substitution rate for nutrient
i (t nutrient year
−1),
is the annual mass of digestate available for agricultural application (t year
−1),
is the concentration of nutrient
i in the digestate (t nutrient t
−1 digestate), and
is the agronomic nutrient recovery efficiency for nutrient
i (dimensionless). The detailed expression for
as a function of the daily digestate mass and annual operating days is provided as
Equation (S9) of the Supplementary Material. In this study, the indicator is evaluated for total nitrogen N, phosphorus equivalent as P
2O
5, and potassium equivalent as K
2O.
2.12.5. Water Closure Factor (WCF)
The WCF (Equation (
17)) evaluates the extent to which the system returns treated water to productive use relative to the freshwater consumed for substrate dilution.
where
is the daily volume of treated effluent effectively reused for irrigation (m
3 day
−1) and
is the daily volume of freshwater consumed for substrate dilution (m
3 day
−1). The detailed expression for
is presented as
Equation (S10) of the Supplementary Material. A value of WCF ≥ 1 indicates that the system returns to productive use an amount of water equal to or greater than the freshwater required for slurry dilution.
2.13. Limitations of the Screening-Level LCA
It should be noted that the study carried out corresponds to a preliminary-level assessment intended to support decision-making at early stages. Therefore, some life cycle stages and operational factors were not fully modeled, including construction materials, geomembrane and equipment replacement, long-term maintenance, unplanned shutdowns, methane leakage, and possible reductions in biogas production or conversion efficiency over time. These exclusions may affect the absolute magnitude of some impact categories, especially those associated with infrastructure, material production, toxicity, land occupation, and water consumption. Nevertheless, the preliminary approach is useful for identifying the main environmental trade-offs and the mitigation potential of the proposed system, particularly because methane recovery and the substitution of diesel-generated electricity are expected to dominate the results in the climate change category. Future work should develop a complete analysis based on primary operational data, including maintenance records, seasonal performance, system efficiency degradation, and detailed digestate management scenarios.
3. Results
Table 4 presents the main physical, construction, and equipment design parameters of the biogas production system considered in this study, which includes the feed tank, anaerobic biodigester, discharge pond, and mechanical agitation system. These parameters define the structural configuration of the system and establish the geometric and volumetric conditions necessary to ensure adequate hydraulic performance and the stability of the anaerobic digestion process.
The parameters presented in
Table 4 describe the main physical characteristics and equipment of the biodigester. The system has a useful volume of 3150 m
3 and a design volume of 3780 m
3, which reflects an adequate capacity for continuous substrate treatment. The depth of the biodigester (4.0 m) and its construction geometry ensure stable storage of the material undergoing digestion. Likewise, the 1815 m
3 discharge lagoon allows for adequate management of the digested effluent. The installed agitation system, with a total power of 75.6 kW, demonstrates the existence of technical conditions for efficient substrate mixing.
Table 5 summarizes the main hydraulic and load parameters of the biogas production system, used as reference data for evaluating the energy performance of the system and for the environmental analysis carried out subsequently.
The system operates with a daily production of 35,000 kg day−1, corresponding to an average excreta generation of 3.5 kg per pig. A dilution factor of was adopted. The nominal hydraulic load was estimated as 105 m3 day−1, and a 20% design margin yielded a design flow rate of 126 m3 day−1. The feed tank useful volume of 21 m3 was obtained considering a cleaning and collection period of up to 6 h per day.
For the anaerobic digestion stage, a hydraulic retention time of 30 days was selected, consistent with mesophilic operation at an average temperature of 29 °C. This resulted in a useful biodigester volume of 3150 m3, which was increased by 20% to 3780 m3. The biodigester lagoon geometry corresponds to a rectangular truncated pyramid with a depth of 4 m and side slopes of 1:1.
The effluent flow directed to the post-treatment lagoon is 113.4 m3 day−1, considering that approximately 10% of the influent becomes sludge and including an additional margin to handle load fluctuations. A hydraulic retention time of 16 days was adopted for the facultative lagoon, in accordance with Cuban discharge limits.
The mixing system was sized using an empirical criterion of 2 kW per 100 m
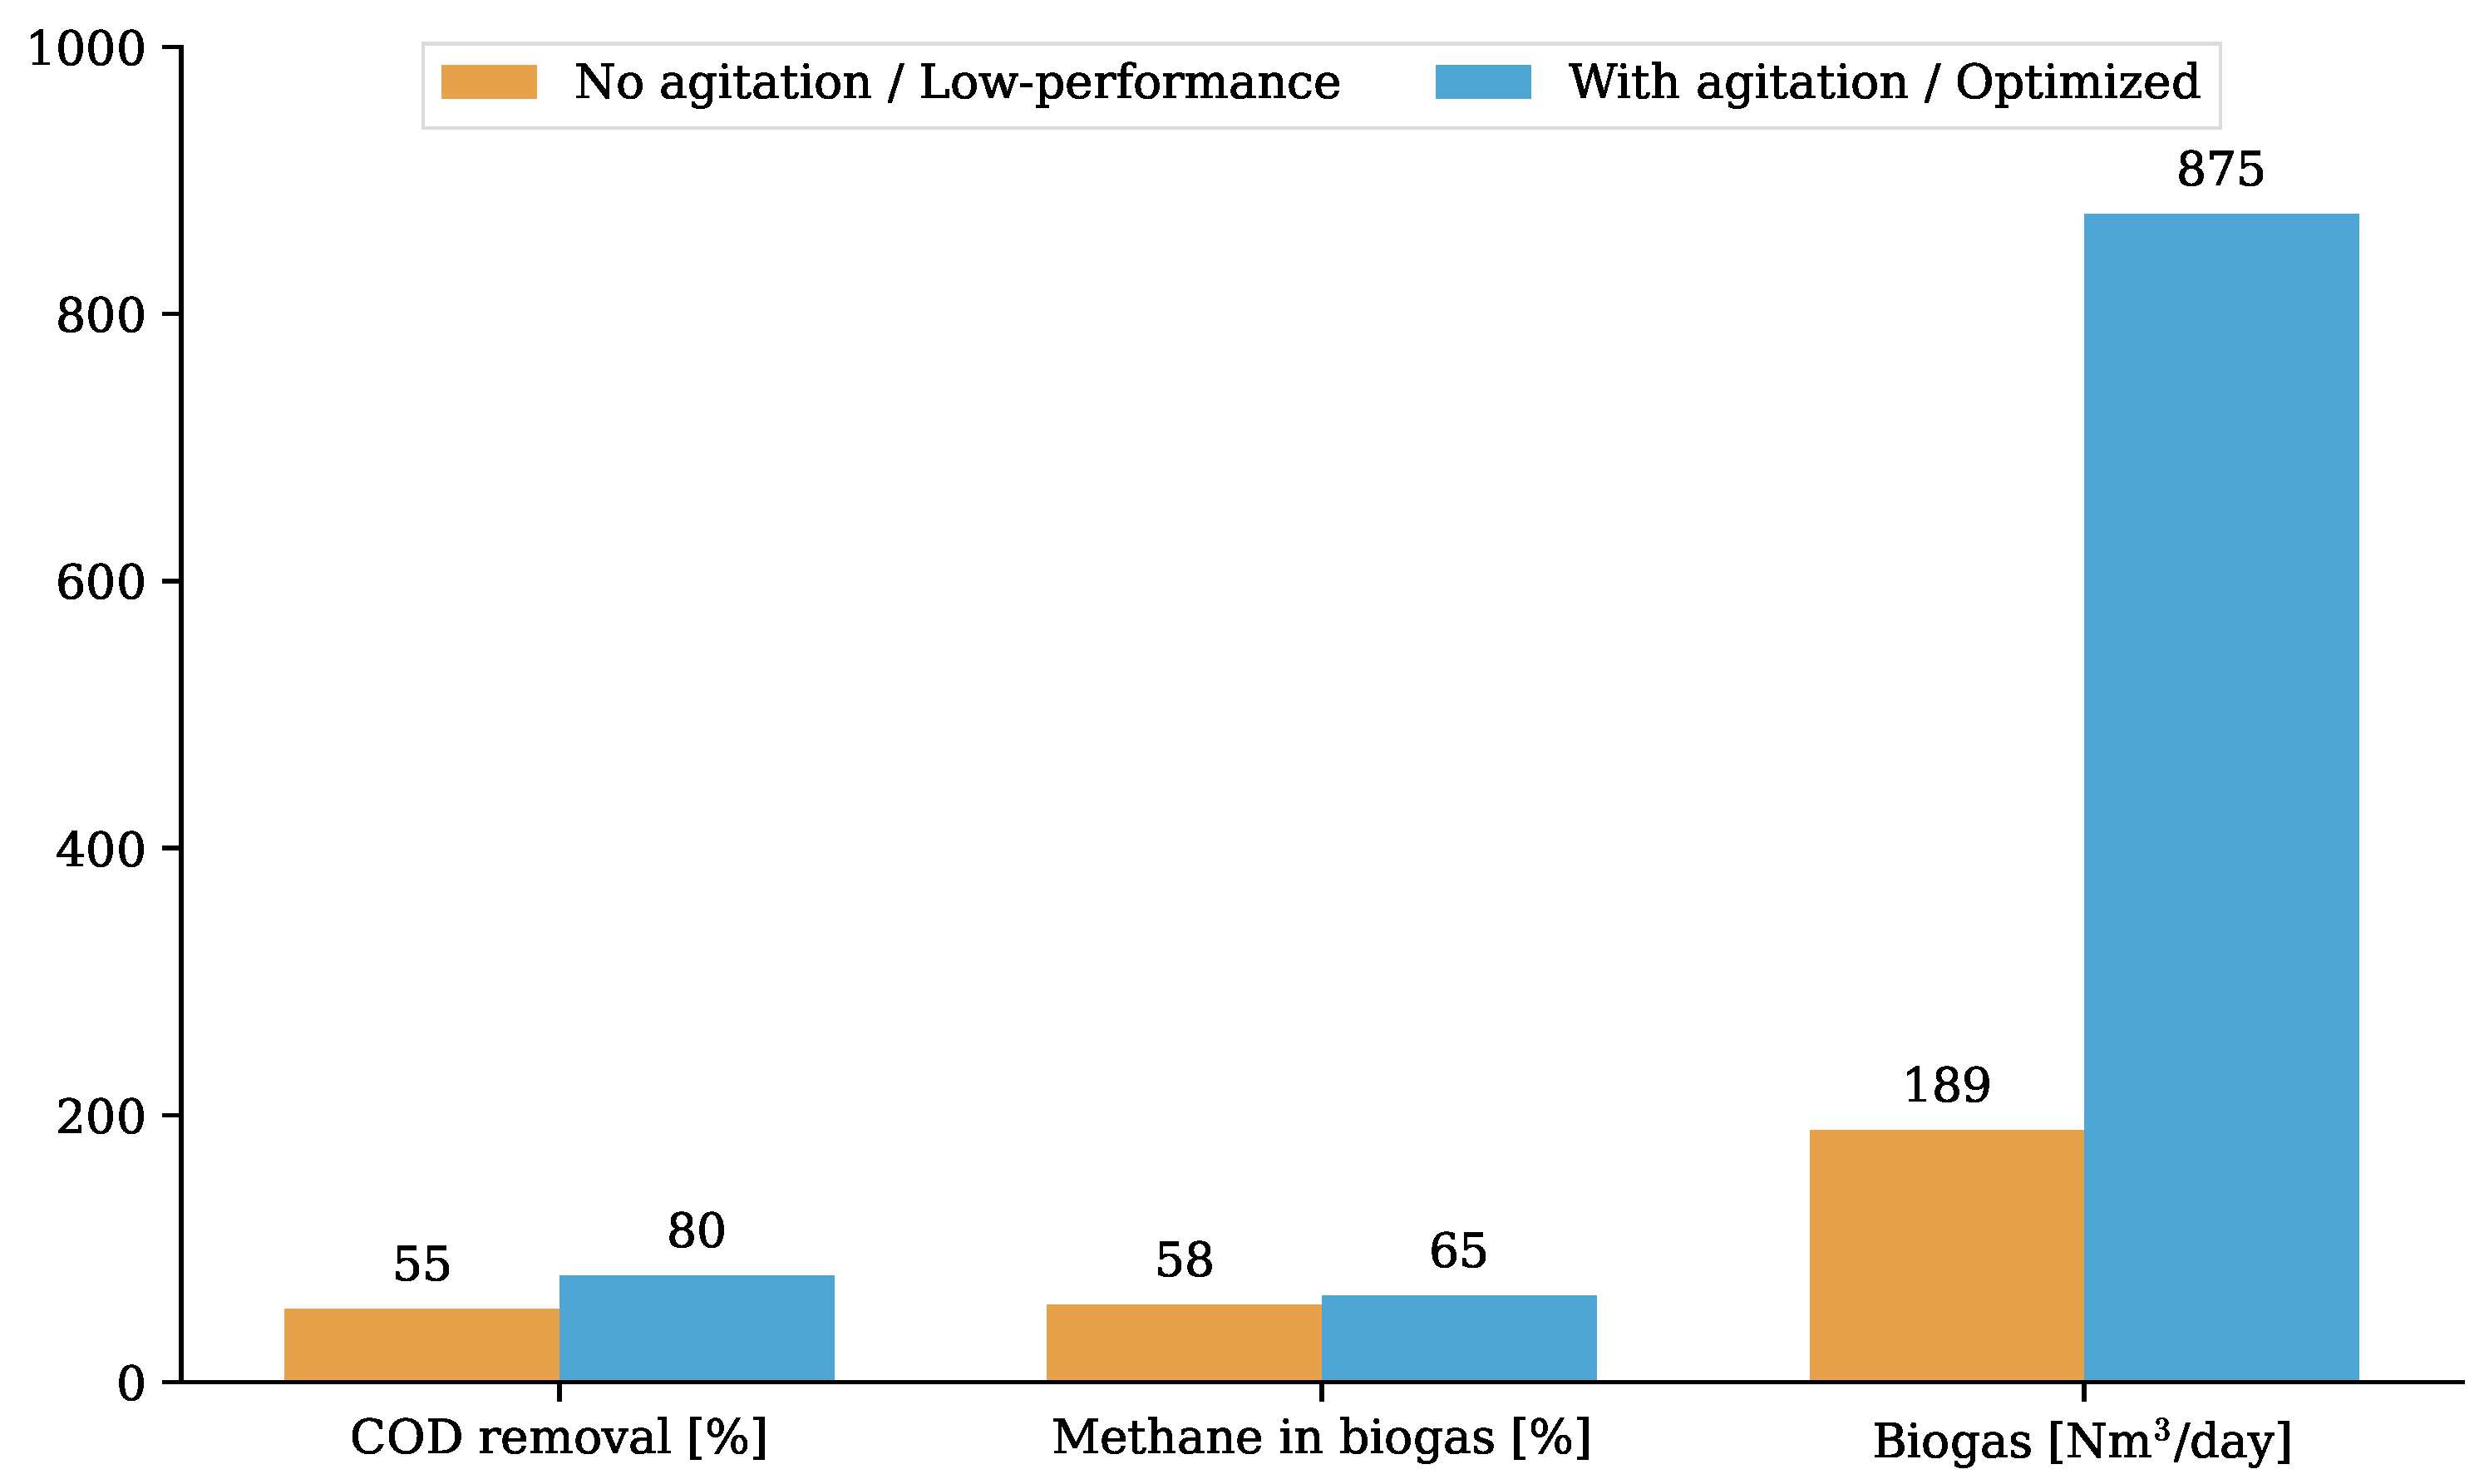
3 of biodigester volume, yielding a total required power of 75.6 kW. Four 20 kW lateral agitators were selected to promote more uniform mixing and reduce mechanical stress. The effect of agitation on process performance is illustrated in
Figure 2.
Under standard operating conditions, the daily biogas production is 875 Nm3 day−1. Assuming an average electrical conversion of 2 kWh per Nm3 of biogas, the system exhibits a theoretical electricity generation potential of approximately 1750 kWh day−1.
3.1. Economic Evaluation
The economic evaluation reports two cash-flow scenarios consistent with the techno-economic methodology described in
Section 2.10 and the sensitivity scenarios in
Section 3.6. The conservative scenario considers only direct revenues from electricity export and biofertilizer commercialization; the extended scenario additionally incorporates the avoided cost of grid electricity purchase and an explicit OPEX equal to 5% of CAPEX.
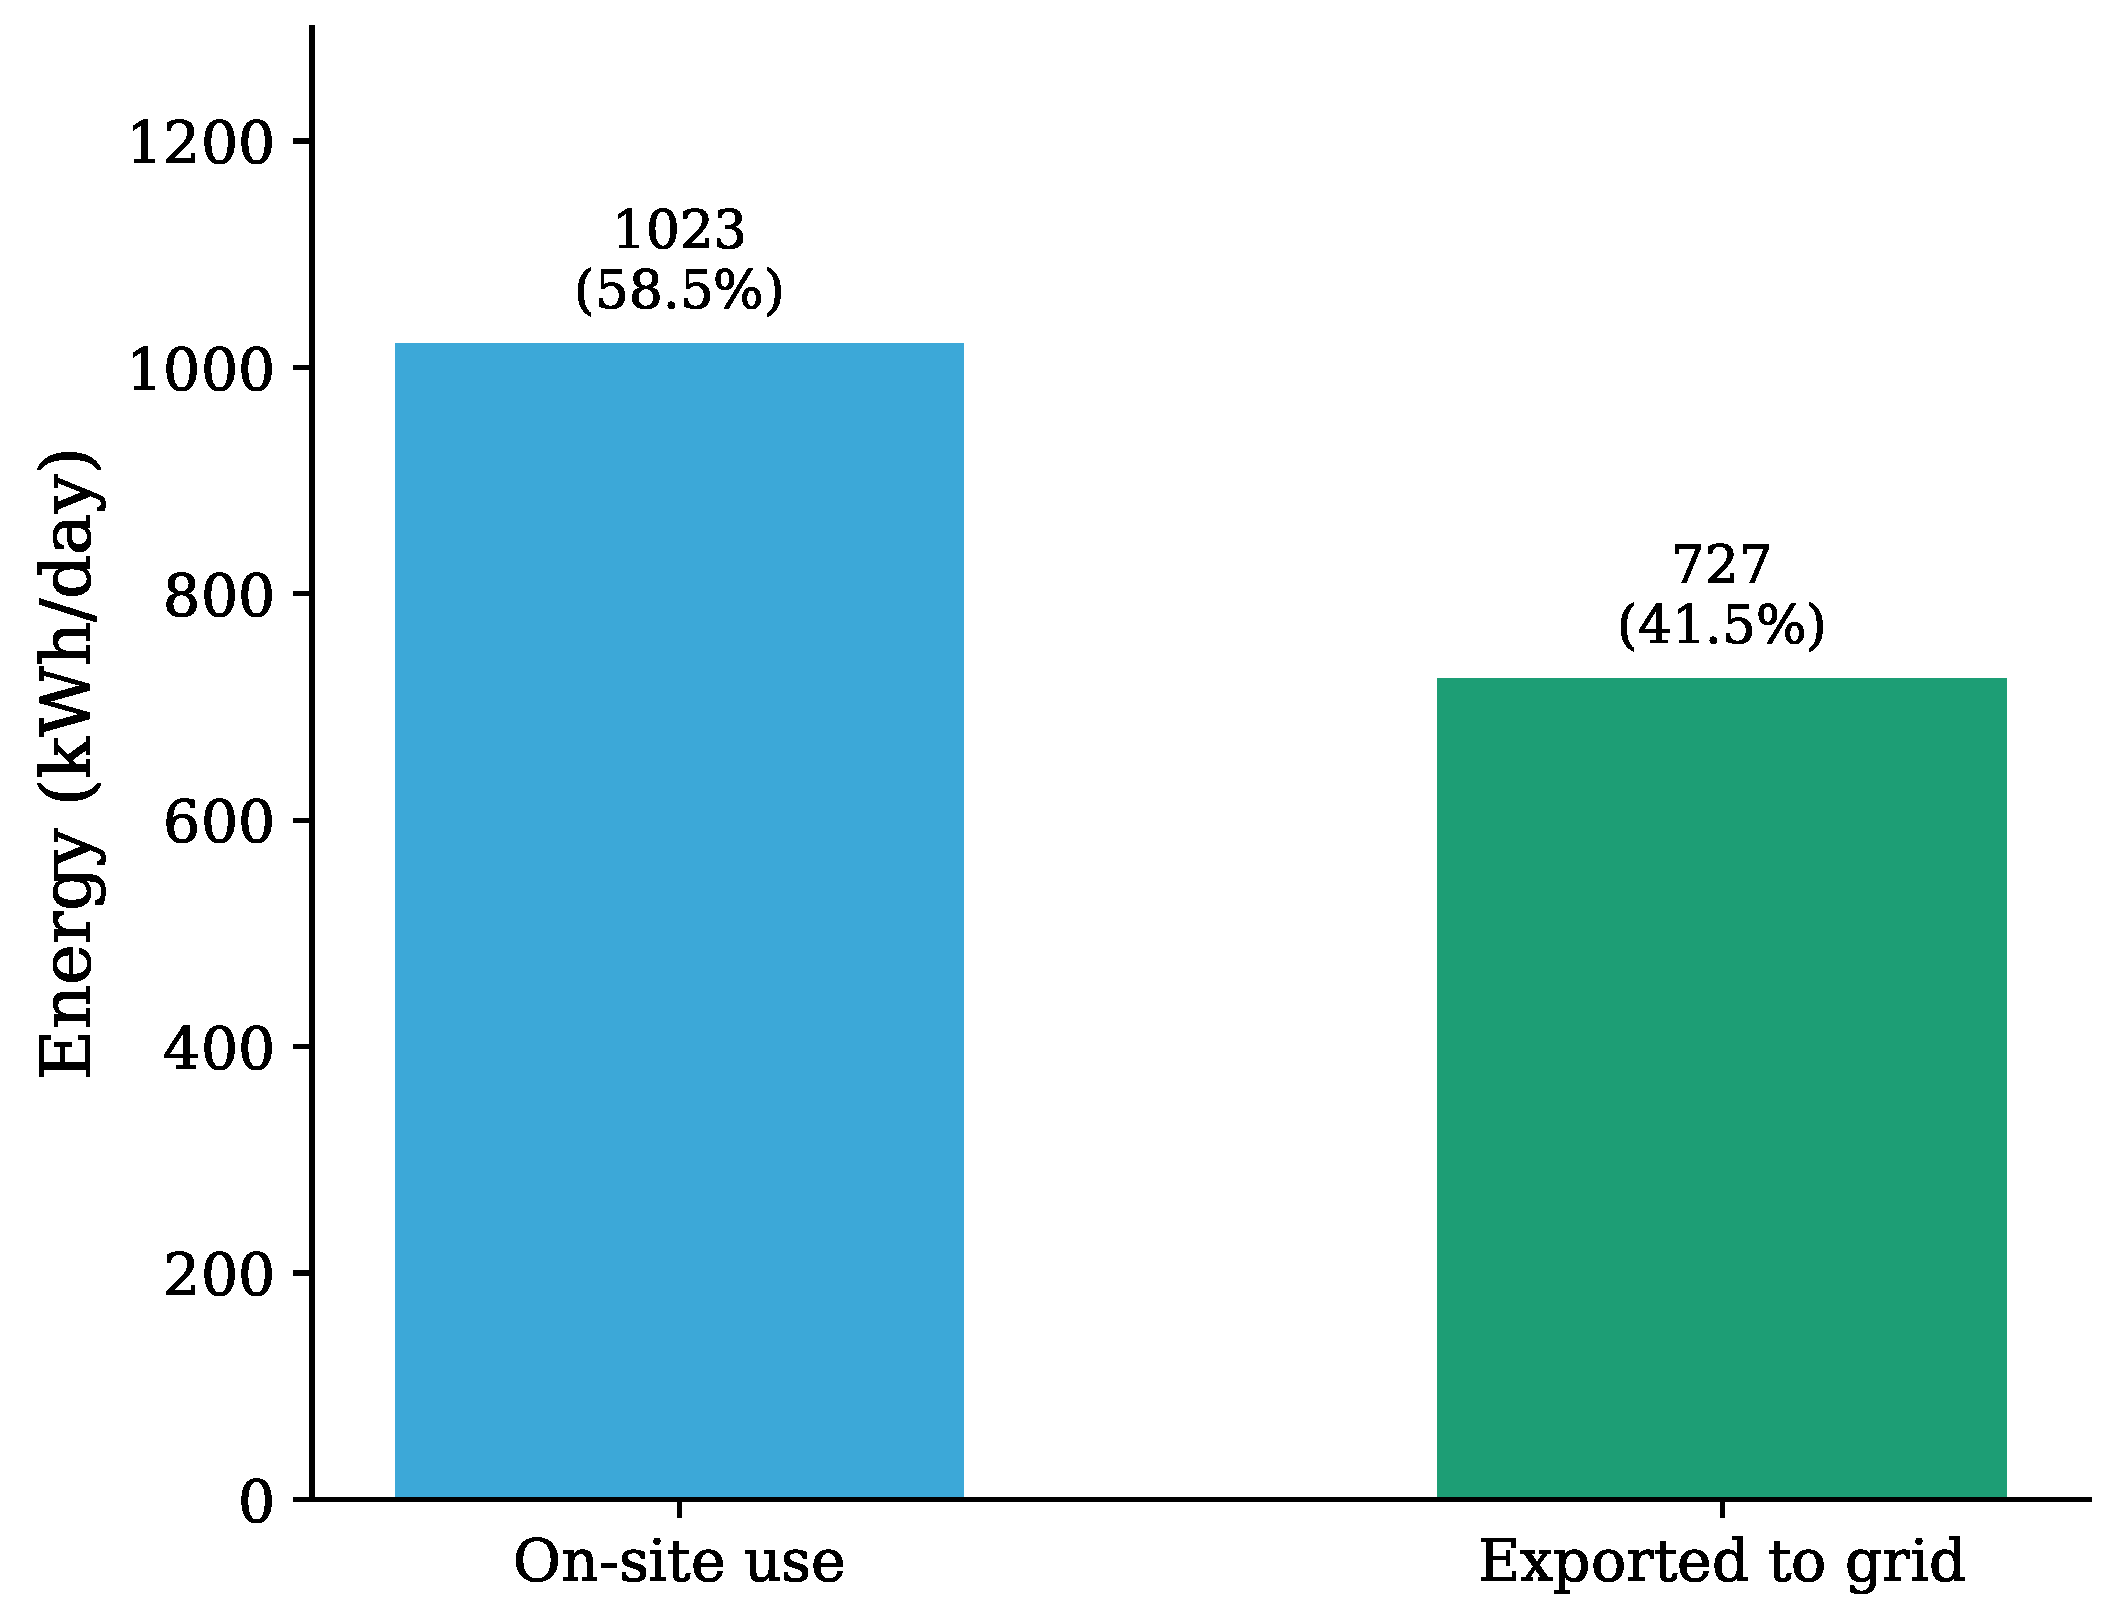
The system generates 1750 kWh day
−1 of electricity from biogas. Of this output, 1023 kWh day
−1 (58.5%) is consumed on-site by the finishing module and the biodigestion auxiliary equipment, and 727 kWh day
−1 (41.5%) is exported to the grid, equivalent to an exportable surplus of approximately 21,800 kWh month
−1 (
Figure 3). The biofertilizer output is 22.6 t day
−1 of digested sludge available for agricultural application. At an electricity tariff of
$0.24 kWh
−1 and a biofertilizer unit value of
$16 t
−1, the annual revenues are
$126,000 from on-site electricity (treated as avoided cost) and
$108,480 from biofertilizer commercialization, over 300 operating days per year. The remaining 65 days year
−1 are reserved for scheduled maintenance and contingency repairs.
The initial capital expenditure (CAPEX) is
$300,000. The conservative cash-flow scenario, which excludes the avoided-cost revenue and explicit OPEX, yields a Net Present Value of
$1,087,378.68 (
$1.09 million USD), an Internal Rate of Return of 32%, and a payback period of approximately 3 years over a 20-year project lifetime, with a discount rate of 8% and a 35% profit tax. The NPV-to-CAPEX ratio is 3.6. The extended cash-flow scenario, which incorporates the avoided cost of grid electricity purchase and an OPEX of 5% of CAPEX, yields an updated NPV of approximately
$1.85 million USD, analyzed in the multivariate sensitivity assessment presented in the Discussion (
Section 4).
3.2. Environment and Circular Economy
This subsection reports the environmental and circular-economy output flows of the proposed system. The interpretation of these results, their comparison with the literature, and the analysis of trade-offs are developed in
Section 4.
3.2.1. GHG Mitigation Through Biogas Capture and Use
Assuming a methane fraction of 60% in the produced biogas, which is typical for swine slurry digestion systems, and considering a methane density of
, the daily methane mass captured was estimated using
Equation (S11) of the Supplementary Material. For
,
, and
, the estimated methane capture was approximately
.
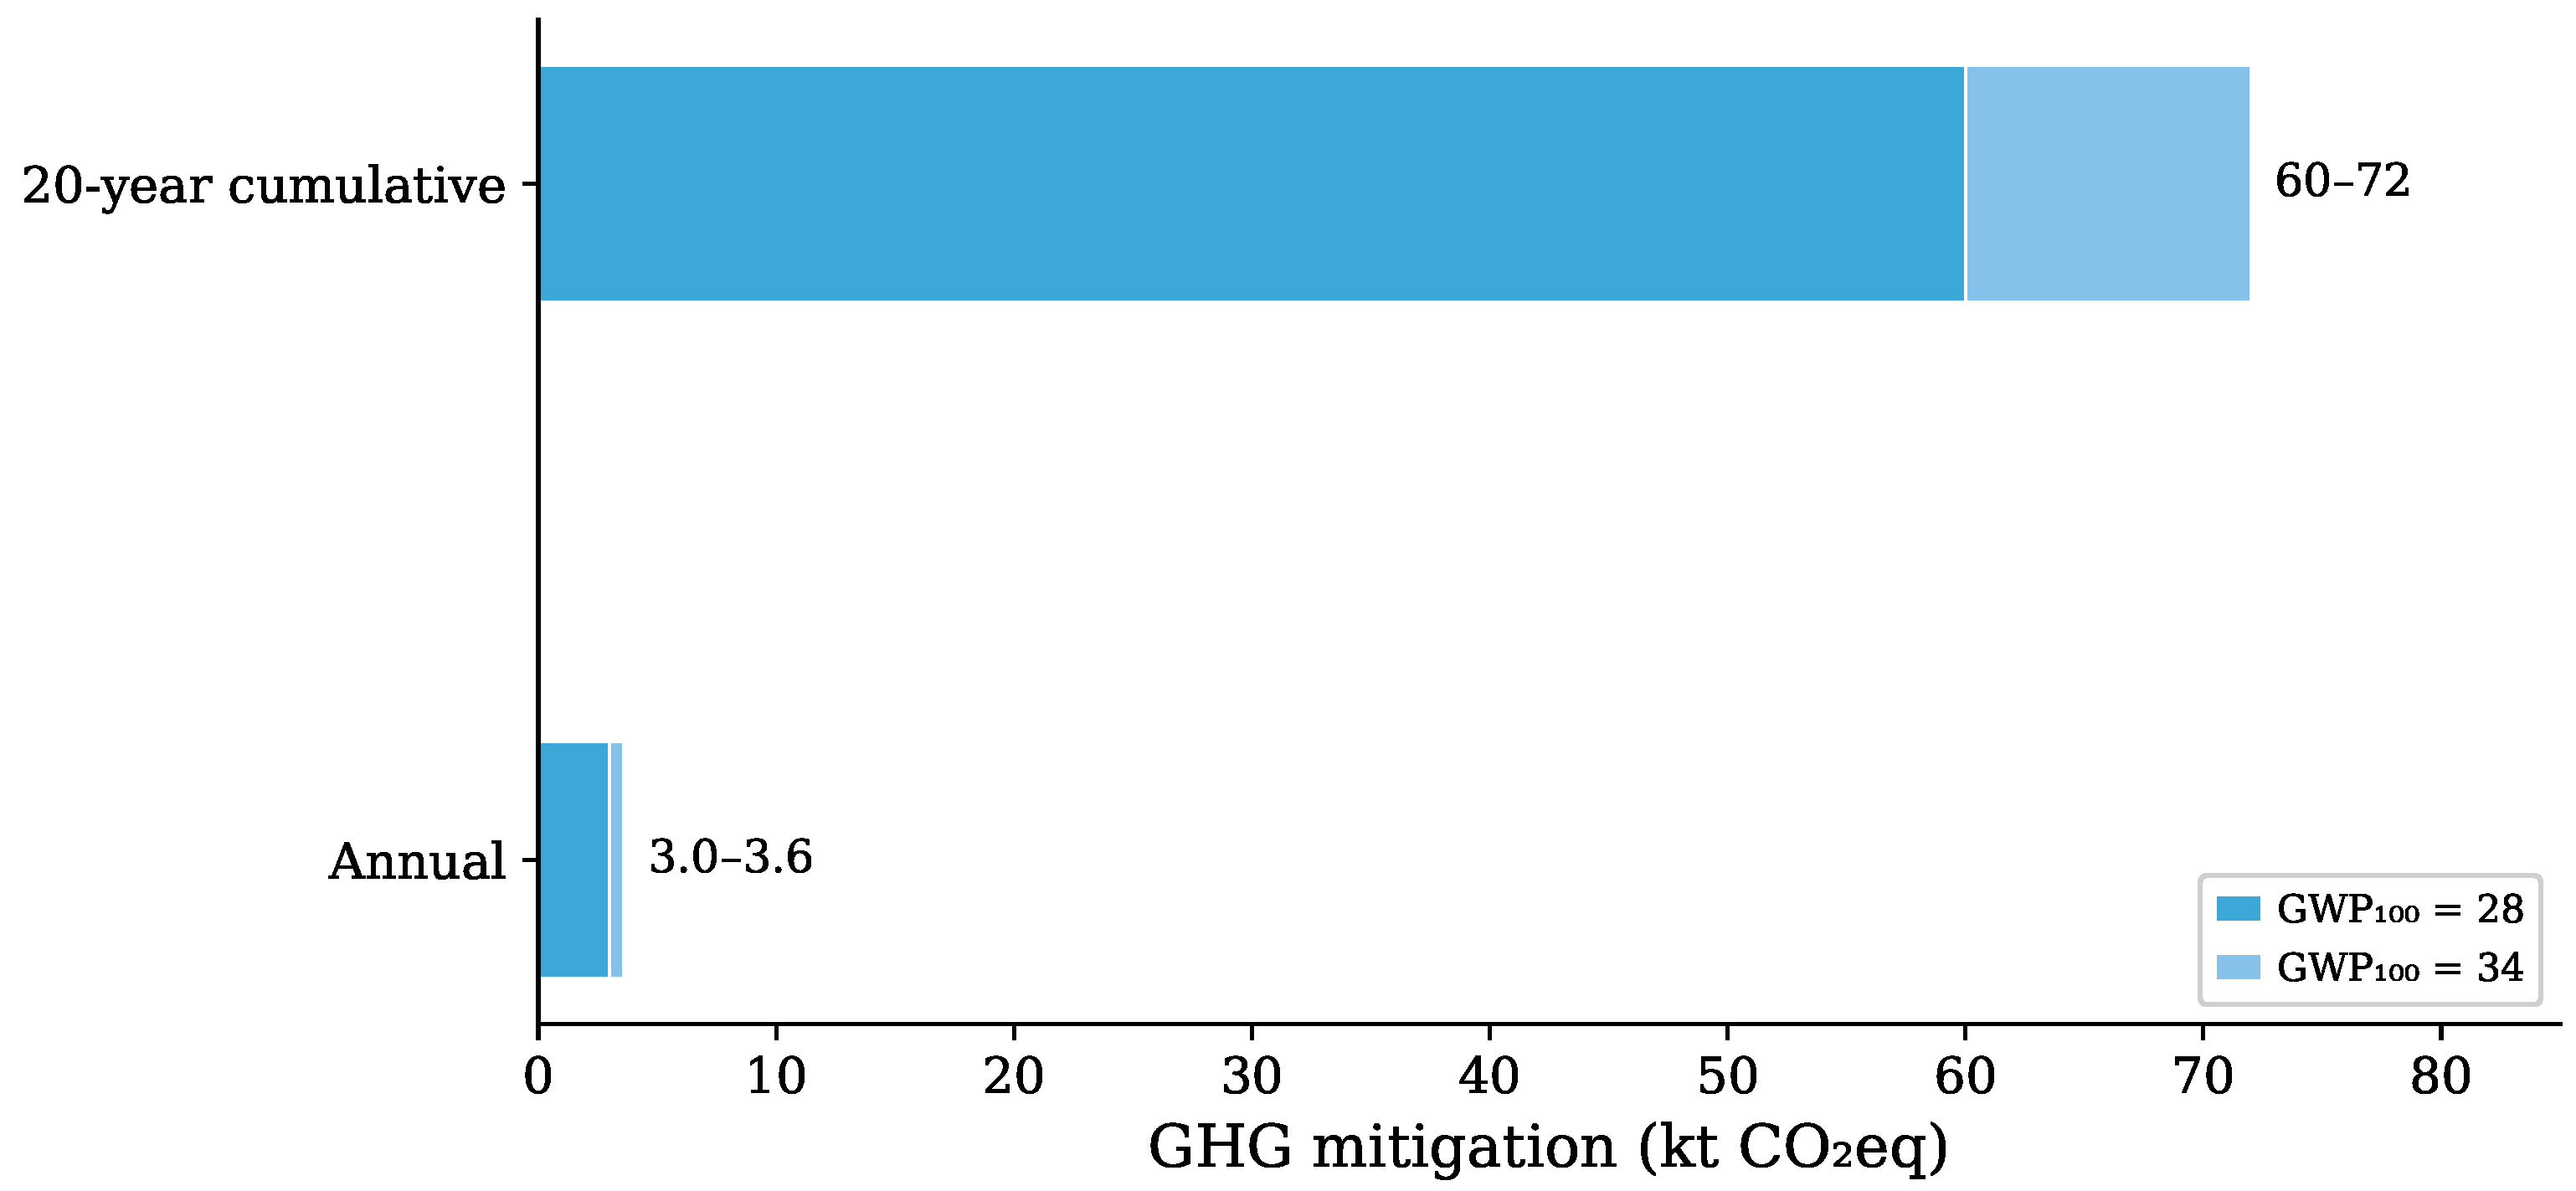
The equivalent greenhouse gas mitigation potential was calculated using
Equation (S12) of the Supplementary Material, based on the 100-year global warming potential of methane. Using a range of
–34, the estimated avoided emissions ranged between
and
. Assuming 300 operating days per year, the corresponding annual mitigation potential was approximately
–
. Over an operational period of 20 years, the cumulative greenhouse gas mitigation potential was estimated at approximately 60–
, as illustrated in
Figure 4.
3.2.2. Effluent Treatment Compliance
The treatment train comprising the biodigester, the facultative lagoon, and the subsurface-flow wetland achieves a discharge BOD below 90 mg L−1, complying with the Cuban permissible limit for Class B receiving bodies. The treated effluent volume available for potential agricultural reuse is 113.4 m3 day−1.
3.2.3. Digestate Output
The biodigestion process generates approximately 22.6 t day
−1 of liquid–solid digestate available for agricultural application. The equivalent fertilizer substitution potential was estimated using
Equation (S13) of the Supplementary Material and is reported quantitatively in the circular economy indicators (
Section 3.5).
3.2.4. Daily Energy Output and Self-Consumption
The system generates 1750 kWh day−1 of electricity, of which 1023 kWh day−1 (58.5%) covers the on-site demand of the finishing module and the auxiliary equipment of the biodigestion system, and 727 kWh day−1 (41.5%) constitutes an exportable surplus.
3.3. Life Cycle Assessment Results
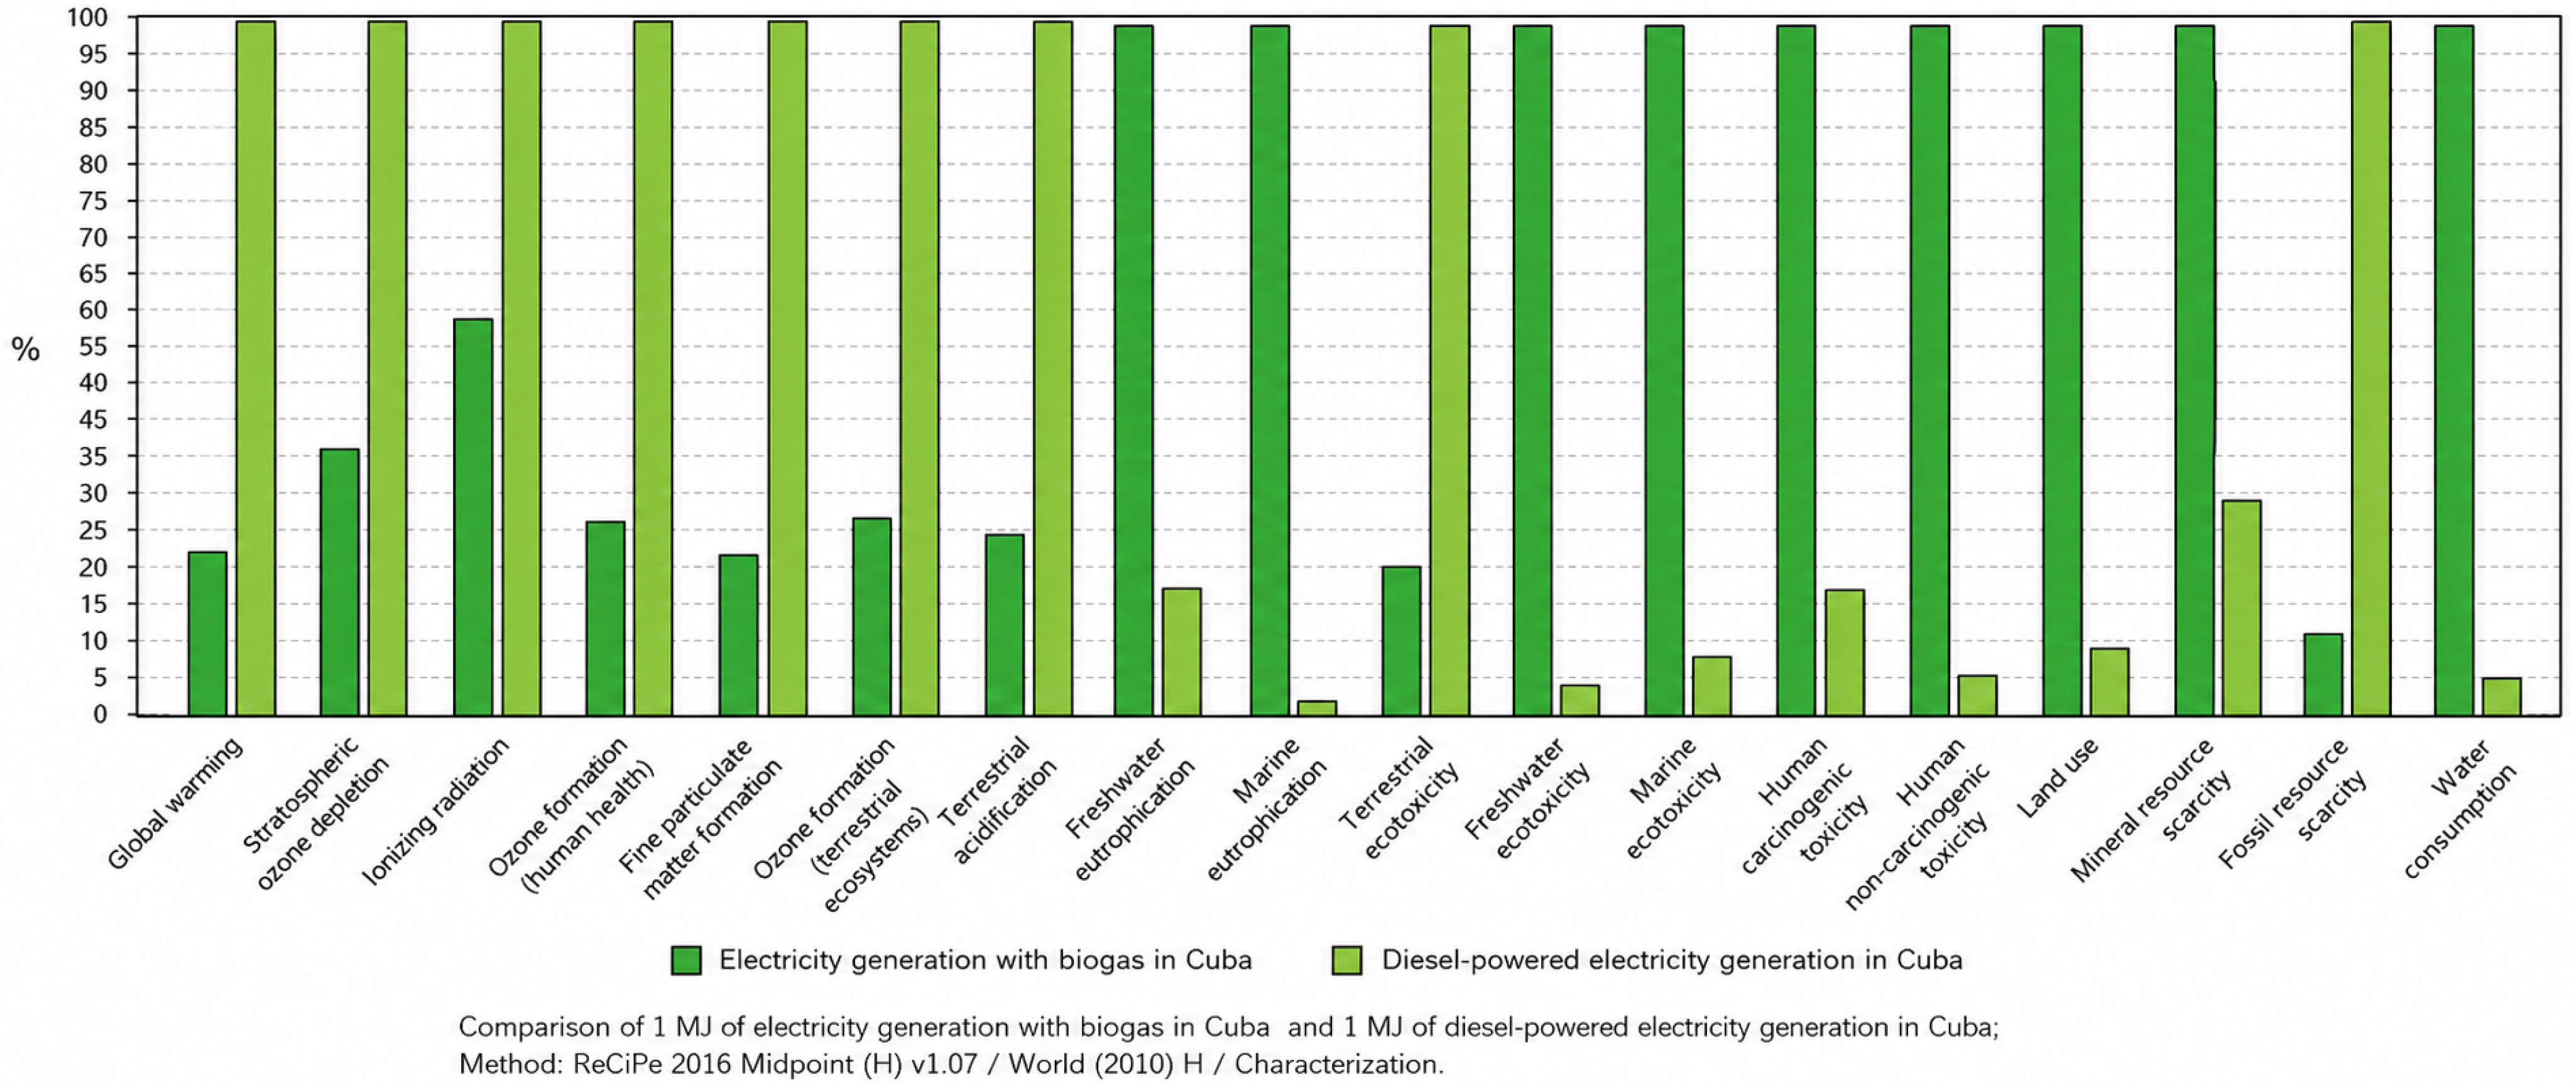
Figure 5 shows the comparison of the potential environmental impacts associated with generating 1 MWh of electricity from biogas and conventional diesel in Cuba, obtained using the ReCiPe 2016 Midpoint (H) method.
The full set of characterized values for the eighteen ReCiPe 2016 Midpoint (H) categories is reported in
Figure 5. For the climate change category, the biogas scenario yields 353 kg CO
2 eq MWh
−1 and the diesel scenario yields
kg CO
2 eq MWh
−1. In the categories of fine-particulate-matter formation, tropospheric ozone formation, terrestrial acidification, and fossil resource scarcity, the biogas scenario shows lower characterized values than the diesel scenario; in the categories of stratospheric ozone depletion, ionizing radiation, freshwater and marine eutrophication, terrestrial, freshwater and marine ecotoxicity, human carcinogenic and non-carcinogenic toxicity, land use, and water consumption, the biogas scenario shows higher characterized values than the diesel scenario. The interpretation of these contrasts, the analysis of the underlying processes responsible for each trade-off, and the comparison with the literature are developed in
Section 4.
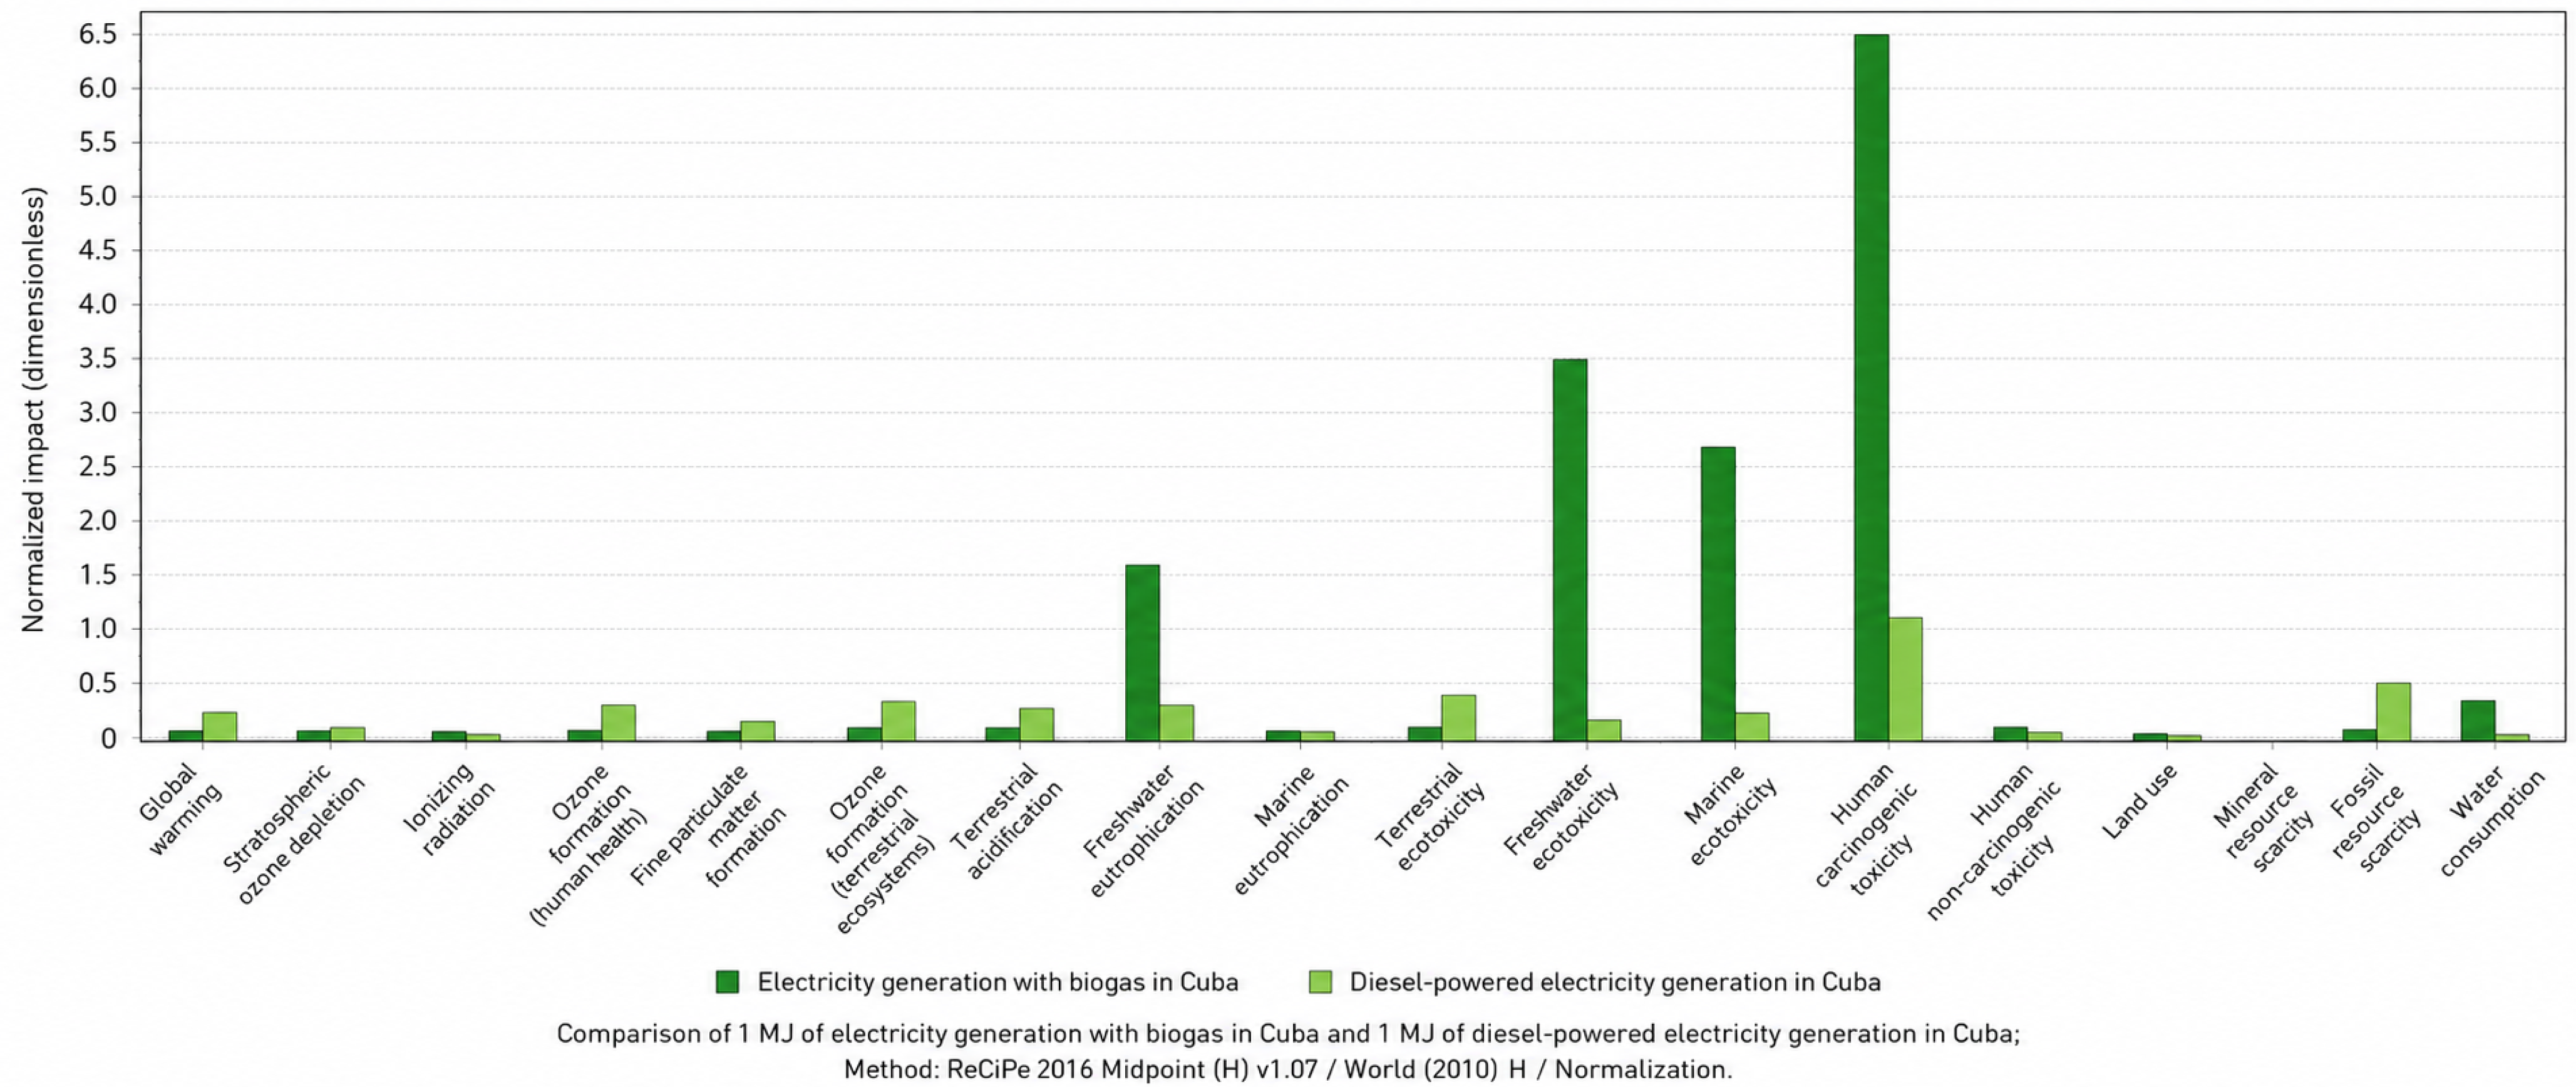
The normalized results for the same eighteen Midpoint (H) categories are presented in
Figure 6. These normalized values are reported here to support the comparative magnitude of the impacts across categories on a common reference scale; their analytical interpretation is developed in
Section 4.
The main environmental and circular economy indicators of the proposed system are summarized in
Table 6. These indicators include the estimated biogas and methane capture, avoided greenhouse gas emissions, digestate generation, effluent compliance after wetland polishing, and renewable energy potential.
3.4. Mass Balance and Material Valorization
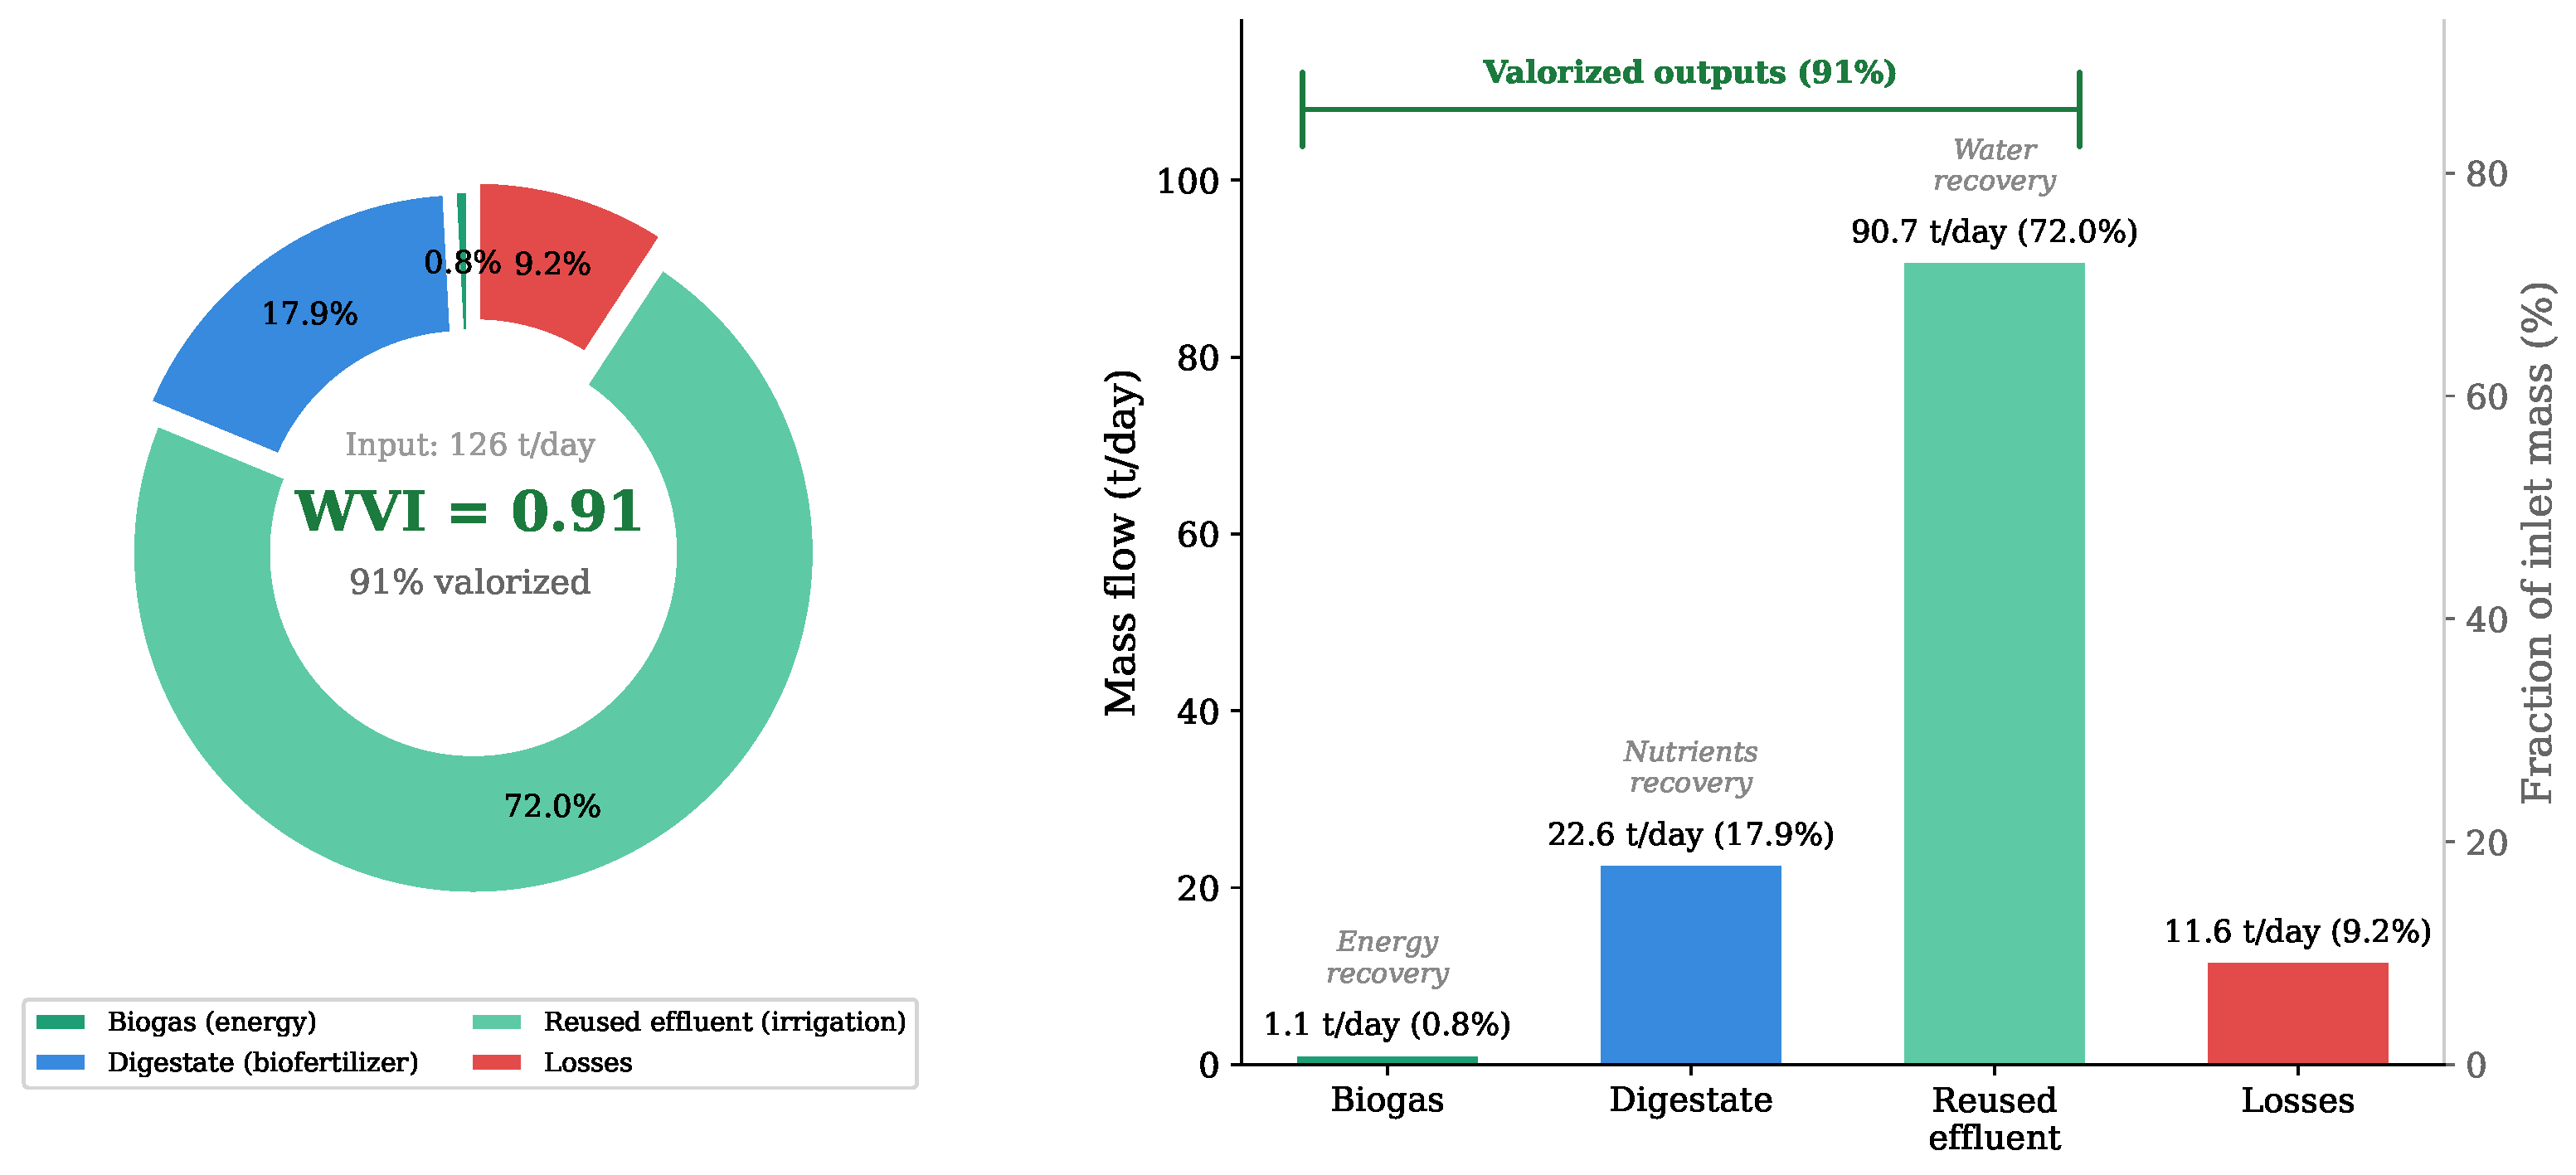
To visualize the distribution of the system’s mass flows and assess the degree of material valorization,
Figure 7 presents the mass balance of the proposed biodigester. The left panel shows the composition of the Waste Valorization Index (WVI) using a doughnut chart, while the right panel presents the daily mass flows in stacked bars with a dual axis (t/day and percentage of the input mass).
The treated effluent reused for irrigation constitutes the dominant fraction of the valorized mass (72.0%), followed by the digestate intended for agricultural application (17.9%) and biogas (0.8%). System losses, associated with fugitive emissions, unrecovered sludge, and the fraction of effluent not reused, account for only 9.2% of the total input mass. Under the assumption of 80% effective effluent reuse, the system transforms more than 90% of the input stream into products with energy, agronomic, or water value.
3.5. Circular Economy Indicators
Applying Equations (
9)–(
17), as defined in
Section 2.12, to the operational and design parameters summarized in
Table 4 and
Table 5, the quantitative values of the proposed circular economy indicators were obtained.
Table 7 presents the calculated results for each indicator, including the corresponding symbol, equation reference, numerical value, unit, and physical interpretation. The system achieves net energy self-sufficiency, a high degree of waste valorization, significant GHG mitigation potential, substantial nutrient recovery through fertilizer substitution, and positive water-cycle closure performance.
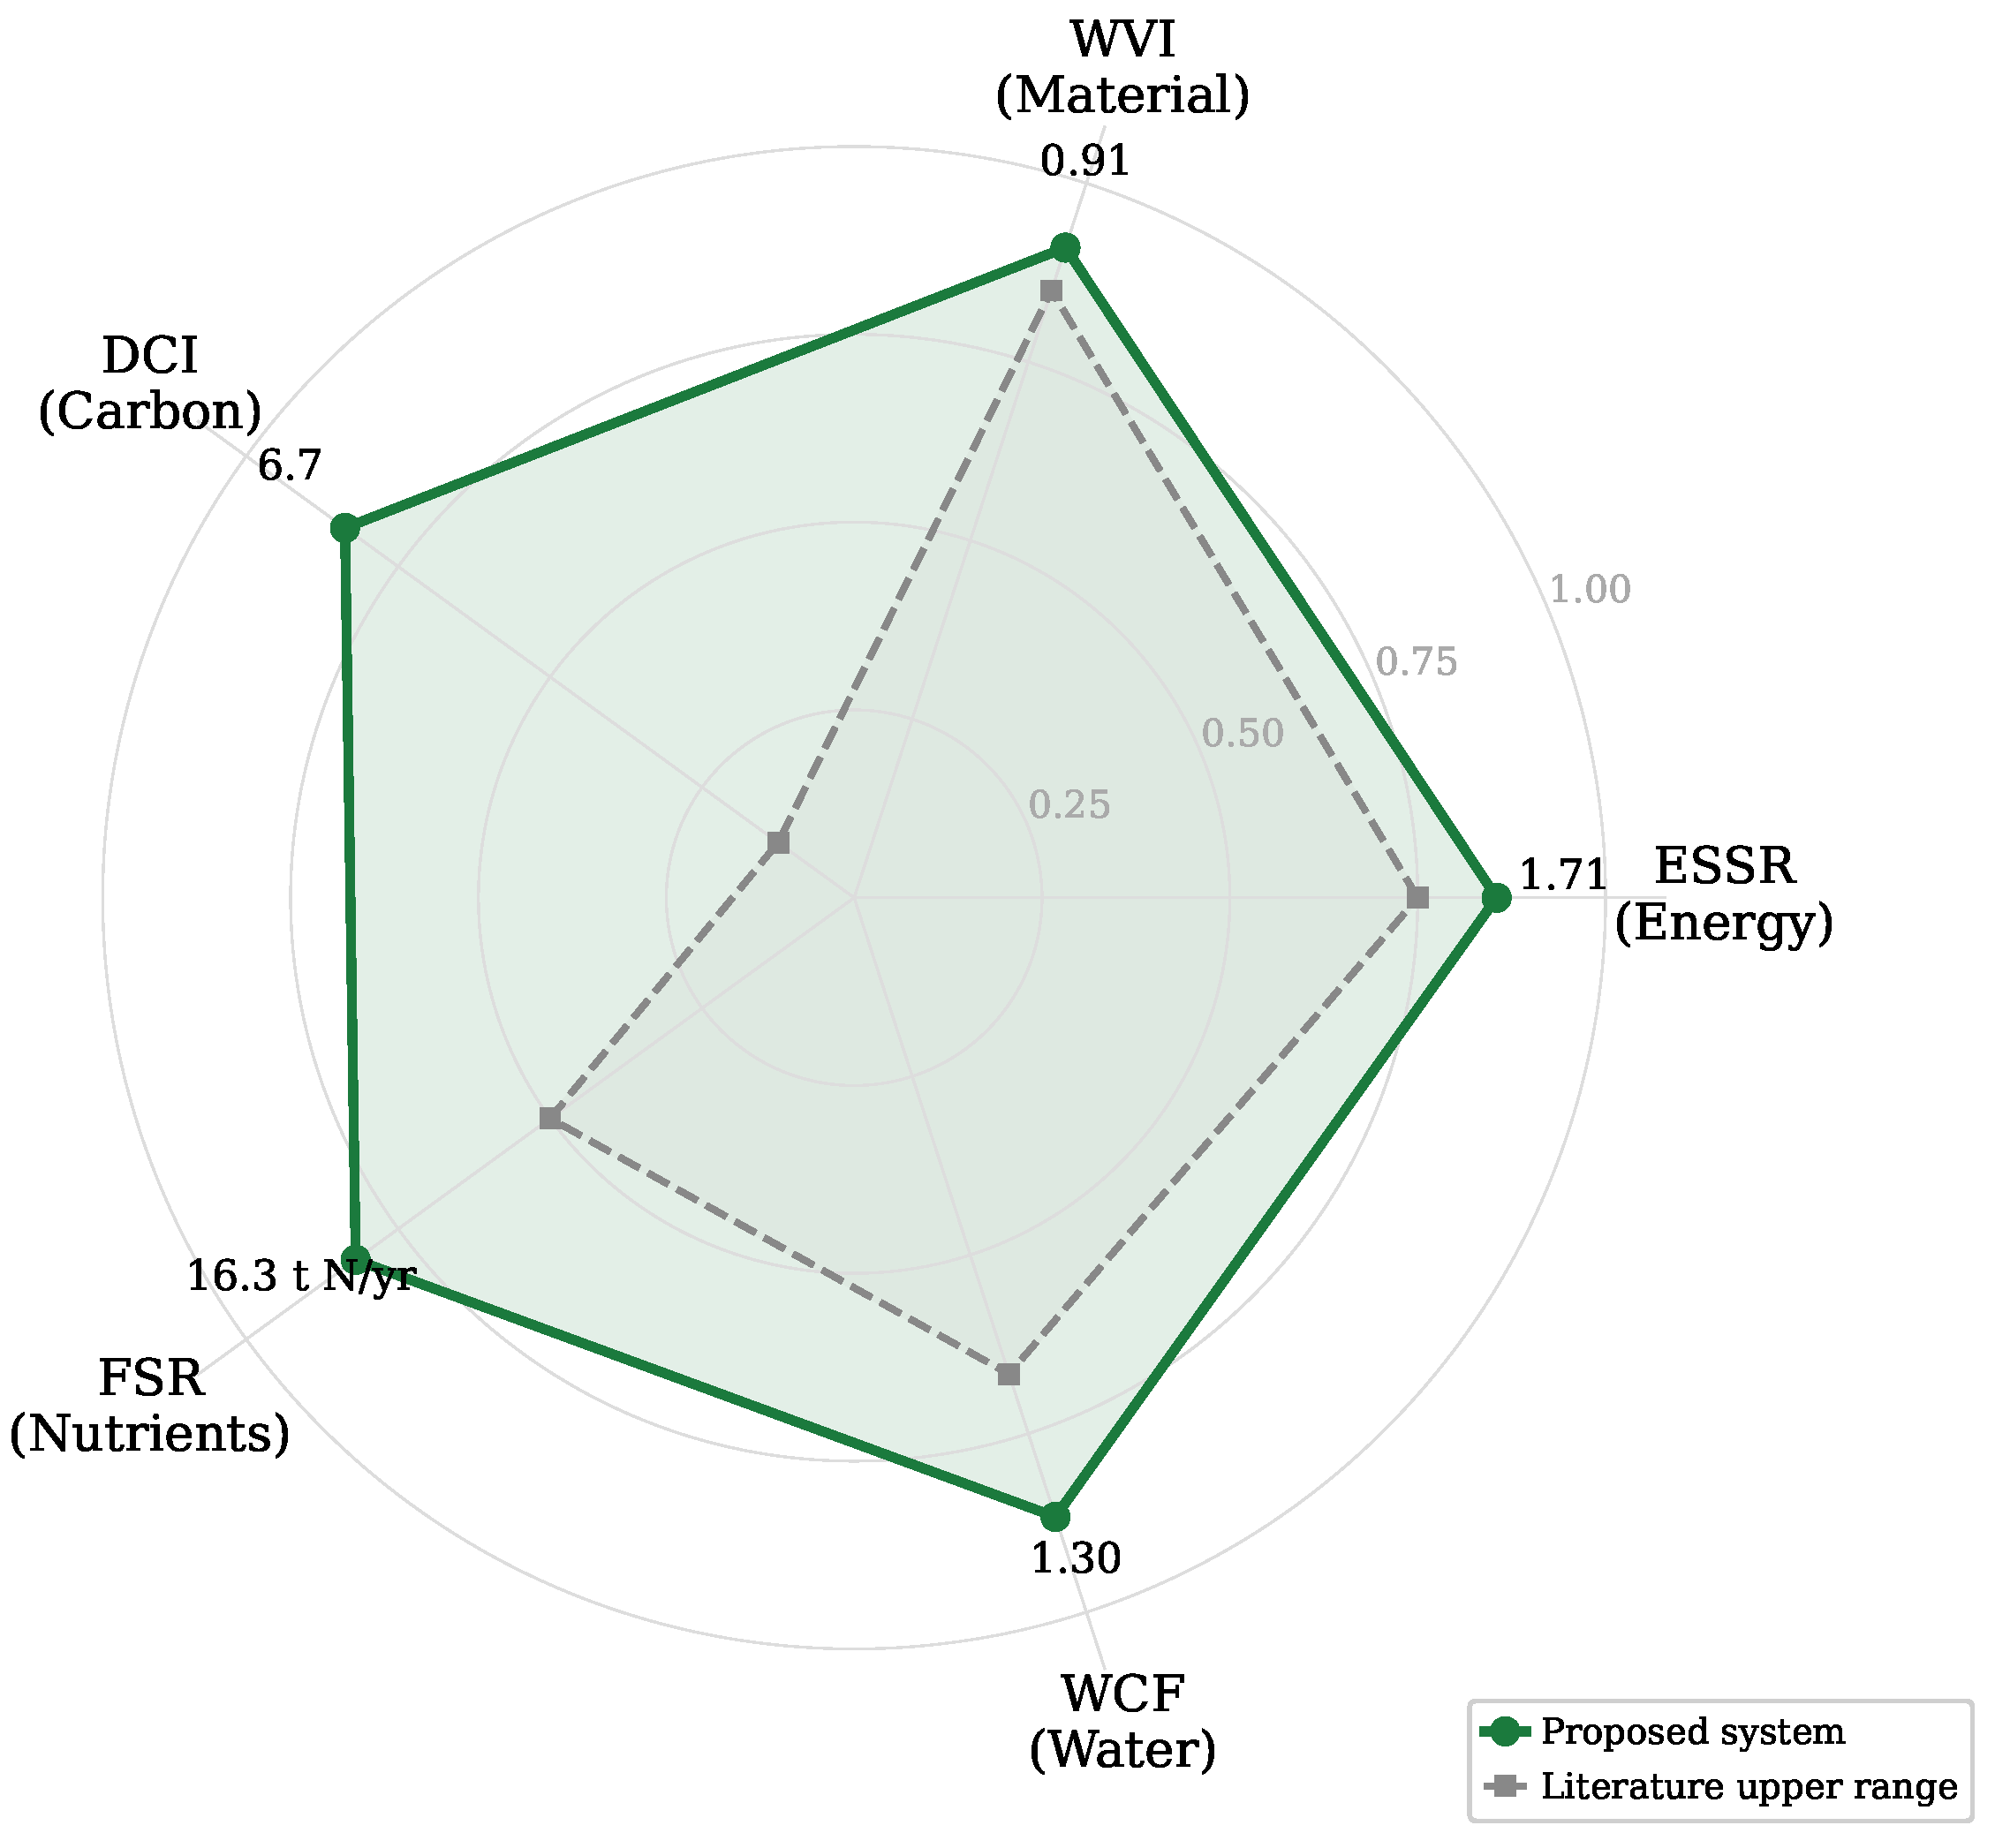
The five indicators exceed the threshold values associated with self-sufficiency or cycle closure. An ESSR of 1.71 indicates that the system generates 71% more electricity than it consumes, producing a daily exportable surplus of 727 kWh. A WVI of 0.91 confirms that 91% of the input mass (126 t day−1) is converted into products with energy, agronomic, or water value. A DCI of 6.7 demonstrates that for every kg of CO2eq attributable to system operation, approximately 6.7 kg CO2eq are avoided through methane capture and displacement of fossil electricity. The FSR shows that the digestate can substitute 16.3 t N year−1, 4.1 t P2O5 year−1, and 12.2 t K2O year−1 of synthetic fertilizers. A WCF of 1.30 indicates that the system returns 30% more water to productive agricultural use than the freshwater consumed for dilution.
Figure 8 presents a radar diagram with the five indicators normalized to a 0–2 scale to facilitate visual comparison of the circularity performance of the proposed system with typical values reported for anaerobic digestion systems in temperate climates.
The proposed system outperforms the temperate reference values across all evaluated dimensions, with particularly marked differences in DCI (6.7 vs. ∼2.0 in literature) and ESSR (1.71 vs. ∼0.8–1.2).
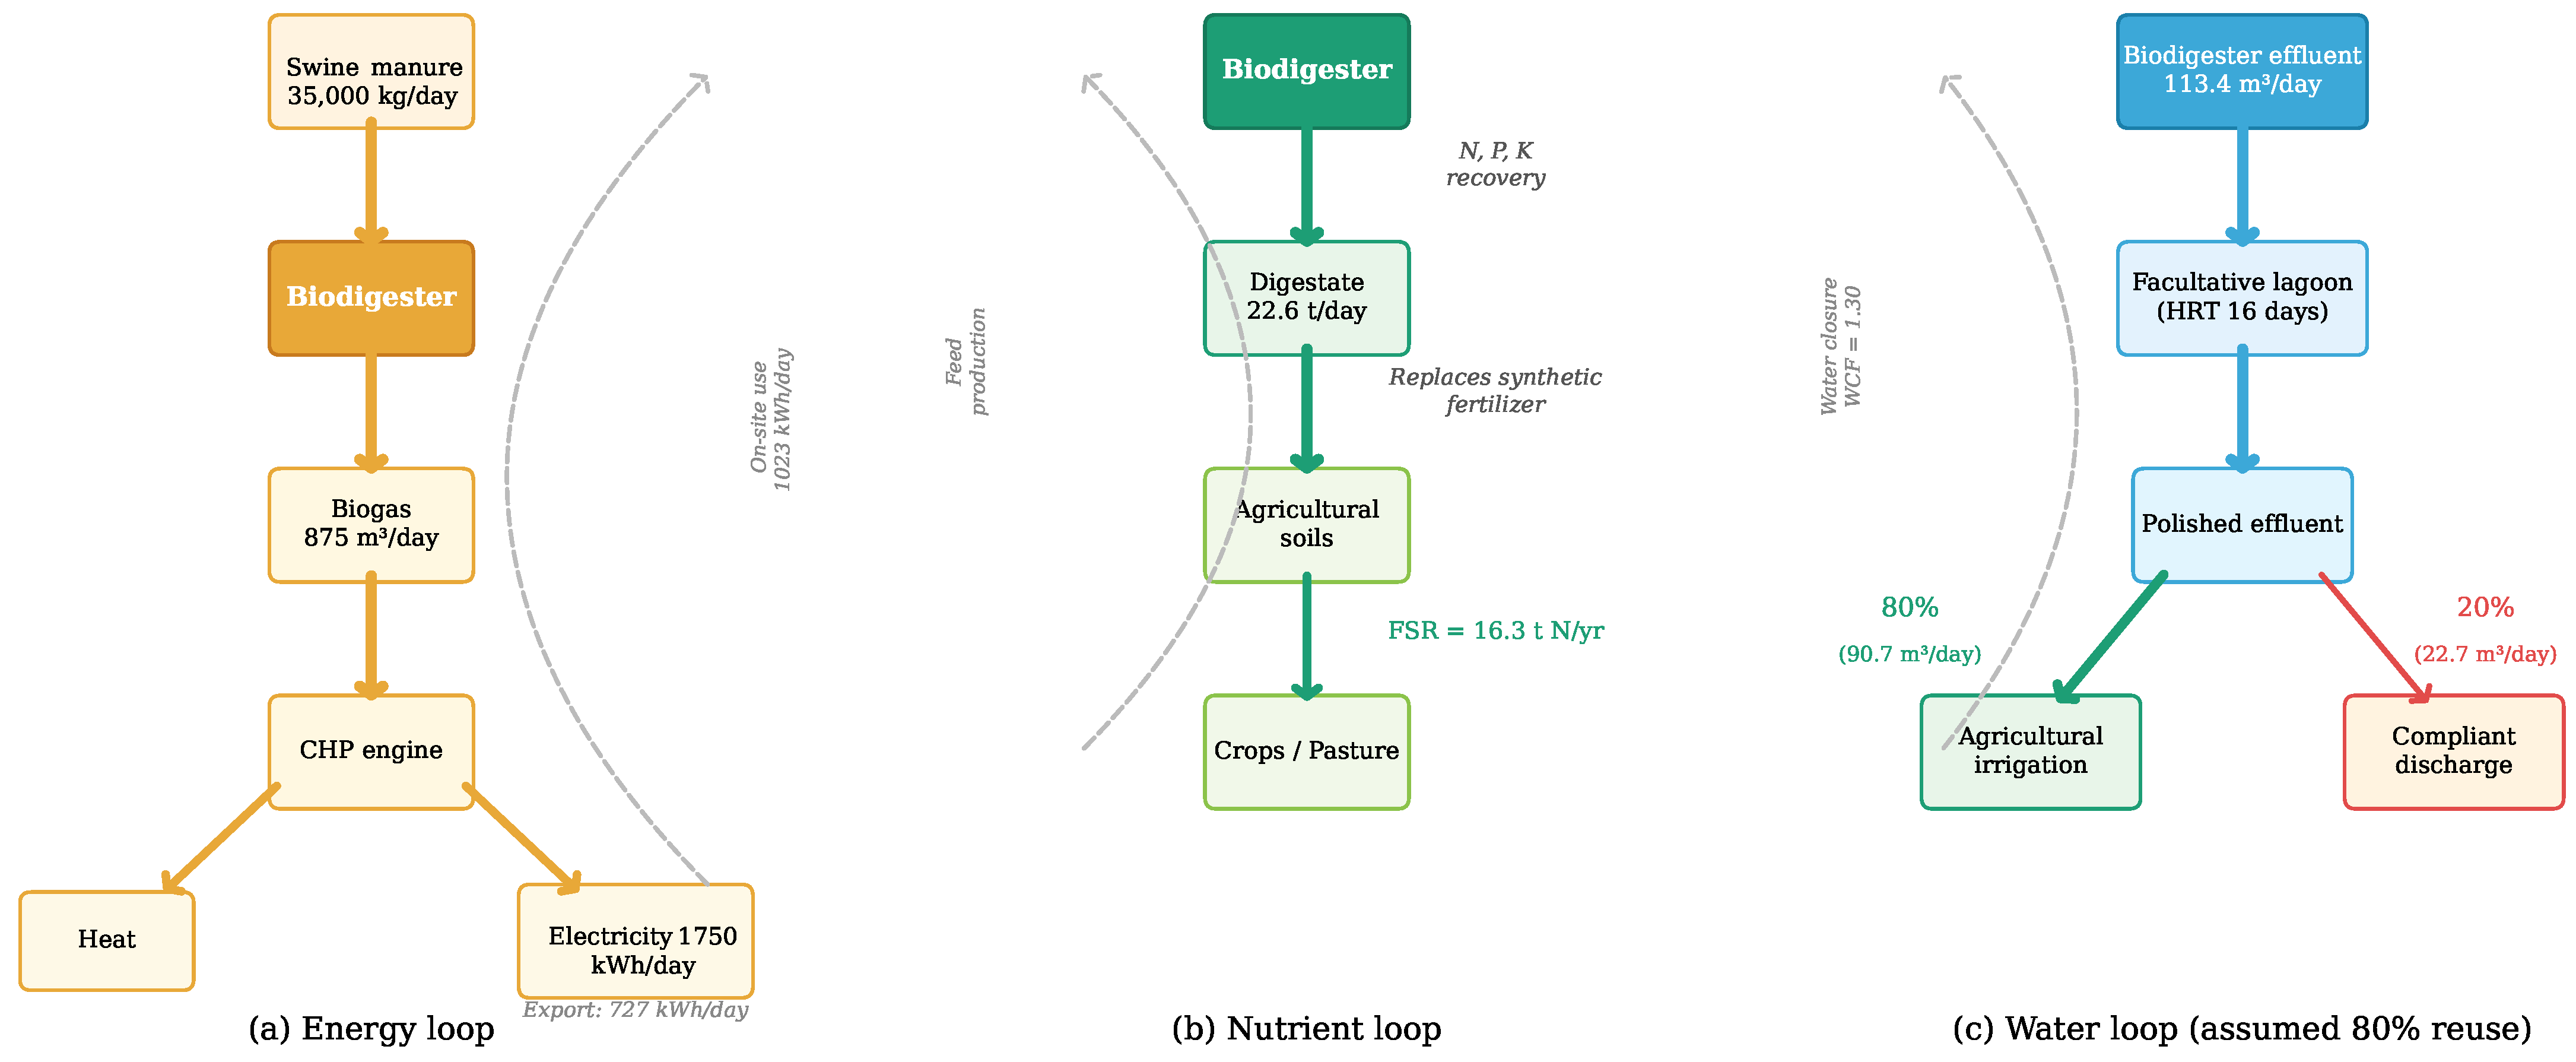
Figure 9 illustrates the integrated circular economy flows of the proposed anaerobic digestion system. The diagram highlights the three main loops: (i) energy conversion from biogas to electricity and heat, (ii) nutrient recycling through digestate application as biofertilizer, and (iii) water reuse via effluent polishing and agricultural irrigation.
The integrated visualization in
Figure 9 confirms the simultaneous operation of the energy, nutrient and water loops at the system boundary. The analytical interpretation of these loops, the underlying conditions that enable each one, and the comparison with the literature are developed in
Section 4.
3.6. Univariate Sensitivity Analysis
A univariate sensitivity analysis was conducted to evaluate the influence of key operational and market-related parameters on the economic performance of the proposed covered lagoon biodigester system. The selected variables included biogas production, electricity price, biofertilizer market value, and annual operating days, since these parameters directly affect the annual revenues associated with electricity generation and digestate valorization. Each parameter was independently varied by relative to the baseline scenario, while all remaining variables were maintained constant in order to isolate the effect of each parameter on project profitability.
The baseline conditions adopted in the analysis were a daily biogas production of , an electrical conversion yield of of biogas, an electricity price of , a daily biofertilizer production of , a biofertilizer market value of , and an annual operation period of 300 days.
The annual income from electricity generation, the annual income from biofertilizer valorization, the total annual income, and the recalculated Net Present Value used for each sensitivity scenario are presented as
Equations (S14)–(S17) of the Supplementary Material.
The sensitivity analysis showed that electricity price and biogas yield exert the strongest influence on the NPV, since both parameters directly affect the amount and value of electricity generated (
Table 8). Annual operating days also showed a significant effect because they influence both electricity and biofertilizer revenues simultaneously. In contrast, the biofertilizer value had a comparatively lower but still relevant influence on the project economics. These results indicate that maintaining stable biogas production, ensuring favorable electricity tariffs, and maximizing annual operating availability are critical factors for preserving the economic attractiveness of the proposed system.
The sensitivity results also indicate that the favorable economic performance is not dependent on a single optimistic assumption. Although the electricity price has the strongest effect on project profitability, the system remains economically attractive under the low-price scenario considered. A reduction in the number of annual operating days decreases revenues from both electricity generation and biofertilizer valorization simultaneously, making operational availability an important factor for financial performance. By contrast, the biofertilizer value has a smaller influence on the overall results, because electricity-related benefits represent the dominant revenue stream.
The favourable economic performance of the base case (NPV = USD 1.09 million, IRR = 32%, payback ≈ 3 years) is not contingent on a single optimistic assumption. Three independent conservatism factors are embedded in the baseline itself: (i) the specific biogas yield was set at 0.025 m
3 kg
−1 of raw excreta, which corresponds to the lower bound of the 0.02–0.04 m
3 kg
−1 range reported for swine manure under mesophilic conditions; (ii) the biofertilizer unit value was set at USD 16 t
−1, the lower bound of the USD 16–60 t
−1 range reported for the Cuban context; and (iii) the system was assumed to operate only 300 days per year, leaving 65 days for scheduled maintenance and contingency repairs. In addition, the multivariate tornado sensitivity analysis indicates that the NPV remains positive across the entire ±20% range of the electricity tariff and biogas yield, and across the ±30% range of the CAPEX. The reported IRR of 32% and payback of approximately 3 years should therefore be interpreted as the central estimate of the baseline design scenario under the stated assumptions, rather than a guaranteed outcome under all operating conditions. A formally combined multivariate stress test using primary operational data and probabilistic uncertainty propagation (Monte Carlo with documented input distributions and parameter correlations) is recommended as part of future, site-specific implementation studies, in line with the limitations stated in
Section 4.
4. Discussion
4.1. Operational Efficiency
The proposed sizing (HRT = 30 days; usable volume of 3150 m
3 plus a 20% safety margin; four 20 kW agitators; estimated biogas production of 875 m
3/d) is consistent with covered lagoon digesters designed for swine manure in tropical regions. The adopted electrical conversion of 2 kWh per m
3 of biogas, equivalent to 1750 kWh day
−1, lies at the conservative lower end of the 2.0–2.3 kWh m
−3 range obtained for biogas with a lower heating value of approximately 6.25 kWh m
−3 at CHP electrical efficiencies of 32–36%. This conservatism reinforces the realism of both the technical and financial assumptions adopted in this study and is favourable for both technical and financial feasibility (
Figure 10).
In terms of construction, the truncated-pyramid geometry and reinforced walls ensure structural stability and membrane durability, while the scaling of pipes and the torch sized at 36.5 m
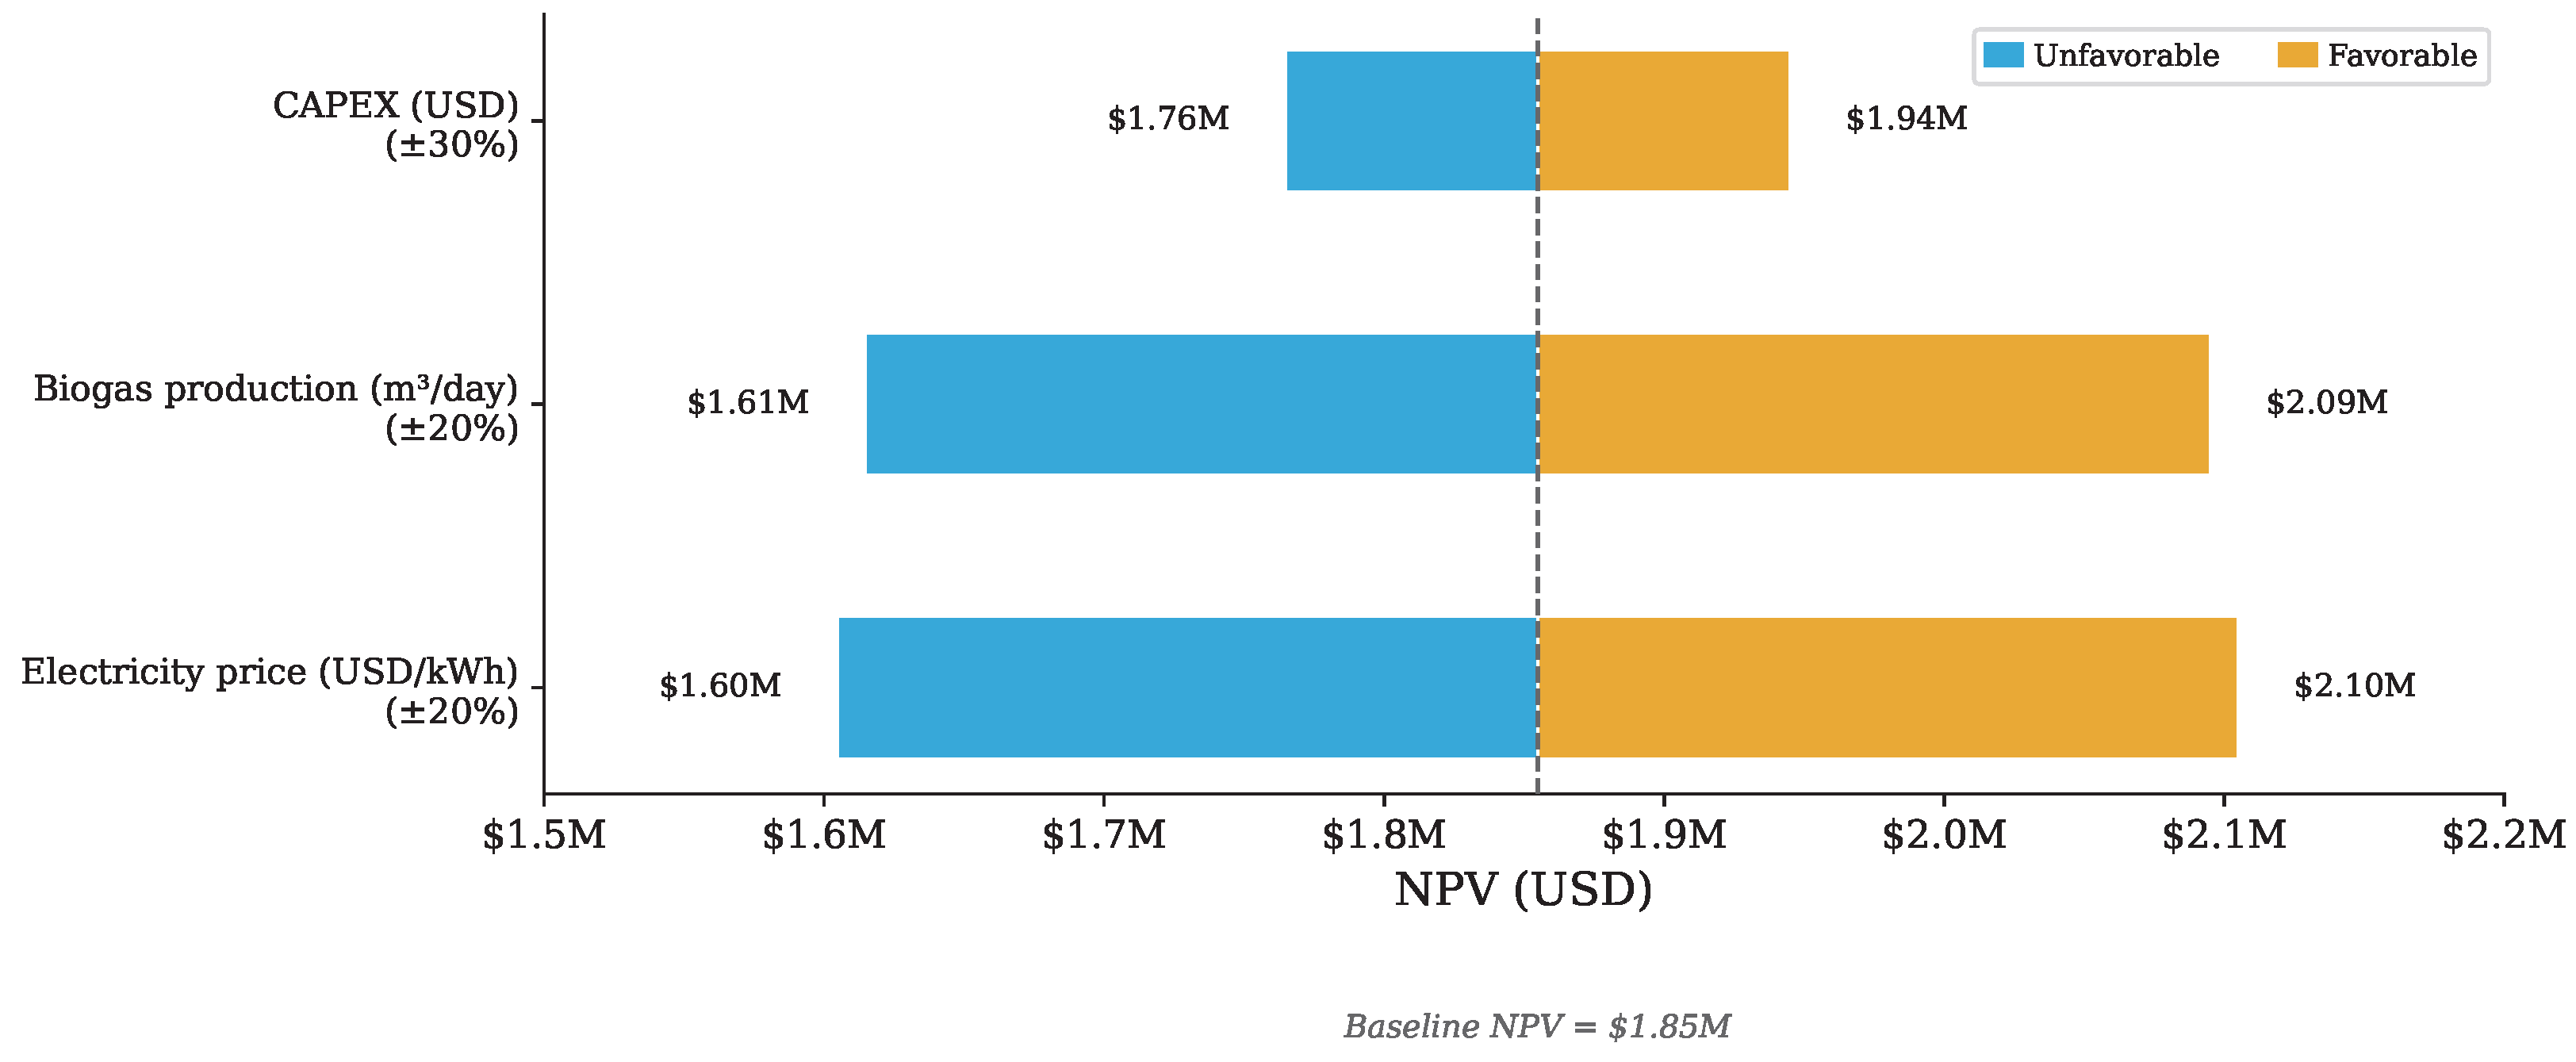
3/h guarantee operational safety under variable load conditions. The sensitivity analysis showed that electricity price and biogas yield exert the strongest influence on the NPV; annual operating days also showed a significant effect because they influence both electricity and biofertilizer revenues simultaneously. The tornado chart in
Figure 11 confirms that the NPV remains positive across the full ±20% range of the electricity tariff and biogas yield, and across the ±30% range of the CAPEX, indicating that the favourable economic performance is not contingent on any single parameter.
4.2. Environmental Benefits
The system captures approximately 352 kg of CH4 per day, equivalent to 3000–3600 t CO2eq per year. This level of mitigation is consistent with studies that show reductions of 40–50% in GHG emissions when replacing open storage with anaerobic digestion.
The treatment train (biodigester, facultative lagoon, and subsurface-flow wetland) ensures compliance with Cuban regulations of 90 mg/L BOD for discharges, while also opening up the possibility for agricultural reuse of the treated effluent, reducing freshwater extraction and improving water security. The digestate (∼22.6 t/d) represents a biofertilizer that replaces synthetic fertilizers, reducing costs and the carbon footprint associated with the industrial production of chemical inputs.
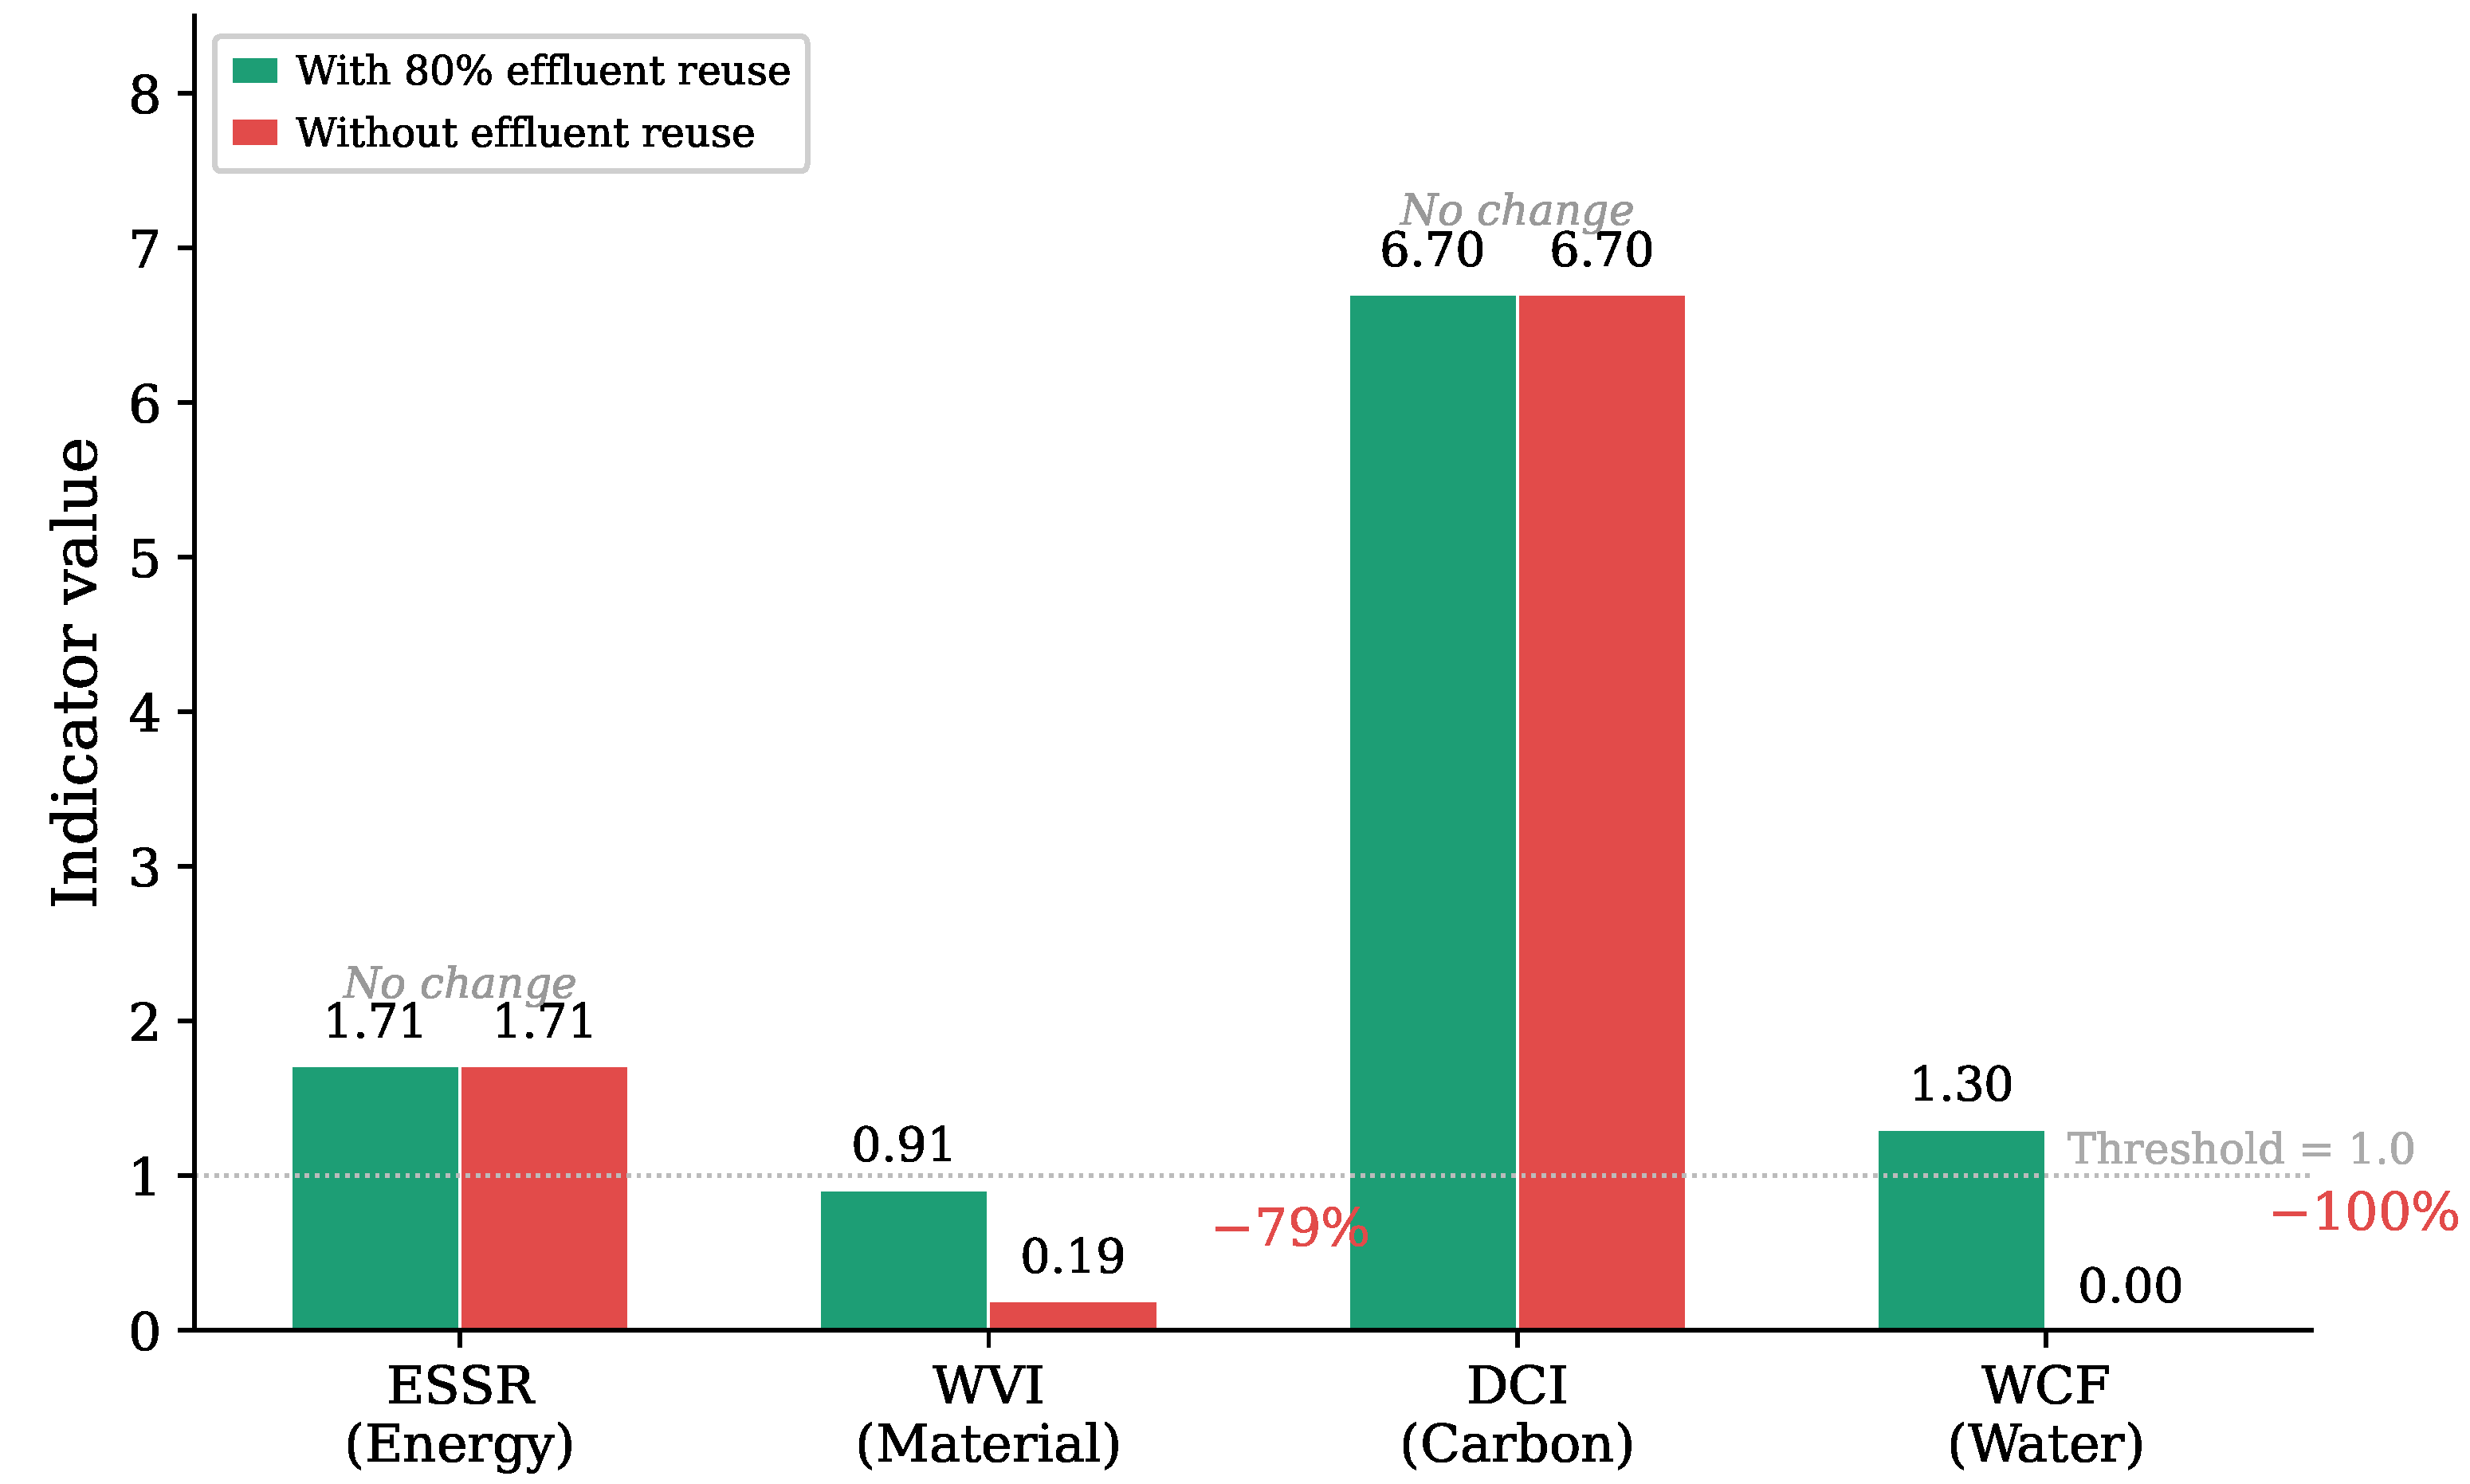
A critical aspect of circularity performance is its sensitivity to effluent management assumptions. To evaluate this dependency, the base scenario (80% effective reuse of treated effluent for agricultural irrigation) was compared with a no-reuse scenario, where all effluent is discharged to the receiving body.
Figure 10 presents the variation of the four dimensionless indicators (ESSR, WVI, DCI, WCF) under both scenarios.
The sensitivity analysis reveals a fundamental asymmetry: while ESSR and DCI remain unchanged (1.71 and 6.7, respectively) regardless of effluent reuse—as they depend exclusively on biogas capture and electricity generation—WVI collapses from 0.91 to 0.19 and WCF from 1.30 to 0 without reuse. This asymmetry demonstrates that the system’s energy and carbon circularity are intrinsic to the biogas capture process, whereas material and water circularity critically depends on integrating the biodigester with surrounding agricultural land-use planning. Practical implication: Installing biodigesters without simultaneously ensuring land availability for effluent reuse produces systems that are energetically circular but materially linear.
4.3. Comparison with Reference Studies
Methane values (55–70%) and yields of 0.025 m
3/kg excreta fall within the range reported in the international literature (0.02–0.04 m
3/kg, 60–65% CH
4). Covered lagoon digesters have been shown to achieve COD removals of 70% and CH
4 concentrations of
[
82], which supports the design assumptions.
A sensitivity analysis was conducted to evaluate the influence of the main techno-economic parameters on the Net Present Value (NPV) of the project, shown in
Figure 11. The results show that electricity selling price and biogas yield are the most sensitive factors, with variations of ±20% leading to significant changes in NPV, while investment costs (±30%) exert a moderate effect. The tornado evaluation in
Figure 11 confirms that the NPV remains positive across the full uncertainty bands of these dominant parameters, indicating that the financial robustness of the proposed system is supported by the multivariate sensitivity evidence rather than by any single optimistic assumption.
In terms of energy, the conversion of 2.0–2.2 kWh el/m
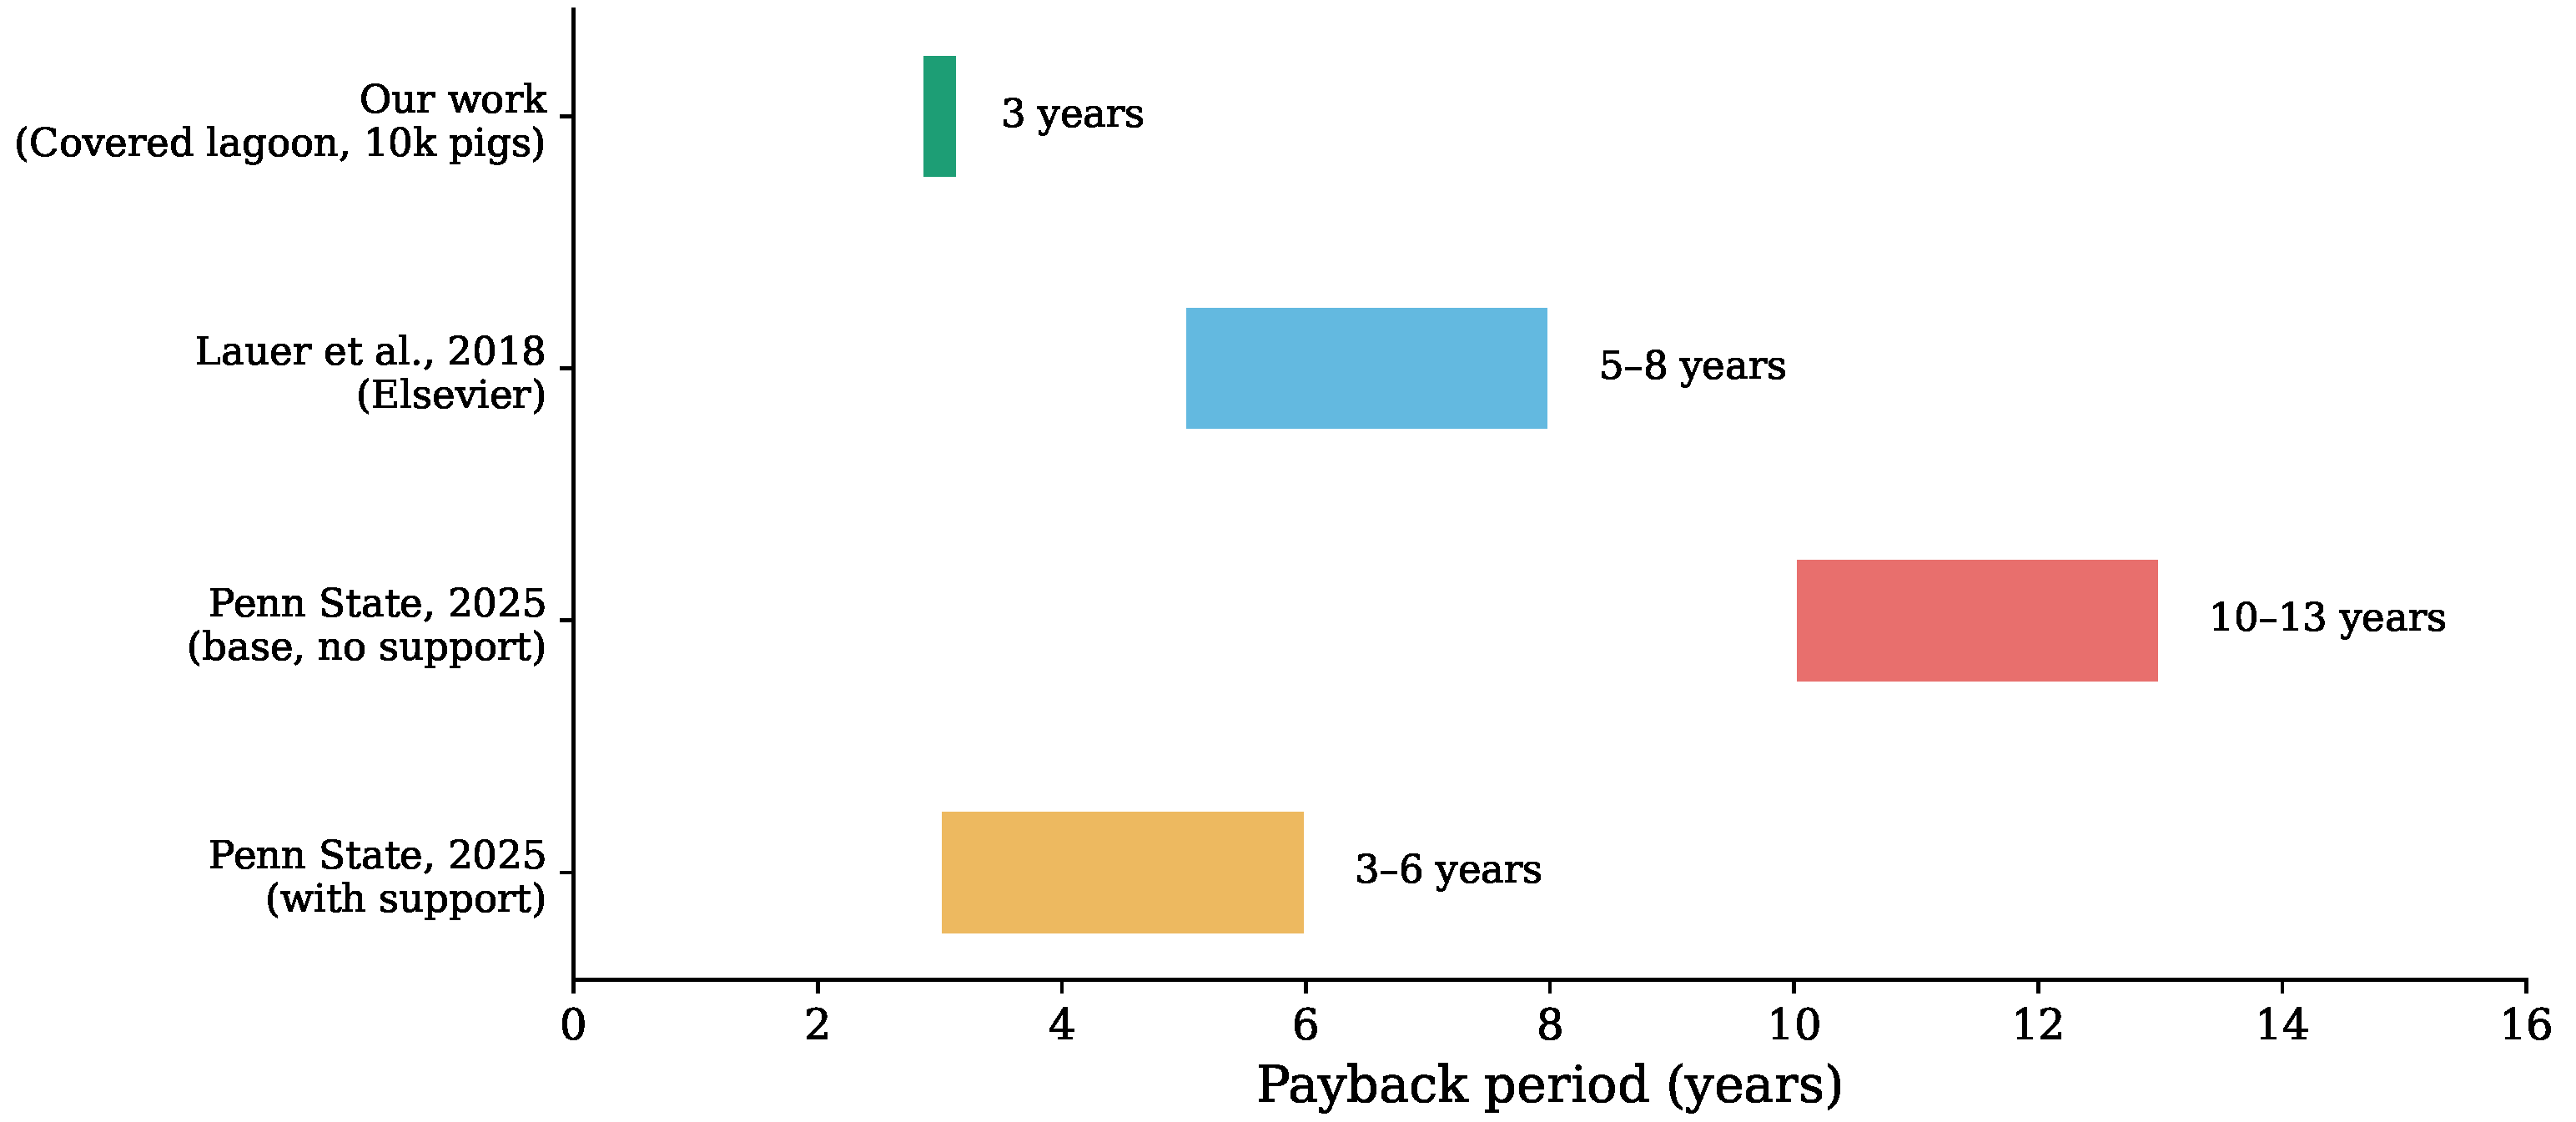
3 of biogas aligns with the literature on biogas cogeneration. Regarding the economic aspect, the project reports an NPV of 1.09 M USD, IRR of 32%, and a payback period of 3 years, indicators that are superior to those of international studies reporting return on investment periods of 5–10 years. This can be attributed to favorable local factors: electricity selling price, digestate valorization, and operation scale.
Table 9 and
Figure 12 present a comparison of the case studies conducted on biodigesters.
4.4. Circular Economy Performance: Contextual Drivers, Comparative Analysis, and Methodological Contribution
4.4.1. Contextual Drivers of High Circularity Performance
The five quantitative indicators reveal that the convergence of tropical climate, a fossil-intensive electricity grid, and industrial scale produces a system with circularity performance exceeding that reported for temperate anaerobic digestion facilities. The ESSR of 1.71 indicates that the system generates 727 kWh day−1 more than it consumes (1750 − 1023 = 727 kWh day−1), representing a 71% energy surplus available for grid export. This value substantially exceeds the range of 0.3–1.5 typically reported for farm-scale anaerobic digestion in temperate climates, where 20–40% of the generated electricity is consumed for auxiliary heating of the digester. In the Cuban tropical context, the average ambient temperature of 29 °C eliminates the need for auxiliary heating entirely, redirecting that energy fraction to the exportable surplus.
The DCI value of 6.7 is particularly noteworthy and can be quantitatively decomposed. The numerator includes the avoided emissions from methane capture (3300 t CO2eq year−1), calculated from 351.8 kg CH4 day−1 × GWP100 = 31 × 300 operational days. The denominator represents the system’s total annual operational emissions, which include three components: (i) electricity consumption of the mixing system ( kW h day−1 × 300 days kg CO2eq kWh−1 × 10⁻³ ≈ 163 t CO2eq year−1); (ii) fugitive methane emissions through the lagoon cover, estimated at 3% of CH4 produced ( t CO2eq year−1); and (iii) electricity use by pumps and auxiliary equipment, estimated at approximately 231 t CO2eq year−1 based on operational data from comparable facilities. The resulting total operational emissions are about 492 t CO2eq year−1, yielding DCI .
This value confirms that the system avoids nearly seven times more greenhouse gas emissions than it generates during operation. The high DCI mainly results from the combination of the large volume of methane captured and the high carbon intensity of the Cuban electricity grid (≈0.9 kg CO2eq kWh−1). To illustrate the contextual dependence: applying the same system to the Peruvian grid ( kg CO2eq kWh−1) would proportionally reduce the credit from grid displacement, although the DCI would still remain above one because CH4 capture dominates the avoided emissions.
4.4.2. Comparative Analysis with Direct Antecedents
The results enable a structured comparison with the three closest antecedents identified in the literature. Reference [
24] proposed three circular economy indicators for pig manure wastewater treatment, reporting 0.97 m
3 of recovered water, 49.40 kg of biofertilizer, and 5.33 m
3 of biogas per m
3 of treated slurry. These indicators quantify process-level efficiency (output per unit input at the treatment stage) but do not capture system-level performance dimensions. Specifically, they do not address:
Whether the recovered energy satisfies the facility’s own demand (energy self-sufficiency);
The net carbon balance of the system (decarbonization);
The extent to which the returned water closes the freshwater consumption cycle (water closure).
The five indicators proposed in the present study extend this approach by integrating these system-level dimensions into a unified multidimensional framework. Reference [
25] validated a full-scale integrated treatment system in southern Brazil, demonstrating simultaneous recovery of energy (42,064 kWh month
−1 surplus), nutrients (93.6% total nitrogen removal, 99.4% total phosphorus removal), and reuse water from swine manure under a circular economy concept. These results are impressive in absolute terms: the energy surplus of that system (≈1402 kWh day
−1 assuming 30 days/month) is comparable in magnitude to the 727 kWh day
−1 surplus of the system evaluated here. However, those results were presented as removal efficiencies and absolute flows without defining formal circularity metrics with standardized equations and system boundaries. This limits cross-system comparability: a reader cannot determine whether the system achieves energy self-sufficiency (ESSR) without knowing the facility’s total electricity demand. The contribution of the present work lies precisely in formalizing these dimensions into a reproducible and transferable metric framework. Reference [
26] proposed a scalable circularity index for bio-economy systems based on mass and energy flow analysis, yielding a single aggregated score. While aggregation facilitates ranking and comparison, it obscures the diagnostic information needed for system improvement. The sensitivity analysis presented in
Figure 10 demonstrates this limitation clearly: a single aggregated index would show a moderate decrease when effluent reuse is removed, masking the fact that WVI collapses from 0.91 to 0.19 (a 79% reduction) while ESSR remains completely unchanged. The five independent indicators adopted in this study provide greater diagnostic resolution, enabling targeted identification of which circularity dimensions require intervention.
4.4.3. Critical Sensitivity Finding and Policy Implications
The scenario analysis (
Figure 10) revealed a fundamental asymmetry in circularity performance that has not been previously reported for covered lagoon biodigesters. While the energy (ESSR = 1.71) and carbon (DCI = 6.7) indicators remain completely invariant regardless of effluent management—because they depend exclusively on biogas capture and electricity generation—the material (WVI) and water (WCF) indicators collapse entirely without agricultural reuse of the treated effluent: WVI drops from 0.91 to 0.19 and WCF from 1.30 to zero.
This finding has a direct practical implication: a biodigester installed without simultaneously ensuring the availability of agricultural land for effluent reuse produces a system that is energetically circular but materially linear. Ref. [
28] had identified water reuse as a key strategy for mitigating atmospheric emissions and protecting water resources in the swine production chain, but without explicitly quantifying the impact of its absence on overall material circularity. Ref. [
83] demonstrated that dynamic digestate management on agricultural land can reduce greenhouse gas emissions by 48%, but also warned about the risk of environmental burden shifting—specifically, increased eutrophication and acidification when nitrogen application exceeds crop uptake capacity.
The LCA results presented in
Figure 5 and
Figure 6 corroborate this concern: the biogas system shows a freshwater eutrophication impact 5.8 times higher than that of diesel (1.05 vs. 0.18 kg P eq per MWh) and marine eutrophication 94 times higher (0.195 vs. 0.00207 kg N eq per MWh). These trade-offs are directly linked to the nutrient management dimension captured by the FSR indicator: while the digestate can substitute 16.3 t N year
−1 of synthetic fertilizer (a clear circularity benefit), improper application generates the eutrophication burden identified by the LCA. This illustrates how the five circular economy indicators and the LCA results function as complementary diagnostic tools: the indicators quantify cycle closure, while the LCA identifies the environmental trade-offs associated with that closure.
4.4.4. Methodological Contribution and Transferability
A recent review of circular economy indicators [
23] concluded that fragmentation and lack of consensus remain the main obstacles to circularity measurement. The key recommendation was to use complementary multidimensional indicator sets rather than single aggregated scores. The five-indicator framework proposed in this study responds directly to this recommendation, covering the energy, material, carbon, nutrient, and water dimensions of cycle closure independently but complementarily. A systematic scoping review of biogas systems in the Global South [
22] confirmed that the circular economy remains an infrequent and underdeveloped theme in the biogas literature, underscoring the need for quantitative frameworks such as the one proposed here. Consistently, a mini-review of ten LCA studies on pig manure treatment published between 2019 and 2023 [
3] found that none proposed circularity indicators, limiting their evaluations to standard environmental impact categories. These findings confirm that the measurement gap addressed by the present study is both real and widely recognized.
The proposed framework provides a unified quantitative language that enables reconstruction, comparison, and diagnosis of multidimensional AD circularity from available data. The systematic distribution of non-reconstructible (NR) cells across external cases (
Table 10)—particularly in the water (WCF) and material valuation (WVI) dimensions—is not a weakness of the framework but direct evidence of existing reporting incompleteness, and therefore demonstrates the need for an instrument that requires simultaneous closure of all five cycles. The absence of prior studies calculating all five indicators simultaneously does not invalidate the framework; on the contrary, it confirms the original contribution of this work: providing a tool that the literature lacked.
The proposed framework is aligned with ISO 59020:2024 [
29], which establishes requirements for defining system boundaries, selecting indicators, and reporting circularity performance in a verifiable manner. The five indicators use the same system boundaries adopted throughout this study and produce interpretable values that enable comparison across:
Anaerobic digestion configurations (CSTR, UASB, tubular biodigesters, covered lagoons);
Geographical contexts (tropical vs. temperate, fossil-intensive vs. clean grids);
Operational scales (farm-scale vs. centralized).
The applicability of the proposed indicators is not restricted to covered lagoon biodigesters or to swine production systems. Because the framework is based on measurable system-level flows rather than on reactor-specific design variables, it can be adapted to other anaerobic digestion configurations, including continuously stirred tank reactors, tubular digesters, plug-flow digesters, and UASB-based treatment schemes [
86]. Likewise, the framework can be extended to other livestock systems, such as dairy, poultry, or mixed-manure facilities, provided that the corresponding substrate generation rates, biogas yields, nutrient composition, freshwater inputs, and effluent reuse pathways are defined. In such applications, the mathematical structure of the indicators remains unchanged, while the input parameters are adjusted to reflect the specific characteristics of the reactor, feedstock, and local resource-management context [
87]. For example, ESSR and DCI can be applied wherever biogas-derived energy and avoided emissions are quantified, FSR can be recalculated from the nutrient composition of the resulting digestate, and WCF becomes particularly relevant in systems where dilution water or treated effluent reuse represents a significant management issue. This flexibility allows the framework to serve not only as a case-specific assessment tool, but also as a comparative basis for evaluating circularity across different anaerobic digestion technologies and livestock production models [
88].
Recent research [
31] demonstrated the value of integrating techno-economic analysis (TEA) and life cycle assessment (LCA) for comparing swine manure treatment configurations in Brazil, yet the circularity dimension remained absent from their evaluation; the indicators proposed here naturally complement such integrated assessments.
4.4.5. External Applicability and Comparative Consistency Assessment
To evaluate the applicability of the five-indicator framework beyond the Cuban case, a comparative reconstruction was performed using data explicitly reported in five selected international studies on anaerobic digestion of livestock waste. The cases were selected under strict criteria: (i) full-scale AD systems with livestock manure as the main substrate, (ii) availability of quantitative data on at least biogas production and/or energy generation, and (iii) a documented system boundary. The indicators were reconstructed using the same boundary logic adopted in this study. Indicators not reconstructible due to insufficient data were classified as NR; those requiring auxiliary assumptions were marked as proxy (b). This exercise does not constitute experimental validation but rather a methodological transferability assessment.
4.4.6. Patterns and Comparative Analysis
Pattern 1—Energy and climate dimensions are most reconstructible: ESSR could be reconstructed (at least as proxy) only for [
25], which explicitly reports a surplus of 42,064 kWh/month. DCI could be approximated as proxy in three out of five external cases, as most AD studies report at least GHG mitigation data. However, no external study reports DCI as the explicit ratio of avoided/operational emissions, confirming this formulation as an original contribution of the present framework.
Pattern 2—Nutrient dimension (FSR) is partially reconstructible: ref. [
83] reports digestate N availability (41.8%) and ref. [
24] reports biofertilizer mass (49.4 kg/m
3), but neither expresses substitution as t N/year at system scale, which is the FSR formulation proposed. This shows nutrient data exist fragmentally but lack a unifying framework.
Pattern 3—Water dimension (WCF) is systematically non-reconstructible: no external case allows WCF calculation as reused volume/freshwater consumed ratio. Ref. [
25] confirms the final effluent is reuse-suitable, and ref. [
28] identifies water reuse as a key strategy, but neither quantifies effective reuse fraction or dilution water volume. This systematic gap provides the strongest evidence for the need of the proposed WCF indicator.
4.5. Comparison of Circularity Profiles with the Cuban Case
The Cuban case occupies the energy–climate extreme of the circularity spectrum, with ESSR = 1.71 and DCI = 6.7 exceeding any reconstructible literature value. This results from three contextual factors: (i) tropical operation without auxiliary heating, freeing all generated energy for use/export; (ii) high Cuban grid carbon intensity (0.9 kg CO2eq/kWh), maximizing decarbonization benefit per displaced kWh; and (iii) industrial scale (10,000 pigs) ensuring continuous substrate flow.
In contrast, the SISTRATES
® system [
25] shows a more balanced profile: it generates energy surplus AND recovers nutrients (93.6% NT, 99.4% PT) while enabling water reuse. This suggests post-treatment integration (nitrification/denitrification + P precipitation) amplifies material and water dimensions unachievable by biodigester alone. Practical implication: The Cuban case could improve WVI and WCF by adding a SISTRATES
®-type post-treatment train downstream of the facultative lagoon.
The [
83] (Ireland) case illustrates climate context modification: temperate co-digestion (swine + grass silage) multiplies energy recovery
vs. mono-digestion (1592 MWh vs. baseline), but a significant fraction is consumed for digester heating, reducing effective ESSR. This aligns with the predicted tropical ESSR > temperate ESSR asymmetry.
Finally, ref. [
24]’s process-level indicators (m
3 recovered/m
3 treated) are not directly comparable with the proposed system-farm indicators. However, they confirm that water and nutrient dimensions are quantifiable when data reporting suffices, reinforcing the proposed framework viability.
4.6. Limitations of This Study
Several limitations should be acknowledged together, integrating both the limitations of the case-study assessment and those of the cross-study comparative reconstruction reported in
Section 4.4.6.
- 1.
The five circular economy indicators were validated through conceptual grounding and scenario analysis rather than through operational monitoring data from the installed system. Field validation under real operating conditions is needed to confirm the calculated values.
- 2.
The WVI and WCF calculations assume 80% effective reuse of the treated effluent for agricultural irrigation; this fraction is a design target rather than a measured value, and its sensitivity was explicitly quantified in
Figure 10.
- 3.
The LCA results were obtained at a screening level and the comparison is limited to two technologies (biogas vs. diesel); a broader comparative analysis including other renewable sources would provide additional context.
- 4.
The indicator framework has not yet been subjected to formal expert validation (e.g., Delphi method); such validation is recommended as future work to consolidate the framework’s acceptance in the scientific community.
- 5.
The digestate composition values (N, P, K concentrations) used for FSR calculation are based on literature values for swine digestate rather than site-specific characterization; actual nutrient content may vary depending on feed composition, dilution ratio, and digestion efficiency.
- 6.
The external cases used in the comparative reconstruction (
Section 4.4.6) operate under different climatic, economic, and regulatory conditions than the Cuban case, which precludes absolute magnitude comparisons. The proxy classification adopted in
Table 10 implies that reconstructed values carry greater uncertainty than the reference case. The systematic absence of complete five-dimensional validation in external cases reflects a literature reporting gap, not an intrinsic framework limitation, and residual boundary differences may exist because the indicators were reconstructed from published data without access to the underlying raw data.
Therefore, the economic results should be interpreted as indicative values for preliminary feasibility assessment rather than definitive financial projections. Site-specific implementation should include updated investment costs, confirmed electricity tariffs, measured biogas yields, actual maintenance costs, and verified digestate market prices.
5. Conclusions
This study demonstrates that integrating quantitative circular economy indicators with techno-economic and life cycle environmental assessments provides a substantially more complete picture of biodigestion system performance than any of these approaches alone. The five proposed indicators (ESSR, WVI, DCI, FSR, WCF) capture the energy, material, carbon, nutrient, and water dimensions of circularity, revealing both the strengths and critical dependencies of the system. The main conclusions are:
A framework of five quantitative circular economy indicators was proposed, adapted from established concepts, and validated through conceptual grounding and scenario analysis. The system achieves ESSR = 1.71 (71% net energy surplus), WVI = 0.91 (91% of inlet mass valorized), DCI = 6.7 (avoids 6.7 times more emissions than it generates), FSR = 16.3 t N year−1 (plus 4.1 t P2O5 and 12.2 t K2O), and WCF = 1.30 (returns 30% more water than consumed). These values exceed temperate-climate benchmarks across all dimensions, due to the tropical context, the fossil-intensive Cuban grid, and the industrial scale of the system.
The scenario analysis revealed a fundamental asymmetry: without effluent reuse, WVI collapses from 0.91 to 0.19 and WCF from 1.30 to zero, while ESSR and DCI remain invariant at 1.71 and 6.7. This demonstrates that energy and carbon circularity are intrinsic to the biogas capture process, whereas material and water circularity depend critically on integrating the biodigester with surrounding agricultural land-use planning. Biodigesters installed without guaranteed land availability for effluent reuse are energetically circular but materially linear.
The covered lagoon biodigester produces 875 m
3 day
−1 of biogas (1750 kWh day
−1), with an NPV of 1.09 million USD, an IRR of 32%, and a payback period of approximately 3 years, computed under the conservative baseline assumptions detailed in
Section 3 (biogas yield at the lower bound of the 0.02–0.04 m
3 kg
−1 range reported in the literature, biofertilizer value at the lower bound of the Cuban reported range, and 300 operating days per year). The univariate sensitivity analysis (
Table 8) and the multivariate tornado evaluation (
Figure 11) confirm that the project NPV remains positive across the relevant uncertainty bands of the dominant techno-economic parameters, demonstrating that the favourable economic performance is not contingent on any single optimistic assumption.
The comparative LCA using ReCiPe 2016 Midpoint (H) confirms that biogas-based electricity reduces impacts on climate change (78% reduction vs. diesel), air quality, and fossil resource scarcity, although it also introduces trade-offs in eutrophication (5.8 times higher) and ecotoxicity that require controlled digestate and effluent management. These trade-offs are directly linked to the circularity dimensions captured by the FSR and WCF indicators.
The indicator framework is transferable to other reactor types, geographical contexts, and scales. Its alignment with ISO 59020:2024 and its complementarity with TEA–LCA evaluations position it as a practical tool for evidence-based decision-making in the design and promotion of circular biodigestion systems. Future work should extend this screening-level assessment into a full life cycle analysis using primary operational data, including construction materials, maintenance records, seasonal performance, methane leakage, equipment replacement, and efficiency degradation.




 ,
,