


Abstract
Legacy coal-mined lands in the Appalachian coalfield retain chemically heterogeneous soils, but consistent multi-site comparisons are scarce. This study asked whether soil properties differ among sites, which properties structure sample-level variation, and whether samples form distinct soil-chemistry classes. We measured 18 soil-test properties in 135 surface (0–20 cm) samples from seven legacy coal-mined sites in West Virginia and Pennsylvania and analyzed them with Kruskal–Wallis tests (Holm correction), principal component analysis (PCA) of 17 properties, and Ward clustering, with bootstrap resampling and alternative specifications as robustness checks. All 18 properties differed among sites, although boron differences coincided with the laboratory batch. Five components explained 69.9% of the variance; the acidity/base-cation, trace-metal, and phosphorus-availability components were reproducible (Tucker’s congruence ≥ 0.87), but two minor components were not. Clustering separated an acidic, lime-requiring majority (n = 106) from a near-neutral minority (n = 29), but separation was weak (silhouette = 0.27), only the acidic group was stable (Jaccard = 0.90 versus 0.67), and the partition matched a pH threshold of 6.0 across site boundaries. These soils are better described as a continuous acidity gradient with an independent trace-metal dimension than as discrete fertility classes, providing a baseline for designing, but not replacing, field trials of reclamation and bioenergy species.
1. Introduction
Surface coal mining has left an extensive legacy of disturbed land and drastically altered soils across the Appalachian region. Across the broader Appalachian coalfield, an estimated 2.5 million acres (~10,000 km2, about 6.5% of the >150,000 km2 coalfield) have been disturbed by surface coal mining since the late 1970s [1], and satellite-based mapping of Central Appalachia identifies a cumulative surface-mining footprint of roughly 5900 km2 (1.5 million acres), or 7.1% of the region, accrued between 1976 and 2015 [2]. This legacy includes both lands mined and reclaimed under permits issued after the Surface Mining Control and Reclamation Act (SMCRA) of 1977 and abandoned mine lands (AMLs), lands mined before SMCRA and left without a responsible party or reclamation bond [3,4]. In West Virginia alone, the federal inventory lists 5478 AML problem areas containing 9790 recorded problems, of which 44% are recorded as reclamation completed, 8% as in reclamation, and 48% as reclamation pending [3]. Whether reclaimed under permit or left unreclaimed, many of these legacy landscapes retain degraded soils that continue to constrain vegetative recovery, land productivity, and downstream ecosystem services decades after mining ceased [5,6,7].
The soils that develop on these sites are shaped more by the geologic material exposed during mining than by natural pedogenesis. Surface mining in the eastern United States inverts the overburden profile, bringing unweathered rock to the surface and producing mine soils whose chemistry depends on the acid–base status of the parent material: soils derived from acid sandstones and pyritic shales can become strongly acid (pH below 4), soils derived from carbonate-bearing strata can become alkaline (pH near 8), and intermediate materials can drift toward extreme over time [8]. This acid–base status, quantified through acid–base accounting, governs lime requirement and buffer pH and has historically been the primary basis for pre-mine planning and reclamation permitting in West Virginia and Pennsylvania [8]. Mine soils are also commonly limited by nitrogen and phosphorus availability; nitrification on mined soils can fall to as little as 7% of rates on undisturbed soils, and phosphorus fixation increases under the acidic conditions typical of pyritic overburden [9]. Mining and reclamation further alter bulk density, organic carbon, and nutrient pools depending on how topsoil and spoil were handled [10,11]. Because the mix of parent materials and reclamation practices vary between and within mine sites, fertility constraints on legacy mine soils are expected to be site-specific rather than generalizable from a single location.
This site-specificity creates a need for direct, statistically grounded comparisons across multiple legacy coal-mined sites, yet most comparative work on reclaimed mine soils has focused on land-use type or reclamation age within a single reclaimed area. For example, a study of the Pingshuo opencast coal mine on China’s Loess Plateau used multivariate analysis of variance and geostatistics to show that available phosphorus, potassium, nitrogen, and organic matter differed by land-use type and reclamation age but noted that comparisons made across different sites reclaimed in different years become confounded with reclamation technology, climate, geomorphology, topsoil material, and management [12]. The same difficulty applies to legacy coal-mined sites in Appalachia: without a consistent statistical framework applied identically across sites, it is unclear whether apparent differences in fertility reflect real geochemical distinctions or uncontrolled variation in sampling, site history, and laboratory analysis.
Descriptive, threshold-based comparisons across locations have revealed location-specific soil constraints (for example, regionally concentrated acidity or phosphorus and zinc deficiency) that a single pooled analysis would have obscured [13], and principal component and cluster analyses applied to correlated fertility indicators have been used to identify which variables drive overall fertility variation [14,15,16]. Multivariate classifications, however, are sensitive to data preprocessing, extreme values, and variable selection, and the resulting groups are meaningful only if they are reproducible under resampling and alternative specifications [17,18]. To our knowledge, no comparative–multivariate framework that couples site-level comparison with an explicit assessment of multivariate structure stability has been applied across multiple independent legacy coal-mined sites in Appalachia.
This study was conducted as the soil-characterization component of a broader project evaluating Central Appalachian legacy mine sites for biomass development. Soil chemistry is a necessary first screen for any revegetation strategy, including the Forestry Reclamation Approach or the establishment of energy crops, but it is not sufficient to establish crop suitability or productivity, which require establishment trials, biomass measurements, and plant-tissue analyses. Within that scope, we analyzed soil samples from seven legacy coal-mined sites in West Virginia and Pennsylvania to address three research questions: (RQ1) do soil fertility indicators differ among sites; (RQ2) which soil properties account for the greatest variation among samples; and (RQ3) can samples be grouped into distinct and reproducible soil-chemistry classes? We explicitly evaluated the robustness of the multivariate results to transformation, variable selection, extreme values, and resampling, assessed within-site spatial dependence using georeferenced sampling positions, and interpreted the findings as a soil-chemistry baseline that can inform, but not replace, field evaluation of reclamation and bioenergy species.
2. Materials and Methods
2.1. Study Sites
We collected samples from seven legacy coal-mined sites in six counties spanning north-central to southern West Virginia and southwestern Pennsylvania, within the Appalachian Plateaus physiographic province (Figure 1; Table 1). The sites were in Marion County (two sub-locations combined); Webster County (Pardee & Curtin, two sub-locations combined); Wyoming County at two locations (Glen Rogers Rd and Turkey Creek East); Monongalia County (Reliance Minerals Inc.); and Raleigh County (WV Land Trust), West Virginia; and Fayette County, Pennsylvania.
Figure 1.
Locations of the seven legacy coal-mined sampling sites in West Virginia and southwestern Pennsylvania (MAR, Marion; MON, Monongalia; FAY, Fayette, PA; WEB, Webster; GR, Glen Rogers Rd; TC, Turkey Creek East; RAL, Raleigh). All seven sites lie within the Appalachian coalfield, in Marion, Monongalia, Webster, Raleigh, and Wyoming counties, West Virginia, and Fayette County, Pennsylvania. Each point marks a site location, and the six sampled counties are shaded; Supplementary Figure S5 shows the positions of individual samples within each site. Shaded relief is from the USGS 3D Elevation Program, and state and county boundaries are from the U.S. Census Bureau cartographic boundary files (2023).
Marion, Monongalia, and Webster counties fall within the historic Fairmont bituminous coal field, documented as extending across twelve counties in northern and central West Virginia and into adjoining parts of Pennsylvania and Maryland [19]. At Marion and Monongalia, the field is underlain by the Pittsburgh coal bed, mapped in modern geospatial data [20], whereas the coals mined at Webster belong to the older Allegheny Formation and Pottsville Group [21]. Webster County also lies within the Eastern Allegheny Plateau and Mountains region, a more deeply dissected southern extension of the Appalachian Plateau [21].
Raleigh and Wyoming counties, in the southern West Virginia coalfields, lie within the Pennsylvanian-age coal-bearing sequence described in early U.S. Geological Survey folios of the region [22]. Fayette County, Pennsylvania, lies in the bituminous coalfield of southwestern Pennsylvania and contains the Pittsburgh coal bed, one of the most extensively assessed coal resources in the northern Appalachian Basin [23,24].
All seven sites are legacy coal-mined lands, but their regulatory and reclamation histories differ (Table 1). These histories were established by overlaying the recorded sampling positions on the abandoned mine land (AML) problem-area, mining-permit, and special-reclamation layers of the West Virginia Department of Environmental Protection (WVDEP) [25,26] and on the federal Enhanced Abandoned Mine Land Inventory System (e-AMLIS) [3], supplemented for Fayette by records of the Pennsylvania Department of Environmental Protection [27]; the detailed records for each site are given in Supplementary Table S12. Four sites are associated with inventoried pre-law AML problem areas (Section 1), as summarized in the AML status column of Table 1. The Monongalia and Raleigh positions lie within coal-refuse-pile problem areas, recorded as reclaimed and pending reclamation, respectively, whereas Fayette, Glen Rogers Rd, and Webster Ponds lie near, but not within, such problem areas. The other three sites fall under permits issued after SMCRA: refuse-area permits issued in 1982–1983 at Marion and Turkey Creek East, and an underground-mine permit at Webster (Bolair sub-location) that was revoked in 1997 and whose forfeited-bond area is administered by the state Office of Special Reclamation. These records document problem types and permit status but not reclamation dates, methods, or materials; prior land use; or lime and fertilizer history, and this information was not uniformly available for all sites, so these attributes could not be entered as covariates. Consequently, “site” in this study is a composite factor integrating parent material, mining and reclamation history, management, and (partly) laboratory batch, and we do not attribute site differences to any single influence. County names identify the sampled mine areas; Supplementary Figure S5 shows the sampling positions within each site.
Plant cover differed in type and continuity among the sites at the time of sampling (Table 1; Supplementary Figure S6). Photographs taken during fieldwork show mixed conifer–hardwood forest with a fern and herbaceous understory, together with an open herbaceous–shrub clearing, at Webster; dense herbaceous, shrub, and young-tree cover with wet openings at Glen Rogers Rd; old-field grassland with scattered shrubs and young trees at Monongalia; and young deciduous forest growing on spoil and coal-refuse slopes at Raleigh and Fayette, where patches of bare shaley spoil, dark coal refuse, and reddish oxidized or burnt refuse remained exposed. At Raleigh, we also observed an orange, iron-oxide-stained seep consistent with mine drainage. Turkey Creek East differed from the other sites in that much of the sampled surface was bare coal refuse or spoil with rock fragments and only sparse grasses, with herbaceous cover and secondary forest confined to the margins. At Marion, photographs taken during the site visits in December 2023, when the samples were collected, show large coal-refuse piles and benches that were largely bare apart from sparse dry grasses, an excavated pit holding orange, iron-stained water, and orange-stained drainage channels, next to reclaimed areas of grassland with shrubs, young trees, and a pond. These observations are qualitative; we did not survey species composition, cover, or biomass.
Table 1.
Characteristics of the seven legacy coal-mined sites.
2.2. Soil Sampling and Laboratory Analysis
At each site, we collected surface soil (0–20 cm) on slopes of 15% or less. Because the legacy sites are steep, overgrown, and partly on private land where access had to be negotiated with owners, a systematic grid could not be laid out; sampling points were instead located opportunistically wherever the interior of the site could be safely reached on foot, and each point was recorded as a georeferenced placemark and in the field sampling log. The sampling target was 20 samples per site. We met or exceeded this target at five sites (20–23 samples); at Glen Rogers Rd, 20 samples were collected but one was not analyzed (n = 19), whereas we collected only 13 samples at Turkey Creek East, where much of the surface is bare coal refuse and spoil and safe access to the site interior is limited. As a result, sample numbers and sampled area differ among sites (Table 1; Supplementary Figure S5). A recorded position could be matched to the laboratory identifier for 132 of the 135 samples (132 distinct positions); for the remaining three samples (two at Marion and one at Glen Rogers Rd), the position was approximated in the site map but was not used in any spatial analysis. Each sample was a single core (one core per sampling point), so within-site variability includes small-scale (core-to-core) heterogeneity that compositing would have averaged out. Samples at Marion came from two sub-locations about 0.3 km apart (Rachel, n = 10; Joanne, n = 10), and samples at Webster came from two sub-locations (Bolair, n = 20; Ponds, n = 3; about 15 km apart); the two sub-locations at each of these sites were combined into one site. Samples were air-dried at temperatures below 30 °C; stones, debris, coal fragments, and plant material were removed, and the soil was sieved to 2 mm (no. 10 sieve) and ground with a mortar and pestle or mechanical grinder as needed.
All analyses were performed by the West Virginia University Davis College Soil Testing Laboratory following its standard operating procedures [30], which are based on the reference methods for the southeastern [31] and northeastern United States [32]. Methods, instruments, calculations, quality-control procedures, and reporting resolution are summarized in Supplementary Table S9. Soil pH was measured with a glass electrode in a 1:1 soil:water suspension (5 cm3 of soil and 5 mL of deionized water, equilibrated for 15 min) after two-point calibration at pH 4.0 and 7.0. Buffer pH was then measured in the same suspension after addition of the Mehlich buffer (initial pH 6.6) [33], from which buffer acidity is calculated as (6.6 − buffer pH) × 4 meq per 100 cm3 of soil. Organic matter (OM, %) was determined by loss on ignition as the mass loss between oven-drying at 105 °C for 2 h and ignition at 400 °C [34]. Electrical conductivity (EC, dS m−1) was measured in a 1:1 soil:water extract (20 g of soil and 20 mL of water, shaken for 30 min) with a conductivity cell calibrated against 0.01 M KCl (1.412 dS m−1) [35].
Extractable P, K, Ca, Mg, Na, Fe, Al, Mn, Zn, Cu, B, and Ni were extracted with Mehlich-3 solution [36] at a 1:10 soil:solution ratio (2.5 cm3 of soil in 25 mL), shaken for 5 min at 200 oscillations min−1 and filtered immediately, and the extracts were analyzed by inductively coupled plasma optical emission spectrometry (ICP-OES; PerkinElmer 2100, PerkinElmer, Waltham, MA, USA). Concentrations were calculated as (extract concentration − method blank) × 10 and reported in mg kg−1, to the nearest 0.1 mg kg−1 for macronutrients and 0.01 mg kg−1 for micronutrients; values reported by the laboratory as zero were analyzed as zero. Each extraction run included a method blank and check samples, an internal loam reference soil was analyzed after every 60 samples, instrument calibration was verified every 30 samples, and the laboratory participates in the North American Proficiency Testing program [30]. Because Mehlich-3 extracts only a fraction of the total element pool, the metal data describe extractable rather than total concentrations. Where extractable concentrations are compared with plant screening levels, which are defined for total concentrations (Section 4.4), the comparison is used only to identify samples that warrant attention in field trials and not as evidence of phytotoxicity.
Two laboratory-derived variables require explicit definition. The phosphorus saturation ratio (PSR, %), reported by the laboratory as P saturation, is the molar ratio of Mehlich-3 P to Mehlich-3 (Al + Fe) multiplied by 100 [37,38]; we confirmed this definition by recomputing PSR from the reported P, Al, and Fe concentrations. PSR is not base saturation, which was not measured. Lime requirement (LR, tons acre−1) is the laboratory’s liming recommendation for agricultural limestone of ≥90% calcium carbonate equivalence and depends on buffer pH and on the crop code entered on the submission form [30]. In this dataset, however, LR took only three values: within each laboratory batch, samples received either no recommendation or a single batch-specific rate (2 tons acre−1 in the February 2024 batch and 9 tons acre−1 in most 2025 samples), regardless of buffer pH. LR is therefore an ordinal, recommendation-based indicator of whether liming was recommended rather than a continuous measure of acidity. Because loss on ignition also combusts coal fragments and other geogenic carbon, OM values in mine soils may overestimate soil organic matter [39]. Samples were analyzed in five laboratory batches received between February 2024 and July 2025 (Table 1); batches were partly confounded with site, which was considered when interpreting site effects (Section 2.3).
2.3. Data Quality Control and Final Dataset
The laboratory export contained 156 records. We removed 20 exact duplicates of the same laboratory submission (identical laboratory ID at the same site), leaving 136 records, which matches the number of analyses invoiced by the laboratory. We retained one additional record (one laboratory ID listed under both Webster and Glen Rogers Rd) only under Webster, the site indicated by its field identifier. One sample (laboratory ID 25-3296) listed under Turkey Creek East in the submitted dataset was assigned to Fayette, consistent with its laboratory submission (it was received with, and numbered in sequence with, the Fayette samples and has the same sampling date). Three samples (laboratory IDs 24-4813 to 24-4815) that had been listed under Glen Rogers Rd were assigned to Webster (Ponds sub-location), following the field sampling log: they were sampled on 9 July 2024 and received by the laboratory on 6 August 2024, before the only Glen Rogers Rd sampling visit (7 August 2024). We recovered EC values for three samples (one each from Webster, Glen Rogers Rd, and Raleigh) missing from the dataset analyzed in the original submission from the WVU laboratory reports. The final dataset therefore comprised 135 unique field samples with complete data for all 18 properties: Marion (n = 20), Webster (n = 23), Glen Rogers Rd (n = 19), Turkey Creek East (n = 13), Monongalia (n = 20), Raleigh (n = 20), and Fayette (n = 20) (Supplementary Table S8). All analyses used these 135 samples. No values were imputed. The submitted analysis also included seven records generated by site-specific bootstrap resampling of measured samples (mainly from Turkey Creek East). Because such records are copies or perturbations of measured samples rather than independent observations, they inflate the apparent sample size and the precision of site comparisons; they were therefore excluded from all primary analyses, and their influence is reported only as a sensitivity analysis (Section 2.4). We checked values flagged as extreme by the 1.5× interquartile range rule against the laboratory data and retained them, because extreme concentrations in mine soils can reflect genuine geochemistry; we evaluated their influence through sensitivity analyses rather than deletion. The sample-level dataset is provided as Supplementary Data S1.
Two properties required caution. First, extractable B differed by about an order of magnitude between laboratory batches within the same site (Webster was analyzed in two batches; Supplementary Table S7), indicating an analytical batch effect. We therefore reported B descriptively and in univariate tests but excluded it from the primary multivariate analyses, and we did not interpret its site differences as soil effects. Second, because the reported LR rate differed between batches (Section 2.2), LR differences among sites may partly reflect laboratory batch and submission settings rather than soil acidity; LR was retained because it is the operational liming indicator, but analyses excluding LR are reported.
2.4. Statistical Analysis
The analysis followed five stages: descriptive statistics (Stage 1), assessment of distributional assumptions (Stage 2), comparison among sites (Stage 3; RQ1), correlation and principal component analysis (Stage 4; RQ2), and cluster analysis with stability assessment (Stage 5; RQ3). We performed analyses in Python 3.14 using NumPy 2.5, pandas 3.0, SciPy 1.18, statsmodels 0.15, and scikit-learn 1.9, with α = 0.05. Before applying the corrections described in Section 2.3, we checked the scripted workflow against the originally reported output from IBM SPSS Statistics (version 29, IBM Corp., Armonk, NY, USA) and reproduced it (e.g., the KMO value, rotated loadings, and cluster sizes). The corresponding author can provide the analysis scripts (Data Availability Statement).
Stage 1: Descriptive statistics
We computed the mean, median, standard deviation, minimum, maximum, range, and coefficient of variation for each property across all samples and by site. We used boxplots to compare site distributions and screen for values beyond 1.5 × the interquartile range.
Stage 2: Distributional assumptions
Because the site comparisons in Stage 3 assume a common distributional form within groups, we assessed normality within each site using the Shapiro–Wilk test [40], yielding an 18-property × 7-site matrix (Supplementary Table S4). We tested homogeneity of variance among sites with the Brown–Forsythe (median-centered Levene) test [41]. The pre-specified decision rule was to use one-way ANOVA only for properties that were normal within every site and homoscedastic, and the Kruskal–Wallis test otherwise. Pooled-sample normality statistics (skewness, kurtosis, and Shapiro–Wilk) are reported in Supplementary Table S5 for completeness only; they did not inform the choice of test, but the pooled non-normality motivated the use of rank-based correlation in Stage 4.
Stage 3: Comparison among sites (RQ1)
For each property, we tested the null hypothesis that the distribution did not differ among the seven sites. Kruskal–Wallis H tests [42] were applied, and omnibus p-values were adjusted across the 18 properties with the Holm procedure [43]. Effect size was expressed as η2H = (H − k + 1)/(n − k) and interpreted as small (0.01–0.06), medium (0.06–0.14), or large (>0.14) [44]. For properties with a significant Holm-adjusted omnibus test, pairwise comparisons used Dunn’s test with a Bonferroni correction for the 21 site pairs within each property [45].
Samples collected within a site are subsamples of that site rather than independent replicates of a site-level treatment, so the site comparisons describe differences among these seven specific sites and do not by themselves support inference to a wider population of legacy coal-mined sites [46]. To quantify within-site dependence, the intraclass correlation coefficient (ICC(1), one-way random effects, computed on ranks) was estimated for each property, together with the corresponding design effect for the mean size [1 + (m− − 1) × ICC]. We evaluated spatial dependence within sites for the 129 samples with recorded positions (at Webster, only the 20 Bolair positions were used; the three Ponds positions, about 15 km away, were too few for a separate within-sub-location analysis) using projected coordinates (UTM zone 17N). For each site, the sampled extent was described by the convex-hull area, the maximum distance between points, and nearest-neighbor spacing. Global Moran’s I [47] was computed for each property within each site using inverse-distance weights, with one-sided permutation p-values (999 permutations) for positive autocorrelation and Benjamini–Hochberg false-discovery-rate (FDR) control across all site × property tests [48]. In addition, a Mantel test (Spearman correlation, 999 permutations) was used within each site to test whether samples closer together were more similar in overall soil chemistry, using Euclidean distance on the 17 standardized properties used in the PCA [49].
Stage 4: Correlation and principal component analysis (RQ2)
Pairwise associations among the 18 properties were assessed with Spearman’s rank correlation [50], with Holm adjustment across the 153 pairs. Principal component analysis (PCA) was performed on 17 properties (B excluded; Section 2.3). To limit the leverage of extreme values on the correlation matrix, each property was winsorized at its 1st and 99th percentiles before standardization (z-scores); all samples were retained. The PCA was then computed by eigen-decomposition of the Pearson correlation matrix of these winsorized z-scores. The Spearman matrix (Supplementary Table S3) was used only to describe pairwise associations, and a PCA of rank-transformed data (equivalent to a Spearman-based PCA) was run as a sensitivity analysis. Sampling adequacy was evaluated with the Kaiser–Meyer–Olkin (KMO) measure, per-variable measures of sampling adequacy (MSA), and Bartlett’s test of sphericity. Components with eigenvalues > 1 were retained [51], and the number of components was cross-checked with Horn’s parallel analysis (95th percentile of eigenvalues from 1000 random normal datasets of the same size) [52]. We varimax-rotated the retained components with Kaiser normalization and used absolute loadings ≥ 0.50 to interpret components [15].
The robustness of the component structure was evaluated by repeating the PCA with (i) untransformed data, (ii) log10-transformed data, (iii) rank-transformed data (equivalent to a Spearman-based PCA), (iv) B included, (v) Al excluded (MSA < 0.5), (vi) Al and OM excluded, (vii) the derived variables LR and PSR excluded, (viii) the 5% of samples with the largest Mahalanobis distances excluded, (ix) the originally submitted dataset, and (x) the 135 field samples plus the seven bootstrap-generated records (n = 142). Each solution was compared with the primary solution using Tucker’s congruence coefficient after optimal matching of components; values ≥ 0.95 indicate that components can be considered equal, and 0.85–0.94 indicates fair similarity [53]. We assessed sampling variability by recomputing the PCA on 500 bootstrap samples of the 135 samples.
Stage 5: Cluster analysis and stability assessment (RQ3)
Hierarchical clustering used Ward’s minimum-variance linkage on Euclidean distances [54], computed from the same winsorized, standardized 17-property matrix used in the PCA. We selected the number of clusters from the agglomeration schedule (largest increase in fusion distance) and the average silhouette width for k = 2–8 [55]. We measured agreement with an independent k-means partition (k = 2, 100 random starts) using the adjusted Rand index (ARI) [56].
We assessed cluster stability in four ways. First, we estimated cluster-wise stability as the mean maximum Jaccard similarity between each original cluster and its best-matching cluster across 1000 bootstrap resamples; mean values ≥ 0.75 indicate stable clusters, and values ≤ 0.5 indicate a cluster dissolves [17]. Second, we computed prediction strength from 200 random half-splits of the data, with values ≥ 0.8 indicating well-supported clusters [18]. Third, in a leave-one-site-out analysis, we repeated clustering with one site omitted; we assigned the omitted site’s samples to the nearest cluster centroid and recorded agreement with the full-data assignment. Fourth, we repeated clustering under the same alternative specifications used for the PCA, on retained component scores, excluding EC and adding the seven bootstrap-generated records (n = 142; agreement computed on the 135 field samples); we measured agreement with the primary partition using ARI.
Clusters were profiled with Mann–Whitney U tests (Holm-adjusted across properties) and the effect size r = |Z|/√N. Because the profiled properties are the same ones used to form the clusters, these tests describe how the clusters differ and are not an independent confirmation of the clustering; effect sizes are therefore emphasized over p-values. The association between cluster membership and site was tested with a chi-square test using a permutation p-value (10,000 permutations) because several expected counts were small, and its strength was expressed as Cramér’s V. Finally, cluster membership was compared with two simple soil-test criteria, pH ≥ 6.0 and LR = 0 (no lime recommended), to evaluate whether the multivariate partition provides information beyond these thresholds. For each criterion, samples meeting it were assigned to the near-neutral cluster and the remaining samples to the acidic cluster, and agreement was expressed as the number and percentage of samples classified identically.
3. Results
3.1. Descriptive Statistics
Table 2 summarizes the 18 properties across all 135 samples. pH and buffer pH showed comparatively low relative variability, whereas several extractable elements were strongly right-skewed and highly dispersed, with means well above medians: Ni, Ca, and Zn had coefficients of variation above 175%, and PSR and P exceeded 125%. Calcium had the widest absolute range, from 22 mg kg−1 in a strongly acidic Fayette sample (pH 4.6) to 26,160 mg kg−1 in a near-neutral Webster sample (pH 7.4); both extremes were checked against the laboratory data and reflect individual samples rather than site-wide conditions. By-site means and standard deviations for all 18 properties are given in Supplementary Table S1.
Table 2.
Descriptive statistics for 18 soil properties across all sites (n = 135).
The site boxplots (Figure 2) show that Turkey Creek East had the least acidic and most variable pH, with several near-neutral to alkaline samples that set it apart from the predominantly acidic remaining sites. Fayette stood out for organic matter, PSR, P, and K, whereas its pH was among the lowest. Boron showed a pattern that tracked laboratory batch rather than geography (Section 2.3). Within-site spread was large for most properties, so between-site contrasts in central tendency coexisted with substantial overlap among sites. Thematic boxplots for all properties are provided in Supplementary Figures S1–S4.
Figure 2.
Distributions of 18 soil properties by site (n = 135). Boxes show the median and interquartile range, whiskers extend to 1.5 × the interquartile range, and points are values beyond the whiskers. Sites appear in the same order and color in every panel and are labeled on the bottom row. † Boron values coincided with laboratory batch (Supplementary Table S7) and are shown for completeness.
The 1.5 × IQR rule flagged 113 values across the 18 properties, most often for OM (13), EC, PSR, and Zn (11 each), and Ca (10), properties that, except for OM, also had the highest coefficients of variation. The most extreme value was a Ca concentration of 26,160 mg kg−1 in a Webster sample with pH 7.4, consistent with a localized carbonate or residual-amendment source; a second Webster sample contained the maxima for Zn (79 mg kg−1), Ni (38 mg kg−1), and Cu (32 mg kg−1). These values were retained, and their influence was evaluated in Section 3.4 and Section 3.5.
3.2. Distributional Assumptions
Within-site Shapiro–Wilk tests showed that every property except Al departed from normality (p < 0.05) or had a degenerate distribution (two or fewer distinct values) in at least one site; overall, 84 of the 126 property × site combinations were non-normal or degenerate (Supplementary Table S4). The Brown–Forsythe test also indicated unequal variances among sites for 12 of the 18 properties. Under the pre-specified decision rule, no property qualified for ANOVA (Al was normal within every site but had unequal variances), so the Kruskal–Wallis test was used for all 18 properties. Pooled-sample statistics (Supplementary Table S5) also indicated non-normal, predominantly right-skewed distributions, supporting the use of Spearman correlation in Stage 4.
3.3. Differences Among Sites
All 18 properties differed among sites at the unadjusted level and after Holm adjustment (Table 3). Among properties not affected by batch, the largest effects were for Na, OM, and Mn, followed by P, Cu, PSR, Zn, and Al; pH and buffer pH also showed large effects, whereas EC, Ca, Fe, and Ni showed medium effects. The very large effect for B coincided with laboratory batch (Supplementary Table S7) and is therefore not interpreted as a site effect.
Table 3.
Kruskal–Wallis tests for 18 soil properties among seven legacy coal-mined sites (n = 135), with effect sizes and within-site intraclass correlations.
Dunn–Bonferroni comparisons identified 94 significant site pairs across the 18 properties with significant omnibus tests, 83 of which involved properties other than B (Supplementary Table S2). Fayette and Marion took part in 36 and 34 of these 83 contrasts, respectively. Marion differed mainly through lower Zn, Na, and Cu and through LR, which in Marion’s batch was reported at a lower recommended rate (Section 2.2), whereas Fayette differed mainly through higher PSR, OM, and P and lower Mn. Because several properties are chemically interdependent (for example, PSR is computed from P, Al, and Fe, and LR is derived from buffer pH), co-occurring pairwise differences are expected and are examined jointly in Section 3.4.
Rank-based intraclass correlations ranged from 0.08 (Ni) to 0.62 (Na), excluding B (Table 3). Samples from the same site were therefore moderately to strongly similar for many properties, so the effective number of independent observations for inference beyond the sampled sites is considerably smaller than the number of samples. Accordingly, the site comparisons describe differences among these seven sites.
The sampled extent ranged from 1.8 ha (Raleigh) to 7.7 ha (Webster, Bolair), and the median nearest-neighbor spacing ranged from 18 m (Raleigh) to 41 m (Webster) (Table 1; Supplementary Table S10). Of the 125 within-site Moran’s I tests (B was constant at Marion), 30 indicated positive spatial autocorrelation at p < 0.05, about five times the number expected by chance, and 11 remained significant after FDR control (Supplementary Table S11). The eleven were at four sites: Marion (pH, buffer pH, and Mg), Monongalia (pH, buffer pH, Ca, Mg, Al, and Mn), Fayette (Cu), and Turkey Creek East (B). Mantel tests showed that samples closer together were more similar in overall soil chemistry at Marion (r = 0.34, p = 0.002) and, more weakly, at Glen Rogers Rd (r = 0.17, p = 0.042); at the other five sites, chemical dissimilarity was not related to distance (r = −0.07 to 0.14; p ≥ 0.08). Within-site spatial dependence was therefore concentrated in acidity-related properties at Marion and Monongalia, further reducing the effective sample size at these sites, whereas at most sites variation among samples was not spatially structured at the sampled spacing.
3.4. Correlation and Principal Component Analysis
Thirteen pairs of properties had |ρ| ≥ 0.5, and all are listed in Table 4 (full matrix in Figure 3 and Supplementary Table S3). The strongest association between PSR and P is partly definitional because P is the numerator of PSR. pH and buffer pH were also strongly correlated, and pH was positively associated with Ca and Mg and negatively with LR, consistent with the acidity–liming–base-cation relationship expected in mine soils. Among trace elements, Zn was associated with Na and Cu. The Na–B correlation is likely influenced by the batch effect on B, because Na also differed between batches at Webster (Supplementary Table S7).
Table 4.
All pairs of soil properties with Spearman rank correlations |ρ| ≥ 0.5 (n = 135; all Holm-adjusted p < 0.001).
Figure 3.
Spearman rank correlation matrix for 18 soil properties (n = 135). PSR, phosphorus saturation ratio.
Organic matter was only weakly associated with the acidity and base-cation properties and with P (Figure 3); its strongest associations were negative with Mn and Al and positive with Cu and Zn. OM therefore varied largely independently of the acidity-driven chemistry that structured most other properties, a pattern that recurs in the PCA.
The overall KMO measure was 0.645, and Bartlett’s test was significant (χ2(136) = 1257.3, p < 0.001), indicating a factorable correlation matrix. Per-variable MSA values were ≥0.51 for all properties except Al (0.35) (Supplementary Table S6). We retained Al in the primary analysis because it represents a chemically distinct dimension of acidic mine soils, and we evaluated its influence in the sensitivity analyses. Five components had eigenvalues > 1 and together explained 69.9% of the variance; parallel analysis supported the first four components, and the fifth eigenvalue only marginally exceeded the Kaiser criterion (Figure 4).
Figure 4.
Scree plot of PCA eigenvalues for 17 soil properties (n = 135), with the Kaiser criterion and the 95th percentile of eigenvalues from parallel analysis.
The rotated solution (Table 5) comprised: PC1, an acidity/base-cation component (pH, Ca, buffer pH, Mg, and EC positive; LR negative); PC2, a trace-metal component (Zn, Ni, Cu, and Na); PC3, a phosphorus-availability component (P, PSR, and K); PC4, an Al–Fe component (Al and Fe positive; buffer pH negative); and PC5, a Mn–OM component (Mn positive; OM negative). Communalities were ≥0.50 for all properties except Fe (0.47).
Table 5.
Varimax-rotated component loadings and communalities for 17 soil properties (n = 135; winsorized, standardized data).
The first three components were highly reproducible (Table 6). Across the ten alternative specifications, congruence with the primary solution was ≥0.96 for PC1, ≥0.97 for PC3, and ≥0.88 for PC2 (lowest for rank-transformed data), and in the bootstrap the 5th percentiles of congruence were 0.88, 0.87, and 0.92 for PC1–PC3. PC4 and PC5 were less stable: congruence ranged from 0.65 to 0.99 across specifications, and bootstrap 5th percentiles were 0.40 and 0.60, indicating that these minor components sometimes rotated into one another or split differently. Excluding Al or the derived variables, excluding the most extreme samples, using the originally submitted dataset, and adding the seven bootstrap-generated records (congruence ≥ 0.98 for all five components) left PC1–PC3 essentially unchanged. Thus, extreme values and low-MSA variables did not materially affect the three main gradients, whereas the interpretation of PC4 and PC5 should be regarded as tentative.
Table 6.
Sensitivity of the PCA solution: Tucker’s congruence coefficients between the primary solution and alternative specifications.
3.5. Cluster Analysis and Stability
In the agglomeration schedule, the largest increase in fusion distance occurred at the final merge (Figure 5), and the average silhouette width was highest for k = 2 (0.27), compared with 0.19–0.20 for k = 3–5 and ≤0.11 for k ≥ 6. The two-cluster solution comprised an acidic Cluster 1 (n = 106) and a near-neutral Cluster 2 (n = 29). The k-means partition agreed with it for 96.3% of samples (ARI = 0.84). These two statistics describe different properties of the solution. The agreement between Ward and k-means shows that the partition is not an artifact of one clustering algorithm, whereas the silhouette width describes how well separated the groups are; high agreement between methods does not imply strong separation, and a silhouette of 0.27 indicates weak structure.
Figure 5.
Dendrogram of Ward hierarchical clustering of 135 soil samples on 17 winsorized, standardized properties (truncated to the last 30 merges), with the cut for two clusters. Branch colors show cluster membership at the two-cluster cut: green branches form Cluster 1 (acidic; n = 106) and orange branches form Cluster 2 (near-neutral; n = 29). The dark gray link above the cut is the final merge joining the two clusters, and the dashed red line marks the cut (linkage distance ≈ 23.8).
The stability assessment showed that the two clusters were not equally reproducible (Table 7). Cluster 1 was stable under bootstrap resampling (mean Jaccard = 0.90) and never dissolved, whereas Cluster 2 was only moderately stable (mean Jaccard = 0.67) and dissolved in 24% of resamples. Prediction strength for k = 2 was 0.72, below the threshold of 0.8 recommended for well-supported clusters and fell to 0.49 and 0.35 for k = 3 and k = 4. In the leave-one-site-out analysis, 90–100% of held-out samples were assigned to the same cluster as in the full analysis for every site, and omitting any one site changed the partition of the remaining samples only moderately (ARI = 0.66–1.00), so the near-neutral group did not depend on a single site.
Table 7.
Validation and sensitivity of the two-cluster solution.
Agreement with the primary partition was high when B was included (ARI = 0.93), for log-transformed data (0.94), when the most extreme samples were removed (0.93), and for k-means (0.84), and moderate for untransformed data (0.71) and when Al (0.76) or EC (0.71) was excluded (Table 7; Figure 6b). Adding the seven bootstrap-generated records also gave only moderate agreement (ARI = 0.71) and enlarged the near-neutral cluster (98/44), because six of the seven records were near-neutral copies of Turkey Creek East samples; the generated records therefore do not change the component structure but would shift cluster boundaries, which is a further reason for excluding them. In contrast, Ward clustering on rank-transformed data, on retained component scores, or without LR and PSR did not reproduce the acidic/near-neutral partition and instead separated a handful of extreme samples or produced an unrelated split. Extreme values therefore influenced the Ward cluster assignments, and the acidic/near-neutral partition is recovered mainly when acidity indicators, including LR, carry weight in the distance matrix. On the PC1–PC2 plane (Figure 6a), the two clusters occupied the two ends of a continuous acidity gradient rather than separate groups, while the trace-metal gradient (PC2) cut across both clusters.
Figure 6.
(a) Sample scores on the acidity/base-cation (PC1) and trace-metal (PC2) components, by site and Ward cluster. (b) Adjusted Rand index between the primary two-cluster solution and alternative specifications; bar labels give the index and the resulting cluster sizes. In (a), open symbols are Cluster 1 (acidic) and filled symbols are Cluster 2 (near-neutral); the PC2 axis is broken between 1.6 and 2.9, where there are no samples, so that the densely clustered samples can be shown at a larger scale.
The clusters differed in 11 of the 18 properties after Holm adjustment (Table 8). Cluster 2 had higher pH, buffer pH, EC, Ca, Mg, Na, Zn, Cu, and Mn and lower LR and P than Cluster 1; PSR, OM, K, Fe, Al, B, and Ni did not differ. The largest effect sizes were for LR (r = 0.72), pH (0.66), buffer pH (0.64), Mg (0.51), and Ca (0.50), whereas the differences in EC, Zn, Mn, Na, Cu, and P were small to moderate (r = 0.25–0.41). Because these properties were used to form the clusters, the comparison characterizes the clusters but does not validate them. The partition corresponded closely to simple soil-test criteria: 128 of 135 samples (94.8%) were classified identically by the rule pH ≥ 6.0, and 127 (94.1%) by LR = 0. The few mismatches lay on both sides of each threshold: under the pH rule, five Cluster 1 samples had pH ≥ 6.0 and two Cluster 2 samples had pH < 6.0; under the LR rule, six Cluster 1 samples had no lime recommended and two Cluster 2 samples had lime recommended. Cluster membership was associated with site (χ2(6) = 22.2, permutation p = 0.0012; Cramér’s V = 0.41), but not one-to-one (Table 9): Fayette contributed no samples to Cluster 2, whereas Turkey Creek East (8 of 13) and Raleigh (7 of 20) contributed many, and every other site contained samples of both types.
Table 8.
Cluster profiles (medians) and Mann–Whitney U comparisons.
Table 9.
Cluster membership by site (n = 135).
4. Discussion
Across the five analytical stages, a consistent picture emerges: the seven legacy coal-mined sites differ significantly in most soil properties, but at the sample level these differences are organized along a small number of continuous chemical gradients rather than into discrete soil classes that coincide with sites. Section 4.1, Section 4.2 and Section 4.3 address the three research questions, Section 4.4 considers what the results do and do not imply for reclamation planning and bioenergy-crop evaluation, and Section 4.5 discusses limitations.
4.1. Do Soil Fertility Indicators Differ Among Sites? (RQ1)
After correcting for multiple testing, all 18 properties differed among sites, so for these seven sites the answer to RQ1 is affirmative for all measured properties, including pH, organic matter, and macro- and micronutrients. Two qualifications apply. First, the B differences, which had the largest nominal effect, coincided with laboratory batch and cannot be attributed to the sites; site differences in LR may likewise be partly procedural because LR depends on the laboratory’s crop-code-specific target pH. Second, the moderate-to-high intraclass correlations show that samples within a site are not independent replicates of a site-level condition. Because we sampled only seven sites and could not quantify site history, the results show that these sites differ, but not why, or how far those differences generalize to other legacy coal-mined sites [12,46].
Although its effect size was smaller than those for Na, Mn, or OM, soil acidity is highlighted here because it determines liming need and defines the dominant multivariate gradient (PC1), and it was therefore the most management-relevant site difference: pH spanned 3.7 to 8.0, three-quarters of samples received a non-zero lime recommendation, and Turkey Creek East was the least acidic site. Native, unmined Appalachian forest soils are typically slightly to moderately acidic, with pH commonly about 4.5–6.5 [57], and some central Appalachian forest surface soils average pH 3.7–3.9 [58]. The range observed here therefore spans both the acidic end of the native forest-soil baseline and the alkaline range typical of fresh, carbonate-bearing spoil. Persistent inter-site differences in pH on reclaimed surface mines have been linked to the residual acid-generating or neutralizing potential of spoil [8,11,59]; because acid–base accounting data were not available for these sites, this explanation is consistent with, but not tested by, the present data.
4.2. Which Properties Explain the Greatest Variation? (RQ2)
The PCA identified three reproducible gradients. PC1, the largest, combined pH, buffer pH, Ca, Mg, EC, and (inversely) LR. This grouping aligns with the well-established relationship that acidic conditions coincide with lower exchangeable base-cation supply [11], and it was the most robust feature across all specifications. Acidity is therefore both the property set that differs among sites and the dimension along which samples vary most.
PC2 grouped Zn, Ni, Cu, and Na and was largely independent of PC1. In mine-impacted settings, acidic conditions are often expected to mobilize trace metals [60], so the independence of PC2 from the acidity gradient suggests that, in this dataset, extractable trace-metal concentrations are not simply a function of current pH. One possible explanation is variation in the trace-metal content of the overburden and spoil materials placed at the surface during regrading [61], as has been reported for other coal-mining-impacted soils with heterogeneous source materials [62]. Because we did not measure lithology, spoil placement, or metal speciation, this interpretation is a hypothesis for future testing rather than an established mechanism. A few individual samples from Webster, Monongalia, and Turkey Creek East drove the PC2 extremes rather than whole sites.
PC3 is grouped Mehlich-3 P, PSR, and K and represents plant-available phosphorus status. The close association between P and PSR is expected because PSR is the molar ratio of P to (Al + Fe) [37]. All PSR values were below the 10% threshold above which acid soils shift from phosphorus sinks to potential sources [38], so the PC3 gradient describes differences in P supply rather than an environmental P-loss risk. Fayette, the site with the highest OM, also had the highest P and PSR, but the available records cannot determine whether this reflects organic amendments, vegetation history, or parent material.
PC4 (Al–Fe) and PC5 (Mn–OM) were less reproducible and are interpreted cautiously. The weak association of OM with acidity and nutrient properties, and its negative association with Mn, could reflect organic complexation of Mn, differences in vegetation and litter inputs, or the inclusion of geogenic coal carbon in OM measurements, which can substantially inflate apparent organic matter in mine soils [39]. This study did not distinguish these alternatives, so OM values, particularly the high values at Fayette, should not be read directly as indicators of biological soil fertility. Taken together, the answer to RQ2 is that sample-level variation is multidimensional: acidity/base-cation status, trace-metal enrichment, and phosphorus availability vary largely independently, so acidity alone is an incomplete proxy for overall soil condition.
4.3. Can Samples Be Grouped into Distinct Classes? (RQ3)
Ward clustering produced a two-group partition: an acidic, lime-requiring group (Cluster 1) separated from a near-neutral group with higher Ca, Mg, EC, and trace-metal concentrations (Cluster 2). However, the stability assessment qualifies this result in three ways. First, separation was weak (silhouette = 0.27), and prediction strength (0.72) did not reach the level indicating well-supported clusters [18]. Second, only the acidic group remained stable under resampling; the near-neutral group dissolved in about a quarter of bootstrap replicates [17], although it was not driven by any single site. Third, the partition was sensitive to how extreme values and derived acidity variables were handled, and it was almost entirely reproduced by a single threshold of pH 6.0.
The answer to RQ3 is therefore that samples can be divided into an acidic majority and a smaller, less coherent near-neutral group, but these are better understood as the two ends of a continuous acidity gradient (Figure 6a) than as distinct soil classes. The classification is exploratory: it has been checked internally by resampling and site-exclusion, but it has not been validated against an independent set of sites. Because a simple pH threshold reproduces the partition, the cluster analysis adds little operational value beyond routine soil testing for classifying acidity, although it confirms that acidity is the dominant axis of differentiation. Its main contribution is showing that trace-metal enrichment (PC2) is a separate dimension not captured by acidity classes and needs independent assessment.
Cluster membership was associated with site but was far from a one-to-one correspondence: Fayette contained only acidic samples, whereas Turkey Creek East and Raleigh contained both types in substantial proportions. Within-site heterogeneity of this kind is common on reclaimed mines, where uneven spoil placement, compaction, and patchy liming during reclamation can produce mosaic soil-chemistry patterns within a single area [11]; in the present study, these processes were not documented, so the mixed sites are best treated as candidates for denser sampling rather than as evidence of a specific mechanism. Practically, site identity alone is not a reliable basis for a single site-wide soil prescription at mixed sites.
4.4. Implications for Reclamation Planning and Future Bioenergy-Crop Trials
This study did not include crop establishment, biomass yield, plant-tissue, or crop-specific tolerance measurements, so it cannot establish the suitability or productivity of any bioenergy crop on these sites. Its implications are limited to the soil-chemistry conditions that any revegetation strategy, including energy-crop plantings, must accommodate, and to the design of the field trials needed to evaluate such strategies.
Three implications follow. First, acidity is the most widespread constraint: most samples received a non-zero lime recommendation, so field trials on these sites should either include liming treatments or test species and cultivars across the observed pH range rather than at a single site-average pH. Second, trace-metal status varies independently of acidity and should be measured directly rather than inferred from pH or site identity. Dataset maxima for Zn (79 mg kg−1) and Cu (32 mg kg−1) were below the U.S. EPA ecological soil screening levels for plants (160 and 70 mg kg−1), whereas five samples, three of them from Turkey Creek East, exceeded the plant screening level for Mn (220 mg kg−1) [63,64,65]. Screening levels are conservative benchmarks for total concentrations rather than Mehlich-3 extractable concentrations, and plant response depends on speciation, bioavailability, pH, and species; these exceedances therefore identify locations where Mn tolerance should be included in trial design, not demonstrated phytotoxicity. Third, because acidic and near-neutral samples co-occur within several sites, trial plots should be located using sample-level soil testing, with sampling dense enough to determine whether contrasting conditions are spatially extensive enough to manage separately.
Examples of species evaluated on acidic or metal-enriched mine soils elsewhere illustrate what such trials could include, but they are candidates for testing, not recommendations. Switchgrass (Panicum virgatum) and giant miscanthus (Miscanthus × giganteus) have been established and harvested for five years on reclaimed surface mines in West Virginia, although on soils that were near neutral after reclamation [66], so their performance at the pH < 5 conditions that dominated Cluster 1 is untested. Native willows (Salix discolor and S. eriocephala) grew on strongly acidic (pH 3.6) clay overburden at a former mine without visible signs of metal toxicity, with growth limited mainly by low pH and moisture stress [67], and willow and poplar short-rotation coppice has been evaluated as a bioenergy option on metal-contaminated soils [68]. Such acid- and metal-tolerant candidates would be most relevant to the acidic, lime-requiring conditions of Cluster 1 and to locations with elevated Mn or trace metals, respectively. The vegetation observed at the sampled sites (Supplementary Figure S6) shows that the present soil conditions do not preclude plant cover, with forest or herbaceous cover established on at least part of every site; however, the largely bare coal-refuse surface at Turkey Creek East, the site with most of the Mn screening-level exceedances, and the bare refuse piles at Marion indicate that establishment cannot be assumed everywhere. Whether any of these species would establish and yield on the present sites, with or without liming, has not been tested.
Accordingly, the results support a soil-test-based screening sequence: define acidity and trace-metal constraints from soil tests, verify the spatial extent of contrasting conditions, and then evaluate candidate species, liming, and amendment treatments in replicated field trials that measure establishment, biomass, and tissue chemistry. Field validation should also account for the water regime of the upper soil profile, because productive soil moisture can strongly influence crop emergence, subsequent development, and final yield even where soil chemistry is similar [69]. Species-level recommendations should be based on such trials rather than on soil chemistry or reported tolerance under controlled conditions.
4.5. Limitations
Several limitations should be considered. First, the sampling design limits inference: the study includes only seven sites, samples are subsamples within sites, and researchers located sampling points by accessibility rather than using a probability-based design, so steep, densely vegetated, or inaccessible parts of sites may be under-represented. If nearby samples are spatially autocorrelated, the effective sample size is smaller than the number of samples and within-site variability may be under- or over-represented [49]; site-level p-values should therefore be interpreted as descriptive of these sites. Positive within-site spatial autocorrelation was detected mainly for acidity-related properties at Marion and Monongalia (Section 3.3), which confirms that nearby samples at these sites are not fully independent; at the other sites, the sampled spacing (median nearest-neighbor distance 18–41 m) did not reveal property-level spatial structure (Glen Rogers Rd showed only a weak overall relation between distance and chemical dissimilarity), but finer-scale structure cannot be excluded. We also lacked recorded positions for three samples, which we excluded from the spatial analyses, and the three Webster Ponds samples, about 15 km from the Bolair sub-location, were too few for a separate within-site spatial analysis and were also excluded. In addition, Turkey Creek East is represented by 13 samples rather than the target of 20, so its site summaries are less precise than those of the other sites; the rank-based tests used do not require equal group sizes, and in the leave-one-site-out analysis all 13 Turkey Creek East samples were assigned to the same clusters when the site was omitted, although omitting it changed the partition of the remaining samples moderately (Table 7; Section 3.5). Future sampling should use a stratified or systematic design with documented spacing where access permits and include more sites to allow site-level replication. Second, public records establish the regulatory status of each site (pre-law AML problem area, active or released permit, or forfeited-bond site) but not reclamation dates, methods, or materials; reclamation age, prior land use, lime and amendment history, and spoil characteristics were therefore not available uniformly, so their contributions to site differences could not be separated; site differences reflect these factors jointly. Third, analytical batch was partly confounded with site. B showed a clear batch effect and was excluded from multivariate analyses, and Na and LR may also be affected; future work should randomize samples across batches and include reference samples in every batch. Fourth, the KMO value (0.645) is modest, Al had a low MSA, and PC4 and PC5 were not robust, so only the first three components should be treated as reliable descriptions of the data. Fifth, the two-cluster solution is weakly separated and only partly stable, and it has not been validated with independent sites; it should be treated as an exploratory description of an acidity gradient. Finally, OM may include geogenic coal carbon, and the soil-test properties analyzed here do not include cation exchange capacity, physical properties, total metals, metal speciation, or biological indicators, all of which affect plant performance. Soil chemical properties alone may not fully characterize crop-establishment potential, because the physical condition of the root zone and the associated soil-moisture availability can directly affect plant development and productivity [70]; on reclaimed mine soils, where compaction, coarse fragments, and shallow rooting depth are common [10], bulk density, rock-fragment content, water-holding capacity, and rooting-zone moisture should be measured alongside soil chemistry in future work. Recent work on reclaimed mine soils also shows that soil quality indices combining physical, chemical, and biological indicators change with revegetation type and reclamation age [71], so multi-indicator, time-series assessments would be needed to evaluate reclamation trajectories at these sites.
5. Conclusions
This study compared soil chemistry across seven legacy coal-mined sites in Appalachia using a consistent workflow that explicitly assessed the robustness of its multivariate results. For RQ1, all 18 soil-test properties differed among the sites after correction for multiple testing, although boron differences reflected laboratory batch and within-site samples were moderately to strongly correlated, so the differences describe these sites rather than legacy coal-mined sites in general. For RQ2, we organized sample-level variation along three reproducible, largely independent gradients: acidity/base-cation status, trace-metal enrichment, and phosphorus availability. For RQ3, samples could be divided into an acidic, lime-requiring majority and a smaller near-neutral group, but the separation was weak; only the acidic group was stable, and the partition was almost entirely reproduced by a pH threshold of 6.0; the classification is therefore an exploratory description of a continuous acidity gradient rather than a validated set of soil classes.
For reclamation planning, these results indicate that acidity and trace-metal status should be assessed separately at the sample rather than the site level, before revegetation. The study does not evaluate crop performance; determining whether specific bioenergy or reclamation species suit these soils will require replicated field trials that measure establishment, biomass yield, and plant-tissue chemistry across the acidity and trace-metal conditions documented here.
Supplementary Materials
The following supporting information can be downloaded at: https://www.mdpi.com/article/10.3390/soilsystems10100128/s1, Figure S1: Acidity and buffering indicators (pH, buffer pH, lime requirement, and EC) by site; Figure S2: Organic matter and nutrient indicators (OM, PSR, P, and K) by site; Figure S3: Exchangeable macro-cations (Ca, Mg, and Na) by site; Figure S4: Micronutrients and trace elements (Fe, Al, B, Zn, Cu, Mn, and Ni) by site; Figure S5: Sampling positions within each of the seven sites; Figure S6: Site photographs taken at the time of sampling; Table S1: By-site descriptive statistics for 18 soil properties (mean, median, SD, minimum, maximum); Table S2: Significant pairwise site comparisons (Dunn’s test; Bonferroni-adjusted p < 0.05) for properties with a significant Holm-adjusted Kruskal–Wallis test; Table S3: Spearman rank correlation matrix for 18 soil properties (n = 135); Table S4: Within-site Shapiro–Wilk p-values and Brown–Forsythe tests of homogeneity of variance among sites; Table S5: Pooled-sample distributional statistics (all sites combined; reported for completeness only); Table S6: Per-variable measures of sampling adequacy (MSA) for the primary PCA (17 properties, n = 135); Table S7: Extractable boron and sodium by site and laboratory receipt date; Table S8: Dataset reconciliation from the laboratory export to the analysis dataset; Table S9: Laboratory methods used by the WVU Davis College Soil Testing Laboratory for the 18 soil properties; Table S10: Sampled extent, spacing of sampling positions, and Mantel tests of geographic versus soil-chemical distance by site; Table S11: Within-site global Moran’s I for each soil property (inverse-distance weights); Table S12: Public mine-land records at the sampling positions of each site; Data S1: Sample-level soil-test dataset (135 samples).
Author Contributions
Conceptualization, D.M.; methodology, D.M.; software, D.M.; validation, J.W., J.S. and S.G.; formal analysis, D.M.; investigation, D.M. and J.S.; resources, J.W., J.S. and S.G.; data curation, D.M.; writing—original draft preparation, D.M.; writing—review and editing, D.M., J.W., J.S. and S.G.; visualization, D.M.; supervision, J.W.; project administration, J.W.; funding acquisition, J.W. All authors have read and agreed to the published version of the manuscript.
Funding
This research was initiated at West Virginia University under the DOE-NETL Legacy Mine Project (Award No. DE-FE0032212), titled Integrated Life Cycle and Techno-Economic Assessments of Central Appalachian Legacy Mine Sites for Biomass Development and Waste Coal Utilization, with primary funding from the United States Department of Energy–National Energy Technology Laboratory (DOE-NETL); additional support came from MASBio Competitive Grant No. 2020-68012-31881, funded by the United States Department of Agriculture (USDA) National Institute of Food and Agriculture (NIFA), and through North Carolina State University College of Natural Resources faculty startup funds.
Institutional Review Board Statement
Not applicable.
Informed Consent Statement
Not applicable.
Data Availability Statement
The sample-level soil-test dataset (135 samples, 18 properties, site, county and state, and sub-location, sampling and laboratory receipt dates, position status, and sampling coordinates rounded to 0.001°, about 100 m, to protect the locations of privately owned sites) is provided as Supplementary Data S1. The analysis scripts are available from the corresponding author on reasonable request.
Acknowledgments
The authors gratefully acknowledge Eugenia Pena-Yewtukhiw (WVU Soil Testing Laboratory at West Virginia University) for assistance with soil testing and analysis and for her comments throughout the study, and Kevin McCandless (West Virginia University) for assistance with field logistics. During the preparation of this manuscript, the authors used generative AI tools (ChatGPT, GPT-6, OpenAI, San Francisco, CA, USA; Perplexity Computer, Perplexity AI (https://www.perplexity.ai/, accessed on 5 October 2026), San Francisco, CA, USA; and Grammarly Pro (https://www.grammarly.com/pro, accessed on 5 October 2026), Superhuman Platform Inc., San Francisco, CA, USA) for language editing and for assistance with statistical scripting. The authors have reviewed and edited all output and take full responsibility for the content of this publication.
Conflicts of Interest
The authors declare no conflicts of interest.
References
- Zipper, C.E.; Adams, M.B.; Skousen, J. The Appalachian Coalfield in Historical Context. In Appalachia’s Coal-Mined Landscapes; Zipper, C.E., Skousen, J., Eds.; Springer: Cham, Switzerland, 2021; pp. 1–26. [Google Scholar] [CrossRef] [Scilit]
- Pericak, A.A.; Thomas, C.J.; Kroodsma, D.A.; Wasson, M.F.; Ross, M.R.V.; Clinton, N.E.; Campagna, D.J.; Franklin, Y.; Bernhardt, E.S.; Amos, J.F. Mapping the Yearly Extent of Surface Coal Mining in Central Appalachia Using Landsat and Google Earth Engine. PLoS ONE 2018, 13, e0197758. [Google Scholar] [CrossRef] [Scilit] [PubMed]
- Office of Surface Mining Reclamation and Enforcement. Enhanced Abandoned Mine Land Inventory System (e-AMLIS): Problems Status Map Service. Available online: https://eamlis.osmre.gov/arcgis/rest/services/ProblemsStatus/MapServer (accessed on 5 October 2026).
- Kendrick, K.; Kim, Y. Abandoned Mine Land Program: Examining Public Participation in Decision-Making. Rev. Policy Res. 2025, 42, 629–657. [Google Scholar] [CrossRef] [Scilit]
- Petty, J.T.; Gutta, B.; Herd, R. Identifying Cost-Effective Restoration Strategies in Mining Impacted West Virginia Watersheds. J. Am. Soc. Min. Reclam. 2008, 2008, 837–855. [Google Scholar] [CrossRef] [Scilit]
- Skousen, J.G.; Johnson, C.D.; Garbutt, K. Natural Revegetation of 15 Abandoned Mine Land Sites in West Virginia. J. Environ. Qual. 1994, 23, 1224–1230. [Google Scholar] [CrossRef] [Scilit]
- Sopper, W.E. Reclamation of Mine Land Using Municipal Sludge. In Soil Restoration; Lal, R., Stewart, B.A., Eds.; Advances in Soil Science; Springer: New York, NY, USA, 1992; Volume 17, pp. 351–431. [Google Scholar] [CrossRef] [Scilit] [PubMed]
- Skousen, J. A Methodology for Geologic Testing for Land Disturbance: Acid-Base Accounting for Surface Mines. Geoderma 2017, 308, 302–311. [Google Scholar] [CrossRef] [Scilit]
- Sandor, J.A.; Burras, C.L.; Thompson, M. Factors of Soil Formation: Human Impacts. In Encyclopedia of Soils in the Environment; Hillel, D., Ed.; Elsevier: Oxford, UK, 2005; pp. 520–532. [Google Scholar] [CrossRef] [Scilit]
- Shrestha, R.K.; Lal, R. Changes in Physical and Chemical Properties of Soil after Surface Mining and Reclamation. Geoderma 2011, 161, 168–176. [Google Scholar] [CrossRef] [Scilit]
- Feng, Y.; Wang, J.; Bai, Z.; Reading, L. Effects of Surface Coal Mining and Land Reclamation on Soil Properties: A Review. Earth-Sci. Rev. 2019, 191, 12–25. [Google Scholar] [CrossRef] [Scilit]
- Guan, Y.; Zhou, W.; Bai, Z.; Cao, Y.; Huang, Y.; Huang, H. Soil Nutrient Variations among Different Land Use Types after Reclamation in the Pingshuo Opencast Coal Mine on the Loess Plateau, China. Catena 2020, 188, 104427. [Google Scholar] [CrossRef] [Scilit]
- Snapp, S.S. Soil Nutrient Status of Smallholder Farms in Malawi. Commun. Soil Sci. Plant Anal. 1998, 29, 2571–2588. [Google Scholar] [CrossRef] [Scilit]
- Reza, S.K.; Baruah, U.; Singh, S.K. Multivariate Approaches for Soil Fertility Characterization of Lower Brahmaputra Valley, Assam, India. J. Indian Soc. Soil Sci. 2015, 63, 379–383. Available online: https://epubs.icar.org.in/index.php/JISSS/article/view/56322 (accessed on 5 October 2026). [CrossRef] [Scilit]
- Andrews, S.S.; Karlen, D.L.; Cambardella, C.A. The Soil Management Assessment Framework: A Quantitative Soil Quality Evaluation Method. Soil Sci. Soc. Am. J. 2004, 68, 1945–1962. [Google Scholar] [CrossRef] [Scilit]
- Asensio, V.; Guala, S.D.; Vega, F.A.; Covelo, E.F. A Soil Quality Index for Reclaimed Mine Soils. Environ. Toxicol. Chem. 2013, 32, 2240–2248. [Google Scholar] [CrossRef] [Scilit] [PubMed]
- Hennig, C. Cluster-Wise Assessment of Cluster Stability. Comput. Stat. Data Anal. 2007, 52, 258–271. [Google Scholar] [CrossRef] [Scilit]
- Tibshirani, R.; Walther, G. Cluster Validation by Prediction Strength. J. Comput. Graph. Stat. 2005, 14, 511–528. [Google Scholar] [CrossRef] [Scilit]
- U.S. Bureau of Labor Statistics. Labor Relations in the Fairmont, West Virginia, Bituminous Coal Field; Bulletin No. 361; U.S. Government Printing Office: Washington, DC, USA, 1924. Available online: https://www.govinfo.gov/content/pkg/SERIALSET-08349_00_00-002-0247-0000/pdf/SERIALSET-08349_00_00-002-0247-0000.pdf (accessed on 5 October 2026).
- Ruppert, L.; Tewalt, S.; Bragg, L. Map Showing Areal Extent of the Pittsburgh Coal Bed and Horizon and Mined Areas of the Pittsburgh Coal Bed in Pennsylvania, Ohio, West Virginia, and Maryland; U.S. Geological Survey Open-File Report 96-280; U.S. Geological Survey: Reston, VA, USA, 1996. Available online: https://pubs.usgs.gov/of/1996/of96-280/ (accessed on 5 October 2026).
- U.S. Department of Agriculture, Soil Conservation Service. Soil Survey of Webster County, West Virginia; U.S. Department of Agriculture: Washington, DC, USA, 1998. Available online: https://www.govinfo.gov/content/pkg/GOVPUB-A57-PURL-LPS105840/pdf/GOVPUB-A57-PURL-LPS105840.pdf (accessed on 5 October 2026).
- U.S. Geological Survey. Description of the Raleigh Quadrangle, West Virginia; Geologic Atlas of the United States, Folio 77; U.S. Geological Survey: Washington, DC, USA, 1901. Available online: https://pubs.usgs.gov/gf/077/text.pdf (accessed on 5 October 2026).
- Tewalt, S.J.; Ruppert, L.F.; Bragg, L.J.; Carlton, R.W.; Brezinski, D.K.; Wallack, R.N.; Butler, D.T. Chapter C—A Digital Resource Model of the Upper Pennsylvanian Pittsburgh Coal Bed, Monongahela Group, Northern Appalachian Basin Coal Region. In 2000 Resource Assessment of Selected Coal Beds and Zones in the Northern and Central Appalachian Basin Coal Regions; U.S. Geological Survey Professional Paper 1625-C; U.S. Geological Survey: Reston, VA, USA, 2001. Available online: https://pubs.usgs.gov/pp/p1625c/CHAPTER_C/CHAPTER_C.pdf (accessed on 5 October 2026).
- Hickok, W.O., IV; Moyer, F.T. Geology and Mineral Resources of Fayette County, Pennsylvania; Pennsylvania Geological Survey, 4th Series, County Report 26; Pennsylvania Geological Survey: Harrisburg, PA, USA, 1940. Available online: https://maps.dcnr.pa.gov/publications/Default.aspx?id=55 (accessed on 5 October 2026).
- West Virginia Department of Environmental Protection, Technical Applications and GIS Unit. GIS Data: Abandoned Mine Lands (Problem Areas). Available online: https://tagis.dep.wv.gov/home/gis%20data (accessed on 5 October 2026).
- West Virginia Department of Environmental Protection, Technical Applications and GIS Unit. GIS Data: Mining and Reclamation (Permit Boundary, Refuse Structures) and Special Reclamation (Special Reclamation Boundaries). Available online: https://tagis.dep.wv.gov/home/gis%20data (accessed on 5 October 2026).
- Pennsylvania Department of Environmental Protection. Shapiro Administration Invests an Additional $15.2 Million to Address Largest Inventory of Abandoned Mine Lands in the Nation, Keep Pennsylvanians Safe While Supporting Local Jobs. 12 March 2026. Available online: https://www.pa.gov/agencies/dep/newsroom/2026-03-12-shapiro-administration-invests-an-additional-15-2-million-to-address-largest-aml-inventory-in-nation (accessed on 8 October 2026).
- e-WV: The West Virginia Encyclopedia. Pardee & Curtin Lumber Company. Available online: https://www.wvencyclopedia.org/entries/1750 (accessed on 5 October 2026).
- Coal Camp USA. Glen Rogers, WV. Available online: https://www.coalcampusa.com/sowv/gulf/glenrogers/glenrogers.htm (accessed on 5 October 2026).
- Pena-Yewtukhiw, E.M. Operational Procedures WVU Davis College Soil Testing Lab; Faculty & Staff Scholarship 3286; West Virginia University: Morgantown, WV, USA, 2021; Available online: https://researchrepository.wvu.edu/cgi/viewcontent.cgi?article=4220&context=faculty_publications (accessed on 5 October 2026).
- Sikora, F.J.; Moore, K.P. (Eds.) Soil Test Methods from the Southeastern United States; Southern Cooperative Series Bulletin No. 419; Southern Extension and Research Activity Information Exchange Group-6 (SERA-IEG-6); Clemson University: Clemson, SC, USA, 2014; Available online: https://aesl.ces.uga.edu/sera6/MethodsManualFinalSERA6.pdf (accessed on 5 October 2026).
- Northeast Coordinating Committee for Soil Testing (NECC-1312). Recommended Soil Testing Procedures for the Northeastern United States, 3rd ed.; Northeastern Regional Publication No. 493; Agricultural Experiment Station, University of Delaware: Newark, DE, USA, 2011; Available online: https://www.udel.edu/academics/colleges/canr/cooperative-extension/fact-sheets/soil-testing-procedures-northeastern-US/ (accessed on 5 October 2026).
- Mehlich, A. New Buffer pH Method for Rapid Estimation of Exchangeable Acidity and Lime Requirement of Soils. Commun. Soil Sci. Plant Anal. 1976, 7, 637–652. [Google Scholar] [CrossRef] [Scilit]
- Nelson, D.W.; Sommers, L.E. Total Carbon, Organic Carbon, and Organic Matter. In Methods of Soil Analysis. Part 3. Chemical Methods; Sparks, D.L., Ed.; SSSA Book Series 5; Soil Science Society of America: Madison, WI, USA, 1996; pp. 961–1010. [Google Scholar] [CrossRef] [Scilit]
- Rhoades, J.D. Salinity: Electrical Conductivity and Total Dissolved Solids. In Methods of Soil Analysis. Part 3. Chemical Methods; Sparks, D.L., Ed.; SSSA Book Series 5; Soil Science Society of America: Madison, WI, USA, 1996; pp. 417–435. [Google Scholar] [CrossRef] [Scilit]
- Mehlich, A. Mehlich 3 Soil Test Extractant: A Modification of Mehlich 2 Extractant. Commun. Soil Sci. Plant Anal. 1984, 15, 1409–1416. [Google Scholar] [CrossRef] [Scilit]
- Sims, J.T.; Maguire, R.O.; Leytem, A.B.; Gartley, K.L.; Pautler, M.C. Evaluation of Mehlich 3 as an Agri-Environmental Soil Phosphorus Test for the Mid-Atlantic United States of America. Soil Sci. Soc. Am. J. 2002, 66, 2016–2032. [Google Scholar] [CrossRef] [Scilit]
- Dari, B.; Nair, V.D.; Sharpley, A.N.; Kleinman, P.; Franklin, D.; Harris, W.G. Consistency of the Threshold Phosphorus Saturation Ratio across a Wide Geographic Range of Acid Soils. Agrosyst. Geosci. Environ. 2018, 1, 180028. [Google Scholar] [CrossRef] [Scilit]
- Ussiri, D.A.N.; Lal, R. Method for Determining Coal Carbon in the Reclaimed Minesoils Contaminated with Coal. Soil Sci. Soc. Am. J. 2008, 72, 231–237. [Google Scholar] [CrossRef] [Scilit]
- Shapiro, S.S.; Wilk, M.B. An Analysis of Variance Test for Normality (Complete Samples). Biometrika 1965, 52, 591–611. [Google Scholar] [CrossRef] [Scilit]
- Brown, M.B.; Forsythe, A.B. Robust Tests for the Equality of Variances. J. Am. Stat. Assoc. 1974, 69, 364–367. [Google Scholar] [CrossRef]
- Kruskal, W.H.; Wallis, W.A. Use of Ranks in One-Criterion Variance Analysis. J. Am. Stat. Assoc. 1952, 47, 583–621. [Google Scholar] [CrossRef]
- Holm, S. A Simple Sequentially Rejective Multiple Test Procedure. Scand. J. Stat. 1979, 6, 65–70. [Google Scholar]
- Tomczak, M.; Tomczak, E. The Need to Report Effect Size Estimates Revisited. An Overview of Some Recommended Measures of Effect Size. Trends Sport Sci. 2014, 21, 19–25. [Google Scholar]
- Dunn, O.J. Multiple Comparisons Using Rank Sums. Technometrics 1964, 6, 241–252. [Google Scholar] [CrossRef]
- Hurlbert, S.H. Pseudoreplication and the Design of Ecological Field Experiments. Ecol. Monogr. 1984, 54, 187–211. [Google Scholar] [CrossRef] [Scilit]
- Moran, P.A.P. Notes on Continuous Stochastic Phenomena. Biometrika 1950, 37, 17–23. [Google Scholar] [CrossRef] [Scilit]
- Benjamini, Y.; Hochberg, Y. Controlling the False Discovery Rate: A Practical and Powerful Approach to Multiple Testing. J. R. Stat. Soc. Ser. B 1995, 57, 289–300. [Google Scholar] [CrossRef] [Scilit]
- Legendre, P. Spatial Autocorrelation: Trouble or New Paradigm? Ecology 1993, 74, 1659–1673. [Google Scholar] [CrossRef] [Scilit]
- Spearman, C. The Proof and Measurement of Association between Two Things. Am. J. Psychol. 1904, 15, 72–101. [Google Scholar] [CrossRef] [Scilit] [PubMed]
- Kaiser, H.F. An Index of Factorial Simplicity. Psychometrika 1974, 39, 31–36. [Google Scholar] [CrossRef] [Scilit]
- Horn, J.L. A Rationale and Test for the Number of Factors in Factor Analysis. Psychometrika 1965, 30, 179–185. [Google Scholar] [CrossRef] [Scilit] [PubMed]
- Lorenzo-Seva, U.; ten Berge, J.M.F. Tucker’s Congruence Coefficient as a Meaningful Index of Factor Similarity. Methodology 2006, 2, 57–64. [Google Scholar] [CrossRef] [Scilit]
- Ward, J.H. Hierarchical Grouping to Optimize an Objective Function. J. Am. Stat. Assoc. 1963, 58, 236–244. [Google Scholar] [CrossRef]
- Rousseeuw, P.J. Silhouettes: A Graphical Aid to the Interpretation and Validation of Cluster Analysis. J. Comput. Appl. Math. 1987, 20, 53–65. [Google Scholar] [CrossRef] [Scilit]
- Hubert, L.; Arabie, P. Comparing Partitions. J. Classif. 1985, 2, 193–218. [Google Scholar] [CrossRef] [Scilit]
- Zipper, C.E.; Burger, J.A.; Barton, C.D.; Skousen, J.G. Rebuilding Soils on Mined Land for Native Forests in Appalachia. Soil Sci. Soc. Am. J. 2013, 77, 337–349. [Google Scholar] [CrossRef] [Scilit]
- Elias, P.E.; Burger, J.A.; Adams, M.B. Acid Deposition Effects on Forest Composition and Growth on the Monongahela National Forest, West Virginia. For. Ecol. Manag. 2009, 258, 2175–2182. [Google Scholar] [CrossRef] [Scilit]
- Stutler, K.; Pena-Yewtukhiw, E.; Skousen, J. Mine Soil Health on Surface Mined Lands Reclaimed to Grassland. Geoderma 2022, 413, 115764. [Google Scholar] [CrossRef] [Scilit]
- Saria, L.; Shimaoka, T.; Miyawaki, K. Leaching of Heavy Metals in Acid Mine Drainage. Waste Manag. Res. 2006, 24, 134–140. [Google Scholar] [CrossRef] [Scilit] [PubMed]
- Skousen, J.; Zipper, C.E. Post-Mining Policies and Practices in the Eastern USA Coal Region. Int. J. Coal Sci. Technol. 2014, 1, 135–151. [Google Scholar] [CrossRef] [Scilit]
- Mandal, A.; Basumatary, R.; Kharbhih, W.J.; Murmu, M.; Dutta, S. Contamination Status and Potential Ecological Risk of Heavy Metals in Coal Mining–Impacted Soils of Jaintia Hills, Meghalaya: Insights from Pollution Indices and Exploratory PCA. Environ. Monit. Assess. 2026, 198, 746. [Google Scholar] [CrossRef] [Scilit] [PubMed]
- U.S. Environmental Protection Agency. Ecological Soil Screening Levels for Copper; OSWER Directive 9285.7-68; Office of Solid Waste and Emergency Response: Washington, DC, USA, 2006. Available online: https://www.epa.gov/sites/default/files/2015-09/documents/eco-ssl_copper.pdf (accessed on 5 October 2026).
- U.S. Environmental Protection Agency. Ecological Soil Screening Levels for Manganese; OSWER Directive 9285.7-71; Office of Solid Waste and Emergency Response: Washington, DC, USA, 2007. Available online: https://www.epa.gov/sites/default/files/2015-09/documents/eco-ssl_manganese.pdf (accessed on 5 October 2026).
- U.S. Environmental Protection Agency. Ecological Soil Screening Levels for Zinc; OSWER Directive 9285.7-73; Office of Solid Waste and Emergency Response: Washington, DC, USA, 2007. Available online: https://www.epa.gov/sites/default/files/2015-09/documents/eco-ssl_zinc.pdf (accessed on 5 October 2026).
- Scagline-Mellor, S.; Griggs, T.; Skousen, J.; Wolfrum, E.; Holásková, I. Switchgrass and Giant Miscanthus Biomass and Theoretical Ethanol Production from Reclaimed Mine Lands. BioEnergy Res. 2018, 11, 562–573. [Google Scholar] [CrossRef] [Scilit]
- Mosseler, A.; Major, J.E. Phytoremediation Efficacy of Salix discolor and S. eriocephala on Adjacent Acidic Clay and Shale Overburden on a Former Mine Site: Growth, Soil, and Foliage Traits. Forests 2017, 8, 475. [Google Scholar] [CrossRef] [Scilit]
- Ruttens, A.; Boulet, J.; Weyens, N.; Smeets, K.; Adriaensen, K.; Meers, E.; Van Slycken, S.; Tack, F.; Meiresonne, L.; Thewys, T.; et al. Short Rotation Coppice Culture of Willows and Poplars as Energy Crops on Metal Contaminated Agricultural Soils. Int. J. Phytoremediat. 2011, 13, 194–207. [Google Scholar] [CrossRef] [Scilit] [PubMed]
- Syromyatnikov, Y.; Semenenko, I.; Orekhovskaya, A.; Troyanovskaya, I.; Bedenko, I.; Sakhapov, R. Influence of Cultivation Technology on the Yield of Winter Wheat. E3S Web Conf. 2023, 443, 02001. [Google Scholar] [CrossRef] [Scilit]
- Pashchenko, V.F.; Syromyatnikov, Y.N.; Khramov, N.S.; Voinash, S.A. The Influence of Local Loosening of the Soil on Soybean Productivity. Tract. Agric. Mach. 2019, 86, 79–86. [Google Scholar] [CrossRef] [Scilit]
- Mou, Y.; Lu, B.; Wang, H.; Wang, X.; Sui, X.; Di, S.; Yuan, J. Evaluative Potential for Reclaimed Mine Soils Under Four Revegetation Types Using Integrated Soil Quality Index and PLS-SEM. Sustainability 2025, 17, 6130. [Google Scholar] [CrossRef] [Scilit]
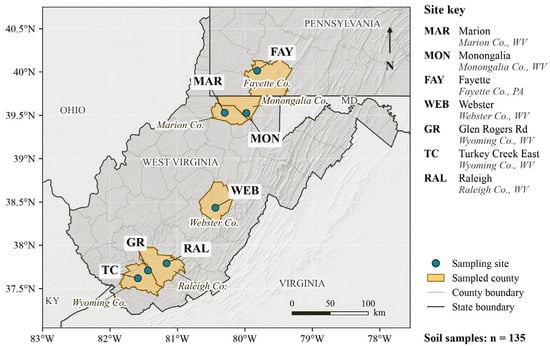
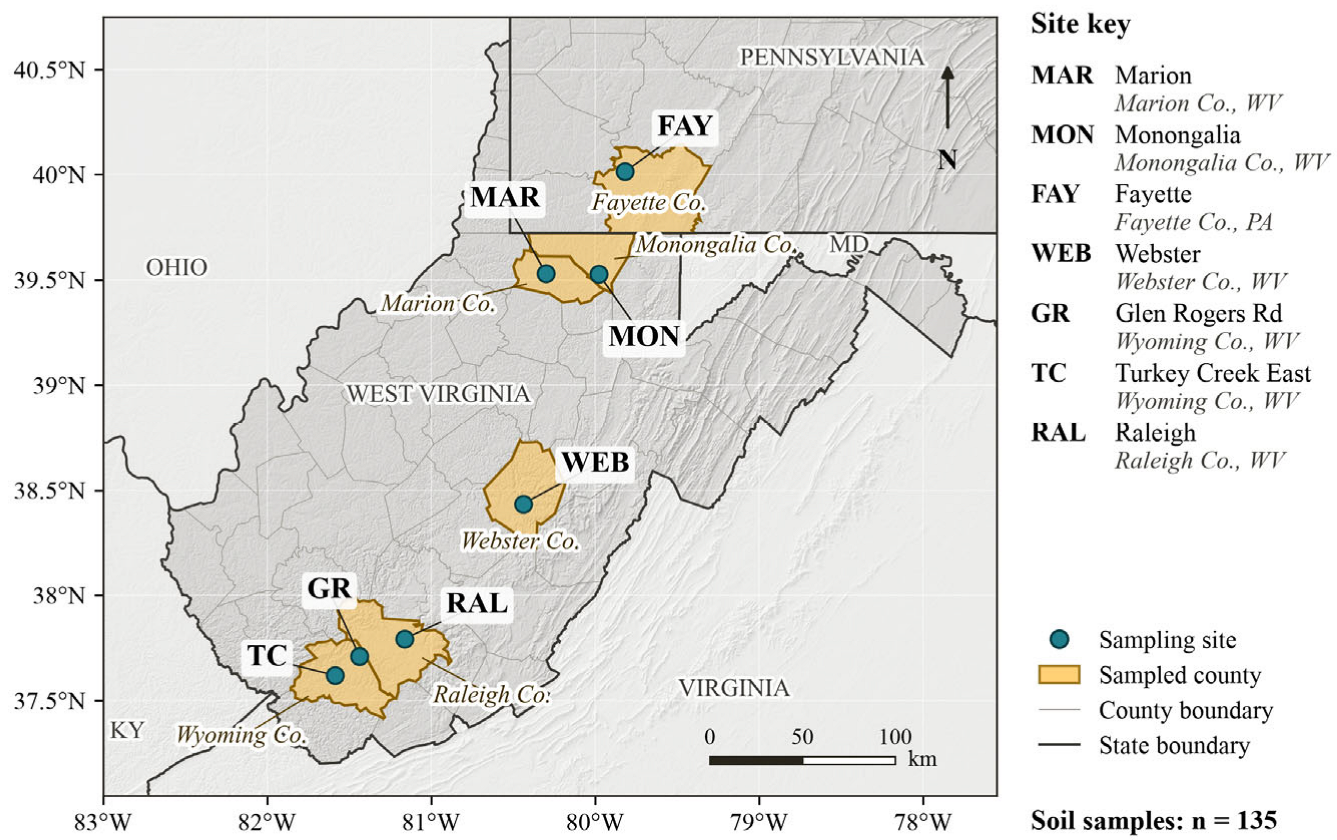
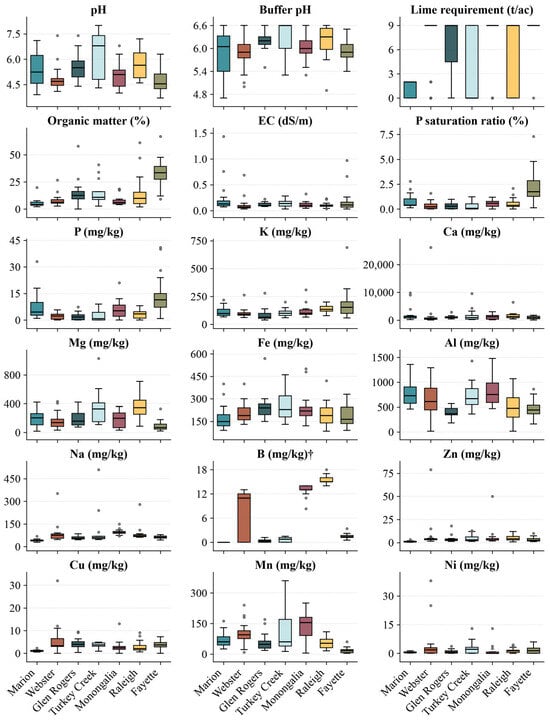
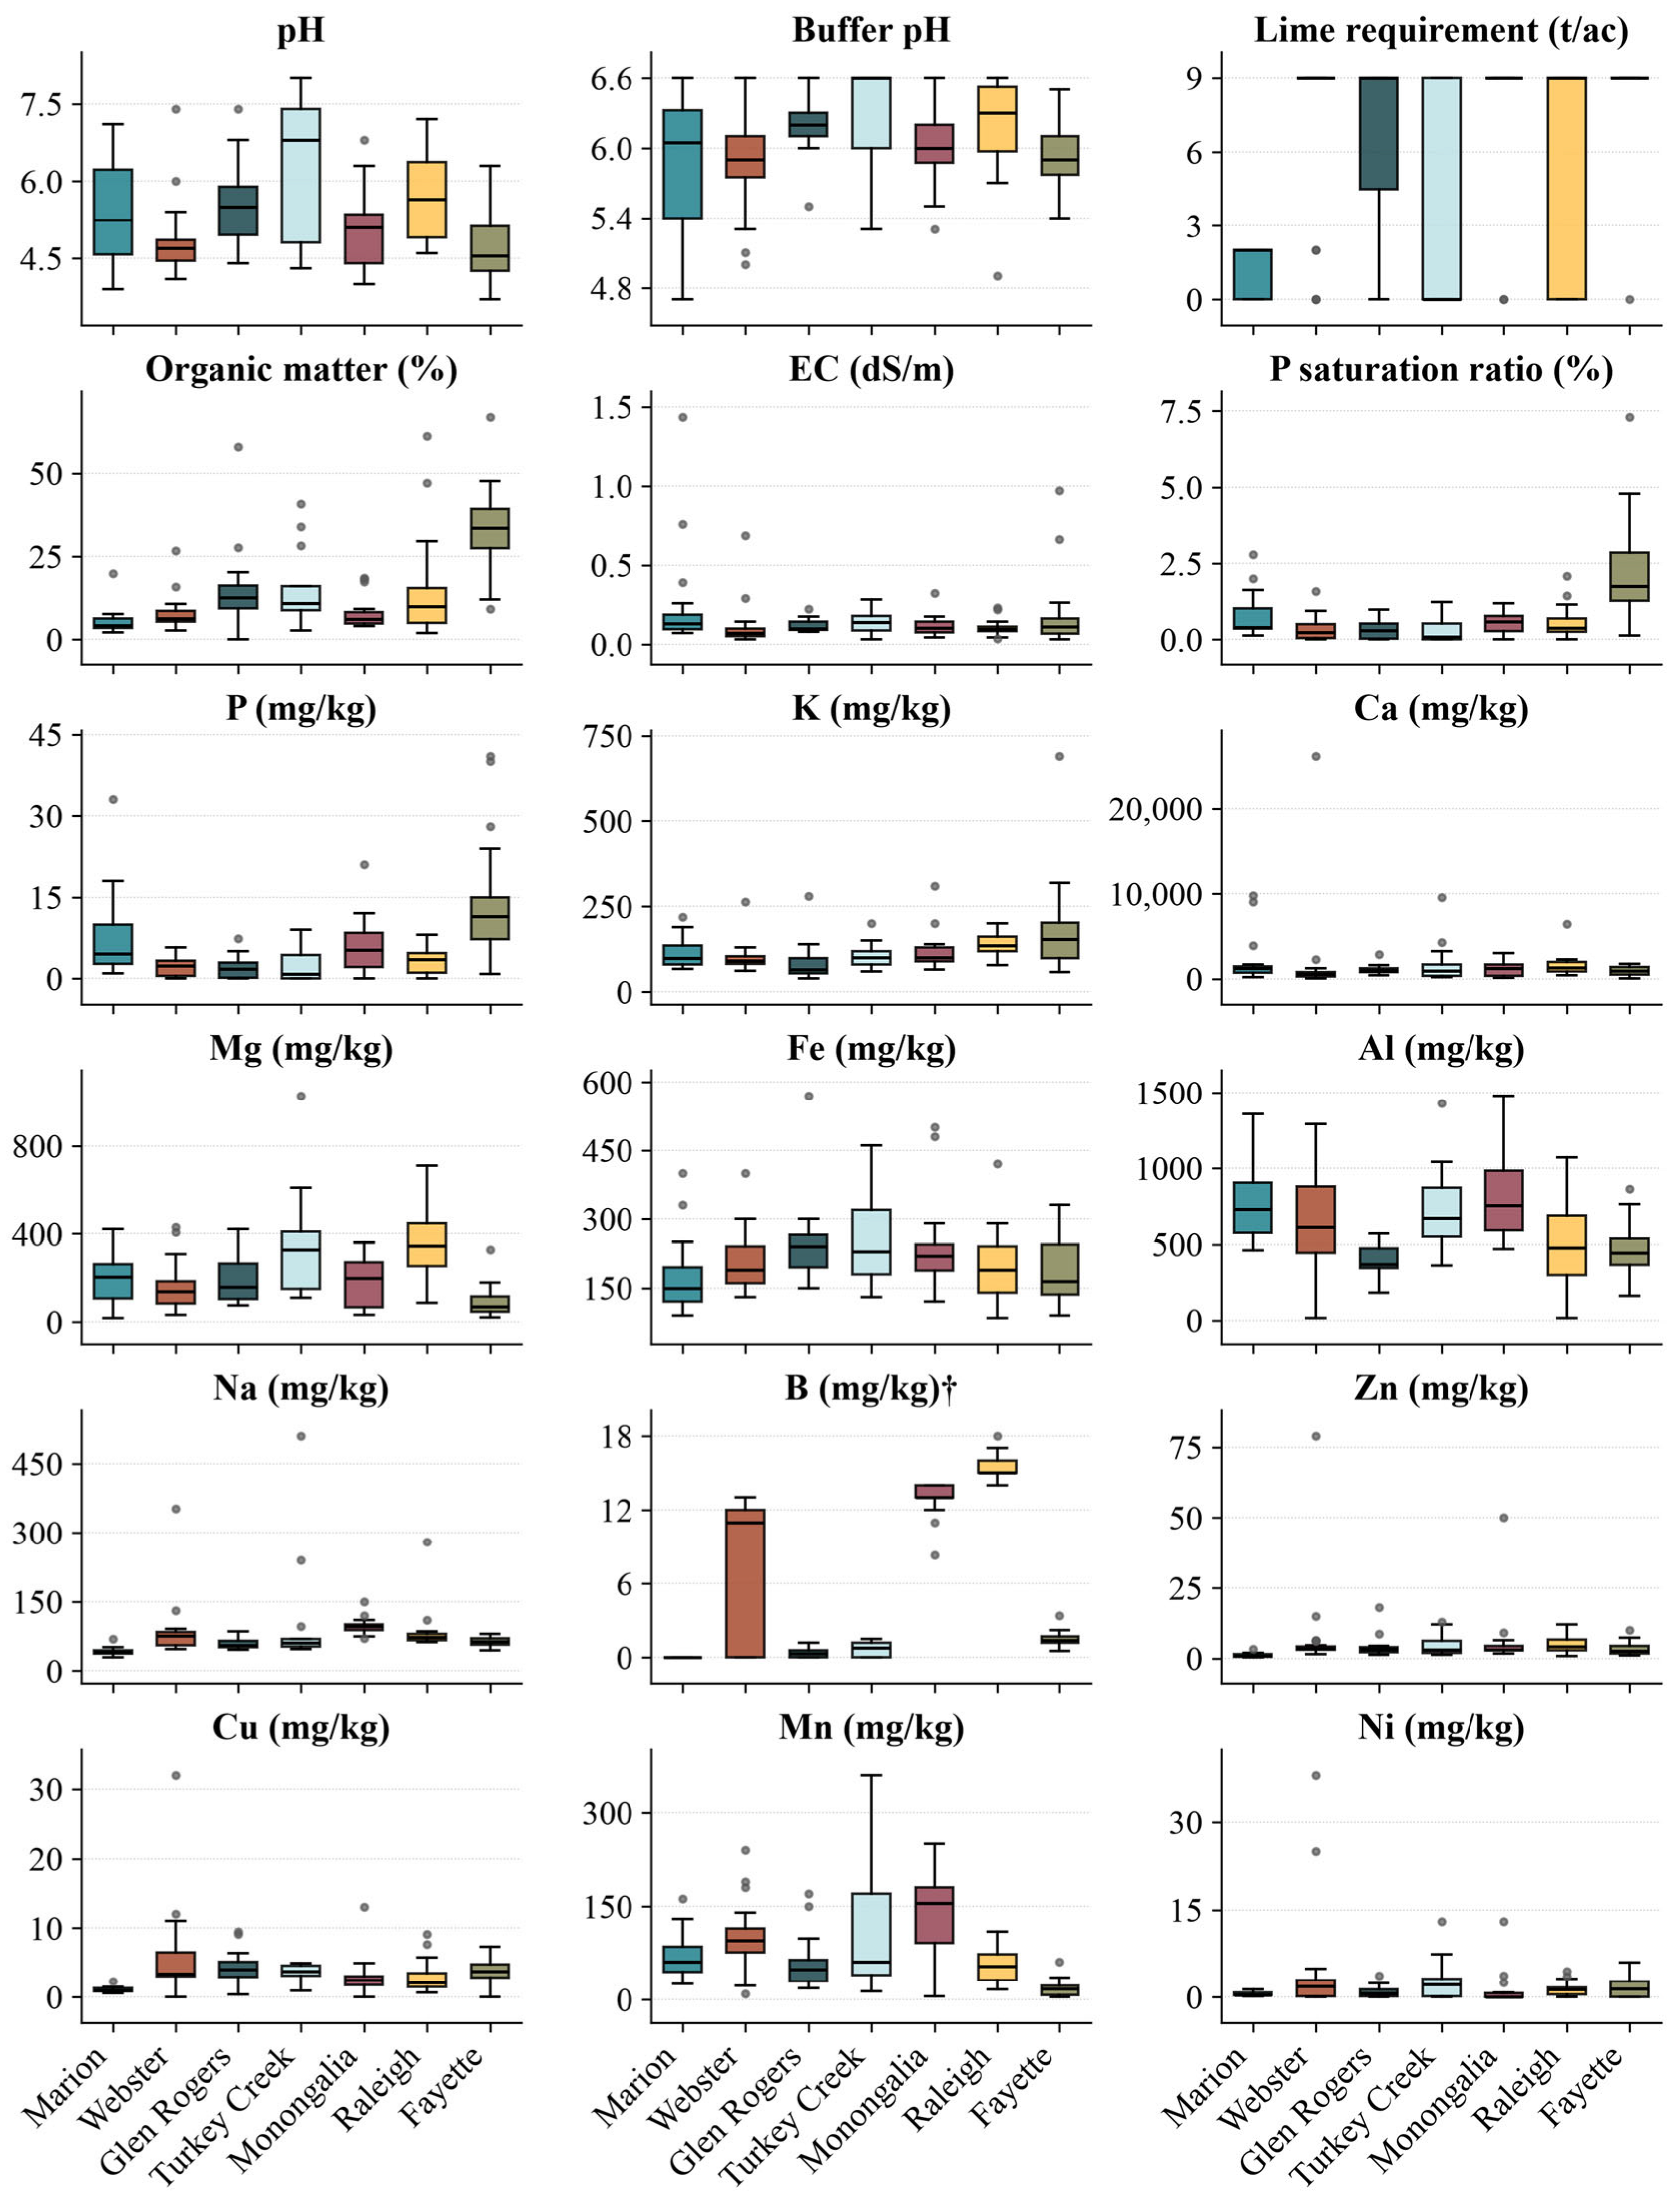
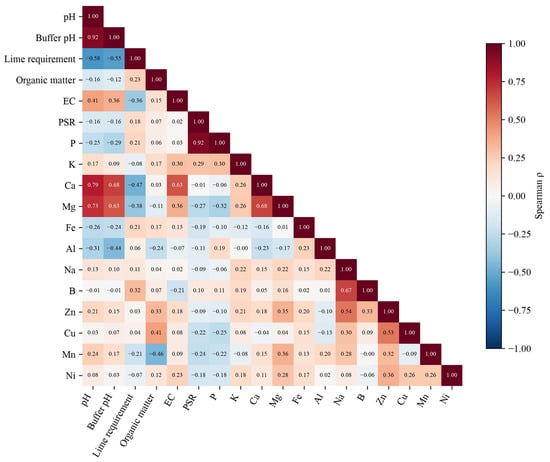
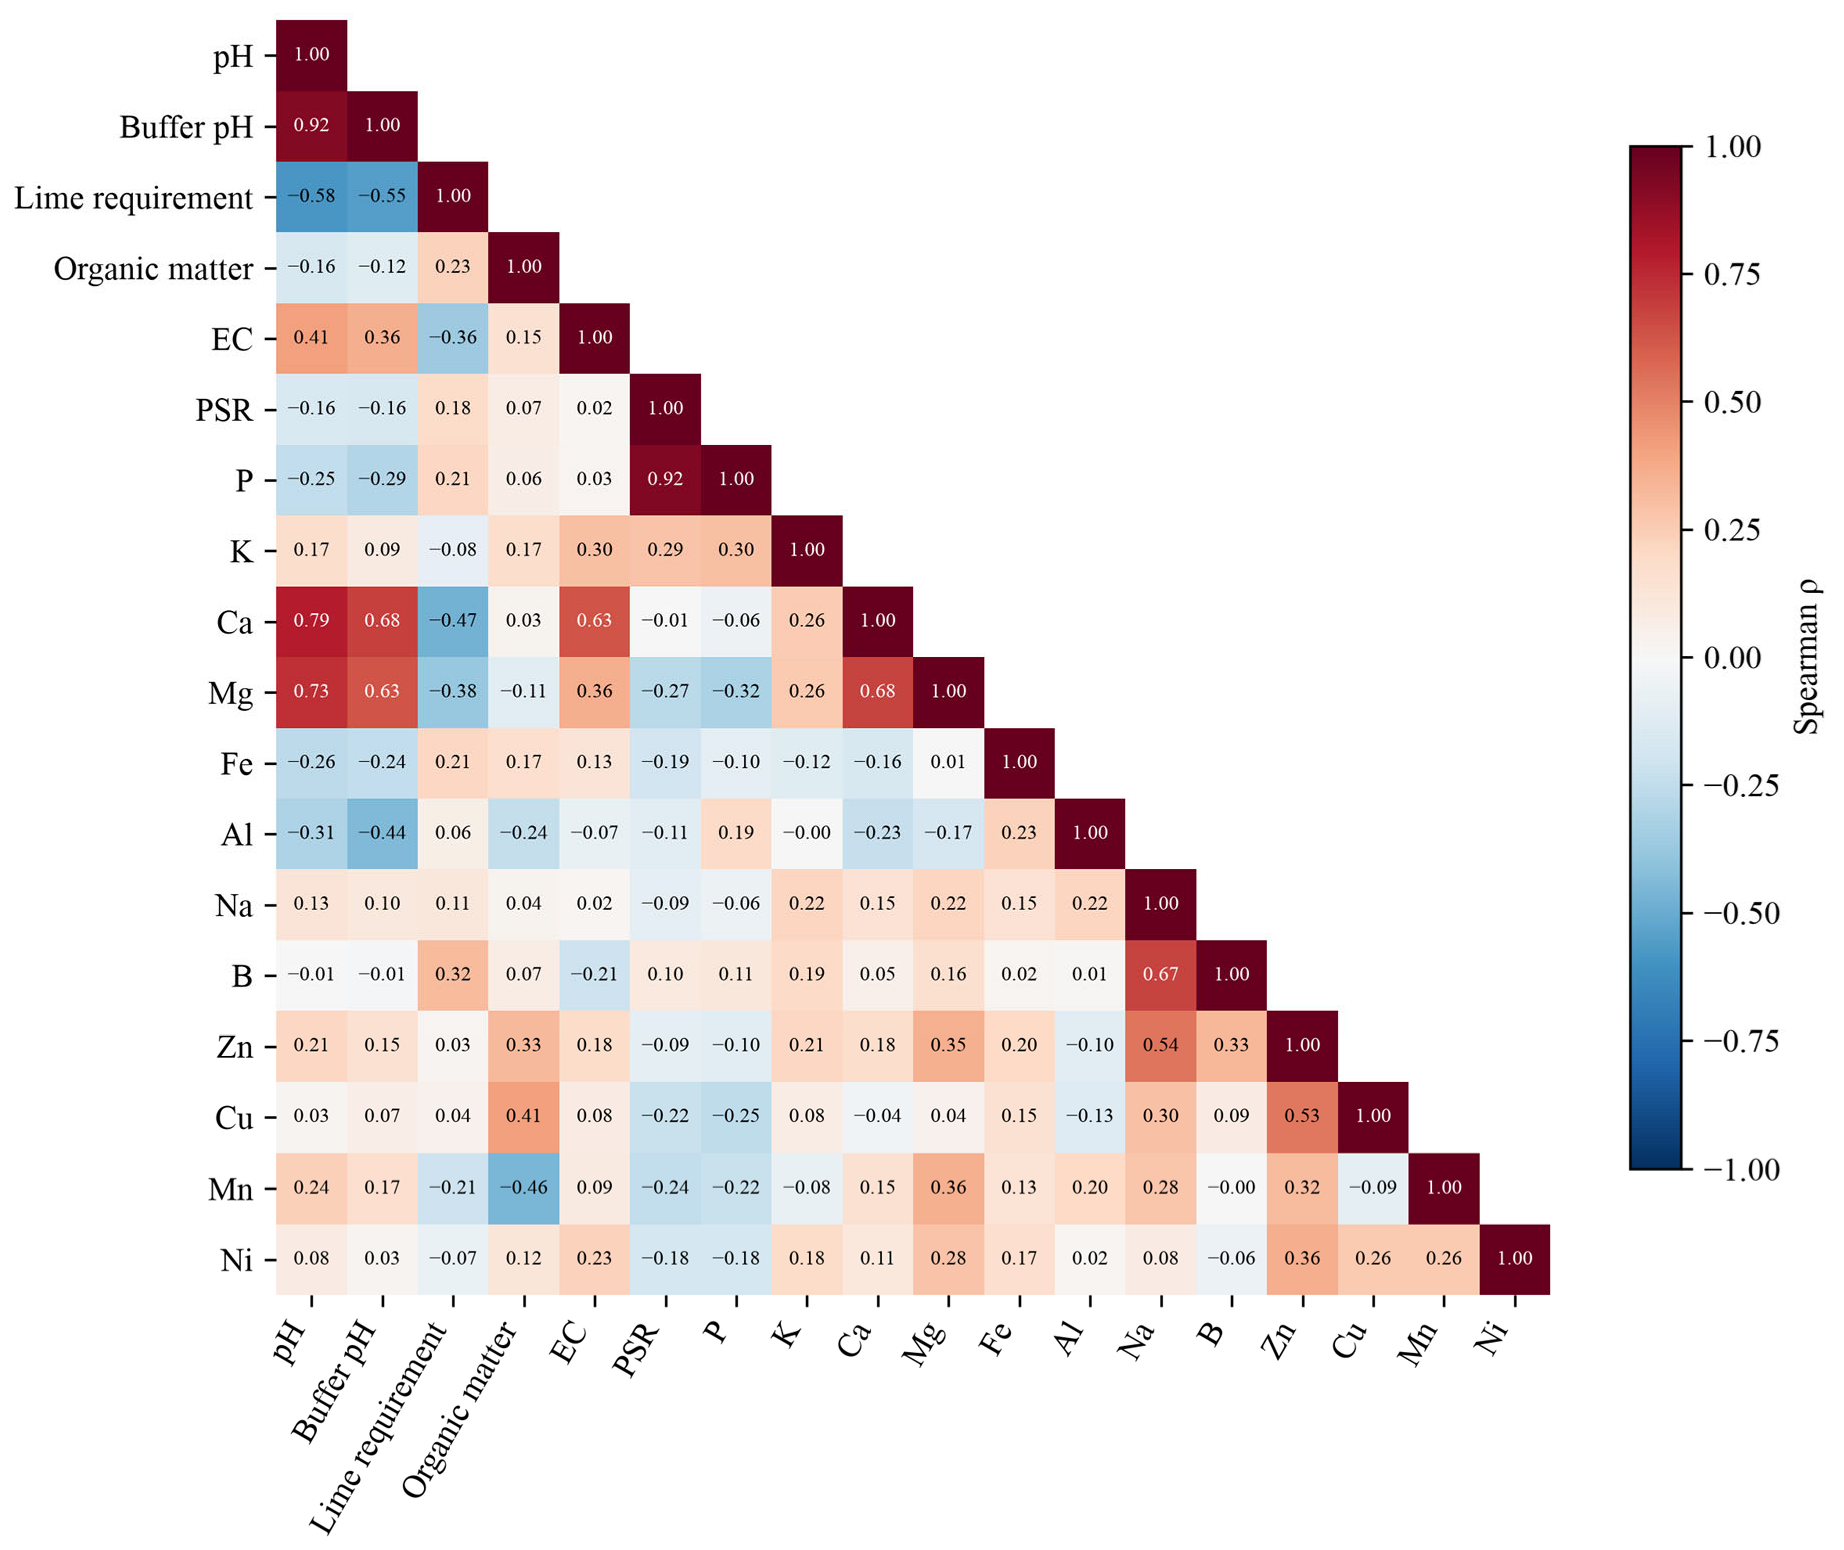
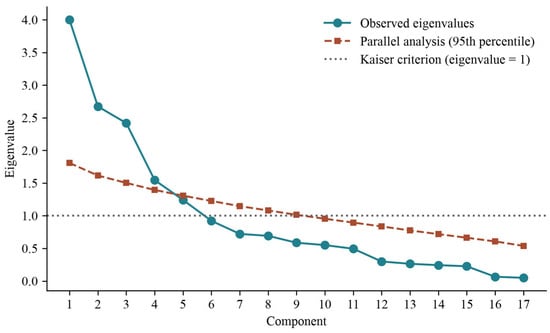
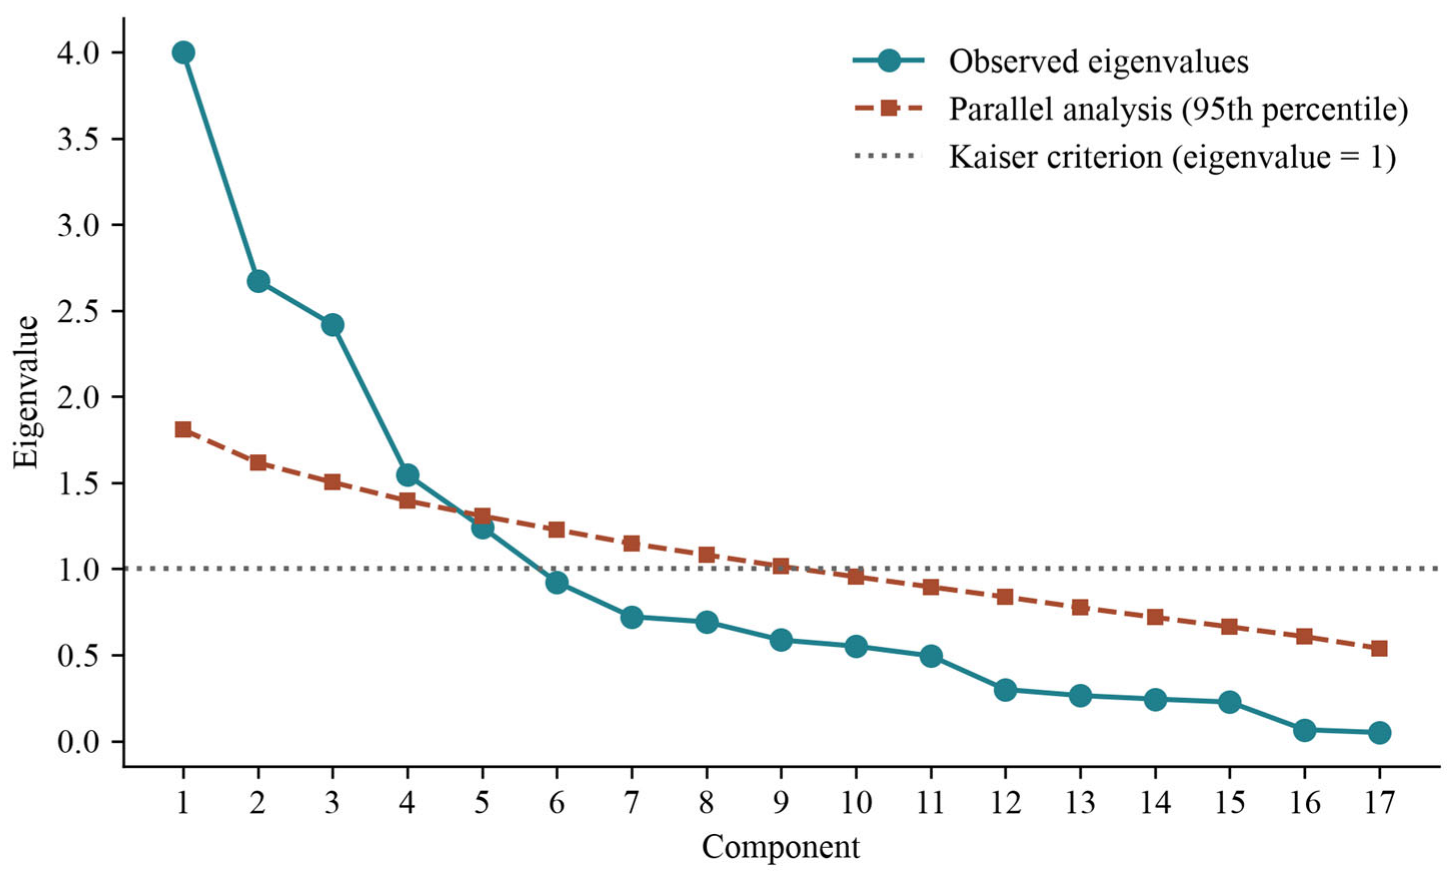
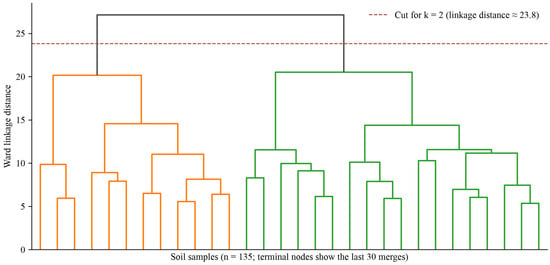
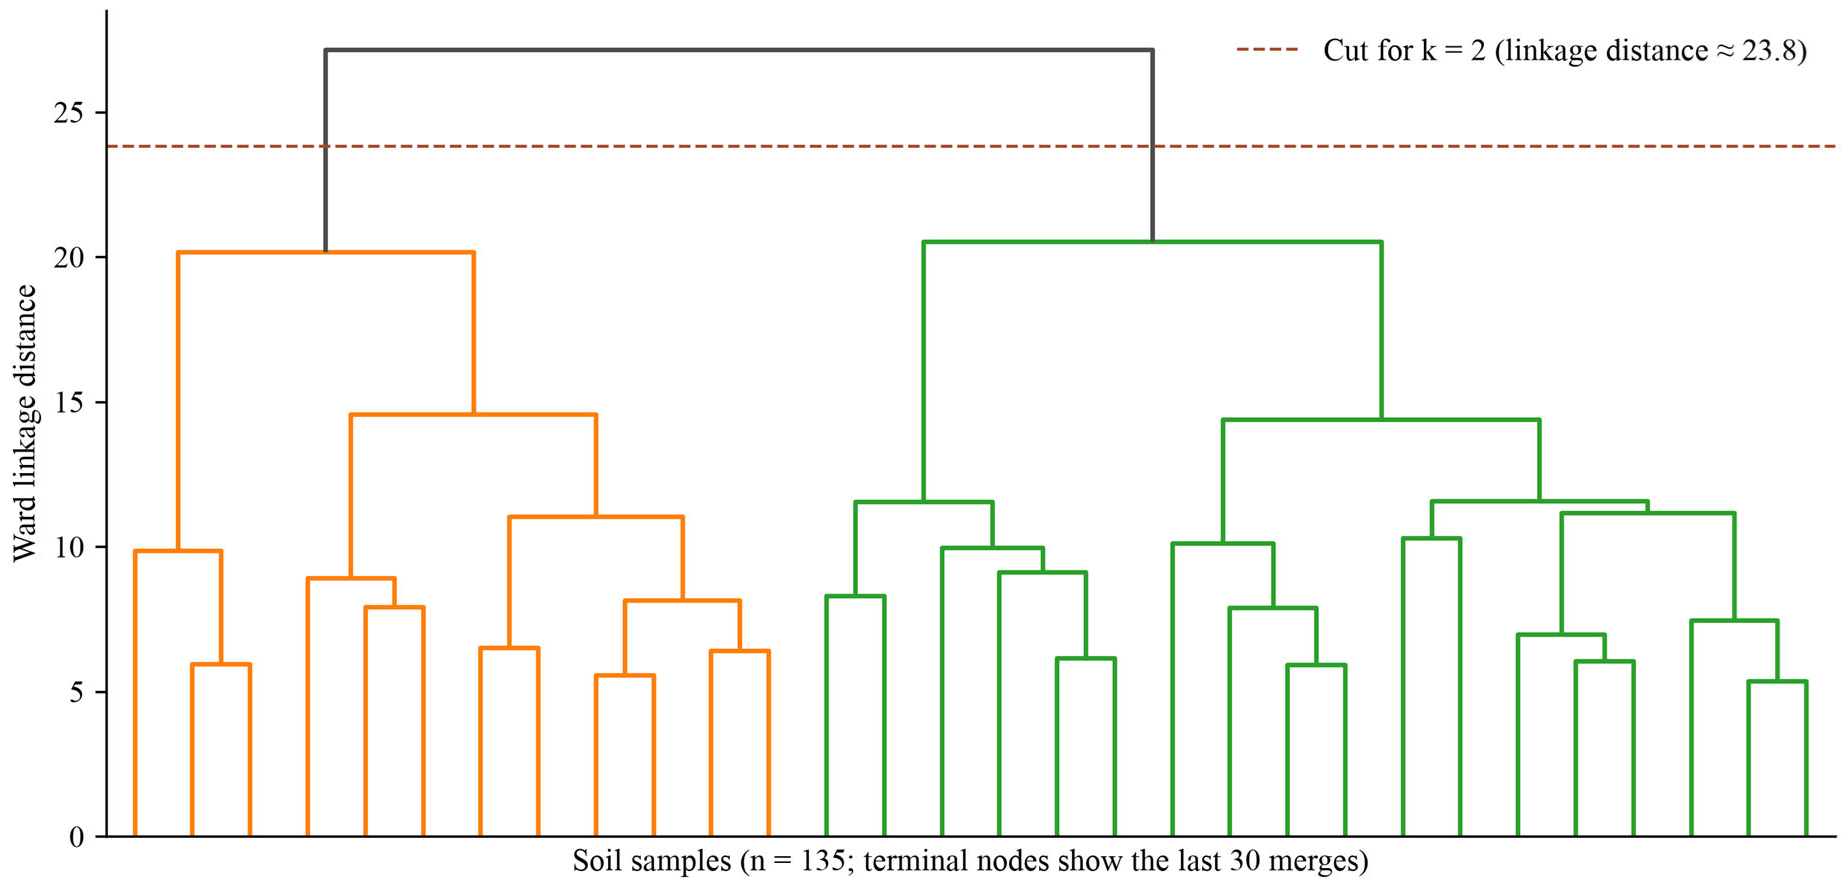
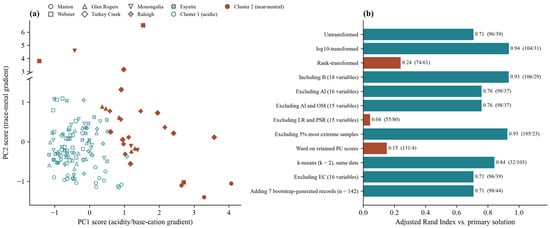
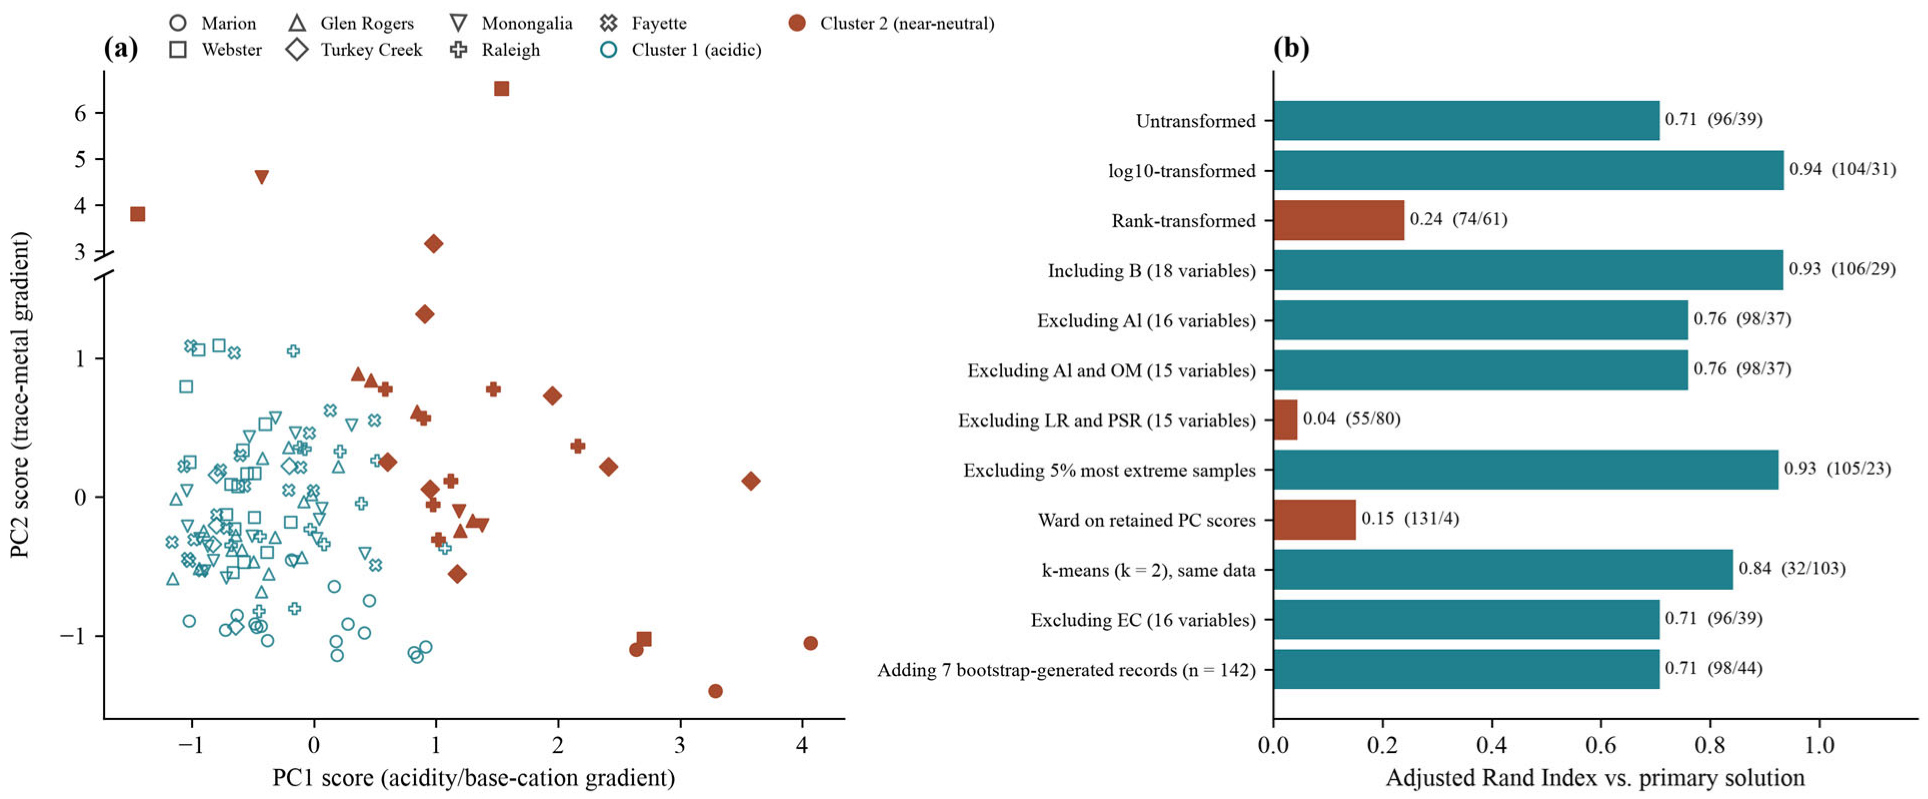

Disclaimer/Publisher’s Note: The statements, opinions and data contained in all publications are solely those of the individual author(s) and contributor(s) and not of MDPI and/or the editor(s). MDPI and/or the editor(s) disclaim responsibility for any injury to people or property resulting from any ideas, methods, instructions or products referred to in the content. |
© 2026 by the authors. Licensee MDPI, Basel, Switzerland. This article is an open access article distributed under the terms and conditions of the Creative Commons Attribution (CC BY) license.