


Abstract
Background/Objectives: Oligodendrocyte maturation and function are stimulated by insulin and insulin-like growth factor (IGF) signaling through Akt-mTOR and Notch. Dysregulation of these pathways is associated with impaired white matter development; yet, treatment with insulin-sensitizing agents failed to restore oligodendrocyte function, leading to the hypothesis that additional signaling pathways are needed for oligodendrocyte function. Methods: Experiments were conducted using human MO3.13 cells to investigate the role of epidermal growth factor receptor (EGFR) expression and signaling as potential mediators of immature oligodendroglia function and mechanistic interactions with insulin/IGF and Notch pathways. Methodologies included cell function, cytomorphology, immunoassays, and RNA hybridization assays. Results: Although EGF, TGF-α, and TGF-β increased the relative levels of EGFR tyrosine phosphorylation (pY-EGFR), MTT activity, and proliferating cell nuclear antigen, EGF and TGF-β increased pY-Erk MAPK and GALC expression and reduced activated Caspase 3, while EGF selectively increased CNPase, MAG, MOG, and MBP. EGF and TGF-α stimulated IGF2, INSULINR, IGF1R, IGF2R, IRS1, and IRS2 mRNA transcripts, while TGF-α and TGF-β increased expression of NOTCH1, JAGGED1, HES1, HEY1, and HIF1A Notch network genes. Conclusions: EGF, TGF-α, and TGF-β differentially modulated the effects of EGFR stimulation on oligodendroglia-related functions, including protein expression. The findings highlight the potential importance of EGFR pathway signaling and its interactions with insulin/IGF and Notch pathways for regulating oligodendrocyte functions during development.
1. Introduction
Central nervous system (CNS) diseases caused by toxic, developmental, or degenerative processes are associated with white matter oligodendrocyte dysfunction and loss of myelin integrity, with attendant impairments in cognitive and motor functions. Previous studies emphasized the importance of insulin and insulin-like growth factor (IGF) stimulation and signaling [1,2,3], linked to Notch and Wnt pathways that regulate oligodendrocyte maturation and function and myelin homeostasis [4,5]. Correspondingly, in disease states such as alcohol-related brain damage (ARBD), fetal alcohol spectrum disorder (FASD) [6,7], and Alzheimer-type neurodegeneration [8,9,10], brain insulin/IGF deficiency and resistance adversely impact downstream signaling through Notch, Wnt, and the mechanistic target of rapamycin (mTOR) in white matter and oligodendrocytes [7], compromising myelin integrity [11]. However, the failure of insulin sensitizer interventions to fully prevent white matter pathology and oligodendrocyte dysfunction in FASD [12,13] or AD [14] models suggested roles for additional signaling mechanisms.
Epidermal growth factor receptor (EGFR) networks are of interest because their stimulatory effects in the developing CNS include proliferation, migration, survival, and differentiation [15], overlapping with responses to insulin/IGF signaling. In the immature CNS, EGFR is abundantly expressed in neurons, astrocytes, oligodendroglia, and vascular elements [16,17]. With maturation, EGFR expression declines [18] but notably persists in pluripotent neural stem cells in the subventricular zones, positioned to have a role in neuronal and glial genesis [19,20], including in adult brains [15,17,21,22,23]. Moreover, EGFR mediates differentiation of subventricular zone oligoprogenitor cells into oligodendrocytes [17,24].
The role of EGFR signaling in glia has been widely investigated in relation to astrocytic cells [25,26]. In contrast, the literature on EGFR’s effects on oligodendrocyte function is relatively scant. Early studies showed that EGF enhances expression of galactocerebroside [27] and that both EGF and TGF-α inhibit myelin basic protein expression [28] in developing immature cerebral tissue. Further experiments confirmed that EGF supports maintenance and proliferation of CNS pluripotent stem cells, inhibiting their differentiation into neurons, astrocytes, and oligodendrocytes [29]. Correspondingly, EGFR overexpression results in hyperplasia of oligodendrocyte progenitor cells [30]. Altogether, these data suggest roles for EGF stimulation of immature oligodendroglia during development. However, the body of information on EGFR’s effects on oligodendroglia function remains relatively scant. Because oligodendrocytes are essential for supporting neuronal process integrity and efficient neural conductivity, additional studies to further characterize the effects of EGFR pathway stimulation on oligodendroglia could lead to new strategies to enhance white matter integrity and function in development and disease.
We hypothesize that growth, survival, metabolic function, and oligodendrocyte/myelin-associated gene expression are supported by dual activation of insulin/IGF and EGFR signaling networks. In addition, we postulate that trophic factor stimulation of the EGFR could potentially modulate oligodendrocyte/myelin protein expression in association with Notch pathways. Therefore, we designed experiments to characterize the effects of EGFR stimulation on oligodendrocyte function and its effects on insulin/IGF and Notch networks in MO3.13 human glial cells, which share features with immature oligodendroglia [31]. The effects of EGF and TGF-α were evaluated due to their known roles in activating EGFR signaling. In addition, responses to TGF-β were characterized because TGF-β transactivates EGFR [32,33], and it controls the timing of CNS myelination by regulating oligodendrocyte progenitor cell cycle withdrawal needed for oligodendrogenesis and myelination during development [34].
2. Materials and Methods
2.1. In Vitro Experimental Model
In vitro experiments were conducted with MO3.13 (RRID:CVCL_D357) human immortal glial hybrid cells, which express some phenotypic characteristics of primary oligodendrocytes [35]. MO3.13 cells have been widely used in neuroscience research on immature/premyelinating oligodendroglia [31]. MO3.13 cells express a full range of myelin markers, and due to their hybrid nature, they can function like oligoastrocytes and express astrocytic proteins [35]. MO3.13 cells were purchased from CELLutions Biosystems Inc (Cedarlane, Burlington, ON, Canada; Product code: CLU301) and maintained in a standard 5% CO2 incubator with antibiotic-free Dulbecco’s modified Eagle’s Medium (DMEM) supplemented with 10% fetal bovine serum (FBS). To study the effects of EGF pathway stimulation, 60% confluent overnight serum-starved cultures were stimulated with 0.5% FBS (control) or 10 ng/mL EGF, TGF-α, or TGF-β (Supplementary Table S1) for 24 h, after which the cultures were analyzed in situ for viability, growth/metabolic function, and cell density, or they were harvested for protein and mRNA studies. The trophic factors were diluted in serum-free medium. A total of 0.5% FBS, rather than vehicle, was used as a control due to concerns about MO3.13 cell viability after longer than 24 h of serum or trophic factor deprivation.
2.2. Cellular Metabolic Activity and Viability
Trophic factor effects on MO3.13 cells were evaluated by measuring 3-(4,5-dimethylthiazol-2-yl)-2,5-diphenyltetrazolium bromide (MTT) activity, Hoechst H33342 fluorescence, crystal violet (CV) staining, and proliferating cell nuclear antigen (PCNA), Ki-67, and activated Caspase 3 immunoreactivities. The MTT, H33342, and CV assays were performed in situ in 96-well cultures. We assessed PCNA, Ki-67, and activated Caspase 3 immunoreactivities using enzyme-linked immunosorbent assays (ELISAs). For MTT activity, 10 µL of freshly prepared MTT (#M5655, MilliporeSigma, St. Louis, MO, USA) solution (5 mg/mL in MEM without phenol red) [36,37] was added to each culture, which contained 100 µL of medium, and incubated for 20 min at 37 °C in a standard 5% CO2 incubator. MTT activity was measured in acidic isopropanol eluates obtained by replacing the MTT-containing culture medium with 100 µL of 0.04 mol/L HCl in isopropanol. After 5 min incubation at room temperature, the absorbances were measured at 540 nm in a Spectra-Max M5 Multimode Plate Reader (Molecular Devices, Sunnyvale, CA, USA).
Hoechst H33342 fluorescence staining provided an in situ measure of cell number in the same wells as the MTT assay. The results were used to calculate MTT activity normalized to culture cell abundance. To measure H33342 fluorescence, the MTT eluate buffer was replaced with 50 µL of Hoechst H33342 dye solution (10 µg/mL H3570, Invitrogen, Carlsbad, CA, USA) prepared in phosphate-buffered saline (PBS). After 5 min of light-shielded room-temperature incubation, fluorescence intensity was measured (Ex 360 nm/Em460 nm) in a Spectra-Max M5 Multimode Plate Reader (Molecular Devices, Sunnyvale, CA, USA).
The crystal violet assay is based on viable adherent cell staining [38]. After removing the culture medium, PBS-rinsed cells were stained for 10 min at room temperature with 50 µL/well of crystal violet (Thermo Scientific Chemicals, Haverhill, MA, USA) solution (0.5% crystal violet dissolved in 100 mL 20% methanol). After rinsing the excess dye with PBS and drying the plates, methanol (200 µL/well) was used to elute cellular crystal violet, and the absorbances were measured at 562 nm in a Spectra-Max M5 Multimode Plate Reader (Molecular Devices, Sunnyvale, CA, USA).
2.3. Chamberslide Preparations for Cellular Morphology
MO3.13 cells grown in 8-well chamber slides for cytomorphological studies were stimulated with trophic factors or 0.5% FBS as described above. The cells were then immersion-fixed in situ with 10% neutral-buffered formalin, stained with crystal violet (Thermo Scientific Chemicals, Haverhill, MA, USA), and examined by light microscopy [39]. The cells were digitally photographed at 200× and 400× magnification using CaptaVision 3.1 Image Acquisition software for Excelis HD (ACCU-SCOPE, Inc., Commack, NY, USA), with a scale calibration bar included in all images. CaptaVision automated measurements of cell diameters at 200× magnification were obtained for each treatment.
2.4. Immunoassays of Protein Expression
ELISAs measured trophic factor effects on immunoreactivity to EGFR, tyrosine phosphorylated EGFR (pY-EGFR), p44/42-Erk MAPK, pY-p44/42-Erk MAPK, proliferating cell nuclear antigen (PCNA), Ki-67, activated Caspase 3, and oligodendrocyte/myelin glycoproteins. In addition, the large acidic ribosomal protein (RPLP0) [40] was measured as a housekeeping/loading control. See Table S2 for the list of antibodies, the concentrations used, their commercial sources, and validation (RRID) codes. Cellular proteins from 12-well cultures were harvested into weak lysis buffer (50 mM Tris (pH 7.5), 150 mM NaCl, 5 mM EDTA (pH 8.0), and 50 mM NaF, 0.1%) supplemented with protease inhibitors (1 mM PMSF, 0.1 mM TPCK, 2 µg/mL aprotinin, 2 µg/mL pepstatin A, and 1 µg/mL leupeptin) and 2 mM sodium vanadate as the phosphatase inhibitor. The samples were clarified by centrifugation at 14,000 rpm (10 min at 4 °C). Aliquots were stored at −80 °C. Protein concentrations were measured with commercial bicinchoninic acid (BCA) assay reagents.
For direct-binding ELISAs, 50 ng protein aliquots in 50 µL of bicarbonate-binding buffer were adsorbed to the bottom surfaces of 96-well MaxiSorp plates by overnight incubation at 4 °C. Nonspecific binding sites were masked with Superblock TBS. The samples were then sequentially incubated with primary antibodies (0.2–5.0 µg/mL; overnight at 4 °C), horseradish peroxidase-conjugated, species-appropriate secondary antibodies, and the Amplex UltraRed soluble fluorophore. Immunoreactivity was measured in a SpectraMax M5 Multimode Plate Reader (Molecular Devices, Sunnyvale, CA, USA) (Ex 530 nm/Em 590 nm). The calculated ratios of target protein to loading control (RPLP0) protein immunoreactivity or protein content/well were the normalized results for inter-group statistical comparisons. In addition, the relative levels of activated EGFR and p44/42 Erk MAPK were calculated from the ratios of tyrosine-phosphorylated to total EGFR or p44/42 Erk MAPK protein and used for statistical analysis.
2.5. mRNA Expression Studies
Commercial custom Quantigene 2.0 multiplex panels (Cat# QGP312177) were used to measure mRNA expression for transcripts encoding insulin/IGF and Notch pathway molecules (Table S3). Control genes used to confirm equal sample loading included hypoxanthine phosphoribosyltransferase 1 (HPRT1) and Ribosomal Protein L13a (RPL13A). QIAzol Lysis Reagent (Qiagen, Germantown, MD, USA) was used to isolate total RNA. mRNA expression was measured using multiplex assays. The 96-well assays were configured by suspending xMAP fluorescent capture beads in commercially supplied buffer that contained blocking reagent and RNA probe sets (pre-amplifier, amplifier, and biotin-label). Following overnight incubation with 1 µg total RNA, the samples were further incubated with streptavidin-conjugated R-Phycoerythrin. Fluorescent signals were measured in a Luminex MAGPIX (Diasorin, Austin, TX, USA), along with calibration and verification standards, ensuring that the fluorescence signals were proportional to RNA transcript abundance captured by the beads. We subtracted the probe-related background from the target median fluorescence intensity and normalized the target median fluorescence intensity to RPL13A for statistical analysis. Negative control reactions included omission of probe sets, RNA or SAPE.
2.6. Data Analysis
The CV, MTT, and H33342 assays were performed with 12 independent cultures per treatment group. The ELISAs were performed using 6 independent cultures and 3 technical replicates per treatment per assay. The technical replicates were averaged to generate a single value per independent culture. The multiplex RNA hybridization assays were performed with 4 independent cultures per treatment, each with three technical replicates that were averaged to generate a single value per independent culture. All studies were repeated twice to assess reproducibility of results. The data were analyzed and displayed as box-and-whisker plots using GraphPad Prism 10.5 (San Diego, CA, USA). We compared groups using analysis of variance (ANOVA) and the post hoc Tukey multiple comparisons test. Statistical significance was set at p ≤ 0.05.
Materials: Critical chemicals and reagents are listed in Table S4. All other fine reagents were purchased from CalBiochem/Millipore Sigma (Burlington, MA, USA), Pierce Chemical (Dallas, TX, USA), or MilliporeSigma (St. Louis, MO, USA).
3. Results
3.1. EGF Pathway Stimulation of MO3.13 Cells
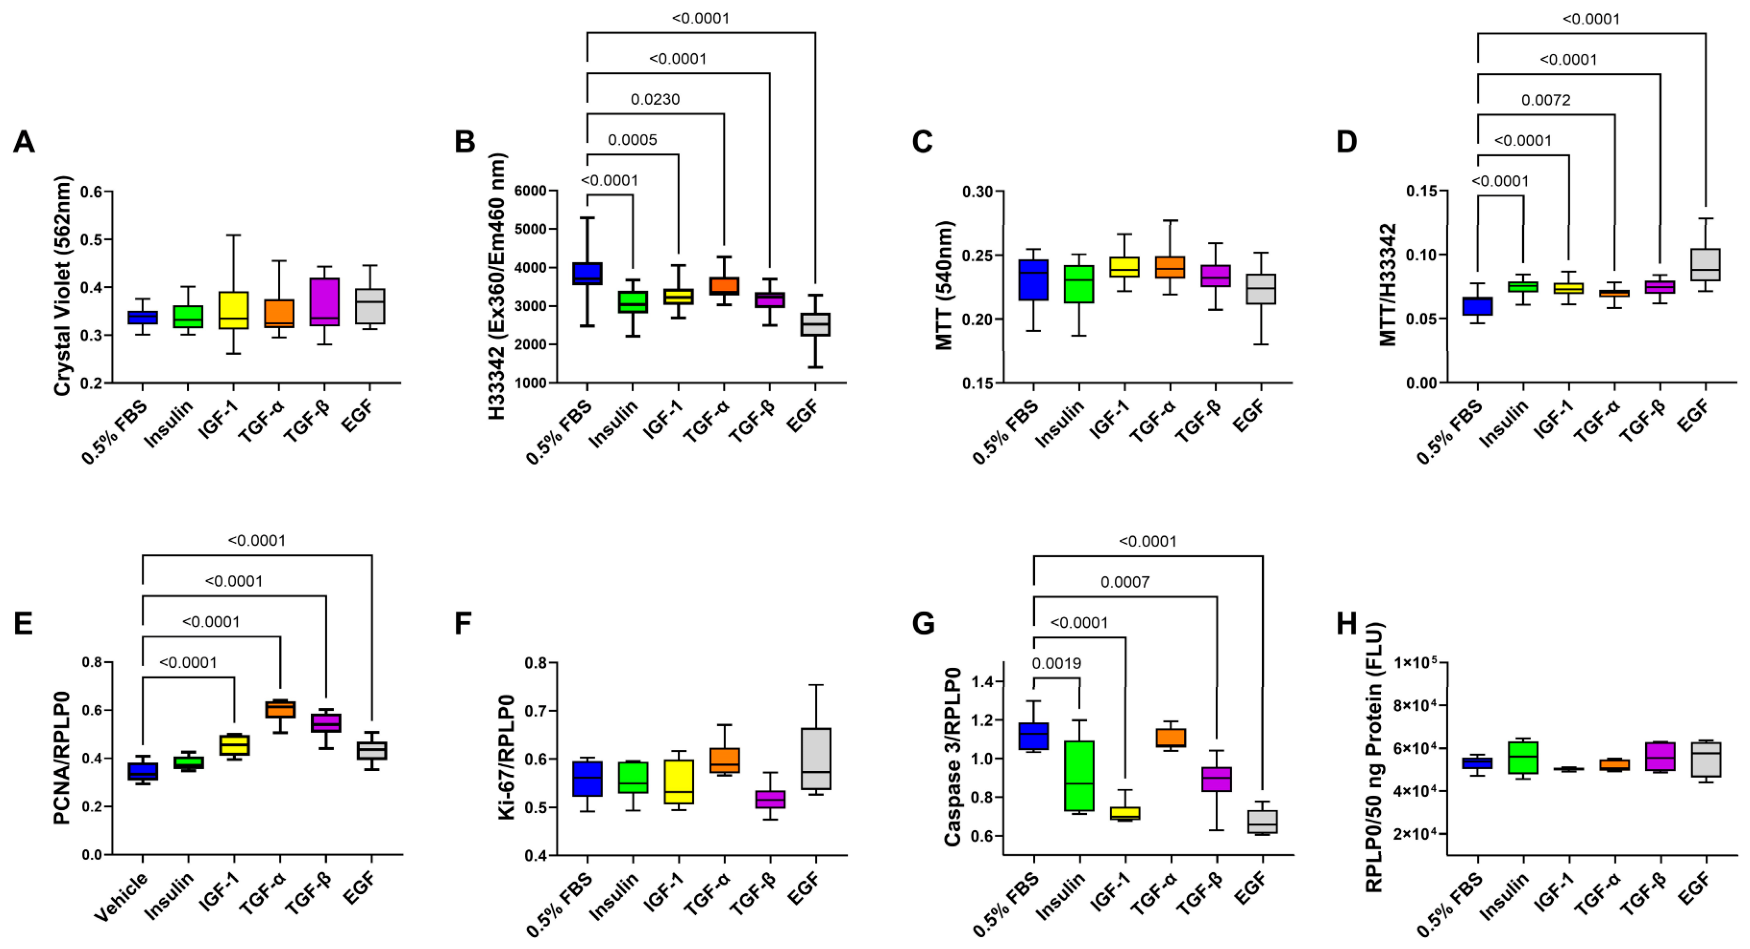
To examine the effects of EGF pathway stimulation on MO3.13 viability, cellular abundance, and metabolic activity, 96-well microcultures were treated with 10 ng/mL EGF, TGF-α, TGF-β, or 0.5% FBS (control). Parallel cultures were stimulated with 10 nM insulin or 10 ng/mL IGF-1 for comparison. ANOVA tests were significant for trophic factor effects on H33342 (p < 0.0001), MTT (p = 0.0047), and the calculated MTT/H33342 ratios, i.e., MTT normalized to H33342 (p < 0.0001), but not crystal violet (Table S5).
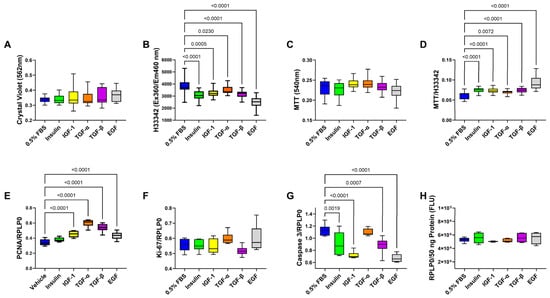
The corresponding graphs and post hoc Tukey tests show that the mean levels of crystal violet staining intensity and uncorrected MTT activity were similar across all treatments (Figure 1A,C). In contrast, relative to 0.5% FBS, the mono-trophic factor stimulations resulted in significantly reduced H33342 fluorescence (i.e., cellular abundance; Figure 1B) but increased MTT/H33342 (i.e., metabolic activity corrected for cell density; Figure 1D). Therefore, correcting for reductions in culture cell density revealed that MTT activity in the remaining cells was significantly elevated by each of the trophic factor treatments relative to 0.5% FBS and that the greatest increase was associated with EGF stimulation (Figure 1D).
Figure 1.
Trophic factor effects on MO3.13 culture viability, cellular abundance, MTT activity, proliferating cell nuclear antigen (PCNA), Ki-67, and activated Caspase 3. MO3.13 micro-cultures (96-well) were stimulated with 0.5% FBS (Control), 10 nM insulin, or 10 ng/mL IGF-1, TGF-α, TGF-β, or EGF (n = 12/treatment) for 24 h. The cells were assayed in situ for (A) crystal violet staining, (B) H33342 fluorescence, (C) MTT activity, (D) MTT normalized to H33342 (MTT/H33342), and (E) PCNA, (F) Ki-67, (G) activated Caspase-3, and (H) RPLP0 immunoreactivity. Box-and-whisker plots display the horizontal mean values, 95% confidence interval limits (upper and lower edges of the boxes), and range (whiskers). Inter-group comparisons were made by one-way ANOVA (Table S5) with post hoc Tukey tests. Significant differences (p ≤ 0.05) relative to the control are shown within the panels.
3.2. Trophic Factor Effects on Proliferating Cell Nuclear Antigen (PCNA), Ki-67, and Activated Caspase 3
ELISAs measured trophic factor-stimulated PCNA, Ki-67, and activated Caspase-3. One-way ANOVA demonstrated significant inter-group differences in PCNA and Caspase 3, a statistical trendwise effect on Ki-67 (0.05 < p < 0.10), and no effect on RPLP0 (Table S5). PCNA (Figure 1E) immunoreactivity was significantly elevated in cultures stimulated with IGF-1, TGF-α, TGF-β, or EGF, and activated Caspase 3 (Figure 1G) was significantly reduced by insulin, IGF-1 TGF-β or EGF relative to control (0.5% FBS). In contrast, none of the trophic factors significantly modulated Ki-67 (Figure 1G) or RPLP0 (Figure 1H) relative to control. These findings support roles for TGF-α, TGF-β, and EGF in promoting MO3.13 cell survival, maintenance, metabolism, and anti-apoptosis, paralleling effects of insulin or IGF-1 stimulation.
3.3. Trophic Factor Effects on EGFR and ERK-MAPK Signaling
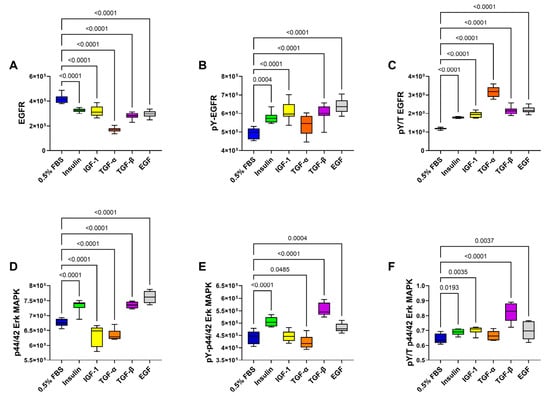
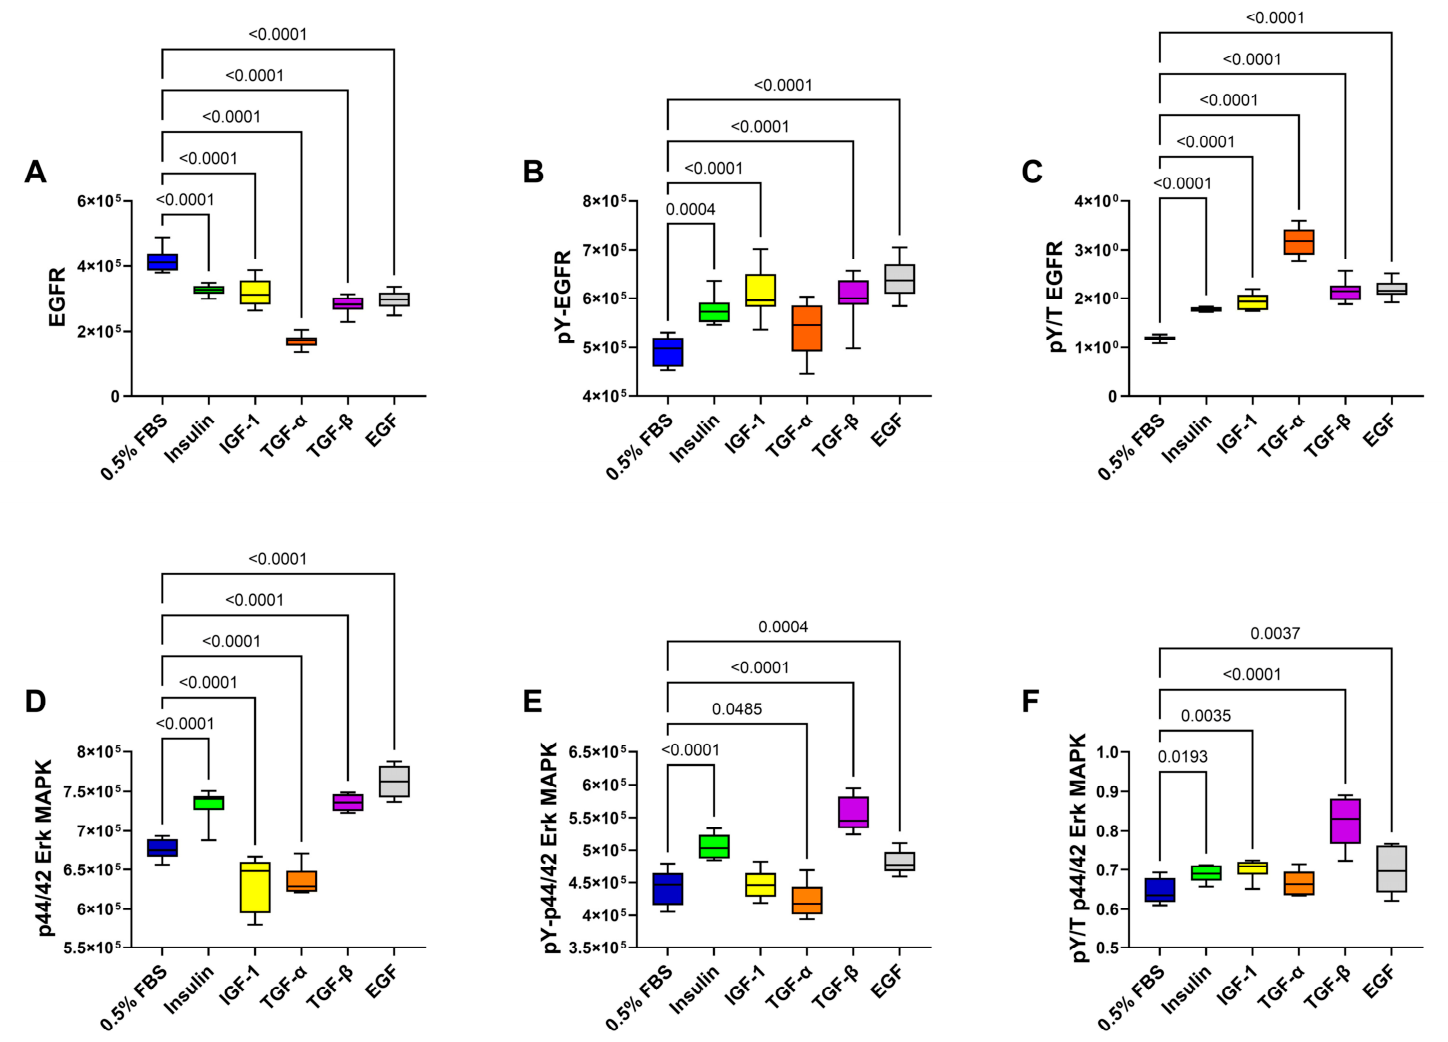
Immunoreactivity to EGFR protein, tyrosine-phosphorylated EGFR (pY-EGFR), p44/42 Erk MAPK, and pY-p44/42 Erk MAPK were measured by ELISA with results normalized to protein content/well. In addition, the calculated relative levels of tyrosine-phosphorylated EGFR (pY/Total EGFR) and p44/42 Erk MAPK (pY/T p44/42-Erk MAPK) were compared with respect to trophic factor stimulation. One-way ANOVA demonstrated significant inter-group differences in the total, tyrosine-phosphorylated, and relative tyrosine-phosphorylated levels of EGFR and p44/42 Erk MAPK (Table S5). EGFR protein was highest in the 0.5% FBS-treated control cultures and significantly lower in cultures stimulated with insulin, IGF-1, TGF-α, TGF-β, or EGF (Figure 2A). In contrast, pY-EGFR and pY/T EGFR were significantly increased by each trophic factor relative to 0.5% FBS (Figure 2B,C). Concerning p44/42 Erk MAPK, insulin, TGF-β, and EGF significantly increased p44/42 MAPK (Figure 2D), pY-p44/42 Erk MAPK (Figure 2E), and pY/T-p44/42 Erk MAPK (Figure 2F) relative to control, whereas IGF-1 and TGF-α significantly reduced p44/42 MAPK (Figure 2D), had neutral or stimulatory effects on pY-p42/42-Erk MAPK, and had neutral or stimulatory effects on pY/T-p44/42 Erk MAPK (Figure 2F).
Figure 2.
Trophic factor effects on MO3.13 EGFR and p44/42 Erk MAPK signaling. MO3.13 cells were stimulated with 0.5% FBS (Control), 10 nM insulin, or 10 ng/mL IGF-1, TGF-α, TGF-β, or EGF for 24 h. ELISAs measured (A) EGFR, (B) tyrosine-phosphorylated (pY) EGFR, (D) p44/42-Erk MAPK, and (E) pY-p44/42-Erk MAPK. Immunoreactivity was normalized to protein content in each well. The calculated relative levels of (C) pY/Total EGFR and (F) pY/Total p44/42-Erk MAPK are also shown. Box-and-whisker plots display the horizontal mean values, 95% confidence interval limits (upper and lower edges of the boxes), and range (whiskers). Inter-group comparisons were made by one-way ANOVA (Table S5) with post hoc Tukey tests. Significant differences (p ≤ 0.05) relative to the control are shown within the panels.
3.4. Trophic Factor Effects on MO3.13 Cell Morphology
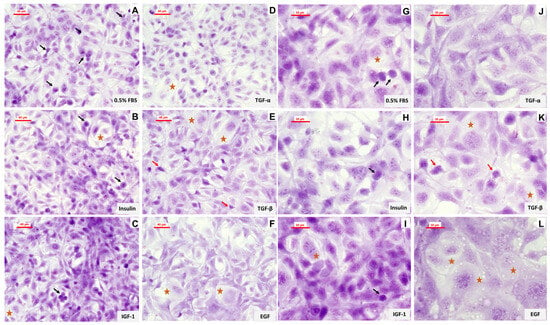
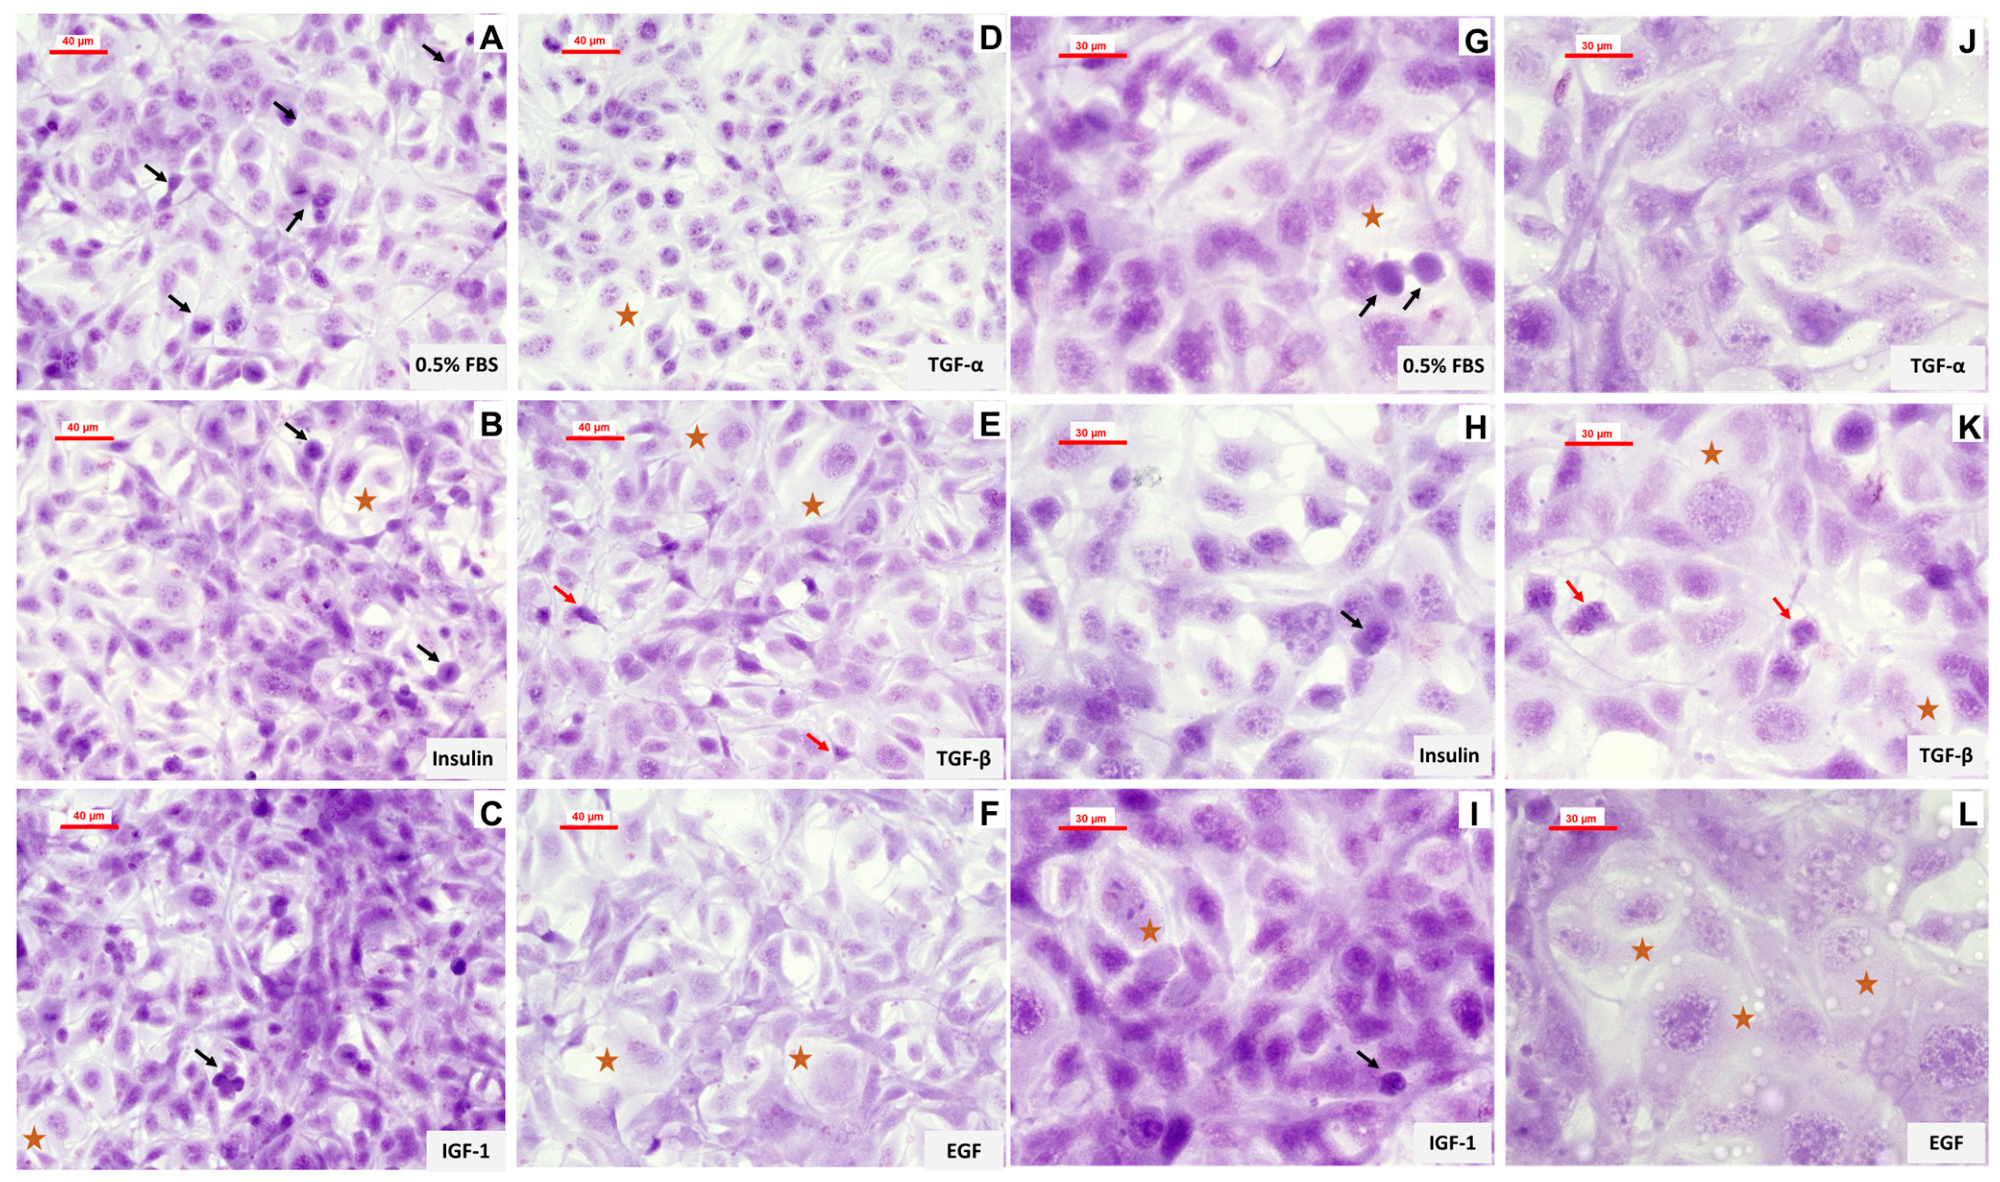
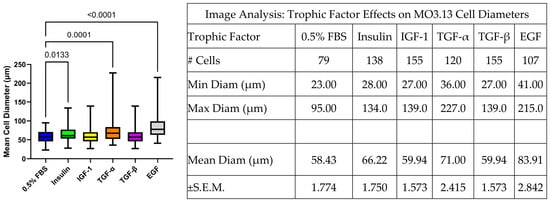
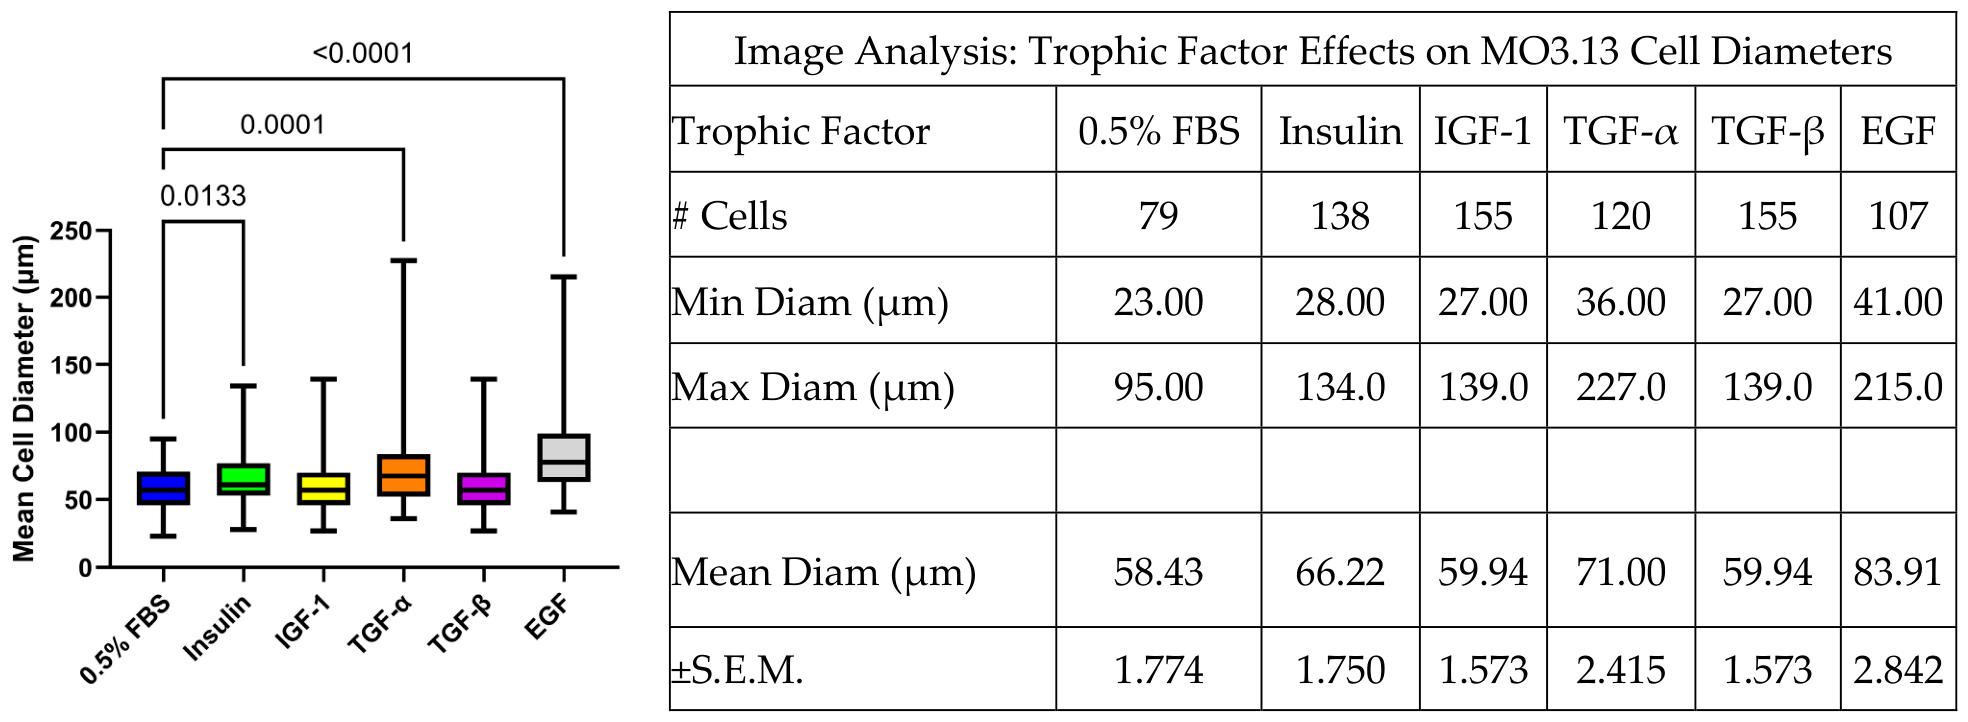
Crystal violet-stained chamber slide cultures were examined and photographed at 200× and 400× by light microscopy (Figure 3). All trophic factor treatments supported cell viability but differentially altered cell morphology. Cultures stimulated with 0.5% FBS exhibited cell size variability with many small dark cells mixed with larger pale cells that lacked distinct nucleoli and nuclear membranes (Figure 3A,G). Compared with 0.5% FBS, insulin- and IGF-1-stimulated cultures showed foci of crowding, along with a conspicuous presence of small dark cells and larger pale cells (Figure 3B,C). Insulin-stimulated cells also had multiple prominent nucleoli (Figure 3H), whereas IGF-1-stimulated cells had mainly homogeneous dark (hyperchromatic) nuclear staining (Figure 3I). TGF-α-stimulated cells had relatively homogeneous morphologies (Figure 3D) with prominent nucleoli and tapering of cytoplasmic processes (Figure 3J). TGF-β-stimulated cultures (Figure 3E,K) had dual populations of cells that mainly had either small dark nuclei with short processes or larger pale morphologies (Figure 3K). EGF stimulation resulted in relatively conspicuous cell enlargement and lower abundance of small dark nuclei relative to the other treatments (Figure 3F,L). Automated image analysis to measure the effects of trophic factor stimulation on cell size demonstrated that the mean cell diameters in insulin-, TGF-α-, and EGF-stimulated cultures were significantly higher than in the 0.5% FBS-stimulated cultures (Figure 4). In contrast, there were no significant differences in the mean cell size of IGF-1- or TGF-β-stimulated cultures relative to 0.5% FBS-stimulated cultures.
Figure 3.
Trophic factors stimulated cytomorphological effects on MO3.13 cells. Chamber slide cultures stimulated for 24 h with (A,G) 0.5% FBS, (B,H) insulin, (C,I) IGF-1, (D,J) TGF-α, (E,K) TGF-β, or (F,L) EGF were stained with crystal violet and photographed at 200× (A–F) and 400× (G–L) magnifications. The final image magnifications were 650× (A–F) and 1600× (G–L). Representative images are displayed with scale bars. Black arrows = apoptotic bodies; red arrows = pyknotic nuclei with short cell processes; brown stars = enlarged hypochromatic (pale-staining) cells, occasionally multinucleated.
Figure 4.
CaptaVision 3.1 automated image analysis measured cell diameters of crystal violet-stained MO3.13 cultures stimulated with different trophic factors. Measurements were obtained throughout the entire field at 400× magnification. The above Table summarizes the number of cells counted, their minimum (Min) and maximum (Max) diameters (Diam), and mean Diam + S.E.M. Inter-group comparisons were made by one-way ANOVA (F = 21.50; p < 0.0001). Significant differences relative to 0.5% FBS by the post hoc Tukey test are shown in the graph.
3.5. Trophic Factor Stimulation of Glial Markers
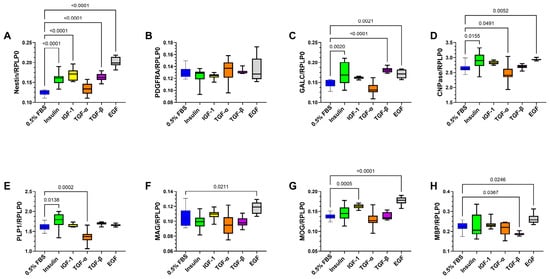
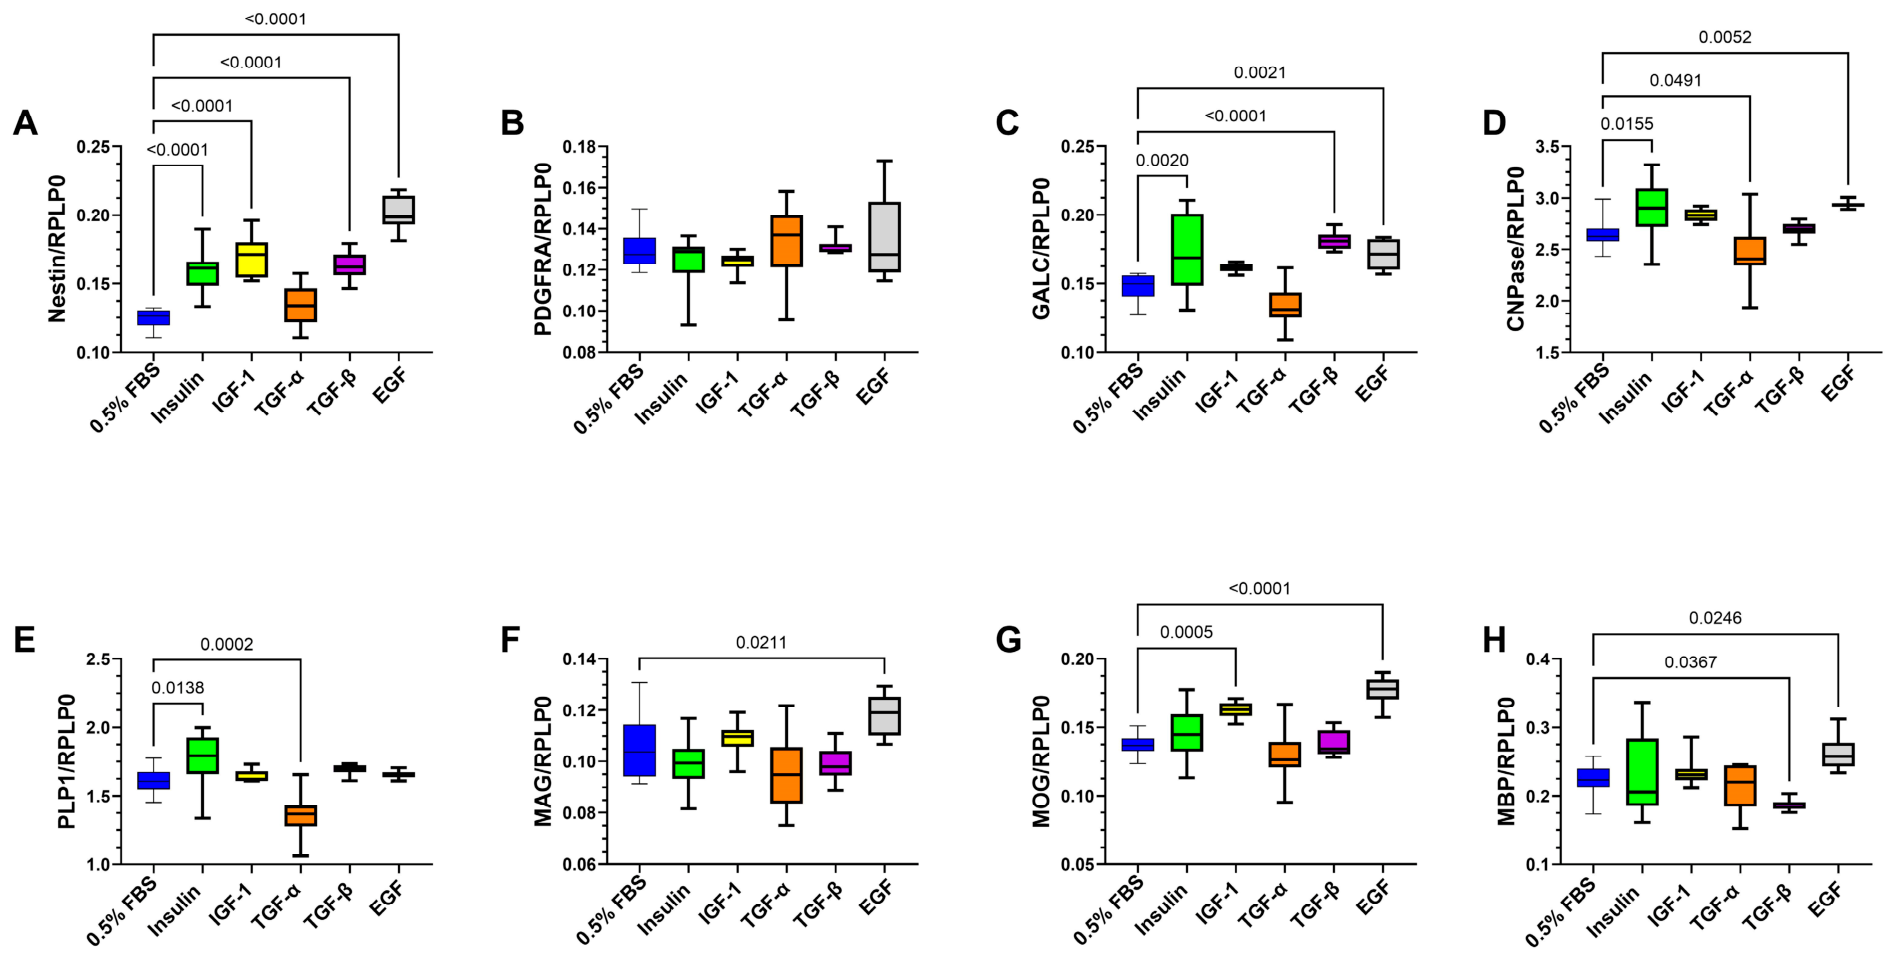
ELISAs measured immunoreactivity to immature (Nestin, PDGFR-α, and GALC), early myelinating (CNPase and PLP1), and late myelinating (MAG, MOG, and MBP) oligodendroglia proteins. The results were normalized to RPLP0, and inter-group comparisons were performed using one-way ANOVA with the Tukey post hoc test. One-way ANOVA demonstrated significant trophic factor effects on all glial molecules examined except for PDGFR-α (Table S6). Figure 5 displays the corresponding graphs with significant post hoc Tukey test results relative to 0.5% FBS.
Figure 5.
Effects of trophic factor stimulation on expression of oligodendroglial molecules. Immunoreactivity to (A) nestin, (B) PDGFR-α, (C) GALC, (D) CNPase, (E) PLP1, (F) MAG, (G) MOG, and (H) MBP was measured by ELISA using 50 ng protein per reaction. Box-and-whisker plots display the distribution of results (each dot is a data point) from 6 independent experimental replicates per group, with immunoreactivity normalized to RPLP0. Inter-group comparisons were made using one-way ANOVA (Table S6) with post hoc Tukey tests. Significant differences (p ≤ 0.05) relative to the 0.5% FBS control groups are shown within the panels.
Immature glial markers: Nestin (Figure 5A) and GALC (Figure 5C) were significantly increased by insulin, TGF-β, or EGF stimulation, whereas none of the trophic factors significantly modulated PDGFR-α expression (Figure 5B). IGF-1 also significantly increased nestin immunoreactivity (Figure 5A). Among the early myelinating proteins, both CNPase and PLP1 immunoreactivities were significantly increased by insulin but reduced by TGF-α (Figure 5D,E). In addition, EGF significantly increased CNPase (Figure 5D). Regarding the late myelinating proteins, EGF significantly increased MAG (Figure 5F), MOG (Figure 5G), and MBP (Figure 5H) expression, while IGF-1 selectively increased MOG and TGF-β selectively reduced MBP. In contrast, insulin and TGF-α had no significant effects on late myelin/glycoprotein expression.
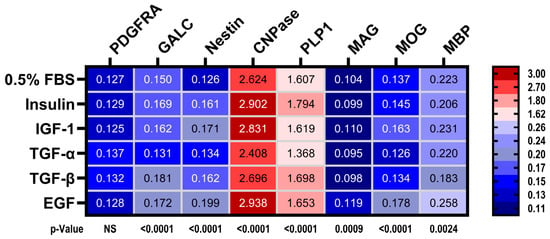
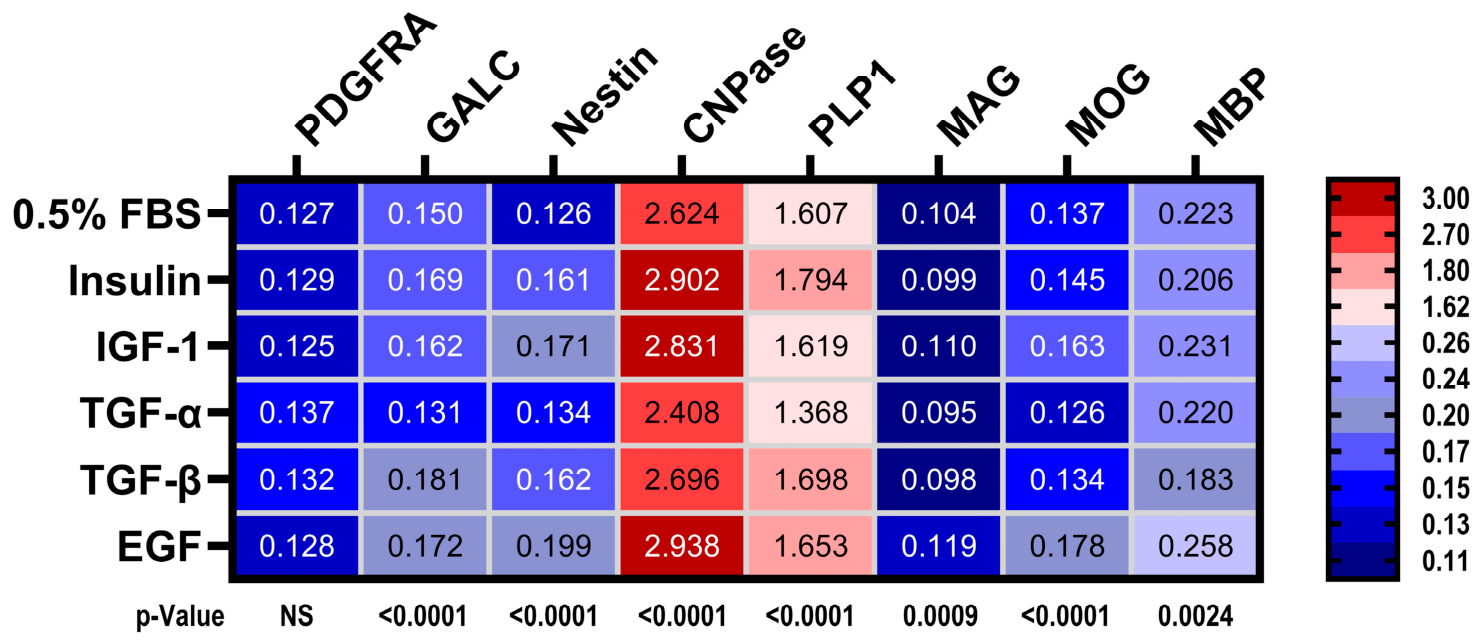
A heatmap was generated to summarize the effects of different trophic factors on glial protein expression (Figure 6). Molecules expressed at low levels are coded with shades of blue, while those expressed at high levels have red shades. To include all molecules in the heatmap, the color intensity gradients were assigned categorically according to levels of immunoreactivity. The mean relative levels of immunoreactivity are indicated within the heatmap bins. The one-way ANOVA test results (p-values) for each molecule in relation to trophic factor stimulation are shown below the heatmap. The heatmap depicts the stimulatory effects of insulin on Nestin, CNPase, and PLP1, and the stimulatory effects of IGF-1 on Nestin, CNPase, and MOG relative to 0.5% FBS. TGF-α had modest stimulatory effects on PDGFRA and Nestin, but neutral or inhibitory effects on GALC, CNPase, PLP1, MAG, MOG, and MBP. In contrast, TGF-β had stimulatory effects on PDGFRA, GALC, Nestin, and PLP1, but neutral or inhibitory effects on the expression of mature myelin oligodendroglial proteins. EGF’s effects were broadly stimulatory, except for its neutral impact on PDGFRA. These differential effects of TGF-α, TGF-β, and EGF may be mediated by downstream signaling, since all three trophic factors significantly increase relative signaling through the EGFR, and TGF-β and EGF enhanced signaling through p44/42 Erk MAPK, whereas the effects of TGF-α were inhibitory or neutral (see Figure 2).
Figure 6.
Heatmap display of trophic factor stimulation effects on the expression levels of oligodendroglial molecules. See the legend in Figure 5. The heatmap legend depicts the categorical scale corresponding to the relative levels of immunoreactivity (numbers indicate upper-limit cutoff values). The mean levels of protein expression are included in each cell. The p-values below the heatmap show the results of the one-way ANOVA tests (see Table S6 and Figure 5).
3.6. Interactions Between Trophic Factor Stimulation and Insulin/IGF or Notch Signaling Networks
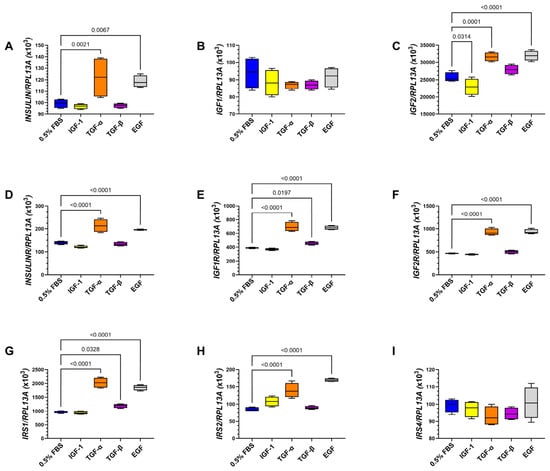
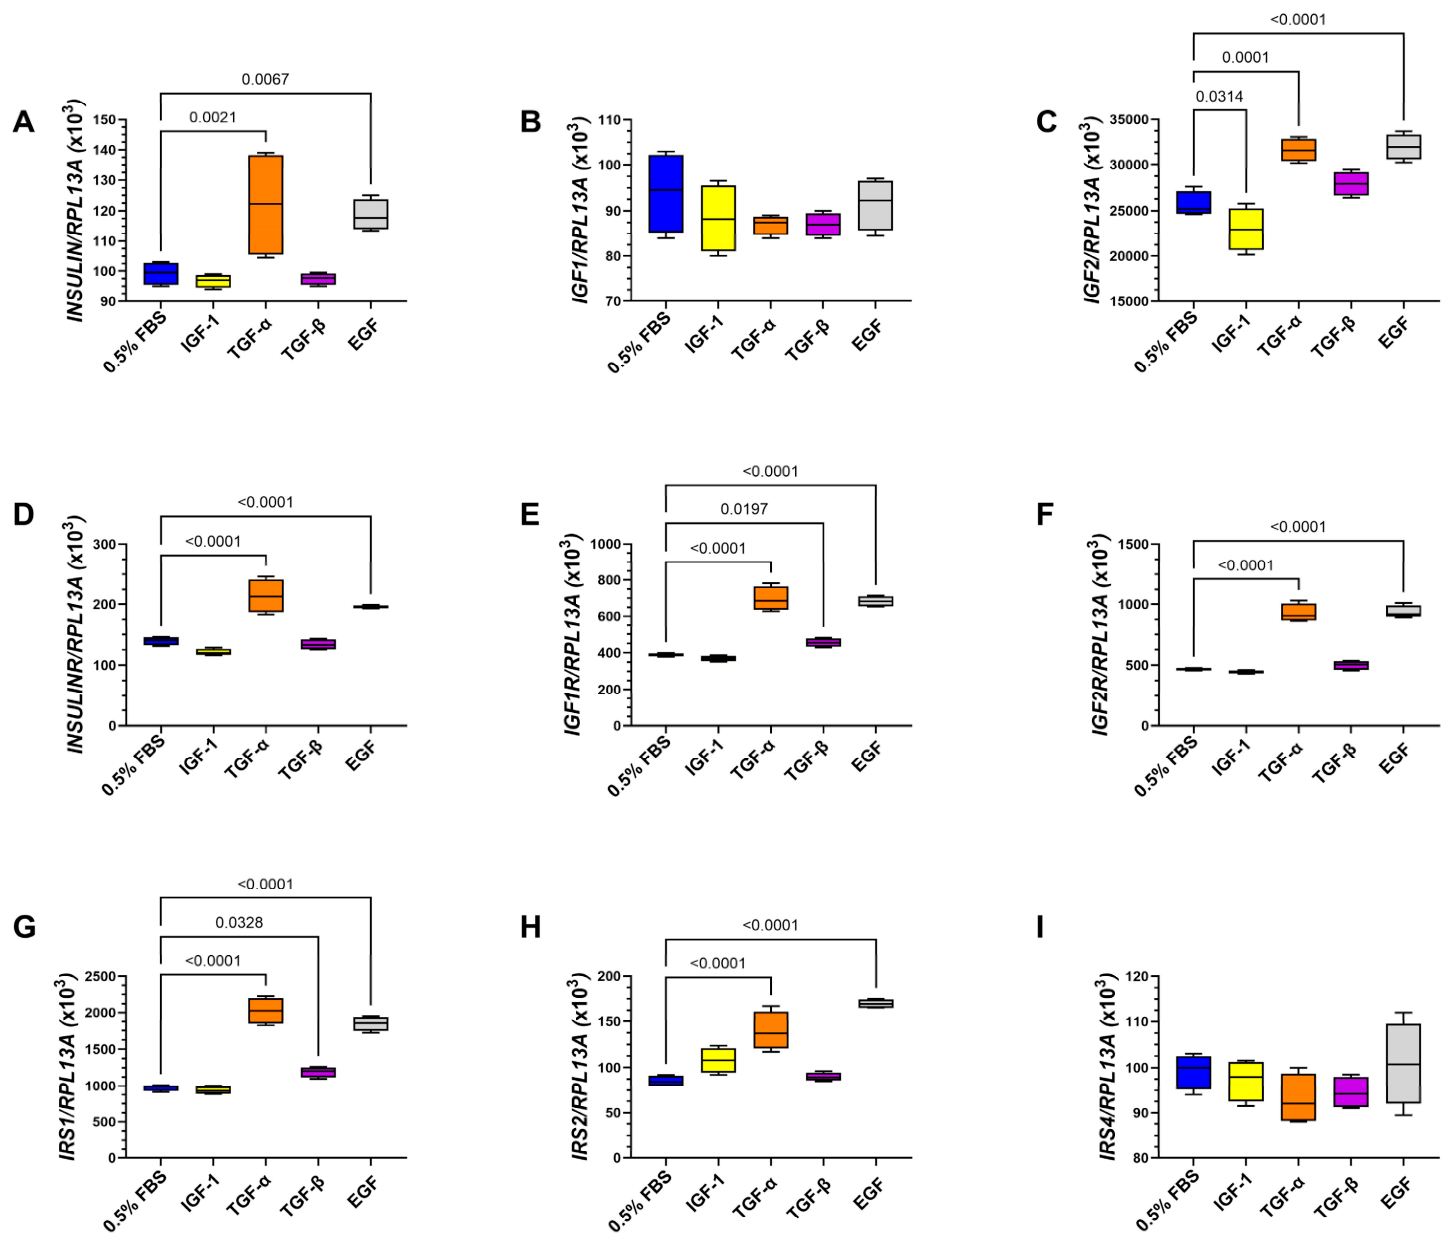
Oligodendrocyte growth, viability, metabolic function, and oligodendroglia/myelin protein expression were previously shown to be regulated by insulin/IGF signaling through the phosphatidylinositol 3-Kinase, Protein Kinase B, and the mechanistic target of rapamycin (PI3K-AKT-mTOR) and MEK/ERK pathways [1]. Given the overlapping effects of insulin and EGF on oligodendroglia protein expression, the next goal was to determine the extent to which the stimulatory effects of EGF, TGF-α, and TGF-β were mediated through insulin/IGF or Notch signaling networks. The approach utilized Quantigene multiplex RNA hybridization assays to measure insulin/IGF/IRS and Notch pathway genes. Insulin stimulation was excluded because the signaling tightly overlaps with that of IGF-1. Multiplex RNA hybridization studies measured insulin and IGF trophic factors, insulin and IGF receptors, and IRS mRNA transcripts. The results, analyzed by one-way ANOVA, demonstrated significant inter-group differences in the expression of INSULIN, IGF2, INSULINR, IGF1R, IGF2R, IRS1, and IRS2 but not IGF1 or IRS4 (Table S7). The corresponding violin plots and post hoc Tukey test results demonstrated that TGF-α and EGF significantly increased INSULIN (Figure 7A), IGF2 (Figure 7C), INSULINR (Figure 7D), IGF1R (Figure 7E), IGF2R (Figure 7F), IRS1 (Figure 7G), and IRS2 (Figure 7H) mRNA transcripts relative to 0.5% FBS. In addition, TGF-β significantly increased IGF2, while IGF-1 inhibited IGF2 mRNA. There were no significant trophic factor effects on IGF1 (Figure 7B) or IRS4 (Figure 7I) mRNAs.
Figure 7.
Trophic factor effects on upstream genes in the insulin/IGF signaling networks: RNA isolated from MO3.13 cells stimulated with 0.5% FBS (control), IGF-1, TGF-α, TGF-β, or EGF was used to measure (A) INSULIN, (B) IGF1, and (C) IGF2 growth factors and (D) INSULINR, (E) IGF1R, (F) IGF2R, (G) IRS1, (H) IRS2, and (I) IRS4 mRNA transcripts in 4 experimental replicate samples per assay using a multiplex RNA hybridization panel with results normalized to RPL13A. Box-and-whisker plots were used to display inter-group differences, which were analyzed using one-way ANOVA (Table S7) with post hoc Tukey tests. Significant differences (p ≤ 0.05) are shown within the panels.
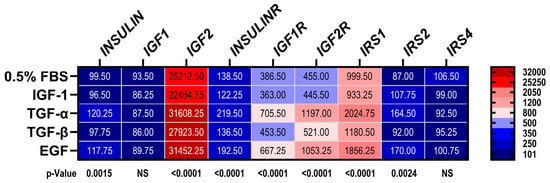
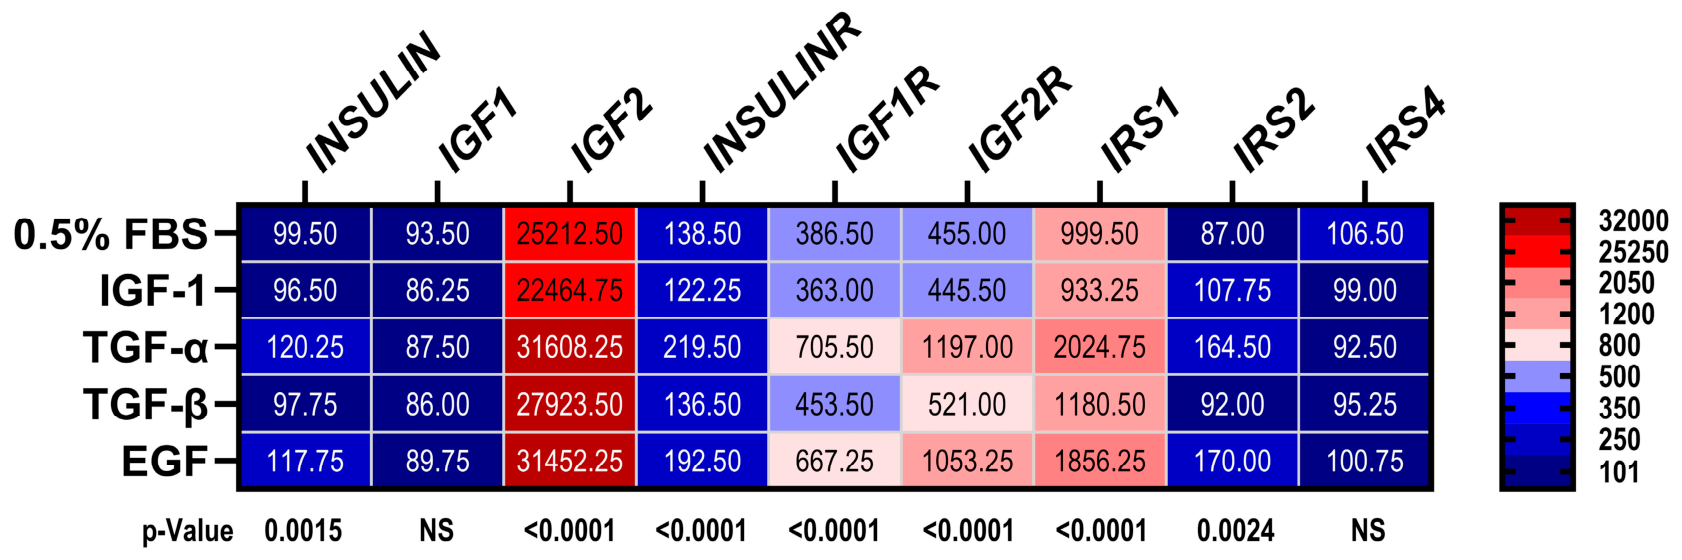
A heatmap was generated to summarize the effects of different trophic factors on insulin/IGF/IRS signaling networks (Figure 8). Molecules expressed at low levels have blue shades, while those expressed at high levels have red shades. To include all molecules in the heatmap, the color intensity gradients were assigned categorically according to levels of mRNA expression. The mean mRNA levels normalized to RPL13A are shown within the heatmap bins. The one-way ANOVA test results (p-values) are shown below the heatmap. IGF1 reduced IGF2 mRNA but otherwise had minimal effect on the expression of insulin/IGF/IRS pathway genes relative to the 0.5% FBS control. TGF-α and EGF had similar effects in that both increased INSULIN, IGF2, IGF1R, IGF2R, IRS1, and IRS2 relative to 0.5% FBS. TGF-β modestly but significantly increased IGF1R and IRS1 mRNA expression, yielding the same directional effects as TGF-α and EGF. Otherwise, the effects of TGF-β on insulin/IGF/IRS network gene expression were modest, similar to the findings with respect to IGF1 stimulation.
Figure 8.
Heatmap display of trophic factor stimulation effects on expression of insulin/IGF/IRS network genes in MO3.13 cells. See the legend in Figure 7. The heatmap’s scale bar depicts the categorical scale corresponding to the relative levels of mRNA (numbers indicate upper-limit cutoff values). The mean relative levels of mRNA expression are included in each cell. The p-values below the heatmap show the results of the one-way ANOVA tests (see Table S7 and Figure 7).
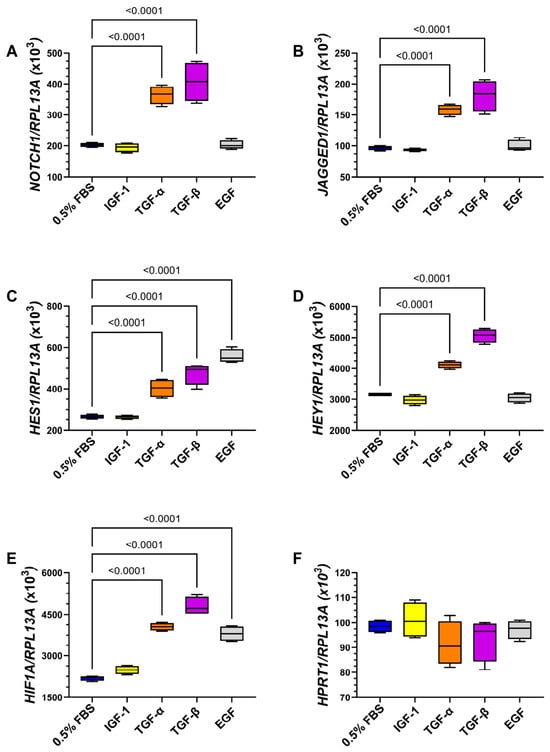
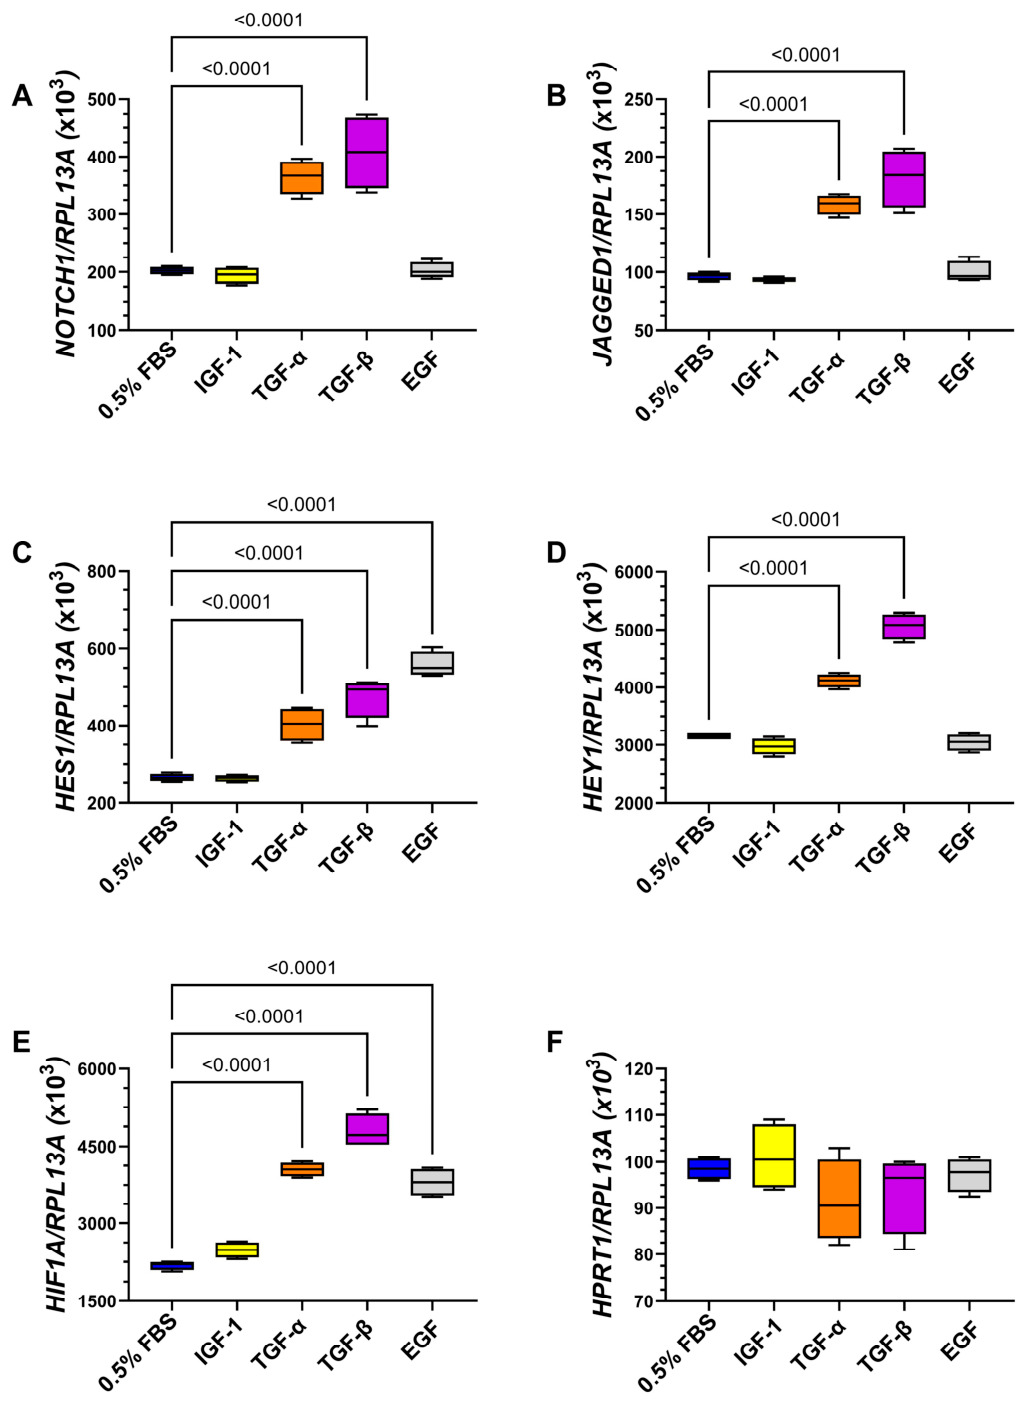
Multiplex RNA hybridization was used to measure trophic factor effects on Notch network and control gene expression. One-way ANOVA tests demonstrated significant inter-group differences in the expression of NOTCH1, JAGGED1, HES1, HEY1, and HIF1A (all p < 0.0001; Table S8). In addition, one-way ANOVA detected no significant inter-group differences in the HPRT1 or RPL13A control genes (Table S8).
The corresponding graphs and post hoc Tukey tests demonstrated that TGF-α and TGF-β significantly increased mRNA levels of NOTCH1 (Figure 9A), JAGGED1 (Figure 9B), HES1 (Figure 9C), HEY1 (Figure 9E), and HIF1A (Figure 9F). In addition, EGF significantly increased the mean mRNA levels of HES1 (Figure 9D) and HIF1A (Figure 9E). There were no significant trophic factor effects on HPRT1 (Figure 9F).
Figure 9.
Trophic factor effects on Notch-related genes: RNA isolated from MO3.13 cells stimulated with 0.5% FBS, IGF-1, TGF-α, TGF-β, or EGF was used to measure (A) NOTCH1, (B) JAGGED1, (C) HES1, (D) HEY1, (E) HIF1A, and (F) HPRT1 mRNA transcripts using a multiplex RNA hybridization panel. Results were normalized to RPL13A measured in the same reactions. Box-and-whisker plots display inter-group differences, which were analyzed by one-way ANOVA (Table S8) and post hoc Tukey tests (n = 4 experimental replicates per treatment group). Significant differences (p ≤ 0.05) are shown within the panels.
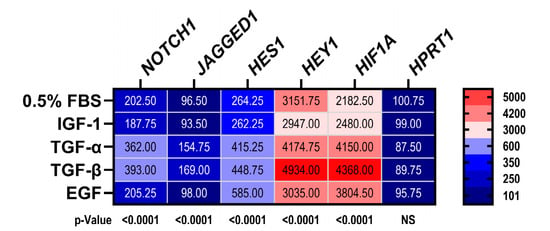
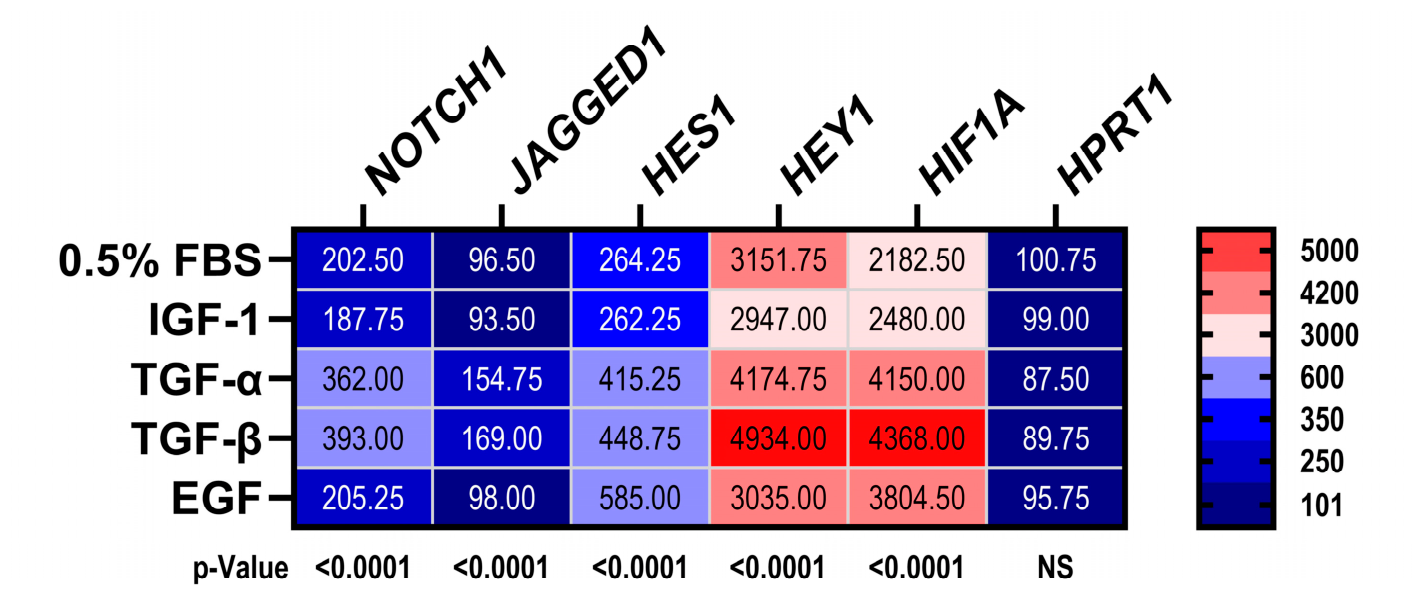
A heatmap was generated to summarize the effects of different trophic factors on Notch network protein expression (Figure 10). Molecules expressed at low levels are coded with shades of blue, while those expressed at high levels are coded with red shades.
Figure 10.
Heatmap display of trophic factor stimulation effects on expression of the Notch network. See Figure 9 for experimental details. The legend to the right of the heatmap depicts the categorical scale corresponding to the relative levels of mRNA (numbers indicate upper-limit cutoff values). The mean relative levels of mRNA are included in each cell. The p-values below the heatmap show the results of the one-way ANOVA tests (see Table S8 and Figure 9).
To include all molecules in the heatmap, the color intensity gradients were assigned categorically according to levels of mRNA. The mean mRNA levels normalized to RPL13A are shown within the heatmap bins. The one-way ANOVA test results (p-values) are shown below the heatmap. IGF-1 had minimal effects on Notch pathway gene expression relative to 0.5% FBS. TGF-α and TGF-β increased NOTCH1, JAGGED1, HES1, HEY1, and HIF1A, while EGF had more restricted effects, increasing only HES1 and HIF1A relative to 0.5% FBS.
4. Discussion
The main goals of this study were to characterize the nature and extent of EGFR-stimulated effects on immature oligodendroglia functions and their interactions with insulin/IGF and Notch pathways because EGFR is expressed in various brain cell types during development. EGF, TGF-α, and TGF-β were the trophic factors of interest. Insulin and IGF-1 were included as positive controls. As a negative control, 0.5% FBS was used instead of a vehicle to prevent MO3.13 cell stress after 24 h or longer of serum/trophic factor deprivation. Empirical studies showed that 0.5% FBS was sufficient to sustain MO3.13 cells. However, its use as a negative control was a limitation because 0.5% FBS contains various trophic factors [41], although their concentrations would have been far lower than those used for mono-trophic factor stimulation [42].
Initial experiments showed that EGF, TGF-α, and TGF-β significantly increased EGFR tyrosine phosphorylation, PCNA expression, and MTT activity normalized to cell density (MTT/H33342), which may correspond to relative metabolic activity in MO3.13 cells. Therefore, all three trophic factors independently stimulated EGFR signaling and supported cell maintenance/survival. The stimulatory effects of TGF-β and EGF may have been mediated in part by p44/42 Erk MAPK activation and suppression of apoptosis (Caspase 3 activation). The absence of corresponding increases in crystal violet (viability) or H33342 (cellular abundance) staining, despite increased PCNA, may reflect insufficient time for mono-trophic factor stimulation to promote cell proliferation, as suggested by the lack of modulation of Ki-67 immunoreactivity over the same period. Alternatively, mono-trophic factor stimulation may have been suboptimum for supporting cell growth, as suggested by the variable degrees of activated Caspase 3 immunoreactivity in the cultures. One potential explanation for the increased MTT/H33342 in EGF-, TGF-α-, or TGF-β-stimulated cultures is that it reflected a stress response [36], which can drive intracellular signaling. Altogether, TGF-α, TGF-β, and EGF appeared to stimulate cell maintenance and metabolic activity via the EGFR pathway.
Erk MAPK is a major downstream pathway activated by EGFR signaling. Corresponding with the effects on EGFR signaling, MO3.13 cells exhibited significantly increased levels of pY-p44/42 Erk MAPK and pY/T-p44/42 Erk MAPK in response to all trophic factors except TGF-α. Moreover, TGF-α’s effects on EGFR and p44/42 Erk MAPK signaling were largely neutral or inhibitory, in contrast to IGF-1, TGF-β, and EGF. While the stimulatory effects of insulin and IGF-1 on PCNA were expected, significant increases in pY-EGFR were unanticipated. However, previous reports demonstrated that IGF-1 can transactivate the EGFR in various cell types via the generation of reactive oxygen species [43,44].
Oligodendrocytes play key roles in myelin synthesis and maintenance. Immature oligodendrocytes/oligoprogenitor cells, which are premyelinating, express non-myelinating molecules, including 2’,3’-cyclic nucleotide 3’ phosphodiesterase (CNPase), chondroitin sulfate proteoglycan 4, galactocerebroside (GALC), platelet-derived growth factor receptor, alpha polypeptide (PDGFRA), and proteolipid protein 1 (PLP). CNPase is well recognized as an oligodendrocyte marker at all stages of myelination, and EGF stimulation of CNPase (EC 3.1.4.37) [2] and basic FGF [45] have important roles in proliferation. The mature myelinating glycoproteins MAG, MOG, and MBP have functional roles in the development of neuronal-to-glial cell interactions, and completing, maintaining, and stabilizing myelin sheaths. MAG is stimulated by nerve growth factor (NGF) via the p75NTR [46]. MOG directly binds to NGF to modulate axonal circuitry [47]. MOG mRNA and protein expression are increased via activation of the FGF and IGF receptors [2,48]. Insulin and IGF-1 increase MBP protein expression via post-transcriptional factors [3], while EGF and TGF-α were observed to strongly inhibit oligodendrocyte MBP [28].
The studies in MO3.13 cells showed that EGF but not TGF-α significantly increased the expression of MAG, MOG, and MBP. IGF-1 was the only other trophic factor to stimulate expression of MOG. Although an earlier report showed that EGF and TGF-α inhibit MBP in mixed brain cell cultures from 4-day-old mice [28], our results concur with the findings in a comprehensive review of multiple studies providing strong evidence for EGF’s positive regulatory effects on myelination and remyelination, including the synthesis and maintenance of mature myelin proteins [17]. One seemingly paradoxical finding was that EGF and TGF-α had opposing effects on the expression of non-myelinating and mature myelinating proteins, yet they are both natural ligands for the EGFR and stimulate tyrosine phosphorylation, i.e., activation of EGFR. EGF was found to be mainly stimulatory, whereas TGF-α was either inhibitory or neutral. Although the underlying mechanisms are not fully explained and remain a subject of investigation, differential trophic factor effects on EGFR stimulation and downstream signaling have been reported [49,50].
Nestin is a neuroepithelial stem cell intermediate filament expressed in both neuronal and glial progenitor cells in early postnatal brain development [51]. Nestin works with vimentin and promotes the disassembly of phosphorylated vimentin during cell proliferation [52]. The stimulatory effects of EGF on nestin are consistent with previous observations in glial cells, including those of immature oligodendrocyte lineage [53,54]. EGF’s actions on nestin-positive oligoprogenitor cells are mediated by signaling through pY-EGFR and downstream activation of Ras-Raf-Erk [54], which is largely stimulatory to growth and proliferation [31], but inhibitory to differentiation [30]. Correspondingly, EGF stimulation of pY-EGFR in MO3.13 cells may have mediated the increased nestin expression via Erk activation.
The EGF- and TGF-α-associated increases in INSULIN, IGF2, INSULINR, IGF1R, IGF2R, IRS1, and IRS2 indicate that these trophic factors promote transcriptional upregulation of insulin/IGF/IRS networks. The strikingly higher levels of IGF2 and IGF2R relative to INSULIN/INSULINR and IGF1/IGF1R suggest a dominant role for IGF2 signaling in immature oligodendroglial cells, corresponding with widespread expression in the brain during development [55]. IGFs stimulate growth, survival, and differentiation of oligodendrocytes [56,57]. Therefore, the stimulatory effects of EGF, TGF-α, and, to some extent, TGF-β on insulin/IGF trophic factors and receptors may reflect one of the mechanisms by which EGFR signaling positively regulates oligodendrocyte growth and function. Likewise, since insulin and IGF-1 signal through IRS1 and IRS2 to mediate downstream effects via PI3K-Akt-mTOR and Erk-MAPK, the stimulatory effects of EGF and TGF-α likely contributed to the corresponding increases in oligodendrocyte/myelin protein expression. However, some of the discordances may be explained by independent data suggesting that cooperative signaling between EGF and other trophic factors, such as IGF or bFGF, may be required to optimally mediate their effects on oligodendrocyte function [58]. Therefore, the mono-stimulatory focus of this study was a limitation that could be overcome in future investigations by characterizing the effects of multi-targeted trophic factor stimulation.
Although EGF, TGF-α, and TGF-β exhibited overlapping effects in their activation of EGFR signaling, stimulation of PCNA, MTT activity, and Erk MAPK, and inhibition of apoptosis (Caspase 3), their differential effects on glial protein expression were likely mediated by differences in their activation of downstream pathways. EGF consistently increased expression of oligodendroglial proteins relative to TGF-α, TGF-β, and control (0.5% FBS). In contrast, TGF-α had either the lowest stimulatory or relative inhibitory effects, whereas TGF-β’s effects were intermediate between those of EGF and TGF-α. These relationships are depicted in heatmaps that also illustrate the degree to which EGF and insulin/IGF broadly stimulate glial protein expression (Figure 6). Mechanistically, it is noteworthy that EGF, like insulin/IGF, broadly increased insulin/IGF/IRS pathway gene expression (Figure 8) with limited Notch pathway activation (Figure 10). EGF’s stimulatory effect on Notch pathways was marked by increased HES1, an important effector of Notch signaling that promotes proliferation and maintenance of neural progenitor cells [59], and HIF1A, which activates Notch [60].
The EGF-associated minimal upregulation of Notch genes correlates with increased expression of the mature oligodendrocyte/myelin glycoproteins, MOG, MAG, and MBP. In contrast, the finding that TGF-α and TGF-β broadly increased the expression of Notch pathway genes as well as HIF1A corresponds with the failure of these trophic factors to increase MAG, MOG, or MBP since Notch has inhibitory effects on oligodendroglial maturation [34]. This concept is reinforced by the inhibitory effects of TGF-α on CNPase and PLP, which are also expressed in mature oligodendroglial cells. Altogether, the differential effects of EGF, TGF-α, and TGF-β on oligodendroglial cell function could be attributed to EGF’s prominent dual activation of EGFR and Insulin/IGF/IRS pathways, TGF-α’s triple activation of EGFR, Insulin/IGF-IRS, and Notch networks, and TGF-β’s dominant activation of EGFR and Notch. Alternatively, TGF-α and EGF may mediate their effects on oligodendroglial protein expression via activation of IGF networks rather than EGFR. TGF-β signaling through its own receptor and SMAD [34,61] mediates differentiation and maturation of oligodendrocyte progenitor cells into myelin-producing oligodendrocytes, whereas receptor depletion inhibits oligodendroglial maturation [34]. Trophic factor activation of the EGFR, marked by increased tyrosine phosphorylation, can directly support growth and migration of immature glial cells during development [15,62], including oligodendrocytes [30]. In addition, TGF-α- and TGF-β-mediated effects on Notch pathway genes can stimulate survival, growth, and migration [4,5,63] and inhibit differentiation/maturation into myelin-producing oligodendrocytes [64], yet Notch can transcriptionally regulate EGFR via p53 [26]. The findings herein that TGF-α and TGF-β broadly increase Notch-related gene expression suggest they have important roles in maintaining oligodendroglia cells in an immature state [64]. However, TGF-β transactivation of the EGFR can lead to inhibition of cell growth and increased apoptosis, or enhanced growth in relation to tumor progression [65,66]. The consequences of TGF-β stimulation depend upon the intracellular signaling pathways engaged.
EGF, TGF-α, and TGF-β notably increased pY-EGFR, PCNA, HES1, HIF1A, and nestin. Importantly, HIF-1α/EGFR crosstalk has been well described such that EGF promotes HIF-1α expression and signaling, and EGF/EGFR signaling is enhanced by HIF-1α [67,68]. Increased HIF-1α inhibits maturation of oligoprogenitor cells and the expression of mature oligodendrocyte proteins [69,70], corresponding with the TGF-β-associated reduction in MBP and stimulation of GALC (non-myelinating–pre-myelinating protein) in MO3.13 cells. Since HIF-1α signals through Notch, the increased levels of both HIF1A and Notch-related mRNA transcripts in TGF-α- and TGF-β-stimulated cultures likely account for their neutral or inhibitory effects on mature oligodendrocyte marker expression. In contrast, in EGF-stimulated cultures, elevated levels of HIF-1α were not associated with broadly increased Notch gene expression, suggesting that EGFR/HIF-1α interactions are functionally active under EGF, TGF-α, and TGF-β, whereas HIF-1α/Notch pathway modulation occurs with TGF-α or TGF-β but not EGF stimulation. These types of differential downstream signaling effects of EGF, TGF-α, and TGF-β are likely critical to the function and fate of immature oligodendroglial cells. HIF-1α activates Notch by binding to the Notch intracellular domain under low-oxygen states [60] and maintains primitive undifferentiated cell states [71,72]. Additional research is needed to understand why HIF-1α activates Notch pathways in TGF-α- and TGF-β-stimulated but not EGF-stimulated MO3.13 immature oligodendroglial cells.
5. Limitations
- The experimental design utilized an immortalized hybrid glial cell line that is not fully representative of oligodendrocytes. Future studies should utilize primary oligodendrocyte cultures to validate the results.
- ELISAs were performed with RRID-validated antibodies to measure immunoreactivity. However, additional approaches such as Western blotting and quantitative immunocytochemical staining would enrich data quality and help to confirm antibody specificity.
- Further studies designed to specifically inhibit or activate EGFR pathways in non-transformed cells are needed to mechanistically link the observed trophic factor effects to oligodendroglia function with insulin/IGF and Notch pathways.
6. Conclusions
- In MO3.13 cells, EGF, TGF-α, and TGF-β were shown to activate EGFR, but only EGF and TGF-β significantly increased p44/42 Erk MAPK signaling. EGFR activation was associated with increased MTT activity and PCNA expression, while increased p44/42 Erk MAPK signaling was associated with inhibition of activated caspase-3 expression. Although reduced Caspase-3 activation may reflect decreased apoptosis or improved cell survival, confirmatory experiments are needed to accurately interpret the finding.
- EGF, TGF-α, and TGF-β differentially modulated the expression of oligodendroglia proteins. EGF consistently upregulated their expression, whereas TGF-α and TGF-β exerted mainly neutral or inhibitory effects on mature oligodendroglia proteins.
- EGF and TGF-α altered the expression of insulin/IGF/IRS-related mRNA transcripts.
- EGF, TGF-α, and TGF-β increased HIF1A mRNA, which may have contributed to Notch activation.
- TGF-α and TGF-β altered the expression of Notch pathway-related genes, as demonstrated by increased levels of NOTCH, JAGGED, HES1, and HEY1 mRNA transcripts. In contrast, EGF’s effect on the Notch pathway-related genes was limited.
- EGF’s predominantly stimulatory effect on oligodendrocyte proteins was associated with increased insulin/IGF/IRS pathway gene expression paired with mainly neutral effects on Notch. We hypothesize that EGF’s regulation of oligodendrocyte proteins may be mediated through IGF pathways rather than EGFR-specific signaling. Further validation experiments are needed, particularly given the limitations of the MO3.13 cell model.
- TGF-βs mainly neutral to inhibitory effects on oligodendroglia proteins were associated with increased Notch pathway mRNA expression and limited or absent changes in the expression of insulin/IGF/IRS pathway genes.
Supplementary Materials
The following supporting information can be downloaded at: https://www.mdpi.com/article/10.3390/neuroglia7040043/s1; Table S1: Trophic Factors; Table S2: Antibodies used in duplex ELISAs; Table S3: QuantiGene 2.0 Plex Panels; Table S4: Critical reagents and equipment; Table S5: ANOVA results of trophic factor stimulation; Table S6: ANOVA tests of trophic factor effects on glial molecules; Table S7: ANOVA test results of trophic factor effects on the insulin/IGF/IRS genes; Table S8: EGFR trophic factor stimulation of Notch networks.
Author Contributions
Conceptualization, S.M.d.l.M.; methodology, Z.L., M.T. and S.M.d.l.M.; validation, M.T. and S.M.d.l.M.; formal analysis, Z.L., M.T. and S.M.d.l.M.; investigation, Z.L. and M.T.; resources, S.M.d.l.M.; data curation, Z.L., M.T. and S.M.d.l.M.; writing—original draft preparation, S.M.d.l.M.; writing—review and editing, Z.L., M.T. and S.M.d.l.M.; visualization, S.M.d.l.M.; supervision, M.T. and S.M.d.l.M.; project administration, S.M.d.l.M.; funding acquisition, S.M.d.l.M. All authors have read and agreed to the published version of the manuscript.
Funding
This research was funded by NIAAA/NIH, grant numbers AA-011431, AA028408, and AA032106, and the APC was funded by SMDLM.
Institutional Review Board Statement
Not applicable.
Informed Consent Statement
Not applicable.
Data Availability Statement
The data underlying this article will be shared upon reasonable request to the corresponding author.
Conflicts of Interest
The authors declare no conflicts of interest.
Abbreviations
The following abbreviations are used in this manuscript:
| Abbreviation | Full Name |
| Akt | Protein kinase B |
| CNS | Central nervous system |
| CNPase | 2’,3’-cyclic nucleotide 3’-phosphodiesterase |
| BCA | Bicinchoninic acid assay |
| CNPase | 2’,3’-cyclic-nucleotide 3’-phosphodiesterase |
| DMEM | Dulbecco’s Modified Eagle Medium |
| EGF | Epidermal growth factor |
| EGFR | Epidermal growth factor receptor |
| ELISA | Enzyme-linked immunosorbent assay |
| ERK | Extracellular signal-regulated kinase |
| FASD | Fetal alcohol spectrum disorder |
| FBS | Fetal bovine serum |
| GALC | Galactocerebroside |
| GFAP | Glial fibrillary acidic protein |
| HEY | Hairy/Enhancer-of-split like with a Y |
| HES | Hairy and enhancer of split |
| HIF1A | Hypoxia-inducible factor 1 alpha |
| HPRT1 | Hypoxanthine phosphoribosyltransferase 1 |
| IGF | Insulin-like growth factor |
| IGF-1R | Insulin-like growth factor 1 receptor |
| Insulin-R | Insulin receptor |
| IRS | Insulin receptor substrate |
| MAG | Myelin-associated glycoprotein |
| MAPK | Mitogen-activated protein kinase |
| MBP | Myelin basic protein |
| MO3.13 | Human oligodendroglial hybrid cell line |
| MOG | Myelin oligodendrocyte glycoprotein |
| mTOR | Mechanistic target of rapamycin |
| MTT | 3-(4,5-dimethylthiazol-2-yl)-2,5-diphenyltetrazolium bromide |
| PBS | Phosphate-buffered saline |
| PCNA | Proliferating cell nuclear antigen |
| PDGFRA | Platelet-derived growth factor receptor alpha |
| PI3K | Phosphatidylinositol 3-kinase |
| PLP1 | Proteolipid protein 1 |
| RPL13A | Ribosomal protein L13a |
| RPLP0 | Large acidic ribosomal protein |
| TGF-α | Transforming growth factor alpha |
| TGF-β | Transforming growth factor beta |
References
- Bibollet-Bahena, O.; Almazan, G. IGF-1-stimulated protein synthesis in oligodendrocyte progenitors requires PI3K/mTOR/Akt and MEK/ERK pathways. J. Neurochem. 2009, 109, 1440–1451. [Google Scholar] [CrossRef] [Scilit]
- Dwivedi, S.; Ranjan, S.; Das, S.; Kumari, J.; Singh, S. Role of growth factors and their interplay during oligodendroglial differentiation and maturation. Cytokine Growth Factor Rev. 2025, 84, 47–58. [Google Scholar] [CrossRef] [Scilit]
- Saneto, R.P.; Low, K.G.; Melner, M.H.; de Vellis, J. Insulin/insulin-like growth factor I and other epigenetic modulators of myelin basic protein expression in isolated oligodendrocyte progenitor cells. J. Neurosci. Res. 1988, 21, 210–219. [Google Scholar] [CrossRef] [Scilit]
- Back, S.A. White matter injury in the preterm infant: Pathology and mechanisms. Acta Neuropathol. 2017, 134, 331–349. [Google Scholar] [CrossRef] [Scilit] [PubMed]
- Nagarajan, B.; Harder, A.; Japp, A.; Haberlein, F.; Mingardo, E.; Kleinert, H.; Yilmaz, O.; Zoons, A.; Rau, B.; Christ, A.; et al. CNS myelin protein 36K regulates oligodendrocyte differentiation through Notch. Glia 2020, 68, 509–527. [Google Scholar] [CrossRef] [Scilit]
- Carabulea, A.L.; Janeski, J.D.; Naik, V.D.; Chen, K.; Mor, G.; Ramadoss, J. A multi-organ analysis of the role of mTOR in fetal alcohol spectrum disorders. FASEB J. 2023, 37, e22897. [Google Scholar] [CrossRef] [Scilit]
- de la Monte, S.M.; Sutherland, G. Dual Stages of Alcohol-Related Cerebral White Matter Degeneration Reviewed: Early-Stage Stress/Neuroinflammation Versus Late-Stage Impaired Insulin/IGF Signaling Through Akt-mTOR-Review. ASN Neuro 2025, 17, 2573965. [Google Scholar] [CrossRef] [Scilit]
- Azimzadeh, M.; Cheah, P.S.; Ling, K.H. Brain insulin resistance in Down syndrome: Involvement of PI3K-Akt/mTOR axis in early-onset of Alzheimer’s disease and its potential as a therapeutic target. Biochem. Biophys. Res. Commun. 2024, 733, 150713. [Google Scholar] [CrossRef] [Scilit]
- Querfurth, H.; Lee, H.K. Mammalian/mechanistic target of rapamycin (mTOR) complexes in neurodegeneration. Mol. Neurodegener. 2021, 16, 44. [Google Scholar] [CrossRef] [Scilit]
- Yang, P.; Baker, K.A.; Hagg, T. The ADAMs family: Coordinators of nervous system development, plasticity and repair. Prog. Neurobiol. 2006, 79, 73–94. [Google Scholar] [CrossRef] [Scilit]
- Yalcin, E.B.; McLean, T.; Tong, M.; de la Monte, S.M. Progressive white matter atrophy with altered lipid profiles is partially reversed by short-term abstinence in an experimental model of alcohol-related neurodegeneration. Alcohol 2017, 65, 51–62. [Google Scholar] [CrossRef] [Scilit]
- Drew, P.D.; Johnson, J.W.; Douglas, J.C.; Phelan, K.D.; Kane, C.J. Pioglitazone blocks ethanol induction of microglial activation and immune responses in the hippocampus, cerebellum, and cerebral cortex in a mouse model of fetal alcohol spectrum disorders. Alcohol Clin. Exp. Res. 2015, 39, 445–454. [Google Scholar] [CrossRef] [Scilit]
- Olivares-Costa, M.; Fabio, M.C.; De la Fuente-Ortega, E.; Haeger, P.A.; Pautassi, R. New therapeutics for the prevention or amelioration of fetal alcohol spectrum disorders: A narrative review of the preclinical literature. Am. J. Drug Alcohol Abus. 2024, 50, 749–770. [Google Scholar] [CrossRef] [Scilit]
- de la Monte, S.M.; Tong, M.; Schiano, I.; Didsbury, J. Improved Brain Insulin/IGF Signaling and Reduced Neuroinflammation with T3D-959 in an Experimental Model of Sporadic Alzheimer’s Disease. J. Alzheimer’s Dis. 2017, 55, 849–864. [Google Scholar] [CrossRef] [Scilit]
- Gonzalez-Perez, O.; Romero-Rodriguez, R.; Soriano-Navarro, M.; Garcia-Verdugo, J.M.; Alvarez-Buylla, A. Epidermal growth factor induces the progeny of subventricular zone type B cells to migrate and differentiate into oligodendrocytes. Stem Cells 2009, 27, 2032–2043, Erratum in Stem Cells 2009, 27, 3122. https://doi.org/10.1002/stem.119. [Google Scholar] [CrossRef] [Scilit]
- Romano, R.; Bucci, C. Role of EGFR in the Nervous System. Cells 2020, 9, 1887. [Google Scholar] [CrossRef] [Scilit]
- Scalabrino, G. Epidermal Growth Factor in the CNS: A Beguiling Journey from Integrated Cell Biology to Multiple Sclerosis. An Extensive Translational Overview. Cell. Mol. Neurobiol. 2022, 42, 891–916. [Google Scholar] [CrossRef] [Scilit]
- Chen, J.; Zeng, F.; Forrester, S.J.; Eguchi, S.; Zhang, M.Z.; Harris, R.C. Expression and Function of the Epidermal Growth Factor Receptor in Physiology and Disease. Physiol. Rev. 2016, 96, 1025–1069. [Google Scholar] [CrossRef] [Scilit]
- Kornblum, H.I.; Hussain, R.J.; Bronstein, J.M.; Gall, C.M.; Lee, D.C.; Seroogy, K.B. Prenatal ontogeny of the epidermal growth factor receptor and its ligand, transforming growth factor alpha, in the rat brain. J. Comp. Neurol. 1997, 380, 243–261. [Google Scholar] [CrossRef] [Scilit]
- Kuhn, H.G.; Winkler, J.; Kempermann, G.; Thal, L.J.; Gage, F.H. Epidermal growth factor and fibroblast growth factor-2 have different effects on neural progenitors in the adult rat brain. J. Neurosci. 1997, 17, 5820–5829. [Google Scholar] [CrossRef] [Scilit]
- Li, H.; Gan, X.; Pan, L.; Zhang, Y.; Hu, X.; Wang, Z. EGF/bFGF promotes survival, migration and differentiation into neurons of GFP-labeled rhesus monkey neural stem cells xenografted into the rat brain. Biochem. Biophys. Res. Commun. 2022, 620, 76–82. [Google Scholar] [CrossRef] [Scilit]
- Liu, X.; Li, C.; Li, J.; Xie, L.; Hong, Z.; Zheng, K.; Zhao, X.; Yang, A.; Xu, X.; Tao, H.; et al. EGF signaling promotes the lineage conversion of astrocytes into oligodendrocytes. Mol. Med. 2022, 28, 50. [Google Scholar] [CrossRef] [Scilit]
- Weickert, C.S.; Webster, M.J.; Colvin, S.M.; Herman, M.M.; Hyde, T.M.; Weinberger, D.R.; Kleinman, J.E. Localization of epidermal growth factor receptors and putative neuroblasts in human subependymal zone. J. Comp. Neurol. 2000, 423, 359–372. [Google Scholar] [CrossRef] [Scilit]
- Pedraza, C.E.; Monk, R.; Lei, J.; Hao, Q.; Macklin, W.B. Production, characterization, and efficient transfection of highly pure oligodendrocyte precursor cultures from mouse embryonic neural progenitors. Glia 2008, 56, 1339–1352. [Google Scholar] [CrossRef] [Scilit]
- Estrada-Bernal, A.; Lawler, S.E.; Nowicki, M.O.; Ray Chaudhury, A.; Van Brocklyn, J.R. The role of sphingosine kinase-1 in EGFRvIII-regulated growth and survival of glioblastoma cells. J. Neuro-Oncol. 2011, 102, 353–366. [Google Scholar] [CrossRef] [Scilit]
- Purow, B.W.; Sundaresan, T.K.; Burdick, M.J.; Kefas, B.A.; Comeau, L.D.; Hawkinson, M.P.; Su, Q.; Kotliarov, Y.; Lee, J.; Zhang, W.; et al. Notch-1 regulates transcription of the epidermal growth factor receptor through p53. Carcinogenesis 2008, 29, 918–925. [Google Scholar] [CrossRef] [Scilit]
- Monnet-Tschudi, F.; Honegger, P. Influence of epidermal growth factor on the maturation of fetal rat brain cells in aggregate culture. An immunocytochemical study. Dev. Neurosci. 1989, 11, 30–40. [Google Scholar] [CrossRef] [Scilit]
- Sheng, H.Z.; Turnley, A.; Murphy, M.; Bernard, C.C.; Bartlett, P.F. Epidermal growth factor inhibits the expression of myelin basic protein in oligodendrocytes. J. Neurosci. Res. 1989, 23, 425–432. [Google Scholar] [CrossRef] [Scilit]
- Hammang, J.P.; Archer, D.R.; Duncan, I.D. Myelination following transplantation of EGF-responsive neural stem cells into a myelin-deficient environment. Exp. Neurol. 1997, 147, 84–95. [Google Scholar] [CrossRef] [Scilit]
- Ivkovic, S.; Canoll, P.; Goldman, J.E. Constitutive EGFR signaling in oligodendrocyte progenitors leads to diffuse hyperplasia in postnatal white matter. J. Neurosci. 2008, 28, 914–922. [Google Scholar] [CrossRef] [Scilit]
- De Kleijn, K.M.A.; Zuure, W.A.; Peijnenborg, J.; Heuvelmans, J.M.; Martens, G.J.M. Reappraisal of Human HOG and MO3.13 Cell Lines as a Model to Study Oligodendrocyte Functioning. Cells 2019, 8, 1096. [Google Scholar] [CrossRef] [Scilit]
- Mattson, M.P.; Barger, S.W.; Furukawa, K.; Bruce, A.J.; Wyss-Coray, T.; Mark, R.J.; Mucke, L. Cellular signaling roles of TGF beta, TNF alpha and beta APP in brain injury responses and Alzheimer’s disease. Brain Res. Rev. 1997, 23, 47–61. [Google Scholar] [CrossRef] [Scilit]
- Kaminska, B.; Kocyk, M.; Kijewska, M. TGF beta signaling and its role in glioma pathogenesis. Adv. Exp. Med. Biol. 2013, 986, 171–187. [Google Scholar] [CrossRef] [Scilit]
- Palazuelos, J.; Klingener, M.; Aguirre, A. TGFbeta signaling regulates the timing of CNS myelination by modulating oligodendrocyte progenitor cell cycle exit through SMAD3/4/FoxO1/Sp1. J. Neurosci. 2014, 34, 7917–7930. [Google Scholar] [CrossRef] [Scilit]
- Iwata, K.; Cafe-Mendes, C.C.; Schmitt, A.; Steiner, J.; Manabe, T.; Matsuzaki, H.; Falkai, P.; Turck, C.W.; Martins-de-Souza, D. The human oligodendrocyte proteome. Proteomics 2013, 13, 3548–3553. [Google Scholar] [CrossRef] [Scilit]
- Ghasemi, M.; Turnbull, T.; Sebastian, S.; Kempson, I. The MTT Assay: Utility, Limitations, Pitfalls, and Interpretation in Bulk and Single-Cell Analysis. Int. J. Mol. Sci. 2021, 22, 12827. [Google Scholar] [CrossRef] [Scilit] [PubMed]
- Pournajaf, S.; Valian, N.; Mohaghegh Shalmani, L.; Khodabakhsh, P.; Jorjani, M.; Dargahi, L. Fingolimod increases oligodendrocytes markers expression in epidermal neural crest stem cells. Eur. J. Pharmacol. 2020, 885, 173502. [Google Scholar] [CrossRef] [Scilit]
- Feoktistova, M.; Geserick, P.; Leverkus, M. Crystal Violet Assay for Determining Viability of Cultured Cells. Cold Spring Harb. Protoc. 2016, 2016, pdb-prot087379. [Google Scholar] [CrossRef] [Scilit]
- Fife, M.; Tong, M.; Das, B.; Rodriguez, R.; Chokkalingam, P.; Carlson, R.I.; de la Monte, S.M. Chondrosarcoma: Multi-Targeting Therapeutic Effects of Doxorubicin, BEZ235, and the Small Molecule Aspartyl-Asparaginyl-beta-hydroxylase Inhibitor SMI1182. Cancers 2025, 17, 1671. [Google Scholar] [CrossRef] [Scilit]
- Stern-Straeter, J.; Bonaterra, G.A.; Hormann, K.; Kinscherf, R.; Goessler, U.R. Identification of valid reference genes during the differentiation of human myoblasts. BMC Mol. Biol. 2009, 10, 66. [Google Scholar] [CrossRef] [Scilit]
- Lee, D.Y.; Lee, S.Y.; Yun, S.H.; Jeong, J.W.; Kim, J.H.; Kim, H.W.; Choi, J.S.; Kim, G.D.; Joo, S.T.; Choi, I.; et al. Review of the Current Research on Fetal Bovine Serum and the Development of Cultured Meat. Korean J. Food Sci. Anim. Resour. 2022, 42, 775–799. [Google Scholar] [CrossRef] [Scilit]
- Mohamed, H.E.; Asker, M.E.; Kotb, N.S.; El Habab, A.M. Human platelet lysate efficiency, stability, and optimal heparin concentration required in culture of mammalian cells. Blood Res. 2020, 55, 35–43. [Google Scholar] [CrossRef] [Scilit]
- Meng, D.; Shi, X.; Jiang, B.H.; Fang, J. Insulin-like growth factor-I (IGF-I) induces epidermal growth factor receptor transactivation and cell proliferation through reactive oxygen species. Free Radic. Biol. Med. 2007, 42, 1651–1660. [Google Scholar] [CrossRef] [Scilit]
- Roudabush, F.L.; Pierce, K.L.; Maudsley, S.; Khan, K.D.; Luttrell, L.M. Transactivation of the EGF receptor mediates IGF-1-stimulated shc phosphorylation and ERK1/2 activation in COS-7 cells. J. Biol. Chem. 2000, 275, 22583–22589. [Google Scholar] [CrossRef] [Scilit]
- Fressinaud, C.; Sarlieve, L.L.; Dalencon, D.; Labourdette, G. Differential regulation of cerebroside sulfotransferase and 2’,3’-cyclic nucleotide 3’-phosphodiesterase by basic fibroblast growth factor in relation to proliferation in rat oligodendrocyte cultures. J. Cell. Physiol. 1992, 150, 34–44. [Google Scholar] [CrossRef] [Scilit]
- Palandri, A.; Salvador, V.R.; Wojnacki, J. Myelin-associated glycoprotein modulates apoptosis of motoneurons during early postnatal development via NgR/p75NTR receptor-mediated activation of RhoA signaling pathways. Cell Death Dis. 2015, 6, e1876. [Google Scholar] [CrossRef] [Scilit]
- von Budingen, H.C.; Mei, F.; Greenfield, A.; Jahn, S.; Shen, Y.A.; Reid, H.H.; McKemy, D.D.; Chan, J.R. The myelin oligodendrocyte glycoprotein directly binds nerve growth factor to modulate central axon circuitry. J. Cell. Biol. 2015, 210, 891–898. [Google Scholar] [CrossRef] [Scilit]
- Peschl, P.; Bradl, M.; Hoftberger, R.; Berger, T.; Reindl, M. Myelin Oligodendrocyte Glycoprotein: Deciphering a Target in Inflammatory Demyelinating Diseases. Front. Immunol. 2017, 8, 529. [Google Scholar] [CrossRef] [Scilit]
- Hu, T.; Li, C. Convergence between Wnt-beta-catenin and EGFR signaling in cancer. Mol. Cancer 2010, 9, 236. [Google Scholar] [CrossRef] [Scilit]
- Tito, C.; Masciarelli, S.; Colotti, G.; Fazi, F. EGF receptor in organ development, tissue homeostasis and regeneration. J. Biomed. Sci. 2025, 32, 24. [Google Scholar] [CrossRef] [Scilit]
- Shi, H.; Cui, H.; Alam, G.; Gunning, W.T.; Nestor, A.; Giovannucci, D.; Zhang, M.; Ding, H.F. Nestin expression defines both glial and neuronal progenitors in postnatal sympathetic ganglia. J. Comp. Neurol. 2008, 508, 867–878. [Google Scholar] [CrossRef] [Scilit]
- Chou, Y.-H.; Khouon, S.; Herrmann, H.; Goldman, R.D. Nestin Promotes the Phosphorylation-dependent Disassembly of Vimentin Intermediate Filaments During Mitosis. Mol. Biol. Cell 2003, 14, 1468–1478. [Google Scholar] [CrossRef] [Scilit]
- Gallo, V.; Armstrong, R.C. Developmental and growth factor-induced regulation of nestin in oligodendrocyte lineage cells. J. Neurosci. 1995, 15, 394–406. [Google Scholar] [CrossRef] [Scilit]
- Huang, Y.L.; Shi, G.Y.; Jiang, M.J.; Lee, H.; Chou, Y.W.; Wu, H.L.; Yang, H.Y. Epidermal growth factor up-regulates the expression of nestin through the Ras-Raf-ERK signaling axis in rat vascular smooth muscle cells. Biochem. Biophys. Res. Commun. 2008, 377, 361–366. [Google Scholar] [CrossRef] [Scilit]
- Lewitt, M.S.; Boyd, G.W. The Role of Insulin-Like Growth Factors and Insulin-Like Growth Factor-Binding Proteins in the Nervous System. Biochem. Insights 2019, 12, 1178626419842176. [Google Scholar] [CrossRef] [Scilit]
- Mozell, R.L.; McMorris, F.A. Insulin-like growth factor I stimulates oligodendrocyte development and myelination in rat brain aggregate cultures. J. Neurosci. Res. 1991, 30, 382–390. [Google Scholar] [CrossRef] [Scilit]
- Frederick, T.J.; Wood, T.L. IGF-I and FGF-2 coordinately enhance cyclin D1 and cyclin E-cdk2 association and activity to promote G1 progression in oligodendrocyte progenitor cells. Mol. Cell. Neurosci. 2004, 25, 480–492. [Google Scholar] [CrossRef] [Scilit]
- Chandran, S.; Svendsen, C.; Compston, A.; Scolding, N. Regional potential for oligodendrocyte generation in the rodent embryonic spinal cord following exposure to EGF and FGF-2. Glia 1998, 24, 382–389. [Google Scholar] [CrossRef] [Scilit]
- Hu, N.; Zou, L. Multiple functions of Hes genes in the proliferation and differentiation of neural stem cells. Ann. Anat.-Anat. Anz. 2022, 239, 151848. [Google Scholar] [CrossRef] [Scilit]
- Li, Y.; Wu, L.; Yu, M.; Yang, F.; Wu, B.; Lu, S.; Tu, M.; Xu, H. HIF-1alpha is Critical for the Activation of Notch Signaling in Neurogenesis During Acute Epilepsy. Neuroscience 2018, 394, 206–219. [Google Scholar] [CrossRef] [Scilit]
- Miyazono, K. TGF-beta signaling by Smad proteins. Cytokine Growth Factor Rev. 2000, 11, 15–22. [Google Scholar] [CrossRef] [Scilit]
- Gonzalez-Perez, O.; Quinones-Hinojosa, A. Dose-dependent effect of EGF on migration and differentiation of adult subventricular zone astrocytes. Glia 2010, 58, 975–983. [Google Scholar] [CrossRef] [Scilit]
- Mastronardi, F.G.; Moscarello, M.A. Molecules affecting myelin stability: A novel hypothesis regarding the pathogenesis of multiple sclerosis. J. Neurosci. Res. 2005, 80, 301–308. [Google Scholar] [CrossRef] [Scilit]
- Wang, S.; Sdrulla, A.D.; diSibio, G.; Bush, G.; Nofziger, D.; Hicks, C.; Weinmaster, G.; Barres, B.A. Notch receptor activation inhibits oligodendrocyte differentiation. Neuron 1998, 21, 63–75. [Google Scholar] [CrossRef] [Scilit]
- Kaminska, B.; Wesolowska, A.; Danilkiewicz, M. TGF beta signalling and its role in tumour pathogenesis. Acta Biochim. Pol. 2005, 52, 329–337. [Google Scholar] [CrossRef] [Scilit]
- Zhao, Y.; Ma, J.; Fan, Y.; Wang, Z.; Tian, R.; Ji, W.; Zhang, F.; Niu, R. TGF-beta transactivates EGFR and facilitates breast cancer migration and invasion through canonical Smad3 and ERK/Sp1 signaling pathways. Mol. Oncol. 2018, 12, 305–321. [Google Scholar] [CrossRef] [Scilit]
- Zhao, F.L.; Qin, C.F. EGF promotes HIF-1alpha expression in colorectal cancer cells and tumor metastasis by regulating phosphorylation of STAT3. Eur. Rev. Med. Pharmacol. Sci. 2019, 23, 1055–1062. [Google Scholar] [CrossRef] [Scilit]
- Wang, B.; He, J.; Cui, Y.; Yu, S.; Zhang, H.; Wei, P.; Zhang, Q. The HIF-1alpha/EGF/EGFR Signaling Pathway Facilitates the Proliferation of Yak Alveolar Type II Epithelial Cells in Hypoxic Conditions. Int. J. Mol. Sci. 2024, 25, 1442. [Google Scholar] [CrossRef] [Scilit]
- Janowska, J.; Ziemka-Nalecz, M.; Sypecka, J. Inhibition of the HIF-1alpha Signaling Pathway Promotes Oligodendrocyte Maturation in the In Vitro Model of Perinatal Asphyxia. Mol. Neurobiol. 2025, 62, 15928–15942. [Google Scholar] [CrossRef] [Scilit]
- Allan, K.C.; Hu, L.R.; Scavuzzo, M.A.; Morton, A.R.; Gevorgyan, A.S.; Cohn, E.F.; Clayton, B.L.L.; Bederman, I.R.; Hung, S.; Bartels, C.F.; et al. Non-canonical Targets of HIF1a Impair Oligodendrocyte Progenitor Cell Function. Cell Stem Cell 2021, 28, 257–272.e11. [Google Scholar] [CrossRef] [Scilit]
- Qiang, L.; Wu, T.; Zhang, H.W.; Lu, N.; Hu, R.; Wang, Y.J.; Zhao, L.; Chen, F.H.; Wang, X.T.; You, Q.D.; et al. HIF-1alpha is critical for hypoxia-mediated maintenance of glioblastoma stem cells by activating Notch signaling pathway. Cell Death Differ. 2012, 19, 284–294. [Google Scholar] [CrossRef] [Scilit]
- Gustafsson, M.V.; Zheng, X.; Pereira, T.; Gradin, K.; Jin, S.; Lundkvist, J.; Ruas, J.L.; Poellinger, L.; Lendahl, U.; Bondesson, M. Hypoxia requires notch signaling to maintain the undifferentiated cell state. Dev. Cell 2005, 9, 617–628. [Google Scholar] [CrossRef] [Scilit]
Disclaimer/Publisher’s Note: The statements, opinions and data contained in all publications are solely those of the individual author(s) and contributor(s) and not of MDPI and/or the editor(s). MDPI and/or the editor(s) disclaim responsibility for any injury to people or property resulting from any ideas, methods, instructions or products referred to in the content. |
© 2026 by the authors. Licensee MDPI, Basel, Switzerland. This article is an open access article distributed under the terms and conditions of the Creative Commons Attribution (CC BY) license.