


Abstract
Background: Interleukin-13 Receptor alpha 2 (IL13Rα2) is an attractive therapeutic target for glioblastoma because of its limited expression in normal brain tissue and overexpression in many tumors. However, the spatial heterogeneity of glioblastoma and limitations of conventional culture models may contribute to the inconsistent translation of IL13Rα2-targeted therapies. This study evaluated IL13Rα2 expression across multiple in vitro glioblastoma models and spatially resolved patient tumors. Methods: IL13Rα2 mRNA and protein expression levels were measured across two-dimensional and three-dimensional glioblastoma culture models, including commercial cell lines (U87MG and T98G), and patient-derived neurospheres. Spatial expression patterns were also characterized using Ivy Glioblastoma Atlas Project. Results: IL13Rα2 expression was highly dependent on glioblastoma model system, with substantial variability observed across commercial cell lines, patient-derived neurospheres, and three-dimensional cultures. Spatial transcriptomic analysis identified significant enrichment of IL13Rα2 expression within perinecrotic tumor regions relative to the leading edge, infiltrating tumor, and cellular tumor. Conclusions: The heterogeneous nature of glioblastoma highlights the limitations of current in vitro modeling and the importance of considering spatial expression patterns when developing IL13Rα2-targeted therapies.
1. Introduction
Glioblastoma, previously known as glioblastoma multiforme (GBM), is the most common and aggressive primary malignant brain tumor in adults [1]. Despite current standard-of-care treatments, mortality rates remain concerning, with median overall survival ranging from 12 to 15 months with a 4.6% survival rate after 5 years [2,3]. The severity of GBM has prompted extensive investigation into novel therapeutic strategies; however, these approaches have yielded only modest improvements in patient survival [4]. One of the principal obstacles to the development of effective targeted therapies for GBM is the pronounced intratumoral spatial heterogeneity characteristic of GBM tumors [5]. Distinct tumor regions differ in cellular composition, molecular signaling, and receptor expression, resulting in heterogeneous distributions of potential therapeutic targets [6]. This variability allows subpopulations of tumor cells to evade treatment, ultimately contributing to therapeutic resistance and disease recurrence [7]. Therefore, defining the spatial expression patterns and in vitro models of clinically relevant therapeutic targets is essential for the development of more effective targeted therapies.
Interleukin-13 Receptor Alpha 2 (IL13Rα2) has been studied as a therapeutic target for GBM [8,9]. IL13Rα2 was originally characterized as a decoy receptor following early studies in murine models that identified a soluble decoy and membrane-bound isoforms capable of binding IL-13 with high affinity [10]. However, subsequent studies of human GBM have demonstrated that the soluble isoform is not noticeably expressed in human GBM, where IL13Rα2 exists predominantly as a membrane-bound receptor [10]. Membrane-bound IL13Rα2 activates STAT6-independent signaling, including ERK/AP1 and Src/PIK/Akt/mTOR pathways [10,11]. Collectively, these pathways promote glioma cell proliferation and invasion, while inducing production of transforming growth factor beta (TGF-β) [4,10,11]. This membrane-bound receptor is overexpressed in approximately 76% of GBM tumors while exhibiting minimal expression in healthy brain tissue, thereby contributing to its attractiveness as a therapeutic target [12,13]. While IL13Rα2 has been studied as a therapeutic target, accumulating evidence suggests that receptor expression is not uniform throughout the tumor microenvironment, likely contributing to variable responses to targeted therapies [14,15]. Although previous studies have reported increased IL13Rα2 expression in higher grade gliomas GBM, its relationship with spatial heterogeneity has not been extensively characterized through bioinformatic analysis, highlighting the novelty of the present study [16,17].
Recombinant IL-13 cytotoxins, monoclonal antibodies, cancer vaccines, antibody–drug conjugates, and chimeric antigen receptor (CAR) T-cell therapies are all currently being tested as therapeutic options for GBM treatment [4,8,17,18,19,20]. Early preclinical studies demonstrated potent and selective antitumor activity, leading to multiple clinical trials evaluating IL13Rα2-directed therapies in patients with recurrent malignant glioma [4,21,22]. Although several approaches have shown promising safety profiles and durable responses in select patients, overall clinical efficacy has remained modest, with most therapies producing limited or inconsistent survival benefits [4,23,24,25]. Accordingly, a more comprehensive understanding of IL13Rα2 expression and regulation within the heterogeneous GBM tumor microenvironment, including its spatial distribution, may improve the development and evaluation of future IL13Rα2-targeted therapies.
Although IL13Rα2 expression has been extensively characterized in conventional two-dimensional (2D) GBM cell cultures, relatively little is known about its expression in three-dimensional (3D) tumor models, particularly with regard to protein expression. Most studies investigating IL13Rα2 in GBM 3D models have focused on mRNA expression, whereas comparatively few have examined corresponding changes in cell surface protein expression despite its direct relevance to targeted therapies [8,26]. Three-dimensional spheroid cultures generated from established GBM cell lines provide a cost-effective and physiologically relevant platform that recapitulates key features of the GBM tumor microenvironment, including cell–cell interactions, nutrient and oxygen gradients, and regional phenotypic heterogeneity that is absent in monolayer cultures [27]. Furthermore, patient-derived GBM neurospheres preserve many characteristics of primary tumors, including cellular heterogeneity and stem-like phenotypes, making them valuable preclinical models for studying therapeutic targets [28].
Despite advances in in vitro modeling, it remains unclear whether IL13Rα2 expression is altered by the 3D structure of GBM or whether current culture models reproduce the regional expression patterns in human tumors. Therefore, this study compares IL13Rα2 mRNA and protein expression in established GBM cell lines grown as 2D monolayers and 3D spheroids, as well as patient-derived GBM neurospheres. Spatial transcriptomic analysis of human GBM specimens was subsequently performed to characterize regional IL13Rα2 expression and provide biological context for these preclinical models. Together, these complementary approaches were used to evaluate how well current in vitro models recapitulate IL13Rα2 expression within human GBM.
2. Materials and Methods
2.1. Materials
All materials, including catalog numbers, manufacturers, and lot numbers, where applicable, are provided in Table A1.
2.2. Cell Line Culturing
2.2.1. Cell Line Selection and Justification
Immortalized human GBM cell lines were acquired through American Type Culture Collection (ATCC). A U87MG cell line (HTB-14) was selected as a high-expression line of IL13Rα2 while a T98G cell line (CRL-1690) was selected as a low expression line of IL13Rα2 [11,29]. Patient-derived GBM samples N08-74 and NU02068 were acquired from Northwestern University (courtesy of the Dr. Daniel J. Brat’s Lab). The NU02068 GBM sample was acquired from a 65-year-old male while the N08-74 origin details were not available. Each of these lines was selected to assess the variable levels of IL13Rα2 expression on both mRNA and protein levels.
2.2.2. Monolayer Culturing
IL13Rα2 mRNA expression was analyzed using human-derived GBM cell lines U87MG and T98G, in both monolayer and spheroid culture conditions. For the monolayer expression, cells were cultured in a 2D monolayer environment with EMEM media with 10% fetal bovine serum (FBS) at 37 °C in 5% CO2. Cells were grown in a T75 flask until confluent.
2.2.3. Spheroid Culturing
Spheroids of GBM cell lines U87MG and T98G were made using Microtissues 3D Petri Dish® molds (Microtissues, Providence, RI, USA). These molds were prepared and equilibrated following the manufacturer’s protocol [30]. Briefly, micro-molds were rinsed with phosphate-buffered saline (pH 7.4) and autoclaved for sterilization. One gram of agarose powder was placed into a dry 250 mL glass bottle. Under an aseptic hood, 50 mL of autoclaved 0.9% (w/v) NaCl was added and mixed via gentle swirling. The agarose solution was then autoclaved using a 15 min liquid cycle. The molten agarose was allowed to cool to 70 °C. In an aseptic hood, 360 μL of molten agarose was pipetted into a 24-series micro-mold avoiding bubble formation. After solidifying, each 3D mold was placed into an individual well of a 6-well plate. To equilibrate the 3D mold, 3 mL of serum-free EMEM was pipetted into each well and the molds were incubated at 37 °C for 15 min. Serum-free culture media was then subsequently removed. Each mold was then seeded with 75 μL of cell suspension in EMEM containing approximately 100,000 cells per mold. Cell viability and concentration were determined using Trypan Blue exclusion and manual counting with a hemocytometer. Following seeding, 1.5 mL of EMEM with 10% FBS was added into each well, surrounding the 3D mold. Plates were placed in a cell culture incubator (Isotemp, Fisher, Waltham, MA, USA) at 37 °C in 5% CO2. Spheroids were microscopically monitored and upon the majority of spheroids reaching at least 200 μm in diameter, surrounding media was discarded in a new 6-well plate; 1 mL of fresh media was added to each well. The diameter of spheroids was determined using Image Focus Alpha (version x64, Euromex Microscopen B.V, Duiven, The Netherlands) (Figure A1).
2.2.4. Neurosphere Culturing
Cells were cultured per Dr. Daniel J. Brat’s lab guidance and as previously published [31]. Patient-derived GBM cell lines N08-74 and NU02068 were cultured in T75 flasks with Neurobasal-A medium with additives at 37 °C at 5% CO2. The additives 10 mL B27, 5 mL GlutaMAX, 5 mL of antibiotic–antimycotic, 500 µL Heparin, 500 µL Epidermal growth factor (20 µg/mL), and 500 µL fibroblast growth factor (20 µg/mL) were mixed into a new 500 mL container of Neurobasal-A medium. Media changes were performed when the indicator turned from red to yellow.
2.3. mRNA Isolation
2.3.1. Monolayer mRNA Isolation
mRNA isolation protocol was adapted from TRIzol Reagent manufacturer guide [32]. To isolate RNA, culture media was removed and cells were washed with 1× PBS (pH 7.4). 1× PBS (pH 7.4) was removed, then 1 mL of TRIzol reagent was added to the flask to lyse the cells. Once the cells were fully lysed, indicated by the absence of intact cells on the bottom of the culture flask, the lysates were transferred to a 1.5 mL microcentrifuge tube. Per 1 mL of TRIzol, 0.2 mL of Chloroform was added. Samples were then mixed by inversion and left to incubate for 3 min at room temperature. The lysates were then centrifuged for 15 min at 12,000× g at 4 °C. The aqueous phase containing RNA was then transferred to a new tube for RNA precipitation. RNA precipitation was performed by adding 0.5 mL of isopropanol to the aqueous phase followed by 10 min incubation at room temperature. Samples were centrifuged for 10 min at 12,000× g at 4 °C to form an RNA pellet. Supernatant was discarded and the pellet was washed with 1 mL of 75% ethanol, mixed, and centrifuged at 7500× g for 5 min at 4 °C. After the supernatant was discarded, the pellet was air-dried for 10 min, resuspended in 40 μL of RNase-free water, and incubated at 55 °C for 10 min to facilitate dissolution. Concentration of RNA was then determined using NanoDrop 2000c UV spectrophotometer (Version 1.6.198, Thermo Scientific, Waltham, MA, USA).
2.3.2. 3D mRNA Isolation
Once U87MG and T98G spheroids had grown to respective sizes of 287.4 (±76.6) and 192.1 (±24.1) µm, the 3D molds were then transferred into the new well face down and gently swirled and allowed to sit for 5 min at room temperature to promote spheroid release. Plates were then placed on an orbital shaker at 70 rpm at room temperature to further facilitate spheroid release from the molds. Using tweezers, the 3D molds were then placed right side up and gently rinsed with the media in the corresponding well. Each mold was inspected microscopically to ensure sufficient spheroid release. The media containing the spheroids was then collected and placed into 1.5 mL sterile microcentrifuge tubes and briefly spun down using an OniLab mini tabletop microcentrifuge (OniLab, San Francisco, CA, USA) to pellet the spheroids. Following centrifugation, the supernatant was discarded and the cells were then lysed by the addition of 1 mL of TRIzol reagent to each tube. The same cell lysis and RNA isolation method were used as the monolayer cell culture (Section 2.3.1). Concentration was determined using NanoDrop UV Spectrophotometry (Version 1.6.198, Thermo Scientific, Waltham, MA, USA).
2.3.3. Neurosphere mRNA Isolation
Once the N08-74 and NU02068 neurospheres had reached sizes of 234.1 (±116.2) and 252.0 (±70.0) µm in diameter, respectively, media with cells was transferred to a centrifuge tube and centrifuged at 300× g for 2–3 min to pellet cells. Supernatant media was discarded and 1 mL of TRIzol was added to lyse the neurospheres. The cells were briefly triturated and allowed to incubate at room temperature for 5 min. The same RNA isolation method as that in the monolayer cell culture (Section 2.3.1) was used. Concentration was determined using the Nanodrop UV Spectrophotometry.
2.4. cDNA Synthesis
Applied Biosystems™ High-Capacity cDNA reverse transcription (RT) (ThermoFisher, Waltham, MA, USA) kit was used to isolate RNA [33]. The RT master mix, made in sterile PCR tubes on ice, consisted of 2.0 μL 10× RT buffer, 0.8 μL 25× dNTP mix (100 mM), 2.0 μL RT random primers, 1.0 μL MultiScribe™ reverse transcriptase, 4.2 μL nuclease free water. A total of 2 μg of isolated RNA lysates were pipetted into the reaction mixture. The amount of RNA solution placed into each reaction mixture was determined by concentrations determined via NanoDrop. The samples were briefly centrifuged and maintained on ice before being transferred to the thermocycler. The program consisted of incubation for 10 min at 25 °C, 37 °C for 120 min, 85 °C for 5 min, and finishing at 4 °C.
2.5. RT-PCR and Electrophoresis
PCR was performed on the synthesized cDNA with the IL13 Rα2 primers. The PCR reaction was prepared by combining 25 μL of Gotaq Green MasterMix (2×), 1.0 μL of the forward IL13Rα2 primer, 1.0 μL of the reverse IL13Rα2 primer (Table 1), 4.0 μL of the cDNA template, and 19.0 μL of nuclease free water in a sterile PCR tube. The PCR protocol used for this reaction was as follows. The initial denaturation was performed at 95 °C for 3 min for 1 cycle. This was followed by 30 s at 95 °C followed by 30 s at 53 °C, followed by 1 min at 72 °C for 35 cycles. A final extension was performed at 72 °C for 5 min followed by a hold at 4 °C.
Table 1.
Primers used for PCR reactions.
The same protocol was carried out for the GAPDH primers except for the intermediate 35 cycles run at 30 s at 95 °C followed by 30 s at 51 °C, followed by 1 min at 72 °C. The forward GAPDH primer and reverse GAPDH primer (Table 1) were utilized for PCR. Each 1% agarose gel was loaded and run for 60 min at 100 V. Loading of the gel consisted of U87MG 7 μL of PCR product, 3 μL water, and 2 μL of 6× TriTrack loading dye; T98G monolayer 9 μL of PCR, 1 μL water, and 2 μL loading dye, T98G spheroid 8 μL PCR product, 2 μL water and 2 μL loading dye. Gels were imaged using a PowerSnap imager (Invitrogen, Waltham, MA, USA), and densitometric analysis was performed using Fiji ImageJ software (version 2.16.0/1.54p).
mRNA Statistical Analysis
To assess the mRNA expression of IL13Rα2, the intensity data for each of the IL13Rα2 bands yielded from the densitometric analysis was normalized according to the averaged intensity of the five GAPDH bands that were run on the same gel, as shown in Equation (1). This yielded a GAPDH-normalized mRNA expression value, enabling comparison across different cell lines and model types. An additional exploratory diameter-normalization was performed to account for the likely spatial distribution of IL13Rα2; this was done by dividing the GAPDH-normalized values by the average spheroid diameter. All GAPDH and diameter normalized data is provided in Table A2. Two independent Welch’s t-tests were used to compare IL13Rα2 mRNA expression between monolayer and spheroid culture within each cell line, as the data stemmed from two independent populations. To compare IL13Rα2 mRNA expression across the four spheroid-forming models, a one-way ANOVA was performed, followed by Tukey HSD post hoc test to identify pairwise differences among groups and to correct for multiple comparisons within that family of tests. All analyses used an alpha value of 0.05 to determine significance and were performed in R (version 4.5.3).
2.6. ELISA Protein Quantification in Monolayer and 3D Culture
Lysed fractions of IL13Rα2 were assessed in both 2D and 3D cell culture lysates of GBM using an Invitrogen Human IL-13R alpha 2 Enzyme-Linked Immunosorbent Assay (ELISA) (Thermo Fisher Scientific, Waltham, MA, USA) [34]. Monolayer cultures of T98G and U87MG were grown, as previously described, to confluency in T75 culture flasks before being lysed. 3D cultures of T98G and U87MG were grown until they formed mostly symmetrical spheroids with average sizes of 187.2 (±58.8) µm and 380.3 (±127.0) µm, respectively, within their agarose microtissue molds, at which point lysis was performed. Patient-derived GBM neurospheres N08-74 and NU02068 were grown, as previously described, to average sizes of 354.9 (±105.9) µm and 115.3 (±29.6) µm, respectively, prior to lysis.
All cell cultures were lysed using the same general protocol, adapted from Abcam’s (Cambridge, UK) sample preparation for Western blots manual [35]. To attain whole cell lysis, the NP-40 lysis buffer was utilized, substituting the 1.0% NP-40 for Triton X-100. To minimize protein degradation, a protease cocktail inhibitor was added at a concentration of 10 µL for every 500 µL of buffer prior to lysis. Supernatants were first aspirated from the GBM cells and stored to be used in the ELISA kit. Cells were then rinsed with 1× PBS (pH 7.4), followed by a five-minute incubation in trypsin to detach adhered monolayer cell lines. Following a centrifugation step at 902× g, all cells were washed with 1× PBS (pH 7.4) to minimize potential interference by trypsin or culture medium. Cell pellets were kept on ice and then 200–500 µL of lysis buffer was added using a micropipette, enabling further agitation via trituration to sufficiently break up each cell pellet. Each cell suspension was then agitated using an orbital shaker at 150 rpm for 20 min at 4 °C. Following agitation, the cell suspensions were centrifuged at 10,303× g for 20 min at 4 °C, yielding an upper lysate layer and a pellet of cell debris at the bottom of the tubes. The lysate layer was transferred to a clean tube for total protein concentration analysis via a Rose Bengal Assay [36] and then stored for short term storage at –20 °C. In addition to running the cell lysates, supernatants were collected and clarified to ensure validation of the ELISA kit based on the manufacturer’s protocol [34]. Clarification was performed via centrifugation of cell culture supernatants at 10,303× g for 10 min at 4 °C.
Prior to running the ThermoFisher (Waltham, MA, USA) ELISA kit for IL13Rα2, all previously collected cell lysates were removed from –20 °C and allowed to thaw at 4 °C. Reagents within the ELISA kit were prepared as specified in the manufacturer manual [34]. Sample dilutions were performed with a ten-fold dilution scheme in 1× Assay Diluent B, provided from the ELISA kit, for both the cell lysate and cell culture supernatant. The IL13Rα2 standard curve was prepared using the dilution series per the manufacturer’s instructions [34]. All standards, samples, and blanks were plated according to a pre-determined 96-well scheme, and the assay was performed as specified in the ThermoFisher ELISA manual. After performing the experiment, the optical densities for each well were determined at 450 nm using a Thermo Scientific Varioskan LUX microplate reader (Thermo Fisher Scientific, Waltham, MA, USA) and converted to concentrations using Origin 2026 (Version 10.3.0.197) based on the resultant four-parameter algorithm standard curve.
Statistical Analysis of Protein Expression of IL13Rα2
Resultant IL13Rα2 concentrations were corrected for their dilution factors and then normalized according to their total protein concentrations, as determined via a Rose Bengal Assay, following Equation (2) [37]. An additional exploratory diameter-normalization was performed to account for the likely spatial distribution of IL13Rα2; this was done by dividing the protein normalization by the average spheroid diameter. All normalized data are provided in Table A3. As three biologically independent samples were run in the ELISA, the normalized ratios were then averaged, and a standard deviation was calculated. Similar to mRNA expression statistics, two independent Welch’s t-tests were used to compare protein expression between monolayer and spheroid culture within each cell line and a one-way ANOVA with Tukey HSD was performed to compare across spheroid-forming models.
2.7. Bioinformatics
Spatial IL13Rα2 expression data were obtained from the Ivy Glioblastoma Atlas Project (Ivy GAP) (https://glioblastoma.alleninstitute.org, accessed 25 June 2026). Expression values from eight histologically defined tumor compartments were extracted for each donor: leading edge (LE), infiltrating tumor (IT), cellular tumor (CT), hyperplastic blood vessels in the cellular tumor (HBV), pseudopalisading cells without visible necrosis (PPC−), pseudopalisading cells surrounding necrosis (PPC+), perinecrotic zone (PNZ), and necrosis (N). Expression values were log2-transformed using log2 (expression + 1) for visualization and analysis. Differences in IL13Rα2 expression among spatial regions were assessed using a linear mixed-effects model with spatial region as a fixed effect and donor as a random intercept to account for repeated measurements within individual tumors. Overall significance was evaluated using a Type III analysis of variance with Satterthwaite’s approximation for degrees of freedom. Planned pairwise comparisons between the perinecrotic zone and selected spatial regions (LE, IT, CT, N, and PPC-) were performed using estimated marginal means, with Holm adjustment applied across the five prespecified comparisons to account for multiple testing. Boxplots with overlaid individual data points were generated in R (version 4.x) using ggplot2 (version 4.0.3).
3. Results
3.1. Altered mRNA Expression Levels of IL13Rα2 Across Culture Models
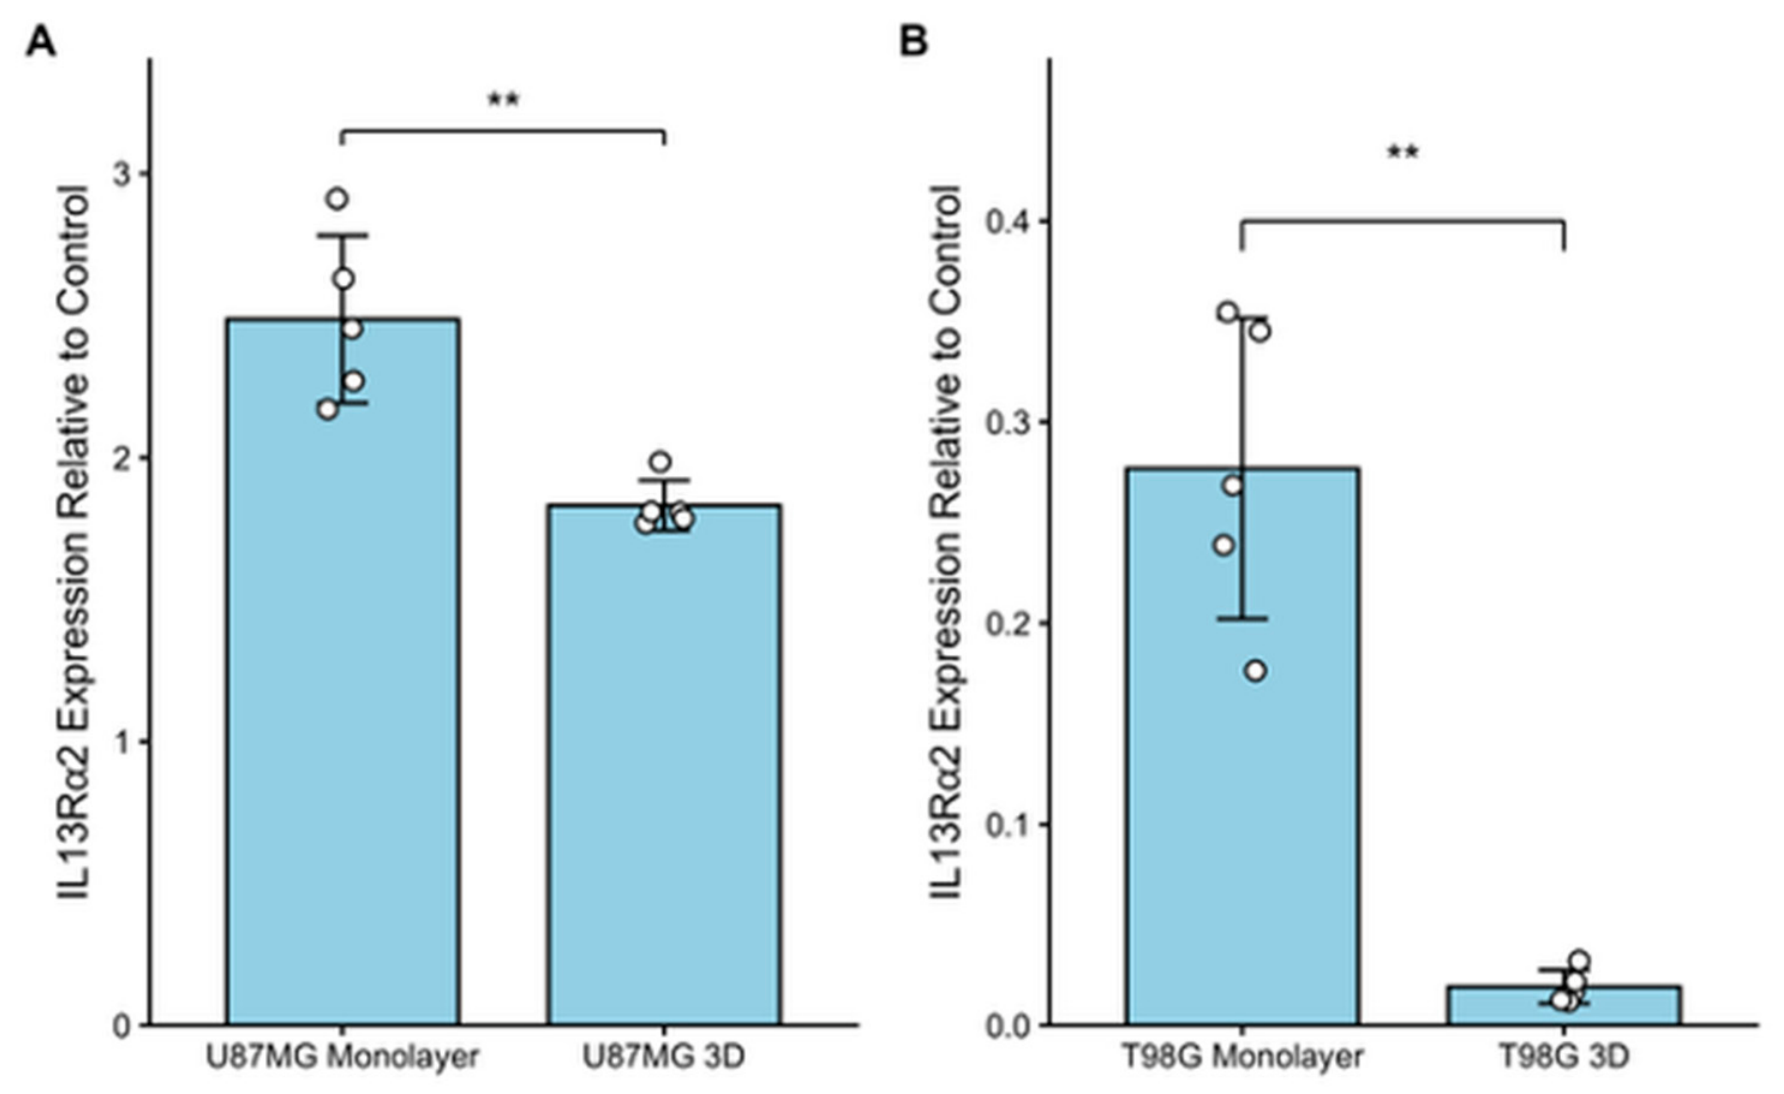
To first establish a baseline, the differences in IL13Rα2 mRNA expression between monolayer cultures of different cell types were assessed by performing semi-quantitative endpoint reverse transcription PCR (RT-PCR), followed by densitometric analysis of the gels, which are displayed in Figure A2, Figure A3 and Figure A4. The differences in IL13Rα2 expression, as seen in Figure 1, show that the U87MG monolayer expressed IL13Rα2 mRNA levels at 2.49 (±0.30) compared to the T98G monolayer culture mRNA expression at 0.28 (±0.07), following normalization to GAPDH. There is significantly reduced expression of IL13Rα2 in T98G monolayer as compared with the U87MG monolayer. All raw averages for band intensity provided in Table A2.
Figure 1.
Differing IL13Rα2 expression levels between monolayer and spheroid cultures of two different immortalized GBM cell lines. (A) Displays the IL13Rα2 expression within a U87MG cell line, grown in both monolayer and 3D culture conditions. Expression values were normalized to GAPDH. (B) Shows the differing expression levels of IL13Rα2 in monolayer and 3D cultures of immortalized cell line, T98G. Expression values were normalized to GAPDH. The data are presented as mean ± SD (** p < 0.01) (n = 5 independent biological replicates).
To determine how expression levels of IL13Rα2 differ across the two different GBM cell lines and models, mRNA transcript levels of IL13Rα2 were evaluated via semi-quantitative endpoint RT-PCR. As shown in Figure 1, the mRNA transcript level for IL13Rα2 was seen to decrease across both cell lines when transitioned from a monolayer to a 3D culture model. Specifically, it can be denoted that a significant decrease is seen during the shift from a monolayer to a spheroid culture model of U87MG (p = 0.005927) (Figure 1A), with the IL13Rα2 expression exhibiting an aforementioned value of 2.49 (±0.30) within a monolayer culture model versus a value of 1.83 (±0.09) in a 3D culture model. Similarly, this same trend was observed for the T98G GBM cell line, with the monolayer culture having an IL13Rα2 normalized expression value of 0.28 (±0.07), as compared with the significantly lower value of 0.019 (±0.008) for its 3D culture model (p = 0.001412) (Figure 1B). Representative cell images are seen in Figure A3 with average spheroid diameters and standard deviations in Table A2.
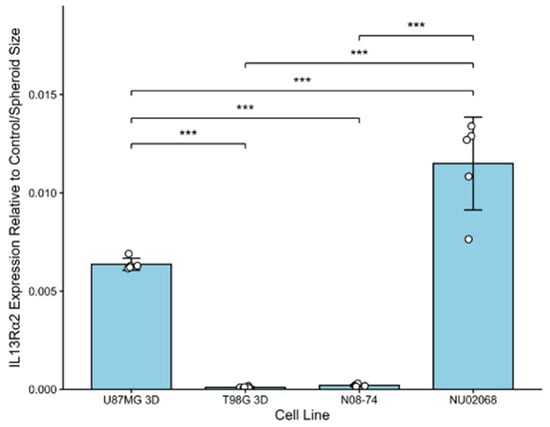
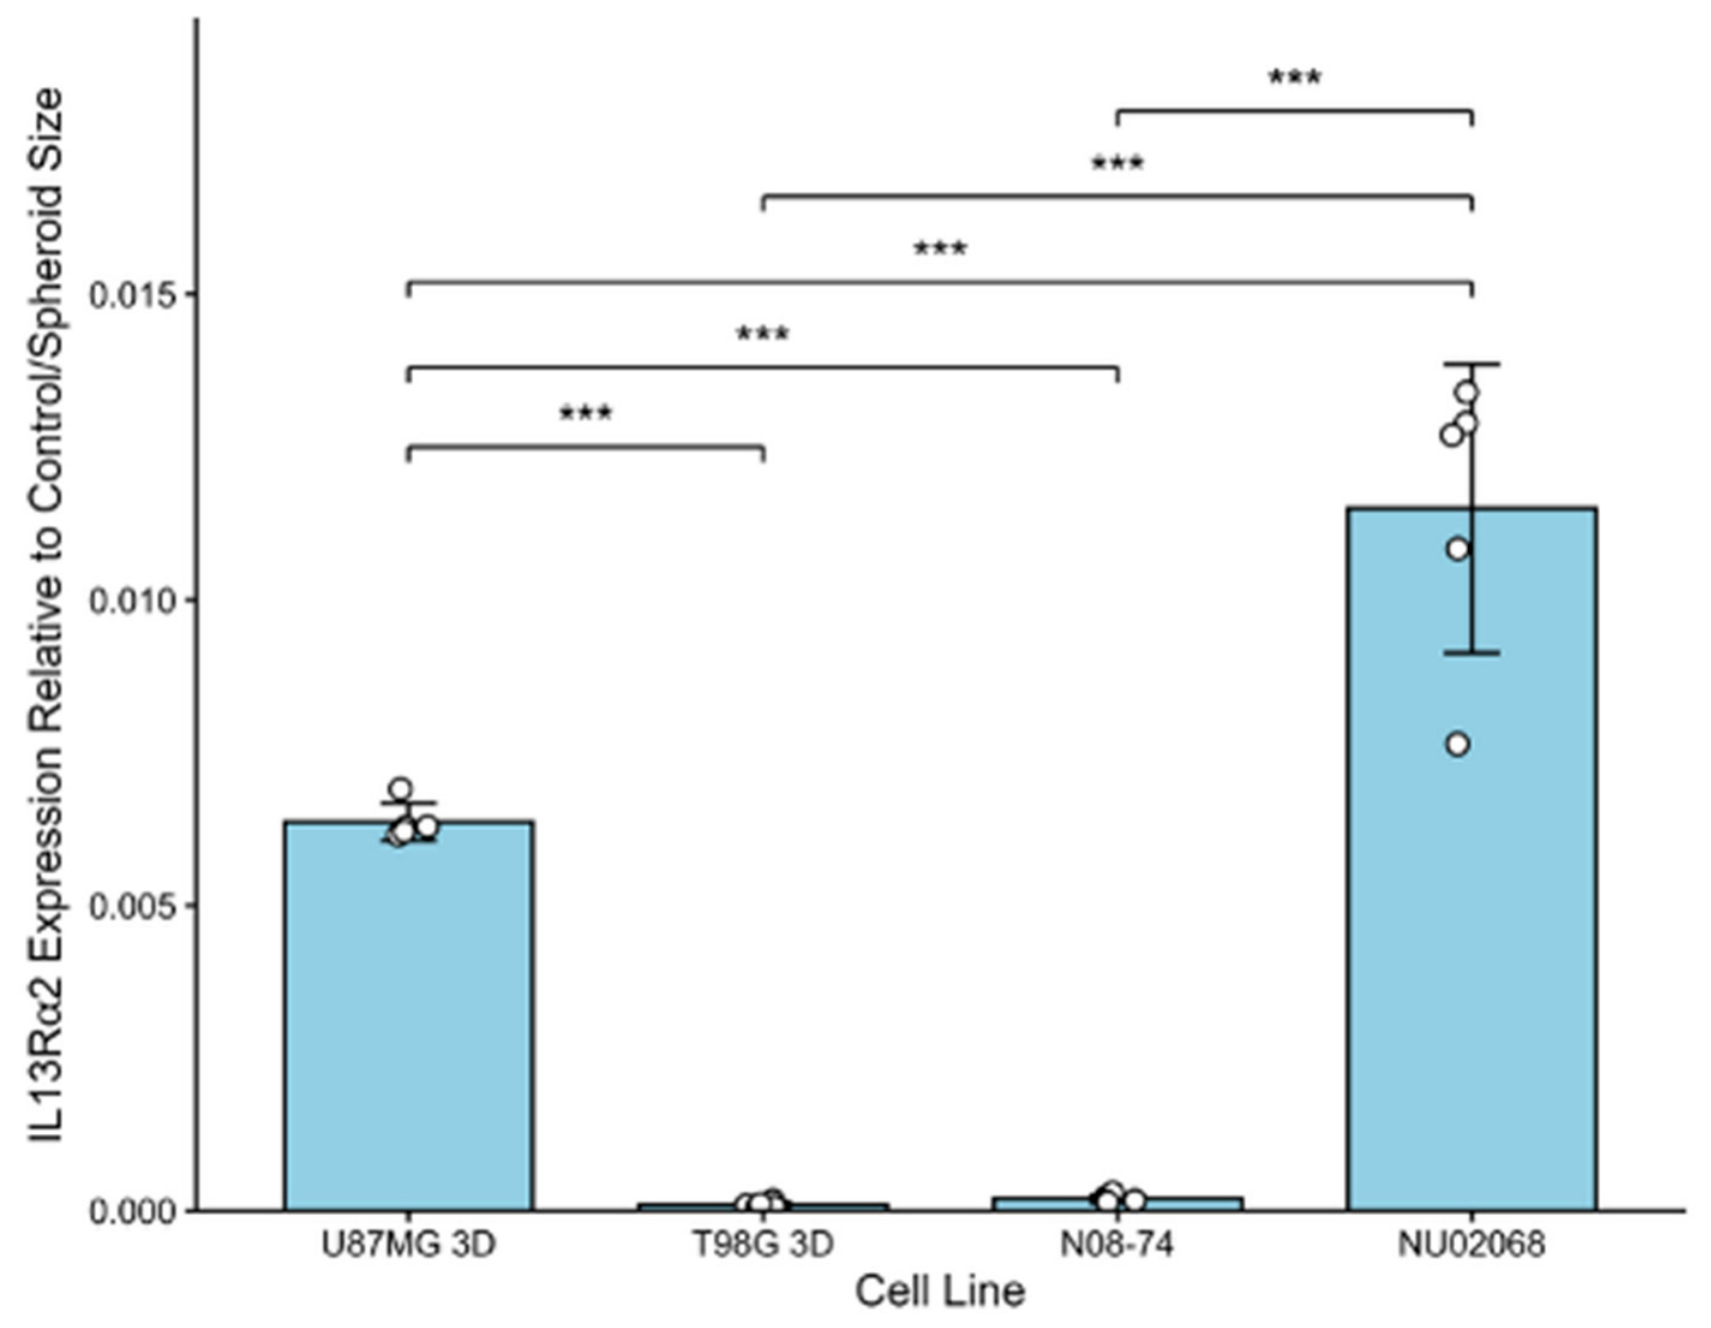
To properly examine the IL13Rα2 mRNA expression difference across spheroid cultures of immortalized cell lines and spheroids forming patient-derived samples, the results used an exploratory diameter-normalized analysis to account for the size variations within each experiment which are illustrated in Figure A4. Spheroid diameter was used as an additional exploratory normalization factor to account for differences in spheroid diameter among cultures, rather than as a direct surrogate for cell number, total protein, or spheroid volume. Because z-stack imaging was not available, spheroid volume could not be reliably determined. However, spheroids generated using the molds did not grow uniformly, resulting in differences in overall diameter that could influence spatial and depth-dependent characteristics of the 3D cultures and therefore remains a limitation of this study. Normalization to average spheroid diameter was therefore included to reduce variability associated with differences in spheroid size and to better account for the distinct spatial environment present in larger versus smaller spheroids. Following the specified normalization, the variable expression of IL13Rα2 mRNA transcripts across various spheroid cell types is displayed in Figure 2. The T98G spheroid model and the patient-derived N08-74 spheroid-forming model are seen to be low expressors of IL13Rα2 (Figure 2), relative to housekeeping control GAPDH. The T98G spheroid model exhibits a size-normalized IL13Rα2 expression value of 0.00010 (±0.00004), while the N08-74 spheroid model has an expression value of 0.00020 (±0.00006). Conversely, the U87MG spheroid model and the patient-derived spheroid-forming NU02068 are seen to be higher expressors of IL13Rα2 relative to T98G and N08-74, with size-normalized IL13Rα2 expression values of 0.0064 (±0.0003) and 0.0115 (±0.0024), respectively. Each of the spheroid groups were seen to be significantly different from one another, exempting the T98G spheroid and N08-74 neurospheres, emphasizing the variable expression of IL13Rα2 across GBM sample types. A table of Tukey HSD pairwise p-values can be seen in Table A4.
Figure 2.
Variable mRNA expression of IL13Rα2 in different spheroid cultures of GBM. T98G 3D and N08-74 spheroid cultures are seen to exhibit lower mRNA expression of IL13Rα2, while U87MG and NU02068 are seen to express higher levels of IL13Rα2, relative to one another. The values were normalized to both total protein concentration and average diameter (size) of the 3D samples. Data are presented as mean ± SD (*** p < 0.001) (n = 5 independent biological replicates).
3.2. Altered Protein Expression Levels of IL13Rα2 Across Culture Models
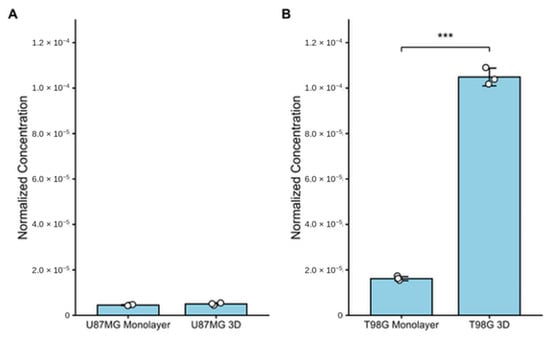
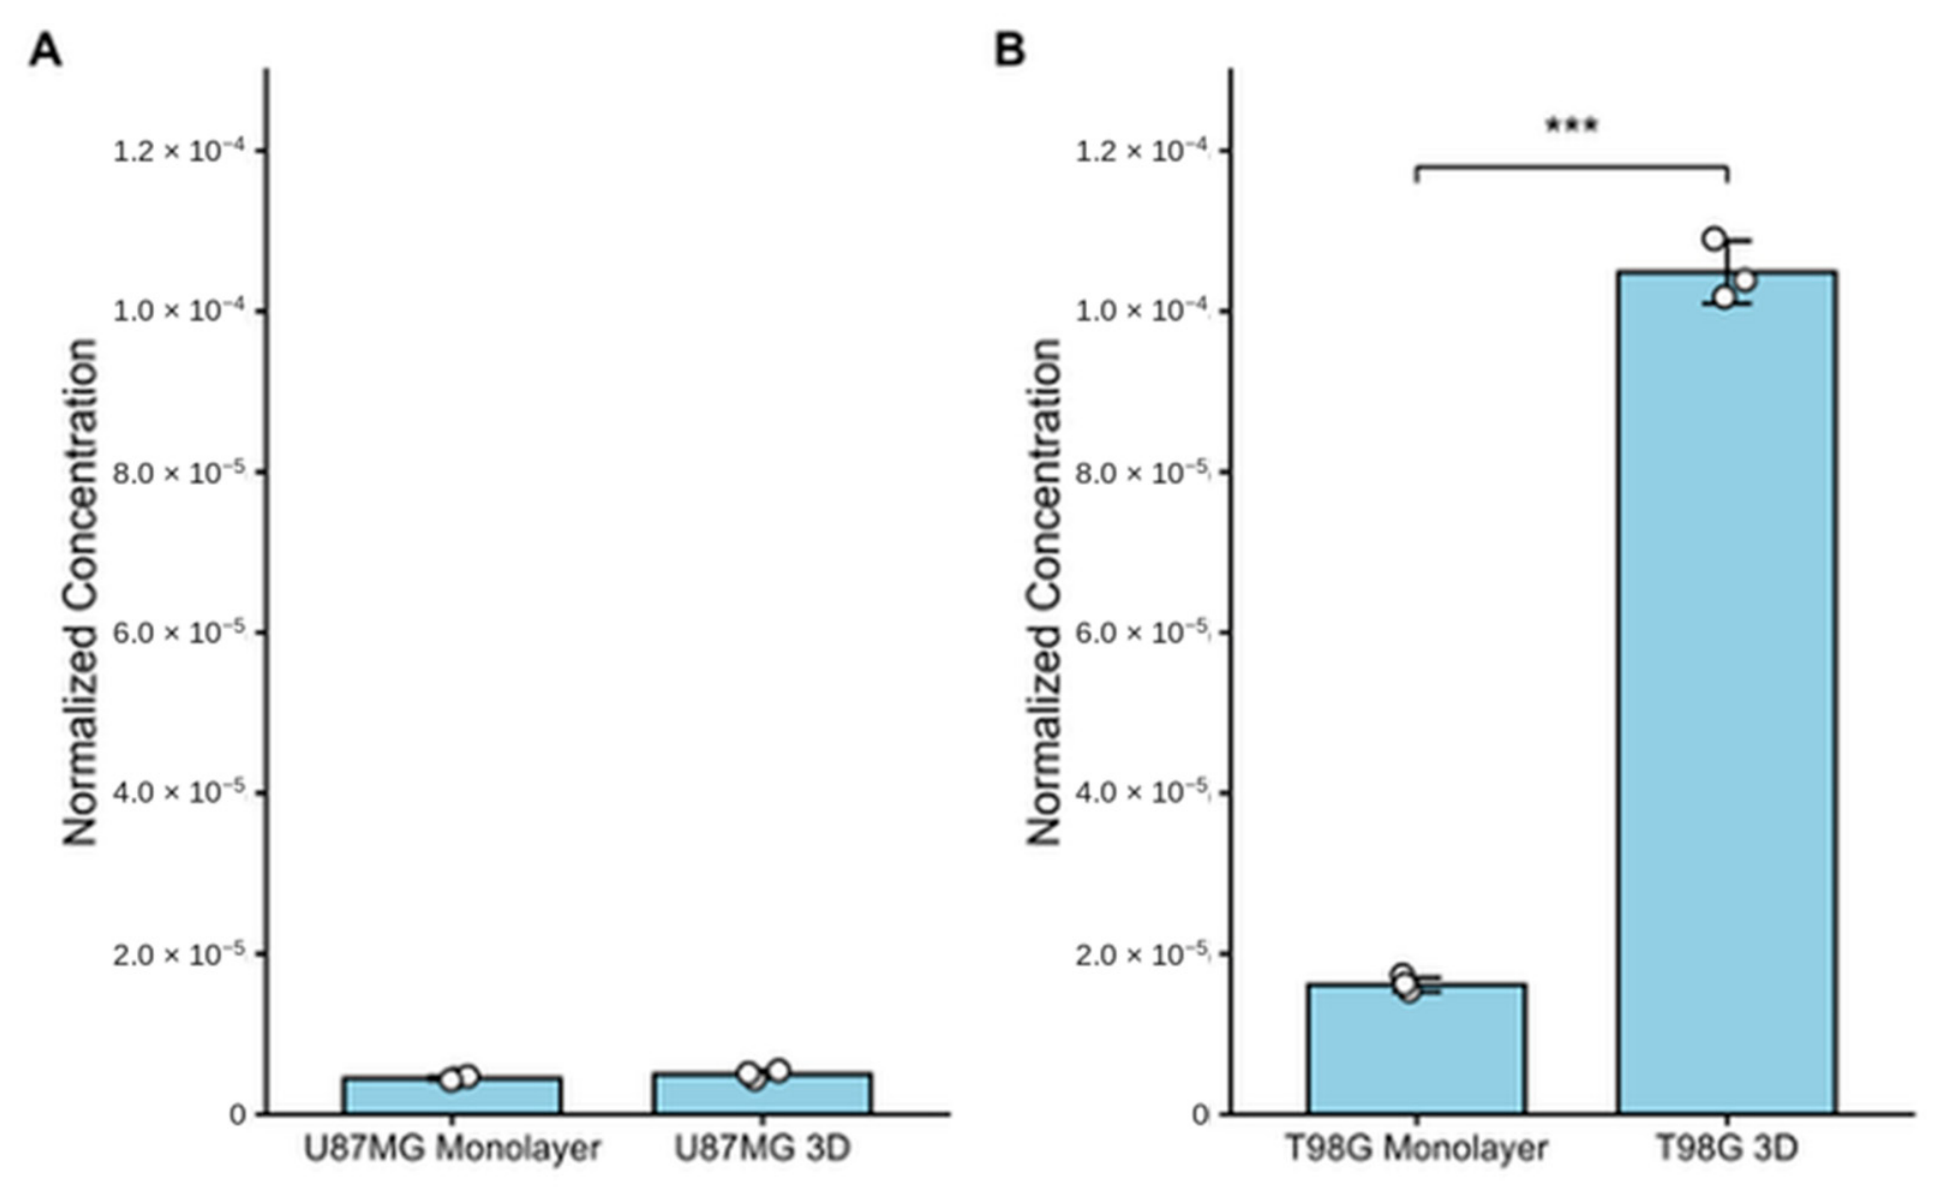
The protein expression of IL13Rα2 was assessed across the same in vitro models as examined for mRNA expression. Concentrations of IL13Rα2 were determined using a four-parameter algorithm standard curve as seen in Figure A5. Figure 3 depicts U87MG cell line exhibiting a substantially lower percentage of IL13Rα2 when compared to the T98G cell line in both monolayer and 3D cultures. The U87MG monolayer exhibited an IL13Rα2 percentage of 4.53 × 10⁻⁶ (±2.40 × 10⁻⁷) while the U87MG spheroid models displayed an IL13Rα2 percentage value of 5.03 × 10⁻⁶ (±5.46 × 10⁻⁷). Ultimately, the U87MG cell line did not exhibit a significant difference in protein expression across 2D to 3D models (p = 0.2535) (Figure 3A). The T98G cell line did exhibit significant differences in IL13Rα2 protein expression between 2D and 3D culture models, at values of 1.62 × 10⁻⁵ (±8.91 × 10⁻⁷) and 1.05 × 10⁻⁴ (±3.93 × 10⁻⁶), respectively (p = 0.0003741) (Figure 3B).
Figure 3.
Comparison of IL13Rα2 content expressed as a percentage between U87MG and T98G cell lines under monolayer and 3D culture conditions. (A) Displays the total percentage of protein that is IL13Rα2 within U87MG two different culture models. (B) Illustrates the total percentage of protein that was made up of IL13Rα2 within T98G cultures. Data were normalized to the total protein concentration within respective culture samples to attain percentage values. Data are presented as mean ± SD (*** p < 0.001) (n = 3 independent biological replicates).
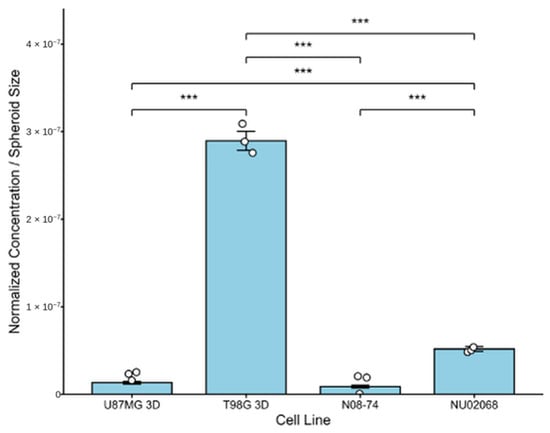
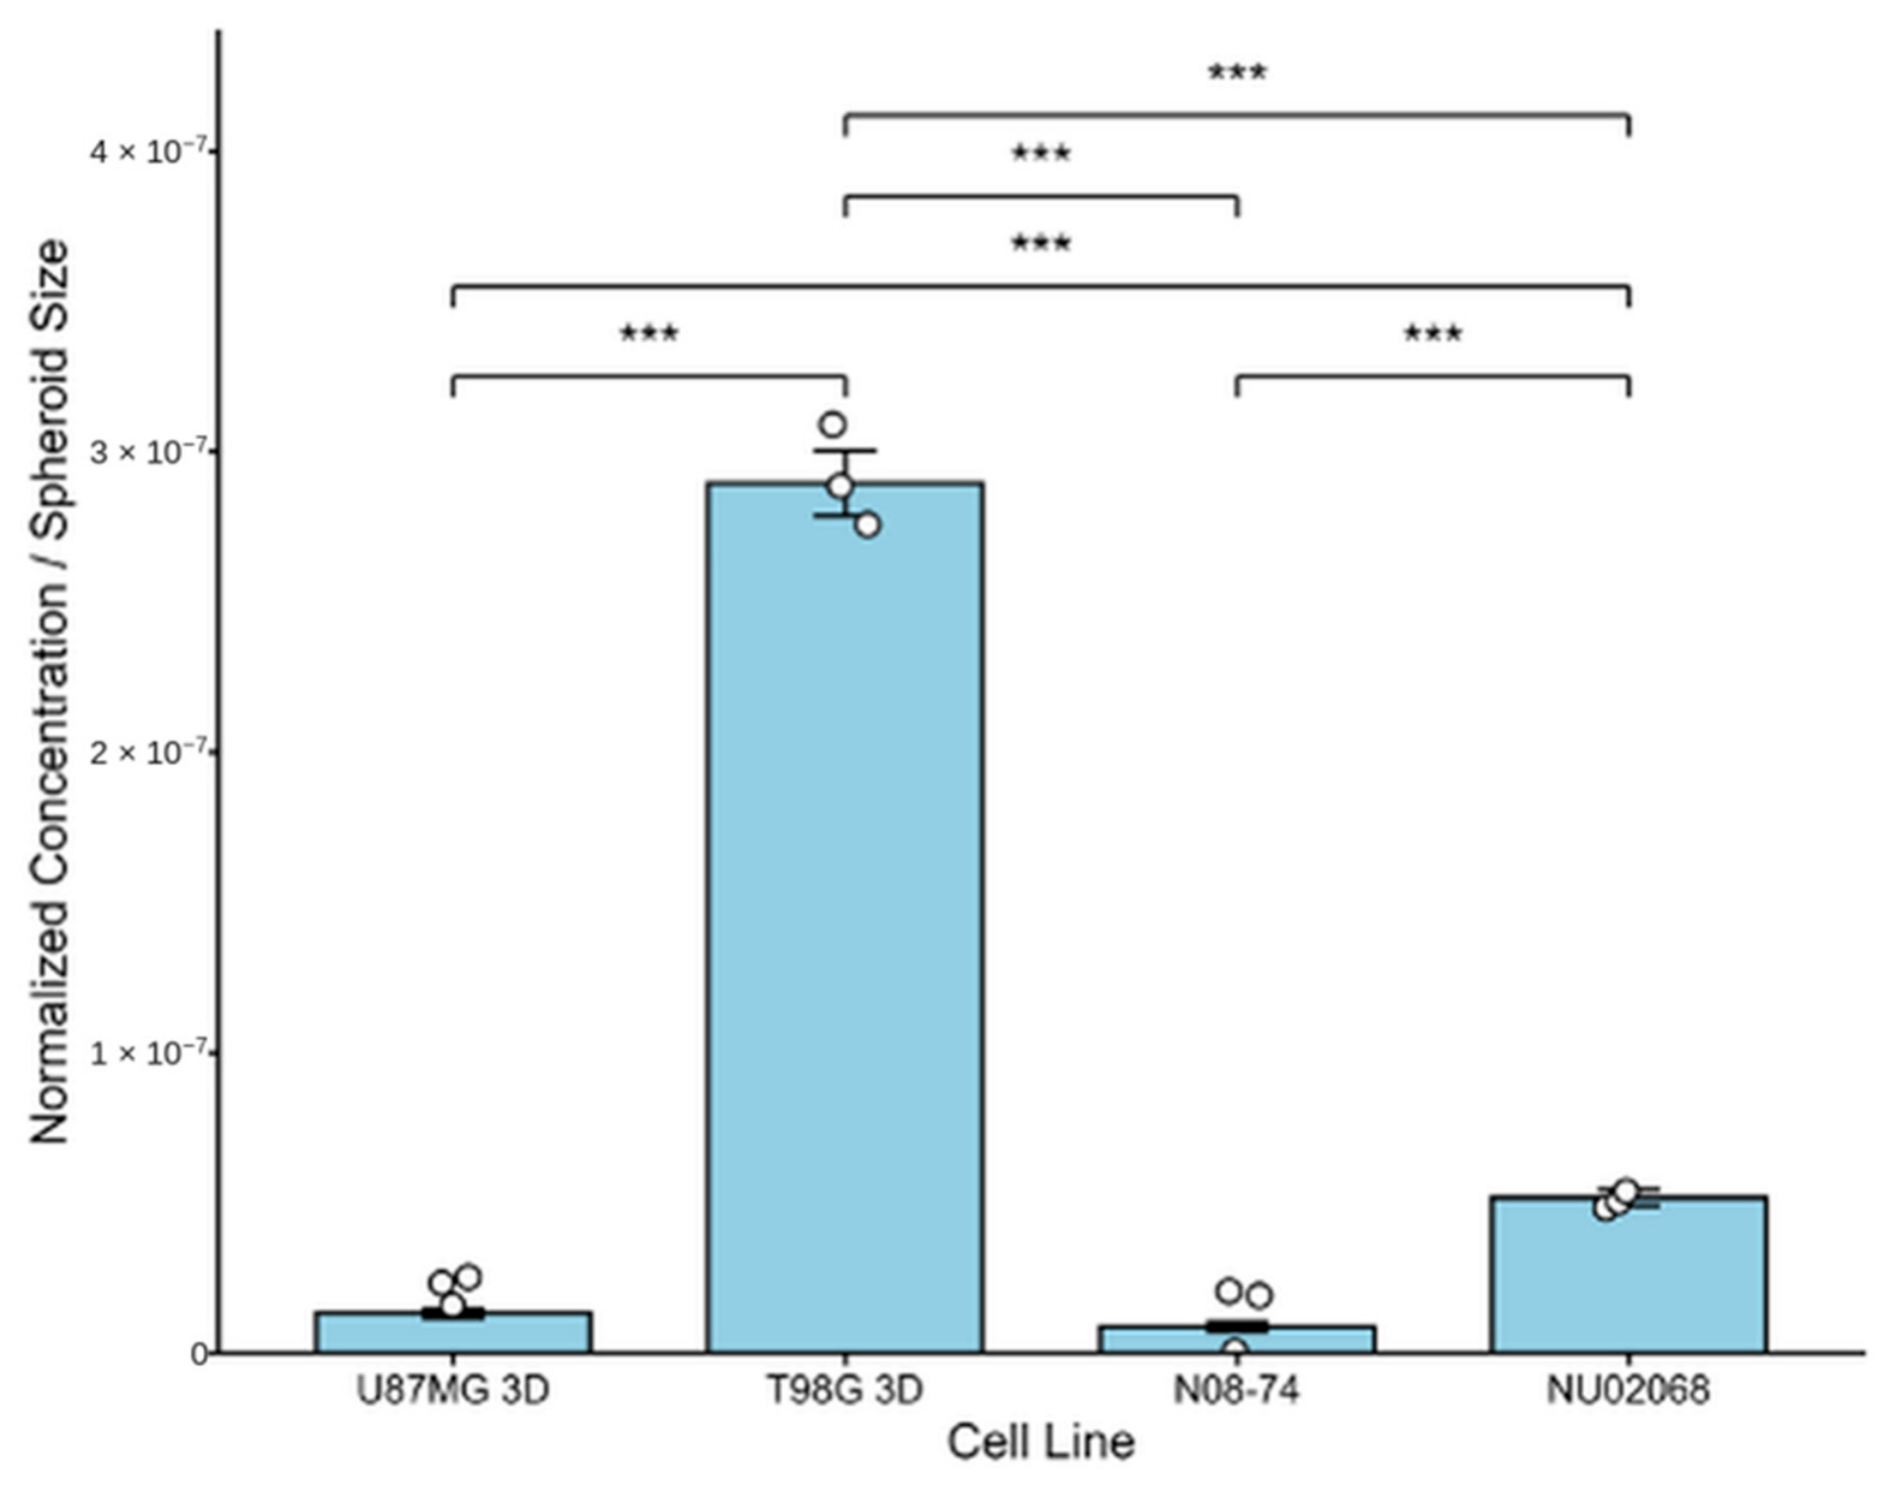
Due to variations in the diameters of spheroids across the cell lines and potential spatially influenced expression pattern, the IL13Rα2 protein expression was diameter-normalized to mitigate potential discrepancies as a result of significant size differences; all raw averages and protein-normalized alone averages are available in Table A3. As shown in Figure 4, IL13Rα2 protein levels were very low, with the highest diameter-normalized ratio identifying approximately 2.89 × 10⁻⁷ (±1.08 × 10⁻⁸) of the total protein as IL13Rα2 within T98G spheroids. The NU02068 cell line exhibited the second highest diameter-normalized at a value of 5.17 × 10⁻⁸ (±2.77 × 10⁻⁹) (Figure 4). Both the U87MG and N08-74 had lower expression of IL13Rα2 protein, relative to the aforementioned spheroid types, with diameter-normalized values of 1.32 × 10⁻⁸ (±1.43 × 10⁻⁹) and 8.73 × 10⁻⁹ (±1.58 × 10⁻⁹), respectively. Each spheroid comparison was seen to exhibit significant differences in expression of IL13Rα2, relative to both the total protein concentration and diameter of the spheroids (Table A4).
Figure 4.
Varied diameter-normalized protein expression levels of IL13Rα2 across different cell lines and models. Data are presented as mean ± SD (*** p < 0.001) (n = 3 independent biological replicates).
3.3. Spatial Distribution of IL13Rα2 mRNA Expression in Patient Glioblastoma Tissue
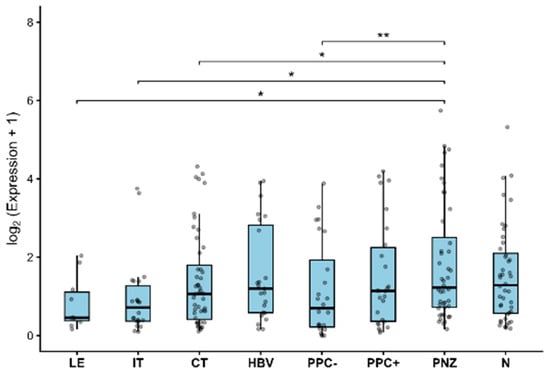
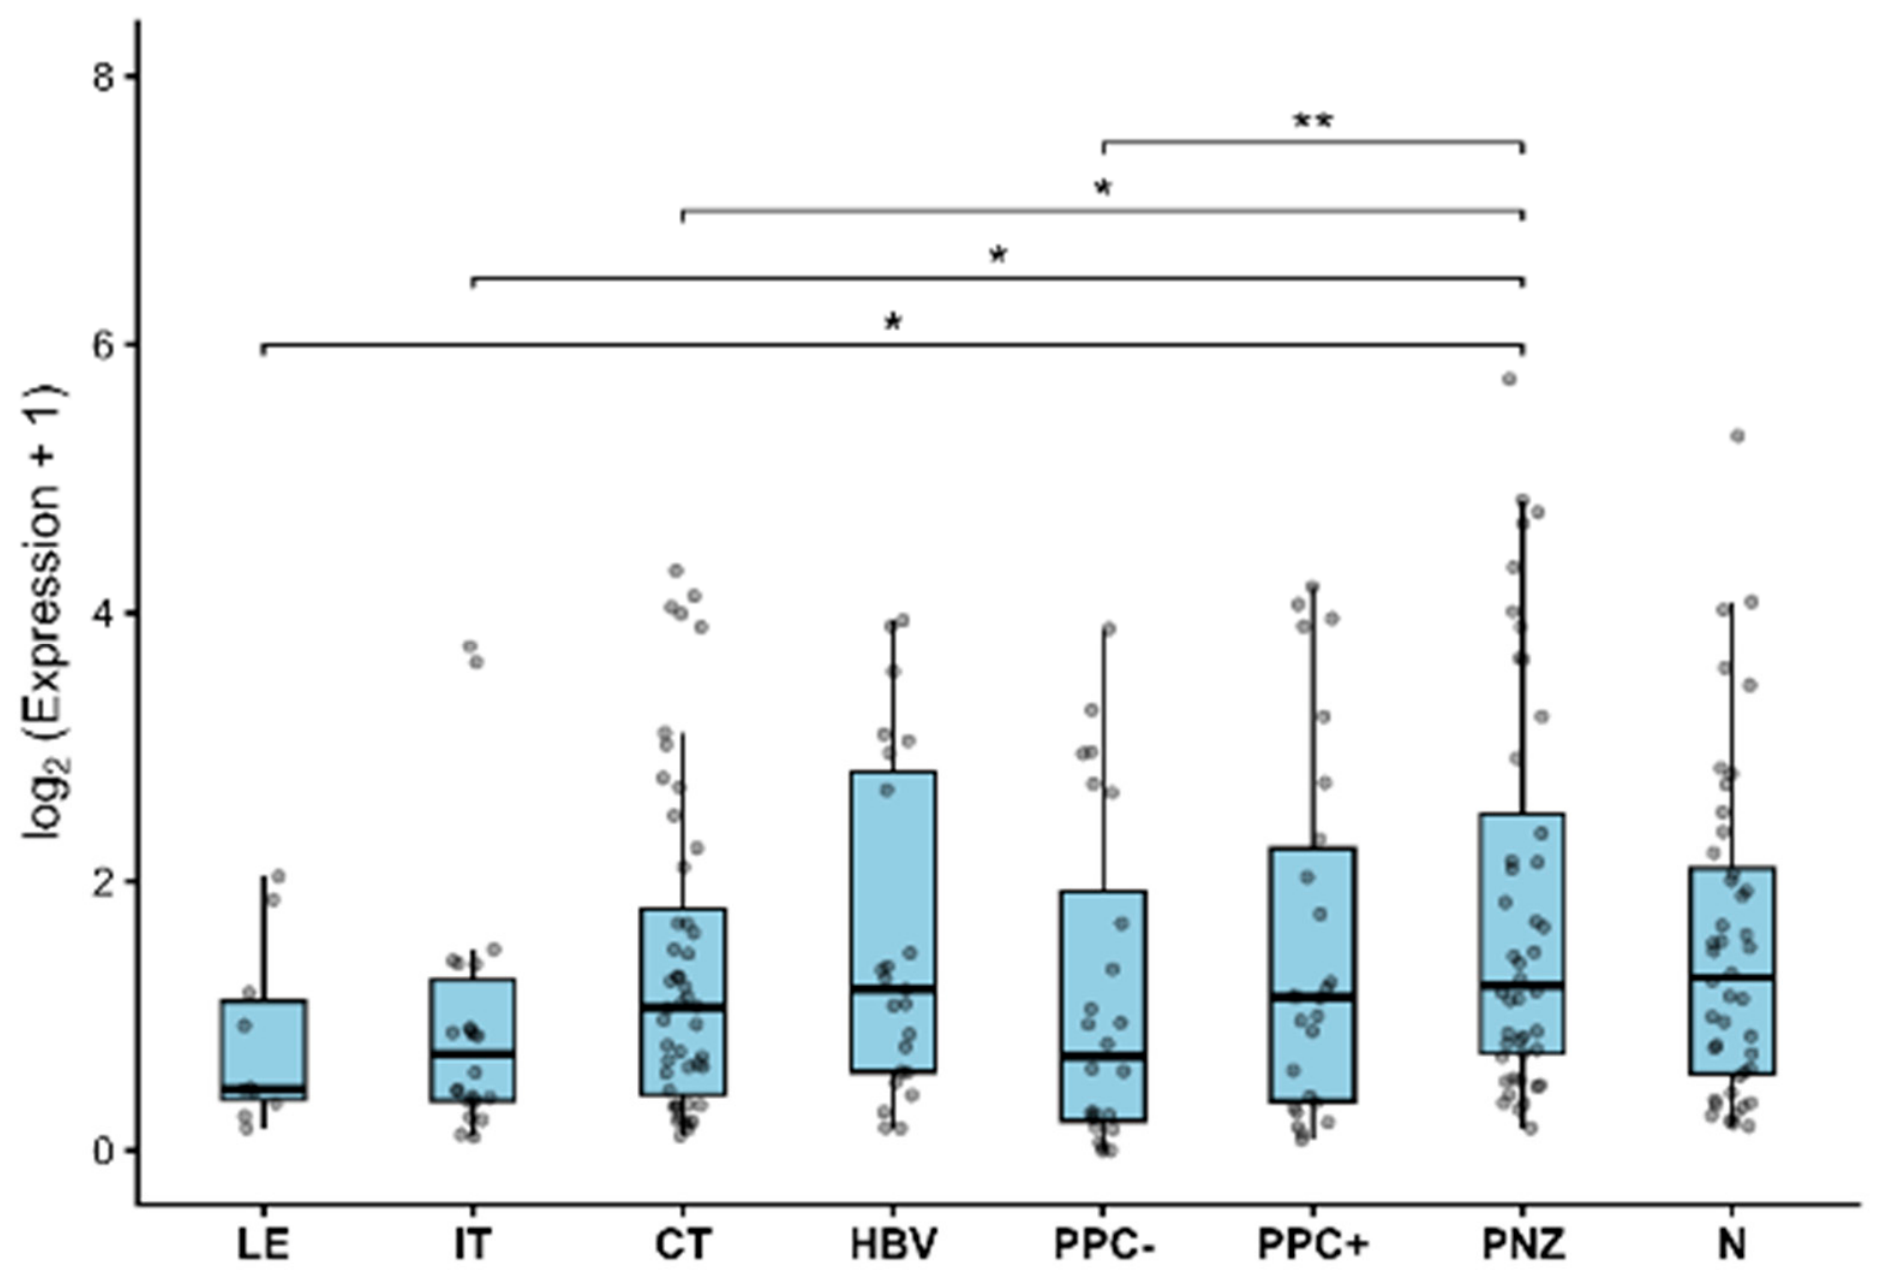
IL13Rα2 expression differed significantly across the eight Ivy GAP spatial tumor compartments (linear mixed-effects model, F(7, 207.5) = 3.10, p = 0.0039) as seen in Figure 5. Planned pairwise comparisons with Holm adjustment for multiple testing showed significantly higher IL13Rα2 expression in the perinecrotic zone compared with the leading edge (p = 0.0203), infiltrating tumor (p = 0.0108), cellular tumor (p = 0.0287), and pseudopalisading cells without visible necrosis (p = 0.0015). IL13Rα2 expression did not differ significantly between the perinecrotic zone and necrosis (p = 0.0889).
Figure 5.
Spatial distribution of IL13Rα2 expression across Ivy GAP glioblastoma regions. Boxplots show log2-transformed IL13Rα2 expression across spatial tumor compartments, with individual specimens overlaid as points. Sample sizes were LE, n = 10; IT, n = 22; CT, n = 48; HBV, n = 23; PPC−, n = 24; PPC+, n = 26; PNZ, n = 44; and N, n = 44. Data are presented as mean ± SD (** p < 0.01; * p < 0.05). Abbreviations: LE, leading edge; IT, infiltrating tumor; CT, cellular tumor; HBV, hyperplastic blood vessels in cellular tumor; PPC−, pseudopalisading cells without visible necrosis; PPC+, pseudopalisading cells surrounding necrosis; PNZ, perinecrotic zone; N, necrosis.
4. Discussion
Given the growing interest in IL13Rα2 as a therapeutic target, understanding how its expression varies across preclinical models is important for interpreting experimental findings. In the present study, IL13Rα2 expression demonstrated substantial variability at both the mRNA and protein levels across commercial GBM cell lines and patient-derived models. This variability suggests that IL13Rα2 expression differs among commonly used GBM model systems and may warrant consideration in future studies of IL13Rα2-targeted therapies.
At the transcript level, several findings were consistent with previous reports. U87MG cells exhibited higher IL13Rα2 mRNA expression than T98G cells across both monolayer and 3D culture, consistent with previous reports [38,39]. Among all models examined, the patient-derived neurosphere NU02068 demonstrated the highest mRNA expression, approximately 80% greater than those observed in U87MG spheroids. In contrast to the mRNA findings, IL13Rα2 protein expression was greatest in T98G cells under both monolayer and spheroid conditions. This pattern differs from previous reports and deserves further investigation [11,38,40]. Although the mechanism underlying this discrepancy remains unclear, several explanations are possible. T98G cells are known to exhibit genetic instability, which may contribute to variable receptor expression across laboratories [39,41]. Alternatively, differences in post-transcriptional regulation, receptor turnover, or antibody cross-reactivity may account for the discordance between mRNA and protein expression. Consequently, additional studies are warranted to better characterize IL13Rα2 protein expression in T98G cells and determine whether this cell line provides a reliable model for evaluating IL13Rα2- targeted therapies.
Beyond differences between established cell lines, substantial variability in IL13Rα2 protein expression was also observed among U87MG spheroids and patient-derived neurospheres. This finding further illustrates the biological heterogeneity of GBM and suggests that IL13Rα2 expression may differ considerably even among 3D models intended to more closely recapitulate the native tumor microenvironment. A similar pattern of heterogeneity was observed in the spatial transcriptomic analysis, where IL13Rα2 expression differed significantly across distinct tumor compartments. Notably, expression was greatest within the perinecrotic zone and significantly exceeded that observed in the leading edge, infiltrating tumor, and cellular regions. Together these findings suggest that IL13Rα2 expression is influenced by both the biological characteristics of the model system and the local tumor microenvironment, emphasizing the importance of considering regional tumor context when evaluating IL13Rα2- targeting. Several limitations should be considered when interpreting these findings. First, only a limited number of established GBM cell lines and patient-derived neurospheres were evaluated, and additional models will be necessary to determine the generalizability of these observations. Furthermore, the spatial analysis was based on publicly available transcriptomic data and therefore does not directly assess regional IL13Rα2 protein expression or establish increased expression by individual tumor cells, as regional RNA-seq measurements may also be influenced by differences in cellular composition. Future studies should investigate IL13Rα2 localization within patient-derived tumor models and clinical specimens while evaluating how regional and model-dependent differences in expression influence responses to IL13Rα2-targeted therapies. Together, these findings demonstrate that IL13Rα2 expression is influenced by both biological model and tumor microenvironment, emphasizing the importance of incorporating physiologically relevant preclinical models and regional tumor context into the development and evaluation of IL13Rα2-directed therapies.
Author Contributions
Conceptualization, C.A.C. and J.E.P.; methodology, C.A.C., J.E.A. and J.E.P.; validation, C.A.C., T.J., J.E.A. and J.E.P.; formal analysis, C.A.C., M.D.N., T.J., J.E.A. and J.E.P.; investigation, C.A.C., M.D.N., T.J. and J.E.A.; resources, J.E.P.; data curation, C.A.C.; writing—original draft preparation, C.A.C., M.D.N., T.J., J.E.A. and J.E.P.; writing—review and editing, C.A.C., M.D.N., T.J., J.E.A. and J.E.P.; visualization, C.A.C., M.D.N., T.J., J.E.A. and J.E.P.; supervision, J.E.P.; project administration, J.E.P.; funding acquisition, J.E.P. All authors have read and agreed to the published version of the manuscript.
Funding
This research was funded by National Institutes of Health, grant number R16GM154694.
Institutional Review Board Statement
Not applicable.
Informed Consent Statement
Not applicable.
Data Availability Statement
Bioinformatics data is publicly available through Ivy Gap (https://glioblastoma.alleninstitute.org, accessed 25 June 2026) and GlioVis (https://gliovis.bioinfo.cnio.es, accessed 25 June 2026). The original contributions presented in this study are included in the article. Further inquiries can be directed to the corresponding author.
Acknowledgments
The graphical abstract was created with BioRender (https://www.biorender.com/, accessed 28 July 2026). The authors gratefully acknowledge the administrative staff from the Department of Chemistry and Physics for their support throughout this work. The authors also thank their collaborator, Kaitlin M. Dailey for her contribution, guidance, and technical expertise, as well as all current and former students of the Pullan Laboratory whose efforts supported the development and completion of this study. The authors are also very grateful for the donation of the neurospheres by the Daniel Brat lab at Northwestern Feinberg School of Medicine and the donors for providing the samples. During the preparation of this manuscript, the authors used ChatGPT (OpenAI, GPT-5.6) to assist with language refinement and editing. The authors reviewed and edited the output and take full responsibility for the content of this publication.
Conflicts of Interest
The authors declare no conflicts of interest.
Abbreviations
The following abbreviations are used in this manuscript:
| GBM | Glioblastoma Multiforme |
| ATCC | American Type Culture Collection |
| ELISA | Enzyme-Linked Immunosorbent Assay |
| LE | Leading Edge |
| IT | Infiltrating Tumor |
| CT | Cellular Tumor |
| HBV | Hyperplastic blood vessels in the cellular tumor |
| PPC− | Pseudopalisading cells without visible necrosis |
| PPC+ | Pseudopalisading cells with necrosis |
| PNZ | Perinecrotic Zone |
| N | Necrosis |
| RT-PCR | Reverse Transcription PCR |
| SD | Standard Deviation |
Appendix A
Table A1.
Table of materials, reagents, and instruments.
Figure A1.
Cell images illustrating the variable sizes of the different spheroid models. (A) NU02068 neurosphere, (B) N08-74 neurosphere, (C) T98G spheroid, (D) U87MG spheroid.
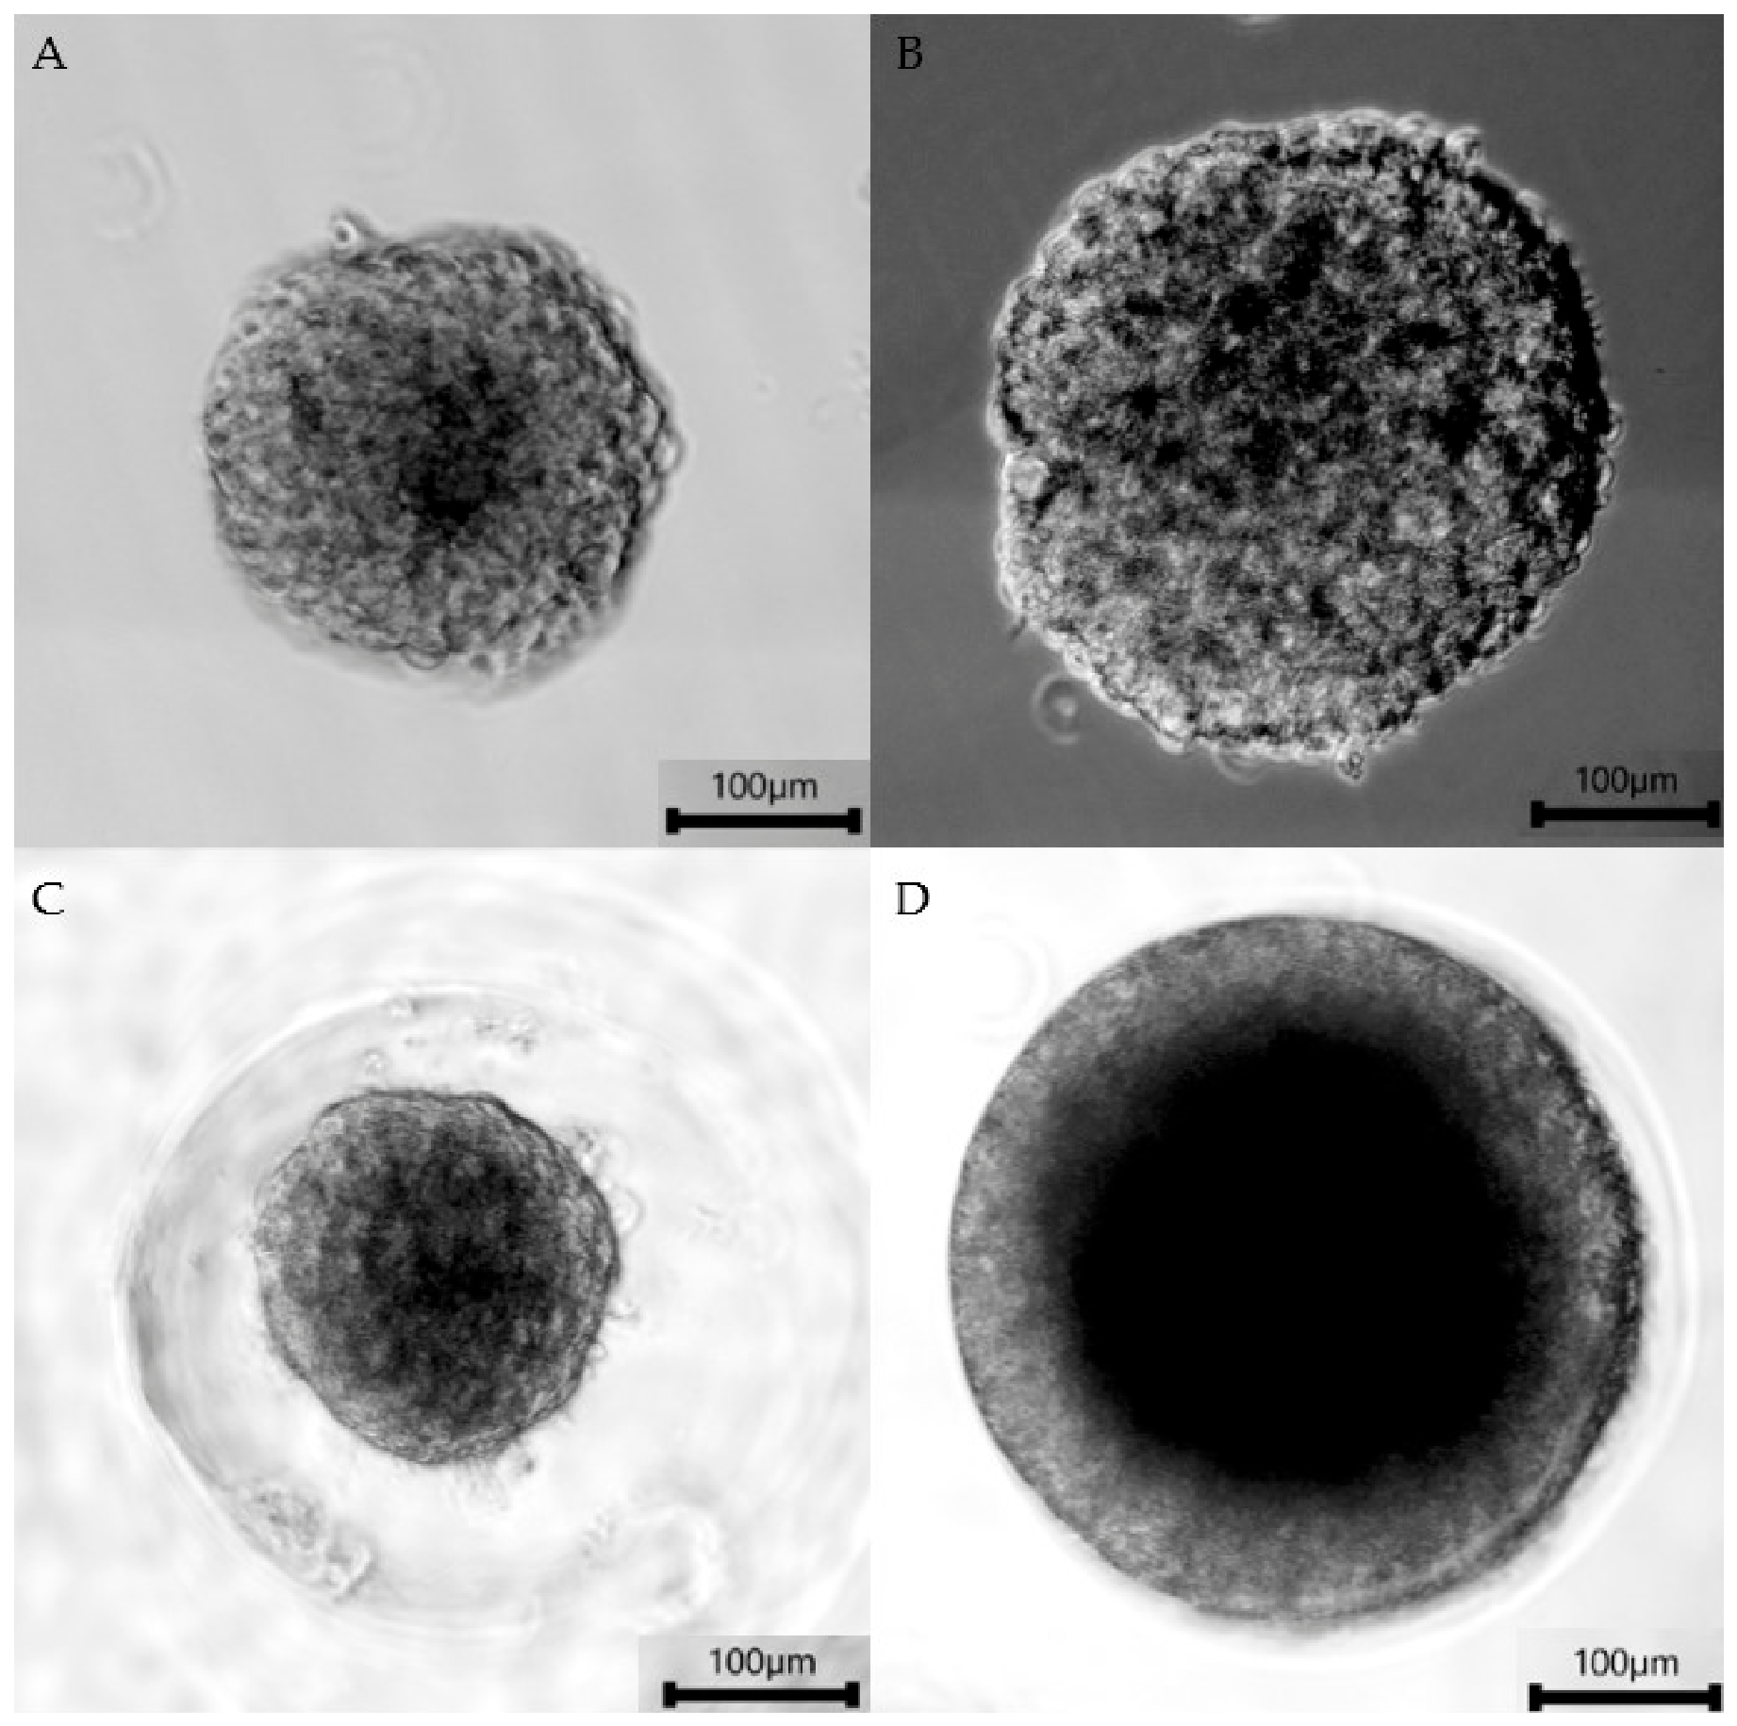
Figure A2.
Agarose gels analyzed with Fiji ImageJ software (version 2.16.0/1.54p). (A) U87MG monolayer comparison between GAPDH and IL13Rα2 mRNA expression with controls. (B) T98G monolayer comparison between GAPDH and IL13Rα2 mRNA expression with controls.
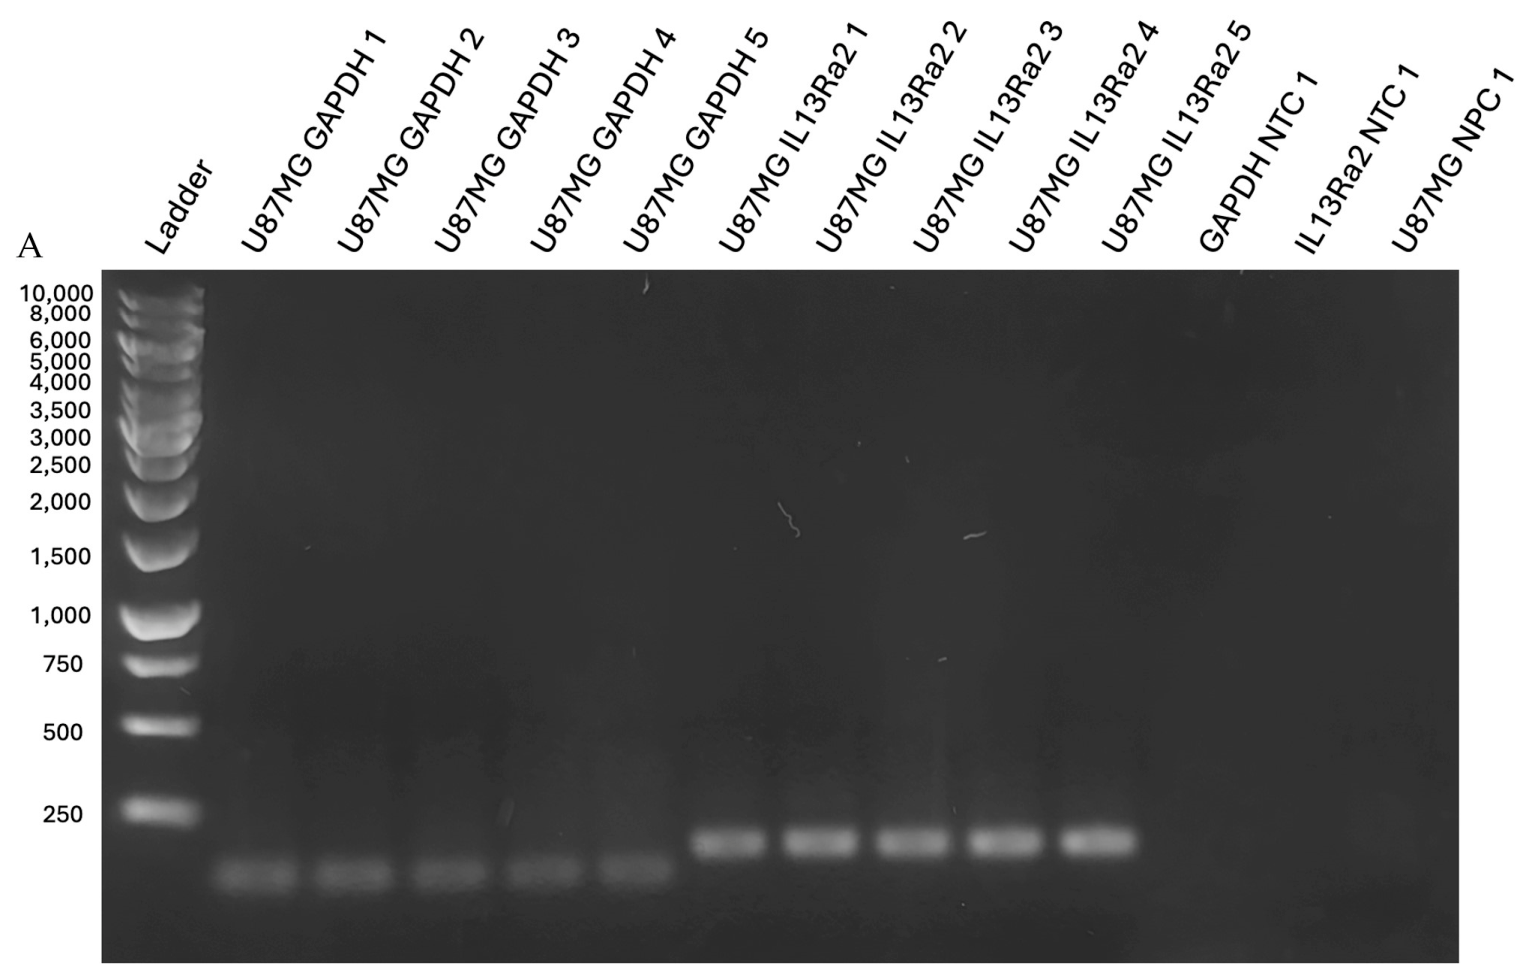
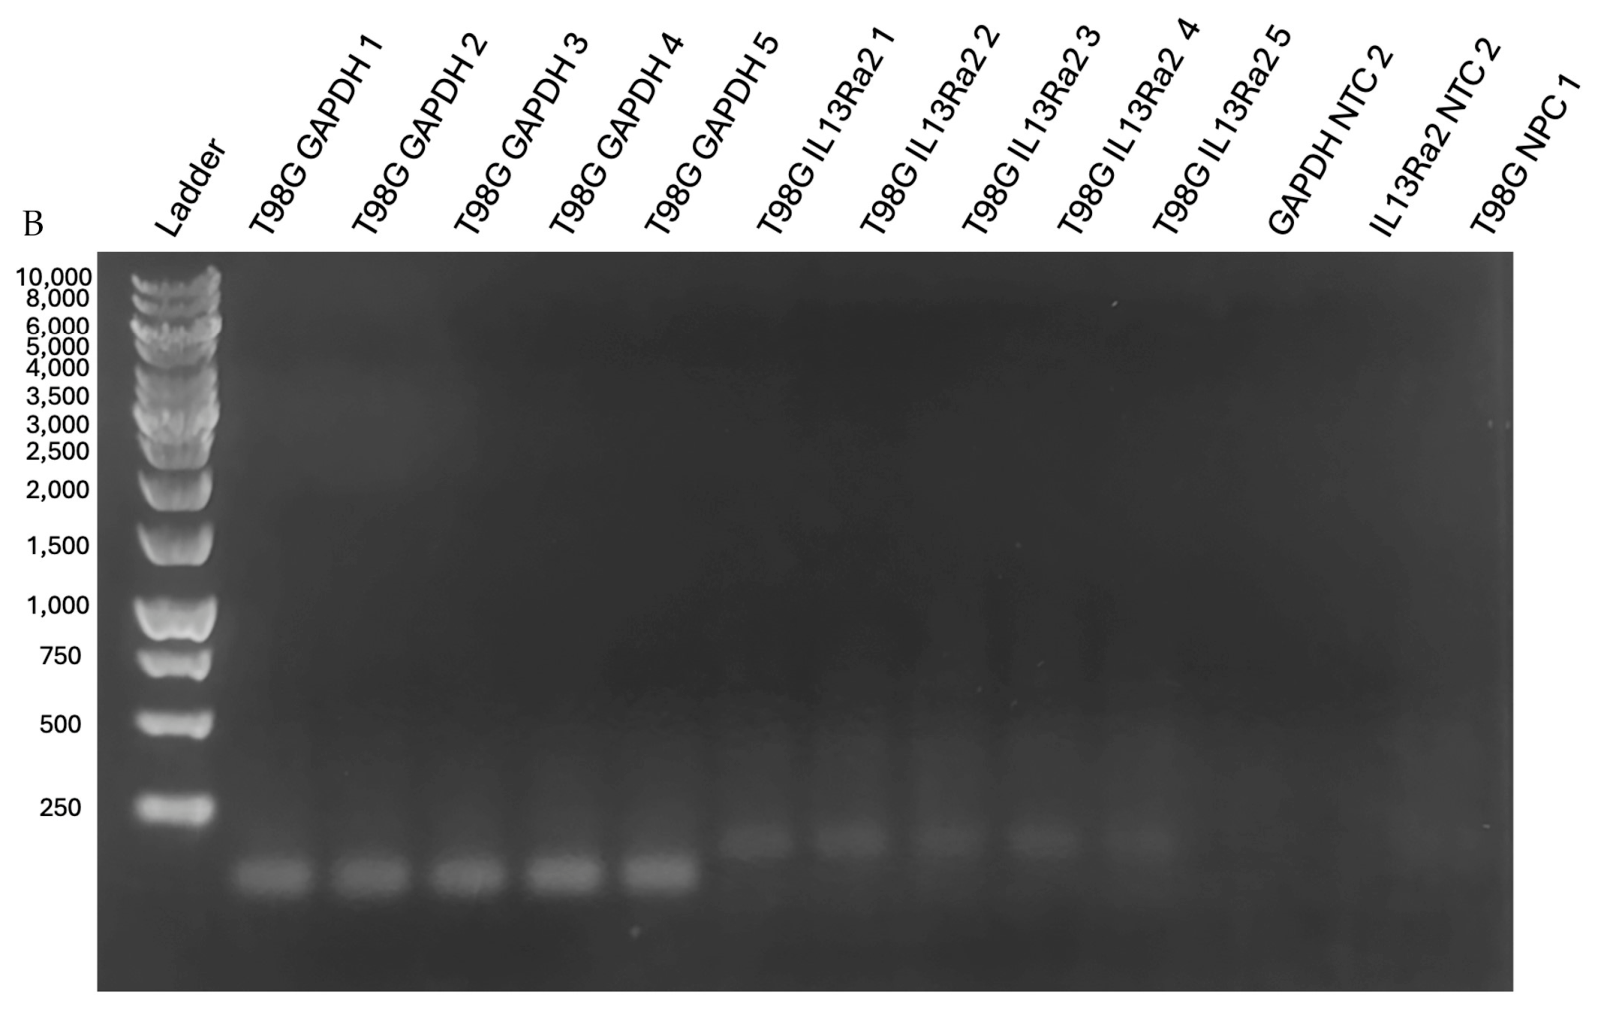
Figure A3.
Agarose gels analyzed with Fiji ImageJ software (version 2.16.0/1.54p). (A) U87MG spheroid culture comparison between GAPDH and IL13Rα2 mRNA expression. (B) Relevant controls for U87MG spheroid culture. (C) T98G spheroid culture comparison between GAPDH and IL13Rα2 mRNA expression. (D) Relevant controls for T98G spheroid culture.
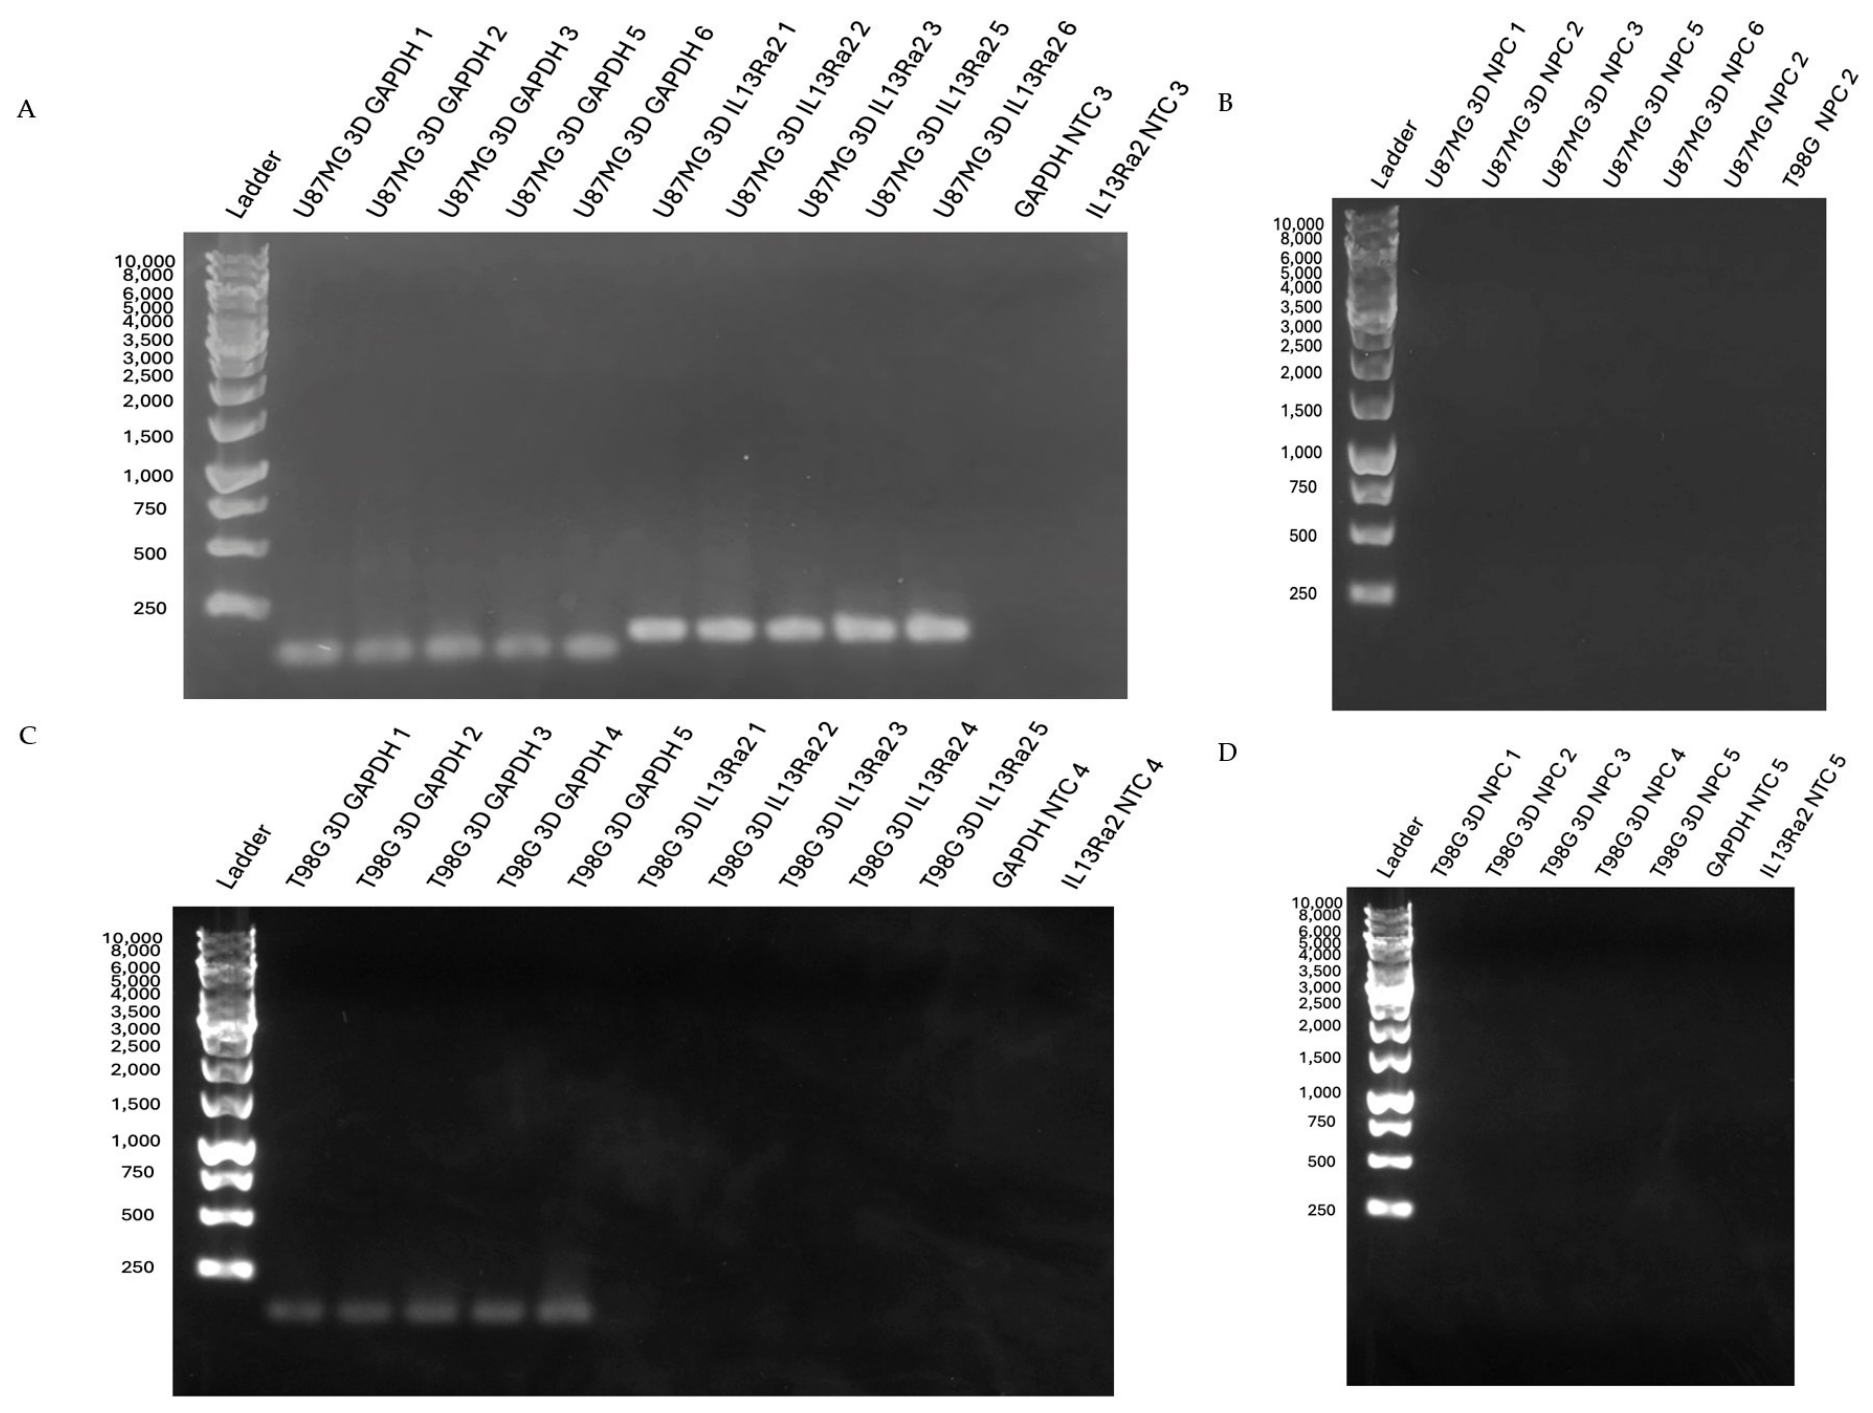
Figure A4.
Agarose gels analyzed with Fiji ImageJ software (version 2.16.0/1.54p). (A) N08-74 patient-derived cell line neurosphere culture comparison between GAPDH and IL13Rα2 mRNA expression with controls. (B) Controls for NO8-74. (C) NU02086 patient-derived cell line neurosphere culture comparison between GAPDH and IL13Rα2 mRNA expression with controls.
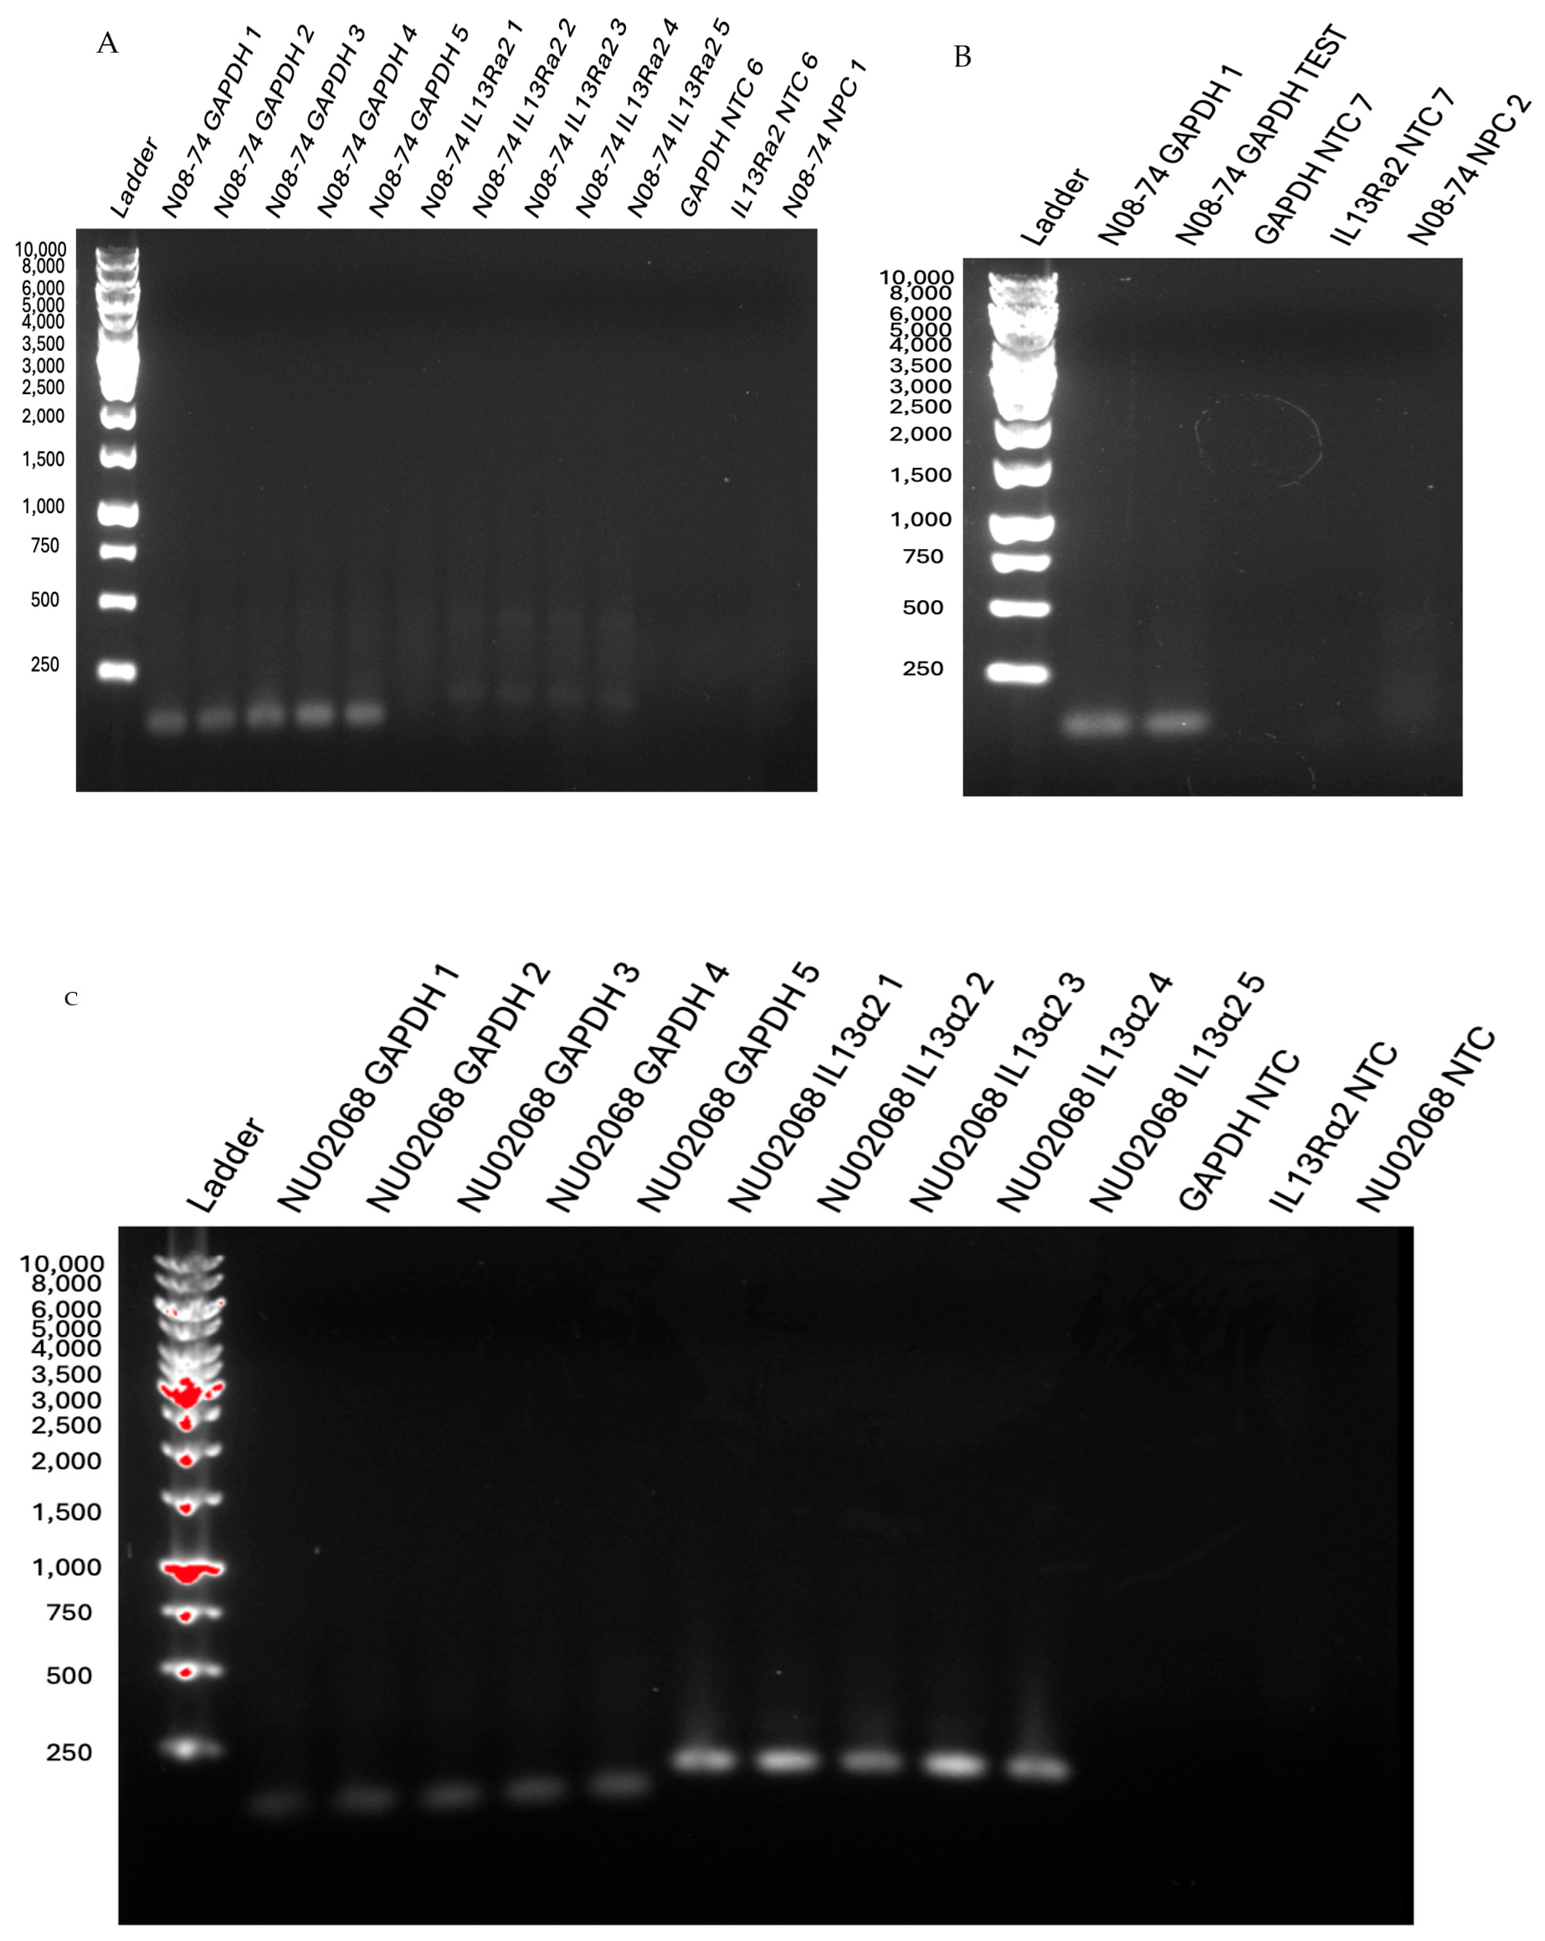
Table A2.
Data collected within the mRNA IL13Rα2 expression arm of the study. Average band intensities for mRNA markers and associated standard deviations are seen, along with the average spheroid sizes and standard deviations, where applicable.
Figure A5.
Standard curve of the IL13Rα2 ELISA. The line was created using a four-parameter algorithm. The absorbance was determined at 450 nm compared to the IL13Rα2 standard concentrations in ng/mL.
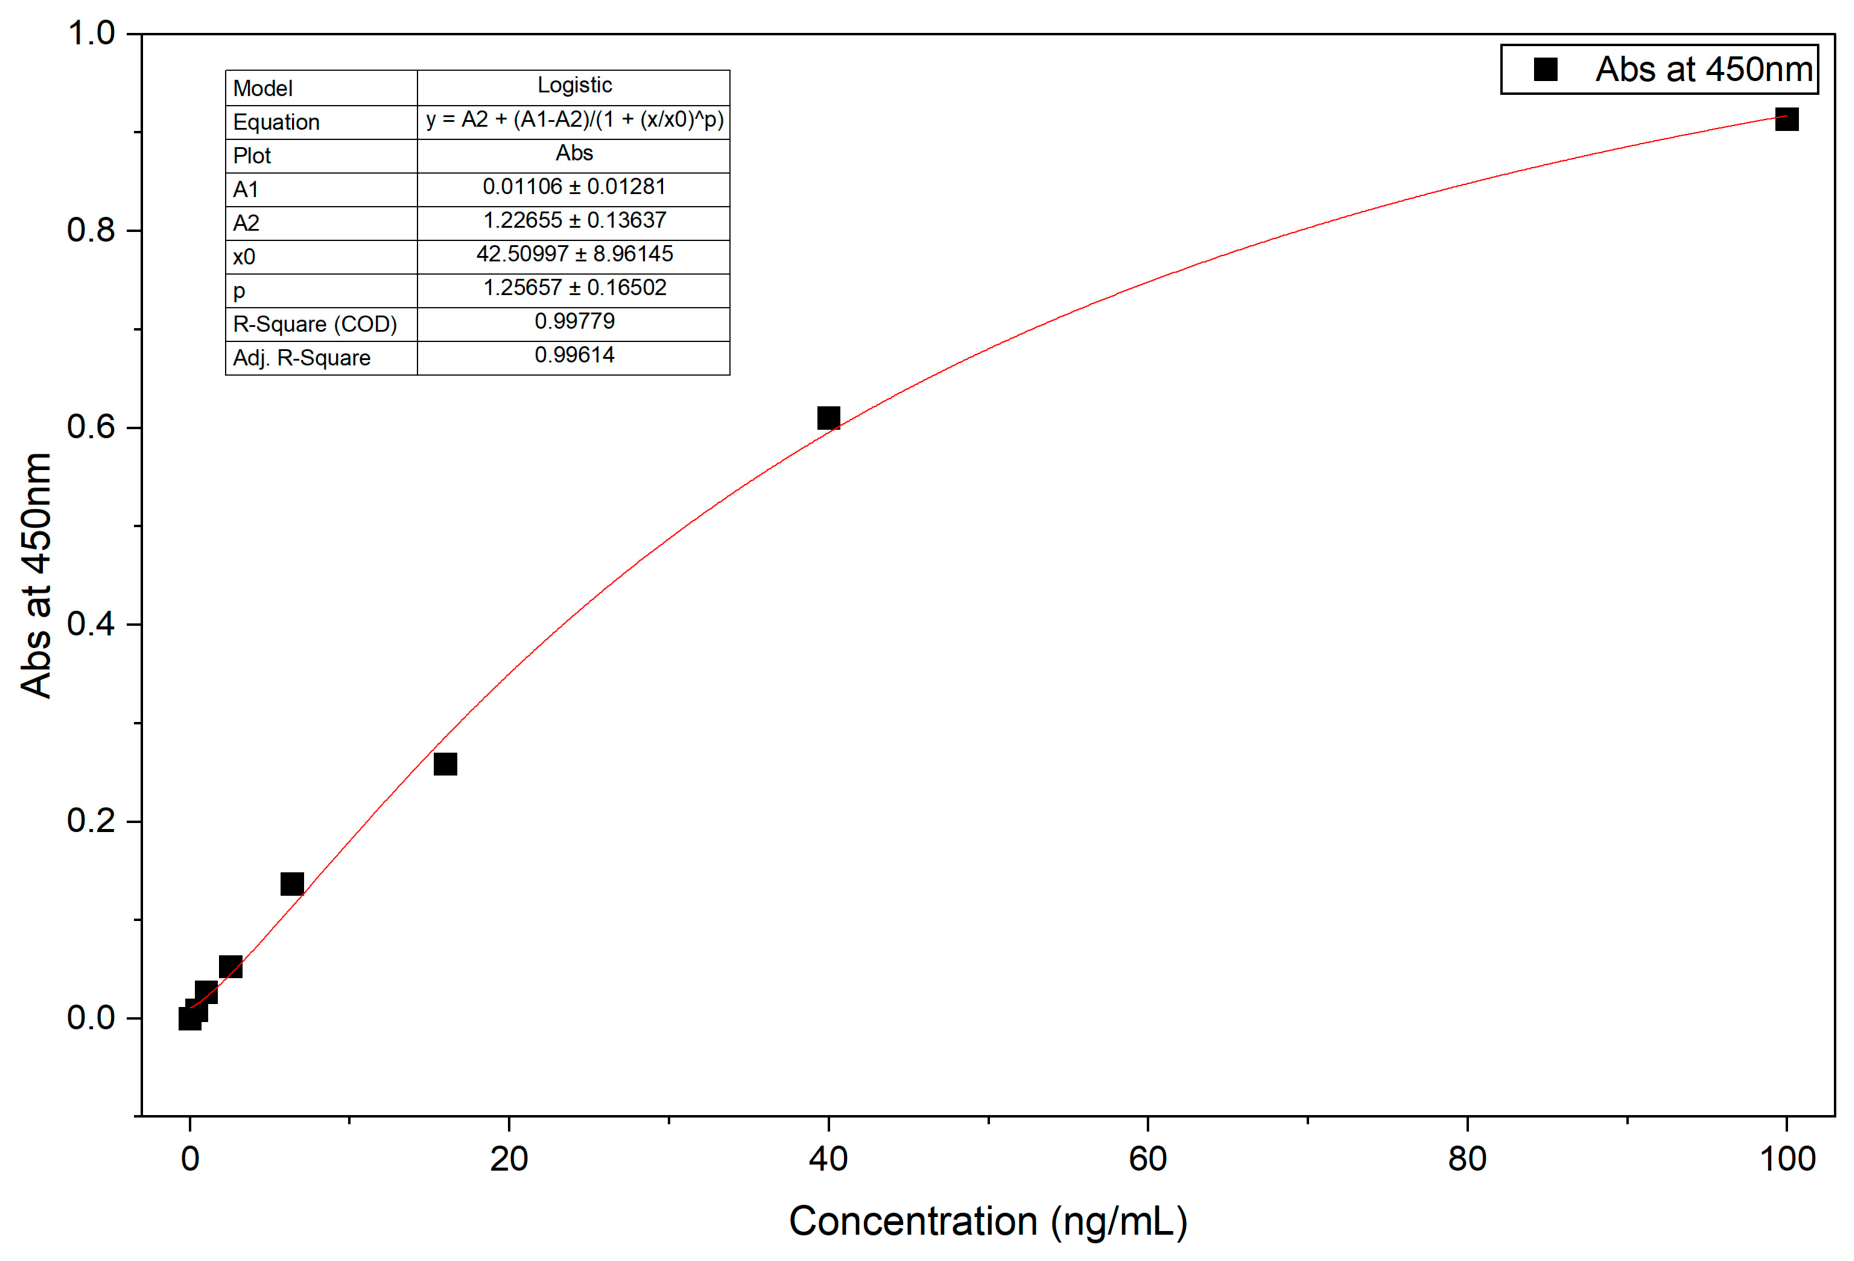
Table A3.
Data collected within the IL13Rα2 protein expression experiment. Average IL13Rα2 protein concentrations, as well as total protein concentrations are given for each cell type. Average spheroid diameters and associated standard deviations are displayed as well.
Table A4.
A table of p-values for each of the comparisons made, yielded from Welch’s t-test and Tukey’s HSD post hoc analyses.
References
- Weller, M.; Wen, P.Y.; Chang, S.M.; Dirven, L.; Lim, M.; Monje, M.; Reifenberger, G. Glioma. Nat. Rev. Dis. Primers 2024, 10, 33. [Google Scholar] [CrossRef] [Scilit]
- Cantrell, J.N.; Waddle, M.R.; Rotman, M.; Peterson, J.L.; Ruiz-Garcia, H.; Heckman, M.G.; Quiñones-Hinojosa, A.; Rosenfeld, S.S.; Brown, P.D.; Trifiletti, D.M. Progress Toward Long-Term Survivors of Glioblastoma. Mayo Clin. Proc. 2019, 94, 1278–1286. [Google Scholar] [CrossRef] [Scilit]
- Rodríguez-Camacho, A.; Flores-Vázquez, J.G.; Moscardini-Martelli, J.; Torres-Ríos, J.A.; Olmos-Guzmán, A.; Ortiz-Arce, C.S.; Cid-Sánchez, D.R.; Pérez, S.R.; Macías-González, M.D.S.; Hernández-Sánchez, L.C.; et al. Glioblastoma Treatment: State-of-the-Art and Future Perspectives. Int. J. Mol. Sci. 2022, 23, 7207. [Google Scholar] [CrossRef] [Scilit]
- Knudson, K.M.; Hwang, S.; McCann, M.S.; Joshi, B.H.; Husain, S.R.; Puri, R.K. Recent Advances in IL-13Rα2-Directed Cancer Immunotherapy. Front. Immunol. 2022, 13, 878365. [Google Scholar] [CrossRef] [Scilit]
- Neftel, C.; Laffy, J.; Filbin, M.G.; Hara, T.; Shore, M.E.; Rahme, G.J.; Richman, A.R.; Silverbush, D.; Shaw, M.L.; Hebert, C.M.; et al. An Integrative Model of Cellular States, Plasticity, and Genetics for Glioblastoma. Cell 2019, 178, 835–849.e21. [Google Scholar] [CrossRef] [Scilit]
- Lv, X.; Wang, B.; Liu, K.; Li, M.J.; Yi, X.; Wu, X. Decoding Heterogeneous and Coordinated Tissue Architecture in Glioblastoma Using Spatial Transcriptomics. iScience 2024, 27, 110064. [Google Scholar] [CrossRef] [Scilit]
- Vartanian, A.; Singh, S.K.; Agnihotri, S.; Jalali, S.; Burrell, K.; Aldape, K.D.; Zadeh, G. GBM’s Multifaceted Landscape: Highlighting Regional and Microenvironmental Heterogeneity. Neuro-Oncology 2014, 16, 1167–1175. [Google Scholar] [CrossRef] [Scilit]
- Jarboe, J.S.; Johnson, K.R.; Choi, Y.; Lonser, R.R.; Park, J.K. Expression of Interleukin-13 Receptor A2 in Glioblastoma Multiforme: Implications for Targeted Therapies. Cancer Res. 2007, 67, 7983–7986. [Google Scholar] [CrossRef] [Scilit]
- Han, J.; Puri, R.K. Analysis of the Cancer Genome Atlas (TCGA) Database Identifies an Inverse Relationship between Interleukin-13 Receptor A1 and A2 Gene Expression and Poor Prognosis and Drug Resistance in Subjects with Glioblastoma Multiforme. J. Neuro-Oncol. 2018, 136, 463–474. [Google Scholar] [CrossRef] [Scilit]
- Chen, W.; Sivaprasad, U.; Tabata, Y.; Gibson, A.M.; Stier, M.T.; Finkelman, F.D.; Khurana Hershey, G.K. IL-13 Receptor Alpha 2 Membrane and Soluble Isoforms Differ in Human and Mouse. J. Immunol. 2009, 183, 7870. [Google Scholar] [CrossRef] [Scilit]
- Bhardwaj, R.; Suzuki, A.; Leland, P.; Joshi, B.H.; Puri, R.K. Identification of a Novel Role of IL-13Rα2 in Human Glioblastoma Multiforme: Interleukin-13 Mediates Signal Transduction through AP-1 Pathway. J. Transl. Med. 2018, 16, 369. [Google Scholar] [CrossRef] [Scilit]
- Tu, M.; Wange, W.; Cai, L.; Zhu, P.; Gao, Z.; Zheng, W. IL-13 Receptor A2 Stimulates Human Glioma Cell Growth and Metastasis through the Src/PI3K/Akt/mTOR Signaling Pathway. Tumor Biol. 2016, 37, 14701–14709. [Google Scholar] [CrossRef] [Scilit]
- Zeng, J.; Zhang, J.; Yang, Y.-Z.; Wang, F.; Jiang, H.; Chen, H.-D.; Wu, H.-Y.; Sai, K.; Hu, W.-M. IL13RA2 Is Overexpressed in Malignant Gliomas and Related to Clinical Outcome of Patients. Am. J. Transl. Res. 2020, 12, 4702–4714. [Google Scholar]
- Wykosky, J.; Gibo, D.M.; Stanton, C.; Debinski, W. Interleukin-13 Receptor A2, EphA2, and Fos-Related Antigen 1 as Molecular Denominators of High-Grade Astrocytomas and Specific Targets for Combinatorial Therapy. Clin. Cancer Res. 2008, 14, 199–208. [Google Scholar] [CrossRef] [Scilit]
- Okamoto, H.; Yoshimatsu, Y.; Tomizawa, T.; Kunita, A.; Takayama, R.; Morikawa, T.; Komura, D.; Takahashi, K.; Oshima, T.; Sato, M.; et al. Interleukin-13 Receptor A2 Is a Novel Marker and Potential Therapeutic Target for Human Melanoma. Sci. Rep. 2019, 9, 1281. [Google Scholar] [CrossRef] [Scilit]
- He, H.; Xu, J.; Nelson, P.S.; Marshall, F.F.; Chung, L.W.K.; Zhau, H.E.; He, D.; Wang, R. Differential Expression of the A2 Chain of the Interleukin-13 Receptor in Metastatic Human Prostate Cancer ARCaPM Cells. Prostate 2010, 70, 993–1001. [Google Scholar] [CrossRef] [Scilit]
- Joshi, B.H.; Leland, P.; Calvo, A.; Green, J.E.; Puri, R.K. Human Adrenomedullin Up-Regulates Interleukin-13 Receptor A2 Chain in Prostate Cancer In Vitro and In Vivo: A Novel Approach to Sensitize Prostate Cancer to Anticancer Therapy. Cancer Res. 2008, 68, 9311–9317. [Google Scholar] [CrossRef] [Scilit]
- Gonzalez-Moreno, O.; Calvo, A.; Joshi, B.H.; Abasolo, I.; Leland, P.; Wang, Z.; Montuenga, L.; Puri, R.K.; Green, J.E. Gene Expression Profiling Identifies IL-13 Receptor A2 Chain as a Therapeutic Target in Prostate Tumor Cells Overexpressing Adrenomedullin. Int. J. Cancer 2005, 114, 870–878. [Google Scholar] [CrossRef] [Scilit]
- Gajecki, L.; Lebedeva, I.V.; Liao, Y.-R.; Ambriz, D.; Carter, L.M.; Kumpf, M.; Lovibond, S.; Hachey, J.S.; Graham, M.S.; Postow, M.; et al. IL13Rα2-Targeting Antibodies for Immuno-PET in Solid Malignancies. J. Nucl. Med. 2025, 66, 605. [Google Scholar] [CrossRef] [Scilit]
- Debinski, W.; Gibo, D.M.; Obiri, N.I.; Kealiher, A.; Puri, R.K. Novel Anti–Brain Tumor Cytotoxins Specific for Cancer Cells. Nat. Biotechnol. 1998, 16, 449–453. [Google Scholar] [CrossRef] [Scilit]
- Kunwar, S.; Prados, M.D.; Chang, S.M.; Berger, M.S.; Lang, F.F.; Piepmeier, J.M.; Sampson, J.H.; Ram, Z.; Gutin, P.H.; Gibbons, R.D.; et al. Direct Intracerebral Delivery of Cintredekin Besudotox (IL13-PE38QQR) in Recurrent Malignant Glioma: A Report by the Cintredekin Besudotox Intraparenchymal Study Group. J. Clin. Oncol. 2007, 25, 837–844. [Google Scholar] [CrossRef] [Scilit]
- Puri, R.; Husain, S.; Sherman, J.; Grahn, A.; Parker, K.; Croteau, D.; Lang, F.; Asher, A.; Shaffrey, M.; Chang, S.; et al. CONVECTION-ENHANCED DELIVERY OF CINTREDEKIN BESUDOTOX (INTERLEUKIN-13-PE38QQR) FOLLOWED BY RADIATION THERAPY WITH AND WITHOUT TEMOZOLOMIDE IN NEWLY DIAGNOSED MALIGNANT GLIOMAS: PHASE 1 STUDY OF FINAL SAFETY RESULTS. Neurosurgery 2007, 61, 1031–1038. [Google Scholar] [CrossRef] [Scilit]
- Brown, C.E.; Badie, B.; Barish, M.E.; Weng, L.; Ostberg, J.R.; Chang, W.-C.; Naranjo, A.; Starr, R.; Wagner, J.; Wright, C.; et al. Bioactivity and Safety of IL13Rα2-Redirected Chimeric Antigen Receptor CD8+ T Cells in Patients with Recurrent Glioblastoma. Clin. Cancer Res. 2015, 21, 4062–4072. [Google Scholar] [CrossRef] [Scilit]
- Kunwar, S.; Chang, S.; Westphal, M.; Vogelbaum, M.; Sampson, J.; Barnett, G.; Shaffrey, M.; Ram, Z.; Piepmeier, J.; Prados, M.; et al. Phase III Randomized Trial of CED of IL13-PE38QQR vs Gliadel Wafers for Recurrent Glioblastoma. Neuro Oncol. 2010, 12, 871–881. [Google Scholar] [CrossRef] [Scilit]
- Okada, H.; Kalinski, P.; Ueda, R.; Hoji, A.; Kohanbash, G.; Donegan, T.E.; Mintz, A.H.; Engh, J.A.; Bartlett, D.L.; Brown, C.K.; et al. Induction of CD8+ T-Cell Responses Against Novel Glioma–Associated Antigen Peptides and Clinical Activity by Vaccinations With α-Type 1 Polarized Dendritic Cells and Polyinosinic-Polycytidylic Acid Stabilized by Lysine and Carboxymethylcellulose in Patients With Recurrent Malignant Glioma. J. Clin. Oncol. 2011, 29, 330–336. [Google Scholar] [CrossRef] [Scilit]
- Debinski, W.; Herpai, D. Molecular Expression Analysis of Restrictive Receptor for Interleukin 13, a Brain Tumor-Associated Cancer/Testis Antigen. Mol. Med. 2000, 6, 440–449. [Google Scholar] [CrossRef] [Scilit]
- Joseph, J.V.; Blaavand, M.S.; Daubon, T.; Kruyt, F.A.E.; Thomsen, M.K. Three-Dimensional Culture Models to Study Glioblastoma—Current Trends and Future Perspectives. Curr. Opin. Pharmacol. 2021, 61, 91–97. [Google Scholar] [CrossRef] [Scilit]
- Wakimoto, H.; Mohapatra, G.; Kanai, R.; Curry, W.T., Jr.; Yip, S.; Nitta, M.; Patel, A.P.; Barnard, Z.R.; Stemmer-Rachamimov, A.O.; Louis, D.N.; et al. Maintenance of Primary Tumor Phenotype and Genotype in Glioblastoma Stem Cells. Neuro-Oncology 2012, 14, 132–144. [Google Scholar] [CrossRef] [Scilit]
- Brown, C.E.; Starr, R.; Aguilar, B.; Shami, A.F.; Martinez, C.; D’Apuzzo, M.; Barish, M.E.; Forman, S.J.; Jensen, M.C. Stem-like Tumor-Initiating Cells Isolated from IL13Rα2 Expressing Gliomas Are Targeted and Killed by IL13-Zetakine–Redirected T Cells. Clin. Cancer Res. 2012, 18, 2199–2209. [Google Scholar] [CrossRef] [Scilit]
- Microtissues Natural 3D Casting, Equilibrating and Seeding the 3D Petri Dish. Available online: https://www.sigmaaldrich.com/deepweb/assets/sigmaaldrich/product/documents/957/273/casting-equilibrating-seeding-3d-petri-dish.pdf (accessed on 4 May 2026).
- Chen, G.; Kong, J.; Tucker-Burden, C.; Anand, M.; Rong, Y.; Rahman, F.; Moreno, C.S.; Van Meir, E.G.; Hadjipanayis, C.G.; Brat, D.J. Human Brat Ortholog TRIM3 Is a Tumor Suppressor That Regulates Asymmetric Cell Division in Glioblastoma. Cancer Res. 2014, 74, 4536–4548. [Google Scholar] [CrossRef] [Scilit]
- TRIzolTM Reagent. Available online: https://documents.thermofisher.com/TFS-Assets/LSG/manuals/trizol_ls_reagent.pdf (accessed on 15 May 2026).
- Applied Biosystems High Capacity cDNA Reverse Transcription Kit USER GUIDE. Available online: https://documents.thermofisher.com/TFS-Assets/LSG/manuals/MAN0017977_highcap_cDNA_RT_UG.pdf (accessed on 16 May 2026).
- Invitrogen Human IL-13R Alpha 2 ELISA User Guide. Available online: https://documents.thermofisher.com/TFS-Assets%2FLSG%2Fmanuals%2FEHIL13RA2.pdf (accessed on 26 May 2026).
- Sample Preparation for Western Blot. Available online: https://docs.abcam.com/pdf/protocols/sample-preparation-for-western-blot.pdf (accessed on 28 May 2026).
- Whitney, L.S.; College, E.R.; Peña-Ekker, J.; Cannon, C.A.; Mason, K.M.; Wilson, J.N.; Pullan, J.E. Isolation and Characterization of Bovine-Milk Derived Extracellular Vesicles Using a Modified Aqueous Two-Phase System. BioTechniques 2026, 78, 55–64. [Google Scholar] [CrossRef] [Scilit]
- Kishore, S.; Maruthamuthu, M. Binding of Rose Bengal onto Bovine Serum Albumin. Proc. Indian Acad. Sci. (Chem. Sci.) 1993, 105, 279–285. [Google Scholar] [CrossRef] [Scilit]
- Newman, J.P.; Wang, G.Y.; Arima, K.; Guan, S.P.; Waters, M.R.; Cavenee, W.K.; Pan, E.; Aliwarga, E.; Chong, S.T.; Kok, C.Y.L.; et al. Interleukin-13 Receptor Alpha 2 Cooperates with EGFRvIII Signaling to Promote Glioblastoma Multiforme. Nat. Commun. 2017, 8, 1913. [Google Scholar] [CrossRef] [Scilit]
- Bartolomé, R.A.; Jaén, M.; Casal, J.I. An IL13Rα2 Peptide Exhibits Therapeutic Activity against Metastatic Colorectal Cancer. Br. J. Cancer 2018, 119, 940–949. [Google Scholar] [CrossRef] [Scilit]
- Chen, L.; Shang, C.; Hong, Y.; Zhang, H. Development and Evaluation of IL13RA2 Targeted Drug Delivery System Based on Glioblastoma Homing Peptide A2b11. Mater. Today Bio 2026, 37, 102823. [Google Scholar] [CrossRef] [Scilit]
- Frum, R.A.; Khondker, Z.S.; Kaufman, D.G. Temporal Differences in DNA Replication during the S Phase Using Single Fiber Analysis of Normal Human Fibroblasts and Glioblastoma T98G Cells. Cell Cycle 2009, 8, 3133–3148. [Google Scholar] [CrossRef] [Scilit]

Disclaimer/Publisher’s Note: The statements, opinions and data contained in all publications are solely those of the individual author(s) and contributor(s) and not of MDPI and/or the editor(s). MDPI and/or the editor(s) disclaim responsibility for any injury to people or property resulting from any ideas, methods, instructions or products referred to in the content. |
© 2026 by the authors. Licensee MDPI, Basel, Switzerland. This article is an open access article distributed under the terms and conditions of the Creative Commons Attribution (CC BY) license.